Heart Rate Variability, Standard of Measurement ...file.scirp.org/pdf/JBBS_2013022711062612.pdf ·...
23
Journal of Behavioral and Brain Science, 2013, 3, 26-48 http://dx.doi.org/10.4236/jbbs.2013.31004 Published Online February 2013 (http://www.scirp.org/journal/jbbs) Copyright © 2013 SciRes. JBBS Heart Rate Variability, Standard of Measurement, Physiological Interpretation and Clinical Use in Mountain Marathon Runners during Sleep and after Acclimatization at 3480 m Ivana Gritti 1* , Stefano Defendi 1 , Clara Mauri 1 , Giuseppe Banfi 1 , Piergiorgio Duca 1 , Giulio Sergio Roi 2 1 Department of Biomedical and Clinical Science Luigi Sacco, University of Milan, Milan, Italy 2 Education and Research Department Isokinetic, Bologna, Italy Email: * [email protected], [email protected], [email protected] Received November 19, 2012; revised December 20, 2012; accepted December 27, 2012 ABSTRACT Fluctuations in autonomic cardiovascular regulation during exposure to high altitude may increase the risk of heart at- tack during waking and sleep. This study compared heart rate variability (HVR) and its components during sleep at low altitude and after 30 - 41 hours of acclimatization at high altitude (3480 m) in five mountain marathon runners con- trolled for diet, drugs, light-dark cycle and jet lag. In comparison to sea level, RR-intervals during sleep at high altitude decreased significantly (P < 0.001). The significant increase in sympathetic autonomic cardiovascular modulation at high altitude protects against excessive oxygen deprivation during sleep. Increases in R-R intervals can require longer periods of acclimatization at 3480 m to mitigate the effects of altitude/hypoxia on sympathetic tone, thus reducing car- diovascular distress at rest during waking and sleep and probably before during and after athletic performance at alti- tude. Keywords: Heart Rate Variability; Very Low Frequency Fluctuation (VLF, <0.04 Hz) Rhythm; Low-Frequency (LF, 0.04 - 0.15 Hz) Rhythm; High-Frequency (HF, 0.15 - 0.4 Hz) Rhythm; Mountain Marathon Runners 1. Introduction 1.1. Heart Rate Variability Intrinsic to pacemaker tissues, cardiac automaticity is re- gulated by the central nervous systems (CNS). Control of the cardiac cycle is also mediated by local and autonomic nervous system components: the parasympathetic influ- ence on heart rate is modulated by acetylcholine released by the vagus nerve on the sinoatrial node and the sympa- thetic influence by the release of epinephrine and nore- pinephrine. Under resting conditions, vagal modulation and tone predominate at the level of the sinoatrial node. Vagal and sympathetic activities interact constantly [1 hereinafter Task Force 1996]. In the sympathovagal and thoracic systems, CNS con- trol and influences on the autonomic mechanism can be physiologically and voluntarily cut off to different de- grees during relaxed attentive waking and involuntarily during the progressive deepening of slow-wave sleep [1]. Alterations in the autonomic nervous system may give rise to cardiovascular and/or cerebrovascular diseases and have been frequently associated with death in hu- mans. Research into predisposition to arrhythmias and increased sympathetic activity or reduced vagal activity has led to the development of quantitative markers of autonomic activity [1]. The Task Force [1] has suggested that cardiovascular changes can be investigated non-invasively by electro- cardiography (ECG) and by common parameters derived from ECG such as heart rate variability (HRV), i.e., the variation in the duration of two consecutive R-R intervals. R-R interval variations during resting condition are pre- cisely tuned by reflexes directed to the sinus node and modulated by central (vasomotor and respiratory centre) and peripheral (arterial pressure and respiratory move- ments) oscillators, particularly during high altitude ex- posure. Analysis of R-R intervals provides information about the state and function of central oscillators, sympa- thetic and vagal efferent activities, humoral cardiac fac- tors, and sinus node characteristics [1]. * Corresponding author.
Transcript of Heart Rate Variability, Standard of Measurement ...file.scirp.org/pdf/JBBS_2013022711062612.pdf ·...

Journal of Behavioral and Brain Science 2013 3 26-48 httpdxdoiorg104236jbbs201331004 Published Online February 2013 (httpwwwscirporgjournaljbbs)
Copyright copy 2013 SciRes JBBS
Heart Rate Variability Standard of Measurement Physiological Interpretation and Clinical Use in Mountain
Marathon Runners during Sleep and after Acclimatization at 3480 m
Ivana Gritti1 Stefano Defendi1 Clara Mauri1 Giuseppe Banfi1 Piergiorgio Duca1 Giulio Sergio Roi2
1Department of Biomedical and Clinical Science Luigi Sacco University of Milan Milan Italy 2Education and Research Department Isokinetic Bologna Italy
Email IvanaGrittiunimiit PiergiorgioDucaunimiit gsroiisokineticcom
Received November 19 2012 revised December 20 2012 accepted December 27 2012
ABSTRACT
Fluctuations in autonomic cardiovascular regulation during exposure to high altitude may increase the risk of heart at-tack during waking and sleep This study compared heart rate variability (HVR) and its components during sleep at low altitude and after 30 - 41 hours of acclimatization at high altitude (3480 m) in five mountain marathon runners con-trolled for diet drugs light-dark cycle and jet lag In comparison to sea level RR-intervals during sleep at high altitude decreased significantly (P lt 0001) The significant increase in sympathetic autonomic cardiovascular modulation at high altitude protects against excessive oxygen deprivation during sleep Increases in R-R intervals can require longer periods of acclimatization at 3480 m to mitigate the effects of altitudehypoxia on sympathetic tone thus reducing car-diovascular distress at rest during waking and sleep and probably before during and after athletic performance at alti-tude Keywords Heart Rate Variability Very Low Frequency Fluctuation (VLF lt004 Hz) Rhythm Low-Frequency (LF
004 - 015 Hz) Rhythm High-Frequency (HF 015 - 04 Hz) Rhythm Mountain Marathon Runners
1 Introduction
11 Heart Rate Variability
Intrinsic to pacemaker tissues cardiac automaticity is re- gulated by the central nervous systems (CNS) Control of the cardiac cycle is also mediated by local and autonomic nervous system components the parasympathetic influ- ence on heart rate is modulated by acetylcholine released by the vagus nerve on the sinoatrial node and the sympa- thetic influence by the release of epinephrine and nore- pinephrine Under resting conditions vagal modulation and tone predominate at the level of the sinoatrial node Vagal and sympathetic activities interact constantly [1 hereinafter Task Force 1996]
In the sympathovagal and thoracic systems CNS con- trol and influences on the autonomic mechanism can be physiologically and voluntarily cut off to different de- grees during relaxed attentive waking and involuntarily during the progressive deepening of slow-wave sleep [1]
Alterations in the autonomic nervous system may give rise to cardiovascular andor cerebrovascular diseases and have been frequently associated with death in hu- mans Research into predisposition to arrhythmias and increased sympathetic activity or reduced vagal activity has led to the development of quantitative markers of autonomic activity [1]
The Task Force [1] has suggested that cardiovascular changes can be investigated non-invasively by electro- cardiography (ECG) and by common parameters derived from ECG such as heart rate variability (HRV) ie the variation in the duration of two consecutive R-R intervals R-R interval variations during resting condition are pre- cisely tuned by reflexes directed to the sinus node and modulated by central (vasomotor and respiratory centre) and peripheral (arterial pressure and respiratory move- ments) oscillators particularly during high altitude ex- posure Analysis of R-R intervals provides information about the state and function of central oscillators sympa- thetic and vagal efferent activities humoral cardiac fac- tors and sinus node characteristics [1] Corresponding author
I GRITTI ET AL
Copyright copy 2013 SciRes JBBS
27
It has also been reported by the Task Force [1] and by Lanfranchi et al [2] that the risk of cardiac disease can be evaluated by means of spectral analysis of the vari- ability in the R-R interval in order to determine high- frequency ([HF] 015 - 04 Hz) rhythm which primarily reflects respiratory-driven vagal modulation of sinus rhy- thm and low-frequency ([LF] 004 - 015 Hz) rhythm which appears to have a widespread neuronal genesis LF is also considered as a marker of sympathetic modulation (expressed in normalized units) andor as a parameter that includes both sympathetic and vagal modulation Thermoregulation-related HRV so-called very low fre- quency fluctuation ([VLF] lt004 Hz) rhythm is also used to analyze HRV However explanation of the VLF com- ponent of HRV is less defined than the LF or the HF component VLF LF and HF power are usually meas- ured in absolute values of power (milliseconds squared [ms2]) LF and HF can be also measured in normalized units (NU) to emphasize the controlled and balanced be- havior of the two branches of the autonomic nervous sys- tem as well as baroreflex responsiveness to beat-to-beat variations in arterial blood pressure [1] Normalization of LF and HF power tends to minimize the effect of the changes in the total power on the values of these two components Normalized units and absolute values of LF and HF power should both be calculated to provide a better measurement of the degree of autonomic modula- tion rather than just the level of autonomic tone [1]
To date little has been reported about the effect of dif- ferent environments (type of nature physical activity emotional circumstances environment of the group) on HRV analysis [1]
12 Type of Nature
121 Hypobaric-Hypoxic Conditions Hypoxia affects ventilator control circuits and autonomic cardiovascular regulatory mechanisms in normal subjects and in those with cardiac andor respiratory failure In hypobaric-hypoxic conditions HRV analysis can be con- sidered as an expression of the changes in respiratory frequency oscillation and of respiratory sinus arrhythmia not mediated by the beta adrenergic block yet modulated by the vagus nerve furthermore changes in the cardiac vagal nervous system result in proportional changes in R-R intervals During exposure to hypobaric-hypoxic and during waking conditions HRV is reduced with a rela- tive increase in the LF component In mountaineers the relative increase in the LF component is thought to be due to increased sympathetic modulation of the sinus node in response to high altitude Acute exposure to hy- pobaric-hypoxic conditions at high altitude increases the risk of cardiovascular stroke heart attack and death [2]
122 Sleep-Wake Cycle At low altitudes HR is normally higher during daytime hours and lower at night During wakefulness HRV os- cillates in relation to physical activity during the sleep cycle it changes with the passage from non-rapid eye movement (NREM) to rapid eye movement (REM) sleep to awakening periods during sleep (W) episodes [3] Changes in HR may precede changes on the electroen- cephalogram (EEG) Shorter R-R intervals are believed to reflect sympathetic dominance and are associated with waking and REM sleep while longer R-R intervals re- flect vagal dominance probably coincident with sleep dampening This allows for HRV analysis in the LF HF and LHHF frequency domains as a tool for exploring sympathovagal balance continuously during sleep at alti- tude To our knowledge HRV during the nocturnal sleep- wake cycle at high altitudes in humans has been less in- vestigated than at low altitude in humans and animals
13 Environment and Physical Activity of Mountain Marathon Athletes
Mountain marathoners also called sky runners are ath- letes who perform marathons and races at high altitude Their anthropometric characteristics are similar to those of marathoners competing at sea level Various physio- logical biochemical hematological and psychological parameters studied in these athletes during waking be- fore during and after races have shown that changes in these parameters are transient promptly return to normal and produce no evident clinical symptoms or diseases The endurance performance of mountain marathoners is appreciably reduced at high altitude Based on their an- tropometrical characteristics mountain marathoners may be considered a suitable group for studying possible pa- thological effects of stay and exercise at altitude [4-13] Unlike the situation described in Lanfranchi and co- workers [2] the medical staff involved in this study dur- ing the long-term follow-up of a group of mountain ma- rathon athletes during training and athletic competition from sea level to 5500 m has never recorded signs of acute mountain sickness (AMS) [4-13] Regular exercise is thought to modify autonomic balance and accelerate the safe recovery of physiological sympathovagal inter- action [1] Exercise and training of the mountain mara- thon runners might have decreased their risk of cardio- vascular mortality and sudden cardiac death at low and high altitudes as well as prevented syncope episodes which can occur after the end of races at high altitude [12]
14 Mountain Environments
When undertaken in mountain environments studies on
I GRITTI ET AL
Copyright copy 2013 SciRes JBBS
28
humans typically lack the controlled conditions of the laboratory High-altitude research as in the present study is limited to a small number of anthropometrically con- trolled subjects Even so for future high and very high altitude expeditions studies on anthropometrically con- trolled subjects transiently and naturally exposed to the mountain environment can give albeit under less rigor- ously controlled conditions important insights into HRV that may not completely be gleaned from sea-level labo- ratory studies The data presented here were collected during sleep in sea-level native mountain marathon run- ners at 122 m and at an altitude of 3480 m in clinostatic position so as to avoid or at least reduce autonomic me- chanisms correlated with the central and peripheral auto- nomic nervous systems and effects related to the time of eating jet lag light-dark cycle and motor activities [14]
15 Aim of the Study
Given the direct and indirect physiological effect of hy- pobaric-hypoxia on the cardiovascular system [15] fluc- tuations in autonomic cardiovascular regulation during exposure to high altitude [2] the increased risk of heart attack and the instability of the cardiovascular system during sleep this study analyzed HRV by calculating the average of the spectral component of stacked series of sequential power spectra from short ECG segments last- ing 05 minutes [16] during sleep at sea level and be- tween 30 and 41 h of acclimatization at 3480 m altitude in a small sample of anthropometrically well character- ized mountain marathon runners [4-13] The analysis of HRV during sleep at 3480 m can provide firmer ground for studying and diagnosing overtraining at high altitude of mountain marathon runners exposed to hypobaric-hy- poxic conditions HRV measurements at high altitude may offer useful data for standard physiological evalua- tion and for formulating recommendations on increasing or reducing acclimatization time to defined hypobaric- hypoxic conditions and reduce cardiovascular distress at low altitude and during performance at high altitude in particular
2 Material and Methods
21 Environment of the Group
Five adult mountain marathon runners native to sea level with at least 20 years experience of competitive races and climbing at altitudes between 122 m and 5500 m aged from 38 to 41 years clinically and psychologically tested before during and after competitions at high altitude (gt2500 m) were recruited for this study [4-13]
The average body weight for the five subjects was 658 plusmn 4 kg the average height was 176 plusmn 37 cm and the
average aerobic power was 614 plusmn 27 mlkgminus1minminus1 The use of any drugs dietary and neuroactive supplements was suspended for one week before the start of the study Effects of light-dark and jet-lag interference on acclima- tization were excluded by the location of the study
22 Polysomnographic Recording
Polysomnographic recording procedures were carried out in accordance with Directive 86609EEC for experimen- tal human care Informed consent prior to each experi- mental session was given by all five subjects and by the international medical staff of the Federation of Sport at Altitude The study was conducted during normal sleep time (between 10 pm and 9 am) Workouts were sus- pended on the days the measurements were taken
Polysomnographic recordings were taken in dedicated dark isolated silent rooms at 122 m (Milan Italy) at a barometric pressure (PB) of 742 plusmn 77 mm Hg and after an acclimatization period of 30 - 32 or 38 - 41 h after reaching 3480 m at a PB of 4954 plusmn 319 mm Hg The recordings were performed to study the electroencepha- logram (EEG) submental electromyogram (EMG) elec- trooculogram (EOG) electrocardiogram (ECG) and the percent of peripheral arterial oxygen saturation (SpaO2) signals All signals were amplified and registered at a sampling rate of 250 Hz then analyzed off-line accord- ing to standard criteria (Somnological 3 EmblaMedcare Flagareg Monza Italy) Electrocardiographic recordings were taken with a bipolar derivation from two cardiac electrodes placed in V2 in the fourth left intercostal re- gion along the sternum and in V4 in the fifth left inter- costal region on the hemiclavear line
The polysomnographic tracings containing the ECG signals were scored as follows awakening during sleep (W) S1 + S2 and S3 + S4 of slow-wave sleep also called NREM sleep and REM sleep according to stan- dard criteria developed by Rechtschaffen and Kales [17] in 30-second artifact-free epochs [16]
Automatic analysis of HRV values was performed us- ing Somnological 3 software (Embla) autoregressive model order 12 following the rules of the Task Force [1] in a total of stacked series of sequential 30-second arti- fact-free epochs of awakening during sleep (W) S1 + S2 and S3 + S4 of NREM sleep and of REM sleep
This analysis focused on the average of the R-R inter- vals the power of the very low frequency (VLF) low frequency (LF) and high frequency (HF) the normalized unit of the low Frequency and high frequency (LFRRNU and HFRRNU) which were obtained by dividing the power of each component by the total variance from which the VLF was subtracted and by multiplying them by 100 and on the total power (TP) [Task Force 1]
I GRITTI ET AL
Copyright copy 2013 SciRes JBBS
29
23 Statistical Analysis
The results are expressed as the mean plusmn standard devia- tion (SD) or standard error mean (SEM) Probabilities lower than P lt 005 were accepted as significant ANOVA and post hoc tests were also performed Simple linear re- gression analysis between the (SpaO2 PCO2) (personal observations) and the ECG parameters was also per- formed using the Stat-View program
3 Results
None of the five subjects ever experienced AMS during the present study There were no differences in the time of evaluation of the subjects During sleep the SpaO2 and PCO2 at high altitude was significantly lower than that recorded at sea level (average plusmnSD SpaO2 80 plusmn 364 at 3480 m vs 956 plusmn 085 at 122 m P lt 005 PCO2 2825 plusmn 233 at 3480 m vs 4121 plusmn 338 at 122 m)
31 R-R Intervals (ms)
311 Sea Level (122 m) At 122 m the averages of the recorded R-R intervals were similar between all sleep stages and ranged from 1223 ms during the awakening period during sleep (W) 1300 ms during S1 + S2 and 1262 ms during S3 + S4 of NREM sleep to 1272 ms during REM sleep (Table 1) The averages of the R-R intervals recorded at 122 m during the nocturnal sleep-wake cycle suggested a pre- valence of vagal tone during all four sleep stages and in all five subjects
312 High Altitude (3480 m) At 3480 m the averages of the R-R intervals recorded during sleep ranged from 935 ms during W 1054 ms during S1 + S2 and 993 ms during S3 + S4 of NREM sleep to 990 ms during REM sleep
The averages of the R-R intervals recorded at altitude during the awakening period during sleep (W 935 plusmn 88) were significantly shorter than those recorded during S1 + S2 (1054 plusmn 73 P lt 005) (Table 1) The averages of the R-R intervals recorded during sleep suggested an increase in sympathetic tone during W S3 + S4 NREM sleep and REM sleep and a persistent significant in- crease in vagal tone during the light phases of NREM sleep
313 Sea Level (122 m) and High Altitude (3480 m) Changes in ECG with a reduction in the R-R intervals (ms) recorded during sleep became evident between 30 and 41 h of acclimatization at 3480 m compared to mea- surements taken at 122 m during sleep signs of sinus arrhythmia during periodic breathing during S1 + S2 of
NREM sleep and during REM sleep were evident (Ta- ble 1) In all five mountain marathon runners the aver- ages of the R-R intervals during W S1 + S2 and S3 + S4 of NREM sleep and REM sleep were significantly shor- ter at altitude than those recorded at sea level (P lt 001 - P lt 0001)
The averages of the R-R intervals during W (935 plusmn 88) S1 + S2 (1054 plusmn 73) and S3 + S4 (993 plusmn 55) of NREM sleep and REM sleep (990 plusmn 68) were significantly shorter at altitude than those recorded at sea level [(W 1223 plusmn 102 P lt 0001) (S1 + S2 1300 plusmn 69 P lt 0001) (S3 + S4 1262 plusmn 65 P lt 0001) (REM 1272 plusmn 77 P lt 0001)] The averages of the R-R intervals suggested a prevalence of sympathetic tone during all sleep stages at altitude and a prevalence of vagal tone during sleep at sea level
Simple regression analysis between the average SpaO2 during sleep at low and at high altitudes was significantly correlated (DF19 R-squared 0477 coefficient 62358 F-test731 P = 00269 t = 2704) with the average changes in R-R intervals
32 Total Power of Very Low Frequency [(VLF ms2) (lt004 Hz)] vs Thermoregulation-Related HRV
321 Sea Level (122 m) At 122 m the averages of VLF were 22455 ms2 during W 10217 ms2 during S1 + S2 3977 ms2 during S3 + S4 and 17016 ms2 during REM sleep The average VLF analyzed in 190 30-second epochs during the awakening period during sleep (W 22455 plusmn 17267) was signifi- cantly longer than the average VLF analyzed in 226 30-second signal epochs during S3 + S4 of NREM sleep (3977 plusmn 3531 P lt 00046) (Table 2) The average VLF analyzed in 226 30-second epochs during S3 + S4 of NREM sleep (3977 plusmn 3531) was significantly shorter than that analyzed in 175 30-second epochs during REM sleep (17016 plusmn 13612 P lt 0009)
These data collected at 122 m above sea level indicate that during the deepening of synchronized sleep the ther- moregulation-related component (VLF) of HRV decreased with an increase in vagal tone The averages of VLF dur- ing REM sleep increased approaching the average re- corded during W thus suggesting a high level of sympa- thetic tone during both stages (W and REM)
322 High Altitude (3480 m) At 3480 m the averages of VLF were 17539 ms2 during W 8452 ms2 during S1 + S2 of NREM sleep 3179 ms2 during S3 + S4 of NREM sleep and 15765 ms2 during REM sleep
The average VLF recorded in 271 30-second epochs
I GRITTI ET AL
Copyright copy 2013 SciRes JBBS
30
Table 1 Averages of the R-R intervals (ms) analysed in 5 altitude marathon runners recorded in 30-second physiologically defined number of signal epochs according to the standard criteria developed by Rechtschaffen and Kales (1968) during the waking periods during sleep (W) stages S1 + S2 and S3 + S4 of NREM sleep and REM sleep at 122 m and after 30 - 41 h of acclimatisation at 3480 m(1)
Stages Subjects 122 m 3480 m Epochs Epochs
Awakening during sleep N Mean SD N Mean SD Delta P value CS 7 1212 56 35 1007 72 minus205 00001 MR 3 1051 76 3 817 37 minus234 00087 GM 13 1362 81 12 1061 203 minus301 00001 DC 140 1026 73 157 779 36 minus247 00001 SS 27 1463 224 64 1011 93 minus452 00001 No of epochs 190 No of subjects Mean SEM No of subjects Mean SEM Delta subjects subjects Average 5 1223 102 5 935 88 minus278 0001
S1 + S2 Epochs Epochs N Mean SD N Mean SD Delta P value CS 45 1281 60 34 1123 67 minus158 00001 MR 58 1130 55 52 878 41 minus252 00001 GM 53 1497 71 54 1236 86 minus261 00001 DC 302 1096 43 322 835 28 minus261 00001 SS 200 1494 115 237 1197 145 minus297 00001 No of epochs 658 699 No of subjects Mean SEM No of subjects Mean SEM Delta subjects subjects Average 5 1300 69 5 1054 73 minus246 00001
S3 + S4 Epochs Epochs N Mean SD N Mean SD Delta P value CS 16 1277 48 9 1054 29 minus223 00001 MR 11 1121 42 6 833 8 minus288 00001 GM 9 1435 113 7 1165 112 minus270 00003 DC 98 1065 55 25 846 20 minus219 00001 SS 92 1410 65 59 1068 106 minus342 00001 No of epochs 226 106 No of subjects Mean SEM No of subjects Mean SEM Delta subjects subjects Average 5 1262 65 5 993 55 minus268 0001
REM Epochs Epochs N Mean SD N Mean SD Delta P value CS 8 1276 73 5 1128 120 minus147 00178 MR 23 1085 69 13 813 25 minus272 00001 GM 10 1450 60 13 1106 88 minus344 00001 DC 62 1062 56 30 832 40 minus231 00001 SS 72 1485 125 52 1069 67 minus416 00001 No of epochs 175 No of subjects Mean SEM No of subjects Mean SEM Delta subjects subjects Average 5 1272 77 5 990 68 minus282 0001
Footnotes to Table 1 (1)One-way ANOVA tracts analysed in the five mountain runners the averages of the R-R intervals (ms) measured during the W S1 + S2 S3 + S4 and REM sleep states were significantly different (DF 73239 F-tests = 4007 P = 0003) The post-hoc comparison with Fisher analysis showed a significant difference (P lt 005) between the average of the R-R intervals recorded during W at 122 m and that at 3480 m and a significant difference between the average of the R-R intervals recorded during stages S3 + S4 at 3480 m and during REM sleep at 3480 m (P lt 005) The average of the R-R intervals re-corded during W at 3480 m differed significantly from that during stages S1 + S2 at 122 m (P lt 005) Post-hoc comparison with Fisher analysis showed that the average of the R-R intervals recorded during stages S3 + S4 at 122 m differed significantly from that during REM sleep at 122 m (P lt 005) The average of the R-R intervals recorded during stages S1 + S2 at 122 m differed significantly from that during stages S1 + S2 at 3480 m (P lt 005) Post-hoc comparison of the average of the R-R intervals recorded during stages S1 + S2 at 122 m differed significantly from that during S3 + S4 and REM sleep at 3480 m (P lt 005) Fisher analysis demonstrated that the average of the R-R intervals recorded during stages S3 + S4 at 3480 m differed significantly from that during REM sleep at 122 m (P lt 005) There was a significant difference between the R-R intervals recorded during REM sleep at 122 m and those during REM sleep at 3480 m (P lt 005) Post-hoc comparison with Studentrsquos t-test showed that the average of the power of the R-R interval tract analysed in 271 30-second epochs during the waking period during sleep (W) at 3480 m was significantly lower (P lt 005) than the average measured in 699 30-second epochs during stages S1 + S2 of NREM sleep at 3480 m in all 5 subjects
I GRITTI ET AL
Copyright copy 2013 SciRes JBBS
31
Table 2 Averages of the total power of very low frequency (VLF ms2) (lt004 Hz) (thermoregulation-related HRV) recorded in 30-second signal epochs physiologically defined according to standard criteria developed by Rechtschaffen and Kales (1968) during waking periods during sleep (W) stages S1 + S2 and S3 + S4 of NREM and REM sleep at 122 m and after 30 - 41 h of acclimatisation at 3480 m in the five subjects(1)
Stages Subjects 122 m 3480 m Epochs Epochs
Awakening during sleep N Mean SD N Mean SD Delta P value CS 7 26606 22461 35 21496 16228 minus5110 ns MR 3 38280 9561 3 22860 6308 minus1542 ns GM 13 17791 7300 12 18278 21065 487 ns DC 140 11102 21447 157 7610 10946 minus3492 ns SS 27 18496 25566 64 17749 17617 minus747 ns No of epochs 190 271 No of subjects Mean SEM No of subjects Mean SEM Delta subjects subjects Average 5 22455 17267 5 17593 14433 minus4862 ns
S1 + S2 Epochs Epochs N Mean SD N Mean SD Delta P value CS 45 20578 15536 34 17339 12982 minus3239 ns MR 58 8885 7286 52 8784 9380 minus101 ns GM 53 10545 9710 54 5979 6471 minus4565 0005 DC 302 2135 2225 322 2348 3088 213 ns SS 200 8943 16991 237 7811 8712 minus1132 ns No of epochs 658 699 No of subjects Mean SEM No of subjects Mean SEM Delta subjects subjects Average 5 10217 10350 5 8452 8127 minus1765 ns
S3 + S4 Epochs Epochs N Mean SD N Mean SD Delta P value CS 16 5264 3352 9 4352 4066 minus912 ns MR 11 4263 3839 6 1943 380 minus2320 ns GM 9 6504 5327 7 4636 5916 minus1868 ns DC 98 1644 1887 25 2233 4700 589 ns SS 92 2209 3251 59 2730 3263 521 ns No of epochs 226 No of subjects Mean SEM No of subjects Mean SEM Delta subjects subjects Average 5 3977 3531 5 3179 3665 minus798 ns
REM Epochs Epochs N Mean SD N Mean SD Delta P value CS 8 29739 13936 5 21703 10645 minus8036 ns MR 23 20548 15408 13 17039 8214 minus3509 ns GM 10 13933 5651 13 19185 8120 5252 ns DC 62 12885 23483 30 13262 18141 337 ns SS 72 7976 9580 52 7637 7406 minus339 ns No of epochs 175 113 No of subjects Mean SEM No of subjects Mean SEM Delta subjects subjects Average 5 17016 13612 5 15765 10505 minus1251 ns
Footnotes to Table 2 (1)One-way ANOVA showed that in the five subjects the averages of the total power of very low frequency (VLF ms2) (lt004 Hz) (ther-moregulation-related HRV) differed significantly between stages (DF = 73239 F = 515 P lt 00002) Post-hoc comparison with Fisher analysis of the mean revealed a significant difference between the VLF values recorded during W at 122 m and those during stages S1 + S2 at 122 m (P lt 005) and a significant difference between the VLF values recorded during stages S1 + S2 at 3480 m and those during stages S3 + S4 at 122 m and S3 + S4 at 3480 m There was also a significant difference between the mean of the VLF recorded during stages S3 + S4 at 122 m and those during REM sleep at 122 m and at 3480 m (P lt 005) There was a significant difference between the average of the VLF recorded during stages S3 + S4 at 3480 m and those during REM sleep at 122 m and at 3480 m (P lt 005) Post-hoc comparison with StudentrsquoS t-test showed that the power in the VLF range of the R-R intervals measured in 190 30-second epochs dur-ing the waking period during sleep (W) at 122 m was significantly higher (P lt 00046) than that measured in 226 30-second signal epochs during stages S3 + S4 of NREM sleep at 122 m in all five subjects Post-hoc comparison with Studentrsquos t-test of the mean of the average of the power in the VLF range measured in 271 30-second epochs during the awakening period during sleep (W) at 3480 m was significantly higher (P lt 00007) than that measured in 106 30-second signal epochs during stages S3+S4 of NREM sleep at 3480 m in all five subjects Post-hoc comparison with Studentrsquos t-test of the mean of the average of the power in the VLF range measured in 226 30-second epochs during stages S3 + S4 of NREM sleep at 122 m was significantly lower (P lt 0009) than that meas- ured in 175 30-second epochs during REM sleep at 122 m in all five subjects Post-hoc comparison with Studentrsquos t-test of the mean of the average of the power in the VLF range measured in 106 30-second epochs during stages S3 + S4 of NREM sleep at 3480 m was significantly lower (P lt 0001) than that measured in 113 30-second epochs during REM sleep at 3480 m in all five subjects
I GRITTI ET AL
Copyright copy 2013 SciRes JBBS
32
during the awakening period during sleep [(W) (17593 plusmn 14433)] was significantly longer than the average VLF recorded in 106 30-second signal epochs during S3 + S4 of NREM sleep (3179 plusmn 3665 P lt 00007) (Table 2) The average VLF in 106 30-second epochs during S3 + S4 of NREM sleep (3179 plusmn 3665) was significantly shor- ter than that analyzed in 113 30-second epochs of REM sleep (15765 plusmn 10505 P lt 005)
Overall the averaged data recorded during sleep at 3480 m demonstrate that during the deepening of syn- chronized sleep the thermoregulation-related component (VLF) of HRV decreased with a physiological increase in vagal tone During REM sleep the thermoregulation- related component of HRV approached that recorded during the awakening period during sleep (W) indicating an increase in the sympathetic tone
323 Sea Level (122 m) and High Altitude (3480 m) The average of the total power of very low frequency (VLF ms2) recorded during S1 + S2 of NREM sleep (5979 plusmn 6471) was significantly shorter at high altitude than that recorded sea level (10545 plusmn 9710 P lt 0005) in only 15 (GM) mountain marathon runners (Table 2)
33 Total Power of Low Frequency [(LF ms2) (004 - 015 Hz)] Range The LF Appears to Have a Widespread Neuronal Genesis and Is Considered as a Marker of Sympathetic Modulation or a Marker of Both Sympathetic and Vagal Modulation
331 Sea Level (122 m) At 122 m the averages of LF were 7997 ms2 during W 7400 ms2 during S1 + S2 4881 ms2 during S3 + S4 and 8579 ms2 during REM sleep The changes in the average total power in LF were significantly shorter during S3 + S4 than those observed during REM sleep (4881 plusmn 2041 vs 8579 plusmn 3473 P lt 002) (Table 3) These data suggest that the average values of LF a marker of sympathetic modulation decreased during the deepening phases of NREM sleep During REM sleep the average values of LF significantly increased approaching a value similar to that observed during W
332 High Altitude (3480 m) At 3480 m the averages of LF were 6272 ms2 during W 7516 ms2 during S1 + S2 3805 ms2 during S3 + S4 and 5715 ms2 during REM sleep (Table 3) The results dem- onstrate that the average values of LF during sleep at altitude did not change significantly between the differ- ent sleep stages (Table 3)
333 Sea Level (122 m) and High Altitude (3480 m) The averages of total power of low frequency (LF ms2)
recorded at high altitude during W were significantly shorter than those recorded at sea level in 35 subjects [(CS 3163 plusmn 1400 at 3480 m vs 5148 plusmn 3163 at 122 m P lt 00074) (GM 6157 plusmn 2271 at 3480 m vs 9656 plusmn 2978 at 122 m P lt 00033) (DC 2774 plusmn 2056 at 3480 m vs 5083 plusmn 4655 at 122 m P lt 00001)] (Table 3) The aver- age LF recorded during S1 + S2 was significantly longer at altitude than that recorded at sea level in 15 subjects (SS 17947 plusmn 12895 at 3480 m vs 10155 plusmn 6434 at 122 m P lt 00001) the LF was significantly shorter in 25 subjects [(CS 3539 plusmn 1734 at 3480 m vs 5946 plusmn 2294 at 122 m P lt 00001) (MR 6059 plusmn 1641 at 3480 m vs 10118 plusmn 2699 at 122 m P lt 00001)] the average LF recorded during S3 + S4 was significantly shorter at alti- tude than that recorded at 122 m in 25 [(CS 2276 plusmn 2427 at 3480 m vs 3760 plusmn 1098 at 122 m P lt 00455) (MR 3917 plusmn 592 at 3480 m vs 8344 plusmn 222 at 122 m P lt 00003)] the average LF recorded during REM sleep was significantly shorter at altitude than that recorded at sea level in 35 subjects [(MR 5200 plusmn 1513 at 3480 m vs 10159 plusmn 2790 at 122 m P lt 00001) (DC 3702 plusmn 1955 at 3480 m vs 6727 plusmn 4144 at 122 m P lt 00003) (SS 5 140 plusmn 4402 at 3480 m vs 11509 plusmn 6775 at 122 m P lt 00001)] These data demonstrate great variability in the sympathetic LF component of HRV recorded at low and high altitudes in the five mountain marathon runners
34 Low-Frequency in Normalized Units [(LFRRNU) (004 - 015 Hz)] Range LFRRNU Is Considered as a Marker of Sympathetic Modulation
341 Sea Level (122 m) In all 5 subjects the average LFRRNU recorded in 190 30-second epochs during the awakening period during sleep (W 7341 plusmn 1015) differed significantly from that recorded in 226 30-second epochs during S3 + S4 of NREM sleep (6476 plusmn 1145 P lt 003) In all five moun- tain marathon runners the average LFRRNU during REM sleep was significantly longer (7432 plusmn 1017) than that observed during S3 + S4 (6476 plusmn 1145 P lt 00192) (Table 4) These data indicate that the marker of sympa- thetic modulation (LFRRNU) decreased during deepening of sleep During REM sleep the average value of LFRRNU was similar to that recorded during the awakening period during sleep (W) suggesting that both desynchronized states were supported by an increase in sympathetic tone
342 High Altitude (3480 m) At 3480 m the average LFRRNU values recorded during all four stages of sleep were similar and ranged from 7577 during W 7625 during S1 + S2 6662 during S3 + S4 to 8097 during REM sleep (Table 4)
I GRITTI ET AL
Copyright copy 2013 SciRes JBBS
33
Table 3 Averages of the total power in the low frequency (LF ms2) (004 - 015 Hz) range appear to have a widespread neu-ronal genesis and are considered as a marker of sympathetic modulation or a marker of both sympathetic and vagal modula-tion The LF average was calculated in a physiologically defined number of 30-second signal epochs defined according to the standard criteria developed by Rechtschaffen and Kales (1968) recorded during the waking period during sleep (W) stages S1 + S2 and S3 + S4 of NREM and REM sleep at 122 m and after 30 - 41 h of acclimatisation at 3480 m in the five subjects(1)
Stages Subjects 122 m 3480 m
Epochs Epochs
Awakening during sleep N Mean SD N Mean SD Delta P value
CS 7 5148 2849 35 3163 1400 minus1985 00074
MR 3 10477 3742 3 6780 428 minus3697 ns
GM 13 9656 2978 12 6157 2271 minus3499 00033
DC 140 5083 4655 157 2774 2056 minus2309 00001
SS 27 9619 4825 64 12485 10724 2866 ns
No of epochs 190 271
No of subjects Mean SEM No of subjects Mean SEM Delta
subjects subjects
Average 5 7997 3810 5 6272 3376 minus1725 ns
S1 + S2 Epochs Epochs
N Mean SD N Mean SD Delta P value
CS 45 5946 2294 34 3539 1734 minus2407 00001
MR 58 10118 2699 52 6059 1641 minus4059 00001
GM 53 7692 2871 54 6998 2317 minus694 ns
DC 302 3090 1733 322 3036 1593 minus54 ns
SS 200 10155 6434 237 17947 12895 7792 00001
No of epochs 658 699
No of subjects Mean SEM No of subjects Mean SEM Delta
subjects subjects
Average 5 7400 3206 5 7516 4036 116 ns
S3 + S4 Epochs Epochs
N Mean SD N Mean SD Delta P value
CS 16 3760 1098 9 2276 2427 minus1484 00455
MR 11 8344 2222 6 3917 592 minus4427 00003
GM 9 4352 1275 7 4274 1504 minus78 ns
DC 98 2626 2066 25 2315 1056 minus311 ns
SS 92 5324 6544 59 6245 6031 921 ns
No of epochs 226 106
No of subjects Mean SEM No of subjects Mean SEM Delta
subjects subjects
Average 5 4881 2041 5 3805 2322 minus1076 ns
REM Epochs Epochs
N Mean SD N Mean SD Delta P value
CS 8 6497 1748 5 6105 2640 minus392 ns
MR 23 10159 2790 13 5200 1513 minus4959 00001
GM 10 8005 1910 13 8430 2376 425 ns
DC 62 6727 4144 30 3702 1995 minus3025 00003
SS 72 11509 6775 52 5140 4402 minus6369 00001
No of epochs 175
No of subjects Mean SEM No of subjects Mean SEM Delta
subjects subjects
Average 5 8579 3473 5 5715 2585 minus2864 ns
Footnotes to Table 3 (1)One-way ANOVA revealed no significant changes in the averages of the total power in the low frequency (LF ms2) (004 - 015 Hz) range (DF 73239 F test 13 P = 02819) Post-hoc comparison with Studentrsquos t-test of the average LF value recorded in 175 30-second epochs during REM sleep at sea level was significantly higher (P lt 002) than that recorded in 226 30-second epochs during stages S3 + S4 of NREM sleep at 122 m in all five subjects
I GRITTI ET AL
Copyright copy 2013 SciRes JBBS
34
Table 4 Averages of the total power in the low frequency (004 - 015 Hz) range in normalized units (LF-RR-NU) which is considered as a marker of sympathetic modulation measured in a physiologically defined number of 30-second signal epochs defined according to the standard criteria developed by Rechtschaffen and Kales (1968) recorded during the waking period during sleep (W) stages S1 + S2 and S3 + S4 of NREM and REM sleep at 122 m and after 30 - 41 h of acclimatisation at 3480 m in the five subjects(1)
Stages Subjects 122 m 3480 m Epochs Epochs
Awakening during sleep N Mean SD N Mean SD Delta P value CS 7 7306 625 35 7673 1005 367 ns MR 3 8459 707 3 8466 594 007 ns GM 13 8332 509 12 6003 1826 minus2329 00001 DC 140 6801 1923 157 7499 1752 698 0001 SS 27 5806 1316 64 8243 1395 2437 00001 190 271 No of subjects Mean SEM No of subjects Mean SEM Delta subjects subjects Average 5 7341 1015 5 7577 1314 236 ns
S1 + S2 Epochs Epochs N Mean SD N Mean SD Delta P value CS 45 6677 1570 34 6503 1511 minus173 ns MR 58 7641 945 52 8071 677 430 001 GM 53 7855 791 54 7444 950 minus411 00168 DC 302 5586 1623 322 8061 995 2475 00001 SS 200 5767 1792 237 8047 1271 2280 00001 No of epochs 658 No of subjects Mean SEM No of subjects Mean SEM Delta subjects subjects Average 5 6705 1344 5 7625 1081 minus92 ns
S3 + S4 Epochs Epochs N Mean SD N Mean SD Delta P value CS 16 4727 1123 9 4327 2723 minus385 ns MR 11 6373 1298 6 7390 793 1610 0015 GM 9 7019 1008 7 5953 1140 minus1066 ns DC 98 4584 1691 25 7440 1130 2856 00001 SS 92 3952 1607 59 7593 895 3641 00001 No of epochs 226 106 No of subjects Mean SEM No of subjects Mean SEM Delta subjects subjects Average 5 6476 1145 5 6662 1336 186 ns
REM Epochs Epochs N Mean SD N Mean SD Delta P value CS 8 6797 794 5 7953 587 1156 001748 MR 23 8086 593 13 8900 382 814 00001 GM 10 8383 858 13 7909 798 minus474 ns DC 62 7774 1239 30 8754 638 980 00001 SS 72 6118 1603 52 6967 1722 849 00056 No of epochs 175 113 No of subjects Mean SEM No of subjects Mean SEM Delta subjects subjects Average 5 7432 1017 5 8097 825 665 ns
Footnotes to Table 4 (1)One-way ANOVA revealed significant differences in the averages of the total power in low frequency (004 - 015 Hz) in normalized units (LFRRNU) (DF73239 F = 3229 P lt 00105) Post-hoc analysis with Fisher and Scheffeacute tests revealed that the LF-RR-NU component of the R-R intervals during the W state at 122 m differed significantly from than that during stages S3 + S4 (P = 005) The LF-RR-NU average values during the W state at 3480 m differed significantly from that during stages S3 + S4 (P lt 005) The LF-RR-NU average during stages S1 + S2 at 122 m differed significantly from that during REM sleep at 3480 m (P lt 005) The LF-RR-NU average during stages S1 + S2 recorded at 3480 m differed significantly from that during stages S3 + S4 The LF-RR-NU average during stages S3 + S4 at 122 m differed significantly from that during REM sleep at 122 m (P lt 005) The LF-RR-NU component of the R-R intervals during stages S3 + S4 at 122 m differed significantly from that during REM sleep at 3480 m (P lt 005) The LF-RR-NU average during stages S3 + S4 at 3480 m differed from that during REM sleep at 3480 m (P lt 005) in all five subjects Comparison with Studentrsquos t-test showed a significant difference between the average of the LF-RR-NU recorded in 190 30-second epochs during the waking period during sleep (W) at 122 m (P lt 003) and that recorded in 226 30-second epochs during stages S3 + S4 of NREM sleep at 122 m in all five subjects Comparison with Studentrsquos t-test showed a significant difference (P lt 00192) between the average of the LF-RR-NU in stages S3 + S4 of NREM sleep and that during REM sleep at 122 m in all five subjects
I GRITTI ET AL
Copyright copy 2013 SciRes JBBS
35
343 Sea Level (122 m) and High Altitude (3480 m) The average LFRRNU (Table 4) recorded during W at al- titude was significantly shorter than that recorded at sea level in 15 subjects (GM 6003 plusmn 1826 at 3480 m vs 8332 plusmn 509 at 122 m P lt 00001) and significantly longer in 25 subjects [(DC 7499 plusmn 1752 at 3480 m vs 6801 plusmn 1923 at 122 m P lt 0001) (SS 8243 plusmn 1395 at 3480 m vs 5806 plusmn 1316 at 122 m P lt 00001)]
The average LFRRNU recorded during S1 + S2 at high altitude was significantly longer than that recorded at sea level in 35 subjects [(MR 8071 plusmn 677 at 3480 m vs 7641 plusmn 945 at 122 m P lt 001) (DC 8061 plusmn 995 at 3480 m vs 5586 plusmn 1623 at 122 m P lt 00001) (SS 8047 plusmn 1271 at 3480 m vs 5767 plusmn 1792 at 122 m P lt 00001)] while in 15 the average LFRRNU was signifi- cantly shorter (GM 5953 plusmn 1140 at 3480 m vs 7019 plusmn 1008 at 122 m P lt 00168) in S3 + S4 The average LFRRNU recorded during S3 + S4 at high altitude was significantly longer than that recorded at 122 m in 35 subjects [(MR 7390 plusmn 793 at 3480 m vs 6373 plusmn 1298 at 122 m P lt 00150) (DC 7440 plusmn 1130 at 3480 m vs 4584 plusmn 1691 at 122 m P lt 00001) (SS 7593 plusmn 895 at 3480 m vs 3952 plusmn 1607 at 122 m P lt 00001)] The average LFRRNU recorded during REM sleep at high altitude was significantly longer than that recorded at 122 m in 45 subjects [(CS 7953 plusmn 587 at 3480 m vs 6797 plusmn 794 at 122 m P lt 001748) (MR 8900 plusmn 382 at 3480 m vs 8086 plusmn 593 at 122 m P lt 00001) (DC 8754 plusmn 638 at 3480 m vs 7774 plusmn 1239 at 122 m P lt 00001) (SS 6967 plusmn 1722 at 3480 m vs 6118 plusmn 1603 at 122 m P lt 00056)] These data show a great variabil- ity between mountain marathon runners in LFRRNU when the data set recorded at 122 m is compared with that re- corded at 3480 m Analysis of the data recorded in indi- vidual mountain marathon runners showed an increase in the average LFRRNU at 3480 m demonstrating an in- crease in the marker for sympathetic modulation
35 Total Power of High Frequency [(HF ms2) (015 - 04 Hz)] Range HF Primarily Reflects Respiratory-Driven Vagal Modulation of Sinus Rhythm
351 Sea Level (122 m) No significant differences in the averages of HF were observed between W (2223 plusmn 728) S1 + S2 (2945 plusmn 1080) and S3 + S4 (3891 plusmn 1134) and REM (2499 plusmn 879) stages at low altitude (Table 5) The averages of the HF recorded during the nocturnal sleep-wake cycle at 122 m suggested a prevalence of vagal tone during S3 + S4 stages in comparison with the other sleep stages
352 High Altitude (3480 m) No significant differences in the averages of HF were
observed between W (1572 plusmn 993) S1 + S2 (1610 plusmn 631) and S3 + S4 (1480 plusmn 511) and REM (1159 plusmn 555) stages at 3480 m (Table 5) The averages of the HF recorded during the nocturnal sleep-wake cycle at 3480 m sug- gested a reduction in vagal tone throughout all sleep stages and during awakening during sleep
353 Sea Level (122 m) and High Altitude (3480 m) Compared with the values calculated at sea level there was a significant decrease in the average of total power of high frequency (HF ms2) (Table 5) recorded during W at altitude in 35 subjects [(CS 1422 plusmn 384 at 122 m vs 743 plusmn 191 at 3480 m P lt 00001) (DC 1487 plusmn 729 at 122 m vs 717 plusmn 789 at 3480 m P lt 00001) (SS 4849 plusmn 1587 at 122 m vs 1674 plusmn 1179 at 3480 m P lt 00001)] and a significant increase in 15 subjects (GM 1654 plusmn 400 at 122 m vs 3495 plusmn 2196 at 3480 m P lt 00072)
Compared with the values calculated at sea level there was a significant decrease in the average HF recorded at altitude during S1 + S2 of NREM sleep in 45 subjects [(CS 2485 plusmn 1178 at 122 m vs 1513 plusmn 443 at 3480 m P lt 00001) (MR 2892 plusmn 906 at 122 m vs 1382 plusmn 546 at 3480 m P lt 00001) (DC 2167 plusmn 778 at 122 m vs 605 plusmn 297 at 3480 m P lt 00001) (SS 5375 plusmn 1950 at 122 m vs 2640 plusmn 1385 at 3480 m P lt 00001)] Compared with the averages calculated at 122 m there was a significant decrease in the average HF recorded during S3 + S4 of NREM sleep at 3480 m in 45 subjects [(CS 3776 plusmn 982 at 122 m vs 2044 plusmn 723 at 3480 m P lt 00001) (MR 4624 plusmn 1629 at 122 m vs 975 plusmn 506 at 3480 m P lt 00001) (DC 2617 plusmn 777 at 122 m vs 684 plusmn 249 at 3480 m P lt 00001) (SS 6866 plusmn 1904 at 122 m vs 1394 plusmn 681 at 3480 m P lt 00001)] and a significant increase in 15 subjects (GM 1571 plusmn 376 at 122 m vs 2303 plusmn 396 at 3480 m P lt 00021) There was a significant decrease in the average HF recorded during REM sleep in 45 sub- jects [(CS 2425 plusmn 531 at 122 m vs 1397 plusmn 774 at 3480 m P lt 00155) (MR 2248 plusmn 680 at 122 m vs 615 plusmn 233 at 3480 m P lt 00001) (DC 1530 plusmn 708 at 122 m vs 400 plusmn 149 at 3480 m P lt 00001) (SS 4885 plusmn 1559 at 122 m vs 1671 plusmn 1147 at 3480 m P lt 00001)]
The average HF at 3480 m recorded in individual mountain marathon runners was generally lower than that recorded at 122 m suggesting a decrease in the marker of vagal tone at altitude
36 High Frequency in Normalized Units [(HFRRNU) (004 - 015 Hz)] HFRRNU Is Considered as a Marker of Vagal Modulation
361 Sea Level (122 m) In all five subjects the average of the HFRRNU analyzed
I GRITTI ET AL
Copyright copy 2013 SciRes JBBS
36
Table 5 Averages of the total power in the high frequency (HF ms2) (015 - 04 Hz) range which primarily reflects respira-tory-driven vagal modulation of sinus rhythm in a natural physiologically defined number of 30-second signal epochs ac-cording to the standard criteria developed by Rechtschaffen and Kales (1968) during the waking period during sleep (W) stages S1 + S2 and S3 + S4 of NREM and REM sleep measured at 122 m and after 30 - 41 h of acclimatisation at 3480 m in the five subjects(1)
Stages Subjects 122 m 3480 m
Epochs Epochs
Awakening during sleep N Mean SD N Mean SD Delta P value
CS 7 1422 384 35 743 191 minus679 00001
MR 3 1701 449 3 1232 612 minus469 ns
GM 13 1654 490 12 3495 2196 1841 00072
DC 140 1487 729 157 717 789 minus770 00001
SS 27 4849 1587 64 1674 1179 minus3175 00001
No of epochs 190 271
No of subjects Mean SEM No of subjects Mean SEM Delta
subjects subjects
Average 5 2223 728 5 1572 993 minus651 ns
S1 + S2 Epochs Epochs
N Mean SD N Mean SD Delta P value
CS 45 2485 1178 34 1513 443 minus972 00001
MR 58 2892 906 52 1382 546 minus1510 00001
GM 53 1807 589 54 1909 484 102 ns
DC 302 2167 778 322 605 297 minus1562 00001
SS 200 5375 1950 237 2640 1385 minus2735 00001
No of epochs 658 699
No of subjects Mean SEM No of subjects Mean SEM Delta
subjects subjects
Average 5 2945 1080 5 1610 631 1335 ns
S3 + S4 Epochs Epochs
N Mean SD N Mean SD Delta P value
CS 16 3776 982 9 2044 723 minus1732 00001
MR 11 4624 1629 6 975 506 minus3649 00001
GM 9 1571 376 7 2303 396 732 00021
DC 98 2617 777 25 684 249 minus1933 00001
SS 92 6866 1904 59 1394 681 minus5472 00001
No of epochs 226 106
No of subjects Mean SEM No of subjects Mean SEM Delta
subjects subjects
Average 5 3891 1134 5 1480 511 minus2411 004
REM Epochs Epochs
N Mean SD N Mean SD Delta P value
CS 8 2425 531 5 1397 774 minus1028 00155
MR 23 2248 680 13 615 233 minus1633 00001
GM 10 1409 918 13 1711 472 302 ns
DC 62 1530 708 30 400 149 minus1130 00001
SS 72 4885 1559 52 1671 1147 minus1147 00001
No of epochs 175 113
No of subjects Mean SEM No of subjects Mean SEM Delta
subjects subjects
Average 5 2499 879 5 1159 555 minus1340 ns
Footnotes to Table 5 (1)One-way ANOVA revealed a significant difference between stages in the averages of the total power in the high frequency (HF ms2) (015-04 Hz) range (DF = 73239 F = 2576 P = 00317) Post-hoc Fisher analysis showed significant differences between the averages of HF during W at 122 m and during stages S3 + S4 at 122 m (P lt 005) There was a significant difference between the values measured during W at 3480 m and those during stages S3 + S4 at 122 m (P lt 005) The values measured during stages S1 + S2 at 122 m differed significantly from those during REM sleep at 3480 m in all five subjects
I GRITTI ET AL
Copyright copy 2013 SciRes JBBS
37
in a natural physiologically defined number of 30-sec- ond signal epochs according to standard criteria de- veloped by Rechtschaffen and Kales (1968) during the awakening period during sleep (W 2347 plusmn 946) was significantly shorter than that observed during S3 + S4 of NREM at 122 m (5691 plusmn 3114 P lt 00327) In all five subjects the average of the HFRRNU during S3 + S4 of NREM sleep (5691 plusmn 3114) was significantly longer (P lt 001004) than that observed during REM sleep (2264 plusmn 944 P lt 001004) at 122 m (Table 6) These data sug- gest an increase in vagal modulation during the deepen- ing of slow-wave NREM sleep and a decrease in vagal modulation during the desynchronized awakening period during sleep (W) and REM sleep
362 High Altitude (3480 m) The average of the HFRRNU analyzed between W (2131 plusmn 1108) S1 + S2 (2152 plusmn 976) S3 + S4 (3111 plusmn 1281) of NREM sleep and REM sleep (1674 plusmn 699) was simi- lar (Table 6) The data suggest an increase in vagal mo- dulation during S3 + S4 of slow-wave NREM sleep and a decrease in vagal modulation during the desynchronized awakening period during sleep (W) S1 + S2 of NREM sleep and during REM sleep
363 Sea Level (122 m) and High Altitude (3480 m) The mean of the averages of the HFRRNU (Table 6) re- corded during W at altitude was significantly shorter than that recorded at sea level in 25 subjects (DC 2229 plusmn 1447 at 3480 m vs 3087 plusmn 1875 at 122 m P lt 00001) (SS 1533 plusmn 1165 at 3480 m vs 3349 plusmn 1157 at 122 m P lt 00001)] and significantly longer in 15 subjects (GM 3315 plusmn 1339 at 3480 m vs 1515 plusmn 46 at 122 m P lt 00001) The mean of the averages of the HFRRNU re- corded during S1 + S2 at altitude was significantly shor- ter than that recorded at sea level in 35 subjects (MR 1881 plusmn 671 at 3480 m vs 2317 plusmn 948 at 122 m P lt 001) (DC 1832 plusmn 943 at 3480 m vs 4357 plusmn 1623 at 122 m P lt 0001) (SS 1638 plusmn 1036 at 3480 m vs 3686 plusmn 1723 at 122 m P lt 00001) The mean of the averages of the HFRR-NU recorded during S3 + S4 at al- titude was significantly shorter than that recorded at sea level in 25 subjects [(DC 2442 plusmn 1104 at 3480 m vs 5353 plusmn 1673 at 122 m P lt 00001) (SS 2229 plusmn 830 at 3480 m vs 5554 plusmn 1578 at 122 m P lt 00001)] The mean of the averages of the HFRR-NU recorded during REM sleep at altitude was significantly shorter than that at sea level in 35 subjects [(MR 1057 plusmn 376 at 3480 m vs 1850 plusmn 582 at 122 m P lt 00001) (DC 1156 plusmn 614 at 3480 m vs 2180 plusmn 1224 at 122 m P lt 00001) (SS 2681 plusmn 1455 at 3480 m vs 3215 plusmn 1457 at 122 m P lt 004)]
37 LFHF Ratio Mirrors Sympathovagal Balance or Reflects Sympathetic Modulation
371 Sea Level (122 m) In all five subjects the average of the LFHF ratio during W at 122 m was longer (46446 plusmn 28655) than that ob- served during S3 + S4 (16733 plusmn 10847 P lt 00110) (Table 7) the average of the LFHF ratio during S3+S4 (16733 plusmn 10847) was significantly shorter than that ob- served in 175 epochs of REM sleep (44739 plusmn 21405 P lt 00113) (Table 7) The data suggest an increase of sympathetic modulation during W and REM sleep in comparison of synchronized S1 minus S4 sleep
372 High Altitude (3480 m) The average of the LFHF ratio during S3 + S4 at 3480 m (32109 plusmn 10873) was significantly lower than that ob- served during REM sleep (69132 plusmn 36806 P lt 0036835) The data suggest an increase of sympathetic modulation during REM sleep in comparison to synchro- nized S3 + S4 sleep
373 Sea Level (122 m) and High Altitude (3480 m) The average of the LFHF ratio (Table 7) during W was significantly shorter at 3480 m than at 122 m in 15 sub- jects (GM 61615 plusmn 24214 at 122 m vs 23017 plusmn 13728 at 3480 m P lt 00001) and significantly longer at 3480 m than at 122 m in 25 subjects [(DC 49300 plusmn 62275 at 122 m vs 72334 plusmn 10049 at 3480 m P lt 00235) (SS 21570 plusmn 14672 at 122 m vs 94181 plusmn 81271 at 3480 m P lt 00001)] The average LFHF ratio during S1 + S2 was significantly longer at 3480 m than at 122 m in 35 subjects [(MR 50512 plusmn 23613 at 3480 m vs 39624 plusmn 18413 at 122 m P lt 00078) (DC 61907 plusmn 43641 at 3480 m vs 17193 plusmn 13779 at 122 m P lt 00001) (SS 79224 plusmn 67405 at 3480 m vs 23667 plusmn 216997 at 122 m P lt 00001)] and significantly shorter in 15 subjects (GM 39050 plusmn 16255 at 3480 m vs 46160 plusmn 20671 at 122 m P lt 00503) The average LFHF ratio was sig- nificantly longer at high altitude than at sea level during S3 + S4 in 35 subjects [(MR 46867 plusmn 18516 at 3480 m vs 21655 plusmn 12576 at 122 m P lt 00043) (DC 37484 plusmn 17785 at 3480 m vs 12203 plusmn 14342 at 122 m P lt 00001) (SS 40205 plusmn 23448 at 3480 m vs 09542 plusmn 10418 at 122 m P lt 00001)] The average LFHF ratio was significantly longer (P lt 00102 - 00001) during REM sleep at high altitude than at sea level in 45 sub- jects [(CS 47380 plusmn 14928 at 3480 m vs 28163 plusmn 09832 at 122 m) (MR 98554 plusmn 43032 at 3480 m vs 48217 plusmn 15891 at 122 m) (DC 10520 plusmn 66211 at 3480 m vs 52563 plusmn 37020 at 122 m) (SS 41387 plusmn 39490 at 3480 m vs 27194 plusmn 20375 at 122 m)]
At 122 m and at 3480 m there was a decrease in the LFHF ratio during deepening of NREM sleep indicating
I GRITTI ET AL
Copyright copy 2013 SciRes JBBS
38
Table 6 Averages of the total power in the high frequency (004 - 015 Hz) range in normalized units (HFRRNU) which is considered as a marker of vagal modulation in a natural physiologically defined number of 30-second signal epochs ac-cording to standard criteria developed by Rechtschaffen and Kales (1968) during the waking period during sleep (W) stages S1 + S2 and S3 + S4 of NREM and REM sleep recorded at 122 m and after 30 - 41 h of acclimatisation at 3480 m in the five subjects(1)
Stages Subjects 122 m 3480 m Epochs Epochs
Awakening during sleep N Mean SD N Mean SD Delta P value CS 7 2310 610 35 2105 979 minus205 ns MR 3 1475 628 3 1500 608 025 ns GM 13 1515 460 12 3315 1339 1800 00001 DC 140 3087 1875 157 2229 1447 minus858 00001 SS 27 3349 1157 64 1533 1165 minus1816 00001 No of epochs 190 No of subjects Mean SEM No of subjects Mean SEM Delta subjects subjects Average 5 2347 946 5 2131 1108 minus211 ns
S1 + S2 Epochs Epochs N Mean SD N Mean SD Delta P value CS 45 2929 1537 34 3235 1489 minus174 ns MR 58 2317 948 52 1881 671 minus436 001 GM 53 1997 745 54 2172 739 175 ns DC 302 4357 1623 322 1832 943 minus2524 0001 SS 200 3686 1723 237 1638 1036 minus2048 00001 No of epochs 658 699 No of subjects Mean SEM No of subjects Mean SEM Delta subjects subjects Average 5 3057 1315 5 2152 976 minus906
S3 + S4 Epochs Epochs N Mean SD N Mean SD Delta P value CS 16 4799 1184 9 5507 2698 708 ns MR 11 3590 1294 6 1953 802 minus1638 ns GM 9 2650 755 7 3426 997 776 ns DC 98 5353 1673 25 2442 1104 minus2911 00001 SS 92 5554 1578 59 2229 830 minus364 00001 No of epochs 226 106 No of subjects Mean SEM No of subjects Mean SEM Delta subjects subjects Average 5 5691 3114 5 3111 1281 minus2580 ns
REM Epochs Epochs N Mean SD N Mean SD Delta P value CS 8 2643 812 5 1787 431 minus856 ns MR 23 1850 582 13 1057 376 minus793 0001 GM 10 1431 646 13 1691 618 260 ns DC 62 2180 1224 30 1156 614 minus1024 00001 SS 72 3215 1457 52 2681 1455 minus534 00461 No of epochs 175 113 No of subjects Mean SEM No of subjects Mean SEM Delta subjects subjects Average 5 2264 944 5 1674 699 minus590 ns
Footnotes to Table 6 (1)One-way ANOVA of the averages of the total power in the high frequency (004 - 015 Hz) range in normalized units (HF-RR-NU) showed significant differences between conditions (DF73239 F 4071 P lt 00027) Post-hoc analysis demonstrated a significant difference between the average HF-RR-NU during W at 122 m and that during stages S3 + S4 at 122 m (P lt 005) The averages of HF-RR-NU during W at 3480 m differed significantly from those during stages S3 + S4 at 122 (P lt 005) The averages of HF-RR-NU during W at 122 m differed significantly from those during stages S3 + S4 at 122 m (P lt 005) The average of HF-RR-NU during stages S1 + S2 at 122 m differed significantly from that during stages S3 + S4 at 3480 m (P lt 005) The average of HF-RR-NU during stages S1 + S2 at 3480 m differed significantly from that during stages S3 + S4 at 122 m (P lt 005) The average of HF-RR-NU during stages S3 + S4 at 122 m differed significantly from that during stages S3 + S4 at 3480 m (P lt 005) The average of HF-RR-NU during stages S3 + S4 at 122 m differed significantly from that during REM sleep at 122 m (P lt 005) The average of HF-RR-NU during stages S3 + S4 at 122 m differed significantly from that during stages S3 + S4 at 3480 m (P lt 005) The average of HF-RR-NU during stages S3 + S4 at 3480 m differed significantly from that during REM sleep at 3480 m (P lt 005) in all five subjects Comparison with Studentrsquos t-test of the average of the HF-RR-NU in a natural physiologically defined number of 30-second signal epochs according to standard criteria developed by Rechtschaffen and Kales (1968) during the waking period during sleep (W) differed significantly from that during stages S3 + S4 of NREM sleep at 122 m in all five subjects (P lt 00327) Comparison with Studentrsquos t-test of the average of the HF-RR-NU in a natural physiologically defined number of 30-second signal epochs according to standard criteria developed by Rechtschaffen and Kales (1968) during stages S3 + S4 of NREM sleep differed significantly from that during REM sleep at 122 m in all five subjects (P lt 001004)
I GRITTI ET AL
Copyright copy 2013 SciRes JBBS
39
Table 7 Averages of the ratio of low frequencyhigh frequency (LF ms2HF ms2) range which mirrors sympathovagal bal-ance or reflects sympathetic modulation in a physiologically defined number of 30-second signal epochs according to stan-dard criteria developed by Rechtschaffen and Kales (1968) during the waking period during sleep (W) stages S1 + S2 and S3 + S4 of NREM sleep and REM sleep at 122 m and after 30 - 41 h of acclimatisation at 3480 m in the five subjects(1)
Stages Subjects 122 m 3480 m
Epochs Epochs
Awakening during sleep N Mean SD N Mean SD Delta P value
CS 7 347 14415 35 45477 22645 10777 ns
MR 3 6513 277 3 6517 3324 0004 ns
GM 13 61615 24214 12 23017 13728 minus38598 00001
DC 140 493 62275 157 72334 10049 23034 00235
SS 27 2157 14672 64 94181 81271 72611 00001
No of epochs 190 271
No of subjects Mean SEM No of subjects Mean SEM Delta
subjects subjects
Average 5 46446 28655 5 60036 50276 1357 ns
S1+ S2 Epochs Epochs
N Mean SD N Mean SD Delta P value
CS 45 29293 15299 34 25515 13856 minus03778 ns
MR 58 39624 18413 52 50512 23613 10888 00078
GM 53 4616 20671 54 3905 16255 minus0711 00503
DC 302 17193 13779 322 61907 43641 44714 00001
SS 200 23667 21697 220 79224 67405 55557 00001
No of epochs 658 683
No of subjects Mean SEM No of subjects Mean SEM Delta
subjects subjects
Average 5 31187 17972 5 51242 32954 2007 ns
S3+ S4 Epochs Epochs
N Mean SD N Mean SD Delta P value
CS 16 10919 0477 9 16633 22308 05714 ns
MR 11 21655 12576 6 46867 18516 25212 00043
GM 9 29344 12127 7 19357 0831 minus09987 ns
DC 98 12203 14342 25 37484 17785 25281 00001
SS 92 09542 10418 59 40205 23448 325 00001
No of epochs 226
No of subjects Mean SEM No of subjects Mean SEM Delta
subjects subjects
Average 5 1633 10847 5 32109 18073 1538 ns
REM Epochs Epochs
N Mean SD N Mean SD Delta P value
CS 8 281163 5 4738 14928 19217 00166
MR 23 482217 13 98554 43032 50337 00001
GM 10 6756 13 53138 20368 minus14422 ns
DC 62 52563 30 1052 66211 5264 00001
SS 72 27194 52 41387 3949 1493 00102
No of epochs 175 113
No of subjects Mean SEM No of subjects Mean SEM Delta
subjects subjects
Average 5 44739 5 69132 36806 2439 ns
Footnotes to Table 7 (1)One-way ANOVA showed no significant differences in the LFHF ratio in the different conditions Studentrsquos t-test showed that the average of the total power of the LFHF ratio during the waking state during sleep (W) (190 epochs) at 122 m was generally higher than the average LFHF ratio during stages S3 + S4 (226 epochs) at the same altitude in the five subjects (P lt 00110) Studentrsquos t-test showed that the average of the total power of the LFHF ratio during stages S3 + S4 in a total of 226 epochs of 30 seconds at low altitude was significantly lower than that in 175 epochs of REM sleep at 122 m in the five subjects (P lt 0011335) Studentrsquos t-test showed that the average of the total power of the LFHF ratio during stages S3 + S4 (106 epochs) at 3480 m was significantly lower than that during REM sleep (113 epochs) at high altitude in the five subjects (P lt 0036835)
I GRITTI ET AL
Copyright copy 2013 SciRes JBBS
40
a decline in sympathovagal balance At 122 m and at 3480 m the average values of LFHF during REM sleep were similar to those observed during the awakening period during sleep (W)
38 Total Power (TP ms2)
381 Sea Level (122 m) The average of the TP during the awakening period dur-ing sleep (W 33057 plusmn 18136) differed significantly from that recorded during S3 + S4 (13007 plusmn 4621 P lt 00068) During S3 + S4 of NREM sleep (13007 plusmn 4621) the average of the TP differed significantly from that observed during REM sleep (28480 plusmn 14192 P lt 0003341) (Table 8) The TP during REM sleep was similar to the TP values recorded during W
382 High Altitude (3480 m) During S3 + S4 of NREM sleep (9202 plusmn 3805) the av-erage of the TP differed significantly from that observed during REM sleep (22838 plusmn 11600 P lt 0002613) in all five subjects
383 Sea Level (122 m) and High Altitude (3480 m) (Table 8)
During W the average of the total power (TP ms2) re- corded at 122 m was longer than that recorded at 3480 m in 25 subjects [(MR 50528 plusmn 7837 at 122 m vs 30899 at 3480 m P lt 00254) (DC 17740 plusmn 23122 at 122 m vs 11197 plusmn 11829 at 3480 m P lt 00020)] (Table 8) During S1 + S2 the average of the TP at low altitude was significantly longer than that observed at 3480 m in 35 subjects [(MR 21950 plusmn 8436 at 122 m vs 16258 plusmn 9971 at 3480 m P lt 00015) (GM 20200 plusmn 11240 at 122 m vs 15218 plusmn 7421 at 3480 m P lt 00079) (DC 7240 plusmn 2998 at 122 m vs 6021 plusmn 3589 at 3480 m P lt 000019)] During S3 + S4 the average of the TP at 122 m was sig- nificantly longer than that observed at 3480 m in 45 sub- jects (CS 13176 plusmn 3660 at 122 m vs 8733 plusmn 5824 at 3480 m P lt 00275) (MR 17278 plusmn 4805 at 122 m vs 6865 plusmn 720 at 3480 m P lt 00001) (DC 6917 plusmn 3007 at 122 m vs 5262 plusmn 4686 at 3480 m P lt 00307) (SS 15005 plusmn 5017 at 122 m vs 10516 plusmn 9526 at 3480 m P lt 00002) At 3480 m during the awakening period during sleep (W 25672 plusmn 15424) the average of the TP dif- fered significantly from that recorded during S3 + S4 (9202 plusmn 3805 P lt 0028) The average of the TP re- corded during REM sleep at sea level was significantly shorter than that at altitude in 25 subjects (CS 39198 plusmn 13892 at 122 m vs 22879 plusmn 8514 at 3480 m P lt 00320) (SS 25442 plusmn 11874 at 122 m vs 14723 plusmn 7978 at 3480 m P lt 00001)
At 122 m and at 3480 m there was a decrease in TP during deepening of NREM sleep At 122 m and at 3480
m the average values of TP during REM sleep were simi- lar to those observed during awakening during sleep (W)
4 Discussion
Fluctuations in autonomic cardiovascular regulation dur- ing exposure to high-altitude environment may increase the risk of heart attack This study compared heart rate variability (HVR) and its components during sleep at low altitude and after 30 - 41 hours of acclimatization at high altitude (3480 m) in mountain marathon runners controlled for diet drugs light-dark cycle and jet lag dif- ferences At altitude RR-intervals became significantly shorter (P lt 0001) The significant changes in sympa- theticparasympathetic autonomic cardiovascular modu- lation at high altitude can protect against excessive oxy- gen deprivation particularly during sleep and thus lower the risk of heart attack Increase in R-R intervals during wake and sleep may require longer periods of acclimati-zation at 3480 m to mitigate the effects of altitudehypo- xia on the sympathetic tone of the mountain marathon runners thus reducing cardiovascular distress
5 Background
Molecular oxygen is essential for all higher forms of life and brain cell function During evolution humans and other animal species developed molecular biochemical and physiological mechanisms to optimize oxygen utili- zation efficacy Humans respond to acute or chronic ex- posure to hypobaric-hypoxia by resetting the pO2 balance to ensure brain and heart cell function Understanding how the body adjusts its biochemical and physiological cellular needs may help to better define the health risks associated with activities in hypobaric-hypoxia condi- tions and can aid in identifying appropriate therapeutic non-pharmacological andor pharmacological treatments Our ability to breathe and to modify breathing according to the amount of available ambient oxygen and to our bodyrsquos demands (particularly those of the brain heart and lungs) is essential for survival Failure to breathe or an inadequate oxygen supply especially to the brain contributes to cardiorespiratory distress In hypoxic con- ditions distribution of cardiac output to the cardiovascu- lar beds is subordinate to a preprogrammed priority pro- gram for preservation of the organism In hypoxic condi- tions the majority of neuronal systems of the brain in- crease andor change their firing rate in order to modulate in a cyclic manner the discharge of the neurons involved in regulating the oxygen supply in mammals [151618 19]
Acute and chronic exposure to hypoxemia leads to all sorts of disturbances that suggest impaired excitatory neuronal functions involved in the behavioral and meta- bolic integration of autonomic control and arousal [15]
I GRITTI ET AL
Copyright copy 2013 SciRes JBBS
41
Table 8 Averages of the total power (TP ms2) in a physiologically defined number of 30-second EEG signal epochs accord-ing to standard criteria developed by Rechtschaffen and Kales (1968) during the waking state during sleep (W) stages S1 + S2 and S3 + S4 of NREM sleep and REM sleep at 122 m and after 30 - 41 h of acclimatisation at 3480 m in the five subjects
Stages Subjects 122 m 3480 m Epochs Epochs
Awakening during sleep N Mean SD N Mean SD Delta P value CS 7 33449 24257 35 25486 16753 minus7963 ns MR 3 50528 7837 3 30899 5845 minus19629 00254 GM 13 29277 9809 12 28573 22336 minus704 ns DC 140 17740 23122 157 11197 11829 minus6543 0002 SS 27 34293 25655 64 32203 20358 minus2090 ns No of epochs 190 271 No of subjects Mean SEM No of subjects Mean SEM Delta subjects subjects Average 5 33057 18136 5 25672 15424 minus7385 ns
S1+ S2 Epochs Epochs N Mean SD N Mean SD Delta P value CS 45 29292 16380 34 22533 13712 minus6758 MR 58 21950 8436 52 16258 9971 minus5692 ns GM 53 20200 11240 54 15218 7421 minus4982 00015 DC 302 7420 2998 322 6021 3589 minus1398 00079 SS 200 25316 18423 237 29006 16917 3690 00001 No of epochs 658 683 00297 No of subjects Mean SEM No of subjects Mean SEM Delta subjects subjects Average 5 20836 11495 5 17807 10322 minus3028 ns
S3+ S4 Epochs Epochs N Mean SD N Mean SD Delta P value CS 16 13176 3660 9 8733 5824 minus4443 00275 MR 11 17278 4805 6 6865 720 minus10412 00001 GM 9 12659 6614 7 11634 6801 minus1025 ns DC 98 6917 3007 25 5262 4686 minus1655 00307 SS 92 15005 5017 59 10516 9526 minus4489 00002 No of epochs 226 106 No of subjects Mean SEM No of subjects Mean SEM Delta subjects subjects Average 5 130007 4621 5 9202 3805 minus3798 ns
REM Epochs Epochs N Mean SD N Mean SD Delta P value CS 8 39198 13892 5 29459 13908 minus938 ns MR 23 33035 14907 13 22879 8514 minus10156 0032 GM 10 23552 6159 13 29734 9673 6182 ns DC 62 21174 24128 30 17396 17929 minus3778 ns SS 72 25442 11874 52 14723 7978 10719 00001 No of epochs 175 113 No of subjects Mean SEM No of subjects Mean SEM Delta subjects subjects Average 5 28480 14192 5 22838 116000 minus5642 ns
Footnotes to Table 8 (1)One-way ANOVA showed a significant difference in the average of the total power (TP) between conditions (DF 73239 F = 5433 P = 00004) Post-hoc Fisher analysis revealed a significant difference between the average of the TP recorded at 122 m during waking (W) and that recorded at 122 m during stages S1 + S2 (P lt 005)and during stages S3 + S4 (P lt 005) Post-hoc Fisher analysis revealed a significant difference between the average of the TP recorded at 122 m during waking (W) and that at 3480 m during stages S1 + S2 (P lt 005) and stages S3 + S4 (P lt 005) Post-hoc Fisher analysis revealed a significant difference between the average of the TP recorded at 122 m during waking (W) and that at 3480 m during REM sleep (P lt 005) Post-hoc Fisher analysis revealed a significant difference between the average of the TP recorded at 3480 m during stages S3 + S4 and that at 122 m during stages S3 + S4 (P lt 005) Post-hoc Fisher analysis revealed a significant difference between the average of the TP recorded at 122 m during stages S1 + S2 and that at 3480 m dur- ing REM sleep (P lt 005) Post-hoc Fisher analysis revealed a significant difference between the average of the TP recorded at 3480 m during stages S1 + S2 and that at 122 m during REM sleep (P lt 005) Post-hoc Fisher analysis revealed a significant difference between the average of the TP recorded at 122 m during stages S3 + S4 and that at 122 m during REM sleep (P lt 005) Post-hoc Fisher revealed a significant difference between the average of the TP recorded at 3480 m during stages S3 + S4 and that at 122 m during REM sleep (P lt 005) Post-hoc Fisher analysis revealed a significant difference between the average of the TP recorded at 3480 m during stages S3 + S4 and that at 3480 m during REM sleep (P lt 005) in the five subjects Post-hoc analysis with Studentrsquos t-test showed a significant difference (P lt 005) between the average of the total power (TP ms2) in a physiologically defined number of 30-second signal epochs according to standard criteria developed by Rechtschaffen and Kales (1968) recorded during the waking state during sleep (W) (190 epochs) and that during stages S3 + S4 (226 epochs) at 122 m (P lt 00068) in the five subjects Post-hoc analysis with Studentrsquos t-test showed a significant difference (P lt 0028) between the average of the total power (TP ms2) in a physiologically defined number of 30-second signal epochs according to standard criteria developed by Rechtschaffen and Kales (1968) recorded during the waking state during sleep (W) (271 epochs) and that during stages S3 + S4 (106 epochs) at 3480 m in the five subjects Post-hoc analysis with Studentrsquos t-test showed a significant difference (P lt 0003341) between the average of the total power (TP ms2) in a physio-logically defined number of 30-second signal epochs according to standard criteria developed by Rechtschaffen and Kales (1968) recorded during stages S3 + S4 (226 epochs) and that during REM sleep (175 epochs) at 122 m in the five subjects Post-hoc analysis with Studentrsquos t-test showed a significant difference (P lt 0002613) between the average of the total power (TP ms2) in a physiologically defined number of 30-second signal epochs according to standard criteria devel-oped by Rechtschaffen and Kales (1968) recorded during stages S3 + S4 (106 epochs) and that during REM sleep (113 epochs) at 3480 m in the five subjects
I GRITTI ET AL
Copyright copy 2013 SciRes JBBS
42
Research into the causes of cardiovascular mortality ex- perimental evidence for a predisposition to fatal arrhyth- mias signs of tonic or phasic increased sympathetic ac- tivity and reduced parasympathetic-cholinergic-vagal ac- tivity has advanced efforts for the development of quan- titative markers of heart rate variability (HRV) (Task Force [1])
51 Heart Rate Variability during Wake and Sleep
HRV has been established as a non-invasive tool to study cardiac autonomic activity and proposed as a predictor for evaluating the increased risk of cardiac death Inter- actions of changes in cardiac autonomic nervous modu- lation in various types of subjects are under study by the Task Force [1] An overnight declining trend of HRV has been found to increase during sleep [14] Otzenberger and co-workers [14] demonstrated that overnight profiles of the R-R intervals are related to changes in the sleep EEG mean frequency sign which reflects the depth of sleep During attentive-to-quiet waking and from the lighter to the deeper phases of sleep HRV has been shown to be affected by vagalsympathetic modulation and control
52 Heart Rate Variability and Mountain Marathon Runners
Past studies showed that the high-altitude endurance per- formance of mountain marathoners is appreciably re- duced at 5200 m Based on their clinical characteristics mountain marathoners can be considered as a physio- logical model for studying cardiovascular alterations of long-lasting stay and exercise at high altitude Over the last 12 years the time course of cardiovascular changes in the mountain marathon runners has been assessed be- fore during and after the end of races at altitude In sea- level native mountain marathoners long-lasting training mdashfrom sea level to altitudemdashcan lower the HR during rest and exercise associated with a decrease in sympa- thetic modulation and a rise in parasympathetic activity [20] As in normal subjects so too in well-trained moun- tain marathoners cardiovascular modifications can change continuously over a 24-h period during acclimatization and the nocturnal sleep-wake-cycle at low and high alti- tudes In mountain marathoners just as in normal sub- jects HRV alterations at altitude may include altered resting HR due to changes in the vagal and sympathetic components besides the appearance of sinus arrhythmia during waking and periodically during nocturnal S1 + S2 NREM sleep and REM sleep breathing
As suggested by the Task Force [1] the present study data were obtained during sleep and as such may add valuable insights for research into HRV With this study we also wanted to determine whether 20 years of training
between 122 m and 5200 m altitude could have exerted in addition to the changes reported elsewhere [912] a high impact on the autonomiccardiovascular systems of the mountain marathon runners during the nocturnal sleep- wake cycle at low and at high altitudes
Our study documents that in mountain marathoners the nocturnal sleep-wake cycle at 122 m is highly influ- ence by autonomic parasympathetic activity and by in- creased autonomic parasympathetic activity during the deepening of NREM sleep The results also show a phy- siological decrease in parasympathetic activity versus an increase in sympathetic activity during all phases of the nocturnal sleep-wake cycle at 3480 m Surprisingly our study also documents that the nocturnal sleep-wake cycle at 3480 m is still characterized by an increase in auto- nomic parasympathetic activity during light S1 + S2 NREM sleep At both altitudes the trend of the balance of parasympatheticsympathetic activity recorded during REM sleep is similar to that recorded during the awak- ening state (W)
53 R-R Intervals (ms)
531 Sea Level (122 m) The averages of the R-R intervals recorded at 122 m did not change significantly between nocturnal awakenings during sleep and sleep stages (R-R interval range 1200 - 1300 ms) The average R-R interval at 122 m during the awaking state of sleep was similar to that recorded dur- ing the wake state in 12 trained endurance athletes who performed a minimum of 3 h of aerobic activity per week [21]
532 High Altitude (3480 m) The majority of the ECG alterations in the five mountain runners during sleep at an altitude of 3480 m and at a barometric pressure (PB) of 495 mm Hg and between 30 and 41 h of acclimatization were signs of sinus arrhyth- mia during the early stages (S1 + S2) of NREM sleep and during REM sleep At 3480 m the average of the R-R intervals we recorded during S1 + S2 of NREM sleep were significantly longer than those observed during the awaking period (W) during sleep The longest average R-R intervals were recorded during S1 + S2 at 3480 m These results suggest that at altitude there was still a significant elevation of parasympathetic tone during S1 + S2 of slow-wave sleep versus the waking state during sleep at 3480 m
533 Sea Level (122 m) and High Altitude (3480 m) There was a nonpathological significant reduction in the R-R intervals during the awakening period during sleep (W) S1 + S2 S3 + S4 of NREM and REM sleep stages and after 30 - 41 h of acclimatization to an altitude of
I GRITTI ET AL
Copyright copy 2013 SciRes JBBS
43
3480 m versus the averages of the R-R intervals ob- served during the same stages at 122 m
The longest average R-R intervals were recorded dur- ing the light stage of slow-wave-sleep (S1 + S2) at 122 m (suggesting high vagal activation) and the lowest aver- age R-R intervals were recorded during the awakening period during sleep (W) at 3480 m (indicating an in- crease in noradrenergic activation) Overall the average R-R intervals at high altitude were significantly lower than those recorded at 122 m with the average R-R in- tervals we recorded at 3480 m even during the awaken- ing period (W) during sleep (935 ms) The absolute value of the R-R intervals Bernardi and co-workers [22] found in 10 sea-level native subjects at low altitude was 1002 plusmn 45 ms and 809 plusmn 116 ms in 3 high-altitude native sub- jects living at low altitude In that study the average R-R intervals in the 10 sea-level native subjects and in 3 high- altitude native subjects (living at low altitude) exposed to 4970 m for 3 days were 775 plusmn 57 and 749 plusmn 47 respec- tively The delta of the averages of the R-R intervals that we calculated in our subjects after exposure to 3480 m was similar to the delta of the R-R intervals Bernardi and co-workers [22] reported In our study the average R-R intervals recorded at 122 m and 3480 m during all sleep stages were also longer than those observed by Lanfran- chi and co-workers [2] in 41 mountaineers during wak- ing with and without AMS and after acute exposure to approximately 4500 m Overall the average R-R inter- vals we recorded at 122 m and 3480 m demonstrate that frequent exposure to altitudes between 122 m and 5500 m for more than 20 years may have improved the effi- cacy of vagal modulation at low and high altitude during nocturnal awakening and sleep
54 Simple Linear Regression Analysis between the R-R Intervals and the SpaO2
Linear regression analysis showed a significant negative correlation between the changes in the average SpaO2 and the changes in the average R-R intervals The sig- nificant negative correlation between SpaO2 and R-R intervals may indicate that the average quantity of oxy- gen supplied during nocturnal sleep stages may be di- rectly responsible for the R-R interval changes observed during nocturnal sleep particularly at high altitude
55 Total Power of Very Low Frequency [(VLF ms2) (lt004 Hz)] Such as the Thermoregulation-Related HRV
The thermoregulatory-related very low frequency (VLF) rhythm may be related to thermoregulatory changes or chemical and acid-base equilibrium changes or both In- terestingly the changes in the VLF are significantly co- related with the PCO2 changes (personal observations
DF13839 R-squared = 0191 coefficient = ndash970294 Ftest = 8982 P = 00048 t = 1146) tCO2 changes (personal observations DF13839 R-squared = 0189 coefficient = ndash21649785 Ftest = 8871 P = 0005 t = 2978) and
3HCOminus changes (personal observations DF13839 R- squared = 0184 coefficient = ndash21682826 Ftest = 8557 P = 00058 t = 2925)
551 Sea Level (122 m) At 122 m the average VLF decreased during S1 + S2 and significantly so during S3 + S4 compared with the average VLF recorded during the waking period (W) The average VLF during S3 + S4 at 122 m was signifi- cantly shorter than the average VLF recorded during the awakening period (W) during sleep The average VLF during S3 + S4 at 122 m was shorter than the average VLF recorded during REM sleep At 122 m there was a decrease in the average VLF during NREM sleep and an increase in VLF during the desynchronized waking state The average VLF during desynchronized REM sleep at 122 m was slightly shorter than the average VLF re- corded during the awakening period (W) during sleep
552 High Altitude (3480 m) At 3480 m the average VLF decreased during S1 + S2 and significantly so during S3 + S4 compared with the average VLF recorded during the awaking period (W) during sleep The average VLF during S3 + S4 at 3480 m was significantly shorter than the average VLF recorded during the awakening period (W) during sleep At 3480 m there was a decrease in the average VLF during NREM sleep and an increase during the desynchronized awaking state during sleep and REM sleep The average VLF during REM sleep at 3480 m was slightly shorter than that observed during the awakening period (W) dur- ing sleep
553 Sea Level (122 m) and High Altitude (3480 m) The average VLF during the awakening period (W) dur- ing sleep S1 + S2 S3 + S4 and REM sleep at 122 m was longer but not significantly so compared with the average VLF observed at 3480 m
56 Total Power of Low Frequency [(LF ms2) (004 - 015 Hz)] Range The LF Appears to Have a Widespread Neuronal Genesis and Is Considered as a Marker of Sympathetic Modulation or a Marker of Both Sympathetic and Vagal Modulation
561 Sea Level (122 m) Statistical analysis of our data revealed that the average of the LF during desynchronized REM sleep at 122 m was significantly longer than that recorded during syn-
I GRITTI ET AL
Copyright copy 2013 SciRes JBBS
44
chronized S3 + S4 sleep These data demonstrate an in- crease in parasympathetic tone during REM sleep
562 High Altitude (3480 m) In altitude there was a significant increase in sympathetic tone throughout the awakening period (W) during sleep the S1 + S2 and the REM sleep The sympathetic tone decreased during the deep phase of slow wave sleep (S3 + S4)
563 Sea Level (122 m) and High Altitude (3480 m) No significant changes were found between the average LF recorded at 122 m and that recorded at 3480 m How- ever in some subjects a significant decrease emerged between the average of LF recorded during the awaken- ing period (W) during sleep S1 + S2 S3 + S4 and REM sleep at 122 m versus the average of LF recorded at 3480 m
The average LF recorded in all 5 mountain marathon- ers and in all 4 stages of desynchronization and synchro- nization at 122 m and at 3480 m (Table 3) were longer than the average LF Ako and co-workers [3] observed in 7 subjects during sleep at sea level
We also found a decrease in the average LF during S3 + S4 at 122 m and 3480 m compared with the average LF recorded during S1 + S2 The average LF recorded in our study during the desynchronized REM sleep state at 122 m and 3480 m returned to similar values we recorded during the desynchronized awakening period (W) during sleep A comparison of LF indices in the different sleep stages recorded at 122 m and at 3480 m revealed a de-crease in the LF from the waking to the deep stages of sleep The average LF during REM sleep was similar to the average LF recorded during waking Like those of Ako and co-workers [3] our data suggest that sympa- thetic nervous activity decreases as sleep deepens and concomitantly increases during desynchronization of the awakening period (W) during sleep and even more so during desynchronization during REM sleep In our study the average LF a marker of sympathetic modulation during the awakening period (W) during sleep S1 + S2 S3 + S4 and REM sleep at 122 m and at 3480 m was lower
57 LFRRNU
The aim of this study was also to verify whether auto- nomic variables at low altitude could predict prodromic signs of AMS when subjects were exposed to high alti- tude or whether subjects experienced AMS at high alti- tude Autonomic cardiovascular function was also ex- plored by measuring widespread neuronal genesis rhythm low frequency in normalized unit (LFRRNU) to study sympathetic modulation
Lanfranchi and co-workers [2] reported a substantial increase in the LFRRNU component at altitude suggest- ing an increase in sympathetic modulation in response to hypoxia at 4500 m During exposure to high altitude besides shorter R-R intervals we also found a relative though not significant increase in the LFRRNU compo- nent
We agree with Lanfranchi and co-workers [2] that this increase in the LFRRNU component may reflect an in- crease in the sympathetic modulation of HR During ex- posure to 3480 m R-R interval variability decreased as the LF component increased suggesting an increase in sympathetic modulation in response to hypobaric-hypo- xia The average LFRRNU Lanfranchi and co-workers [2] recorded in 24 subjects without AMS after exposure to approximately 4500 m during waking was similar to the average we recorded in our subjects during the awaken- ing period (W) during sleep at 3480 m (73 vs 75 respec- tively)
LFRRNU has been said to be a quantitative marker of the cardiac vigil (Vanderwalle et al [23]) and sympa- thetic outflow of the autonomic nervous system By means of spectral analysis of subjects in supine position the Task Force [1] calculated an average LFRRNU of 54 which is fairly similar to the average values in 45 of our subjects 47 in CS 45 in DC and 39 in SS in supine po- sition during S3 + S4 at 122 m Overall the average LFRRNU reported by the Task Force [1] is somewhat lower than our data (54 vs 39 - 89 respectively)
From a steady-state HRV analysis Murrel and co- workers [24] found an average LFRRNU of 77 in the standing position and premarathon conditions an average between 72 and 92 immediately after a marathon and an average of 73 in the standing position at 48 h postmara- thon These data appear similar to the data we recorded at 122 m and 3480 m during the awakening S1 + S2 S3 + S4 and REM stages of sleep
Specifically at 122 m there was a decrease in LFRRNU as sleep depth increased during the desynchronized phase of sleep (the awakening state) the LFRRNU reached the values observed during REM sleep At 3480 m there was a decrease in LFRRNU as sleep deepened during the de- synchronized phase of sleep (the awakening state) the LFRRNU reached the values recorded during the REM phases at 3480 m
58 High Frequency
Efferent vagal activity is a major contributor to the high frequency (HF) component (Task Force [1]) which pri- marily reflects respiration-driven vigil modulation of the sinus rhythm Other factors such as voluntary controlled respiration cold stimulation of the face or rotational mo- tor stimuli (see above) can occur physiologically during
I GRITTI ET AL
Copyright copy 2013 SciRes JBBS
45
sleeping and might confound results Spectral analysis of stationary supine subjects revealed an average normal HF close to 975 ms2 (Task Force [1]) Saito and co-workers [25] reported an average HF of 780 plusmn 211 ms2 in 21 sub- jects during waking at low altitude and an average HF between 61 plusmn 44 and 112 plusmn 128 ms2 after exposure for 4 - 6 h at PB 495 mm Hg Lanfranchi and co-workers [2] reported an average HF between 102 plusmn 37 and 157 plusmn 43 ms2 in subjects exposed to approximately 4500 m or between 135 plusmn 30 and 64 plusmn 4 ms2 in those with no signs of AMS Briefly in the subjects without AMS there was a non significant increase in the HF component At low altitude the average HF in our five mountain marathon runners increased as sleep deepened and decreased dur- ing REM sleep to levels similar to those observed in the waking state The average HF at altitude was 1572 ms2 during the awakening state 1610 ms2 during S1 + S2 1480 ms2 during S3 + S4 and 1159 ms2 during REM sleep The average HF decreased during the sleep stages Surprisingly the average HF of 1159 ms2 during REM sleep at high altitude was lower than the average ob- served during the desynchronized state during waking
As reported by the Task Force [1] we also found the HF vigil component of the power spectrum to be aug- mented during NREM sleep at low altitude
59 HFRRNU
The average of total power expressed in high frequency RR normalized units (HFRRNU) is considered a marker of vagal modulation of the autonomic system The values that we found at low altitude during the awakening pe- riod (W) during sleep during S2 + S3 and S3 + S4 and during REM sleep were similar to those Murrell and co- workers [24] recorded at premarathon postmarathon and 48 h postmarathon assessment under controlled normal breathing and standing conditions Our HFRRNU data recorded during the awakening period (W) during sleep at 122 and were similar to those they reported during REM sleep (2347 versus 2264 respectively) In their evaluation of LFRRNU the average HF (controlled brea- thing) was 5845 during the premarathon stage 45 during and 53 at 48 h postmarathon The average HFRRNU de- creased immediately after the race and at 48 h postmara- thon All these values are very close to the average LFRRNU we recorded in the subjects during S3 + S4 sleep at low altitude
Of note is that HFRRNU at low and at high altitudes increases at sleep onset and peaks during the deep stage of sleep (S3 + S4) at altitude (5691) After exposure to 3480 m at a PB of 495 mm Hg for 30 - 41 h there was a non significant reduction in HFRRNU across all sleep stages The average HFRRNU during the awakening pe- riod (W) during sleep at 3480 m was lower but still simi-
lar to that at 122 m These values were similar though lower than those Murrell and co-workers [24] recorded immediately and at 48 h post-marathon at altitude
Our HFRRNU data recorded during sleep at 122 m and 3480 m were also similar to those Lanfranchi and co- workers [2] reported in subjects without AMS and those with AMS (16 and 31 respectively) during the supposed diurnal state and after exposure to 4500 m
Compared with the HFRRNU reported by the Task Force [1] our data recorded during the awakening state S1 + S2 and S3 + S4 and REM sleep at sea level and at 3480 m were 2131 and 3111 respectively
510 LFHF Ratio
Exercise and training at low and high altitudes may have modified autonomic nervous system balance and thus the LFHF ratio The LFHF ratio is considered by some in- vestigators as the mirror of sympathovagal balance or a reflection of sympathetic modulation (Ako et al [3]) In agreement with Ako and co-workers [3] we observed significantly at low altitude but indeed also at high alti- tude a significant decrease in the LFHF component as sleep deepened In agreement with Ako and co-workers [3] we also observed that the sympathetic nervous sys- tem is activated during the two desynchronisation phases of REM sleep and deactivated during NREM sleep at low and high altitude
In detail we analyzed the dynamics of nocturnal fluc- tuations of autonomic nerve activities in sleep stages classified by Rechtschaffen and Kalesrsquos criteria These criteria have not yet been investigated in association with HRV indices particularly during hypoxic conditions Ako and co-workers [3] found an increase in the LFHF ratio (251 plusmn 017) during REM sleep and a significant linear decrease during NREM sleep (S1 230 plusmn 029 S2 185 plusmn 009 S3 078 plusmn 006 S4 251 plusmn 017) Like Ako and co-workers [3] we noted a reduction in the LFHF ratio at 122 m and at 3480 m during NREM sleep (S1 + S2122 m 31187 S1 + S23480 m 51242 S3 + S4122 m 16733 S3 + S43480 m 32109) and an increase during REM sleep (REM122 m 44739 REM3480 m 69132) to the level found during the awaking period (W) during sleep (W122m 46446 and W3480 m 60036) We also found that the av- erage LFHF ratio during S3 + S4 of NREM sleep at 122 m (LFHF = 16733) was similar to that reported by the Task Force [1] (LFHF 15 - 20) in the spectral analysis of stationary supine 5-minute recordings In our study the average LFHF ratio at 122 m and 3480 m during the awaking period (W) during sleep (W122 m 46446 and W3480 m 60036 respectively) was lower yet similar to the average LFHF ratio Lanfranchi and co-workers [2] found during the waking state at 4500 m in mountaineers with and without AMS (34 plusmn 13 and 83 plusmn 14 respectively)
I GRITTI ET AL
Copyright copy 2013 SciRes JBBS
46
Saito and co-workers [25] found an average LFHF ratio of 26 plusmn 08 at PB 760 mm Hg at sea level during the re- laxed waking state This was similar to the value we found (16733) during S3 + S4 at 122 m They reported an average LFHF ratio of 35 plusmn 23 at 3456 m and at a PB of 495 mm Hg which was similar to the average of 32109 that we recorded during S3 + S4 at 3480 m The average LFHF ratio that we found in all five mountain runners during S3 + S4 (16733 plusmn 10847) at 122 m was similar to that reported by the Task Force [1] In some of the mountain marathon runners at low altitude at 122 m and after 30 - 41 h of acclimatization at 3480 m during the different stages of desynchronized and synchronized sleep the average LFHF ratio reached the normal values reported by the Task Force [1] (between 15 and 20) The LFHF ratio value of 2 which is considered normal by the Task Force [1] was recorded at 122 m in 15 sub- jects (SS) during the awakening period (W) of sleep 35 subjects (CS DC SS) during S1 + S2 and 55 subjects during S3 + S4 25 subjects (CS SS) during the REM sleep stage A LFHF ratio value of 2 was reached after 30 - 41 h of acclimatization at 3480 m by 15 subjects (GM) during the awakening period (W) of sleep 15 subjects (CS) during S1 + S2 and 25 subjects (CS GM) during S3 + S4 No changes were noted between the av- erage LFHF ratio recorded in all five mountain runners at 122 m and after 30 - 41 h of acclimatization at 3480 m and during all four stages of sleep awakening period (W) during sleep S1 + S2 S3 + S4 and REM sleep These results suggest highly controlled regulation of sympa- thovagal balance on exposure to moderate hypoxia con- ditions As reported in Table 7 several mountain mara- thon runners showed very high control of sympathovagal balance their LFHF ratio was similar to that reported by the Task Force [1] or did not differ between 122 m and 3480 m after 30 - 41 h of acclimatization during the awakening period (W) during sleep during S1 + S2 during S3 + S4 or during the REM sleep Cornolo and co-workers [20] reported an average LFHF ratio of ~60 in trained high-altitude native subjects 6 - 8 h after the end of a marathon performed between 4100 and 4400 m This was similar to the average LFHF ratio that we re- corded at 3480 m during the desynchronized state of sleep specifically during the awakening period (W) dur- ing sleep (60036 plusmn 50276) and during the REM sleep at the same altitude (69132 plusmn 36806)
511 Total Power
We observed significant parallel changes in TP recorded at low (PB about 740 mm Hg) and high (PB 495 mm Hg) altitude between the awakening period (W) during sleep and S3 + S4 of sleep We also found significant parallel changes in the TP recorded during REM sleep and the
average of TP recorded during S3 + S4 at 122 and 3480 m These changes may reflect changes in cardiac re- spiratory and sympathovagal balance In general in indi- vidual mountain marathon runners we found a decrease in the total power at altitude The components of HRV are thought to be influenced by both neuronal and hu- moral factors (Task Force [1]) Saito and co-workers [25] reported that humoral control of the autonomic nervous system plays an important role in the survival of victims under hypoxic conditions at high altitude
6 Functional Significance
Physical training at low and high altitudes may have in- duced marked autonomic adaptations in the mountain marathon runners over the course of their years of train- ing The resting heart rate was lower at sea level because parasympathetic modulation predominates over higher sympathetic control at high altitude By constantly main- taining their training levels at low and high altitudes for more than 20 years the mountain runners may have shifted their cardiovascular autonomic control toward a greater parasympathetic modulation particularly at sea level Rest and training under hypoxia conditions may have balanced the prevalence of parasympathetic modu- lation as well as improved control of phasic sympathetic responses
These well-trained runners seem to be exceptionally adapted to the high altitude environment [4-13] Strenu- ous exercise is known to induce profound cardiovascular modifications but with a caveat for non-professional ma- rathoners
We agree with Lanfranchi et al [2] that HRV analysis has proved to be essential for investigating the mountain sickness the balance of the sympathetic and parasympa- thetic function of the autonomic nervous system at low and high altitude in mountain marathon runners HRV analysis could also be very useful for evaluating de- creases in parasympathetic and increases in sympathetic tone of the autonomic nervous system during acclimati- zation at altitude of mountain marathon runners who ge- nerally have a tonic prevalence of parasympathetic tone at low altitude
R-R interval variability was observed in the mountain marathon runners during sleep at 122 m (ie a controlled increase in parasympathetic tone during NREM sleep and an increased sympathetic tone during the awakening pe- riod (W) during sleep and during REM sleep) At high altitude the RR-intervals we observed were similar to those Sacknoff and co-workers [21] reported in athletes and controls Moreover the major ECG alterations evi- dent during sleep at an altitude of 3480 m at a PB of 495 mm Hg and after 30 - 41 hours of acclimatization were an increase in HR together with signs of sinus arrhyth-
I GRITTI ET AL
Copyright copy 2013 SciRes JBBS
47
mia during periodic breathing in S1 + S2 of NREM sleep and in REM sleep
This study did not find abnormal reductions in the R-R interval during the awakening period (W) during sleep S1 + S2 S3 + S4 and REM sleep between 30 and 41 h of acclimatization at 3480 m in these well-trained moun- tain marathon runners
The HRV data observed at altitude suggest that the runners possess an intrinsic high parasympathetic tone that at high altitude promptly compensates the physio- logical increase in sympathetic tone due to a periodic significant decrease in peripheral oxygen saturation dur- ing sleep
Not in group average but in several individual runners we found a significant reduction in the LF component at high altitude which may be due to the rhythmic increase of sympathetic discharge of the central brain stem center
In comparison to the average calculated at low altitude we also found a significant decrease in the average of the power of HF during S3 + S4 of NREM sleep at 3480 m This significant reduction probably indicates a decrease in the vagal parasympathetic components of the brain- stem generator
The study demonstrates that cardiovascular modifi- cations during sleep and after 30 - 41 h of acclimatization at high altitude can occur even in mountain marathoners who have benefited from 20 years of training at low and high altitude Physicians should therefore take the results of HRV analysis into account to improve the training and performance particularly at altitude
7 Acknowledgements
Thanks are due to K Britsch for reading the manuscript We thank the FILA Sky Marathon for economical sup- port from 1998 up to 2003
REFERENCES [1] Task Force of the European Society of Cardiology and
North America Society of Pacing Electrophysiology ldquoHeart Rate Variability Standard of Measurement Phy- siological Interpretation and Clinical Userdquo European Heart Journal Vol 17 1996 pp 354-381 doi101093oxfordjournalseurheartja014868
[2] P A Lanfranchi R Colombo G Cremona P Baderna L Spagnolati G Mazzuero P Wagner L Perini H Wagner C Cavallaro and P Giannuzzi ldquoAutonomic Car- diovascular Regulation in Subjects with Acute Mountain Sicknessrdquo American Physiology Heart Circulation Physi- ology Vol 289 No 6 2005 pp H2364-H2372 doi101152ajpheart000042005
[3] M Ako K Tokuhiro S Uchida S Miyazaky K Nishi- hara J Mukai K Hirao J Ako and Y Okubo ldquoCorrela- tion between Electrophysiography and Heart Rate Vari- ability during Sleeprdquo Psychiatry and Clinical Neurosci-
ence Vol 57 No 1 2003 pp 59-65 doi101046j1440-1819200301080x
[4] G Banfi M Marinelli G S Roi A Colombini M Pon- tillo M Giacometti and S Wade ldquoGrowth Hormone and Insulin-Like Growth Factor I in Athletes Performing a Marathon at 4000 m of Altituderdquo Growth Regulation Vol 4 1994 pp 82-86
[5] M Marinelli G S Roi M Giacometti P Bonini and G Banfi ldquoCortisol Testosterone and Free Testosterone in Athletes Performing a Marathon at 4000 m of Altituderdquo Hormon Research Vol 41 No 5-6 1994 pp 225-229 doi101159000183929
[6] G Banfi M Marinelli G S Roi and M Giacometti ldquoPlatelet Indices in Athletes Performing a Race in Alti- tude Environmentrdquo Journal of Clinical Laboratory Ana- lysis Vol 9 No 1 1995 pp 34-36 doi101002jcla1860090106
[7] G Banfi M Marinelli P Bonini I Gritti and G S Roi ldquoPepsinogens and Gastrointestinal Symptoms in Moun- tain Marathon Runnersrdquo International Journal Sports Me- dicine Vol 17 No 8 1996 pp 554-558 doi101055s-2007-972894
[8] G Banfi M Pontillo M Marinelli A Dolci and G S Roi ldquoThyrotropin and Free Thyroid Hormones in Ath- letes during and after Ultra Endurance Sport Perform- ancesrdquo Journal Clinical of Ligand Assay Vol 21 No 3 1998 pp 331-334
[9] G S Roi M Giacometti and S P von Duvillard ldquoMara- thons in Altituderdquo Medicine amp Science in Sports amp Exer- cise Vol 31 No 5 1999 pp 723-728 doi10109700005768-199905000-00016
[10] G Banfi and A Dolci ldquoPreanalytical Phase of Sport Bio- chemistry and Haematologyrdquo The Journal of Sports Me- dicine and Physical Fitness Vol 43 No 2 2003 pp 223-230
[11] G Pelamatti M Pascotto and C Semenza ldquoVerbal Free Recall in High Altitude Proper Names vs Common Namesrdquo Cortex Vol 39 No 1 2003 pp 97-103 doi101016S0010-9452(08)70077-7
[12] G Fragasso A Palloshi S Roi E Rossetti G Monaco A Dolci A Margonato and S Chierchia ldquoTransient Left Ventricular Diastolic Dysfunction Following Strenuous Exerciserdquo Sport Science Health Vol 1 No 1 2004 pp 31-35 doi101007s11332-004-0007-7
[13] I Gritti M Martignoni R Calcaterra and G S Roi ldquoElectroencephalographic Changes after a Marathon at 4300 m of Altituderdquo Journal of Behavioral and Brain Science Vol 2 No 3 2012 pp 380-386 doi104236jbbs201223043
[14] H Otzenberger C Simon C Gronfier and G Branden- berger ldquoTemporal Relationship between Dynamic Heart Rate Variability and Electroencephalographic Activity during Sleep in Manrdquo Neuroscience Letters Vol 229 No 3 1997 pp 173-176 doi101016S0304-3940(97)00448-5
[15] J H Coote ldquoMedicine and Mechanisms in Altitude Sick- ness Recommendationsrdquo Sports Medicine Vol 20 No 3 1995 pp 148-159
I GRITTI ET AL
Copyright copy 2013 SciRes JBBS
48
doi10216500007256-199520030-00003
[16] M A Conney R W van Arts L A A Kolleacutee J C W Hopman G B A Stoelinga P Herman and H P van Geijn ldquoHeart Rate Variabilityrdquo Annals of Internal Medi- cine Vol 118 No 6 1993 pp 436-447
[17] A Rechtschaffen and A Kales ldquoA Manual of Standard- ized Terminology Techniques and Scoring System for Sleep Stages of Human Subjectsrdquo BISBRI UCLA Los Angeles 1968
[18] F R Calaresu A A Faiers and G J Mogenson ldquoCentral Neuronal Regulation of the Heart and Blood Vessels in Mammalsrdquo Progress Neurobiology Vol 5 No 1 1975 pp 1-35 doi1010160301-0082(75)90006-4
[19] H Scholz ldquoAdaptational Responses to Hypoxiardquo Ameri- can Journal of Physiology and Regulatory Integrative Comparative Physiology Vol 282 No 6 2002 pp R1541-R1543
[20] J Cornolo J V Brugniaux J L Marcarlupu C Privat F Leon-Velarde and J P Richalet ldquoAutonomic Adaptations in Andean-Trained Participants to 4220 m Altitude Mara- thonrdquo Medicine and Science in Sports and Exercise Vol 37 No 12 2005 pp 2148-2153 doi10124901mss00001799011928085
[21] D M Sacknoff G W Gleim N Stachenfeld and N L Complan ldquoEffect of Athletic Training on Heart Variabil-
ityrdquo American Heart Journal Vol 127 No 5 1994 pp 1275-1278 doi1010160002-8703(94)90046-9
[22] L Bernardi C Passino G Spadaccini A Calciati R Robergs R Green E Martignoni I Anand and O Ap- penzeller ldquoCardiovascular Autonomic Modulation and Activity of Carotid Baroreceptors at Altituderdquo Clinical Science Vol 95 1998 pp 565-573 doi101042CS19980046
[23] G Vandewalle B Middleton S W R Rajaratnam B M Stone B Thorleifsdottir J Aredent and D J Dijk ldquoRo- bust Circadian Rhythm in Heart Rate and Its Variability Influence of Melatonin and Photoperiodrdquo Journal of Sleep Research Vol 16 No 2 2007 pp 148-150 doi101111j1365-2869200700581x
[24] C Murrell L Wilson J D Cotter S Lucas S Ogoh G Keith and N Ainslie ldquoAlteration in Autonomic Function and Cerebral Hemodynamics to Orthostatic Challenge Fol- lowing a Mountain Marathonrdquo Journal Applied Physiol- ogy Vol 103 No 1 2007 pp 88-96 doi101152japplphysiol013962006
[25] S Saito K Tanobe M Yamada and F Nishihara ldquoRela- tionship between Arterial Oxygen Saturation and Heart Rate Variability at High Altitudesrdquo American Journal of Emergency Medicine Vol 23 No 1 2005 pp 8-12 doi101016jajem200409023

I GRITTI ET AL
Copyright copy 2013 SciRes JBBS
29
23 Statistical Analysis
The results are expressed as the mean plusmn standard devia- tion (SD) or standard error mean (SEM) Probabilities lower than P lt 005 were accepted as significant ANOVA and post hoc tests were also performed Simple linear re- gression analysis between the (SpaO2 PCO2) (personal observations) and the ECG parameters was also per- formed using the Stat-View program
3 Results
None of the five subjects ever experienced AMS during the present study There were no differences in the time of evaluation of the subjects During sleep the SpaO2 and PCO2 at high altitude was significantly lower than that recorded at sea level (average plusmnSD SpaO2 80 plusmn 364 at 3480 m vs 956 plusmn 085 at 122 m P lt 005 PCO2 2825 plusmn 233 at 3480 m vs 4121 plusmn 338 at 122 m)
31 R-R Intervals (ms)
311 Sea Level (122 m) At 122 m the averages of the recorded R-R intervals were similar between all sleep stages and ranged from 1223 ms during the awakening period during sleep (W) 1300 ms during S1 + S2 and 1262 ms during S3 + S4 of NREM sleep to 1272 ms during REM sleep (Table 1) The averages of the R-R intervals recorded at 122 m during the nocturnal sleep-wake cycle suggested a pre- valence of vagal tone during all four sleep stages and in all five subjects
312 High Altitude (3480 m) At 3480 m the averages of the R-R intervals recorded during sleep ranged from 935 ms during W 1054 ms during S1 + S2 and 993 ms during S3 + S4 of NREM sleep to 990 ms during REM sleep
The averages of the R-R intervals recorded at altitude during the awakening period during sleep (W 935 plusmn 88) were significantly shorter than those recorded during S1 + S2 (1054 plusmn 73 P lt 005) (Table 1) The averages of the R-R intervals recorded during sleep suggested an increase in sympathetic tone during W S3 + S4 NREM sleep and REM sleep and a persistent significant in- crease in vagal tone during the light phases of NREM sleep
313 Sea Level (122 m) and High Altitude (3480 m) Changes in ECG with a reduction in the R-R intervals (ms) recorded during sleep became evident between 30 and 41 h of acclimatization at 3480 m compared to mea- surements taken at 122 m during sleep signs of sinus arrhythmia during periodic breathing during S1 + S2 of
NREM sleep and during REM sleep were evident (Ta- ble 1) In all five mountain marathon runners the aver- ages of the R-R intervals during W S1 + S2 and S3 + S4 of NREM sleep and REM sleep were significantly shor- ter at altitude than those recorded at sea level (P lt 001 - P lt 0001)
The averages of the R-R intervals during W (935 plusmn 88) S1 + S2 (1054 plusmn 73) and S3 + S4 (993 plusmn 55) of NREM sleep and REM sleep (990 plusmn 68) were significantly shorter at altitude than those recorded at sea level [(W 1223 plusmn 102 P lt 0001) (S1 + S2 1300 plusmn 69 P lt 0001) (S3 + S4 1262 plusmn 65 P lt 0001) (REM 1272 plusmn 77 P lt 0001)] The averages of the R-R intervals suggested a prevalence of sympathetic tone during all sleep stages at altitude and a prevalence of vagal tone during sleep at sea level
Simple regression analysis between the average SpaO2 during sleep at low and at high altitudes was significantly correlated (DF19 R-squared 0477 coefficient 62358 F-test731 P = 00269 t = 2704) with the average changes in R-R intervals
32 Total Power of Very Low Frequency [(VLF ms2) (lt004 Hz)] vs Thermoregulation-Related HRV
321 Sea Level (122 m) At 122 m the averages of VLF were 22455 ms2 during W 10217 ms2 during S1 + S2 3977 ms2 during S3 + S4 and 17016 ms2 during REM sleep The average VLF analyzed in 190 30-second epochs during the awakening period during sleep (W 22455 plusmn 17267) was signifi- cantly longer than the average VLF analyzed in 226 30-second signal epochs during S3 + S4 of NREM sleep (3977 plusmn 3531 P lt 00046) (Table 2) The average VLF analyzed in 226 30-second epochs during S3 + S4 of NREM sleep (3977 plusmn 3531) was significantly shorter than that analyzed in 175 30-second epochs during REM sleep (17016 plusmn 13612 P lt 0009)
These data collected at 122 m above sea level indicate that during the deepening of synchronized sleep the ther- moregulation-related component (VLF) of HRV decreased with an increase in vagal tone The averages of VLF dur- ing REM sleep increased approaching the average re- corded during W thus suggesting a high level of sympa- thetic tone during both stages (W and REM)
322 High Altitude (3480 m) At 3480 m the averages of VLF were 17539 ms2 during W 8452 ms2 during S1 + S2 of NREM sleep 3179 ms2 during S3 + S4 of NREM sleep and 15765 ms2 during REM sleep
The average VLF recorded in 271 30-second epochs
I GRITTI ET AL
Copyright copy 2013 SciRes JBBS
30
Table 1 Averages of the R-R intervals (ms) analysed in 5 altitude marathon runners recorded in 30-second physiologically defined number of signal epochs according to the standard criteria developed by Rechtschaffen and Kales (1968) during the waking periods during sleep (W) stages S1 + S2 and S3 + S4 of NREM sleep and REM sleep at 122 m and after 30 - 41 h of acclimatisation at 3480 m(1)
Stages Subjects 122 m 3480 m Epochs Epochs
Awakening during sleep N Mean SD N Mean SD Delta P value CS 7 1212 56 35 1007 72 minus205 00001 MR 3 1051 76 3 817 37 minus234 00087 GM 13 1362 81 12 1061 203 minus301 00001 DC 140 1026 73 157 779 36 minus247 00001 SS 27 1463 224 64 1011 93 minus452 00001 No of epochs 190 No of subjects Mean SEM No of subjects Mean SEM Delta subjects subjects Average 5 1223 102 5 935 88 minus278 0001
S1 + S2 Epochs Epochs N Mean SD N Mean SD Delta P value CS 45 1281 60 34 1123 67 minus158 00001 MR 58 1130 55 52 878 41 minus252 00001 GM 53 1497 71 54 1236 86 minus261 00001 DC 302 1096 43 322 835 28 minus261 00001 SS 200 1494 115 237 1197 145 minus297 00001 No of epochs 658 699 No of subjects Mean SEM No of subjects Mean SEM Delta subjects subjects Average 5 1300 69 5 1054 73 minus246 00001
S3 + S4 Epochs Epochs N Mean SD N Mean SD Delta P value CS 16 1277 48 9 1054 29 minus223 00001 MR 11 1121 42 6 833 8 minus288 00001 GM 9 1435 113 7 1165 112 minus270 00003 DC 98 1065 55 25 846 20 minus219 00001 SS 92 1410 65 59 1068 106 minus342 00001 No of epochs 226 106 No of subjects Mean SEM No of subjects Mean SEM Delta subjects subjects Average 5 1262 65 5 993 55 minus268 0001
REM Epochs Epochs N Mean SD N Mean SD Delta P value CS 8 1276 73 5 1128 120 minus147 00178 MR 23 1085 69 13 813 25 minus272 00001 GM 10 1450 60 13 1106 88 minus344 00001 DC 62 1062 56 30 832 40 minus231 00001 SS 72 1485 125 52 1069 67 minus416 00001 No of epochs 175 No of subjects Mean SEM No of subjects Mean SEM Delta subjects subjects Average 5 1272 77 5 990 68 minus282 0001
Footnotes to Table 1 (1)One-way ANOVA tracts analysed in the five mountain runners the averages of the R-R intervals (ms) measured during the W S1 + S2 S3 + S4 and REM sleep states were significantly different (DF 73239 F-tests = 4007 P = 0003) The post-hoc comparison with Fisher analysis showed a significant difference (P lt 005) between the average of the R-R intervals recorded during W at 122 m and that at 3480 m and a significant difference between the average of the R-R intervals recorded during stages S3 + S4 at 3480 m and during REM sleep at 3480 m (P lt 005) The average of the R-R intervals re-corded during W at 3480 m differed significantly from that during stages S1 + S2 at 122 m (P lt 005) Post-hoc comparison with Fisher analysis showed that the average of the R-R intervals recorded during stages S3 + S4 at 122 m differed significantly from that during REM sleep at 122 m (P lt 005) The average of the R-R intervals recorded during stages S1 + S2 at 122 m differed significantly from that during stages S1 + S2 at 3480 m (P lt 005) Post-hoc comparison of the average of the R-R intervals recorded during stages S1 + S2 at 122 m differed significantly from that during S3 + S4 and REM sleep at 3480 m (P lt 005) Fisher analysis demonstrated that the average of the R-R intervals recorded during stages S3 + S4 at 3480 m differed significantly from that during REM sleep at 122 m (P lt 005) There was a significant difference between the R-R intervals recorded during REM sleep at 122 m and those during REM sleep at 3480 m (P lt 005) Post-hoc comparison with Studentrsquos t-test showed that the average of the power of the R-R interval tract analysed in 271 30-second epochs during the waking period during sleep (W) at 3480 m was significantly lower (P lt 005) than the average measured in 699 30-second epochs during stages S1 + S2 of NREM sleep at 3480 m in all 5 subjects
I GRITTI ET AL
Copyright copy 2013 SciRes JBBS
31
Table 2 Averages of the total power of very low frequency (VLF ms2) (lt004 Hz) (thermoregulation-related HRV) recorded in 30-second signal epochs physiologically defined according to standard criteria developed by Rechtschaffen and Kales (1968) during waking periods during sleep (W) stages S1 + S2 and S3 + S4 of NREM and REM sleep at 122 m and after 30 - 41 h of acclimatisation at 3480 m in the five subjects(1)
Stages Subjects 122 m 3480 m Epochs Epochs
Awakening during sleep N Mean SD N Mean SD Delta P value CS 7 26606 22461 35 21496 16228 minus5110 ns MR 3 38280 9561 3 22860 6308 minus1542 ns GM 13 17791 7300 12 18278 21065 487 ns DC 140 11102 21447 157 7610 10946 minus3492 ns SS 27 18496 25566 64 17749 17617 minus747 ns No of epochs 190 271 No of subjects Mean SEM No of subjects Mean SEM Delta subjects subjects Average 5 22455 17267 5 17593 14433 minus4862 ns
S1 + S2 Epochs Epochs N Mean SD N Mean SD Delta P value CS 45 20578 15536 34 17339 12982 minus3239 ns MR 58 8885 7286 52 8784 9380 minus101 ns GM 53 10545 9710 54 5979 6471 minus4565 0005 DC 302 2135 2225 322 2348 3088 213 ns SS 200 8943 16991 237 7811 8712 minus1132 ns No of epochs 658 699 No of subjects Mean SEM No of subjects Mean SEM Delta subjects subjects Average 5 10217 10350 5 8452 8127 minus1765 ns
S3 + S4 Epochs Epochs N Mean SD N Mean SD Delta P value CS 16 5264 3352 9 4352 4066 minus912 ns MR 11 4263 3839 6 1943 380 minus2320 ns GM 9 6504 5327 7 4636 5916 minus1868 ns DC 98 1644 1887 25 2233 4700 589 ns SS 92 2209 3251 59 2730 3263 521 ns No of epochs 226 No of subjects Mean SEM No of subjects Mean SEM Delta subjects subjects Average 5 3977 3531 5 3179 3665 minus798 ns
REM Epochs Epochs N Mean SD N Mean SD Delta P value CS 8 29739 13936 5 21703 10645 minus8036 ns MR 23 20548 15408 13 17039 8214 minus3509 ns GM 10 13933 5651 13 19185 8120 5252 ns DC 62 12885 23483 30 13262 18141 337 ns SS 72 7976 9580 52 7637 7406 minus339 ns No of epochs 175 113 No of subjects Mean SEM No of subjects Mean SEM Delta subjects subjects Average 5 17016 13612 5 15765 10505 minus1251 ns
Footnotes to Table 2 (1)One-way ANOVA showed that in the five subjects the averages of the total power of very low frequency (VLF ms2) (lt004 Hz) (ther-moregulation-related HRV) differed significantly between stages (DF = 73239 F = 515 P lt 00002) Post-hoc comparison with Fisher analysis of the mean revealed a significant difference between the VLF values recorded during W at 122 m and those during stages S1 + S2 at 122 m (P lt 005) and a significant difference between the VLF values recorded during stages S1 + S2 at 3480 m and those during stages S3 + S4 at 122 m and S3 + S4 at 3480 m There was also a significant difference between the mean of the VLF recorded during stages S3 + S4 at 122 m and those during REM sleep at 122 m and at 3480 m (P lt 005) There was a significant difference between the average of the VLF recorded during stages S3 + S4 at 3480 m and those during REM sleep at 122 m and at 3480 m (P lt 005) Post-hoc comparison with StudentrsquoS t-test showed that the power in the VLF range of the R-R intervals measured in 190 30-second epochs dur-ing the waking period during sleep (W) at 122 m was significantly higher (P lt 00046) than that measured in 226 30-second signal epochs during stages S3 + S4 of NREM sleep at 122 m in all five subjects Post-hoc comparison with Studentrsquos t-test of the mean of the average of the power in the VLF range measured in 271 30-second epochs during the awakening period during sleep (W) at 3480 m was significantly higher (P lt 00007) than that measured in 106 30-second signal epochs during stages S3+S4 of NREM sleep at 3480 m in all five subjects Post-hoc comparison with Studentrsquos t-test of the mean of the average of the power in the VLF range measured in 226 30-second epochs during stages S3 + S4 of NREM sleep at 122 m was significantly lower (P lt 0009) than that meas- ured in 175 30-second epochs during REM sleep at 122 m in all five subjects Post-hoc comparison with Studentrsquos t-test of the mean of the average of the power in the VLF range measured in 106 30-second epochs during stages S3 + S4 of NREM sleep at 3480 m was significantly lower (P lt 0001) than that measured in 113 30-second epochs during REM sleep at 3480 m in all five subjects
I GRITTI ET AL
Copyright copy 2013 SciRes JBBS
32
during the awakening period during sleep [(W) (17593 plusmn 14433)] was significantly longer than the average VLF recorded in 106 30-second signal epochs during S3 + S4 of NREM sleep (3179 plusmn 3665 P lt 00007) (Table 2) The average VLF in 106 30-second epochs during S3 + S4 of NREM sleep (3179 plusmn 3665) was significantly shor- ter than that analyzed in 113 30-second epochs of REM sleep (15765 plusmn 10505 P lt 005)
Overall the averaged data recorded during sleep at 3480 m demonstrate that during the deepening of syn- chronized sleep the thermoregulation-related component (VLF) of HRV decreased with a physiological increase in vagal tone During REM sleep the thermoregulation- related component of HRV approached that recorded during the awakening period during sleep (W) indicating an increase in the sympathetic tone
323 Sea Level (122 m) and High Altitude (3480 m) The average of the total power of very low frequency (VLF ms2) recorded during S1 + S2 of NREM sleep (5979 plusmn 6471) was significantly shorter at high altitude than that recorded sea level (10545 plusmn 9710 P lt 0005) in only 15 (GM) mountain marathon runners (Table 2)
33 Total Power of Low Frequency [(LF ms2) (004 - 015 Hz)] Range The LF Appears to Have a Widespread Neuronal Genesis and Is Considered as a Marker of Sympathetic Modulation or a Marker of Both Sympathetic and Vagal Modulation
331 Sea Level (122 m) At 122 m the averages of LF were 7997 ms2 during W 7400 ms2 during S1 + S2 4881 ms2 during S3 + S4 and 8579 ms2 during REM sleep The changes in the average total power in LF were significantly shorter during S3 + S4 than those observed during REM sleep (4881 plusmn 2041 vs 8579 plusmn 3473 P lt 002) (Table 3) These data suggest that the average values of LF a marker of sympathetic modulation decreased during the deepening phases of NREM sleep During REM sleep the average values of LF significantly increased approaching a value similar to that observed during W
332 High Altitude (3480 m) At 3480 m the averages of LF were 6272 ms2 during W 7516 ms2 during S1 + S2 3805 ms2 during S3 + S4 and 5715 ms2 during REM sleep (Table 3) The results dem- onstrate that the average values of LF during sleep at altitude did not change significantly between the differ- ent sleep stages (Table 3)
333 Sea Level (122 m) and High Altitude (3480 m) The averages of total power of low frequency (LF ms2)
recorded at high altitude during W were significantly shorter than those recorded at sea level in 35 subjects [(CS 3163 plusmn 1400 at 3480 m vs 5148 plusmn 3163 at 122 m P lt 00074) (GM 6157 plusmn 2271 at 3480 m vs 9656 plusmn 2978 at 122 m P lt 00033) (DC 2774 plusmn 2056 at 3480 m vs 5083 plusmn 4655 at 122 m P lt 00001)] (Table 3) The aver- age LF recorded during S1 + S2 was significantly longer at altitude than that recorded at sea level in 15 subjects (SS 17947 plusmn 12895 at 3480 m vs 10155 plusmn 6434 at 122 m P lt 00001) the LF was significantly shorter in 25 subjects [(CS 3539 plusmn 1734 at 3480 m vs 5946 plusmn 2294 at 122 m P lt 00001) (MR 6059 plusmn 1641 at 3480 m vs 10118 plusmn 2699 at 122 m P lt 00001)] the average LF recorded during S3 + S4 was significantly shorter at alti- tude than that recorded at 122 m in 25 [(CS 2276 plusmn 2427 at 3480 m vs 3760 plusmn 1098 at 122 m P lt 00455) (MR 3917 plusmn 592 at 3480 m vs 8344 plusmn 222 at 122 m P lt 00003)] the average LF recorded during REM sleep was significantly shorter at altitude than that recorded at sea level in 35 subjects [(MR 5200 plusmn 1513 at 3480 m vs 10159 plusmn 2790 at 122 m P lt 00001) (DC 3702 plusmn 1955 at 3480 m vs 6727 plusmn 4144 at 122 m P lt 00003) (SS 5 140 plusmn 4402 at 3480 m vs 11509 plusmn 6775 at 122 m P lt 00001)] These data demonstrate great variability in the sympathetic LF component of HRV recorded at low and high altitudes in the five mountain marathon runners
34 Low-Frequency in Normalized Units [(LFRRNU) (004 - 015 Hz)] Range LFRRNU Is Considered as a Marker of Sympathetic Modulation
341 Sea Level (122 m) In all 5 subjects the average LFRRNU recorded in 190 30-second epochs during the awakening period during sleep (W 7341 plusmn 1015) differed significantly from that recorded in 226 30-second epochs during S3 + S4 of NREM sleep (6476 plusmn 1145 P lt 003) In all five moun- tain marathon runners the average LFRRNU during REM sleep was significantly longer (7432 plusmn 1017) than that observed during S3 + S4 (6476 plusmn 1145 P lt 00192) (Table 4) These data indicate that the marker of sympa- thetic modulation (LFRRNU) decreased during deepening of sleep During REM sleep the average value of LFRRNU was similar to that recorded during the awakening period during sleep (W) suggesting that both desynchronized states were supported by an increase in sympathetic tone
342 High Altitude (3480 m) At 3480 m the average LFRRNU values recorded during all four stages of sleep were similar and ranged from 7577 during W 7625 during S1 + S2 6662 during S3 + S4 to 8097 during REM sleep (Table 4)
I GRITTI ET AL
Copyright copy 2013 SciRes JBBS
33
Table 3 Averages of the total power in the low frequency (LF ms2) (004 - 015 Hz) range appear to have a widespread neu-ronal genesis and are considered as a marker of sympathetic modulation or a marker of both sympathetic and vagal modula-tion The LF average was calculated in a physiologically defined number of 30-second signal epochs defined according to the standard criteria developed by Rechtschaffen and Kales (1968) recorded during the waking period during sleep (W) stages S1 + S2 and S3 + S4 of NREM and REM sleep at 122 m and after 30 - 41 h of acclimatisation at 3480 m in the five subjects(1)
Stages Subjects 122 m 3480 m
Epochs Epochs
Awakening during sleep N Mean SD N Mean SD Delta P value
CS 7 5148 2849 35 3163 1400 minus1985 00074
MR 3 10477 3742 3 6780 428 minus3697 ns
GM 13 9656 2978 12 6157 2271 minus3499 00033
DC 140 5083 4655 157 2774 2056 minus2309 00001
SS 27 9619 4825 64 12485 10724 2866 ns
No of epochs 190 271
No of subjects Mean SEM No of subjects Mean SEM Delta
subjects subjects
Average 5 7997 3810 5 6272 3376 minus1725 ns
S1 + S2 Epochs Epochs
N Mean SD N Mean SD Delta P value
CS 45 5946 2294 34 3539 1734 minus2407 00001
MR 58 10118 2699 52 6059 1641 minus4059 00001
GM 53 7692 2871 54 6998 2317 minus694 ns
DC 302 3090 1733 322 3036 1593 minus54 ns
SS 200 10155 6434 237 17947 12895 7792 00001
No of epochs 658 699
No of subjects Mean SEM No of subjects Mean SEM Delta
subjects subjects
Average 5 7400 3206 5 7516 4036 116 ns
S3 + S4 Epochs Epochs
N Mean SD N Mean SD Delta P value
CS 16 3760 1098 9 2276 2427 minus1484 00455
MR 11 8344 2222 6 3917 592 minus4427 00003
GM 9 4352 1275 7 4274 1504 minus78 ns
DC 98 2626 2066 25 2315 1056 minus311 ns
SS 92 5324 6544 59 6245 6031 921 ns
No of epochs 226 106
No of subjects Mean SEM No of subjects Mean SEM Delta
subjects subjects
Average 5 4881 2041 5 3805 2322 minus1076 ns
REM Epochs Epochs
N Mean SD N Mean SD Delta P value
CS 8 6497 1748 5 6105 2640 minus392 ns
MR 23 10159 2790 13 5200 1513 minus4959 00001
GM 10 8005 1910 13 8430 2376 425 ns
DC 62 6727 4144 30 3702 1995 minus3025 00003
SS 72 11509 6775 52 5140 4402 minus6369 00001
No of epochs 175
No of subjects Mean SEM No of subjects Mean SEM Delta
subjects subjects
Average 5 8579 3473 5 5715 2585 minus2864 ns
Footnotes to Table 3 (1)One-way ANOVA revealed no significant changes in the averages of the total power in the low frequency (LF ms2) (004 - 015 Hz) range (DF 73239 F test 13 P = 02819) Post-hoc comparison with Studentrsquos t-test of the average LF value recorded in 175 30-second epochs during REM sleep at sea level was significantly higher (P lt 002) than that recorded in 226 30-second epochs during stages S3 + S4 of NREM sleep at 122 m in all five subjects
I GRITTI ET AL
Copyright copy 2013 SciRes JBBS
34
Table 4 Averages of the total power in the low frequency (004 - 015 Hz) range in normalized units (LF-RR-NU) which is considered as a marker of sympathetic modulation measured in a physiologically defined number of 30-second signal epochs defined according to the standard criteria developed by Rechtschaffen and Kales (1968) recorded during the waking period during sleep (W) stages S1 + S2 and S3 + S4 of NREM and REM sleep at 122 m and after 30 - 41 h of acclimatisation at 3480 m in the five subjects(1)
Stages Subjects 122 m 3480 m Epochs Epochs
Awakening during sleep N Mean SD N Mean SD Delta P value CS 7 7306 625 35 7673 1005 367 ns MR 3 8459 707 3 8466 594 007 ns GM 13 8332 509 12 6003 1826 minus2329 00001 DC 140 6801 1923 157 7499 1752 698 0001 SS 27 5806 1316 64 8243 1395 2437 00001 190 271 No of subjects Mean SEM No of subjects Mean SEM Delta subjects subjects Average 5 7341 1015 5 7577 1314 236 ns
S1 + S2 Epochs Epochs N Mean SD N Mean SD Delta P value CS 45 6677 1570 34 6503 1511 minus173 ns MR 58 7641 945 52 8071 677 430 001 GM 53 7855 791 54 7444 950 minus411 00168 DC 302 5586 1623 322 8061 995 2475 00001 SS 200 5767 1792 237 8047 1271 2280 00001 No of epochs 658 No of subjects Mean SEM No of subjects Mean SEM Delta subjects subjects Average 5 6705 1344 5 7625 1081 minus92 ns
S3 + S4 Epochs Epochs N Mean SD N Mean SD Delta P value CS 16 4727 1123 9 4327 2723 minus385 ns MR 11 6373 1298 6 7390 793 1610 0015 GM 9 7019 1008 7 5953 1140 minus1066 ns DC 98 4584 1691 25 7440 1130 2856 00001 SS 92 3952 1607 59 7593 895 3641 00001 No of epochs 226 106 No of subjects Mean SEM No of subjects Mean SEM Delta subjects subjects Average 5 6476 1145 5 6662 1336 186 ns
REM Epochs Epochs N Mean SD N Mean SD Delta P value CS 8 6797 794 5 7953 587 1156 001748 MR 23 8086 593 13 8900 382 814 00001 GM 10 8383 858 13 7909 798 minus474 ns DC 62 7774 1239 30 8754 638 980 00001 SS 72 6118 1603 52 6967 1722 849 00056 No of epochs 175 113 No of subjects Mean SEM No of subjects Mean SEM Delta subjects subjects Average 5 7432 1017 5 8097 825 665 ns
Footnotes to Table 4 (1)One-way ANOVA revealed significant differences in the averages of the total power in low frequency (004 - 015 Hz) in normalized units (LFRRNU) (DF73239 F = 3229 P lt 00105) Post-hoc analysis with Fisher and Scheffeacute tests revealed that the LF-RR-NU component of the R-R intervals during the W state at 122 m differed significantly from than that during stages S3 + S4 (P = 005) The LF-RR-NU average values during the W state at 3480 m differed significantly from that during stages S3 + S4 (P lt 005) The LF-RR-NU average during stages S1 + S2 at 122 m differed significantly from that during REM sleep at 3480 m (P lt 005) The LF-RR-NU average during stages S1 + S2 recorded at 3480 m differed significantly from that during stages S3 + S4 The LF-RR-NU average during stages S3 + S4 at 122 m differed significantly from that during REM sleep at 122 m (P lt 005) The LF-RR-NU component of the R-R intervals during stages S3 + S4 at 122 m differed significantly from that during REM sleep at 3480 m (P lt 005) The LF-RR-NU average during stages S3 + S4 at 3480 m differed from that during REM sleep at 3480 m (P lt 005) in all five subjects Comparison with Studentrsquos t-test showed a significant difference between the average of the LF-RR-NU recorded in 190 30-second epochs during the waking period during sleep (W) at 122 m (P lt 003) and that recorded in 226 30-second epochs during stages S3 + S4 of NREM sleep at 122 m in all five subjects Comparison with Studentrsquos t-test showed a significant difference (P lt 00192) between the average of the LF-RR-NU in stages S3 + S4 of NREM sleep and that during REM sleep at 122 m in all five subjects
I GRITTI ET AL
Copyright copy 2013 SciRes JBBS
35
343 Sea Level (122 m) and High Altitude (3480 m) The average LFRRNU (Table 4) recorded during W at al- titude was significantly shorter than that recorded at sea level in 15 subjects (GM 6003 plusmn 1826 at 3480 m vs 8332 plusmn 509 at 122 m P lt 00001) and significantly longer in 25 subjects [(DC 7499 plusmn 1752 at 3480 m vs 6801 plusmn 1923 at 122 m P lt 0001) (SS 8243 plusmn 1395 at 3480 m vs 5806 plusmn 1316 at 122 m P lt 00001)]
The average LFRRNU recorded during S1 + S2 at high altitude was significantly longer than that recorded at sea level in 35 subjects [(MR 8071 plusmn 677 at 3480 m vs 7641 plusmn 945 at 122 m P lt 001) (DC 8061 plusmn 995 at 3480 m vs 5586 plusmn 1623 at 122 m P lt 00001) (SS 8047 plusmn 1271 at 3480 m vs 5767 plusmn 1792 at 122 m P lt 00001)] while in 15 the average LFRRNU was signifi- cantly shorter (GM 5953 plusmn 1140 at 3480 m vs 7019 plusmn 1008 at 122 m P lt 00168) in S3 + S4 The average LFRRNU recorded during S3 + S4 at high altitude was significantly longer than that recorded at 122 m in 35 subjects [(MR 7390 plusmn 793 at 3480 m vs 6373 plusmn 1298 at 122 m P lt 00150) (DC 7440 plusmn 1130 at 3480 m vs 4584 plusmn 1691 at 122 m P lt 00001) (SS 7593 plusmn 895 at 3480 m vs 3952 plusmn 1607 at 122 m P lt 00001)] The average LFRRNU recorded during REM sleep at high altitude was significantly longer than that recorded at 122 m in 45 subjects [(CS 7953 plusmn 587 at 3480 m vs 6797 plusmn 794 at 122 m P lt 001748) (MR 8900 plusmn 382 at 3480 m vs 8086 plusmn 593 at 122 m P lt 00001) (DC 8754 plusmn 638 at 3480 m vs 7774 plusmn 1239 at 122 m P lt 00001) (SS 6967 plusmn 1722 at 3480 m vs 6118 plusmn 1603 at 122 m P lt 00056)] These data show a great variabil- ity between mountain marathon runners in LFRRNU when the data set recorded at 122 m is compared with that re- corded at 3480 m Analysis of the data recorded in indi- vidual mountain marathon runners showed an increase in the average LFRRNU at 3480 m demonstrating an in- crease in the marker for sympathetic modulation
35 Total Power of High Frequency [(HF ms2) (015 - 04 Hz)] Range HF Primarily Reflects Respiratory-Driven Vagal Modulation of Sinus Rhythm
351 Sea Level (122 m) No significant differences in the averages of HF were observed between W (2223 plusmn 728) S1 + S2 (2945 plusmn 1080) and S3 + S4 (3891 plusmn 1134) and REM (2499 plusmn 879) stages at low altitude (Table 5) The averages of the HF recorded during the nocturnal sleep-wake cycle at 122 m suggested a prevalence of vagal tone during S3 + S4 stages in comparison with the other sleep stages
352 High Altitude (3480 m) No significant differences in the averages of HF were
observed between W (1572 plusmn 993) S1 + S2 (1610 plusmn 631) and S3 + S4 (1480 plusmn 511) and REM (1159 plusmn 555) stages at 3480 m (Table 5) The averages of the HF recorded during the nocturnal sleep-wake cycle at 3480 m sug- gested a reduction in vagal tone throughout all sleep stages and during awakening during sleep
353 Sea Level (122 m) and High Altitude (3480 m) Compared with the values calculated at sea level there was a significant decrease in the average of total power of high frequency (HF ms2) (Table 5) recorded during W at altitude in 35 subjects [(CS 1422 plusmn 384 at 122 m vs 743 plusmn 191 at 3480 m P lt 00001) (DC 1487 plusmn 729 at 122 m vs 717 plusmn 789 at 3480 m P lt 00001) (SS 4849 plusmn 1587 at 122 m vs 1674 plusmn 1179 at 3480 m P lt 00001)] and a significant increase in 15 subjects (GM 1654 plusmn 400 at 122 m vs 3495 plusmn 2196 at 3480 m P lt 00072)
Compared with the values calculated at sea level there was a significant decrease in the average HF recorded at altitude during S1 + S2 of NREM sleep in 45 subjects [(CS 2485 plusmn 1178 at 122 m vs 1513 plusmn 443 at 3480 m P lt 00001) (MR 2892 plusmn 906 at 122 m vs 1382 plusmn 546 at 3480 m P lt 00001) (DC 2167 plusmn 778 at 122 m vs 605 plusmn 297 at 3480 m P lt 00001) (SS 5375 plusmn 1950 at 122 m vs 2640 plusmn 1385 at 3480 m P lt 00001)] Compared with the averages calculated at 122 m there was a significant decrease in the average HF recorded during S3 + S4 of NREM sleep at 3480 m in 45 subjects [(CS 3776 plusmn 982 at 122 m vs 2044 plusmn 723 at 3480 m P lt 00001) (MR 4624 plusmn 1629 at 122 m vs 975 plusmn 506 at 3480 m P lt 00001) (DC 2617 plusmn 777 at 122 m vs 684 plusmn 249 at 3480 m P lt 00001) (SS 6866 plusmn 1904 at 122 m vs 1394 plusmn 681 at 3480 m P lt 00001)] and a significant increase in 15 subjects (GM 1571 plusmn 376 at 122 m vs 2303 plusmn 396 at 3480 m P lt 00021) There was a significant decrease in the average HF recorded during REM sleep in 45 sub- jects [(CS 2425 plusmn 531 at 122 m vs 1397 plusmn 774 at 3480 m P lt 00155) (MR 2248 plusmn 680 at 122 m vs 615 plusmn 233 at 3480 m P lt 00001) (DC 1530 plusmn 708 at 122 m vs 400 plusmn 149 at 3480 m P lt 00001) (SS 4885 plusmn 1559 at 122 m vs 1671 plusmn 1147 at 3480 m P lt 00001)]
The average HF at 3480 m recorded in individual mountain marathon runners was generally lower than that recorded at 122 m suggesting a decrease in the marker of vagal tone at altitude
36 High Frequency in Normalized Units [(HFRRNU) (004 - 015 Hz)] HFRRNU Is Considered as a Marker of Vagal Modulation
361 Sea Level (122 m) In all five subjects the average of the HFRRNU analyzed
I GRITTI ET AL
Copyright copy 2013 SciRes JBBS
36
Table 5 Averages of the total power in the high frequency (HF ms2) (015 - 04 Hz) range which primarily reflects respira-tory-driven vagal modulation of sinus rhythm in a natural physiologically defined number of 30-second signal epochs ac-cording to the standard criteria developed by Rechtschaffen and Kales (1968) during the waking period during sleep (W) stages S1 + S2 and S3 + S4 of NREM and REM sleep measured at 122 m and after 30 - 41 h of acclimatisation at 3480 m in the five subjects(1)
Stages Subjects 122 m 3480 m
Epochs Epochs
Awakening during sleep N Mean SD N Mean SD Delta P value
CS 7 1422 384 35 743 191 minus679 00001
MR 3 1701 449 3 1232 612 minus469 ns
GM 13 1654 490 12 3495 2196 1841 00072
DC 140 1487 729 157 717 789 minus770 00001
SS 27 4849 1587 64 1674 1179 minus3175 00001
No of epochs 190 271
No of subjects Mean SEM No of subjects Mean SEM Delta
subjects subjects
Average 5 2223 728 5 1572 993 minus651 ns
S1 + S2 Epochs Epochs
N Mean SD N Mean SD Delta P value
CS 45 2485 1178 34 1513 443 minus972 00001
MR 58 2892 906 52 1382 546 minus1510 00001
GM 53 1807 589 54 1909 484 102 ns
DC 302 2167 778 322 605 297 minus1562 00001
SS 200 5375 1950 237 2640 1385 minus2735 00001
No of epochs 658 699
No of subjects Mean SEM No of subjects Mean SEM Delta
subjects subjects
Average 5 2945 1080 5 1610 631 1335 ns
S3 + S4 Epochs Epochs
N Mean SD N Mean SD Delta P value
CS 16 3776 982 9 2044 723 minus1732 00001
MR 11 4624 1629 6 975 506 minus3649 00001
GM 9 1571 376 7 2303 396 732 00021
DC 98 2617 777 25 684 249 minus1933 00001
SS 92 6866 1904 59 1394 681 minus5472 00001
No of epochs 226 106
No of subjects Mean SEM No of subjects Mean SEM Delta
subjects subjects
Average 5 3891 1134 5 1480 511 minus2411 004
REM Epochs Epochs
N Mean SD N Mean SD Delta P value
CS 8 2425 531 5 1397 774 minus1028 00155
MR 23 2248 680 13 615 233 minus1633 00001
GM 10 1409 918 13 1711 472 302 ns
DC 62 1530 708 30 400 149 minus1130 00001
SS 72 4885 1559 52 1671 1147 minus1147 00001
No of epochs 175 113
No of subjects Mean SEM No of subjects Mean SEM Delta
subjects subjects
Average 5 2499 879 5 1159 555 minus1340 ns
Footnotes to Table 5 (1)One-way ANOVA revealed a significant difference between stages in the averages of the total power in the high frequency (HF ms2) (015-04 Hz) range (DF = 73239 F = 2576 P = 00317) Post-hoc Fisher analysis showed significant differences between the averages of HF during W at 122 m and during stages S3 + S4 at 122 m (P lt 005) There was a significant difference between the values measured during W at 3480 m and those during stages S3 + S4 at 122 m (P lt 005) The values measured during stages S1 + S2 at 122 m differed significantly from those during REM sleep at 3480 m in all five subjects
I GRITTI ET AL
Copyright copy 2013 SciRes JBBS
37
in a natural physiologically defined number of 30-sec- ond signal epochs according to standard criteria de- veloped by Rechtschaffen and Kales (1968) during the awakening period during sleep (W 2347 plusmn 946) was significantly shorter than that observed during S3 + S4 of NREM at 122 m (5691 plusmn 3114 P lt 00327) In all five subjects the average of the HFRRNU during S3 + S4 of NREM sleep (5691 plusmn 3114) was significantly longer (P lt 001004) than that observed during REM sleep (2264 plusmn 944 P lt 001004) at 122 m (Table 6) These data sug- gest an increase in vagal modulation during the deepen- ing of slow-wave NREM sleep and a decrease in vagal modulation during the desynchronized awakening period during sleep (W) and REM sleep
362 High Altitude (3480 m) The average of the HFRRNU analyzed between W (2131 plusmn 1108) S1 + S2 (2152 plusmn 976) S3 + S4 (3111 plusmn 1281) of NREM sleep and REM sleep (1674 plusmn 699) was simi- lar (Table 6) The data suggest an increase in vagal mo- dulation during S3 + S4 of slow-wave NREM sleep and a decrease in vagal modulation during the desynchronized awakening period during sleep (W) S1 + S2 of NREM sleep and during REM sleep
363 Sea Level (122 m) and High Altitude (3480 m) The mean of the averages of the HFRRNU (Table 6) re- corded during W at altitude was significantly shorter than that recorded at sea level in 25 subjects (DC 2229 plusmn 1447 at 3480 m vs 3087 plusmn 1875 at 122 m P lt 00001) (SS 1533 plusmn 1165 at 3480 m vs 3349 plusmn 1157 at 122 m P lt 00001)] and significantly longer in 15 subjects (GM 3315 plusmn 1339 at 3480 m vs 1515 plusmn 46 at 122 m P lt 00001) The mean of the averages of the HFRRNU re- corded during S1 + S2 at altitude was significantly shor- ter than that recorded at sea level in 35 subjects (MR 1881 plusmn 671 at 3480 m vs 2317 plusmn 948 at 122 m P lt 001) (DC 1832 plusmn 943 at 3480 m vs 4357 plusmn 1623 at 122 m P lt 0001) (SS 1638 plusmn 1036 at 3480 m vs 3686 plusmn 1723 at 122 m P lt 00001) The mean of the averages of the HFRR-NU recorded during S3 + S4 at al- titude was significantly shorter than that recorded at sea level in 25 subjects [(DC 2442 plusmn 1104 at 3480 m vs 5353 plusmn 1673 at 122 m P lt 00001) (SS 2229 plusmn 830 at 3480 m vs 5554 plusmn 1578 at 122 m P lt 00001)] The mean of the averages of the HFRR-NU recorded during REM sleep at altitude was significantly shorter than that at sea level in 35 subjects [(MR 1057 plusmn 376 at 3480 m vs 1850 plusmn 582 at 122 m P lt 00001) (DC 1156 plusmn 614 at 3480 m vs 2180 plusmn 1224 at 122 m P lt 00001) (SS 2681 plusmn 1455 at 3480 m vs 3215 plusmn 1457 at 122 m P lt 004)]
37 LFHF Ratio Mirrors Sympathovagal Balance or Reflects Sympathetic Modulation
371 Sea Level (122 m) In all five subjects the average of the LFHF ratio during W at 122 m was longer (46446 plusmn 28655) than that ob- served during S3 + S4 (16733 plusmn 10847 P lt 00110) (Table 7) the average of the LFHF ratio during S3+S4 (16733 plusmn 10847) was significantly shorter than that ob- served in 175 epochs of REM sleep (44739 plusmn 21405 P lt 00113) (Table 7) The data suggest an increase of sympathetic modulation during W and REM sleep in comparison of synchronized S1 minus S4 sleep
372 High Altitude (3480 m) The average of the LFHF ratio during S3 + S4 at 3480 m (32109 plusmn 10873) was significantly lower than that ob- served during REM sleep (69132 plusmn 36806 P lt 0036835) The data suggest an increase of sympathetic modulation during REM sleep in comparison to synchro- nized S3 + S4 sleep
373 Sea Level (122 m) and High Altitude (3480 m) The average of the LFHF ratio (Table 7) during W was significantly shorter at 3480 m than at 122 m in 15 sub- jects (GM 61615 plusmn 24214 at 122 m vs 23017 plusmn 13728 at 3480 m P lt 00001) and significantly longer at 3480 m than at 122 m in 25 subjects [(DC 49300 plusmn 62275 at 122 m vs 72334 plusmn 10049 at 3480 m P lt 00235) (SS 21570 plusmn 14672 at 122 m vs 94181 plusmn 81271 at 3480 m P lt 00001)] The average LFHF ratio during S1 + S2 was significantly longer at 3480 m than at 122 m in 35 subjects [(MR 50512 plusmn 23613 at 3480 m vs 39624 plusmn 18413 at 122 m P lt 00078) (DC 61907 plusmn 43641 at 3480 m vs 17193 plusmn 13779 at 122 m P lt 00001) (SS 79224 plusmn 67405 at 3480 m vs 23667 plusmn 216997 at 122 m P lt 00001)] and significantly shorter in 15 subjects (GM 39050 plusmn 16255 at 3480 m vs 46160 plusmn 20671 at 122 m P lt 00503) The average LFHF ratio was sig- nificantly longer at high altitude than at sea level during S3 + S4 in 35 subjects [(MR 46867 plusmn 18516 at 3480 m vs 21655 plusmn 12576 at 122 m P lt 00043) (DC 37484 plusmn 17785 at 3480 m vs 12203 plusmn 14342 at 122 m P lt 00001) (SS 40205 plusmn 23448 at 3480 m vs 09542 plusmn 10418 at 122 m P lt 00001)] The average LFHF ratio was significantly longer (P lt 00102 - 00001) during REM sleep at high altitude than at sea level in 45 sub- jects [(CS 47380 plusmn 14928 at 3480 m vs 28163 plusmn 09832 at 122 m) (MR 98554 plusmn 43032 at 3480 m vs 48217 plusmn 15891 at 122 m) (DC 10520 plusmn 66211 at 3480 m vs 52563 plusmn 37020 at 122 m) (SS 41387 plusmn 39490 at 3480 m vs 27194 plusmn 20375 at 122 m)]
At 122 m and at 3480 m there was a decrease in the LFHF ratio during deepening of NREM sleep indicating
I GRITTI ET AL
Copyright copy 2013 SciRes JBBS
38
Table 6 Averages of the total power in the high frequency (004 - 015 Hz) range in normalized units (HFRRNU) which is considered as a marker of vagal modulation in a natural physiologically defined number of 30-second signal epochs ac-cording to standard criteria developed by Rechtschaffen and Kales (1968) during the waking period during sleep (W) stages S1 + S2 and S3 + S4 of NREM and REM sleep recorded at 122 m and after 30 - 41 h of acclimatisation at 3480 m in the five subjects(1)
Stages Subjects 122 m 3480 m Epochs Epochs
Awakening during sleep N Mean SD N Mean SD Delta P value CS 7 2310 610 35 2105 979 minus205 ns MR 3 1475 628 3 1500 608 025 ns GM 13 1515 460 12 3315 1339 1800 00001 DC 140 3087 1875 157 2229 1447 minus858 00001 SS 27 3349 1157 64 1533 1165 minus1816 00001 No of epochs 190 No of subjects Mean SEM No of subjects Mean SEM Delta subjects subjects Average 5 2347 946 5 2131 1108 minus211 ns
S1 + S2 Epochs Epochs N Mean SD N Mean SD Delta P value CS 45 2929 1537 34 3235 1489 minus174 ns MR 58 2317 948 52 1881 671 minus436 001 GM 53 1997 745 54 2172 739 175 ns DC 302 4357 1623 322 1832 943 minus2524 0001 SS 200 3686 1723 237 1638 1036 minus2048 00001 No of epochs 658 699 No of subjects Mean SEM No of subjects Mean SEM Delta subjects subjects Average 5 3057 1315 5 2152 976 minus906
S3 + S4 Epochs Epochs N Mean SD N Mean SD Delta P value CS 16 4799 1184 9 5507 2698 708 ns MR 11 3590 1294 6 1953 802 minus1638 ns GM 9 2650 755 7 3426 997 776 ns DC 98 5353 1673 25 2442 1104 minus2911 00001 SS 92 5554 1578 59 2229 830 minus364 00001 No of epochs 226 106 No of subjects Mean SEM No of subjects Mean SEM Delta subjects subjects Average 5 5691 3114 5 3111 1281 minus2580 ns
REM Epochs Epochs N Mean SD N Mean SD Delta P value CS 8 2643 812 5 1787 431 minus856 ns MR 23 1850 582 13 1057 376 minus793 0001 GM 10 1431 646 13 1691 618 260 ns DC 62 2180 1224 30 1156 614 minus1024 00001 SS 72 3215 1457 52 2681 1455 minus534 00461 No of epochs 175 113 No of subjects Mean SEM No of subjects Mean SEM Delta subjects subjects Average 5 2264 944 5 1674 699 minus590 ns
Footnotes to Table 6 (1)One-way ANOVA of the averages of the total power in the high frequency (004 - 015 Hz) range in normalized units (HF-RR-NU) showed significant differences between conditions (DF73239 F 4071 P lt 00027) Post-hoc analysis demonstrated a significant difference between the average HF-RR-NU during W at 122 m and that during stages S3 + S4 at 122 m (P lt 005) The averages of HF-RR-NU during W at 3480 m differed significantly from those during stages S3 + S4 at 122 (P lt 005) The averages of HF-RR-NU during W at 122 m differed significantly from those during stages S3 + S4 at 122 m (P lt 005) The average of HF-RR-NU during stages S1 + S2 at 122 m differed significantly from that during stages S3 + S4 at 3480 m (P lt 005) The average of HF-RR-NU during stages S1 + S2 at 3480 m differed significantly from that during stages S3 + S4 at 122 m (P lt 005) The average of HF-RR-NU during stages S3 + S4 at 122 m differed significantly from that during stages S3 + S4 at 3480 m (P lt 005) The average of HF-RR-NU during stages S3 + S4 at 122 m differed significantly from that during REM sleep at 122 m (P lt 005) The average of HF-RR-NU during stages S3 + S4 at 122 m differed significantly from that during stages S3 + S4 at 3480 m (P lt 005) The average of HF-RR-NU during stages S3 + S4 at 3480 m differed significantly from that during REM sleep at 3480 m (P lt 005) in all five subjects Comparison with Studentrsquos t-test of the average of the HF-RR-NU in a natural physiologically defined number of 30-second signal epochs according to standard criteria developed by Rechtschaffen and Kales (1968) during the waking period during sleep (W) differed significantly from that during stages S3 + S4 of NREM sleep at 122 m in all five subjects (P lt 00327) Comparison with Studentrsquos t-test of the average of the HF-RR-NU in a natural physiologically defined number of 30-second signal epochs according to standard criteria developed by Rechtschaffen and Kales (1968) during stages S3 + S4 of NREM sleep differed significantly from that during REM sleep at 122 m in all five subjects (P lt 001004)
I GRITTI ET AL
Copyright copy 2013 SciRes JBBS
39
Table 7 Averages of the ratio of low frequencyhigh frequency (LF ms2HF ms2) range which mirrors sympathovagal bal-ance or reflects sympathetic modulation in a physiologically defined number of 30-second signal epochs according to stan-dard criteria developed by Rechtschaffen and Kales (1968) during the waking period during sleep (W) stages S1 + S2 and S3 + S4 of NREM sleep and REM sleep at 122 m and after 30 - 41 h of acclimatisation at 3480 m in the five subjects(1)
Stages Subjects 122 m 3480 m
Epochs Epochs
Awakening during sleep N Mean SD N Mean SD Delta P value
CS 7 347 14415 35 45477 22645 10777 ns
MR 3 6513 277 3 6517 3324 0004 ns
GM 13 61615 24214 12 23017 13728 minus38598 00001
DC 140 493 62275 157 72334 10049 23034 00235
SS 27 2157 14672 64 94181 81271 72611 00001
No of epochs 190 271
No of subjects Mean SEM No of subjects Mean SEM Delta
subjects subjects
Average 5 46446 28655 5 60036 50276 1357 ns
S1+ S2 Epochs Epochs
N Mean SD N Mean SD Delta P value
CS 45 29293 15299 34 25515 13856 minus03778 ns
MR 58 39624 18413 52 50512 23613 10888 00078
GM 53 4616 20671 54 3905 16255 minus0711 00503
DC 302 17193 13779 322 61907 43641 44714 00001
SS 200 23667 21697 220 79224 67405 55557 00001
No of epochs 658 683
No of subjects Mean SEM No of subjects Mean SEM Delta
subjects subjects
Average 5 31187 17972 5 51242 32954 2007 ns
S3+ S4 Epochs Epochs
N Mean SD N Mean SD Delta P value
CS 16 10919 0477 9 16633 22308 05714 ns
MR 11 21655 12576 6 46867 18516 25212 00043
GM 9 29344 12127 7 19357 0831 minus09987 ns
DC 98 12203 14342 25 37484 17785 25281 00001
SS 92 09542 10418 59 40205 23448 325 00001
No of epochs 226
No of subjects Mean SEM No of subjects Mean SEM Delta
subjects subjects
Average 5 1633 10847 5 32109 18073 1538 ns
REM Epochs Epochs
N Mean SD N Mean SD Delta P value
CS 8 281163 5 4738 14928 19217 00166
MR 23 482217 13 98554 43032 50337 00001
GM 10 6756 13 53138 20368 minus14422 ns
DC 62 52563 30 1052 66211 5264 00001
SS 72 27194 52 41387 3949 1493 00102
No of epochs 175 113
No of subjects Mean SEM No of subjects Mean SEM Delta
subjects subjects
Average 5 44739 5 69132 36806 2439 ns
Footnotes to Table 7 (1)One-way ANOVA showed no significant differences in the LFHF ratio in the different conditions Studentrsquos t-test showed that the average of the total power of the LFHF ratio during the waking state during sleep (W) (190 epochs) at 122 m was generally higher than the average LFHF ratio during stages S3 + S4 (226 epochs) at the same altitude in the five subjects (P lt 00110) Studentrsquos t-test showed that the average of the total power of the LFHF ratio during stages S3 + S4 in a total of 226 epochs of 30 seconds at low altitude was significantly lower than that in 175 epochs of REM sleep at 122 m in the five subjects (P lt 0011335) Studentrsquos t-test showed that the average of the total power of the LFHF ratio during stages S3 + S4 (106 epochs) at 3480 m was significantly lower than that during REM sleep (113 epochs) at high altitude in the five subjects (P lt 0036835)
I GRITTI ET AL
Copyright copy 2013 SciRes JBBS
40
a decline in sympathovagal balance At 122 m and at 3480 m the average values of LFHF during REM sleep were similar to those observed during the awakening period during sleep (W)
38 Total Power (TP ms2)
381 Sea Level (122 m) The average of the TP during the awakening period dur-ing sleep (W 33057 plusmn 18136) differed significantly from that recorded during S3 + S4 (13007 plusmn 4621 P lt 00068) During S3 + S4 of NREM sleep (13007 plusmn 4621) the average of the TP differed significantly from that observed during REM sleep (28480 plusmn 14192 P lt 0003341) (Table 8) The TP during REM sleep was similar to the TP values recorded during W
382 High Altitude (3480 m) During S3 + S4 of NREM sleep (9202 plusmn 3805) the av-erage of the TP differed significantly from that observed during REM sleep (22838 plusmn 11600 P lt 0002613) in all five subjects
383 Sea Level (122 m) and High Altitude (3480 m) (Table 8)
During W the average of the total power (TP ms2) re- corded at 122 m was longer than that recorded at 3480 m in 25 subjects [(MR 50528 plusmn 7837 at 122 m vs 30899 at 3480 m P lt 00254) (DC 17740 plusmn 23122 at 122 m vs 11197 plusmn 11829 at 3480 m P lt 00020)] (Table 8) During S1 + S2 the average of the TP at low altitude was significantly longer than that observed at 3480 m in 35 subjects [(MR 21950 plusmn 8436 at 122 m vs 16258 plusmn 9971 at 3480 m P lt 00015) (GM 20200 plusmn 11240 at 122 m vs 15218 plusmn 7421 at 3480 m P lt 00079) (DC 7240 plusmn 2998 at 122 m vs 6021 plusmn 3589 at 3480 m P lt 000019)] During S3 + S4 the average of the TP at 122 m was sig- nificantly longer than that observed at 3480 m in 45 sub- jects (CS 13176 plusmn 3660 at 122 m vs 8733 plusmn 5824 at 3480 m P lt 00275) (MR 17278 plusmn 4805 at 122 m vs 6865 plusmn 720 at 3480 m P lt 00001) (DC 6917 plusmn 3007 at 122 m vs 5262 plusmn 4686 at 3480 m P lt 00307) (SS 15005 plusmn 5017 at 122 m vs 10516 plusmn 9526 at 3480 m P lt 00002) At 3480 m during the awakening period during sleep (W 25672 plusmn 15424) the average of the TP dif- fered significantly from that recorded during S3 + S4 (9202 plusmn 3805 P lt 0028) The average of the TP re- corded during REM sleep at sea level was significantly shorter than that at altitude in 25 subjects (CS 39198 plusmn 13892 at 122 m vs 22879 plusmn 8514 at 3480 m P lt 00320) (SS 25442 plusmn 11874 at 122 m vs 14723 plusmn 7978 at 3480 m P lt 00001)
At 122 m and at 3480 m there was a decrease in TP during deepening of NREM sleep At 122 m and at 3480
m the average values of TP during REM sleep were simi- lar to those observed during awakening during sleep (W)
4 Discussion
Fluctuations in autonomic cardiovascular regulation dur- ing exposure to high-altitude environment may increase the risk of heart attack This study compared heart rate variability (HVR) and its components during sleep at low altitude and after 30 - 41 hours of acclimatization at high altitude (3480 m) in mountain marathon runners controlled for diet drugs light-dark cycle and jet lag dif- ferences At altitude RR-intervals became significantly shorter (P lt 0001) The significant changes in sympa- theticparasympathetic autonomic cardiovascular modu- lation at high altitude can protect against excessive oxy- gen deprivation particularly during sleep and thus lower the risk of heart attack Increase in R-R intervals during wake and sleep may require longer periods of acclimati-zation at 3480 m to mitigate the effects of altitudehypo- xia on the sympathetic tone of the mountain marathon runners thus reducing cardiovascular distress
5 Background
Molecular oxygen is essential for all higher forms of life and brain cell function During evolution humans and other animal species developed molecular biochemical and physiological mechanisms to optimize oxygen utili- zation efficacy Humans respond to acute or chronic ex- posure to hypobaric-hypoxia by resetting the pO2 balance to ensure brain and heart cell function Understanding how the body adjusts its biochemical and physiological cellular needs may help to better define the health risks associated with activities in hypobaric-hypoxia condi- tions and can aid in identifying appropriate therapeutic non-pharmacological andor pharmacological treatments Our ability to breathe and to modify breathing according to the amount of available ambient oxygen and to our bodyrsquos demands (particularly those of the brain heart and lungs) is essential for survival Failure to breathe or an inadequate oxygen supply especially to the brain contributes to cardiorespiratory distress In hypoxic con- ditions distribution of cardiac output to the cardiovascu- lar beds is subordinate to a preprogrammed priority pro- gram for preservation of the organism In hypoxic condi- tions the majority of neuronal systems of the brain in- crease andor change their firing rate in order to modulate in a cyclic manner the discharge of the neurons involved in regulating the oxygen supply in mammals [151618 19]
Acute and chronic exposure to hypoxemia leads to all sorts of disturbances that suggest impaired excitatory neuronal functions involved in the behavioral and meta- bolic integration of autonomic control and arousal [15]
I GRITTI ET AL
Copyright copy 2013 SciRes JBBS
41
Table 8 Averages of the total power (TP ms2) in a physiologically defined number of 30-second EEG signal epochs accord-ing to standard criteria developed by Rechtschaffen and Kales (1968) during the waking state during sleep (W) stages S1 + S2 and S3 + S4 of NREM sleep and REM sleep at 122 m and after 30 - 41 h of acclimatisation at 3480 m in the five subjects
Stages Subjects 122 m 3480 m Epochs Epochs
Awakening during sleep N Mean SD N Mean SD Delta P value CS 7 33449 24257 35 25486 16753 minus7963 ns MR 3 50528 7837 3 30899 5845 minus19629 00254 GM 13 29277 9809 12 28573 22336 minus704 ns DC 140 17740 23122 157 11197 11829 minus6543 0002 SS 27 34293 25655 64 32203 20358 minus2090 ns No of epochs 190 271 No of subjects Mean SEM No of subjects Mean SEM Delta subjects subjects Average 5 33057 18136 5 25672 15424 minus7385 ns
S1+ S2 Epochs Epochs N Mean SD N Mean SD Delta P value CS 45 29292 16380 34 22533 13712 minus6758 MR 58 21950 8436 52 16258 9971 minus5692 ns GM 53 20200 11240 54 15218 7421 minus4982 00015 DC 302 7420 2998 322 6021 3589 minus1398 00079 SS 200 25316 18423 237 29006 16917 3690 00001 No of epochs 658 683 00297 No of subjects Mean SEM No of subjects Mean SEM Delta subjects subjects Average 5 20836 11495 5 17807 10322 minus3028 ns
S3+ S4 Epochs Epochs N Mean SD N Mean SD Delta P value CS 16 13176 3660 9 8733 5824 minus4443 00275 MR 11 17278 4805 6 6865 720 minus10412 00001 GM 9 12659 6614 7 11634 6801 minus1025 ns DC 98 6917 3007 25 5262 4686 minus1655 00307 SS 92 15005 5017 59 10516 9526 minus4489 00002 No of epochs 226 106 No of subjects Mean SEM No of subjects Mean SEM Delta subjects subjects Average 5 130007 4621 5 9202 3805 minus3798 ns
REM Epochs Epochs N Mean SD N Mean SD Delta P value CS 8 39198 13892 5 29459 13908 minus938 ns MR 23 33035 14907 13 22879 8514 minus10156 0032 GM 10 23552 6159 13 29734 9673 6182 ns DC 62 21174 24128 30 17396 17929 minus3778 ns SS 72 25442 11874 52 14723 7978 10719 00001 No of epochs 175 113 No of subjects Mean SEM No of subjects Mean SEM Delta subjects subjects Average 5 28480 14192 5 22838 116000 minus5642 ns
Footnotes to Table 8 (1)One-way ANOVA showed a significant difference in the average of the total power (TP) between conditions (DF 73239 F = 5433 P = 00004) Post-hoc Fisher analysis revealed a significant difference between the average of the TP recorded at 122 m during waking (W) and that recorded at 122 m during stages S1 + S2 (P lt 005)and during stages S3 + S4 (P lt 005) Post-hoc Fisher analysis revealed a significant difference between the average of the TP recorded at 122 m during waking (W) and that at 3480 m during stages S1 + S2 (P lt 005) and stages S3 + S4 (P lt 005) Post-hoc Fisher analysis revealed a significant difference between the average of the TP recorded at 122 m during waking (W) and that at 3480 m during REM sleep (P lt 005) Post-hoc Fisher analysis revealed a significant difference between the average of the TP recorded at 3480 m during stages S3 + S4 and that at 122 m during stages S3 + S4 (P lt 005) Post-hoc Fisher analysis revealed a significant difference between the average of the TP recorded at 122 m during stages S1 + S2 and that at 3480 m dur- ing REM sleep (P lt 005) Post-hoc Fisher analysis revealed a significant difference between the average of the TP recorded at 3480 m during stages S1 + S2 and that at 122 m during REM sleep (P lt 005) Post-hoc Fisher analysis revealed a significant difference between the average of the TP recorded at 122 m during stages S3 + S4 and that at 122 m during REM sleep (P lt 005) Post-hoc Fisher revealed a significant difference between the average of the TP recorded at 3480 m during stages S3 + S4 and that at 122 m during REM sleep (P lt 005) Post-hoc Fisher analysis revealed a significant difference between the average of the TP recorded at 3480 m during stages S3 + S4 and that at 3480 m during REM sleep (P lt 005) in the five subjects Post-hoc analysis with Studentrsquos t-test showed a significant difference (P lt 005) between the average of the total power (TP ms2) in a physiologically defined number of 30-second signal epochs according to standard criteria developed by Rechtschaffen and Kales (1968) recorded during the waking state during sleep (W) (190 epochs) and that during stages S3 + S4 (226 epochs) at 122 m (P lt 00068) in the five subjects Post-hoc analysis with Studentrsquos t-test showed a significant difference (P lt 0028) between the average of the total power (TP ms2) in a physiologically defined number of 30-second signal epochs according to standard criteria developed by Rechtschaffen and Kales (1968) recorded during the waking state during sleep (W) (271 epochs) and that during stages S3 + S4 (106 epochs) at 3480 m in the five subjects Post-hoc analysis with Studentrsquos t-test showed a significant difference (P lt 0003341) between the average of the total power (TP ms2) in a physio-logically defined number of 30-second signal epochs according to standard criteria developed by Rechtschaffen and Kales (1968) recorded during stages S3 + S4 (226 epochs) and that during REM sleep (175 epochs) at 122 m in the five subjects Post-hoc analysis with Studentrsquos t-test showed a significant difference (P lt 0002613) between the average of the total power (TP ms2) in a physiologically defined number of 30-second signal epochs according to standard criteria devel-oped by Rechtschaffen and Kales (1968) recorded during stages S3 + S4 (106 epochs) and that during REM sleep (113 epochs) at 3480 m in the five subjects
I GRITTI ET AL
Copyright copy 2013 SciRes JBBS
42
Research into the causes of cardiovascular mortality ex- perimental evidence for a predisposition to fatal arrhyth- mias signs of tonic or phasic increased sympathetic ac- tivity and reduced parasympathetic-cholinergic-vagal ac- tivity has advanced efforts for the development of quan- titative markers of heart rate variability (HRV) (Task Force [1])
51 Heart Rate Variability during Wake and Sleep
HRV has been established as a non-invasive tool to study cardiac autonomic activity and proposed as a predictor for evaluating the increased risk of cardiac death Inter- actions of changes in cardiac autonomic nervous modu- lation in various types of subjects are under study by the Task Force [1] An overnight declining trend of HRV has been found to increase during sleep [14] Otzenberger and co-workers [14] demonstrated that overnight profiles of the R-R intervals are related to changes in the sleep EEG mean frequency sign which reflects the depth of sleep During attentive-to-quiet waking and from the lighter to the deeper phases of sleep HRV has been shown to be affected by vagalsympathetic modulation and control
52 Heart Rate Variability and Mountain Marathon Runners
Past studies showed that the high-altitude endurance per- formance of mountain marathoners is appreciably re- duced at 5200 m Based on their clinical characteristics mountain marathoners can be considered as a physio- logical model for studying cardiovascular alterations of long-lasting stay and exercise at high altitude Over the last 12 years the time course of cardiovascular changes in the mountain marathon runners has been assessed be- fore during and after the end of races at altitude In sea- level native mountain marathoners long-lasting training mdashfrom sea level to altitudemdashcan lower the HR during rest and exercise associated with a decrease in sympa- thetic modulation and a rise in parasympathetic activity [20] As in normal subjects so too in well-trained moun- tain marathoners cardiovascular modifications can change continuously over a 24-h period during acclimatization and the nocturnal sleep-wake-cycle at low and high alti- tudes In mountain marathoners just as in normal sub- jects HRV alterations at altitude may include altered resting HR due to changes in the vagal and sympathetic components besides the appearance of sinus arrhythmia during waking and periodically during nocturnal S1 + S2 NREM sleep and REM sleep breathing
As suggested by the Task Force [1] the present study data were obtained during sleep and as such may add valuable insights for research into HRV With this study we also wanted to determine whether 20 years of training
between 122 m and 5200 m altitude could have exerted in addition to the changes reported elsewhere [912] a high impact on the autonomiccardiovascular systems of the mountain marathon runners during the nocturnal sleep- wake cycle at low and at high altitudes
Our study documents that in mountain marathoners the nocturnal sleep-wake cycle at 122 m is highly influ- ence by autonomic parasympathetic activity and by in- creased autonomic parasympathetic activity during the deepening of NREM sleep The results also show a phy- siological decrease in parasympathetic activity versus an increase in sympathetic activity during all phases of the nocturnal sleep-wake cycle at 3480 m Surprisingly our study also documents that the nocturnal sleep-wake cycle at 3480 m is still characterized by an increase in auto- nomic parasympathetic activity during light S1 + S2 NREM sleep At both altitudes the trend of the balance of parasympatheticsympathetic activity recorded during REM sleep is similar to that recorded during the awak- ening state (W)
53 R-R Intervals (ms)
531 Sea Level (122 m) The averages of the R-R intervals recorded at 122 m did not change significantly between nocturnal awakenings during sleep and sleep stages (R-R interval range 1200 - 1300 ms) The average R-R interval at 122 m during the awaking state of sleep was similar to that recorded dur- ing the wake state in 12 trained endurance athletes who performed a minimum of 3 h of aerobic activity per week [21]
532 High Altitude (3480 m) The majority of the ECG alterations in the five mountain runners during sleep at an altitude of 3480 m and at a barometric pressure (PB) of 495 mm Hg and between 30 and 41 h of acclimatization were signs of sinus arrhyth- mia during the early stages (S1 + S2) of NREM sleep and during REM sleep At 3480 m the average of the R-R intervals we recorded during S1 + S2 of NREM sleep were significantly longer than those observed during the awaking period (W) during sleep The longest average R-R intervals were recorded during S1 + S2 at 3480 m These results suggest that at altitude there was still a significant elevation of parasympathetic tone during S1 + S2 of slow-wave sleep versus the waking state during sleep at 3480 m
533 Sea Level (122 m) and High Altitude (3480 m) There was a nonpathological significant reduction in the R-R intervals during the awakening period during sleep (W) S1 + S2 S3 + S4 of NREM and REM sleep stages and after 30 - 41 h of acclimatization to an altitude of
I GRITTI ET AL
Copyright copy 2013 SciRes JBBS
43
3480 m versus the averages of the R-R intervals ob- served during the same stages at 122 m
The longest average R-R intervals were recorded dur- ing the light stage of slow-wave-sleep (S1 + S2) at 122 m (suggesting high vagal activation) and the lowest aver- age R-R intervals were recorded during the awakening period during sleep (W) at 3480 m (indicating an in- crease in noradrenergic activation) Overall the average R-R intervals at high altitude were significantly lower than those recorded at 122 m with the average R-R in- tervals we recorded at 3480 m even during the awaken- ing period (W) during sleep (935 ms) The absolute value of the R-R intervals Bernardi and co-workers [22] found in 10 sea-level native subjects at low altitude was 1002 plusmn 45 ms and 809 plusmn 116 ms in 3 high-altitude native sub- jects living at low altitude In that study the average R-R intervals in the 10 sea-level native subjects and in 3 high- altitude native subjects (living at low altitude) exposed to 4970 m for 3 days were 775 plusmn 57 and 749 plusmn 47 respec- tively The delta of the averages of the R-R intervals that we calculated in our subjects after exposure to 3480 m was similar to the delta of the R-R intervals Bernardi and co-workers [22] reported In our study the average R-R intervals recorded at 122 m and 3480 m during all sleep stages were also longer than those observed by Lanfran- chi and co-workers [2] in 41 mountaineers during wak- ing with and without AMS and after acute exposure to approximately 4500 m Overall the average R-R inter- vals we recorded at 122 m and 3480 m demonstrate that frequent exposure to altitudes between 122 m and 5500 m for more than 20 years may have improved the effi- cacy of vagal modulation at low and high altitude during nocturnal awakening and sleep
54 Simple Linear Regression Analysis between the R-R Intervals and the SpaO2
Linear regression analysis showed a significant negative correlation between the changes in the average SpaO2 and the changes in the average R-R intervals The sig- nificant negative correlation between SpaO2 and R-R intervals may indicate that the average quantity of oxy- gen supplied during nocturnal sleep stages may be di- rectly responsible for the R-R interval changes observed during nocturnal sleep particularly at high altitude
55 Total Power of Very Low Frequency [(VLF ms2) (lt004 Hz)] Such as the Thermoregulation-Related HRV
The thermoregulatory-related very low frequency (VLF) rhythm may be related to thermoregulatory changes or chemical and acid-base equilibrium changes or both In- terestingly the changes in the VLF are significantly co- related with the PCO2 changes (personal observations
DF13839 R-squared = 0191 coefficient = ndash970294 Ftest = 8982 P = 00048 t = 1146) tCO2 changes (personal observations DF13839 R-squared = 0189 coefficient = ndash21649785 Ftest = 8871 P = 0005 t = 2978) and
3HCOminus changes (personal observations DF13839 R- squared = 0184 coefficient = ndash21682826 Ftest = 8557 P = 00058 t = 2925)
551 Sea Level (122 m) At 122 m the average VLF decreased during S1 + S2 and significantly so during S3 + S4 compared with the average VLF recorded during the waking period (W) The average VLF during S3 + S4 at 122 m was signifi- cantly shorter than the average VLF recorded during the awakening period (W) during sleep The average VLF during S3 + S4 at 122 m was shorter than the average VLF recorded during REM sleep At 122 m there was a decrease in the average VLF during NREM sleep and an increase in VLF during the desynchronized waking state The average VLF during desynchronized REM sleep at 122 m was slightly shorter than the average VLF re- corded during the awakening period (W) during sleep
552 High Altitude (3480 m) At 3480 m the average VLF decreased during S1 + S2 and significantly so during S3 + S4 compared with the average VLF recorded during the awaking period (W) during sleep The average VLF during S3 + S4 at 3480 m was significantly shorter than the average VLF recorded during the awakening period (W) during sleep At 3480 m there was a decrease in the average VLF during NREM sleep and an increase during the desynchronized awaking state during sleep and REM sleep The average VLF during REM sleep at 3480 m was slightly shorter than that observed during the awakening period (W) dur- ing sleep
553 Sea Level (122 m) and High Altitude (3480 m) The average VLF during the awakening period (W) dur- ing sleep S1 + S2 S3 + S4 and REM sleep at 122 m was longer but not significantly so compared with the average VLF observed at 3480 m
56 Total Power of Low Frequency [(LF ms2) (004 - 015 Hz)] Range The LF Appears to Have a Widespread Neuronal Genesis and Is Considered as a Marker of Sympathetic Modulation or a Marker of Both Sympathetic and Vagal Modulation
561 Sea Level (122 m) Statistical analysis of our data revealed that the average of the LF during desynchronized REM sleep at 122 m was significantly longer than that recorded during syn-
I GRITTI ET AL
Copyright copy 2013 SciRes JBBS
44
chronized S3 + S4 sleep These data demonstrate an in- crease in parasympathetic tone during REM sleep
562 High Altitude (3480 m) In altitude there was a significant increase in sympathetic tone throughout the awakening period (W) during sleep the S1 + S2 and the REM sleep The sympathetic tone decreased during the deep phase of slow wave sleep (S3 + S4)
563 Sea Level (122 m) and High Altitude (3480 m) No significant changes were found between the average LF recorded at 122 m and that recorded at 3480 m How- ever in some subjects a significant decrease emerged between the average of LF recorded during the awaken- ing period (W) during sleep S1 + S2 S3 + S4 and REM sleep at 122 m versus the average of LF recorded at 3480 m
The average LF recorded in all 5 mountain marathon- ers and in all 4 stages of desynchronization and synchro- nization at 122 m and at 3480 m (Table 3) were longer than the average LF Ako and co-workers [3] observed in 7 subjects during sleep at sea level
We also found a decrease in the average LF during S3 + S4 at 122 m and 3480 m compared with the average LF recorded during S1 + S2 The average LF recorded in our study during the desynchronized REM sleep state at 122 m and 3480 m returned to similar values we recorded during the desynchronized awakening period (W) during sleep A comparison of LF indices in the different sleep stages recorded at 122 m and at 3480 m revealed a de-crease in the LF from the waking to the deep stages of sleep The average LF during REM sleep was similar to the average LF recorded during waking Like those of Ako and co-workers [3] our data suggest that sympa- thetic nervous activity decreases as sleep deepens and concomitantly increases during desynchronization of the awakening period (W) during sleep and even more so during desynchronization during REM sleep In our study the average LF a marker of sympathetic modulation during the awakening period (W) during sleep S1 + S2 S3 + S4 and REM sleep at 122 m and at 3480 m was lower
57 LFRRNU
The aim of this study was also to verify whether auto- nomic variables at low altitude could predict prodromic signs of AMS when subjects were exposed to high alti- tude or whether subjects experienced AMS at high alti- tude Autonomic cardiovascular function was also ex- plored by measuring widespread neuronal genesis rhythm low frequency in normalized unit (LFRRNU) to study sympathetic modulation
Lanfranchi and co-workers [2] reported a substantial increase in the LFRRNU component at altitude suggest- ing an increase in sympathetic modulation in response to hypoxia at 4500 m During exposure to high altitude besides shorter R-R intervals we also found a relative though not significant increase in the LFRRNU compo- nent
We agree with Lanfranchi and co-workers [2] that this increase in the LFRRNU component may reflect an in- crease in the sympathetic modulation of HR During ex- posure to 3480 m R-R interval variability decreased as the LF component increased suggesting an increase in sympathetic modulation in response to hypobaric-hypo- xia The average LFRRNU Lanfranchi and co-workers [2] recorded in 24 subjects without AMS after exposure to approximately 4500 m during waking was similar to the average we recorded in our subjects during the awaken- ing period (W) during sleep at 3480 m (73 vs 75 respec- tively)
LFRRNU has been said to be a quantitative marker of the cardiac vigil (Vanderwalle et al [23]) and sympa- thetic outflow of the autonomic nervous system By means of spectral analysis of subjects in supine position the Task Force [1] calculated an average LFRRNU of 54 which is fairly similar to the average values in 45 of our subjects 47 in CS 45 in DC and 39 in SS in supine po- sition during S3 + S4 at 122 m Overall the average LFRRNU reported by the Task Force [1] is somewhat lower than our data (54 vs 39 - 89 respectively)
From a steady-state HRV analysis Murrel and co- workers [24] found an average LFRRNU of 77 in the standing position and premarathon conditions an average between 72 and 92 immediately after a marathon and an average of 73 in the standing position at 48 h postmara- thon These data appear similar to the data we recorded at 122 m and 3480 m during the awakening S1 + S2 S3 + S4 and REM stages of sleep
Specifically at 122 m there was a decrease in LFRRNU as sleep depth increased during the desynchronized phase of sleep (the awakening state) the LFRRNU reached the values observed during REM sleep At 3480 m there was a decrease in LFRRNU as sleep deepened during the de- synchronized phase of sleep (the awakening state) the LFRRNU reached the values recorded during the REM phases at 3480 m
58 High Frequency
Efferent vagal activity is a major contributor to the high frequency (HF) component (Task Force [1]) which pri- marily reflects respiration-driven vigil modulation of the sinus rhythm Other factors such as voluntary controlled respiration cold stimulation of the face or rotational mo- tor stimuli (see above) can occur physiologically during
I GRITTI ET AL
Copyright copy 2013 SciRes JBBS
45
sleeping and might confound results Spectral analysis of stationary supine subjects revealed an average normal HF close to 975 ms2 (Task Force [1]) Saito and co-workers [25] reported an average HF of 780 plusmn 211 ms2 in 21 sub- jects during waking at low altitude and an average HF between 61 plusmn 44 and 112 plusmn 128 ms2 after exposure for 4 - 6 h at PB 495 mm Hg Lanfranchi and co-workers [2] reported an average HF between 102 plusmn 37 and 157 plusmn 43 ms2 in subjects exposed to approximately 4500 m or between 135 plusmn 30 and 64 plusmn 4 ms2 in those with no signs of AMS Briefly in the subjects without AMS there was a non significant increase in the HF component At low altitude the average HF in our five mountain marathon runners increased as sleep deepened and decreased dur- ing REM sleep to levels similar to those observed in the waking state The average HF at altitude was 1572 ms2 during the awakening state 1610 ms2 during S1 + S2 1480 ms2 during S3 + S4 and 1159 ms2 during REM sleep The average HF decreased during the sleep stages Surprisingly the average HF of 1159 ms2 during REM sleep at high altitude was lower than the average ob- served during the desynchronized state during waking
As reported by the Task Force [1] we also found the HF vigil component of the power spectrum to be aug- mented during NREM sleep at low altitude
59 HFRRNU
The average of total power expressed in high frequency RR normalized units (HFRRNU) is considered a marker of vagal modulation of the autonomic system The values that we found at low altitude during the awakening pe- riod (W) during sleep during S2 + S3 and S3 + S4 and during REM sleep were similar to those Murrell and co- workers [24] recorded at premarathon postmarathon and 48 h postmarathon assessment under controlled normal breathing and standing conditions Our HFRRNU data recorded during the awakening period (W) during sleep at 122 and were similar to those they reported during REM sleep (2347 versus 2264 respectively) In their evaluation of LFRRNU the average HF (controlled brea- thing) was 5845 during the premarathon stage 45 during and 53 at 48 h postmarathon The average HFRRNU de- creased immediately after the race and at 48 h postmara- thon All these values are very close to the average LFRRNU we recorded in the subjects during S3 + S4 sleep at low altitude
Of note is that HFRRNU at low and at high altitudes increases at sleep onset and peaks during the deep stage of sleep (S3 + S4) at altitude (5691) After exposure to 3480 m at a PB of 495 mm Hg for 30 - 41 h there was a non significant reduction in HFRRNU across all sleep stages The average HFRRNU during the awakening pe- riod (W) during sleep at 3480 m was lower but still simi-
lar to that at 122 m These values were similar though lower than those Murrell and co-workers [24] recorded immediately and at 48 h post-marathon at altitude
Our HFRRNU data recorded during sleep at 122 m and 3480 m were also similar to those Lanfranchi and co- workers [2] reported in subjects without AMS and those with AMS (16 and 31 respectively) during the supposed diurnal state and after exposure to 4500 m
Compared with the HFRRNU reported by the Task Force [1] our data recorded during the awakening state S1 + S2 and S3 + S4 and REM sleep at sea level and at 3480 m were 2131 and 3111 respectively
510 LFHF Ratio
Exercise and training at low and high altitudes may have modified autonomic nervous system balance and thus the LFHF ratio The LFHF ratio is considered by some in- vestigators as the mirror of sympathovagal balance or a reflection of sympathetic modulation (Ako et al [3]) In agreement with Ako and co-workers [3] we observed significantly at low altitude but indeed also at high alti- tude a significant decrease in the LFHF component as sleep deepened In agreement with Ako and co-workers [3] we also observed that the sympathetic nervous sys- tem is activated during the two desynchronisation phases of REM sleep and deactivated during NREM sleep at low and high altitude
In detail we analyzed the dynamics of nocturnal fluc- tuations of autonomic nerve activities in sleep stages classified by Rechtschaffen and Kalesrsquos criteria These criteria have not yet been investigated in association with HRV indices particularly during hypoxic conditions Ako and co-workers [3] found an increase in the LFHF ratio (251 plusmn 017) during REM sleep and a significant linear decrease during NREM sleep (S1 230 plusmn 029 S2 185 plusmn 009 S3 078 plusmn 006 S4 251 plusmn 017) Like Ako and co-workers [3] we noted a reduction in the LFHF ratio at 122 m and at 3480 m during NREM sleep (S1 + S2122 m 31187 S1 + S23480 m 51242 S3 + S4122 m 16733 S3 + S43480 m 32109) and an increase during REM sleep (REM122 m 44739 REM3480 m 69132) to the level found during the awaking period (W) during sleep (W122m 46446 and W3480 m 60036) We also found that the av- erage LFHF ratio during S3 + S4 of NREM sleep at 122 m (LFHF = 16733) was similar to that reported by the Task Force [1] (LFHF 15 - 20) in the spectral analysis of stationary supine 5-minute recordings In our study the average LFHF ratio at 122 m and 3480 m during the awaking period (W) during sleep (W122 m 46446 and W3480 m 60036 respectively) was lower yet similar to the average LFHF ratio Lanfranchi and co-workers [2] found during the waking state at 4500 m in mountaineers with and without AMS (34 plusmn 13 and 83 plusmn 14 respectively)
I GRITTI ET AL
Copyright copy 2013 SciRes JBBS
46
Saito and co-workers [25] found an average LFHF ratio of 26 plusmn 08 at PB 760 mm Hg at sea level during the re- laxed waking state This was similar to the value we found (16733) during S3 + S4 at 122 m They reported an average LFHF ratio of 35 plusmn 23 at 3456 m and at a PB of 495 mm Hg which was similar to the average of 32109 that we recorded during S3 + S4 at 3480 m The average LFHF ratio that we found in all five mountain runners during S3 + S4 (16733 plusmn 10847) at 122 m was similar to that reported by the Task Force [1] In some of the mountain marathon runners at low altitude at 122 m and after 30 - 41 h of acclimatization at 3480 m during the different stages of desynchronized and synchronized sleep the average LFHF ratio reached the normal values reported by the Task Force [1] (between 15 and 20) The LFHF ratio value of 2 which is considered normal by the Task Force [1] was recorded at 122 m in 15 sub- jects (SS) during the awakening period (W) of sleep 35 subjects (CS DC SS) during S1 + S2 and 55 subjects during S3 + S4 25 subjects (CS SS) during the REM sleep stage A LFHF ratio value of 2 was reached after 30 - 41 h of acclimatization at 3480 m by 15 subjects (GM) during the awakening period (W) of sleep 15 subjects (CS) during S1 + S2 and 25 subjects (CS GM) during S3 + S4 No changes were noted between the av- erage LFHF ratio recorded in all five mountain runners at 122 m and after 30 - 41 h of acclimatization at 3480 m and during all four stages of sleep awakening period (W) during sleep S1 + S2 S3 + S4 and REM sleep These results suggest highly controlled regulation of sympa- thovagal balance on exposure to moderate hypoxia con- ditions As reported in Table 7 several mountain mara- thon runners showed very high control of sympathovagal balance their LFHF ratio was similar to that reported by the Task Force [1] or did not differ between 122 m and 3480 m after 30 - 41 h of acclimatization during the awakening period (W) during sleep during S1 + S2 during S3 + S4 or during the REM sleep Cornolo and co-workers [20] reported an average LFHF ratio of ~60 in trained high-altitude native subjects 6 - 8 h after the end of a marathon performed between 4100 and 4400 m This was similar to the average LFHF ratio that we re- corded at 3480 m during the desynchronized state of sleep specifically during the awakening period (W) dur- ing sleep (60036 plusmn 50276) and during the REM sleep at the same altitude (69132 plusmn 36806)
511 Total Power
We observed significant parallel changes in TP recorded at low (PB about 740 mm Hg) and high (PB 495 mm Hg) altitude between the awakening period (W) during sleep and S3 + S4 of sleep We also found significant parallel changes in the TP recorded during REM sleep and the
average of TP recorded during S3 + S4 at 122 and 3480 m These changes may reflect changes in cardiac re- spiratory and sympathovagal balance In general in indi- vidual mountain marathon runners we found a decrease in the total power at altitude The components of HRV are thought to be influenced by both neuronal and hu- moral factors (Task Force [1]) Saito and co-workers [25] reported that humoral control of the autonomic nervous system plays an important role in the survival of victims under hypoxic conditions at high altitude
6 Functional Significance
Physical training at low and high altitudes may have in- duced marked autonomic adaptations in the mountain marathon runners over the course of their years of train- ing The resting heart rate was lower at sea level because parasympathetic modulation predominates over higher sympathetic control at high altitude By constantly main- taining their training levels at low and high altitudes for more than 20 years the mountain runners may have shifted their cardiovascular autonomic control toward a greater parasympathetic modulation particularly at sea level Rest and training under hypoxia conditions may have balanced the prevalence of parasympathetic modu- lation as well as improved control of phasic sympathetic responses
These well-trained runners seem to be exceptionally adapted to the high altitude environment [4-13] Strenu- ous exercise is known to induce profound cardiovascular modifications but with a caveat for non-professional ma- rathoners
We agree with Lanfranchi et al [2] that HRV analysis has proved to be essential for investigating the mountain sickness the balance of the sympathetic and parasympa- thetic function of the autonomic nervous system at low and high altitude in mountain marathon runners HRV analysis could also be very useful for evaluating de- creases in parasympathetic and increases in sympathetic tone of the autonomic nervous system during acclimati- zation at altitude of mountain marathon runners who ge- nerally have a tonic prevalence of parasympathetic tone at low altitude
R-R interval variability was observed in the mountain marathon runners during sleep at 122 m (ie a controlled increase in parasympathetic tone during NREM sleep and an increased sympathetic tone during the awakening pe- riod (W) during sleep and during REM sleep) At high altitude the RR-intervals we observed were similar to those Sacknoff and co-workers [21] reported in athletes and controls Moreover the major ECG alterations evi- dent during sleep at an altitude of 3480 m at a PB of 495 mm Hg and after 30 - 41 hours of acclimatization were an increase in HR together with signs of sinus arrhyth-
I GRITTI ET AL
Copyright copy 2013 SciRes JBBS
47
mia during periodic breathing in S1 + S2 of NREM sleep and in REM sleep
This study did not find abnormal reductions in the R-R interval during the awakening period (W) during sleep S1 + S2 S3 + S4 and REM sleep between 30 and 41 h of acclimatization at 3480 m in these well-trained moun- tain marathon runners
The HRV data observed at altitude suggest that the runners possess an intrinsic high parasympathetic tone that at high altitude promptly compensates the physio- logical increase in sympathetic tone due to a periodic significant decrease in peripheral oxygen saturation dur- ing sleep
Not in group average but in several individual runners we found a significant reduction in the LF component at high altitude which may be due to the rhythmic increase of sympathetic discharge of the central brain stem center
In comparison to the average calculated at low altitude we also found a significant decrease in the average of the power of HF during S3 + S4 of NREM sleep at 3480 m This significant reduction probably indicates a decrease in the vagal parasympathetic components of the brain- stem generator
The study demonstrates that cardiovascular modifi- cations during sleep and after 30 - 41 h of acclimatization at high altitude can occur even in mountain marathoners who have benefited from 20 years of training at low and high altitude Physicians should therefore take the results of HRV analysis into account to improve the training and performance particularly at altitude
7 Acknowledgements
Thanks are due to K Britsch for reading the manuscript We thank the FILA Sky Marathon for economical sup- port from 1998 up to 2003
REFERENCES [1] Task Force of the European Society of Cardiology and
North America Society of Pacing Electrophysiology ldquoHeart Rate Variability Standard of Measurement Phy- siological Interpretation and Clinical Userdquo European Heart Journal Vol 17 1996 pp 354-381 doi101093oxfordjournalseurheartja014868
[2] P A Lanfranchi R Colombo G Cremona P Baderna L Spagnolati G Mazzuero P Wagner L Perini H Wagner C Cavallaro and P Giannuzzi ldquoAutonomic Car- diovascular Regulation in Subjects with Acute Mountain Sicknessrdquo American Physiology Heart Circulation Physi- ology Vol 289 No 6 2005 pp H2364-H2372 doi101152ajpheart000042005
[3] M Ako K Tokuhiro S Uchida S Miyazaky K Nishi- hara J Mukai K Hirao J Ako and Y Okubo ldquoCorrela- tion between Electrophysiography and Heart Rate Vari- ability during Sleeprdquo Psychiatry and Clinical Neurosci-
ence Vol 57 No 1 2003 pp 59-65 doi101046j1440-1819200301080x
[4] G Banfi M Marinelli G S Roi A Colombini M Pon- tillo M Giacometti and S Wade ldquoGrowth Hormone and Insulin-Like Growth Factor I in Athletes Performing a Marathon at 4000 m of Altituderdquo Growth Regulation Vol 4 1994 pp 82-86
[5] M Marinelli G S Roi M Giacometti P Bonini and G Banfi ldquoCortisol Testosterone and Free Testosterone in Athletes Performing a Marathon at 4000 m of Altituderdquo Hormon Research Vol 41 No 5-6 1994 pp 225-229 doi101159000183929
[6] G Banfi M Marinelli G S Roi and M Giacometti ldquoPlatelet Indices in Athletes Performing a Race in Alti- tude Environmentrdquo Journal of Clinical Laboratory Ana- lysis Vol 9 No 1 1995 pp 34-36 doi101002jcla1860090106
[7] G Banfi M Marinelli P Bonini I Gritti and G S Roi ldquoPepsinogens and Gastrointestinal Symptoms in Moun- tain Marathon Runnersrdquo International Journal Sports Me- dicine Vol 17 No 8 1996 pp 554-558 doi101055s-2007-972894
[8] G Banfi M Pontillo M Marinelli A Dolci and G S Roi ldquoThyrotropin and Free Thyroid Hormones in Ath- letes during and after Ultra Endurance Sport Perform- ancesrdquo Journal Clinical of Ligand Assay Vol 21 No 3 1998 pp 331-334
[9] G S Roi M Giacometti and S P von Duvillard ldquoMara- thons in Altituderdquo Medicine amp Science in Sports amp Exer- cise Vol 31 No 5 1999 pp 723-728 doi10109700005768-199905000-00016
[10] G Banfi and A Dolci ldquoPreanalytical Phase of Sport Bio- chemistry and Haematologyrdquo The Journal of Sports Me- dicine and Physical Fitness Vol 43 No 2 2003 pp 223-230
[11] G Pelamatti M Pascotto and C Semenza ldquoVerbal Free Recall in High Altitude Proper Names vs Common Namesrdquo Cortex Vol 39 No 1 2003 pp 97-103 doi101016S0010-9452(08)70077-7
[12] G Fragasso A Palloshi S Roi E Rossetti G Monaco A Dolci A Margonato and S Chierchia ldquoTransient Left Ventricular Diastolic Dysfunction Following Strenuous Exerciserdquo Sport Science Health Vol 1 No 1 2004 pp 31-35 doi101007s11332-004-0007-7
[13] I Gritti M Martignoni R Calcaterra and G S Roi ldquoElectroencephalographic Changes after a Marathon at 4300 m of Altituderdquo Journal of Behavioral and Brain Science Vol 2 No 3 2012 pp 380-386 doi104236jbbs201223043
[14] H Otzenberger C Simon C Gronfier and G Branden- berger ldquoTemporal Relationship between Dynamic Heart Rate Variability and Electroencephalographic Activity during Sleep in Manrdquo Neuroscience Letters Vol 229 No 3 1997 pp 173-176 doi101016S0304-3940(97)00448-5
[15] J H Coote ldquoMedicine and Mechanisms in Altitude Sick- ness Recommendationsrdquo Sports Medicine Vol 20 No 3 1995 pp 148-159
I GRITTI ET AL
Copyright copy 2013 SciRes JBBS
48
doi10216500007256-199520030-00003
[16] M A Conney R W van Arts L A A Kolleacutee J C W Hopman G B A Stoelinga P Herman and H P van Geijn ldquoHeart Rate Variabilityrdquo Annals of Internal Medi- cine Vol 118 No 6 1993 pp 436-447
[17] A Rechtschaffen and A Kales ldquoA Manual of Standard- ized Terminology Techniques and Scoring System for Sleep Stages of Human Subjectsrdquo BISBRI UCLA Los Angeles 1968
[18] F R Calaresu A A Faiers and G J Mogenson ldquoCentral Neuronal Regulation of the Heart and Blood Vessels in Mammalsrdquo Progress Neurobiology Vol 5 No 1 1975 pp 1-35 doi1010160301-0082(75)90006-4
[19] H Scholz ldquoAdaptational Responses to Hypoxiardquo Ameri- can Journal of Physiology and Regulatory Integrative Comparative Physiology Vol 282 No 6 2002 pp R1541-R1543
[20] J Cornolo J V Brugniaux J L Marcarlupu C Privat F Leon-Velarde and J P Richalet ldquoAutonomic Adaptations in Andean-Trained Participants to 4220 m Altitude Mara- thonrdquo Medicine and Science in Sports and Exercise Vol 37 No 12 2005 pp 2148-2153 doi10124901mss00001799011928085
[21] D M Sacknoff G W Gleim N Stachenfeld and N L Complan ldquoEffect of Athletic Training on Heart Variabil-
ityrdquo American Heart Journal Vol 127 No 5 1994 pp 1275-1278 doi1010160002-8703(94)90046-9
[22] L Bernardi C Passino G Spadaccini A Calciati R Robergs R Green E Martignoni I Anand and O Ap- penzeller ldquoCardiovascular Autonomic Modulation and Activity of Carotid Baroreceptors at Altituderdquo Clinical Science Vol 95 1998 pp 565-573 doi101042CS19980046
[23] G Vandewalle B Middleton S W R Rajaratnam B M Stone B Thorleifsdottir J Aredent and D J Dijk ldquoRo- bust Circadian Rhythm in Heart Rate and Its Variability Influence of Melatonin and Photoperiodrdquo Journal of Sleep Research Vol 16 No 2 2007 pp 148-150 doi101111j1365-2869200700581x
[24] C Murrell L Wilson J D Cotter S Lucas S Ogoh G Keith and N Ainslie ldquoAlteration in Autonomic Function and Cerebral Hemodynamics to Orthostatic Challenge Fol- lowing a Mountain Marathonrdquo Journal Applied Physiol- ogy Vol 103 No 1 2007 pp 88-96 doi101152japplphysiol013962006
[25] S Saito K Tanobe M Yamada and F Nishihara ldquoRela- tionship between Arterial Oxygen Saturation and Heart Rate Variability at High Altitudesrdquo American Journal of Emergency Medicine Vol 23 No 1 2005 pp 8-12 doi101016jajem200409023
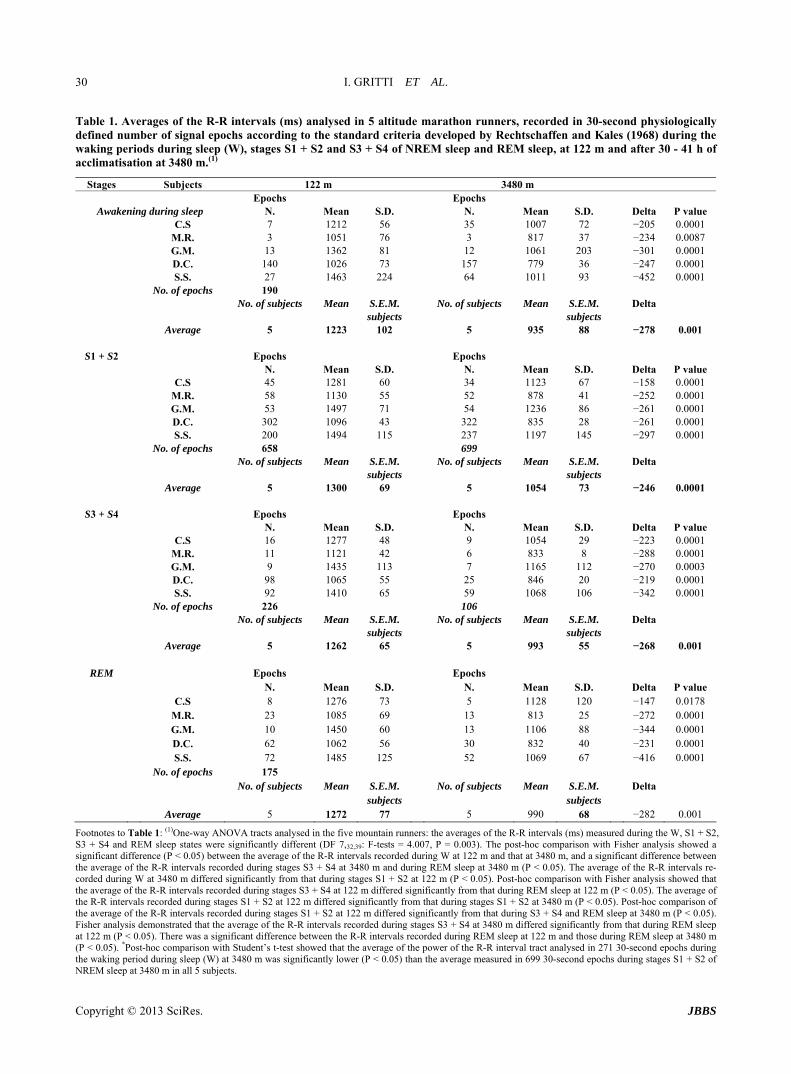
I GRITTI ET AL
Copyright copy 2013 SciRes JBBS
32
during the awakening period during sleep [(W) (17593 plusmn 14433)] was significantly longer than the average VLF recorded in 106 30-second signal epochs during S3 + S4 of NREM sleep (3179 plusmn 3665 P lt 00007) (Table 2) The average VLF in 106 30-second epochs during S3 + S4 of NREM sleep (3179 plusmn 3665) was significantly shor- ter than that analyzed in 113 30-second epochs of REM sleep (15765 plusmn 10505 P lt 005)
Overall the averaged data recorded during sleep at 3480 m demonstrate that during the deepening of syn- chronized sleep the thermoregulation-related component (VLF) of HRV decreased with a physiological increase in vagal tone During REM sleep the thermoregulation- related component of HRV approached that recorded during the awakening period during sleep (W) indicating an increase in the sympathetic tone
323 Sea Level (122 m) and High Altitude (3480 m) The average of the total power of very low frequency (VLF ms2) recorded during S1 + S2 of NREM sleep (5979 plusmn 6471) was significantly shorter at high altitude than that recorded sea level (10545 plusmn 9710 P lt 0005) in only 15 (GM) mountain marathon runners (Table 2)
33 Total Power of Low Frequency [(LF ms2) (004 - 015 Hz)] Range The LF Appears to Have a Widespread Neuronal Genesis and Is Considered as a Marker of Sympathetic Modulation or a Marker of Both Sympathetic and Vagal Modulation
331 Sea Level (122 m) At 122 m the averages of LF were 7997 ms2 during W 7400 ms2 during S1 + S2 4881 ms2 during S3 + S4 and 8579 ms2 during REM sleep The changes in the average total power in LF were significantly shorter during S3 + S4 than those observed during REM sleep (4881 plusmn 2041 vs 8579 plusmn 3473 P lt 002) (Table 3) These data suggest that the average values of LF a marker of sympathetic modulation decreased during the deepening phases of NREM sleep During REM sleep the average values of LF significantly increased approaching a value similar to that observed during W
332 High Altitude (3480 m) At 3480 m the averages of LF were 6272 ms2 during W 7516 ms2 during S1 + S2 3805 ms2 during S3 + S4 and 5715 ms2 during REM sleep (Table 3) The results dem- onstrate that the average values of LF during sleep at altitude did not change significantly between the differ- ent sleep stages (Table 3)
333 Sea Level (122 m) and High Altitude (3480 m) The averages of total power of low frequency (LF ms2)
recorded at high altitude during W were significantly shorter than those recorded at sea level in 35 subjects [(CS 3163 plusmn 1400 at 3480 m vs 5148 plusmn 3163 at 122 m P lt 00074) (GM 6157 plusmn 2271 at 3480 m vs 9656 plusmn 2978 at 122 m P lt 00033) (DC 2774 plusmn 2056 at 3480 m vs 5083 plusmn 4655 at 122 m P lt 00001)] (Table 3) The aver- age LF recorded during S1 + S2 was significantly longer at altitude than that recorded at sea level in 15 subjects (SS 17947 plusmn 12895 at 3480 m vs 10155 plusmn 6434 at 122 m P lt 00001) the LF was significantly shorter in 25 subjects [(CS 3539 plusmn 1734 at 3480 m vs 5946 plusmn 2294 at 122 m P lt 00001) (MR 6059 plusmn 1641 at 3480 m vs 10118 plusmn 2699 at 122 m P lt 00001)] the average LF recorded during S3 + S4 was significantly shorter at alti- tude than that recorded at 122 m in 25 [(CS 2276 plusmn 2427 at 3480 m vs 3760 plusmn 1098 at 122 m P lt 00455) (MR 3917 plusmn 592 at 3480 m vs 8344 plusmn 222 at 122 m P lt 00003)] the average LF recorded during REM sleep was significantly shorter at altitude than that recorded at sea level in 35 subjects [(MR 5200 plusmn 1513 at 3480 m vs 10159 plusmn 2790 at 122 m P lt 00001) (DC 3702 plusmn 1955 at 3480 m vs 6727 plusmn 4144 at 122 m P lt 00003) (SS 5 140 plusmn 4402 at 3480 m vs 11509 plusmn 6775 at 122 m P lt 00001)] These data demonstrate great variability in the sympathetic LF component of HRV recorded at low and high altitudes in the five mountain marathon runners
34 Low-Frequency in Normalized Units [(LFRRNU) (004 - 015 Hz)] Range LFRRNU Is Considered as a Marker of Sympathetic Modulation
341 Sea Level (122 m) In all 5 subjects the average LFRRNU recorded in 190 30-second epochs during the awakening period during sleep (W 7341 plusmn 1015) differed significantly from that recorded in 226 30-second epochs during S3 + S4 of NREM sleep (6476 plusmn 1145 P lt 003) In all five moun- tain marathon runners the average LFRRNU during REM sleep was significantly longer (7432 plusmn 1017) than that observed during S3 + S4 (6476 plusmn 1145 P lt 00192) (Table 4) These data indicate that the marker of sympa- thetic modulation (LFRRNU) decreased during deepening of sleep During REM sleep the average value of LFRRNU was similar to that recorded during the awakening period during sleep (W) suggesting that both desynchronized states were supported by an increase in sympathetic tone
342 High Altitude (3480 m) At 3480 m the average LFRRNU values recorded during all four stages of sleep were similar and ranged from 7577 during W 7625 during S1 + S2 6662 during S3 + S4 to 8097 during REM sleep (Table 4)
I GRITTI ET AL
Copyright copy 2013 SciRes JBBS
33
Table 3 Averages of the total power in the low frequency (LF ms2) (004 - 015 Hz) range appear to have a widespread neu-ronal genesis and are considered as a marker of sympathetic modulation or a marker of both sympathetic and vagal modula-tion The LF average was calculated in a physiologically defined number of 30-second signal epochs defined according to the standard criteria developed by Rechtschaffen and Kales (1968) recorded during the waking period during sleep (W) stages S1 + S2 and S3 + S4 of NREM and REM sleep at 122 m and after 30 - 41 h of acclimatisation at 3480 m in the five subjects(1)
Stages Subjects 122 m 3480 m
Epochs Epochs
Awakening during sleep N Mean SD N Mean SD Delta P value
CS 7 5148 2849 35 3163 1400 minus1985 00074
MR 3 10477 3742 3 6780 428 minus3697 ns
GM 13 9656 2978 12 6157 2271 minus3499 00033
DC 140 5083 4655 157 2774 2056 minus2309 00001
SS 27 9619 4825 64 12485 10724 2866 ns
No of epochs 190 271
No of subjects Mean SEM No of subjects Mean SEM Delta
subjects subjects
Average 5 7997 3810 5 6272 3376 minus1725 ns
S1 + S2 Epochs Epochs
N Mean SD N Mean SD Delta P value
CS 45 5946 2294 34 3539 1734 minus2407 00001
MR 58 10118 2699 52 6059 1641 minus4059 00001
GM 53 7692 2871 54 6998 2317 minus694 ns
DC 302 3090 1733 322 3036 1593 minus54 ns
SS 200 10155 6434 237 17947 12895 7792 00001
No of epochs 658 699
No of subjects Mean SEM No of subjects Mean SEM Delta
subjects subjects
Average 5 7400 3206 5 7516 4036 116 ns
S3 + S4 Epochs Epochs
N Mean SD N Mean SD Delta P value
CS 16 3760 1098 9 2276 2427 minus1484 00455
MR 11 8344 2222 6 3917 592 minus4427 00003
GM 9 4352 1275 7 4274 1504 minus78 ns
DC 98 2626 2066 25 2315 1056 minus311 ns
SS 92 5324 6544 59 6245 6031 921 ns
No of epochs 226 106
No of subjects Mean SEM No of subjects Mean SEM Delta
subjects subjects
Average 5 4881 2041 5 3805 2322 minus1076 ns
REM Epochs Epochs
N Mean SD N Mean SD Delta P value
CS 8 6497 1748 5 6105 2640 minus392 ns
MR 23 10159 2790 13 5200 1513 minus4959 00001
GM 10 8005 1910 13 8430 2376 425 ns
DC 62 6727 4144 30 3702 1995 minus3025 00003
SS 72 11509 6775 52 5140 4402 minus6369 00001
No of epochs 175
No of subjects Mean SEM No of subjects Mean SEM Delta
subjects subjects
Average 5 8579 3473 5 5715 2585 minus2864 ns
Footnotes to Table 3 (1)One-way ANOVA revealed no significant changes in the averages of the total power in the low frequency (LF ms2) (004 - 015 Hz) range (DF 73239 F test 13 P = 02819) Post-hoc comparison with Studentrsquos t-test of the average LF value recorded in 175 30-second epochs during REM sleep at sea level was significantly higher (P lt 002) than that recorded in 226 30-second epochs during stages S3 + S4 of NREM sleep at 122 m in all five subjects
I GRITTI ET AL
Copyright copy 2013 SciRes JBBS
34
Table 4 Averages of the total power in the low frequency (004 - 015 Hz) range in normalized units (LF-RR-NU) which is considered as a marker of sympathetic modulation measured in a physiologically defined number of 30-second signal epochs defined according to the standard criteria developed by Rechtschaffen and Kales (1968) recorded during the waking period during sleep (W) stages S1 + S2 and S3 + S4 of NREM and REM sleep at 122 m and after 30 - 41 h of acclimatisation at 3480 m in the five subjects(1)
Stages Subjects 122 m 3480 m Epochs Epochs
Awakening during sleep N Mean SD N Mean SD Delta P value CS 7 7306 625 35 7673 1005 367 ns MR 3 8459 707 3 8466 594 007 ns GM 13 8332 509 12 6003 1826 minus2329 00001 DC 140 6801 1923 157 7499 1752 698 0001 SS 27 5806 1316 64 8243 1395 2437 00001 190 271 No of subjects Mean SEM No of subjects Mean SEM Delta subjects subjects Average 5 7341 1015 5 7577 1314 236 ns
S1 + S2 Epochs Epochs N Mean SD N Mean SD Delta P value CS 45 6677 1570 34 6503 1511 minus173 ns MR 58 7641 945 52 8071 677 430 001 GM 53 7855 791 54 7444 950 minus411 00168 DC 302 5586 1623 322 8061 995 2475 00001 SS 200 5767 1792 237 8047 1271 2280 00001 No of epochs 658 No of subjects Mean SEM No of subjects Mean SEM Delta subjects subjects Average 5 6705 1344 5 7625 1081 minus92 ns
S3 + S4 Epochs Epochs N Mean SD N Mean SD Delta P value CS 16 4727 1123 9 4327 2723 minus385 ns MR 11 6373 1298 6 7390 793 1610 0015 GM 9 7019 1008 7 5953 1140 minus1066 ns DC 98 4584 1691 25 7440 1130 2856 00001 SS 92 3952 1607 59 7593 895 3641 00001 No of epochs 226 106 No of subjects Mean SEM No of subjects Mean SEM Delta subjects subjects Average 5 6476 1145 5 6662 1336 186 ns
REM Epochs Epochs N Mean SD N Mean SD Delta P value CS 8 6797 794 5 7953 587 1156 001748 MR 23 8086 593 13 8900 382 814 00001 GM 10 8383 858 13 7909 798 minus474 ns DC 62 7774 1239 30 8754 638 980 00001 SS 72 6118 1603 52 6967 1722 849 00056 No of epochs 175 113 No of subjects Mean SEM No of subjects Mean SEM Delta subjects subjects Average 5 7432 1017 5 8097 825 665 ns
Footnotes to Table 4 (1)One-way ANOVA revealed significant differences in the averages of the total power in low frequency (004 - 015 Hz) in normalized units (LFRRNU) (DF73239 F = 3229 P lt 00105) Post-hoc analysis with Fisher and Scheffeacute tests revealed that the LF-RR-NU component of the R-R intervals during the W state at 122 m differed significantly from than that during stages S3 + S4 (P = 005) The LF-RR-NU average values during the W state at 3480 m differed significantly from that during stages S3 + S4 (P lt 005) The LF-RR-NU average during stages S1 + S2 at 122 m differed significantly from that during REM sleep at 3480 m (P lt 005) The LF-RR-NU average during stages S1 + S2 recorded at 3480 m differed significantly from that during stages S3 + S4 The LF-RR-NU average during stages S3 + S4 at 122 m differed significantly from that during REM sleep at 122 m (P lt 005) The LF-RR-NU component of the R-R intervals during stages S3 + S4 at 122 m differed significantly from that during REM sleep at 3480 m (P lt 005) The LF-RR-NU average during stages S3 + S4 at 3480 m differed from that during REM sleep at 3480 m (P lt 005) in all five subjects Comparison with Studentrsquos t-test showed a significant difference between the average of the LF-RR-NU recorded in 190 30-second epochs during the waking period during sleep (W) at 122 m (P lt 003) and that recorded in 226 30-second epochs during stages S3 + S4 of NREM sleep at 122 m in all five subjects Comparison with Studentrsquos t-test showed a significant difference (P lt 00192) between the average of the LF-RR-NU in stages S3 + S4 of NREM sleep and that during REM sleep at 122 m in all five subjects
I GRITTI ET AL
Copyright copy 2013 SciRes JBBS
35
343 Sea Level (122 m) and High Altitude (3480 m) The average LFRRNU (Table 4) recorded during W at al- titude was significantly shorter than that recorded at sea level in 15 subjects (GM 6003 plusmn 1826 at 3480 m vs 8332 plusmn 509 at 122 m P lt 00001) and significantly longer in 25 subjects [(DC 7499 plusmn 1752 at 3480 m vs 6801 plusmn 1923 at 122 m P lt 0001) (SS 8243 plusmn 1395 at 3480 m vs 5806 plusmn 1316 at 122 m P lt 00001)]
The average LFRRNU recorded during S1 + S2 at high altitude was significantly longer than that recorded at sea level in 35 subjects [(MR 8071 plusmn 677 at 3480 m vs 7641 plusmn 945 at 122 m P lt 001) (DC 8061 plusmn 995 at 3480 m vs 5586 plusmn 1623 at 122 m P lt 00001) (SS 8047 plusmn 1271 at 3480 m vs 5767 plusmn 1792 at 122 m P lt 00001)] while in 15 the average LFRRNU was signifi- cantly shorter (GM 5953 plusmn 1140 at 3480 m vs 7019 plusmn 1008 at 122 m P lt 00168) in S3 + S4 The average LFRRNU recorded during S3 + S4 at high altitude was significantly longer than that recorded at 122 m in 35 subjects [(MR 7390 plusmn 793 at 3480 m vs 6373 plusmn 1298 at 122 m P lt 00150) (DC 7440 plusmn 1130 at 3480 m vs 4584 plusmn 1691 at 122 m P lt 00001) (SS 7593 plusmn 895 at 3480 m vs 3952 plusmn 1607 at 122 m P lt 00001)] The average LFRRNU recorded during REM sleep at high altitude was significantly longer than that recorded at 122 m in 45 subjects [(CS 7953 plusmn 587 at 3480 m vs 6797 plusmn 794 at 122 m P lt 001748) (MR 8900 plusmn 382 at 3480 m vs 8086 plusmn 593 at 122 m P lt 00001) (DC 8754 plusmn 638 at 3480 m vs 7774 plusmn 1239 at 122 m P lt 00001) (SS 6967 plusmn 1722 at 3480 m vs 6118 plusmn 1603 at 122 m P lt 00056)] These data show a great variabil- ity between mountain marathon runners in LFRRNU when the data set recorded at 122 m is compared with that re- corded at 3480 m Analysis of the data recorded in indi- vidual mountain marathon runners showed an increase in the average LFRRNU at 3480 m demonstrating an in- crease in the marker for sympathetic modulation
35 Total Power of High Frequency [(HF ms2) (015 - 04 Hz)] Range HF Primarily Reflects Respiratory-Driven Vagal Modulation of Sinus Rhythm
351 Sea Level (122 m) No significant differences in the averages of HF were observed between W (2223 plusmn 728) S1 + S2 (2945 plusmn 1080) and S3 + S4 (3891 plusmn 1134) and REM (2499 plusmn 879) stages at low altitude (Table 5) The averages of the HF recorded during the nocturnal sleep-wake cycle at 122 m suggested a prevalence of vagal tone during S3 + S4 stages in comparison with the other sleep stages
352 High Altitude (3480 m) No significant differences in the averages of HF were
observed between W (1572 plusmn 993) S1 + S2 (1610 plusmn 631) and S3 + S4 (1480 plusmn 511) and REM (1159 plusmn 555) stages at 3480 m (Table 5) The averages of the HF recorded during the nocturnal sleep-wake cycle at 3480 m sug- gested a reduction in vagal tone throughout all sleep stages and during awakening during sleep
353 Sea Level (122 m) and High Altitude (3480 m) Compared with the values calculated at sea level there was a significant decrease in the average of total power of high frequency (HF ms2) (Table 5) recorded during W at altitude in 35 subjects [(CS 1422 plusmn 384 at 122 m vs 743 plusmn 191 at 3480 m P lt 00001) (DC 1487 plusmn 729 at 122 m vs 717 plusmn 789 at 3480 m P lt 00001) (SS 4849 plusmn 1587 at 122 m vs 1674 plusmn 1179 at 3480 m P lt 00001)] and a significant increase in 15 subjects (GM 1654 plusmn 400 at 122 m vs 3495 plusmn 2196 at 3480 m P lt 00072)
Compared with the values calculated at sea level there was a significant decrease in the average HF recorded at altitude during S1 + S2 of NREM sleep in 45 subjects [(CS 2485 plusmn 1178 at 122 m vs 1513 plusmn 443 at 3480 m P lt 00001) (MR 2892 plusmn 906 at 122 m vs 1382 plusmn 546 at 3480 m P lt 00001) (DC 2167 plusmn 778 at 122 m vs 605 plusmn 297 at 3480 m P lt 00001) (SS 5375 plusmn 1950 at 122 m vs 2640 plusmn 1385 at 3480 m P lt 00001)] Compared with the averages calculated at 122 m there was a significant decrease in the average HF recorded during S3 + S4 of NREM sleep at 3480 m in 45 subjects [(CS 3776 plusmn 982 at 122 m vs 2044 plusmn 723 at 3480 m P lt 00001) (MR 4624 plusmn 1629 at 122 m vs 975 plusmn 506 at 3480 m P lt 00001) (DC 2617 plusmn 777 at 122 m vs 684 plusmn 249 at 3480 m P lt 00001) (SS 6866 plusmn 1904 at 122 m vs 1394 plusmn 681 at 3480 m P lt 00001)] and a significant increase in 15 subjects (GM 1571 plusmn 376 at 122 m vs 2303 plusmn 396 at 3480 m P lt 00021) There was a significant decrease in the average HF recorded during REM sleep in 45 sub- jects [(CS 2425 plusmn 531 at 122 m vs 1397 plusmn 774 at 3480 m P lt 00155) (MR 2248 plusmn 680 at 122 m vs 615 plusmn 233 at 3480 m P lt 00001) (DC 1530 plusmn 708 at 122 m vs 400 plusmn 149 at 3480 m P lt 00001) (SS 4885 plusmn 1559 at 122 m vs 1671 plusmn 1147 at 3480 m P lt 00001)]
The average HF at 3480 m recorded in individual mountain marathon runners was generally lower than that recorded at 122 m suggesting a decrease in the marker of vagal tone at altitude
36 High Frequency in Normalized Units [(HFRRNU) (004 - 015 Hz)] HFRRNU Is Considered as a Marker of Vagal Modulation
361 Sea Level (122 m) In all five subjects the average of the HFRRNU analyzed
I GRITTI ET AL
Copyright copy 2013 SciRes JBBS
36
Table 5 Averages of the total power in the high frequency (HF ms2) (015 - 04 Hz) range which primarily reflects respira-tory-driven vagal modulation of sinus rhythm in a natural physiologically defined number of 30-second signal epochs ac-cording to the standard criteria developed by Rechtschaffen and Kales (1968) during the waking period during sleep (W) stages S1 + S2 and S3 + S4 of NREM and REM sleep measured at 122 m and after 30 - 41 h of acclimatisation at 3480 m in the five subjects(1)
Stages Subjects 122 m 3480 m
Epochs Epochs
Awakening during sleep N Mean SD N Mean SD Delta P value
CS 7 1422 384 35 743 191 minus679 00001
MR 3 1701 449 3 1232 612 minus469 ns
GM 13 1654 490 12 3495 2196 1841 00072
DC 140 1487 729 157 717 789 minus770 00001
SS 27 4849 1587 64 1674 1179 minus3175 00001
No of epochs 190 271
No of subjects Mean SEM No of subjects Mean SEM Delta
subjects subjects
Average 5 2223 728 5 1572 993 minus651 ns
S1 + S2 Epochs Epochs
N Mean SD N Mean SD Delta P value
CS 45 2485 1178 34 1513 443 minus972 00001
MR 58 2892 906 52 1382 546 minus1510 00001
GM 53 1807 589 54 1909 484 102 ns
DC 302 2167 778 322 605 297 minus1562 00001
SS 200 5375 1950 237 2640 1385 minus2735 00001
No of epochs 658 699
No of subjects Mean SEM No of subjects Mean SEM Delta
subjects subjects
Average 5 2945 1080 5 1610 631 1335 ns
S3 + S4 Epochs Epochs
N Mean SD N Mean SD Delta P value
CS 16 3776 982 9 2044 723 minus1732 00001
MR 11 4624 1629 6 975 506 minus3649 00001
GM 9 1571 376 7 2303 396 732 00021
DC 98 2617 777 25 684 249 minus1933 00001
SS 92 6866 1904 59 1394 681 minus5472 00001
No of epochs 226 106
No of subjects Mean SEM No of subjects Mean SEM Delta
subjects subjects
Average 5 3891 1134 5 1480 511 minus2411 004
REM Epochs Epochs
N Mean SD N Mean SD Delta P value
CS 8 2425 531 5 1397 774 minus1028 00155
MR 23 2248 680 13 615 233 minus1633 00001
GM 10 1409 918 13 1711 472 302 ns
DC 62 1530 708 30 400 149 minus1130 00001
SS 72 4885 1559 52 1671 1147 minus1147 00001
No of epochs 175 113
No of subjects Mean SEM No of subjects Mean SEM Delta
subjects subjects
Average 5 2499 879 5 1159 555 minus1340 ns
Footnotes to Table 5 (1)One-way ANOVA revealed a significant difference between stages in the averages of the total power in the high frequency (HF ms2) (015-04 Hz) range (DF = 73239 F = 2576 P = 00317) Post-hoc Fisher analysis showed significant differences between the averages of HF during W at 122 m and during stages S3 + S4 at 122 m (P lt 005) There was a significant difference between the values measured during W at 3480 m and those during stages S3 + S4 at 122 m (P lt 005) The values measured during stages S1 + S2 at 122 m differed significantly from those during REM sleep at 3480 m in all five subjects
I GRITTI ET AL
Copyright copy 2013 SciRes JBBS
37
in a natural physiologically defined number of 30-sec- ond signal epochs according to standard criteria de- veloped by Rechtschaffen and Kales (1968) during the awakening period during sleep (W 2347 plusmn 946) was significantly shorter than that observed during S3 + S4 of NREM at 122 m (5691 plusmn 3114 P lt 00327) In all five subjects the average of the HFRRNU during S3 + S4 of NREM sleep (5691 plusmn 3114) was significantly longer (P lt 001004) than that observed during REM sleep (2264 plusmn 944 P lt 001004) at 122 m (Table 6) These data sug- gest an increase in vagal modulation during the deepen- ing of slow-wave NREM sleep and a decrease in vagal modulation during the desynchronized awakening period during sleep (W) and REM sleep
362 High Altitude (3480 m) The average of the HFRRNU analyzed between W (2131 plusmn 1108) S1 + S2 (2152 plusmn 976) S3 + S4 (3111 plusmn 1281) of NREM sleep and REM sleep (1674 plusmn 699) was simi- lar (Table 6) The data suggest an increase in vagal mo- dulation during S3 + S4 of slow-wave NREM sleep and a decrease in vagal modulation during the desynchronized awakening period during sleep (W) S1 + S2 of NREM sleep and during REM sleep
363 Sea Level (122 m) and High Altitude (3480 m) The mean of the averages of the HFRRNU (Table 6) re- corded during W at altitude was significantly shorter than that recorded at sea level in 25 subjects (DC 2229 plusmn 1447 at 3480 m vs 3087 plusmn 1875 at 122 m P lt 00001) (SS 1533 plusmn 1165 at 3480 m vs 3349 plusmn 1157 at 122 m P lt 00001)] and significantly longer in 15 subjects (GM 3315 plusmn 1339 at 3480 m vs 1515 plusmn 46 at 122 m P lt 00001) The mean of the averages of the HFRRNU re- corded during S1 + S2 at altitude was significantly shor- ter than that recorded at sea level in 35 subjects (MR 1881 plusmn 671 at 3480 m vs 2317 plusmn 948 at 122 m P lt 001) (DC 1832 plusmn 943 at 3480 m vs 4357 plusmn 1623 at 122 m P lt 0001) (SS 1638 plusmn 1036 at 3480 m vs 3686 plusmn 1723 at 122 m P lt 00001) The mean of the averages of the HFRR-NU recorded during S3 + S4 at al- titude was significantly shorter than that recorded at sea level in 25 subjects [(DC 2442 plusmn 1104 at 3480 m vs 5353 plusmn 1673 at 122 m P lt 00001) (SS 2229 plusmn 830 at 3480 m vs 5554 plusmn 1578 at 122 m P lt 00001)] The mean of the averages of the HFRR-NU recorded during REM sleep at altitude was significantly shorter than that at sea level in 35 subjects [(MR 1057 plusmn 376 at 3480 m vs 1850 plusmn 582 at 122 m P lt 00001) (DC 1156 plusmn 614 at 3480 m vs 2180 plusmn 1224 at 122 m P lt 00001) (SS 2681 plusmn 1455 at 3480 m vs 3215 plusmn 1457 at 122 m P lt 004)]
37 LFHF Ratio Mirrors Sympathovagal Balance or Reflects Sympathetic Modulation
371 Sea Level (122 m) In all five subjects the average of the LFHF ratio during W at 122 m was longer (46446 plusmn 28655) than that ob- served during S3 + S4 (16733 plusmn 10847 P lt 00110) (Table 7) the average of the LFHF ratio during S3+S4 (16733 plusmn 10847) was significantly shorter than that ob- served in 175 epochs of REM sleep (44739 plusmn 21405 P lt 00113) (Table 7) The data suggest an increase of sympathetic modulation during W and REM sleep in comparison of synchronized S1 minus S4 sleep
372 High Altitude (3480 m) The average of the LFHF ratio during S3 + S4 at 3480 m (32109 plusmn 10873) was significantly lower than that ob- served during REM sleep (69132 plusmn 36806 P lt 0036835) The data suggest an increase of sympathetic modulation during REM sleep in comparison to synchro- nized S3 + S4 sleep
373 Sea Level (122 m) and High Altitude (3480 m) The average of the LFHF ratio (Table 7) during W was significantly shorter at 3480 m than at 122 m in 15 sub- jects (GM 61615 plusmn 24214 at 122 m vs 23017 plusmn 13728 at 3480 m P lt 00001) and significantly longer at 3480 m than at 122 m in 25 subjects [(DC 49300 plusmn 62275 at 122 m vs 72334 plusmn 10049 at 3480 m P lt 00235) (SS 21570 plusmn 14672 at 122 m vs 94181 plusmn 81271 at 3480 m P lt 00001)] The average LFHF ratio during S1 + S2 was significantly longer at 3480 m than at 122 m in 35 subjects [(MR 50512 plusmn 23613 at 3480 m vs 39624 plusmn 18413 at 122 m P lt 00078) (DC 61907 plusmn 43641 at 3480 m vs 17193 plusmn 13779 at 122 m P lt 00001) (SS 79224 plusmn 67405 at 3480 m vs 23667 plusmn 216997 at 122 m P lt 00001)] and significantly shorter in 15 subjects (GM 39050 plusmn 16255 at 3480 m vs 46160 plusmn 20671 at 122 m P lt 00503) The average LFHF ratio was sig- nificantly longer at high altitude than at sea level during S3 + S4 in 35 subjects [(MR 46867 plusmn 18516 at 3480 m vs 21655 plusmn 12576 at 122 m P lt 00043) (DC 37484 plusmn 17785 at 3480 m vs 12203 plusmn 14342 at 122 m P lt 00001) (SS 40205 plusmn 23448 at 3480 m vs 09542 plusmn 10418 at 122 m P lt 00001)] The average LFHF ratio was significantly longer (P lt 00102 - 00001) during REM sleep at high altitude than at sea level in 45 sub- jects [(CS 47380 plusmn 14928 at 3480 m vs 28163 plusmn 09832 at 122 m) (MR 98554 plusmn 43032 at 3480 m vs 48217 plusmn 15891 at 122 m) (DC 10520 plusmn 66211 at 3480 m vs 52563 plusmn 37020 at 122 m) (SS 41387 plusmn 39490 at 3480 m vs 27194 plusmn 20375 at 122 m)]
At 122 m and at 3480 m there was a decrease in the LFHF ratio during deepening of NREM sleep indicating
I GRITTI ET AL
Copyright copy 2013 SciRes JBBS
38
Table 6 Averages of the total power in the high frequency (004 - 015 Hz) range in normalized units (HFRRNU) which is considered as a marker of vagal modulation in a natural physiologically defined number of 30-second signal epochs ac-cording to standard criteria developed by Rechtschaffen and Kales (1968) during the waking period during sleep (W) stages S1 + S2 and S3 + S4 of NREM and REM sleep recorded at 122 m and after 30 - 41 h of acclimatisation at 3480 m in the five subjects(1)
Stages Subjects 122 m 3480 m Epochs Epochs
Awakening during sleep N Mean SD N Mean SD Delta P value CS 7 2310 610 35 2105 979 minus205 ns MR 3 1475 628 3 1500 608 025 ns GM 13 1515 460 12 3315 1339 1800 00001 DC 140 3087 1875 157 2229 1447 minus858 00001 SS 27 3349 1157 64 1533 1165 minus1816 00001 No of epochs 190 No of subjects Mean SEM No of subjects Mean SEM Delta subjects subjects Average 5 2347 946 5 2131 1108 minus211 ns
S1 + S2 Epochs Epochs N Mean SD N Mean SD Delta P value CS 45 2929 1537 34 3235 1489 minus174 ns MR 58 2317 948 52 1881 671 minus436 001 GM 53 1997 745 54 2172 739 175 ns DC 302 4357 1623 322 1832 943 minus2524 0001 SS 200 3686 1723 237 1638 1036 minus2048 00001 No of epochs 658 699 No of subjects Mean SEM No of subjects Mean SEM Delta subjects subjects Average 5 3057 1315 5 2152 976 minus906
S3 + S4 Epochs Epochs N Mean SD N Mean SD Delta P value CS 16 4799 1184 9 5507 2698 708 ns MR 11 3590 1294 6 1953 802 minus1638 ns GM 9 2650 755 7 3426 997 776 ns DC 98 5353 1673 25 2442 1104 minus2911 00001 SS 92 5554 1578 59 2229 830 minus364 00001 No of epochs 226 106 No of subjects Mean SEM No of subjects Mean SEM Delta subjects subjects Average 5 5691 3114 5 3111 1281 minus2580 ns
REM Epochs Epochs N Mean SD N Mean SD Delta P value CS 8 2643 812 5 1787 431 minus856 ns MR 23 1850 582 13 1057 376 minus793 0001 GM 10 1431 646 13 1691 618 260 ns DC 62 2180 1224 30 1156 614 minus1024 00001 SS 72 3215 1457 52 2681 1455 minus534 00461 No of epochs 175 113 No of subjects Mean SEM No of subjects Mean SEM Delta subjects subjects Average 5 2264 944 5 1674 699 minus590 ns
Footnotes to Table 6 (1)One-way ANOVA of the averages of the total power in the high frequency (004 - 015 Hz) range in normalized units (HF-RR-NU) showed significant differences between conditions (DF73239 F 4071 P lt 00027) Post-hoc analysis demonstrated a significant difference between the average HF-RR-NU during W at 122 m and that during stages S3 + S4 at 122 m (P lt 005) The averages of HF-RR-NU during W at 3480 m differed significantly from those during stages S3 + S4 at 122 (P lt 005) The averages of HF-RR-NU during W at 122 m differed significantly from those during stages S3 + S4 at 122 m (P lt 005) The average of HF-RR-NU during stages S1 + S2 at 122 m differed significantly from that during stages S3 + S4 at 3480 m (P lt 005) The average of HF-RR-NU during stages S1 + S2 at 3480 m differed significantly from that during stages S3 + S4 at 122 m (P lt 005) The average of HF-RR-NU during stages S3 + S4 at 122 m differed significantly from that during stages S3 + S4 at 3480 m (P lt 005) The average of HF-RR-NU during stages S3 + S4 at 122 m differed significantly from that during REM sleep at 122 m (P lt 005) The average of HF-RR-NU during stages S3 + S4 at 122 m differed significantly from that during stages S3 + S4 at 3480 m (P lt 005) The average of HF-RR-NU during stages S3 + S4 at 3480 m differed significantly from that during REM sleep at 3480 m (P lt 005) in all five subjects Comparison with Studentrsquos t-test of the average of the HF-RR-NU in a natural physiologically defined number of 30-second signal epochs according to standard criteria developed by Rechtschaffen and Kales (1968) during the waking period during sleep (W) differed significantly from that during stages S3 + S4 of NREM sleep at 122 m in all five subjects (P lt 00327) Comparison with Studentrsquos t-test of the average of the HF-RR-NU in a natural physiologically defined number of 30-second signal epochs according to standard criteria developed by Rechtschaffen and Kales (1968) during stages S3 + S4 of NREM sleep differed significantly from that during REM sleep at 122 m in all five subjects (P lt 001004)
I GRITTI ET AL
Copyright copy 2013 SciRes JBBS
39
Table 7 Averages of the ratio of low frequencyhigh frequency (LF ms2HF ms2) range which mirrors sympathovagal bal-ance or reflects sympathetic modulation in a physiologically defined number of 30-second signal epochs according to stan-dard criteria developed by Rechtschaffen and Kales (1968) during the waking period during sleep (W) stages S1 + S2 and S3 + S4 of NREM sleep and REM sleep at 122 m and after 30 - 41 h of acclimatisation at 3480 m in the five subjects(1)
Stages Subjects 122 m 3480 m
Epochs Epochs
Awakening during sleep N Mean SD N Mean SD Delta P value
CS 7 347 14415 35 45477 22645 10777 ns
MR 3 6513 277 3 6517 3324 0004 ns
GM 13 61615 24214 12 23017 13728 minus38598 00001
DC 140 493 62275 157 72334 10049 23034 00235
SS 27 2157 14672 64 94181 81271 72611 00001
No of epochs 190 271
No of subjects Mean SEM No of subjects Mean SEM Delta
subjects subjects
Average 5 46446 28655 5 60036 50276 1357 ns
S1+ S2 Epochs Epochs
N Mean SD N Mean SD Delta P value
CS 45 29293 15299 34 25515 13856 minus03778 ns
MR 58 39624 18413 52 50512 23613 10888 00078
GM 53 4616 20671 54 3905 16255 minus0711 00503
DC 302 17193 13779 322 61907 43641 44714 00001
SS 200 23667 21697 220 79224 67405 55557 00001
No of epochs 658 683
No of subjects Mean SEM No of subjects Mean SEM Delta
subjects subjects
Average 5 31187 17972 5 51242 32954 2007 ns
S3+ S4 Epochs Epochs
N Mean SD N Mean SD Delta P value
CS 16 10919 0477 9 16633 22308 05714 ns
MR 11 21655 12576 6 46867 18516 25212 00043
GM 9 29344 12127 7 19357 0831 minus09987 ns
DC 98 12203 14342 25 37484 17785 25281 00001
SS 92 09542 10418 59 40205 23448 325 00001
No of epochs 226
No of subjects Mean SEM No of subjects Mean SEM Delta
subjects subjects
Average 5 1633 10847 5 32109 18073 1538 ns
REM Epochs Epochs
N Mean SD N Mean SD Delta P value
CS 8 281163 5 4738 14928 19217 00166
MR 23 482217 13 98554 43032 50337 00001
GM 10 6756 13 53138 20368 minus14422 ns
DC 62 52563 30 1052 66211 5264 00001
SS 72 27194 52 41387 3949 1493 00102
No of epochs 175 113
No of subjects Mean SEM No of subjects Mean SEM Delta
subjects subjects
Average 5 44739 5 69132 36806 2439 ns
Footnotes to Table 7 (1)One-way ANOVA showed no significant differences in the LFHF ratio in the different conditions Studentrsquos t-test showed that the average of the total power of the LFHF ratio during the waking state during sleep (W) (190 epochs) at 122 m was generally higher than the average LFHF ratio during stages S3 + S4 (226 epochs) at the same altitude in the five subjects (P lt 00110) Studentrsquos t-test showed that the average of the total power of the LFHF ratio during stages S3 + S4 in a total of 226 epochs of 30 seconds at low altitude was significantly lower than that in 175 epochs of REM sleep at 122 m in the five subjects (P lt 0011335) Studentrsquos t-test showed that the average of the total power of the LFHF ratio during stages S3 + S4 (106 epochs) at 3480 m was significantly lower than that during REM sleep (113 epochs) at high altitude in the five subjects (P lt 0036835)
I GRITTI ET AL
Copyright copy 2013 SciRes JBBS
40
a decline in sympathovagal balance At 122 m and at 3480 m the average values of LFHF during REM sleep were similar to those observed during the awakening period during sleep (W)
38 Total Power (TP ms2)
381 Sea Level (122 m) The average of the TP during the awakening period dur-ing sleep (W 33057 plusmn 18136) differed significantly from that recorded during S3 + S4 (13007 plusmn 4621 P lt 00068) During S3 + S4 of NREM sleep (13007 plusmn 4621) the average of the TP differed significantly from that observed during REM sleep (28480 plusmn 14192 P lt 0003341) (Table 8) The TP during REM sleep was similar to the TP values recorded during W
382 High Altitude (3480 m) During S3 + S4 of NREM sleep (9202 plusmn 3805) the av-erage of the TP differed significantly from that observed during REM sleep (22838 plusmn 11600 P lt 0002613) in all five subjects
383 Sea Level (122 m) and High Altitude (3480 m) (Table 8)
During W the average of the total power (TP ms2) re- corded at 122 m was longer than that recorded at 3480 m in 25 subjects [(MR 50528 plusmn 7837 at 122 m vs 30899 at 3480 m P lt 00254) (DC 17740 plusmn 23122 at 122 m vs 11197 plusmn 11829 at 3480 m P lt 00020)] (Table 8) During S1 + S2 the average of the TP at low altitude was significantly longer than that observed at 3480 m in 35 subjects [(MR 21950 plusmn 8436 at 122 m vs 16258 plusmn 9971 at 3480 m P lt 00015) (GM 20200 plusmn 11240 at 122 m vs 15218 plusmn 7421 at 3480 m P lt 00079) (DC 7240 plusmn 2998 at 122 m vs 6021 plusmn 3589 at 3480 m P lt 000019)] During S3 + S4 the average of the TP at 122 m was sig- nificantly longer than that observed at 3480 m in 45 sub- jects (CS 13176 plusmn 3660 at 122 m vs 8733 plusmn 5824 at 3480 m P lt 00275) (MR 17278 plusmn 4805 at 122 m vs 6865 plusmn 720 at 3480 m P lt 00001) (DC 6917 plusmn 3007 at 122 m vs 5262 plusmn 4686 at 3480 m P lt 00307) (SS 15005 plusmn 5017 at 122 m vs 10516 plusmn 9526 at 3480 m P lt 00002) At 3480 m during the awakening period during sleep (W 25672 plusmn 15424) the average of the TP dif- fered significantly from that recorded during S3 + S4 (9202 plusmn 3805 P lt 0028) The average of the TP re- corded during REM sleep at sea level was significantly shorter than that at altitude in 25 subjects (CS 39198 plusmn 13892 at 122 m vs 22879 plusmn 8514 at 3480 m P lt 00320) (SS 25442 plusmn 11874 at 122 m vs 14723 plusmn 7978 at 3480 m P lt 00001)
At 122 m and at 3480 m there was a decrease in TP during deepening of NREM sleep At 122 m and at 3480
m the average values of TP during REM sleep were simi- lar to those observed during awakening during sleep (W)
4 Discussion
Fluctuations in autonomic cardiovascular regulation dur- ing exposure to high-altitude environment may increase the risk of heart attack This study compared heart rate variability (HVR) and its components during sleep at low altitude and after 30 - 41 hours of acclimatization at high altitude (3480 m) in mountain marathon runners controlled for diet drugs light-dark cycle and jet lag dif- ferences At altitude RR-intervals became significantly shorter (P lt 0001) The significant changes in sympa- theticparasympathetic autonomic cardiovascular modu- lation at high altitude can protect against excessive oxy- gen deprivation particularly during sleep and thus lower the risk of heart attack Increase in R-R intervals during wake and sleep may require longer periods of acclimati-zation at 3480 m to mitigate the effects of altitudehypo- xia on the sympathetic tone of the mountain marathon runners thus reducing cardiovascular distress
5 Background
Molecular oxygen is essential for all higher forms of life and brain cell function During evolution humans and other animal species developed molecular biochemical and physiological mechanisms to optimize oxygen utili- zation efficacy Humans respond to acute or chronic ex- posure to hypobaric-hypoxia by resetting the pO2 balance to ensure brain and heart cell function Understanding how the body adjusts its biochemical and physiological cellular needs may help to better define the health risks associated with activities in hypobaric-hypoxia condi- tions and can aid in identifying appropriate therapeutic non-pharmacological andor pharmacological treatments Our ability to breathe and to modify breathing according to the amount of available ambient oxygen and to our bodyrsquos demands (particularly those of the brain heart and lungs) is essential for survival Failure to breathe or an inadequate oxygen supply especially to the brain contributes to cardiorespiratory distress In hypoxic con- ditions distribution of cardiac output to the cardiovascu- lar beds is subordinate to a preprogrammed priority pro- gram for preservation of the organism In hypoxic condi- tions the majority of neuronal systems of the brain in- crease andor change their firing rate in order to modulate in a cyclic manner the discharge of the neurons involved in regulating the oxygen supply in mammals [151618 19]
Acute and chronic exposure to hypoxemia leads to all sorts of disturbances that suggest impaired excitatory neuronal functions involved in the behavioral and meta- bolic integration of autonomic control and arousal [15]
I GRITTI ET AL
Copyright copy 2013 SciRes JBBS
41
Table 8 Averages of the total power (TP ms2) in a physiologically defined number of 30-second EEG signal epochs accord-ing to standard criteria developed by Rechtschaffen and Kales (1968) during the waking state during sleep (W) stages S1 + S2 and S3 + S4 of NREM sleep and REM sleep at 122 m and after 30 - 41 h of acclimatisation at 3480 m in the five subjects
Stages Subjects 122 m 3480 m Epochs Epochs
Awakening during sleep N Mean SD N Mean SD Delta P value CS 7 33449 24257 35 25486 16753 minus7963 ns MR 3 50528 7837 3 30899 5845 minus19629 00254 GM 13 29277 9809 12 28573 22336 minus704 ns DC 140 17740 23122 157 11197 11829 minus6543 0002 SS 27 34293 25655 64 32203 20358 minus2090 ns No of epochs 190 271 No of subjects Mean SEM No of subjects Mean SEM Delta subjects subjects Average 5 33057 18136 5 25672 15424 minus7385 ns
S1+ S2 Epochs Epochs N Mean SD N Mean SD Delta P value CS 45 29292 16380 34 22533 13712 minus6758 MR 58 21950 8436 52 16258 9971 minus5692 ns GM 53 20200 11240 54 15218 7421 minus4982 00015 DC 302 7420 2998 322 6021 3589 minus1398 00079 SS 200 25316 18423 237 29006 16917 3690 00001 No of epochs 658 683 00297 No of subjects Mean SEM No of subjects Mean SEM Delta subjects subjects Average 5 20836 11495 5 17807 10322 minus3028 ns
S3+ S4 Epochs Epochs N Mean SD N Mean SD Delta P value CS 16 13176 3660 9 8733 5824 minus4443 00275 MR 11 17278 4805 6 6865 720 minus10412 00001 GM 9 12659 6614 7 11634 6801 minus1025 ns DC 98 6917 3007 25 5262 4686 minus1655 00307 SS 92 15005 5017 59 10516 9526 minus4489 00002 No of epochs 226 106 No of subjects Mean SEM No of subjects Mean SEM Delta subjects subjects Average 5 130007 4621 5 9202 3805 minus3798 ns
REM Epochs Epochs N Mean SD N Mean SD Delta P value CS 8 39198 13892 5 29459 13908 minus938 ns MR 23 33035 14907 13 22879 8514 minus10156 0032 GM 10 23552 6159 13 29734 9673 6182 ns DC 62 21174 24128 30 17396 17929 minus3778 ns SS 72 25442 11874 52 14723 7978 10719 00001 No of epochs 175 113 No of subjects Mean SEM No of subjects Mean SEM Delta subjects subjects Average 5 28480 14192 5 22838 116000 minus5642 ns
Footnotes to Table 8 (1)One-way ANOVA showed a significant difference in the average of the total power (TP) between conditions (DF 73239 F = 5433 P = 00004) Post-hoc Fisher analysis revealed a significant difference between the average of the TP recorded at 122 m during waking (W) and that recorded at 122 m during stages S1 + S2 (P lt 005)and during stages S3 + S4 (P lt 005) Post-hoc Fisher analysis revealed a significant difference between the average of the TP recorded at 122 m during waking (W) and that at 3480 m during stages S1 + S2 (P lt 005) and stages S3 + S4 (P lt 005) Post-hoc Fisher analysis revealed a significant difference between the average of the TP recorded at 122 m during waking (W) and that at 3480 m during REM sleep (P lt 005) Post-hoc Fisher analysis revealed a significant difference between the average of the TP recorded at 3480 m during stages S3 + S4 and that at 122 m during stages S3 + S4 (P lt 005) Post-hoc Fisher analysis revealed a significant difference between the average of the TP recorded at 122 m during stages S1 + S2 and that at 3480 m dur- ing REM sleep (P lt 005) Post-hoc Fisher analysis revealed a significant difference between the average of the TP recorded at 3480 m during stages S1 + S2 and that at 122 m during REM sleep (P lt 005) Post-hoc Fisher analysis revealed a significant difference between the average of the TP recorded at 122 m during stages S3 + S4 and that at 122 m during REM sleep (P lt 005) Post-hoc Fisher revealed a significant difference between the average of the TP recorded at 3480 m during stages S3 + S4 and that at 122 m during REM sleep (P lt 005) Post-hoc Fisher analysis revealed a significant difference between the average of the TP recorded at 3480 m during stages S3 + S4 and that at 3480 m during REM sleep (P lt 005) in the five subjects Post-hoc analysis with Studentrsquos t-test showed a significant difference (P lt 005) between the average of the total power (TP ms2) in a physiologically defined number of 30-second signal epochs according to standard criteria developed by Rechtschaffen and Kales (1968) recorded during the waking state during sleep (W) (190 epochs) and that during stages S3 + S4 (226 epochs) at 122 m (P lt 00068) in the five subjects Post-hoc analysis with Studentrsquos t-test showed a significant difference (P lt 0028) between the average of the total power (TP ms2) in a physiologically defined number of 30-second signal epochs according to standard criteria developed by Rechtschaffen and Kales (1968) recorded during the waking state during sleep (W) (271 epochs) and that during stages S3 + S4 (106 epochs) at 3480 m in the five subjects Post-hoc analysis with Studentrsquos t-test showed a significant difference (P lt 0003341) between the average of the total power (TP ms2) in a physio-logically defined number of 30-second signal epochs according to standard criteria developed by Rechtschaffen and Kales (1968) recorded during stages S3 + S4 (226 epochs) and that during REM sleep (175 epochs) at 122 m in the five subjects Post-hoc analysis with Studentrsquos t-test showed a significant difference (P lt 0002613) between the average of the total power (TP ms2) in a physiologically defined number of 30-second signal epochs according to standard criteria devel-oped by Rechtschaffen and Kales (1968) recorded during stages S3 + S4 (106 epochs) and that during REM sleep (113 epochs) at 3480 m in the five subjects
I GRITTI ET AL
Copyright copy 2013 SciRes JBBS
42
Research into the causes of cardiovascular mortality ex- perimental evidence for a predisposition to fatal arrhyth- mias signs of tonic or phasic increased sympathetic ac- tivity and reduced parasympathetic-cholinergic-vagal ac- tivity has advanced efforts for the development of quan- titative markers of heart rate variability (HRV) (Task Force [1])
51 Heart Rate Variability during Wake and Sleep
HRV has been established as a non-invasive tool to study cardiac autonomic activity and proposed as a predictor for evaluating the increased risk of cardiac death Inter- actions of changes in cardiac autonomic nervous modu- lation in various types of subjects are under study by the Task Force [1] An overnight declining trend of HRV has been found to increase during sleep [14] Otzenberger and co-workers [14] demonstrated that overnight profiles of the R-R intervals are related to changes in the sleep EEG mean frequency sign which reflects the depth of sleep During attentive-to-quiet waking and from the lighter to the deeper phases of sleep HRV has been shown to be affected by vagalsympathetic modulation and control
52 Heart Rate Variability and Mountain Marathon Runners
Past studies showed that the high-altitude endurance per- formance of mountain marathoners is appreciably re- duced at 5200 m Based on their clinical characteristics mountain marathoners can be considered as a physio- logical model for studying cardiovascular alterations of long-lasting stay and exercise at high altitude Over the last 12 years the time course of cardiovascular changes in the mountain marathon runners has been assessed be- fore during and after the end of races at altitude In sea- level native mountain marathoners long-lasting training mdashfrom sea level to altitudemdashcan lower the HR during rest and exercise associated with a decrease in sympa- thetic modulation and a rise in parasympathetic activity [20] As in normal subjects so too in well-trained moun- tain marathoners cardiovascular modifications can change continuously over a 24-h period during acclimatization and the nocturnal sleep-wake-cycle at low and high alti- tudes In mountain marathoners just as in normal sub- jects HRV alterations at altitude may include altered resting HR due to changes in the vagal and sympathetic components besides the appearance of sinus arrhythmia during waking and periodically during nocturnal S1 + S2 NREM sleep and REM sleep breathing
As suggested by the Task Force [1] the present study data were obtained during sleep and as such may add valuable insights for research into HRV With this study we also wanted to determine whether 20 years of training
between 122 m and 5200 m altitude could have exerted in addition to the changes reported elsewhere [912] a high impact on the autonomiccardiovascular systems of the mountain marathon runners during the nocturnal sleep- wake cycle at low and at high altitudes
Our study documents that in mountain marathoners the nocturnal sleep-wake cycle at 122 m is highly influ- ence by autonomic parasympathetic activity and by in- creased autonomic parasympathetic activity during the deepening of NREM sleep The results also show a phy- siological decrease in parasympathetic activity versus an increase in sympathetic activity during all phases of the nocturnal sleep-wake cycle at 3480 m Surprisingly our study also documents that the nocturnal sleep-wake cycle at 3480 m is still characterized by an increase in auto- nomic parasympathetic activity during light S1 + S2 NREM sleep At both altitudes the trend of the balance of parasympatheticsympathetic activity recorded during REM sleep is similar to that recorded during the awak- ening state (W)
53 R-R Intervals (ms)
531 Sea Level (122 m) The averages of the R-R intervals recorded at 122 m did not change significantly between nocturnal awakenings during sleep and sleep stages (R-R interval range 1200 - 1300 ms) The average R-R interval at 122 m during the awaking state of sleep was similar to that recorded dur- ing the wake state in 12 trained endurance athletes who performed a minimum of 3 h of aerobic activity per week [21]
532 High Altitude (3480 m) The majority of the ECG alterations in the five mountain runners during sleep at an altitude of 3480 m and at a barometric pressure (PB) of 495 mm Hg and between 30 and 41 h of acclimatization were signs of sinus arrhyth- mia during the early stages (S1 + S2) of NREM sleep and during REM sleep At 3480 m the average of the R-R intervals we recorded during S1 + S2 of NREM sleep were significantly longer than those observed during the awaking period (W) during sleep The longest average R-R intervals were recorded during S1 + S2 at 3480 m These results suggest that at altitude there was still a significant elevation of parasympathetic tone during S1 + S2 of slow-wave sleep versus the waking state during sleep at 3480 m
533 Sea Level (122 m) and High Altitude (3480 m) There was a nonpathological significant reduction in the R-R intervals during the awakening period during sleep (W) S1 + S2 S3 + S4 of NREM and REM sleep stages and after 30 - 41 h of acclimatization to an altitude of
I GRITTI ET AL
Copyright copy 2013 SciRes JBBS
43
3480 m versus the averages of the R-R intervals ob- served during the same stages at 122 m
The longest average R-R intervals were recorded dur- ing the light stage of slow-wave-sleep (S1 + S2) at 122 m (suggesting high vagal activation) and the lowest aver- age R-R intervals were recorded during the awakening period during sleep (W) at 3480 m (indicating an in- crease in noradrenergic activation) Overall the average R-R intervals at high altitude were significantly lower than those recorded at 122 m with the average R-R in- tervals we recorded at 3480 m even during the awaken- ing period (W) during sleep (935 ms) The absolute value of the R-R intervals Bernardi and co-workers [22] found in 10 sea-level native subjects at low altitude was 1002 plusmn 45 ms and 809 plusmn 116 ms in 3 high-altitude native sub- jects living at low altitude In that study the average R-R intervals in the 10 sea-level native subjects and in 3 high- altitude native subjects (living at low altitude) exposed to 4970 m for 3 days were 775 plusmn 57 and 749 plusmn 47 respec- tively The delta of the averages of the R-R intervals that we calculated in our subjects after exposure to 3480 m was similar to the delta of the R-R intervals Bernardi and co-workers [22] reported In our study the average R-R intervals recorded at 122 m and 3480 m during all sleep stages were also longer than those observed by Lanfran- chi and co-workers [2] in 41 mountaineers during wak- ing with and without AMS and after acute exposure to approximately 4500 m Overall the average R-R inter- vals we recorded at 122 m and 3480 m demonstrate that frequent exposure to altitudes between 122 m and 5500 m for more than 20 years may have improved the effi- cacy of vagal modulation at low and high altitude during nocturnal awakening and sleep
54 Simple Linear Regression Analysis between the R-R Intervals and the SpaO2
Linear regression analysis showed a significant negative correlation between the changes in the average SpaO2 and the changes in the average R-R intervals The sig- nificant negative correlation between SpaO2 and R-R intervals may indicate that the average quantity of oxy- gen supplied during nocturnal sleep stages may be di- rectly responsible for the R-R interval changes observed during nocturnal sleep particularly at high altitude
55 Total Power of Very Low Frequency [(VLF ms2) (lt004 Hz)] Such as the Thermoregulation-Related HRV
The thermoregulatory-related very low frequency (VLF) rhythm may be related to thermoregulatory changes or chemical and acid-base equilibrium changes or both In- terestingly the changes in the VLF are significantly co- related with the PCO2 changes (personal observations
DF13839 R-squared = 0191 coefficient = ndash970294 Ftest = 8982 P = 00048 t = 1146) tCO2 changes (personal observations DF13839 R-squared = 0189 coefficient = ndash21649785 Ftest = 8871 P = 0005 t = 2978) and
3HCOminus changes (personal observations DF13839 R- squared = 0184 coefficient = ndash21682826 Ftest = 8557 P = 00058 t = 2925)
551 Sea Level (122 m) At 122 m the average VLF decreased during S1 + S2 and significantly so during S3 + S4 compared with the average VLF recorded during the waking period (W) The average VLF during S3 + S4 at 122 m was signifi- cantly shorter than the average VLF recorded during the awakening period (W) during sleep The average VLF during S3 + S4 at 122 m was shorter than the average VLF recorded during REM sleep At 122 m there was a decrease in the average VLF during NREM sleep and an increase in VLF during the desynchronized waking state The average VLF during desynchronized REM sleep at 122 m was slightly shorter than the average VLF re- corded during the awakening period (W) during sleep
552 High Altitude (3480 m) At 3480 m the average VLF decreased during S1 + S2 and significantly so during S3 + S4 compared with the average VLF recorded during the awaking period (W) during sleep The average VLF during S3 + S4 at 3480 m was significantly shorter than the average VLF recorded during the awakening period (W) during sleep At 3480 m there was a decrease in the average VLF during NREM sleep and an increase during the desynchronized awaking state during sleep and REM sleep The average VLF during REM sleep at 3480 m was slightly shorter than that observed during the awakening period (W) dur- ing sleep
553 Sea Level (122 m) and High Altitude (3480 m) The average VLF during the awakening period (W) dur- ing sleep S1 + S2 S3 + S4 and REM sleep at 122 m was longer but not significantly so compared with the average VLF observed at 3480 m
56 Total Power of Low Frequency [(LF ms2) (004 - 015 Hz)] Range The LF Appears to Have a Widespread Neuronal Genesis and Is Considered as a Marker of Sympathetic Modulation or a Marker of Both Sympathetic and Vagal Modulation
561 Sea Level (122 m) Statistical analysis of our data revealed that the average of the LF during desynchronized REM sleep at 122 m was significantly longer than that recorded during syn-
I GRITTI ET AL
Copyright copy 2013 SciRes JBBS
44
chronized S3 + S4 sleep These data demonstrate an in- crease in parasympathetic tone during REM sleep
562 High Altitude (3480 m) In altitude there was a significant increase in sympathetic tone throughout the awakening period (W) during sleep the S1 + S2 and the REM sleep The sympathetic tone decreased during the deep phase of slow wave sleep (S3 + S4)
563 Sea Level (122 m) and High Altitude (3480 m) No significant changes were found between the average LF recorded at 122 m and that recorded at 3480 m How- ever in some subjects a significant decrease emerged between the average of LF recorded during the awaken- ing period (W) during sleep S1 + S2 S3 + S4 and REM sleep at 122 m versus the average of LF recorded at 3480 m
The average LF recorded in all 5 mountain marathon- ers and in all 4 stages of desynchronization and synchro- nization at 122 m and at 3480 m (Table 3) were longer than the average LF Ako and co-workers [3] observed in 7 subjects during sleep at sea level
We also found a decrease in the average LF during S3 + S4 at 122 m and 3480 m compared with the average LF recorded during S1 + S2 The average LF recorded in our study during the desynchronized REM sleep state at 122 m and 3480 m returned to similar values we recorded during the desynchronized awakening period (W) during sleep A comparison of LF indices in the different sleep stages recorded at 122 m and at 3480 m revealed a de-crease in the LF from the waking to the deep stages of sleep The average LF during REM sleep was similar to the average LF recorded during waking Like those of Ako and co-workers [3] our data suggest that sympa- thetic nervous activity decreases as sleep deepens and concomitantly increases during desynchronization of the awakening period (W) during sleep and even more so during desynchronization during REM sleep In our study the average LF a marker of sympathetic modulation during the awakening period (W) during sleep S1 + S2 S3 + S4 and REM sleep at 122 m and at 3480 m was lower
57 LFRRNU
The aim of this study was also to verify whether auto- nomic variables at low altitude could predict prodromic signs of AMS when subjects were exposed to high alti- tude or whether subjects experienced AMS at high alti- tude Autonomic cardiovascular function was also ex- plored by measuring widespread neuronal genesis rhythm low frequency in normalized unit (LFRRNU) to study sympathetic modulation
Lanfranchi and co-workers [2] reported a substantial increase in the LFRRNU component at altitude suggest- ing an increase in sympathetic modulation in response to hypoxia at 4500 m During exposure to high altitude besides shorter R-R intervals we also found a relative though not significant increase in the LFRRNU compo- nent
We agree with Lanfranchi and co-workers [2] that this increase in the LFRRNU component may reflect an in- crease in the sympathetic modulation of HR During ex- posure to 3480 m R-R interval variability decreased as the LF component increased suggesting an increase in sympathetic modulation in response to hypobaric-hypo- xia The average LFRRNU Lanfranchi and co-workers [2] recorded in 24 subjects without AMS after exposure to approximately 4500 m during waking was similar to the average we recorded in our subjects during the awaken- ing period (W) during sleep at 3480 m (73 vs 75 respec- tively)
LFRRNU has been said to be a quantitative marker of the cardiac vigil (Vanderwalle et al [23]) and sympa- thetic outflow of the autonomic nervous system By means of spectral analysis of subjects in supine position the Task Force [1] calculated an average LFRRNU of 54 which is fairly similar to the average values in 45 of our subjects 47 in CS 45 in DC and 39 in SS in supine po- sition during S3 + S4 at 122 m Overall the average LFRRNU reported by the Task Force [1] is somewhat lower than our data (54 vs 39 - 89 respectively)
From a steady-state HRV analysis Murrel and co- workers [24] found an average LFRRNU of 77 in the standing position and premarathon conditions an average between 72 and 92 immediately after a marathon and an average of 73 in the standing position at 48 h postmara- thon These data appear similar to the data we recorded at 122 m and 3480 m during the awakening S1 + S2 S3 + S4 and REM stages of sleep
Specifically at 122 m there was a decrease in LFRRNU as sleep depth increased during the desynchronized phase of sleep (the awakening state) the LFRRNU reached the values observed during REM sleep At 3480 m there was a decrease in LFRRNU as sleep deepened during the de- synchronized phase of sleep (the awakening state) the LFRRNU reached the values recorded during the REM phases at 3480 m
58 High Frequency
Efferent vagal activity is a major contributor to the high frequency (HF) component (Task Force [1]) which pri- marily reflects respiration-driven vigil modulation of the sinus rhythm Other factors such as voluntary controlled respiration cold stimulation of the face or rotational mo- tor stimuli (see above) can occur physiologically during
I GRITTI ET AL
Copyright copy 2013 SciRes JBBS
45
sleeping and might confound results Spectral analysis of stationary supine subjects revealed an average normal HF close to 975 ms2 (Task Force [1]) Saito and co-workers [25] reported an average HF of 780 plusmn 211 ms2 in 21 sub- jects during waking at low altitude and an average HF between 61 plusmn 44 and 112 plusmn 128 ms2 after exposure for 4 - 6 h at PB 495 mm Hg Lanfranchi and co-workers [2] reported an average HF between 102 plusmn 37 and 157 plusmn 43 ms2 in subjects exposed to approximately 4500 m or between 135 plusmn 30 and 64 plusmn 4 ms2 in those with no signs of AMS Briefly in the subjects without AMS there was a non significant increase in the HF component At low altitude the average HF in our five mountain marathon runners increased as sleep deepened and decreased dur- ing REM sleep to levels similar to those observed in the waking state The average HF at altitude was 1572 ms2 during the awakening state 1610 ms2 during S1 + S2 1480 ms2 during S3 + S4 and 1159 ms2 during REM sleep The average HF decreased during the sleep stages Surprisingly the average HF of 1159 ms2 during REM sleep at high altitude was lower than the average ob- served during the desynchronized state during waking
As reported by the Task Force [1] we also found the HF vigil component of the power spectrum to be aug- mented during NREM sleep at low altitude
59 HFRRNU
The average of total power expressed in high frequency RR normalized units (HFRRNU) is considered a marker of vagal modulation of the autonomic system The values that we found at low altitude during the awakening pe- riod (W) during sleep during S2 + S3 and S3 + S4 and during REM sleep were similar to those Murrell and co- workers [24] recorded at premarathon postmarathon and 48 h postmarathon assessment under controlled normal breathing and standing conditions Our HFRRNU data recorded during the awakening period (W) during sleep at 122 and were similar to those they reported during REM sleep (2347 versus 2264 respectively) In their evaluation of LFRRNU the average HF (controlled brea- thing) was 5845 during the premarathon stage 45 during and 53 at 48 h postmarathon The average HFRRNU de- creased immediately after the race and at 48 h postmara- thon All these values are very close to the average LFRRNU we recorded in the subjects during S3 + S4 sleep at low altitude
Of note is that HFRRNU at low and at high altitudes increases at sleep onset and peaks during the deep stage of sleep (S3 + S4) at altitude (5691) After exposure to 3480 m at a PB of 495 mm Hg for 30 - 41 h there was a non significant reduction in HFRRNU across all sleep stages The average HFRRNU during the awakening pe- riod (W) during sleep at 3480 m was lower but still simi-
lar to that at 122 m These values were similar though lower than those Murrell and co-workers [24] recorded immediately and at 48 h post-marathon at altitude
Our HFRRNU data recorded during sleep at 122 m and 3480 m were also similar to those Lanfranchi and co- workers [2] reported in subjects without AMS and those with AMS (16 and 31 respectively) during the supposed diurnal state and after exposure to 4500 m
Compared with the HFRRNU reported by the Task Force [1] our data recorded during the awakening state S1 + S2 and S3 + S4 and REM sleep at sea level and at 3480 m were 2131 and 3111 respectively
510 LFHF Ratio
Exercise and training at low and high altitudes may have modified autonomic nervous system balance and thus the LFHF ratio The LFHF ratio is considered by some in- vestigators as the mirror of sympathovagal balance or a reflection of sympathetic modulation (Ako et al [3]) In agreement with Ako and co-workers [3] we observed significantly at low altitude but indeed also at high alti- tude a significant decrease in the LFHF component as sleep deepened In agreement with Ako and co-workers [3] we also observed that the sympathetic nervous sys- tem is activated during the two desynchronisation phases of REM sleep and deactivated during NREM sleep at low and high altitude
In detail we analyzed the dynamics of nocturnal fluc- tuations of autonomic nerve activities in sleep stages classified by Rechtschaffen and Kalesrsquos criteria These criteria have not yet been investigated in association with HRV indices particularly during hypoxic conditions Ako and co-workers [3] found an increase in the LFHF ratio (251 plusmn 017) during REM sleep and a significant linear decrease during NREM sleep (S1 230 plusmn 029 S2 185 plusmn 009 S3 078 plusmn 006 S4 251 plusmn 017) Like Ako and co-workers [3] we noted a reduction in the LFHF ratio at 122 m and at 3480 m during NREM sleep (S1 + S2122 m 31187 S1 + S23480 m 51242 S3 + S4122 m 16733 S3 + S43480 m 32109) and an increase during REM sleep (REM122 m 44739 REM3480 m 69132) to the level found during the awaking period (W) during sleep (W122m 46446 and W3480 m 60036) We also found that the av- erage LFHF ratio during S3 + S4 of NREM sleep at 122 m (LFHF = 16733) was similar to that reported by the Task Force [1] (LFHF 15 - 20) in the spectral analysis of stationary supine 5-minute recordings In our study the average LFHF ratio at 122 m and 3480 m during the awaking period (W) during sleep (W122 m 46446 and W3480 m 60036 respectively) was lower yet similar to the average LFHF ratio Lanfranchi and co-workers [2] found during the waking state at 4500 m in mountaineers with and without AMS (34 plusmn 13 and 83 plusmn 14 respectively)
I GRITTI ET AL
Copyright copy 2013 SciRes JBBS
46
Saito and co-workers [25] found an average LFHF ratio of 26 plusmn 08 at PB 760 mm Hg at sea level during the re- laxed waking state This was similar to the value we found (16733) during S3 + S4 at 122 m They reported an average LFHF ratio of 35 plusmn 23 at 3456 m and at a PB of 495 mm Hg which was similar to the average of 32109 that we recorded during S3 + S4 at 3480 m The average LFHF ratio that we found in all five mountain runners during S3 + S4 (16733 plusmn 10847) at 122 m was similar to that reported by the Task Force [1] In some of the mountain marathon runners at low altitude at 122 m and after 30 - 41 h of acclimatization at 3480 m during the different stages of desynchronized and synchronized sleep the average LFHF ratio reached the normal values reported by the Task Force [1] (between 15 and 20) The LFHF ratio value of 2 which is considered normal by the Task Force [1] was recorded at 122 m in 15 sub- jects (SS) during the awakening period (W) of sleep 35 subjects (CS DC SS) during S1 + S2 and 55 subjects during S3 + S4 25 subjects (CS SS) during the REM sleep stage A LFHF ratio value of 2 was reached after 30 - 41 h of acclimatization at 3480 m by 15 subjects (GM) during the awakening period (W) of sleep 15 subjects (CS) during S1 + S2 and 25 subjects (CS GM) during S3 + S4 No changes were noted between the av- erage LFHF ratio recorded in all five mountain runners at 122 m and after 30 - 41 h of acclimatization at 3480 m and during all four stages of sleep awakening period (W) during sleep S1 + S2 S3 + S4 and REM sleep These results suggest highly controlled regulation of sympa- thovagal balance on exposure to moderate hypoxia con- ditions As reported in Table 7 several mountain mara- thon runners showed very high control of sympathovagal balance their LFHF ratio was similar to that reported by the Task Force [1] or did not differ between 122 m and 3480 m after 30 - 41 h of acclimatization during the awakening period (W) during sleep during S1 + S2 during S3 + S4 or during the REM sleep Cornolo and co-workers [20] reported an average LFHF ratio of ~60 in trained high-altitude native subjects 6 - 8 h after the end of a marathon performed between 4100 and 4400 m This was similar to the average LFHF ratio that we re- corded at 3480 m during the desynchronized state of sleep specifically during the awakening period (W) dur- ing sleep (60036 plusmn 50276) and during the REM sleep at the same altitude (69132 plusmn 36806)
511 Total Power
We observed significant parallel changes in TP recorded at low (PB about 740 mm Hg) and high (PB 495 mm Hg) altitude between the awakening period (W) during sleep and S3 + S4 of sleep We also found significant parallel changes in the TP recorded during REM sleep and the
average of TP recorded during S3 + S4 at 122 and 3480 m These changes may reflect changes in cardiac re- spiratory and sympathovagal balance In general in indi- vidual mountain marathon runners we found a decrease in the total power at altitude The components of HRV are thought to be influenced by both neuronal and hu- moral factors (Task Force [1]) Saito and co-workers [25] reported that humoral control of the autonomic nervous system plays an important role in the survival of victims under hypoxic conditions at high altitude
6 Functional Significance
Physical training at low and high altitudes may have in- duced marked autonomic adaptations in the mountain marathon runners over the course of their years of train- ing The resting heart rate was lower at sea level because parasympathetic modulation predominates over higher sympathetic control at high altitude By constantly main- taining their training levels at low and high altitudes for more than 20 years the mountain runners may have shifted their cardiovascular autonomic control toward a greater parasympathetic modulation particularly at sea level Rest and training under hypoxia conditions may have balanced the prevalence of parasympathetic modu- lation as well as improved control of phasic sympathetic responses
These well-trained runners seem to be exceptionally adapted to the high altitude environment [4-13] Strenu- ous exercise is known to induce profound cardiovascular modifications but with a caveat for non-professional ma- rathoners
We agree with Lanfranchi et al [2] that HRV analysis has proved to be essential for investigating the mountain sickness the balance of the sympathetic and parasympa- thetic function of the autonomic nervous system at low and high altitude in mountain marathon runners HRV analysis could also be very useful for evaluating de- creases in parasympathetic and increases in sympathetic tone of the autonomic nervous system during acclimati- zation at altitude of mountain marathon runners who ge- nerally have a tonic prevalence of parasympathetic tone at low altitude
R-R interval variability was observed in the mountain marathon runners during sleep at 122 m (ie a controlled increase in parasympathetic tone during NREM sleep and an increased sympathetic tone during the awakening pe- riod (W) during sleep and during REM sleep) At high altitude the RR-intervals we observed were similar to those Sacknoff and co-workers [21] reported in athletes and controls Moreover the major ECG alterations evi- dent during sleep at an altitude of 3480 m at a PB of 495 mm Hg and after 30 - 41 hours of acclimatization were an increase in HR together with signs of sinus arrhyth-
I GRITTI ET AL
Copyright copy 2013 SciRes JBBS
47
mia during periodic breathing in S1 + S2 of NREM sleep and in REM sleep
This study did not find abnormal reductions in the R-R interval during the awakening period (W) during sleep S1 + S2 S3 + S4 and REM sleep between 30 and 41 h of acclimatization at 3480 m in these well-trained moun- tain marathon runners
The HRV data observed at altitude suggest that the runners possess an intrinsic high parasympathetic tone that at high altitude promptly compensates the physio- logical increase in sympathetic tone due to a periodic significant decrease in peripheral oxygen saturation dur- ing sleep
Not in group average but in several individual runners we found a significant reduction in the LF component at high altitude which may be due to the rhythmic increase of sympathetic discharge of the central brain stem center
In comparison to the average calculated at low altitude we also found a significant decrease in the average of the power of HF during S3 + S4 of NREM sleep at 3480 m This significant reduction probably indicates a decrease in the vagal parasympathetic components of the brain- stem generator
The study demonstrates that cardiovascular modifi- cations during sleep and after 30 - 41 h of acclimatization at high altitude can occur even in mountain marathoners who have benefited from 20 years of training at low and high altitude Physicians should therefore take the results of HRV analysis into account to improve the training and performance particularly at altitude
7 Acknowledgements
Thanks are due to K Britsch for reading the manuscript We thank the FILA Sky Marathon for economical sup- port from 1998 up to 2003
REFERENCES [1] Task Force of the European Society of Cardiology and
North America Society of Pacing Electrophysiology ldquoHeart Rate Variability Standard of Measurement Phy- siological Interpretation and Clinical Userdquo European Heart Journal Vol 17 1996 pp 354-381 doi101093oxfordjournalseurheartja014868
[2] P A Lanfranchi R Colombo G Cremona P Baderna L Spagnolati G Mazzuero P Wagner L Perini H Wagner C Cavallaro and P Giannuzzi ldquoAutonomic Car- diovascular Regulation in Subjects with Acute Mountain Sicknessrdquo American Physiology Heart Circulation Physi- ology Vol 289 No 6 2005 pp H2364-H2372 doi101152ajpheart000042005
[3] M Ako K Tokuhiro S Uchida S Miyazaky K Nishi- hara J Mukai K Hirao J Ako and Y Okubo ldquoCorrela- tion between Electrophysiography and Heart Rate Vari- ability during Sleeprdquo Psychiatry and Clinical Neurosci-
ence Vol 57 No 1 2003 pp 59-65 doi101046j1440-1819200301080x
[4] G Banfi M Marinelli G S Roi A Colombini M Pon- tillo M Giacometti and S Wade ldquoGrowth Hormone and Insulin-Like Growth Factor I in Athletes Performing a Marathon at 4000 m of Altituderdquo Growth Regulation Vol 4 1994 pp 82-86
[5] M Marinelli G S Roi M Giacometti P Bonini and G Banfi ldquoCortisol Testosterone and Free Testosterone in Athletes Performing a Marathon at 4000 m of Altituderdquo Hormon Research Vol 41 No 5-6 1994 pp 225-229 doi101159000183929
[6] G Banfi M Marinelli G S Roi and M Giacometti ldquoPlatelet Indices in Athletes Performing a Race in Alti- tude Environmentrdquo Journal of Clinical Laboratory Ana- lysis Vol 9 No 1 1995 pp 34-36 doi101002jcla1860090106
[7] G Banfi M Marinelli P Bonini I Gritti and G S Roi ldquoPepsinogens and Gastrointestinal Symptoms in Moun- tain Marathon Runnersrdquo International Journal Sports Me- dicine Vol 17 No 8 1996 pp 554-558 doi101055s-2007-972894
[8] G Banfi M Pontillo M Marinelli A Dolci and G S Roi ldquoThyrotropin and Free Thyroid Hormones in Ath- letes during and after Ultra Endurance Sport Perform- ancesrdquo Journal Clinical of Ligand Assay Vol 21 No 3 1998 pp 331-334
[9] G S Roi M Giacometti and S P von Duvillard ldquoMara- thons in Altituderdquo Medicine amp Science in Sports amp Exer- cise Vol 31 No 5 1999 pp 723-728 doi10109700005768-199905000-00016
[10] G Banfi and A Dolci ldquoPreanalytical Phase of Sport Bio- chemistry and Haematologyrdquo The Journal of Sports Me- dicine and Physical Fitness Vol 43 No 2 2003 pp 223-230
[11] G Pelamatti M Pascotto and C Semenza ldquoVerbal Free Recall in High Altitude Proper Names vs Common Namesrdquo Cortex Vol 39 No 1 2003 pp 97-103 doi101016S0010-9452(08)70077-7
[12] G Fragasso A Palloshi S Roi E Rossetti G Monaco A Dolci A Margonato and S Chierchia ldquoTransient Left Ventricular Diastolic Dysfunction Following Strenuous Exerciserdquo Sport Science Health Vol 1 No 1 2004 pp 31-35 doi101007s11332-004-0007-7
[13] I Gritti M Martignoni R Calcaterra and G S Roi ldquoElectroencephalographic Changes after a Marathon at 4300 m of Altituderdquo Journal of Behavioral and Brain Science Vol 2 No 3 2012 pp 380-386 doi104236jbbs201223043
[14] H Otzenberger C Simon C Gronfier and G Branden- berger ldquoTemporal Relationship between Dynamic Heart Rate Variability and Electroencephalographic Activity during Sleep in Manrdquo Neuroscience Letters Vol 229 No 3 1997 pp 173-176 doi101016S0304-3940(97)00448-5
[15] J H Coote ldquoMedicine and Mechanisms in Altitude Sick- ness Recommendationsrdquo Sports Medicine Vol 20 No 3 1995 pp 148-159
I GRITTI ET AL
Copyright copy 2013 SciRes JBBS
48
doi10216500007256-199520030-00003
[16] M A Conney R W van Arts L A A Kolleacutee J C W Hopman G B A Stoelinga P Herman and H P van Geijn ldquoHeart Rate Variabilityrdquo Annals of Internal Medi- cine Vol 118 No 6 1993 pp 436-447
[17] A Rechtschaffen and A Kales ldquoA Manual of Standard- ized Terminology Techniques and Scoring System for Sleep Stages of Human Subjectsrdquo BISBRI UCLA Los Angeles 1968
[18] F R Calaresu A A Faiers and G J Mogenson ldquoCentral Neuronal Regulation of the Heart and Blood Vessels in Mammalsrdquo Progress Neurobiology Vol 5 No 1 1975 pp 1-35 doi1010160301-0082(75)90006-4
[19] H Scholz ldquoAdaptational Responses to Hypoxiardquo Ameri- can Journal of Physiology and Regulatory Integrative Comparative Physiology Vol 282 No 6 2002 pp R1541-R1543
[20] J Cornolo J V Brugniaux J L Marcarlupu C Privat F Leon-Velarde and J P Richalet ldquoAutonomic Adaptations in Andean-Trained Participants to 4220 m Altitude Mara- thonrdquo Medicine and Science in Sports and Exercise Vol 37 No 12 2005 pp 2148-2153 doi10124901mss00001799011928085
[21] D M Sacknoff G W Gleim N Stachenfeld and N L Complan ldquoEffect of Athletic Training on Heart Variabil-
ityrdquo American Heart Journal Vol 127 No 5 1994 pp 1275-1278 doi1010160002-8703(94)90046-9
[22] L Bernardi C Passino G Spadaccini A Calciati R Robergs R Green E Martignoni I Anand and O Ap- penzeller ldquoCardiovascular Autonomic Modulation and Activity of Carotid Baroreceptors at Altituderdquo Clinical Science Vol 95 1998 pp 565-573 doi101042CS19980046
[23] G Vandewalle B Middleton S W R Rajaratnam B M Stone B Thorleifsdottir J Aredent and D J Dijk ldquoRo- bust Circadian Rhythm in Heart Rate and Its Variability Influence of Melatonin and Photoperiodrdquo Journal of Sleep Research Vol 16 No 2 2007 pp 148-150 doi101111j1365-2869200700581x
[24] C Murrell L Wilson J D Cotter S Lucas S Ogoh G Keith and N Ainslie ldquoAlteration in Autonomic Function and Cerebral Hemodynamics to Orthostatic Challenge Fol- lowing a Mountain Marathonrdquo Journal Applied Physiol- ogy Vol 103 No 1 2007 pp 88-96 doi101152japplphysiol013962006
[25] S Saito K Tanobe M Yamada and F Nishihara ldquoRela- tionship between Arterial Oxygen Saturation and Heart Rate Variability at High Altitudesrdquo American Journal of Emergency Medicine Vol 23 No 1 2005 pp 8-12 doi101016jajem200409023
I GRITTI ET AL
Copyright copy 2013 SciRes JBBS
33
Table 3 Averages of the total power in the low frequency (LF ms2) (004 - 015 Hz) range appear to have a widespread neu-ronal genesis and are considered as a marker of sympathetic modulation or a marker of both sympathetic and vagal modula-tion The LF average was calculated in a physiologically defined number of 30-second signal epochs defined according to the standard criteria developed by Rechtschaffen and Kales (1968) recorded during the waking period during sleep (W) stages S1 + S2 and S3 + S4 of NREM and REM sleep at 122 m and after 30 - 41 h of acclimatisation at 3480 m in the five subjects(1)
Stages Subjects 122 m 3480 m
Epochs Epochs
Awakening during sleep N Mean SD N Mean SD Delta P value
CS 7 5148 2849 35 3163 1400 minus1985 00074
MR 3 10477 3742 3 6780 428 minus3697 ns
GM 13 9656 2978 12 6157 2271 minus3499 00033
DC 140 5083 4655 157 2774 2056 minus2309 00001
SS 27 9619 4825 64 12485 10724 2866 ns
No of epochs 190 271
No of subjects Mean SEM No of subjects Mean SEM Delta
subjects subjects
Average 5 7997 3810 5 6272 3376 minus1725 ns
S1 + S2 Epochs Epochs
N Mean SD N Mean SD Delta P value
CS 45 5946 2294 34 3539 1734 minus2407 00001
MR 58 10118 2699 52 6059 1641 minus4059 00001
GM 53 7692 2871 54 6998 2317 minus694 ns
DC 302 3090 1733 322 3036 1593 minus54 ns
SS 200 10155 6434 237 17947 12895 7792 00001
No of epochs 658 699
No of subjects Mean SEM No of subjects Mean SEM Delta
subjects subjects
Average 5 7400 3206 5 7516 4036 116 ns
S3 + S4 Epochs Epochs
N Mean SD N Mean SD Delta P value
CS 16 3760 1098 9 2276 2427 minus1484 00455
MR 11 8344 2222 6 3917 592 minus4427 00003
GM 9 4352 1275 7 4274 1504 minus78 ns
DC 98 2626 2066 25 2315 1056 minus311 ns
SS 92 5324 6544 59 6245 6031 921 ns
No of epochs 226 106
No of subjects Mean SEM No of subjects Mean SEM Delta
subjects subjects
Average 5 4881 2041 5 3805 2322 minus1076 ns
REM Epochs Epochs
N Mean SD N Mean SD Delta P value
CS 8 6497 1748 5 6105 2640 minus392 ns
MR 23 10159 2790 13 5200 1513 minus4959 00001
GM 10 8005 1910 13 8430 2376 425 ns
DC 62 6727 4144 30 3702 1995 minus3025 00003
SS 72 11509 6775 52 5140 4402 minus6369 00001
No of epochs 175
No of subjects Mean SEM No of subjects Mean SEM Delta
subjects subjects
Average 5 8579 3473 5 5715 2585 minus2864 ns
Footnotes to Table 3 (1)One-way ANOVA revealed no significant changes in the averages of the total power in the low frequency (LF ms2) (004 - 015 Hz) range (DF 73239 F test 13 P = 02819) Post-hoc comparison with Studentrsquos t-test of the average LF value recorded in 175 30-second epochs during REM sleep at sea level was significantly higher (P lt 002) than that recorded in 226 30-second epochs during stages S3 + S4 of NREM sleep at 122 m in all five subjects
I GRITTI ET AL
Copyright copy 2013 SciRes JBBS
34
Table 4 Averages of the total power in the low frequency (004 - 015 Hz) range in normalized units (LF-RR-NU) which is considered as a marker of sympathetic modulation measured in a physiologically defined number of 30-second signal epochs defined according to the standard criteria developed by Rechtschaffen and Kales (1968) recorded during the waking period during sleep (W) stages S1 + S2 and S3 + S4 of NREM and REM sleep at 122 m and after 30 - 41 h of acclimatisation at 3480 m in the five subjects(1)
Stages Subjects 122 m 3480 m Epochs Epochs
Awakening during sleep N Mean SD N Mean SD Delta P value CS 7 7306 625 35 7673 1005 367 ns MR 3 8459 707 3 8466 594 007 ns GM 13 8332 509 12 6003 1826 minus2329 00001 DC 140 6801 1923 157 7499 1752 698 0001 SS 27 5806 1316 64 8243 1395 2437 00001 190 271 No of subjects Mean SEM No of subjects Mean SEM Delta subjects subjects Average 5 7341 1015 5 7577 1314 236 ns
S1 + S2 Epochs Epochs N Mean SD N Mean SD Delta P value CS 45 6677 1570 34 6503 1511 minus173 ns MR 58 7641 945 52 8071 677 430 001 GM 53 7855 791 54 7444 950 minus411 00168 DC 302 5586 1623 322 8061 995 2475 00001 SS 200 5767 1792 237 8047 1271 2280 00001 No of epochs 658 No of subjects Mean SEM No of subjects Mean SEM Delta subjects subjects Average 5 6705 1344 5 7625 1081 minus92 ns
S3 + S4 Epochs Epochs N Mean SD N Mean SD Delta P value CS 16 4727 1123 9 4327 2723 minus385 ns MR 11 6373 1298 6 7390 793 1610 0015 GM 9 7019 1008 7 5953 1140 minus1066 ns DC 98 4584 1691 25 7440 1130 2856 00001 SS 92 3952 1607 59 7593 895 3641 00001 No of epochs 226 106 No of subjects Mean SEM No of subjects Mean SEM Delta subjects subjects Average 5 6476 1145 5 6662 1336 186 ns
REM Epochs Epochs N Mean SD N Mean SD Delta P value CS 8 6797 794 5 7953 587 1156 001748 MR 23 8086 593 13 8900 382 814 00001 GM 10 8383 858 13 7909 798 minus474 ns DC 62 7774 1239 30 8754 638 980 00001 SS 72 6118 1603 52 6967 1722 849 00056 No of epochs 175 113 No of subjects Mean SEM No of subjects Mean SEM Delta subjects subjects Average 5 7432 1017 5 8097 825 665 ns
Footnotes to Table 4 (1)One-way ANOVA revealed significant differences in the averages of the total power in low frequency (004 - 015 Hz) in normalized units (LFRRNU) (DF73239 F = 3229 P lt 00105) Post-hoc analysis with Fisher and Scheffeacute tests revealed that the LF-RR-NU component of the R-R intervals during the W state at 122 m differed significantly from than that during stages S3 + S4 (P = 005) The LF-RR-NU average values during the W state at 3480 m differed significantly from that during stages S3 + S4 (P lt 005) The LF-RR-NU average during stages S1 + S2 at 122 m differed significantly from that during REM sleep at 3480 m (P lt 005) The LF-RR-NU average during stages S1 + S2 recorded at 3480 m differed significantly from that during stages S3 + S4 The LF-RR-NU average during stages S3 + S4 at 122 m differed significantly from that during REM sleep at 122 m (P lt 005) The LF-RR-NU component of the R-R intervals during stages S3 + S4 at 122 m differed significantly from that during REM sleep at 3480 m (P lt 005) The LF-RR-NU average during stages S3 + S4 at 3480 m differed from that during REM sleep at 3480 m (P lt 005) in all five subjects Comparison with Studentrsquos t-test showed a significant difference between the average of the LF-RR-NU recorded in 190 30-second epochs during the waking period during sleep (W) at 122 m (P lt 003) and that recorded in 226 30-second epochs during stages S3 + S4 of NREM sleep at 122 m in all five subjects Comparison with Studentrsquos t-test showed a significant difference (P lt 00192) between the average of the LF-RR-NU in stages S3 + S4 of NREM sleep and that during REM sleep at 122 m in all five subjects
I GRITTI ET AL
Copyright copy 2013 SciRes JBBS
35
343 Sea Level (122 m) and High Altitude (3480 m) The average LFRRNU (Table 4) recorded during W at al- titude was significantly shorter than that recorded at sea level in 15 subjects (GM 6003 plusmn 1826 at 3480 m vs 8332 plusmn 509 at 122 m P lt 00001) and significantly longer in 25 subjects [(DC 7499 plusmn 1752 at 3480 m vs 6801 plusmn 1923 at 122 m P lt 0001) (SS 8243 plusmn 1395 at 3480 m vs 5806 plusmn 1316 at 122 m P lt 00001)]
The average LFRRNU recorded during S1 + S2 at high altitude was significantly longer than that recorded at sea level in 35 subjects [(MR 8071 plusmn 677 at 3480 m vs 7641 plusmn 945 at 122 m P lt 001) (DC 8061 plusmn 995 at 3480 m vs 5586 plusmn 1623 at 122 m P lt 00001) (SS 8047 plusmn 1271 at 3480 m vs 5767 plusmn 1792 at 122 m P lt 00001)] while in 15 the average LFRRNU was signifi- cantly shorter (GM 5953 plusmn 1140 at 3480 m vs 7019 plusmn 1008 at 122 m P lt 00168) in S3 + S4 The average LFRRNU recorded during S3 + S4 at high altitude was significantly longer than that recorded at 122 m in 35 subjects [(MR 7390 plusmn 793 at 3480 m vs 6373 plusmn 1298 at 122 m P lt 00150) (DC 7440 plusmn 1130 at 3480 m vs 4584 plusmn 1691 at 122 m P lt 00001) (SS 7593 plusmn 895 at 3480 m vs 3952 plusmn 1607 at 122 m P lt 00001)] The average LFRRNU recorded during REM sleep at high altitude was significantly longer than that recorded at 122 m in 45 subjects [(CS 7953 plusmn 587 at 3480 m vs 6797 plusmn 794 at 122 m P lt 001748) (MR 8900 plusmn 382 at 3480 m vs 8086 plusmn 593 at 122 m P lt 00001) (DC 8754 plusmn 638 at 3480 m vs 7774 plusmn 1239 at 122 m P lt 00001) (SS 6967 plusmn 1722 at 3480 m vs 6118 plusmn 1603 at 122 m P lt 00056)] These data show a great variabil- ity between mountain marathon runners in LFRRNU when the data set recorded at 122 m is compared with that re- corded at 3480 m Analysis of the data recorded in indi- vidual mountain marathon runners showed an increase in the average LFRRNU at 3480 m demonstrating an in- crease in the marker for sympathetic modulation
35 Total Power of High Frequency [(HF ms2) (015 - 04 Hz)] Range HF Primarily Reflects Respiratory-Driven Vagal Modulation of Sinus Rhythm
351 Sea Level (122 m) No significant differences in the averages of HF were observed between W (2223 plusmn 728) S1 + S2 (2945 plusmn 1080) and S3 + S4 (3891 plusmn 1134) and REM (2499 plusmn 879) stages at low altitude (Table 5) The averages of the HF recorded during the nocturnal sleep-wake cycle at 122 m suggested a prevalence of vagal tone during S3 + S4 stages in comparison with the other sleep stages
352 High Altitude (3480 m) No significant differences in the averages of HF were
observed between W (1572 plusmn 993) S1 + S2 (1610 plusmn 631) and S3 + S4 (1480 plusmn 511) and REM (1159 plusmn 555) stages at 3480 m (Table 5) The averages of the HF recorded during the nocturnal sleep-wake cycle at 3480 m sug- gested a reduction in vagal tone throughout all sleep stages and during awakening during sleep
353 Sea Level (122 m) and High Altitude (3480 m) Compared with the values calculated at sea level there was a significant decrease in the average of total power of high frequency (HF ms2) (Table 5) recorded during W at altitude in 35 subjects [(CS 1422 plusmn 384 at 122 m vs 743 plusmn 191 at 3480 m P lt 00001) (DC 1487 plusmn 729 at 122 m vs 717 plusmn 789 at 3480 m P lt 00001) (SS 4849 plusmn 1587 at 122 m vs 1674 plusmn 1179 at 3480 m P lt 00001)] and a significant increase in 15 subjects (GM 1654 plusmn 400 at 122 m vs 3495 plusmn 2196 at 3480 m P lt 00072)
Compared with the values calculated at sea level there was a significant decrease in the average HF recorded at altitude during S1 + S2 of NREM sleep in 45 subjects [(CS 2485 plusmn 1178 at 122 m vs 1513 plusmn 443 at 3480 m P lt 00001) (MR 2892 plusmn 906 at 122 m vs 1382 plusmn 546 at 3480 m P lt 00001) (DC 2167 plusmn 778 at 122 m vs 605 plusmn 297 at 3480 m P lt 00001) (SS 5375 plusmn 1950 at 122 m vs 2640 plusmn 1385 at 3480 m P lt 00001)] Compared with the averages calculated at 122 m there was a significant decrease in the average HF recorded during S3 + S4 of NREM sleep at 3480 m in 45 subjects [(CS 3776 plusmn 982 at 122 m vs 2044 plusmn 723 at 3480 m P lt 00001) (MR 4624 plusmn 1629 at 122 m vs 975 plusmn 506 at 3480 m P lt 00001) (DC 2617 plusmn 777 at 122 m vs 684 plusmn 249 at 3480 m P lt 00001) (SS 6866 plusmn 1904 at 122 m vs 1394 plusmn 681 at 3480 m P lt 00001)] and a significant increase in 15 subjects (GM 1571 plusmn 376 at 122 m vs 2303 plusmn 396 at 3480 m P lt 00021) There was a significant decrease in the average HF recorded during REM sleep in 45 sub- jects [(CS 2425 plusmn 531 at 122 m vs 1397 plusmn 774 at 3480 m P lt 00155) (MR 2248 plusmn 680 at 122 m vs 615 plusmn 233 at 3480 m P lt 00001) (DC 1530 plusmn 708 at 122 m vs 400 plusmn 149 at 3480 m P lt 00001) (SS 4885 plusmn 1559 at 122 m vs 1671 plusmn 1147 at 3480 m P lt 00001)]
The average HF at 3480 m recorded in individual mountain marathon runners was generally lower than that recorded at 122 m suggesting a decrease in the marker of vagal tone at altitude
36 High Frequency in Normalized Units [(HFRRNU) (004 - 015 Hz)] HFRRNU Is Considered as a Marker of Vagal Modulation
361 Sea Level (122 m) In all five subjects the average of the HFRRNU analyzed
I GRITTI ET AL
Copyright copy 2013 SciRes JBBS
36
Table 5 Averages of the total power in the high frequency (HF ms2) (015 - 04 Hz) range which primarily reflects respira-tory-driven vagal modulation of sinus rhythm in a natural physiologically defined number of 30-second signal epochs ac-cording to the standard criteria developed by Rechtschaffen and Kales (1968) during the waking period during sleep (W) stages S1 + S2 and S3 + S4 of NREM and REM sleep measured at 122 m and after 30 - 41 h of acclimatisation at 3480 m in the five subjects(1)
Stages Subjects 122 m 3480 m
Epochs Epochs
Awakening during sleep N Mean SD N Mean SD Delta P value
CS 7 1422 384 35 743 191 minus679 00001
MR 3 1701 449 3 1232 612 minus469 ns
GM 13 1654 490 12 3495 2196 1841 00072
DC 140 1487 729 157 717 789 minus770 00001
SS 27 4849 1587 64 1674 1179 minus3175 00001
No of epochs 190 271
No of subjects Mean SEM No of subjects Mean SEM Delta
subjects subjects
Average 5 2223 728 5 1572 993 minus651 ns
S1 + S2 Epochs Epochs
N Mean SD N Mean SD Delta P value
CS 45 2485 1178 34 1513 443 minus972 00001
MR 58 2892 906 52 1382 546 minus1510 00001
GM 53 1807 589 54 1909 484 102 ns
DC 302 2167 778 322 605 297 minus1562 00001
SS 200 5375 1950 237 2640 1385 minus2735 00001
No of epochs 658 699
No of subjects Mean SEM No of subjects Mean SEM Delta
subjects subjects
Average 5 2945 1080 5 1610 631 1335 ns
S3 + S4 Epochs Epochs
N Mean SD N Mean SD Delta P value
CS 16 3776 982 9 2044 723 minus1732 00001
MR 11 4624 1629 6 975 506 minus3649 00001
GM 9 1571 376 7 2303 396 732 00021
DC 98 2617 777 25 684 249 minus1933 00001
SS 92 6866 1904 59 1394 681 minus5472 00001
No of epochs 226 106
No of subjects Mean SEM No of subjects Mean SEM Delta
subjects subjects
Average 5 3891 1134 5 1480 511 minus2411 004
REM Epochs Epochs
N Mean SD N Mean SD Delta P value
CS 8 2425 531 5 1397 774 minus1028 00155
MR 23 2248 680 13 615 233 minus1633 00001
GM 10 1409 918 13 1711 472 302 ns
DC 62 1530 708 30 400 149 minus1130 00001
SS 72 4885 1559 52 1671 1147 minus1147 00001
No of epochs 175 113
No of subjects Mean SEM No of subjects Mean SEM Delta
subjects subjects
Average 5 2499 879 5 1159 555 minus1340 ns
Footnotes to Table 5 (1)One-way ANOVA revealed a significant difference between stages in the averages of the total power in the high frequency (HF ms2) (015-04 Hz) range (DF = 73239 F = 2576 P = 00317) Post-hoc Fisher analysis showed significant differences between the averages of HF during W at 122 m and during stages S3 + S4 at 122 m (P lt 005) There was a significant difference between the values measured during W at 3480 m and those during stages S3 + S4 at 122 m (P lt 005) The values measured during stages S1 + S2 at 122 m differed significantly from those during REM sleep at 3480 m in all five subjects
I GRITTI ET AL
Copyright copy 2013 SciRes JBBS
37
in a natural physiologically defined number of 30-sec- ond signal epochs according to standard criteria de- veloped by Rechtschaffen and Kales (1968) during the awakening period during sleep (W 2347 plusmn 946) was significantly shorter than that observed during S3 + S4 of NREM at 122 m (5691 plusmn 3114 P lt 00327) In all five subjects the average of the HFRRNU during S3 + S4 of NREM sleep (5691 plusmn 3114) was significantly longer (P lt 001004) than that observed during REM sleep (2264 plusmn 944 P lt 001004) at 122 m (Table 6) These data sug- gest an increase in vagal modulation during the deepen- ing of slow-wave NREM sleep and a decrease in vagal modulation during the desynchronized awakening period during sleep (W) and REM sleep
362 High Altitude (3480 m) The average of the HFRRNU analyzed between W (2131 plusmn 1108) S1 + S2 (2152 plusmn 976) S3 + S4 (3111 plusmn 1281) of NREM sleep and REM sleep (1674 plusmn 699) was simi- lar (Table 6) The data suggest an increase in vagal mo- dulation during S3 + S4 of slow-wave NREM sleep and a decrease in vagal modulation during the desynchronized awakening period during sleep (W) S1 + S2 of NREM sleep and during REM sleep
363 Sea Level (122 m) and High Altitude (3480 m) The mean of the averages of the HFRRNU (Table 6) re- corded during W at altitude was significantly shorter than that recorded at sea level in 25 subjects (DC 2229 plusmn 1447 at 3480 m vs 3087 plusmn 1875 at 122 m P lt 00001) (SS 1533 plusmn 1165 at 3480 m vs 3349 plusmn 1157 at 122 m P lt 00001)] and significantly longer in 15 subjects (GM 3315 plusmn 1339 at 3480 m vs 1515 plusmn 46 at 122 m P lt 00001) The mean of the averages of the HFRRNU re- corded during S1 + S2 at altitude was significantly shor- ter than that recorded at sea level in 35 subjects (MR 1881 plusmn 671 at 3480 m vs 2317 plusmn 948 at 122 m P lt 001) (DC 1832 plusmn 943 at 3480 m vs 4357 plusmn 1623 at 122 m P lt 0001) (SS 1638 plusmn 1036 at 3480 m vs 3686 plusmn 1723 at 122 m P lt 00001) The mean of the averages of the HFRR-NU recorded during S3 + S4 at al- titude was significantly shorter than that recorded at sea level in 25 subjects [(DC 2442 plusmn 1104 at 3480 m vs 5353 plusmn 1673 at 122 m P lt 00001) (SS 2229 plusmn 830 at 3480 m vs 5554 plusmn 1578 at 122 m P lt 00001)] The mean of the averages of the HFRR-NU recorded during REM sleep at altitude was significantly shorter than that at sea level in 35 subjects [(MR 1057 plusmn 376 at 3480 m vs 1850 plusmn 582 at 122 m P lt 00001) (DC 1156 plusmn 614 at 3480 m vs 2180 plusmn 1224 at 122 m P lt 00001) (SS 2681 plusmn 1455 at 3480 m vs 3215 plusmn 1457 at 122 m P lt 004)]
37 LFHF Ratio Mirrors Sympathovagal Balance or Reflects Sympathetic Modulation
371 Sea Level (122 m) In all five subjects the average of the LFHF ratio during W at 122 m was longer (46446 plusmn 28655) than that ob- served during S3 + S4 (16733 plusmn 10847 P lt 00110) (Table 7) the average of the LFHF ratio during S3+S4 (16733 plusmn 10847) was significantly shorter than that ob- served in 175 epochs of REM sleep (44739 plusmn 21405 P lt 00113) (Table 7) The data suggest an increase of sympathetic modulation during W and REM sleep in comparison of synchronized S1 minus S4 sleep
372 High Altitude (3480 m) The average of the LFHF ratio during S3 + S4 at 3480 m (32109 plusmn 10873) was significantly lower than that ob- served during REM sleep (69132 plusmn 36806 P lt 0036835) The data suggest an increase of sympathetic modulation during REM sleep in comparison to synchro- nized S3 + S4 sleep
373 Sea Level (122 m) and High Altitude (3480 m) The average of the LFHF ratio (Table 7) during W was significantly shorter at 3480 m than at 122 m in 15 sub- jects (GM 61615 plusmn 24214 at 122 m vs 23017 plusmn 13728 at 3480 m P lt 00001) and significantly longer at 3480 m than at 122 m in 25 subjects [(DC 49300 plusmn 62275 at 122 m vs 72334 plusmn 10049 at 3480 m P lt 00235) (SS 21570 plusmn 14672 at 122 m vs 94181 plusmn 81271 at 3480 m P lt 00001)] The average LFHF ratio during S1 + S2 was significantly longer at 3480 m than at 122 m in 35 subjects [(MR 50512 plusmn 23613 at 3480 m vs 39624 plusmn 18413 at 122 m P lt 00078) (DC 61907 plusmn 43641 at 3480 m vs 17193 plusmn 13779 at 122 m P lt 00001) (SS 79224 plusmn 67405 at 3480 m vs 23667 plusmn 216997 at 122 m P lt 00001)] and significantly shorter in 15 subjects (GM 39050 plusmn 16255 at 3480 m vs 46160 plusmn 20671 at 122 m P lt 00503) The average LFHF ratio was sig- nificantly longer at high altitude than at sea level during S3 + S4 in 35 subjects [(MR 46867 plusmn 18516 at 3480 m vs 21655 plusmn 12576 at 122 m P lt 00043) (DC 37484 plusmn 17785 at 3480 m vs 12203 plusmn 14342 at 122 m P lt 00001) (SS 40205 plusmn 23448 at 3480 m vs 09542 plusmn 10418 at 122 m P lt 00001)] The average LFHF ratio was significantly longer (P lt 00102 - 00001) during REM sleep at high altitude than at sea level in 45 sub- jects [(CS 47380 plusmn 14928 at 3480 m vs 28163 plusmn 09832 at 122 m) (MR 98554 plusmn 43032 at 3480 m vs 48217 plusmn 15891 at 122 m) (DC 10520 plusmn 66211 at 3480 m vs 52563 plusmn 37020 at 122 m) (SS 41387 plusmn 39490 at 3480 m vs 27194 plusmn 20375 at 122 m)]
At 122 m and at 3480 m there was a decrease in the LFHF ratio during deepening of NREM sleep indicating
I GRITTI ET AL
Copyright copy 2013 SciRes JBBS
38
Table 6 Averages of the total power in the high frequency (004 - 015 Hz) range in normalized units (HFRRNU) which is considered as a marker of vagal modulation in a natural physiologically defined number of 30-second signal epochs ac-cording to standard criteria developed by Rechtschaffen and Kales (1968) during the waking period during sleep (W) stages S1 + S2 and S3 + S4 of NREM and REM sleep recorded at 122 m and after 30 - 41 h of acclimatisation at 3480 m in the five subjects(1)
Stages Subjects 122 m 3480 m Epochs Epochs
Awakening during sleep N Mean SD N Mean SD Delta P value CS 7 2310 610 35 2105 979 minus205 ns MR 3 1475 628 3 1500 608 025 ns GM 13 1515 460 12 3315 1339 1800 00001 DC 140 3087 1875 157 2229 1447 minus858 00001 SS 27 3349 1157 64 1533 1165 minus1816 00001 No of epochs 190 No of subjects Mean SEM No of subjects Mean SEM Delta subjects subjects Average 5 2347 946 5 2131 1108 minus211 ns
S1 + S2 Epochs Epochs N Mean SD N Mean SD Delta P value CS 45 2929 1537 34 3235 1489 minus174 ns MR 58 2317 948 52 1881 671 minus436 001 GM 53 1997 745 54 2172 739 175 ns DC 302 4357 1623 322 1832 943 minus2524 0001 SS 200 3686 1723 237 1638 1036 minus2048 00001 No of epochs 658 699 No of subjects Mean SEM No of subjects Mean SEM Delta subjects subjects Average 5 3057 1315 5 2152 976 minus906
S3 + S4 Epochs Epochs N Mean SD N Mean SD Delta P value CS 16 4799 1184 9 5507 2698 708 ns MR 11 3590 1294 6 1953 802 minus1638 ns GM 9 2650 755 7 3426 997 776 ns DC 98 5353 1673 25 2442 1104 minus2911 00001 SS 92 5554 1578 59 2229 830 minus364 00001 No of epochs 226 106 No of subjects Mean SEM No of subjects Mean SEM Delta subjects subjects Average 5 5691 3114 5 3111 1281 minus2580 ns
REM Epochs Epochs N Mean SD N Mean SD Delta P value CS 8 2643 812 5 1787 431 minus856 ns MR 23 1850 582 13 1057 376 minus793 0001 GM 10 1431 646 13 1691 618 260 ns DC 62 2180 1224 30 1156 614 minus1024 00001 SS 72 3215 1457 52 2681 1455 minus534 00461 No of epochs 175 113 No of subjects Mean SEM No of subjects Mean SEM Delta subjects subjects Average 5 2264 944 5 1674 699 minus590 ns
Footnotes to Table 6 (1)One-way ANOVA of the averages of the total power in the high frequency (004 - 015 Hz) range in normalized units (HF-RR-NU) showed significant differences between conditions (DF73239 F 4071 P lt 00027) Post-hoc analysis demonstrated a significant difference between the average HF-RR-NU during W at 122 m and that during stages S3 + S4 at 122 m (P lt 005) The averages of HF-RR-NU during W at 3480 m differed significantly from those during stages S3 + S4 at 122 (P lt 005) The averages of HF-RR-NU during W at 122 m differed significantly from those during stages S3 + S4 at 122 m (P lt 005) The average of HF-RR-NU during stages S1 + S2 at 122 m differed significantly from that during stages S3 + S4 at 3480 m (P lt 005) The average of HF-RR-NU during stages S1 + S2 at 3480 m differed significantly from that during stages S3 + S4 at 122 m (P lt 005) The average of HF-RR-NU during stages S3 + S4 at 122 m differed significantly from that during stages S3 + S4 at 3480 m (P lt 005) The average of HF-RR-NU during stages S3 + S4 at 122 m differed significantly from that during REM sleep at 122 m (P lt 005) The average of HF-RR-NU during stages S3 + S4 at 122 m differed significantly from that during stages S3 + S4 at 3480 m (P lt 005) The average of HF-RR-NU during stages S3 + S4 at 3480 m differed significantly from that during REM sleep at 3480 m (P lt 005) in all five subjects Comparison with Studentrsquos t-test of the average of the HF-RR-NU in a natural physiologically defined number of 30-second signal epochs according to standard criteria developed by Rechtschaffen and Kales (1968) during the waking period during sleep (W) differed significantly from that during stages S3 + S4 of NREM sleep at 122 m in all five subjects (P lt 00327) Comparison with Studentrsquos t-test of the average of the HF-RR-NU in a natural physiologically defined number of 30-second signal epochs according to standard criteria developed by Rechtschaffen and Kales (1968) during stages S3 + S4 of NREM sleep differed significantly from that during REM sleep at 122 m in all five subjects (P lt 001004)
I GRITTI ET AL
Copyright copy 2013 SciRes JBBS
39
Table 7 Averages of the ratio of low frequencyhigh frequency (LF ms2HF ms2) range which mirrors sympathovagal bal-ance or reflects sympathetic modulation in a physiologically defined number of 30-second signal epochs according to stan-dard criteria developed by Rechtschaffen and Kales (1968) during the waking period during sleep (W) stages S1 + S2 and S3 + S4 of NREM sleep and REM sleep at 122 m and after 30 - 41 h of acclimatisation at 3480 m in the five subjects(1)
Stages Subjects 122 m 3480 m
Epochs Epochs
Awakening during sleep N Mean SD N Mean SD Delta P value
CS 7 347 14415 35 45477 22645 10777 ns
MR 3 6513 277 3 6517 3324 0004 ns
GM 13 61615 24214 12 23017 13728 minus38598 00001
DC 140 493 62275 157 72334 10049 23034 00235
SS 27 2157 14672 64 94181 81271 72611 00001
No of epochs 190 271
No of subjects Mean SEM No of subjects Mean SEM Delta
subjects subjects
Average 5 46446 28655 5 60036 50276 1357 ns
S1+ S2 Epochs Epochs
N Mean SD N Mean SD Delta P value
CS 45 29293 15299 34 25515 13856 minus03778 ns
MR 58 39624 18413 52 50512 23613 10888 00078
GM 53 4616 20671 54 3905 16255 minus0711 00503
DC 302 17193 13779 322 61907 43641 44714 00001
SS 200 23667 21697 220 79224 67405 55557 00001
No of epochs 658 683
No of subjects Mean SEM No of subjects Mean SEM Delta
subjects subjects
Average 5 31187 17972 5 51242 32954 2007 ns
S3+ S4 Epochs Epochs
N Mean SD N Mean SD Delta P value
CS 16 10919 0477 9 16633 22308 05714 ns
MR 11 21655 12576 6 46867 18516 25212 00043
GM 9 29344 12127 7 19357 0831 minus09987 ns
DC 98 12203 14342 25 37484 17785 25281 00001
SS 92 09542 10418 59 40205 23448 325 00001
No of epochs 226
No of subjects Mean SEM No of subjects Mean SEM Delta
subjects subjects
Average 5 1633 10847 5 32109 18073 1538 ns
REM Epochs Epochs
N Mean SD N Mean SD Delta P value
CS 8 281163 5 4738 14928 19217 00166
MR 23 482217 13 98554 43032 50337 00001
GM 10 6756 13 53138 20368 minus14422 ns
DC 62 52563 30 1052 66211 5264 00001
SS 72 27194 52 41387 3949 1493 00102
No of epochs 175 113
No of subjects Mean SEM No of subjects Mean SEM Delta
subjects subjects
Average 5 44739 5 69132 36806 2439 ns
Footnotes to Table 7 (1)One-way ANOVA showed no significant differences in the LFHF ratio in the different conditions Studentrsquos t-test showed that the average of the total power of the LFHF ratio during the waking state during sleep (W) (190 epochs) at 122 m was generally higher than the average LFHF ratio during stages S3 + S4 (226 epochs) at the same altitude in the five subjects (P lt 00110) Studentrsquos t-test showed that the average of the total power of the LFHF ratio during stages S3 + S4 in a total of 226 epochs of 30 seconds at low altitude was significantly lower than that in 175 epochs of REM sleep at 122 m in the five subjects (P lt 0011335) Studentrsquos t-test showed that the average of the total power of the LFHF ratio during stages S3 + S4 (106 epochs) at 3480 m was significantly lower than that during REM sleep (113 epochs) at high altitude in the five subjects (P lt 0036835)
I GRITTI ET AL
Copyright copy 2013 SciRes JBBS
40
a decline in sympathovagal balance At 122 m and at 3480 m the average values of LFHF during REM sleep were similar to those observed during the awakening period during sleep (W)
38 Total Power (TP ms2)
381 Sea Level (122 m) The average of the TP during the awakening period dur-ing sleep (W 33057 plusmn 18136) differed significantly from that recorded during S3 + S4 (13007 plusmn 4621 P lt 00068) During S3 + S4 of NREM sleep (13007 plusmn 4621) the average of the TP differed significantly from that observed during REM sleep (28480 plusmn 14192 P lt 0003341) (Table 8) The TP during REM sleep was similar to the TP values recorded during W
382 High Altitude (3480 m) During S3 + S4 of NREM sleep (9202 plusmn 3805) the av-erage of the TP differed significantly from that observed during REM sleep (22838 plusmn 11600 P lt 0002613) in all five subjects
383 Sea Level (122 m) and High Altitude (3480 m) (Table 8)
During W the average of the total power (TP ms2) re- corded at 122 m was longer than that recorded at 3480 m in 25 subjects [(MR 50528 plusmn 7837 at 122 m vs 30899 at 3480 m P lt 00254) (DC 17740 plusmn 23122 at 122 m vs 11197 plusmn 11829 at 3480 m P lt 00020)] (Table 8) During S1 + S2 the average of the TP at low altitude was significantly longer than that observed at 3480 m in 35 subjects [(MR 21950 plusmn 8436 at 122 m vs 16258 plusmn 9971 at 3480 m P lt 00015) (GM 20200 plusmn 11240 at 122 m vs 15218 plusmn 7421 at 3480 m P lt 00079) (DC 7240 plusmn 2998 at 122 m vs 6021 plusmn 3589 at 3480 m P lt 000019)] During S3 + S4 the average of the TP at 122 m was sig- nificantly longer than that observed at 3480 m in 45 sub- jects (CS 13176 plusmn 3660 at 122 m vs 8733 plusmn 5824 at 3480 m P lt 00275) (MR 17278 plusmn 4805 at 122 m vs 6865 plusmn 720 at 3480 m P lt 00001) (DC 6917 plusmn 3007 at 122 m vs 5262 plusmn 4686 at 3480 m P lt 00307) (SS 15005 plusmn 5017 at 122 m vs 10516 plusmn 9526 at 3480 m P lt 00002) At 3480 m during the awakening period during sleep (W 25672 plusmn 15424) the average of the TP dif- fered significantly from that recorded during S3 + S4 (9202 plusmn 3805 P lt 0028) The average of the TP re- corded during REM sleep at sea level was significantly shorter than that at altitude in 25 subjects (CS 39198 plusmn 13892 at 122 m vs 22879 plusmn 8514 at 3480 m P lt 00320) (SS 25442 plusmn 11874 at 122 m vs 14723 plusmn 7978 at 3480 m P lt 00001)
At 122 m and at 3480 m there was a decrease in TP during deepening of NREM sleep At 122 m and at 3480
m the average values of TP during REM sleep were simi- lar to those observed during awakening during sleep (W)
4 Discussion
Fluctuations in autonomic cardiovascular regulation dur- ing exposure to high-altitude environment may increase the risk of heart attack This study compared heart rate variability (HVR) and its components during sleep at low altitude and after 30 - 41 hours of acclimatization at high altitude (3480 m) in mountain marathon runners controlled for diet drugs light-dark cycle and jet lag dif- ferences At altitude RR-intervals became significantly shorter (P lt 0001) The significant changes in sympa- theticparasympathetic autonomic cardiovascular modu- lation at high altitude can protect against excessive oxy- gen deprivation particularly during sleep and thus lower the risk of heart attack Increase in R-R intervals during wake and sleep may require longer periods of acclimati-zation at 3480 m to mitigate the effects of altitudehypo- xia on the sympathetic tone of the mountain marathon runners thus reducing cardiovascular distress
5 Background
Molecular oxygen is essential for all higher forms of life and brain cell function During evolution humans and other animal species developed molecular biochemical and physiological mechanisms to optimize oxygen utili- zation efficacy Humans respond to acute or chronic ex- posure to hypobaric-hypoxia by resetting the pO2 balance to ensure brain and heart cell function Understanding how the body adjusts its biochemical and physiological cellular needs may help to better define the health risks associated with activities in hypobaric-hypoxia condi- tions and can aid in identifying appropriate therapeutic non-pharmacological andor pharmacological treatments Our ability to breathe and to modify breathing according to the amount of available ambient oxygen and to our bodyrsquos demands (particularly those of the brain heart and lungs) is essential for survival Failure to breathe or an inadequate oxygen supply especially to the brain contributes to cardiorespiratory distress In hypoxic con- ditions distribution of cardiac output to the cardiovascu- lar beds is subordinate to a preprogrammed priority pro- gram for preservation of the organism In hypoxic condi- tions the majority of neuronal systems of the brain in- crease andor change their firing rate in order to modulate in a cyclic manner the discharge of the neurons involved in regulating the oxygen supply in mammals [151618 19]
Acute and chronic exposure to hypoxemia leads to all sorts of disturbances that suggest impaired excitatory neuronal functions involved in the behavioral and meta- bolic integration of autonomic control and arousal [15]
I GRITTI ET AL
Copyright copy 2013 SciRes JBBS
41
Table 8 Averages of the total power (TP ms2) in a physiologically defined number of 30-second EEG signal epochs accord-ing to standard criteria developed by Rechtschaffen and Kales (1968) during the waking state during sleep (W) stages S1 + S2 and S3 + S4 of NREM sleep and REM sleep at 122 m and after 30 - 41 h of acclimatisation at 3480 m in the five subjects
Stages Subjects 122 m 3480 m Epochs Epochs
Awakening during sleep N Mean SD N Mean SD Delta P value CS 7 33449 24257 35 25486 16753 minus7963 ns MR 3 50528 7837 3 30899 5845 minus19629 00254 GM 13 29277 9809 12 28573 22336 minus704 ns DC 140 17740 23122 157 11197 11829 minus6543 0002 SS 27 34293 25655 64 32203 20358 minus2090 ns No of epochs 190 271 No of subjects Mean SEM No of subjects Mean SEM Delta subjects subjects Average 5 33057 18136 5 25672 15424 minus7385 ns
S1+ S2 Epochs Epochs N Mean SD N Mean SD Delta P value CS 45 29292 16380 34 22533 13712 minus6758 MR 58 21950 8436 52 16258 9971 minus5692 ns GM 53 20200 11240 54 15218 7421 minus4982 00015 DC 302 7420 2998 322 6021 3589 minus1398 00079 SS 200 25316 18423 237 29006 16917 3690 00001 No of epochs 658 683 00297 No of subjects Mean SEM No of subjects Mean SEM Delta subjects subjects Average 5 20836 11495 5 17807 10322 minus3028 ns
S3+ S4 Epochs Epochs N Mean SD N Mean SD Delta P value CS 16 13176 3660 9 8733 5824 minus4443 00275 MR 11 17278 4805 6 6865 720 minus10412 00001 GM 9 12659 6614 7 11634 6801 minus1025 ns DC 98 6917 3007 25 5262 4686 minus1655 00307 SS 92 15005 5017 59 10516 9526 minus4489 00002 No of epochs 226 106 No of subjects Mean SEM No of subjects Mean SEM Delta subjects subjects Average 5 130007 4621 5 9202 3805 minus3798 ns
REM Epochs Epochs N Mean SD N Mean SD Delta P value CS 8 39198 13892 5 29459 13908 minus938 ns MR 23 33035 14907 13 22879 8514 minus10156 0032 GM 10 23552 6159 13 29734 9673 6182 ns DC 62 21174 24128 30 17396 17929 minus3778 ns SS 72 25442 11874 52 14723 7978 10719 00001 No of epochs 175 113 No of subjects Mean SEM No of subjects Mean SEM Delta subjects subjects Average 5 28480 14192 5 22838 116000 minus5642 ns
Footnotes to Table 8 (1)One-way ANOVA showed a significant difference in the average of the total power (TP) between conditions (DF 73239 F = 5433 P = 00004) Post-hoc Fisher analysis revealed a significant difference between the average of the TP recorded at 122 m during waking (W) and that recorded at 122 m during stages S1 + S2 (P lt 005)and during stages S3 + S4 (P lt 005) Post-hoc Fisher analysis revealed a significant difference between the average of the TP recorded at 122 m during waking (W) and that at 3480 m during stages S1 + S2 (P lt 005) and stages S3 + S4 (P lt 005) Post-hoc Fisher analysis revealed a significant difference between the average of the TP recorded at 122 m during waking (W) and that at 3480 m during REM sleep (P lt 005) Post-hoc Fisher analysis revealed a significant difference between the average of the TP recorded at 3480 m during stages S3 + S4 and that at 122 m during stages S3 + S4 (P lt 005) Post-hoc Fisher analysis revealed a significant difference between the average of the TP recorded at 122 m during stages S1 + S2 and that at 3480 m dur- ing REM sleep (P lt 005) Post-hoc Fisher analysis revealed a significant difference between the average of the TP recorded at 3480 m during stages S1 + S2 and that at 122 m during REM sleep (P lt 005) Post-hoc Fisher analysis revealed a significant difference between the average of the TP recorded at 122 m during stages S3 + S4 and that at 122 m during REM sleep (P lt 005) Post-hoc Fisher revealed a significant difference between the average of the TP recorded at 3480 m during stages S3 + S4 and that at 122 m during REM sleep (P lt 005) Post-hoc Fisher analysis revealed a significant difference between the average of the TP recorded at 3480 m during stages S3 + S4 and that at 3480 m during REM sleep (P lt 005) in the five subjects Post-hoc analysis with Studentrsquos t-test showed a significant difference (P lt 005) between the average of the total power (TP ms2) in a physiologically defined number of 30-second signal epochs according to standard criteria developed by Rechtschaffen and Kales (1968) recorded during the waking state during sleep (W) (190 epochs) and that during stages S3 + S4 (226 epochs) at 122 m (P lt 00068) in the five subjects Post-hoc analysis with Studentrsquos t-test showed a significant difference (P lt 0028) between the average of the total power (TP ms2) in a physiologically defined number of 30-second signal epochs according to standard criteria developed by Rechtschaffen and Kales (1968) recorded during the waking state during sleep (W) (271 epochs) and that during stages S3 + S4 (106 epochs) at 3480 m in the five subjects Post-hoc analysis with Studentrsquos t-test showed a significant difference (P lt 0003341) between the average of the total power (TP ms2) in a physio-logically defined number of 30-second signal epochs according to standard criteria developed by Rechtschaffen and Kales (1968) recorded during stages S3 + S4 (226 epochs) and that during REM sleep (175 epochs) at 122 m in the five subjects Post-hoc analysis with Studentrsquos t-test showed a significant difference (P lt 0002613) between the average of the total power (TP ms2) in a physiologically defined number of 30-second signal epochs according to standard criteria devel-oped by Rechtschaffen and Kales (1968) recorded during stages S3 + S4 (106 epochs) and that during REM sleep (113 epochs) at 3480 m in the five subjects
I GRITTI ET AL
Copyright copy 2013 SciRes JBBS
42
Research into the causes of cardiovascular mortality ex- perimental evidence for a predisposition to fatal arrhyth- mias signs of tonic or phasic increased sympathetic ac- tivity and reduced parasympathetic-cholinergic-vagal ac- tivity has advanced efforts for the development of quan- titative markers of heart rate variability (HRV) (Task Force [1])
51 Heart Rate Variability during Wake and Sleep
HRV has been established as a non-invasive tool to study cardiac autonomic activity and proposed as a predictor for evaluating the increased risk of cardiac death Inter- actions of changes in cardiac autonomic nervous modu- lation in various types of subjects are under study by the Task Force [1] An overnight declining trend of HRV has been found to increase during sleep [14] Otzenberger and co-workers [14] demonstrated that overnight profiles of the R-R intervals are related to changes in the sleep EEG mean frequency sign which reflects the depth of sleep During attentive-to-quiet waking and from the lighter to the deeper phases of sleep HRV has been shown to be affected by vagalsympathetic modulation and control
52 Heart Rate Variability and Mountain Marathon Runners
Past studies showed that the high-altitude endurance per- formance of mountain marathoners is appreciably re- duced at 5200 m Based on their clinical characteristics mountain marathoners can be considered as a physio- logical model for studying cardiovascular alterations of long-lasting stay and exercise at high altitude Over the last 12 years the time course of cardiovascular changes in the mountain marathon runners has been assessed be- fore during and after the end of races at altitude In sea- level native mountain marathoners long-lasting training mdashfrom sea level to altitudemdashcan lower the HR during rest and exercise associated with a decrease in sympa- thetic modulation and a rise in parasympathetic activity [20] As in normal subjects so too in well-trained moun- tain marathoners cardiovascular modifications can change continuously over a 24-h period during acclimatization and the nocturnal sleep-wake-cycle at low and high alti- tudes In mountain marathoners just as in normal sub- jects HRV alterations at altitude may include altered resting HR due to changes in the vagal and sympathetic components besides the appearance of sinus arrhythmia during waking and periodically during nocturnal S1 + S2 NREM sleep and REM sleep breathing
As suggested by the Task Force [1] the present study data were obtained during sleep and as such may add valuable insights for research into HRV With this study we also wanted to determine whether 20 years of training
between 122 m and 5200 m altitude could have exerted in addition to the changes reported elsewhere [912] a high impact on the autonomiccardiovascular systems of the mountain marathon runners during the nocturnal sleep- wake cycle at low and at high altitudes
Our study documents that in mountain marathoners the nocturnal sleep-wake cycle at 122 m is highly influ- ence by autonomic parasympathetic activity and by in- creased autonomic parasympathetic activity during the deepening of NREM sleep The results also show a phy- siological decrease in parasympathetic activity versus an increase in sympathetic activity during all phases of the nocturnal sleep-wake cycle at 3480 m Surprisingly our study also documents that the nocturnal sleep-wake cycle at 3480 m is still characterized by an increase in auto- nomic parasympathetic activity during light S1 + S2 NREM sleep At both altitudes the trend of the balance of parasympatheticsympathetic activity recorded during REM sleep is similar to that recorded during the awak- ening state (W)
53 R-R Intervals (ms)
531 Sea Level (122 m) The averages of the R-R intervals recorded at 122 m did not change significantly between nocturnal awakenings during sleep and sleep stages (R-R interval range 1200 - 1300 ms) The average R-R interval at 122 m during the awaking state of sleep was similar to that recorded dur- ing the wake state in 12 trained endurance athletes who performed a minimum of 3 h of aerobic activity per week [21]
532 High Altitude (3480 m) The majority of the ECG alterations in the five mountain runners during sleep at an altitude of 3480 m and at a barometric pressure (PB) of 495 mm Hg and between 30 and 41 h of acclimatization were signs of sinus arrhyth- mia during the early stages (S1 + S2) of NREM sleep and during REM sleep At 3480 m the average of the R-R intervals we recorded during S1 + S2 of NREM sleep were significantly longer than those observed during the awaking period (W) during sleep The longest average R-R intervals were recorded during S1 + S2 at 3480 m These results suggest that at altitude there was still a significant elevation of parasympathetic tone during S1 + S2 of slow-wave sleep versus the waking state during sleep at 3480 m
533 Sea Level (122 m) and High Altitude (3480 m) There was a nonpathological significant reduction in the R-R intervals during the awakening period during sleep (W) S1 + S2 S3 + S4 of NREM and REM sleep stages and after 30 - 41 h of acclimatization to an altitude of
I GRITTI ET AL
Copyright copy 2013 SciRes JBBS
43
3480 m versus the averages of the R-R intervals ob- served during the same stages at 122 m
The longest average R-R intervals were recorded dur- ing the light stage of slow-wave-sleep (S1 + S2) at 122 m (suggesting high vagal activation) and the lowest aver- age R-R intervals were recorded during the awakening period during sleep (W) at 3480 m (indicating an in- crease in noradrenergic activation) Overall the average R-R intervals at high altitude were significantly lower than those recorded at 122 m with the average R-R in- tervals we recorded at 3480 m even during the awaken- ing period (W) during sleep (935 ms) The absolute value of the R-R intervals Bernardi and co-workers [22] found in 10 sea-level native subjects at low altitude was 1002 plusmn 45 ms and 809 plusmn 116 ms in 3 high-altitude native sub- jects living at low altitude In that study the average R-R intervals in the 10 sea-level native subjects and in 3 high- altitude native subjects (living at low altitude) exposed to 4970 m for 3 days were 775 plusmn 57 and 749 plusmn 47 respec- tively The delta of the averages of the R-R intervals that we calculated in our subjects after exposure to 3480 m was similar to the delta of the R-R intervals Bernardi and co-workers [22] reported In our study the average R-R intervals recorded at 122 m and 3480 m during all sleep stages were also longer than those observed by Lanfran- chi and co-workers [2] in 41 mountaineers during wak- ing with and without AMS and after acute exposure to approximately 4500 m Overall the average R-R inter- vals we recorded at 122 m and 3480 m demonstrate that frequent exposure to altitudes between 122 m and 5500 m for more than 20 years may have improved the effi- cacy of vagal modulation at low and high altitude during nocturnal awakening and sleep
54 Simple Linear Regression Analysis between the R-R Intervals and the SpaO2
Linear regression analysis showed a significant negative correlation between the changes in the average SpaO2 and the changes in the average R-R intervals The sig- nificant negative correlation between SpaO2 and R-R intervals may indicate that the average quantity of oxy- gen supplied during nocturnal sleep stages may be di- rectly responsible for the R-R interval changes observed during nocturnal sleep particularly at high altitude
55 Total Power of Very Low Frequency [(VLF ms2) (lt004 Hz)] Such as the Thermoregulation-Related HRV
The thermoregulatory-related very low frequency (VLF) rhythm may be related to thermoregulatory changes or chemical and acid-base equilibrium changes or both In- terestingly the changes in the VLF are significantly co- related with the PCO2 changes (personal observations
DF13839 R-squared = 0191 coefficient = ndash970294 Ftest = 8982 P = 00048 t = 1146) tCO2 changes (personal observations DF13839 R-squared = 0189 coefficient = ndash21649785 Ftest = 8871 P = 0005 t = 2978) and
3HCOminus changes (personal observations DF13839 R- squared = 0184 coefficient = ndash21682826 Ftest = 8557 P = 00058 t = 2925)
551 Sea Level (122 m) At 122 m the average VLF decreased during S1 + S2 and significantly so during S3 + S4 compared with the average VLF recorded during the waking period (W) The average VLF during S3 + S4 at 122 m was signifi- cantly shorter than the average VLF recorded during the awakening period (W) during sleep The average VLF during S3 + S4 at 122 m was shorter than the average VLF recorded during REM sleep At 122 m there was a decrease in the average VLF during NREM sleep and an increase in VLF during the desynchronized waking state The average VLF during desynchronized REM sleep at 122 m was slightly shorter than the average VLF re- corded during the awakening period (W) during sleep
552 High Altitude (3480 m) At 3480 m the average VLF decreased during S1 + S2 and significantly so during S3 + S4 compared with the average VLF recorded during the awaking period (W) during sleep The average VLF during S3 + S4 at 3480 m was significantly shorter than the average VLF recorded during the awakening period (W) during sleep At 3480 m there was a decrease in the average VLF during NREM sleep and an increase during the desynchronized awaking state during sleep and REM sleep The average VLF during REM sleep at 3480 m was slightly shorter than that observed during the awakening period (W) dur- ing sleep
553 Sea Level (122 m) and High Altitude (3480 m) The average VLF during the awakening period (W) dur- ing sleep S1 + S2 S3 + S4 and REM sleep at 122 m was longer but not significantly so compared with the average VLF observed at 3480 m
56 Total Power of Low Frequency [(LF ms2) (004 - 015 Hz)] Range The LF Appears to Have a Widespread Neuronal Genesis and Is Considered as a Marker of Sympathetic Modulation or a Marker of Both Sympathetic and Vagal Modulation
561 Sea Level (122 m) Statistical analysis of our data revealed that the average of the LF during desynchronized REM sleep at 122 m was significantly longer than that recorded during syn-
I GRITTI ET AL
Copyright copy 2013 SciRes JBBS
44
chronized S3 + S4 sleep These data demonstrate an in- crease in parasympathetic tone during REM sleep
562 High Altitude (3480 m) In altitude there was a significant increase in sympathetic tone throughout the awakening period (W) during sleep the S1 + S2 and the REM sleep The sympathetic tone decreased during the deep phase of slow wave sleep (S3 + S4)
563 Sea Level (122 m) and High Altitude (3480 m) No significant changes were found between the average LF recorded at 122 m and that recorded at 3480 m How- ever in some subjects a significant decrease emerged between the average of LF recorded during the awaken- ing period (W) during sleep S1 + S2 S3 + S4 and REM sleep at 122 m versus the average of LF recorded at 3480 m
The average LF recorded in all 5 mountain marathon- ers and in all 4 stages of desynchronization and synchro- nization at 122 m and at 3480 m (Table 3) were longer than the average LF Ako and co-workers [3] observed in 7 subjects during sleep at sea level
We also found a decrease in the average LF during S3 + S4 at 122 m and 3480 m compared with the average LF recorded during S1 + S2 The average LF recorded in our study during the desynchronized REM sleep state at 122 m and 3480 m returned to similar values we recorded during the desynchronized awakening period (W) during sleep A comparison of LF indices in the different sleep stages recorded at 122 m and at 3480 m revealed a de-crease in the LF from the waking to the deep stages of sleep The average LF during REM sleep was similar to the average LF recorded during waking Like those of Ako and co-workers [3] our data suggest that sympa- thetic nervous activity decreases as sleep deepens and concomitantly increases during desynchronization of the awakening period (W) during sleep and even more so during desynchronization during REM sleep In our study the average LF a marker of sympathetic modulation during the awakening period (W) during sleep S1 + S2 S3 + S4 and REM sleep at 122 m and at 3480 m was lower
57 LFRRNU
The aim of this study was also to verify whether auto- nomic variables at low altitude could predict prodromic signs of AMS when subjects were exposed to high alti- tude or whether subjects experienced AMS at high alti- tude Autonomic cardiovascular function was also ex- plored by measuring widespread neuronal genesis rhythm low frequency in normalized unit (LFRRNU) to study sympathetic modulation
Lanfranchi and co-workers [2] reported a substantial increase in the LFRRNU component at altitude suggest- ing an increase in sympathetic modulation in response to hypoxia at 4500 m During exposure to high altitude besides shorter R-R intervals we also found a relative though not significant increase in the LFRRNU compo- nent
We agree with Lanfranchi and co-workers [2] that this increase in the LFRRNU component may reflect an in- crease in the sympathetic modulation of HR During ex- posure to 3480 m R-R interval variability decreased as the LF component increased suggesting an increase in sympathetic modulation in response to hypobaric-hypo- xia The average LFRRNU Lanfranchi and co-workers [2] recorded in 24 subjects without AMS after exposure to approximately 4500 m during waking was similar to the average we recorded in our subjects during the awaken- ing period (W) during sleep at 3480 m (73 vs 75 respec- tively)
LFRRNU has been said to be a quantitative marker of the cardiac vigil (Vanderwalle et al [23]) and sympa- thetic outflow of the autonomic nervous system By means of spectral analysis of subjects in supine position the Task Force [1] calculated an average LFRRNU of 54 which is fairly similar to the average values in 45 of our subjects 47 in CS 45 in DC and 39 in SS in supine po- sition during S3 + S4 at 122 m Overall the average LFRRNU reported by the Task Force [1] is somewhat lower than our data (54 vs 39 - 89 respectively)
From a steady-state HRV analysis Murrel and co- workers [24] found an average LFRRNU of 77 in the standing position and premarathon conditions an average between 72 and 92 immediately after a marathon and an average of 73 in the standing position at 48 h postmara- thon These data appear similar to the data we recorded at 122 m and 3480 m during the awakening S1 + S2 S3 + S4 and REM stages of sleep
Specifically at 122 m there was a decrease in LFRRNU as sleep depth increased during the desynchronized phase of sleep (the awakening state) the LFRRNU reached the values observed during REM sleep At 3480 m there was a decrease in LFRRNU as sleep deepened during the de- synchronized phase of sleep (the awakening state) the LFRRNU reached the values recorded during the REM phases at 3480 m
58 High Frequency
Efferent vagal activity is a major contributor to the high frequency (HF) component (Task Force [1]) which pri- marily reflects respiration-driven vigil modulation of the sinus rhythm Other factors such as voluntary controlled respiration cold stimulation of the face or rotational mo- tor stimuli (see above) can occur physiologically during
I GRITTI ET AL
Copyright copy 2013 SciRes JBBS
45
sleeping and might confound results Spectral analysis of stationary supine subjects revealed an average normal HF close to 975 ms2 (Task Force [1]) Saito and co-workers [25] reported an average HF of 780 plusmn 211 ms2 in 21 sub- jects during waking at low altitude and an average HF between 61 plusmn 44 and 112 plusmn 128 ms2 after exposure for 4 - 6 h at PB 495 mm Hg Lanfranchi and co-workers [2] reported an average HF between 102 plusmn 37 and 157 plusmn 43 ms2 in subjects exposed to approximately 4500 m or between 135 plusmn 30 and 64 plusmn 4 ms2 in those with no signs of AMS Briefly in the subjects without AMS there was a non significant increase in the HF component At low altitude the average HF in our five mountain marathon runners increased as sleep deepened and decreased dur- ing REM sleep to levels similar to those observed in the waking state The average HF at altitude was 1572 ms2 during the awakening state 1610 ms2 during S1 + S2 1480 ms2 during S3 + S4 and 1159 ms2 during REM sleep The average HF decreased during the sleep stages Surprisingly the average HF of 1159 ms2 during REM sleep at high altitude was lower than the average ob- served during the desynchronized state during waking
As reported by the Task Force [1] we also found the HF vigil component of the power spectrum to be aug- mented during NREM sleep at low altitude
59 HFRRNU
The average of total power expressed in high frequency RR normalized units (HFRRNU) is considered a marker of vagal modulation of the autonomic system The values that we found at low altitude during the awakening pe- riod (W) during sleep during S2 + S3 and S3 + S4 and during REM sleep were similar to those Murrell and co- workers [24] recorded at premarathon postmarathon and 48 h postmarathon assessment under controlled normal breathing and standing conditions Our HFRRNU data recorded during the awakening period (W) during sleep at 122 and were similar to those they reported during REM sleep (2347 versus 2264 respectively) In their evaluation of LFRRNU the average HF (controlled brea- thing) was 5845 during the premarathon stage 45 during and 53 at 48 h postmarathon The average HFRRNU de- creased immediately after the race and at 48 h postmara- thon All these values are very close to the average LFRRNU we recorded in the subjects during S3 + S4 sleep at low altitude
Of note is that HFRRNU at low and at high altitudes increases at sleep onset and peaks during the deep stage of sleep (S3 + S4) at altitude (5691) After exposure to 3480 m at a PB of 495 mm Hg for 30 - 41 h there was a non significant reduction in HFRRNU across all sleep stages The average HFRRNU during the awakening pe- riod (W) during sleep at 3480 m was lower but still simi-
lar to that at 122 m These values were similar though lower than those Murrell and co-workers [24] recorded immediately and at 48 h post-marathon at altitude
Our HFRRNU data recorded during sleep at 122 m and 3480 m were also similar to those Lanfranchi and co- workers [2] reported in subjects without AMS and those with AMS (16 and 31 respectively) during the supposed diurnal state and after exposure to 4500 m
Compared with the HFRRNU reported by the Task Force [1] our data recorded during the awakening state S1 + S2 and S3 + S4 and REM sleep at sea level and at 3480 m were 2131 and 3111 respectively
510 LFHF Ratio
Exercise and training at low and high altitudes may have modified autonomic nervous system balance and thus the LFHF ratio The LFHF ratio is considered by some in- vestigators as the mirror of sympathovagal balance or a reflection of sympathetic modulation (Ako et al [3]) In agreement with Ako and co-workers [3] we observed significantly at low altitude but indeed also at high alti- tude a significant decrease in the LFHF component as sleep deepened In agreement with Ako and co-workers [3] we also observed that the sympathetic nervous sys- tem is activated during the two desynchronisation phases of REM sleep and deactivated during NREM sleep at low and high altitude
In detail we analyzed the dynamics of nocturnal fluc- tuations of autonomic nerve activities in sleep stages classified by Rechtschaffen and Kalesrsquos criteria These criteria have not yet been investigated in association with HRV indices particularly during hypoxic conditions Ako and co-workers [3] found an increase in the LFHF ratio (251 plusmn 017) during REM sleep and a significant linear decrease during NREM sleep (S1 230 plusmn 029 S2 185 plusmn 009 S3 078 plusmn 006 S4 251 plusmn 017) Like Ako and co-workers [3] we noted a reduction in the LFHF ratio at 122 m and at 3480 m during NREM sleep (S1 + S2122 m 31187 S1 + S23480 m 51242 S3 + S4122 m 16733 S3 + S43480 m 32109) and an increase during REM sleep (REM122 m 44739 REM3480 m 69132) to the level found during the awaking period (W) during sleep (W122m 46446 and W3480 m 60036) We also found that the av- erage LFHF ratio during S3 + S4 of NREM sleep at 122 m (LFHF = 16733) was similar to that reported by the Task Force [1] (LFHF 15 - 20) in the spectral analysis of stationary supine 5-minute recordings In our study the average LFHF ratio at 122 m and 3480 m during the awaking period (W) during sleep (W122 m 46446 and W3480 m 60036 respectively) was lower yet similar to the average LFHF ratio Lanfranchi and co-workers [2] found during the waking state at 4500 m in mountaineers with and without AMS (34 plusmn 13 and 83 plusmn 14 respectively)
I GRITTI ET AL
Copyright copy 2013 SciRes JBBS
46
Saito and co-workers [25] found an average LFHF ratio of 26 plusmn 08 at PB 760 mm Hg at sea level during the re- laxed waking state This was similar to the value we found (16733) during S3 + S4 at 122 m They reported an average LFHF ratio of 35 plusmn 23 at 3456 m and at a PB of 495 mm Hg which was similar to the average of 32109 that we recorded during S3 + S4 at 3480 m The average LFHF ratio that we found in all five mountain runners during S3 + S4 (16733 plusmn 10847) at 122 m was similar to that reported by the Task Force [1] In some of the mountain marathon runners at low altitude at 122 m and after 30 - 41 h of acclimatization at 3480 m during the different stages of desynchronized and synchronized sleep the average LFHF ratio reached the normal values reported by the Task Force [1] (between 15 and 20) The LFHF ratio value of 2 which is considered normal by the Task Force [1] was recorded at 122 m in 15 sub- jects (SS) during the awakening period (W) of sleep 35 subjects (CS DC SS) during S1 + S2 and 55 subjects during S3 + S4 25 subjects (CS SS) during the REM sleep stage A LFHF ratio value of 2 was reached after 30 - 41 h of acclimatization at 3480 m by 15 subjects (GM) during the awakening period (W) of sleep 15 subjects (CS) during S1 + S2 and 25 subjects (CS GM) during S3 + S4 No changes were noted between the av- erage LFHF ratio recorded in all five mountain runners at 122 m and after 30 - 41 h of acclimatization at 3480 m and during all four stages of sleep awakening period (W) during sleep S1 + S2 S3 + S4 and REM sleep These results suggest highly controlled regulation of sympa- thovagal balance on exposure to moderate hypoxia con- ditions As reported in Table 7 several mountain mara- thon runners showed very high control of sympathovagal balance their LFHF ratio was similar to that reported by the Task Force [1] or did not differ between 122 m and 3480 m after 30 - 41 h of acclimatization during the awakening period (W) during sleep during S1 + S2 during S3 + S4 or during the REM sleep Cornolo and co-workers [20] reported an average LFHF ratio of ~60 in trained high-altitude native subjects 6 - 8 h after the end of a marathon performed between 4100 and 4400 m This was similar to the average LFHF ratio that we re- corded at 3480 m during the desynchronized state of sleep specifically during the awakening period (W) dur- ing sleep (60036 plusmn 50276) and during the REM sleep at the same altitude (69132 plusmn 36806)
511 Total Power
We observed significant parallel changes in TP recorded at low (PB about 740 mm Hg) and high (PB 495 mm Hg) altitude between the awakening period (W) during sleep and S3 + S4 of sleep We also found significant parallel changes in the TP recorded during REM sleep and the
average of TP recorded during S3 + S4 at 122 and 3480 m These changes may reflect changes in cardiac re- spiratory and sympathovagal balance In general in indi- vidual mountain marathon runners we found a decrease in the total power at altitude The components of HRV are thought to be influenced by both neuronal and hu- moral factors (Task Force [1]) Saito and co-workers [25] reported that humoral control of the autonomic nervous system plays an important role in the survival of victims under hypoxic conditions at high altitude
6 Functional Significance
Physical training at low and high altitudes may have in- duced marked autonomic adaptations in the mountain marathon runners over the course of their years of train- ing The resting heart rate was lower at sea level because parasympathetic modulation predominates over higher sympathetic control at high altitude By constantly main- taining their training levels at low and high altitudes for more than 20 years the mountain runners may have shifted their cardiovascular autonomic control toward a greater parasympathetic modulation particularly at sea level Rest and training under hypoxia conditions may have balanced the prevalence of parasympathetic modu- lation as well as improved control of phasic sympathetic responses
These well-trained runners seem to be exceptionally adapted to the high altitude environment [4-13] Strenu- ous exercise is known to induce profound cardiovascular modifications but with a caveat for non-professional ma- rathoners
We agree with Lanfranchi et al [2] that HRV analysis has proved to be essential for investigating the mountain sickness the balance of the sympathetic and parasympa- thetic function of the autonomic nervous system at low and high altitude in mountain marathon runners HRV analysis could also be very useful for evaluating de- creases in parasympathetic and increases in sympathetic tone of the autonomic nervous system during acclimati- zation at altitude of mountain marathon runners who ge- nerally have a tonic prevalence of parasympathetic tone at low altitude
R-R interval variability was observed in the mountain marathon runners during sleep at 122 m (ie a controlled increase in parasympathetic tone during NREM sleep and an increased sympathetic tone during the awakening pe- riod (W) during sleep and during REM sleep) At high altitude the RR-intervals we observed were similar to those Sacknoff and co-workers [21] reported in athletes and controls Moreover the major ECG alterations evi- dent during sleep at an altitude of 3480 m at a PB of 495 mm Hg and after 30 - 41 hours of acclimatization were an increase in HR together with signs of sinus arrhyth-
I GRITTI ET AL
Copyright copy 2013 SciRes JBBS
47
mia during periodic breathing in S1 + S2 of NREM sleep and in REM sleep
This study did not find abnormal reductions in the R-R interval during the awakening period (W) during sleep S1 + S2 S3 + S4 and REM sleep between 30 and 41 h of acclimatization at 3480 m in these well-trained moun- tain marathon runners
The HRV data observed at altitude suggest that the runners possess an intrinsic high parasympathetic tone that at high altitude promptly compensates the physio- logical increase in sympathetic tone due to a periodic significant decrease in peripheral oxygen saturation dur- ing sleep
Not in group average but in several individual runners we found a significant reduction in the LF component at high altitude which may be due to the rhythmic increase of sympathetic discharge of the central brain stem center
In comparison to the average calculated at low altitude we also found a significant decrease in the average of the power of HF during S3 + S4 of NREM sleep at 3480 m This significant reduction probably indicates a decrease in the vagal parasympathetic components of the brain- stem generator
The study demonstrates that cardiovascular modifi- cations during sleep and after 30 - 41 h of acclimatization at high altitude can occur even in mountain marathoners who have benefited from 20 years of training at low and high altitude Physicians should therefore take the results of HRV analysis into account to improve the training and performance particularly at altitude
7 Acknowledgements
Thanks are due to K Britsch for reading the manuscript We thank the FILA Sky Marathon for economical sup- port from 1998 up to 2003
REFERENCES [1] Task Force of the European Society of Cardiology and
North America Society of Pacing Electrophysiology ldquoHeart Rate Variability Standard of Measurement Phy- siological Interpretation and Clinical Userdquo European Heart Journal Vol 17 1996 pp 354-381 doi101093oxfordjournalseurheartja014868
[2] P A Lanfranchi R Colombo G Cremona P Baderna L Spagnolati G Mazzuero P Wagner L Perini H Wagner C Cavallaro and P Giannuzzi ldquoAutonomic Car- diovascular Regulation in Subjects with Acute Mountain Sicknessrdquo American Physiology Heart Circulation Physi- ology Vol 289 No 6 2005 pp H2364-H2372 doi101152ajpheart000042005
[3] M Ako K Tokuhiro S Uchida S Miyazaky K Nishi- hara J Mukai K Hirao J Ako and Y Okubo ldquoCorrela- tion between Electrophysiography and Heart Rate Vari- ability during Sleeprdquo Psychiatry and Clinical Neurosci-
ence Vol 57 No 1 2003 pp 59-65 doi101046j1440-1819200301080x
[4] G Banfi M Marinelli G S Roi A Colombini M Pon- tillo M Giacometti and S Wade ldquoGrowth Hormone and Insulin-Like Growth Factor I in Athletes Performing a Marathon at 4000 m of Altituderdquo Growth Regulation Vol 4 1994 pp 82-86
[5] M Marinelli G S Roi M Giacometti P Bonini and G Banfi ldquoCortisol Testosterone and Free Testosterone in Athletes Performing a Marathon at 4000 m of Altituderdquo Hormon Research Vol 41 No 5-6 1994 pp 225-229 doi101159000183929
[6] G Banfi M Marinelli G S Roi and M Giacometti ldquoPlatelet Indices in Athletes Performing a Race in Alti- tude Environmentrdquo Journal of Clinical Laboratory Ana- lysis Vol 9 No 1 1995 pp 34-36 doi101002jcla1860090106
[7] G Banfi M Marinelli P Bonini I Gritti and G S Roi ldquoPepsinogens and Gastrointestinal Symptoms in Moun- tain Marathon Runnersrdquo International Journal Sports Me- dicine Vol 17 No 8 1996 pp 554-558 doi101055s-2007-972894
[8] G Banfi M Pontillo M Marinelli A Dolci and G S Roi ldquoThyrotropin and Free Thyroid Hormones in Ath- letes during and after Ultra Endurance Sport Perform- ancesrdquo Journal Clinical of Ligand Assay Vol 21 No 3 1998 pp 331-334
[9] G S Roi M Giacometti and S P von Duvillard ldquoMara- thons in Altituderdquo Medicine amp Science in Sports amp Exer- cise Vol 31 No 5 1999 pp 723-728 doi10109700005768-199905000-00016
[10] G Banfi and A Dolci ldquoPreanalytical Phase of Sport Bio- chemistry and Haematologyrdquo The Journal of Sports Me- dicine and Physical Fitness Vol 43 No 2 2003 pp 223-230
[11] G Pelamatti M Pascotto and C Semenza ldquoVerbal Free Recall in High Altitude Proper Names vs Common Namesrdquo Cortex Vol 39 No 1 2003 pp 97-103 doi101016S0010-9452(08)70077-7
[12] G Fragasso A Palloshi S Roi E Rossetti G Monaco A Dolci A Margonato and S Chierchia ldquoTransient Left Ventricular Diastolic Dysfunction Following Strenuous Exerciserdquo Sport Science Health Vol 1 No 1 2004 pp 31-35 doi101007s11332-004-0007-7
[13] I Gritti M Martignoni R Calcaterra and G S Roi ldquoElectroencephalographic Changes after a Marathon at 4300 m of Altituderdquo Journal of Behavioral and Brain Science Vol 2 No 3 2012 pp 380-386 doi104236jbbs201223043
[14] H Otzenberger C Simon C Gronfier and G Branden- berger ldquoTemporal Relationship between Dynamic Heart Rate Variability and Electroencephalographic Activity during Sleep in Manrdquo Neuroscience Letters Vol 229 No 3 1997 pp 173-176 doi101016S0304-3940(97)00448-5
[15] J H Coote ldquoMedicine and Mechanisms in Altitude Sick- ness Recommendationsrdquo Sports Medicine Vol 20 No 3 1995 pp 148-159
I GRITTI ET AL
Copyright copy 2013 SciRes JBBS
48
doi10216500007256-199520030-00003
[16] M A Conney R W van Arts L A A Kolleacutee J C W Hopman G B A Stoelinga P Herman and H P van Geijn ldquoHeart Rate Variabilityrdquo Annals of Internal Medi- cine Vol 118 No 6 1993 pp 436-447
[17] A Rechtschaffen and A Kales ldquoA Manual of Standard- ized Terminology Techniques and Scoring System for Sleep Stages of Human Subjectsrdquo BISBRI UCLA Los Angeles 1968
[18] F R Calaresu A A Faiers and G J Mogenson ldquoCentral Neuronal Regulation of the Heart and Blood Vessels in Mammalsrdquo Progress Neurobiology Vol 5 No 1 1975 pp 1-35 doi1010160301-0082(75)90006-4
[19] H Scholz ldquoAdaptational Responses to Hypoxiardquo Ameri- can Journal of Physiology and Regulatory Integrative Comparative Physiology Vol 282 No 6 2002 pp R1541-R1543
[20] J Cornolo J V Brugniaux J L Marcarlupu C Privat F Leon-Velarde and J P Richalet ldquoAutonomic Adaptations in Andean-Trained Participants to 4220 m Altitude Mara- thonrdquo Medicine and Science in Sports and Exercise Vol 37 No 12 2005 pp 2148-2153 doi10124901mss00001799011928085
[21] D M Sacknoff G W Gleim N Stachenfeld and N L Complan ldquoEffect of Athletic Training on Heart Variabil-
ityrdquo American Heart Journal Vol 127 No 5 1994 pp 1275-1278 doi1010160002-8703(94)90046-9
[22] L Bernardi C Passino G Spadaccini A Calciati R Robergs R Green E Martignoni I Anand and O Ap- penzeller ldquoCardiovascular Autonomic Modulation and Activity of Carotid Baroreceptors at Altituderdquo Clinical Science Vol 95 1998 pp 565-573 doi101042CS19980046
[23] G Vandewalle B Middleton S W R Rajaratnam B M Stone B Thorleifsdottir J Aredent and D J Dijk ldquoRo- bust Circadian Rhythm in Heart Rate and Its Variability Influence of Melatonin and Photoperiodrdquo Journal of Sleep Research Vol 16 No 2 2007 pp 148-150 doi101111j1365-2869200700581x
[24] C Murrell L Wilson J D Cotter S Lucas S Ogoh G Keith and N Ainslie ldquoAlteration in Autonomic Function and Cerebral Hemodynamics to Orthostatic Challenge Fol- lowing a Mountain Marathonrdquo Journal Applied Physiol- ogy Vol 103 No 1 2007 pp 88-96 doi101152japplphysiol013962006
[25] S Saito K Tanobe M Yamada and F Nishihara ldquoRela- tionship between Arterial Oxygen Saturation and Heart Rate Variability at High Altitudesrdquo American Journal of Emergency Medicine Vol 23 No 1 2005 pp 8-12 doi101016jajem200409023

I GRITTI ET AL
Copyright copy 2013 SciRes JBBS
48
doi10216500007256-199520030-00003
[16] M A Conney R W van Arts L A A Kolleacutee J C W Hopman G B A Stoelinga P Herman and H P van Geijn ldquoHeart Rate Variabilityrdquo Annals of Internal Medi- cine Vol 118 No 6 1993 pp 436-447
[17] A Rechtschaffen and A Kales ldquoA Manual of Standard- ized Terminology Techniques and Scoring System for Sleep Stages of Human Subjectsrdquo BISBRI UCLA Los Angeles 1968
[18] F R Calaresu A A Faiers and G J Mogenson ldquoCentral Neuronal Regulation of the Heart and Blood Vessels in Mammalsrdquo Progress Neurobiology Vol 5 No 1 1975 pp 1-35 doi1010160301-0082(75)90006-4
[19] H Scholz ldquoAdaptational Responses to Hypoxiardquo Ameri- can Journal of Physiology and Regulatory Integrative Comparative Physiology Vol 282 No 6 2002 pp R1541-R1543
[20] J Cornolo J V Brugniaux J L Marcarlupu C Privat F Leon-Velarde and J P Richalet ldquoAutonomic Adaptations in Andean-Trained Participants to 4220 m Altitude Mara- thonrdquo Medicine and Science in Sports and Exercise Vol 37 No 12 2005 pp 2148-2153 doi10124901mss00001799011928085
[21] D M Sacknoff G W Gleim N Stachenfeld and N L Complan ldquoEffect of Athletic Training on Heart Variabil-
ityrdquo American Heart Journal Vol 127 No 5 1994 pp 1275-1278 doi1010160002-8703(94)90046-9
[22] L Bernardi C Passino G Spadaccini A Calciati R Robergs R Green E Martignoni I Anand and O Ap- penzeller ldquoCardiovascular Autonomic Modulation and Activity of Carotid Baroreceptors at Altituderdquo Clinical Science Vol 95 1998 pp 565-573 doi101042CS19980046
[23] G Vandewalle B Middleton S W R Rajaratnam B M Stone B Thorleifsdottir J Aredent and D J Dijk ldquoRo- bust Circadian Rhythm in Heart Rate and Its Variability Influence of Melatonin and Photoperiodrdquo Journal of Sleep Research Vol 16 No 2 2007 pp 148-150 doi101111j1365-2869200700581x
[24] C Murrell L Wilson J D Cotter S Lucas S Ogoh G Keith and N Ainslie ldquoAlteration in Autonomic Function and Cerebral Hemodynamics to Orthostatic Challenge Fol- lowing a Mountain Marathonrdquo Journal Applied Physiol- ogy Vol 103 No 1 2007 pp 88-96 doi101152japplphysiol013962006
[25] S Saito K Tanobe M Yamada and F Nishihara ldquoRela- tionship between Arterial Oxygen Saturation and Heart Rate Variability at High Altitudesrdquo American Journal of Emergency Medicine Vol 23 No 1 2005 pp 8-12 doi101016jajem200409023