Heart Disease and Stroke Statistics 2012 Update
24
Heart Disease and Stroke Statistics 2012 Update 1
Transcript of Heart Disease and Stroke Statistics 2012 Update

Heart Disease and Stroke Statistics
2012 Update
1

Additional charts may be downloaded directly from the online publication at: http://circ.ahajournals.org/lookup/doi/10.1161/CIR.0b013e31823ac046
Or at:
www.heart.org/statistics
The American Heart Association requests that this document be cited as follows: Roger VL, Go AS, Lloyd-Jones DM, Benjamin EJ, Berry JD, Borden WB, Bravata DM, Dai S, Ford ES, Fox CS, Fullerton HJ, Gillespie C, Hailpern SM, Heit JA, Howard VJ, Kissela BM, Kittner SJ, Lackland DT, Lichtman JH, Lisabeth LD, Makuc DM, Marcus GM, Marelli A, Matchar DB, Moy CS, Mozaffarian D, Mussolino ME,
Nichol G, Paynter NP, Soliman EZ, Sorlie PD, Sotoodehnia N, Turan TN, Virani SS, Wong ND, Woo D, Turner MB; on behalf of the American Heart Association Statistics Committee and Stroke Statistics
Subcommittee. Heart disease and stroke statistics—2012 update: a report from the American Heart Association. Circulation. 2012: published online before print December 15, 2011,
10.1161/CIR.0b013e31823ac046.
If you have questions about statistics or any points made in the 2012 Statistical Update, please contact the American Heart Association National Center,
Office of Science & Medicine at [email protected].
Please direct all media inquiries to News Media Relations at [email protected] or 214-706-1173.

Prevalence (unadjusted) estimates for poor, intermediate and ideal cardiovascular health
for each of the 7 metrics of cardiovascular health in the AHA 2020 goals,
US children aged 12-19 years, NHANES 2007-2008
©2011 American Heart Association, Inc. All rights reserved.
Roger VL et al. Published online in Circulation Dec. 15, 2011
16.3 18.6
7.2
91.5
4.6 2.0 1.0
0.0
19.0
53.9
8.5
20.2
15.7 22.8
83.7
62.5
39.0
0.0
75.1 82.3
76.2
0.0
20.0
40.0
60.0
80.0
100.0
Current Smoking
Body Mass Index
Physical Activity
Healthy Diet Score
Total Cholesterol
Blood Pressure
Fasting Plasma Glucose
Perc
en
tag
e
Poor Intermediate Ideal

Age-standardized prevalence for poor, intermediate and ideal cardiovascular health
for each of the 7 metrics of cardiovascular health in the AHA 2020 goals,
among US adults >20 years of age, NHANES 2007-2008
24.1
34.1
47.5
79.0
14.0 14.2 7.9
3.0
34.0 13.0
20.7
39.2 42.0
40.1
72.9
31.9 39.5
0.3
46.8 43.8 52.0
0.0
20.0
40.0
60.0
80.0
100.0
Current Smoking
Body Mass Index
Physical Activity
Healthy Diet Score
Total Cholesterol
Blood Pressure
Fasting Plasma Glucose
Pe
rce
nta
ge
Poor Intermediate Ideal
©2011 American Heart Association, Inc. All rights reserved.
Roger VL et al. Published online in Circulation Dec. 15, 2011

14.2
39.3
72.6
80.1
9.7
37.2
71.9
86.7
0
10
20
30
40
50
60
70
80
90
100
20-39 40-59 60-79 80+
Perc
en
t o
f P
op
ula
tio
n
Men Women
Prevalence of CVD in adults ≥20 years of age by age and sex (NHANES: 2005–2008)
Source: NCHS and NHLBI. These data include CHD, HF, stroke, and hypertension.
©2011 American Heart Association, Inc. All rights reserved. Roger VL et al. Published online in Circulation Dec. 15, 2011
©2011 American Heart Association, Inc. All rights reserved. Roger VL et al. Published online in Circulation Dec. 15, 2011
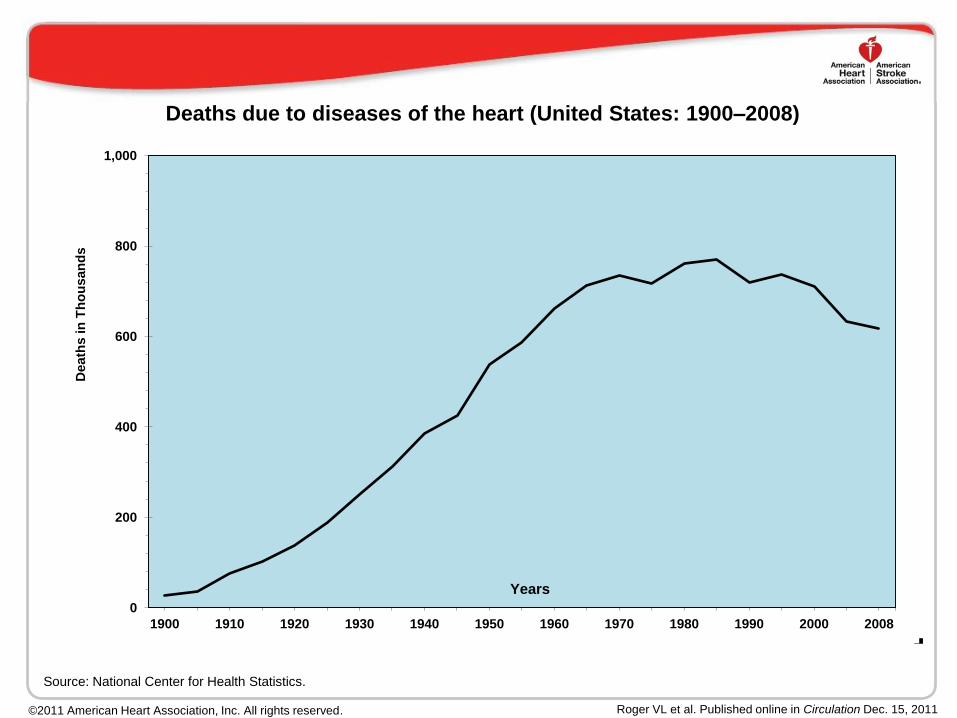
Deaths due to diseases of the heart (United States: 1900–2008)
0
200
400
600
800
1,000
1900 1910 1920 1930 1940 1950 1960 1970 1980 1990 2000 2008
Death
s in
Th
ou
san
ds
Years
Source: National Center for Health Statistics.

CVD and other major causes of death for all males and females (United States: 2008)
Source: NCHS and NHLBI. A indicates CVD plus congenital CVD; B, cancer; C, accidents; D, CLRD; E, diabetes; and F, Alzheimer's disease.
©2011 American Heart Association, Inc. All rights reserved. Roger VL et al. Published online in Circulation Dec. 15, 2011
392,210
295,259
78,378
67,122
35,346
24,516
419,730
270,210
73,968
57,919
43,524 35,207
0
50,000
100,000
150,000
200,000
250,000
300,000
350,000
400,000
450,000
A B C D E F A B D F C E
Death
s
Males Females

Prevalence of stroke by age and sex (NHANES: 2005–2008)
0.3
1.6
7.2
14.5
0.5
2.4
8.2
14.8
0
2
4
6
8
10
12
14
16
18
20-39 40-59 60-79 80+
Perc
en
t o
f P
op
ula
tio
n
Age
Men Women
Source: NCHS and NHLBI.
©2011 American Heart Association, Inc. All rights reserved. Roger VL et al. Published online in Circulation Dec. 15, 2011

Age-adjusted death rates for stroke by sex and race/ethnicity, 2008
Source: NCHS and NHLBI.
©2011 American Heart Association, Inc. All rights reserved. Roger VL et al. Published online in Circulation Dec. 15, 2011
39.0
62.1
34.0
24.5
33.1
38.6
53.4
32.1
24.0
28.9
0
10
20
30
40
50
60
70
White Black Asian/Pacific Islander American Indian/Alaska Native
Hispanic
Death
Rate
per
100 0
00
Males Females

Prevalence of High Blood Pressure in adults ≥20 years of age
by age and sex (NHANES: 2005–2008)
11.1
25.1
37.1
54.0
64.0 66.7
6.8
19.0
35.2
53.3
69.3
78.5
0
10
20
30
40
50
60
70
80
90
20-34 35-44 45-54 55-64 65-74 75+
Perc
en
t o
f P
op
ula
tio
n
Age
Male Female
Source: NCHS and NHLBI. Hypertension is defined as SBP 140 mm Hg or DBP 90 mmHg, taking antihypertensive medication, or being told twice by a
physician or other professional that one has hypertension.
©2011 American Heart Association, Inc. All rights reserved. Roger VL et al. Published online in Circulation Dec. 15, 2011

Age-Adjusted Prevalence Trends for High Blood Pressure in Adults, ≥20 years of age by
race/ethnicity, sex and survey (NHANES:1988-1994, 1999-2004 and 2005-2008)
25.6
22.9
37.5 38.2
26.9
25.0
28.3 28.2
38.6
41.5
25.7 26.8
30.5
27.7
40.2
42.9
24.6 25.0
0
5
10
15
20
25
30
35
40
45
50
NH White Men NH White Women NH Black Men NH Black Women Mexican American Men
Mexican American Women
Perc
en
t o
f P
op
ula
tio
n
1988-1994 1999-2004 2005-2008
Source: NCHS and NHLBI. NH indicates non-Hispanic.
©2011 American Heart Association, Inc. All rights reserved. Roger VL et al. Published online in Circulation Dec. 15, 2011

Trends in mean total serum cholesterol among adolescents 12–17 years of age by race,
sex, and survey year (NHANES: 1988–1994*, 1999–2004 and 2005-2008)
163
165 166
174
159
161
163 163
158
160
154
157
161 162
155
158
140
145
150
155
160
165
170
175
180
NH White Males NH Black Males NH White Females
NH Black Females Mex. Am. Males Mex. Am. Females
Mean
To
tal B
loo
d C
ho
leste
rol
1988-94 1999-2004 2005-2008
Source: NCHS and NHLBI. NH indicates non-Hispanic. Mex. Am. indicates Mexican American. * Data for Mexican Americans not available.
©2011 American Heart Association, Inc. All rights reserved. Roger VL et al. Published online in Circulation Dec. 15, 2011

Trends in mean total serum cholesterol among adults ages ≥20 by race and survey year,
(NHANES: 1988–1994, 1999–2004 and 2005–2008)
206
204 205
203
198
201
198
192
201
180
185
190
195
200
205
210
NH White NH Black Mexican American
Mean
Seru
m T
ota
l C
ho
leste
rol
1988-94 1999-2004 2005-2008
Source: NCHS and NHLBI. NH indicates non-Hispanic.
©2011 American Heart Association, Inc. All rights reserved. Roger VL et al. Published online in Circulation Dec. 15, 2011

Age-adjusted prevalence of physician-diagnosed diabetes in adults ≥20 years of age
by race/ethnicity and sex (NHANES: 2005–2008)
6.8 6.5
14.3 14.7
11.0
12.7
0
2
4
6
8
10
12
14
16
Male Female
Perc
en
t o
f P
op
ula
tio
n
NH White NH Black Mexican American
Source: NCHS and NHLBI. NH indicates non-Hispanic.
©2011 American Heart Association, Inc. All rights reserved. Roger VL et al. Published online in Circulation Dec. 15, 2011

Trends in diabetes prevalence in adults ≥20 years of age, by sex
(NHANES: 1988–1994 and 2005–2008)
5.4
3.4
7.9
4.1
5.4
2.5
8.2
2.3
0
1
2
3
4
5
6
7
8
9
Physician Diagnosed 1988-94 Undiagnosed 1988-94 Physician Diagnosed 2005-08 Undiagnosed 2005-08
Perc
en
t o
f P
op
ula
tio
n
Male Female
Source: NCHS, NHLBI.
©2011 American Heart Association, Inc. All rights reserved. Roger VL et al. Published online in Circulation Dec. 15, 2011

Prevalence of students in grades 9–12 who met currently recommended levels of
physical activity during the past 7 days by race/ethnicity and sex (YRBSS: 2009)
47.3
31.3
43.3
21.9
41.3
24.9
0
5
10
15
20
25
30
35
40
45
50
Male Female
Perc
en
t o
f P
op
ula
tio
n
NH White NH Black Hispanic
Currently recommended levels is defined as activity that increased their heart rate and made them breathe hard some of the time for a total of at least
60 minutes per day on 5 of the 7 days preceding the survey. Source: MMWR Surveill Summ. 2010;59:1–142. NH indicates non-Hispanic.
©2011 American Heart Association, Inc. All rights reserved. Roger VL et al. Published online in Circulation Dec. 15, 2011

Prevalence of meeting the 2008 Federal Physical Activity Guidelines
among adults ≥18 years of age by race/ethnicity and sex (NHIS: 2010)
©2011 American Heart Association, Inc. All rights reserved. Roger VL et al. Published online in Circulation Dec. 15, 2011
26.7
19.1
24.6
11.2
18.8
9.8
0
5
10
15
20
25
30
Men Women
Perc
en
t o
f P
op
ula
tio
n
NH White NH Black Hispanic
NH indicates non-Hispanic. Percents are age-adjusted. Meeting the 2008 Federal PA Guidelines is defined as engaging in moderate leisure-time
physical activity for at least 150 minutes per week or vigorous activity at last 75 minutes per week or an equivalent combination.

Prevalence of students in grades 9 to 12 reporting current cigarette use
by sex and race/ethnicity (YRBSS, 2009)
22.3
10.7
19.4
22.8
8.4
16.7
0
5
10
15
20
25
NH White NH Black Hispanic
Perc
en
t o
f th
e P
op
ula
tio
n
Males Females
Source: MMWR Surveill Summ. 2010;59:1–142.NH indicates non-Hispanic.
©2011 American Heart Association, Inc. All rights reserved. Roger VL et al. Published online in Circulation Dec. 15, 2011

Prevalence of current smoking for adults > 18 years of age
by race/ethnicity and sex (NHIS: 2007-2009)
All percentages are age-adjusted. NH indicates non-Hispanic. *Includes both Hispanics and non-Hispanics. Data derived from Centers for Disease
Control and Prevention/National Center for Health Statistics, Health Data Interactive.
©2011 American Heart Association, Inc. All rights reserved. Roger VL et al. Published online in Circulation Dec. 15, 2011
22.9
18.9
23.6
17.0 17.9
9.3
15.4
5.4
26.8
19.9
0
5
10
15
20
25
30
Men Women
Pe
rce
nt
of
Po
pu
lati
on
NH White NH Black Hispanic Asian* American Indian/Alaska Native*

©2011 American Heart Association, Inc. All rights reserved. Roger VL et al. Published online in Circulation Dec. 15, 2011
4.0
6.1 6.5
5.0
11.3
10.5
15.9 16.0
17.4 17.9
0
2
4
6
8
10
12
14
16
18
20
6-11 12-19
Pe
rce
nt
of
Po
pu
lati
on
Age (Years)
1971-1974 1976-1980 1988-1994 1999-2002 2005-2008
Trends in the prevalence of obesity among US children and adolescents by age and
survey year (National Health and Nutrition Examination Survey: 1971-1974, 1976-1980,
1988-1994, 1999-2002 and 2005–2008)
Data derived from Health, United States, 2010: With Special Feature on Death and Dying. NCHS, 2011.

©2011 American Heart Association, Inc. All rights reserved.
Roger VL et al. Published online in Circulation Dec. 15, 2011
Age-adjusted prevalence of obesity in adults 20–74 years of age, by sex and survey year
(NHES: 1960–62; NHANES: 1971–74, 1976–80, 1988–94, 1999-2002 and 2005-08)
10.7
15.7
12.2
16.8
12.8
17.1
20.6
26.0
28.1
34.0 33.3
36.2
0
5
10
15
20
25
30
35
40
Men Women
Perc
en
t o
f P
op
ula
tio
n
1960-62 1971-74 1976-80 1988-94 1999-2002 2005-08
Data derived from Health, United States, 2010: With Special Feature on Death and Dying. NCHS, 2011.

Trends in cardiovascular procedures, United States: 1979–2009
Note: Inpatient procedures only. Source: National Hospital Discharge Survey, NCHS, and NHLBI.
©2011 American Heart Association, Inc. All rights reserved. Roger VL et al. Published online in Circulation Dec. 15, 2011
0
200
400
600
800
1000
1200
1400
1979 1980 1985 1990 1995 2000 2005 2009
Pro
ced
ure
s i
n T
ho
usan
ds
Years
Catheterizations Bypass PCI Carotid Endarterectomy Pacemakers

Direct and indirect costs (in billions of dollars)
of major cardiovascular diseases and stroke (United States: 2008)
Source: National Heart, Lung, and Blood Institute.
©2011 American Heart Association, Inc. All rights reserved. Roger VL et al. Published online in Circulation Dec. 15, 2011
190.3
50.6
34.3
22.5
0
20
40
60
80
100
120
140
160
180
200
Heart disease Hypertension Stroke Other CVD
Bil
lio
ns o
f D
oll
ars

Projected Total Costs of CVD, 2015–2030 (in Billions 2008$) in the United States
564.9
121.1 132.4
44.6 69.1
197.8
704.7
153.2 156.9
57.0 87.1
250.5
886.2
194.1 186.7
74.1 111.2
320.0
1117.6
245.2 223.8
97.0 143.0
408.5
0
200
400
600
800
1000
1200
All CVD Hypertension CHD HF Stroke Other CVDs
To
tal D
oll
ars
(in
Billio
ns
)
2015 2020 2025 2030
Unpublished data tabulated by AHA using methods described in Circulation. 2011;123:933–944.
©2011 American Heart Association, Inc. All rights reserved. Roger VL et al. Published online in Circulation Dec. 15, 2011