Healthy People 2020 - usrds.org · Healthy People 2020 In this chapter, we examine data for 10...
34
2018 USRDS ANNUAL DATA REPORT | KIDNEY DISEASE IN THE UNITED STATES 703 Healthy People 2020 In this chapter, we examine data for 10 Healthy People 2020 (HP2020) objectives spanning 19 total indicators for which the USRDS serves as the official data source. As in previous Annual Data Reports (ADR), we present data overall, and stratified by race, sex, and age groups to highlight any disparities in progress. In 2016, 11 of the 18 HP2020 indicators with specific targets met the established goals. Key areas where substantial improvement has been observed include mortality among dialysis patients and vascular access. Conversely, the incidence rates of end-stage renal disease (ESRD) overall, and ESRD due to diabetes, remain above HP2020 targets. State-level comparison maps showed marked geographic variation for HP2020 Objectives CKD-10 (Proportion of ESRD patients receiving care from a nephrologist at least 12 months before the start of renal replacement therapy; Figure 1) and CKD-13.1 (Proportion of patients receiving a kidney transplant within three years of end- stage renal disease; Figure 2). Forty-eight states achieved the HP2020 target for CKD-10, while nine achieved the target for CKD-13.1. For HP2020 objectives relating to vascular access, we present data from CROWNWeb examining HP2020 Objectives CKD 11-1 (Proportion of adult hemodialysis patients who use arteriovenous fistulas as the primary mode of vascular access; Table 9) and CKD 11-2 (Proportion of adult hemodialysis patients who use catheters as the only mode of vascular access; Table 10). In 2016, the overall proportion of prevalent patients using an arteriovenous fistula was 64.1%, and this appears to have plateaued since 2012. The all-cause mortality among prevalent dialysis patients in 2016 was 173.1 deaths per 1,000 patient-years (HP2020 objective CKD-14.1, Table 15). This rate represents a 16.8% decrease in the mortality rate since 2007. While this rate is lower than in 2015 (174.0 deaths per 1,000 patient-years), it is still higher than in 2014, when the rate was lower than it has ever been at 171.6 deaths per 1,000 patient-years. Introduction The Healthy People initiative, coordinated by the United States (U.S.) Department of Health and Human Services, provides a vision and strategy for improving the health of all Americans by setting priorities, identifying baseline data and 10-year targets for specific objectives, monitoring outcomes, and evaluating progress. Since 1980, the Healthy People program has released updated plans each decade to reflect emerging health priorities, and to align health promotion resources, strategies, and research. The fourth-generation plan, Healthy People 2020 (HP2020), was launched on December 2, 2010 (HP2020, 2010). It encompasses over 1,000 health objectives organized under 42 different topic areas. HP2020’s overarching goals are: To assist all Americans in attaining high-quality, longer lives free of preventable disease, disability, injury, and premature death To achieve health equity, eliminate disparities, and improve the health of all groups To create social and physical environments that promote good health for all To promote quality of life, healthy development, and healthy behaviors across all life stages (HP2020, 2010).
Transcript of Healthy People 2020 - usrds.org · Healthy People 2020 In this chapter, we examine data for 10...

2018 USRDS ANNUAL DATA REPORT | KIDNEY DISEASE IN THE UNITED STATES 703
Healthy People 2020
In this chapter, we examine data for 10 Healthy People 2020 (HP2020) objectives spanning 19 total indicators for which the USRDS serves as the official data source. As in previous Annual Data Reports (ADR), we present data overall, and stratified by race, sex, and age groups to highlight any disparities in progress.
In 2016, 11 of the 18 HP2020 indicators with specific targets met the established goals. Key areas where substantial improvement has been observed include mortality among dialysis patients and vascular access. Conversely, the incidence rates of end-stage renal disease (ESRD) overall, and ESRD due to diabetes, remain above HP2020 targets.
State-level comparison maps showed marked geographic variation for HP2020 Objectives CKD-10 (Proportion of ESRD patients receiving care from a nephrologist at least 12 months before the start of renal replacement therapy; Figure 1) and CKD-13.1 (Proportion of patients receiving a kidney transplant within three years of end-stage renal disease; Figure 2). Forty-eight states achieved the HP2020 target for CKD-10, while nine achieved the target for CKD-13.1.
For HP2020 objectives relating to vascular access, we present data from CROWNWeb examining HP2020 Objectives CKD 11-1 (Proportion of adult hemodialysis patients who use arteriovenous fistulas as the primary mode of vascular access; Table 9) and CKD 11-2 (Proportion of adult hemodialysis patients who use catheters as the only mode of vascular access; Table 10). In 2016, the overall proportion of prevalent patients using an arteriovenous fistula was 64.1%, and this appears to have plateaued since 2012.
The all-cause mortality among prevalent dialysis patients in 2016 was 173.1 deaths per 1,000 patient-years (HP2020 objective CKD-14.1, Table 15). This rate represents a 16.8% decrease in the mortality rate since 2007. While this rate is lower than in 2015 (174.0 deaths per 1,000 patient-years), it is still higher than in 2014, when the rate was lower than it has ever been at 171.6 deaths per 1,000 patient-years.
Introduction
The Healthy People initiative, coordinated by the
United States (U.S.) Department of Health and
Human Services, provides a vision and strategy for
improving the health of all Americans by setting
priorities, identifying baseline data and 10-year targets
for specific objectives, monitoring outcomes, and
evaluating progress. Since 1980, the Healthy People
program has released updated plans each decade to
reflect emerging health priorities, and to align health
promotion resources, strategies, and research.
The fourth-generation plan, Healthy People 2020
(HP2020), was launched on December 2, 2010
(HP2020, 2010). It encompasses over 1,000 health
objectives organized under 42 different topic areas.
HP2020’s overarching goals are:
To assist all Americans in attaining high-quality, longer lives free of preventable disease, disability, injury, and premature death
To achieve health equity, eliminate disparities, and improve the health of all groups
To create social and physical environments that promote good health for all
To promote quality of life, healthy development, and healthy behaviors across all life stages (HP2020, 2010).
2018 USRDS ANNUAL DATA REPORT | KIDNEY DISEASE IN THE UNITED STATES
704
A key priority of the HP2020 initiative is to “reduce
new cases of chronic kidney disease (CKD) and its
complications, disability, death, and economic costs.”
The HP2020 CKD objectives were designed to monitor
and assess efforts to reduce the long-term burden of
kidney disease, increase lifespan, improve quality of
life, and eliminate related health care disparities. To
accomplish these goals the HP2020 program is
comprised of 14 CKD-related objectives, encompassing
24 individual indicators with targets (HP2020 Table
A). Herein, we provide data for the 10 CKD-related
objectives for which USRDS serves as the official data
source.
One of the four overarching goals of HP2020 is to
eliminate health care disparities. As directed by the
Department of Health and Human Services, and to
facilitate comparisons and gauge progress across
groups, we present data overall and by racial, ethnic,
sex, and age subgroups. In many cases, while the
overall population may have met an objective, one or
more subgroups may have fallen short. Conversely, for
some objectives the overall findings may have been
stable, yet with significant improvements observed in
some subgroups.

HEALTHY PEOPLE 2020
705
HP2020 Table A. Healthy People 2020 CKD Objectives
Objective Indicator Target
CKD-1* Reduce the proportion of the U.S. population with chronic kidney disease 13.3%
CKD-2* Increase the proportion of persons with chronic kidney disease (CKD) who know they have impaired renal function
13.4%
CKD-3 Increase the proportion of hospital patients who incurred acute kidney injury who have follow-up renal evaluation in 6 months post discharge
12.3%
CKD-4 Increase the proportion of persons with diabetes and chronic kidney disease who receive recommended medical evaluation
4.1 Increase the proportion of persons with chronic kidney disease who receive medical evaluation with serum creatinine, lipids, and microalbuminuria
28.4%
4.2 Increase the proportion of persons with type 1 or type 2 diabetes and chronic kidney disease who receive medical evaluation with serum creatinine, microalbuminuria, HbA1c, lipids, and eye examinations
25.3%
CKD-5 Increase the proportion of persons with diabetes and chronic kidney disease who receive recommended medical treatment with angiotensin-converting enzyme (ACE) inhibitors or angiotensin II receptor blockers (ARBs)
74.1%
CKD-6* Improve cardiovascular care in persons with chronic kidney disease
6.1 Reduce the proportion of persons with chronic kidney disease who have elevated blood pressure
17.6%
6.2 Increase the proportion of adults aged 50 years and over with chronic kidney disease who currently take statins to lower their blood cholesterol
25.6%
CKD-7* Reduce the number of deaths among persons with chronic kidney disease Not applicable
CKD-8 Reduce the number of new cases of end-stage renal disease (ESRD) 352.1 PMP
CKD-9 Reduce kidney failure due to diabetes
9.1 Reduce kidney failure due to diabetes 154.4 PMP 9.2 Reduce kidney failure due to diabetes among persons with diabetes
2,352.7 PMP
CKD-10 Increase the proportion of chronic kidney disease patients receiving care from a nephrologist at least 12 months before the start of renal replacement therapy
30.0%
CKD-11 Improve vascular access for hemodialysis patients
11.1 Increase the proportion of adult hemodialysis patients who use arteriovenous fistulas as the primary mode of vascular access
50.6%
11.2 Reduce the proportion of adult hemodialysis patients who use catheters as the only mode of vascular access
26.1%
11.3 Increase the proportion of adult hemodialysis patients who use arteriovenous fistulas or have a maturing fistula as the primary mode of vascular access at the start of renal replacement therapy
34.8%
CKD-12 Increase the proportion of dialysis patients waitlisted and/or receiving a deceased donor kidney transplant within 1 year of end-stage renal disease (ESRD) start (among patients under 70 years of age)
18.7%
CKD-13 Increase the proportion of patients with treated chronic kidney failure who receive a transplant
13.1 Increase the proportion of patients receiving a kidney transplant within 3 years of end-stage renal disease (ESRD)
20.1%
13.2 Increase the proportion of patients who receive a preemptive transplant at the start of ESRD Not applicable
CKD-14 Reduce deaths in persons with end-stage renal disease (ESRD)
14.1 Reduce the total number of deaths for persons on dialysis 187.3 per 1,000 patient-years
14.2 Reduce the number of deaths in dialysis patients within the first 3 months of initiation of renal replacement therapy
335.0 per 1,000 patient-years
14.3 Reduce the number of cardiovascular deaths for persons on dialysis 81.3 per 1,000 patient-years
14.4 Reduce the total number of deaths for persons with a functioning kidney transplant
27.8 per 1,000 patient-years
14.5 Reduce the number of cardiovascular deaths in persons with a functioning kidney transplant
4.5 per 1,000 patient-years
Data Source: https://www.healthypeople.gov/2020/topics-objectives/topic/chronic-kidney-disease/objectives. Abbreviations: CKD, chronic kidney disease; ESRD, end-stage renal disease; HbA1c, glycosylated hemoglobin; HP2020, Healthy People 2010; PMP, per million population. * These objectives use a data source other than USRDS, and are therefore not reported in this chapter.

2018 USRDS ANNUAL DATA REPORT | KIDNEY DISEASE IN THE UNITED STATES
706
Recommended Care
Acute kidney injury (AKI) is an important risk
factor for the subsequent development, or worsening,
of CKD. This association persists even for less severe
stages of AKI and after apparent recovery from AKI.
Follow-up renal evaluation after an episode of AKI
allows for early identification of CKD development
and provides an opportunity to institute
nephroprotective measures early in the course of
evolving disease. Objective CKD-3 aims to promote
improved renal follow-up within six months after an
episode of AKI.
In 2016, 17.6% of patients with AKI had follow-up
renal evaluation within 6 months post-discharge, the
sixth consecutive year in which the HP2020 goal of
12.3% was exceeded (see Table 1). This continued a
steady increase observed over the last decade.
Men were more likely to receive post-AKI follow-up
renal evaluation than women. Among racial and
ethnic groups, the rates in descending order were
Hispanics (24.9%), Asians (19.4%), Blacks/African
Americans (17.8%), Whites (17.2%), and American
Indian or Alaskan native (13.8%). The proportion of
patients receiving post-AKI renal evaluation decreased
with older age, falling from 21.7% in those aged 65-74
to 9.6% of those aged 85 and older.
HP2020 Table 1 CKD-3 Increase the proportion of hospital patients who incurred acute kidney injury who have follow-up renal evaluation in 6 months post discharge: Target 12.3%
2007 (%)
2008 (%)
2009 (%)
2010 (%)
2011 (%)
2012 (%)
2013 (%)
2014 (%)
2015 (%)
2016 (%)
All 11.2 10.5 11.4 11.8 12.6 12.7 15.9 16.2 17.0 17.6
Race/Ethnicity
American Indian or Alaska Native 12.0 15.2 6.9 11.1 17.5 9.5 9.4 10.2 16.7 13.8
Asian 15.1 11.3 16.1 15.4 15.8 14.8 22.4 20.2 20.9 19.4
Black/African American 11.1 10.3 12.1 11.3 11.9 13.1 15.7 17.0 18.6 17.8
White 11.1 10.4 11.2 11.8 12.5 12.4 15.6 15.8 16.5 17.2
Hispanic or Latino 11.8 16.0 13.1 12.9 16.6 15.9 23.0 21.9 22.1 24.9
Sex
Male 12.5 11.9 12.4 12.7 13.8 13.8 17.4 17.5 18.6 18.5
Female 10.0 9.3 10.5 11.0 11.5 11.6 14.5 14.9 15.5 16.6
Age
65-74 16.1 14.8 16.0 16.4 17.5 17.2 20.8 21.0 21.6 21.7
75-84 11.1 10.7 11.2 12.3 13.2 13.0 16.7 17.2 17.9 18.6
85+ 5.1 5.0 6.4 5.9 6.3 6.9 8.8 8.6 9.4 9.6
Data Source: Special analyses, Medicare 5 percent sample. Medicare patients aged 65 & older with a hospitalized AKI event in a given year. Abbreviations: AKI, acute kidney injury; CKD, chronic kidney disease.

HEALTHY PEOPLE 2020
707
HP2020 CKD Objective 4.1 examines the
proportion of patients with CKD who receive
recommended medical testing, specifically serum
creatinine, urine albumin, and lipids (Table 2). In
2016, in the Medicare population aged 65 and older,
34.0% of CKD patients received this recommended
testing. While this represents a slight decrease from
recent years, it was the seventh consecutive year of
surpassing the HP2020 goal of 28.4%.
Similar to trends for other recommended measures,
the proportion of patients receiving these tests
declined with rising age; testing occurred in 40.2%,
35.9%, and 21.3% of individuals in the 65-74, 75-84,
and 85 years and older age groups. Recommended
testing was higher among males (35.5%) than among
females (32.5%). When examining race and ethnicity,
Hispanic or Latino patients and Asians had the
highest proportion of recommended testing, both at
45.2%, followed by Black/African-Americans at 36.7%.
American Indians or Alaska Natives had the lowest
proportion, although this may relate to lack of data
capture of services provided through the Indian
Health Service (IHS), which are not reported to the
Medicare system.
HP2020 Table 2 CKD-4.1 Increase the proportion of persons with chronic kidney disease who receive medical evaluation with serum creatinine, lipids, and microalbuminuria: Target 28.4%
2007 (%)
2008 (%)
2009 (%)
2010 (%)
2011 (%)
2012 (%)
2013 (%)
2014 (%)
2015 (%)
2016 (%)
All 25.8 26.8 28.2 29.1 30.3 31.2 33.1 33.7 35.2 34.0
Race/Ethnicity
American Indian or Alaska Native 17.2 17.4 18.6 20.2 20.9 18.5 23.3 22.0 24.8 24.0
Asian 35.3 34.0 37.8 37.1 39.6 41.2 43.8 44.8 46.1 45.2
Black/African American 26.8 28.0 30.2 30.6 32.3 33.0 35.0 35.5 37.0 36.7
White 25.2 26.3 27.4 28.4 29.5 30.4 32.2 32.8 34.3 33.0
Hispanic or Latino 32.9 32.3 36.2 36.7 39.3 41.5 44.1 44.8 46.0 45.2
Sex
Male 27.2 28.4 29.6 30.6 32.0 33.0 35.0 35.7 36.9 35.5
Female 24.4 25.3 26.8 27.7 28.8 29.6 31.4 32.0 33.7 32.5
Age
65-74 34.0 35.4 37.0 37.8 39.1 39.9 41.5 42.0 43.1 40.2
75-84 26.2 27.3 28.9 30.1 31.5 32.7 34.8 35.6 36.6 35.9
85+ 13.0 14.2 15.1 15.9 17.2 18.0 19.8 20.2 21.1 21.3
Data Source: Special analyses, Medicare 5 percent sample. Medicare patients aged 65 & older with CKD. Abbreviation: CKD, chronic kidney disease.

2018 USRDS ANNUAL DATA REPORT | KIDNEY DISEASE IN THE UNITED STATES
708
Patients with both CKD and type 1 or type 2 DM are
recommended to have comprehensive laboratory
monitoring to assess for the development of
complications. The glycosylated hemoglobin (HbA1c)
test provides an assessment of blood glucose control
over prolonged periods, while regular eye
examinations can detect diabetic retinopathy at
treatable stages. Lipid levels can be used to estimate
cardiovascular risk. In 2016, 30.7% of Medicare
patients with CKD and DM received all five tests:
serum creatinine, urine albumin, HbA1c, lipid testing,
and an eye examination (see Table 3). The level of
testing appears to have plateaued over the last four
years of available data, but has surpassed the HP2020
goal of 25.3% for seven consecutive years.
Once again, the proportion of patients tested was
lowest among the patients over the age of 85; testing
occurred in 32.5%, 32.7%, and 22.8% of individuals in
the 65-74, 75-84, and 85 years and older age groups.
HP2020 Table 3 CKD-4.2 Increase the proportion of persons with type 1 or type 2 diabetes and chronic kidney disease who receive medical evaluation with serum creatinine, microalbuminuria, HbA1c, lipids, and eye examinations: Target 25.3%
2007 (%)
2008 (%)
2009 (%)
2010 (%)
2011 (%)
2012 (%)
2013 (%)
2014 (%)
2015 (%)
2016 (%)
All 23.0 23.6 25.1 26.5 26.9 27.6 29.7 29.8 30.3 30.7
Race/Ethnicity
American Indian or Alaska Native 10.4 11.5 11.7 15.1 14.1 11.5 17.1 17.2 17.4 16.8
Asian 26.6 25.3 27.1 29.6 30.8 32.6 37.0 34.4 32.4 35.5
Black/African American 19.7 21.0 22.4 23.7 25.0 25.1 27.0 26.6 27.9 27.5
White 23.5 24.1 25.6 27.0 27.1 27.8 29.8 30.1 30.4 30.9
Hispanic or Latino 22.0 21.9 24.6 24.1 27.0 25.4 29.8 30.0 31.8 32.0
Sex
Male 23.5 23.6 25.5 26.7 27.2 27.7 30.0 30.2 30.4 30.8
Female 22.5 23.6 24.7 26.2 26.6 27.5 29.4 29.5 30.2 30.6
Age
65-74 26.4 27.0 28.3 29.9 29.9 30.2 32.1 32.2 32.5 32.5
75-84 23.3 24.1 25.9 27.3 28.0 29.3 31.6 31.5 31.8 32.7
85+ 14.1 15.0 16.6 17.6 18.7 18.9 21.4 21.7 22.0 22.8
Data Source: Special analyses, Medicare 5 percent sample. Medicare patients aged 65 & older with CKD & diabetes mellitus. Abbreviations: CKD, chronic kidney disease; HbA1c, glycosylated hemoglobin.

HEALTHY PEOPLE 2020
709
Angiotensin-converting enzyme (ACE) inhibitors
or angiotensin II receptor blockers (ARBs) are a
recommended part of the medical management of
patients with CKD and DM. In 2016, 71.4% of Medicare
patients aged 65 and older received one of these
agents (Table 4). This was a slight decrease from 2015,
and fell short of the HP2020 goal of 74.1%.
A slightly higher proportion of females received
ACE inhibitor or ARB therapy as compared to males.
Those of White race had the lowest proportion of use
at 70.6%, compared to 71.5% of Blacks and 79.6% of
Hispanic or Latino patients. Use of ACE inhibitors and
ARBs decreased with increasing age group.
HP2020 Table 4 CKD-5 Increase the proportion of persons with diabetes and chronic kidney disease who receive recommended medical treatment with angiotensin-converting enzyme (ACE) inhibitors or angiotensin II receptor blockers (ARBs): Target 74.1%
2007 (%)
2008 (%)
2009 (%)
2010 (%)
2011 (%)
2012 (%)
2013 (%)
2014 (%)
2015 (%)
2016 (%)
All 67.4 68.2 69.1 68.9 68.6 67.8 70.3 71.9 71.8 71.4
Race/Ethnicity
American Indian or Alaska Native 68.5 74.4 71.1 71.5 72.7 68.1 70.3 70.4 73.4 70.3
Asian 75.2 75.5 74.6 76.4 75.5 76.8 79.2 77.8 76.0 76.2
Black/African American 70.0 69.3 70.9 70.1 71.0 69.3 71.0 72.5 73.4 71.5
White 66.1 67.3 68.1 67.8 67.3 66.7 69.4 71.1 71.0 70.6
Hispanic or Latino 71.5 72.0 74.7 75.3 76.1 76.8 77.0 78.4 77.3 79.6
Sex
Male 65.0 66.4 67.3 67.1 66.7 66.7 69.4 71.0 71.2 70.9
Female 69.0 69.5 70.4 70.2 70.0 68.9 71.1 72.6 72.3 71.8
Age
65-74 71.4 72.0 72.6 72.5 72.2 72.0 74.2 75.3 75.3 75.2
75-84 65.9 67.3 68.1 67.6 68.2 66.4 69.6 71.7 71.2 70.7
85+ 59.6 60.2 62.3 62.4 60.4 58.1 62.1 63.6 62.9 62.0
Data Source: Special analyses, Medicare 5 percent sample. Medicare patients aged 65 & older with CKD & diabetes mellitus. Abbreviation: CKD, chronic kidney disease.

2018 USRDS ANNUAL DATA REPORT | KIDNEY DISEASE IN THE UNITED STATES
710
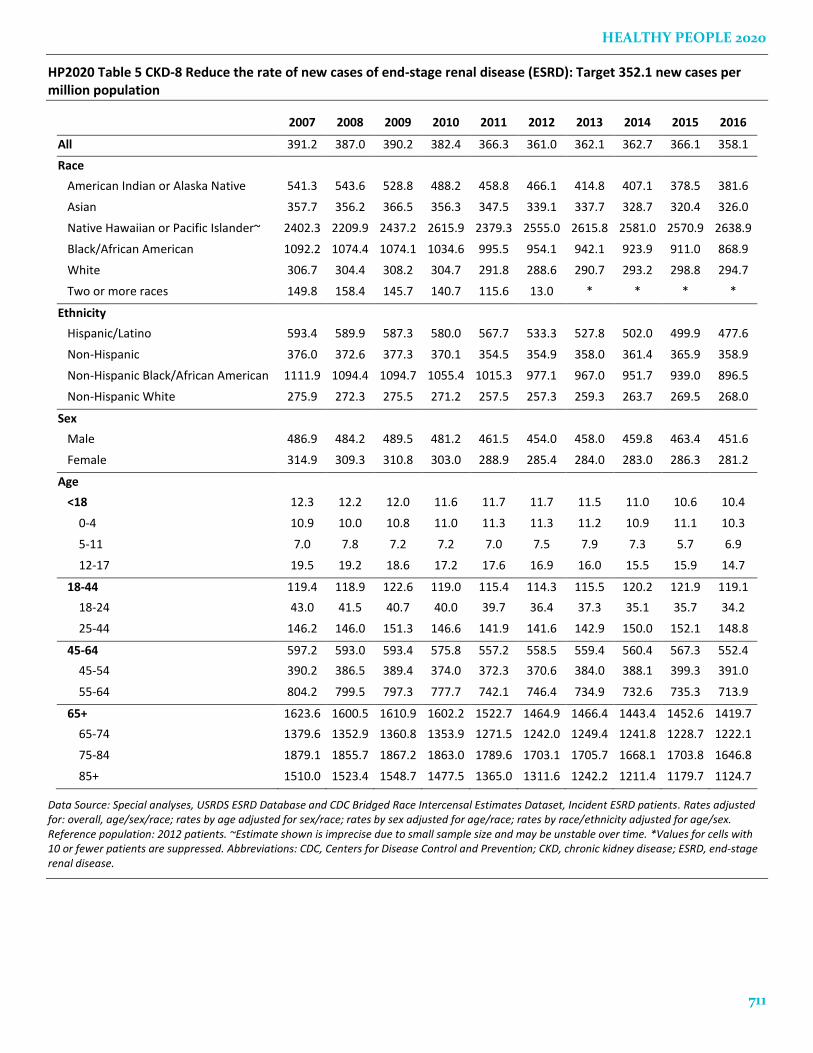
Incidence of End-Stage Renal Disease
After seeing a decline in the rate of new cases of
ESRD from 2006 through 2012, the rates remained
somewhat stable in recent years. In 2016, the
incidence of ESRD was 358.1 cases per million
population (PMP), which remains above the target of
352.1, established as a 10% decrease from the 2007
value of 391.2. As shown in Table 5, there remains
substantial variation in the incidence of ESRD across
race and ethnicity groups. Consistent with previous
years, in 2016 higher rates of incident ESRD were seen
among Blacks, at 868.9 new cases PMP and Native
Hawaiians and Pacific Islanders, with 2638.9 PMP, as
compared to Whites with 294.70 and Asians with
326.0. The most improvement has been observed
among American Indians and Alaska Natives, in
whom overall ESRD incidence decreased by 29.5%
from 2007 to 2016. Blacks had a 20.4% reduction in
ESRD incidence in that decade. In contrast, the
incidence among Whites and Asians decreased by
3.9% and 8.9% respectively over the same period.
Of note, the extraordinarily high incidence rates
among Native Hawaiians and Pacific Islanders might
in part result from differential race reporting between
the U.S. Census Bureau and the Centers for Medicare
& Medicaid ESRD Medical Evidence Report form
(CMS 2728) data collections. Although in the Census,
one-half of Native Hawaiians and Pacific Islanders
self-identified as of multiple races, only 7% did so in
the CMS 2728.
At 477.6 PMP, the rate of incident ESRD among
Hispanics was 35.2% greater than for non-Hispanics,
at 358.9 PMP, although this gap has decreased slightly
in recent years.
There remains a significant gender gap in ESRD
incidence rates. In 2016, men had a 60.4% higher rate
than women (451.6 vs 281.6 new cases PMP). This has
increased since 2006, when the rate in males was
54.6% higher than females.
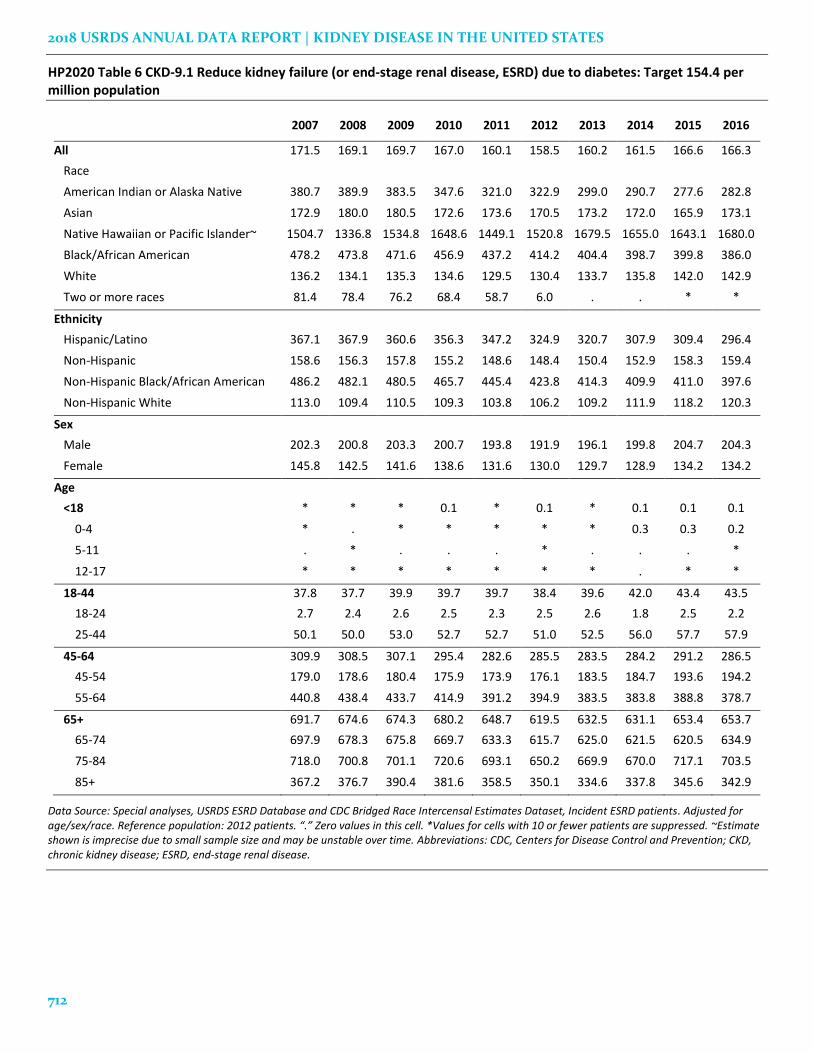
Kidney Failure Resulting from Diabetes
In 2016, the overall rate of kidney failure due to DM
was 166.3 PMP. This was the third consecutive year of
increase, and rates remained above the HP2020 target
of 154.4 PMP (Table 6). Males continued to have a
higher rate of diabetic kidney failure than did females,
at 204.3 compared with 134.2 PMP.
The degree of kidney failure due to DM varied
widely by race, and was markedly higher in Blacks as
compared to Whites, at 386.0 versus 142.9 PMP.
American Indians and Alaska Natives have had the
greatest decline in ESRD incidence from DM, falling
25.9% from 2007 to 2016; over the same period, Blacks
had a 19.3% decrease while Whites experienced a 4.9%
increase in ESRD incidence due to DM. As noted
above, the extraordinarily high rates among Native
Hawaiians and Pacific Islanders again may have been
influenced by differential race reporting between the
Census Bureau and the CMS 2728 data collections.
HEALTHY PEOPLE 2020
711
HP2020 Table 5 CKD-8 Reduce the rate of new cases of end-stage renal disease (ESRD): Target 352.1 new cases per million population
2007 2008 2009 2010 2011 2012 2013 2014 2015 2016
All 391.2 387.0 390.2 382.4 366.3 361.0 362.1 362.7 366.1 358.1
Race
American Indian or Alaska Native 541.3 543.6 528.8 488.2 458.8 466.1 414.8 407.1 378.5 381.6
Asian 357.7 356.2 366.5 356.3 347.5 339.1 337.7 328.7 320.4 326.0
Native Hawaiian or Pacific Islander~ 2402.3 2209.9 2437.2 2615.9 2379.3 2555.0 2615.8 2581.0 2570.9 2638.9
Black/African American 1092.2 1074.4 1074.1 1034.6 995.5 954.1 942.1 923.9 911.0 868.9
White 306.7 304.4 308.2 304.7 291.8 288.6 290.7 293.2 298.8 294.7
Two or more races 149.8 158.4 145.7 140.7 115.6 13.0 * * * *
Ethnicity
Hispanic/Latino 593.4 589.9 587.3 580.0 567.7 533.3 527.8 502.0 499.9 477.6
Non-Hispanic 376.0 372.6 377.3 370.1 354.5 354.9 358.0 361.4 365.9 358.9
Non-Hispanic Black/African American 1111.9 1094.4 1094.7 1055.4 1015.3 977.1 967.0 951.7 939.0 896.5
Non-Hispanic White 275.9 272.3 275.5 271.2 257.5 257.3 259.3 263.7 269.5 268.0
Sex
Male 486.9 484.2 489.5 481.2 461.5 454.0 458.0 459.8 463.4 451.6
Female 314.9 309.3 310.8 303.0 288.9 285.4 284.0 283.0 286.3 281.2
Age
<18 12.3 12.2 12.0 11.6 11.7 11.7 11.5 11.0 10.6 10.4
0-4 10.9 10.0 10.8 11.0 11.3 11.3 11.2 10.9 11.1 10.3
5-11 7.0 7.8 7.2 7.2 7.0 7.5 7.9 7.3 5.7 6.9
12-17 19.5 19.2 18.6 17.2 17.6 16.9 16.0 15.5 15.9 14.7
18-44 119.4 118.9 122.6 119.0 115.4 114.3 115.5 120.2 121.9 119.1
18-24 43.0 41.5 40.7 40.0 39.7 36.4 37.3 35.1 35.7 34.2
25-44 146.2 146.0 151.3 146.6 141.9 141.6 142.9 150.0 152.1 148.8
45-64 597.2 593.0 593.4 575.8 557.2 558.5 559.4 560.4 567.3 552.4
45-54 390.2 386.5 389.4 374.0 372.3 370.6 384.0 388.1 399.3 391.0
55-64 804.2 799.5 797.3 777.7 742.1 746.4 734.9 732.6 735.3 713.9
65+ 1623.6 1600.5 1610.9 1602.2 1522.7 1464.9 1466.4 1443.4 1452.6 1419.7
65-74 1379.6 1352.9 1360.8 1353.9 1271.5 1242.0 1249.4 1241.8 1228.7 1222.1
75-84 1879.1 1855.7 1867.2 1863.0 1789.6 1703.1 1705.7 1668.1 1703.8 1646.8
85+ 1510.0 1523.4 1548.7 1477.5 1365.0 1311.6 1242.2 1211.4 1179.7 1124.7
Data Source: Special analyses, USRDS ESRD Database and CDC Bridged Race Intercensal Estimates Dataset, Incident ESRD patients. Rates adjusted for: overall, age/sex/race; rates by age adjusted for sex/race; rates by sex adjusted for age/race; rates by race/ethnicity adjusted for age/sex. Reference population: 2012 patients. ~Estimate shown is imprecise due to small sample size and may be unstable over time. *Values for cells with 10 or fewer patients are suppressed. Abbreviations: CDC, Centers for Disease Control and Prevention; CKD, chronic kidney disease; ESRD, end-stage renal disease.
2018 USRDS ANNUAL DATA REPORT | KIDNEY DISEASE IN THE UNITED STATES
712
HP2020 Table 6 CKD-9.1 Reduce kidney failure (or end-stage renal disease, ESRD) due to diabetes: Target 154.4 per million population
2007 2008 2009 2010 2011 2012 2013 2014 2015 2016
All 171.5 169.1 169.7 167.0 160.1 158.5 160.2 161.5 166.6 166.3
Race
American Indian or Alaska Native 380.7 389.9 383.5 347.6 321.0 322.9 299.0 290.7 277.6 282.8
Asian 172.9 180.0 180.5 172.6 173.6 170.5 173.2 172.0 165.9 173.1
Native Hawaiian or Pacific Islander~ 1504.7 1336.8 1534.8 1648.6 1449.1 1520.8 1679.5 1655.0 1643.1 1680.0
Black/African American 478.2 473.8 471.6 456.9 437.2 414.2 404.4 398.7 399.8 386.0
White 136.2 134.1 135.3 134.6 129.5 130.4 133.7 135.8 142.0 142.9
Two or more races 81.4 78.4 76.2 68.4 58.7 6.0 . . * *
Ethnicity
Hispanic/Latino 367.1 367.9 360.6 356.3 347.2 324.9 320.7 307.9 309.4 296.4
Non-Hispanic 158.6 156.3 157.8 155.2 148.6 148.4 150.4 152.9 158.3 159.4
Non-Hispanic Black/African American 486.2 482.1 480.5 465.7 445.4 423.8 414.3 409.9 411.0 397.6
Non-Hispanic White 113.0 109.4 110.5 109.3 103.8 106.2 109.2 111.9 118.2 120.3
Sex
Male 202.3 200.8 203.3 200.7 193.8 191.9 196.1 199.8 204.7 204.3
Female 145.8 142.5 141.6 138.6 131.6 130.0 129.7 128.9 134.2 134.2
Age
<18 * * * 0.1 * 0.1 * 0.1 0.1 0.1
0-4 * . * * * * * 0.3 0.3 0.2
5-11 . * . . . * . . . *
12-17 * * * * * * * . * *
18-44 37.8 37.7 39.9 39.7 39.7 38.4 39.6 42.0 43.4 43.5
18-24 2.7 2.4 2.6 2.5 2.3 2.5 2.6 1.8 2.5 2.2
25-44 50.1 50.0 53.0 52.7 52.7 51.0 52.5 56.0 57.7 57.9
45-64 309.9 308.5 307.1 295.4 282.6 285.5 283.5 284.2 291.2 286.5
45-54 179.0 178.6 180.4 175.9 173.9 176.1 183.5 184.7 193.6 194.2
55-64 440.8 438.4 433.7 414.9 391.2 394.9 383.5 383.8 388.8 378.7
65+ 691.7 674.6 674.3 680.2 648.7 619.5 632.5 631.1 653.4 653.7
65-74 697.9 678.3 675.8 669.7 633.3 615.7 625.0 621.5 620.5 634.9
75-84 718.0 700.8 701.1 720.6 693.1 650.2 669.9 670.0 717.1 703.5
85+ 367.2 376.7 390.4 381.6 358.5 350.1 334.6 337.8 345.6 342.9
Data Source: Special analyses, USRDS ESRD Database and CDC Bridged Race Intercensal Estimates Dataset, Incident ESRD patients. Adjusted for age/sex/race. Reference population: 2012 patients. “.” Zero values in this cell. *Values for cells with 10 or fewer patients are suppressed. ~Estimate shown is imprecise due to small sample size and may be unstable over time. Abbreviations: CDC, Centers for Disease Control and Prevention; CKD, chronic kidney disease; ESRD, end-stage renal disease.

HEALTHY PEOPLE 2020
713
In 2016 the adjusted rate of kidney failure among
persons with DM was 2,412 PMP (adjustment by age,
sex, and race; see Table 7), failing to achieve the
HP2020 target of 2352.7PMP. This represented a
decrease from 2015, although it is still higher than it
was in 2009-2014.
Rates in 2016 varied among races, and remained
highest in Blacks with DM at 3462 PMP, compared to
2189 PMP in their White counterparts. Of note, rates
in Whites have increased annually since 2011. In
contrast, rates of kidney failure in Blacks with DM
have fallen each year since 2007, an overall 22.6%
decrease during that period.
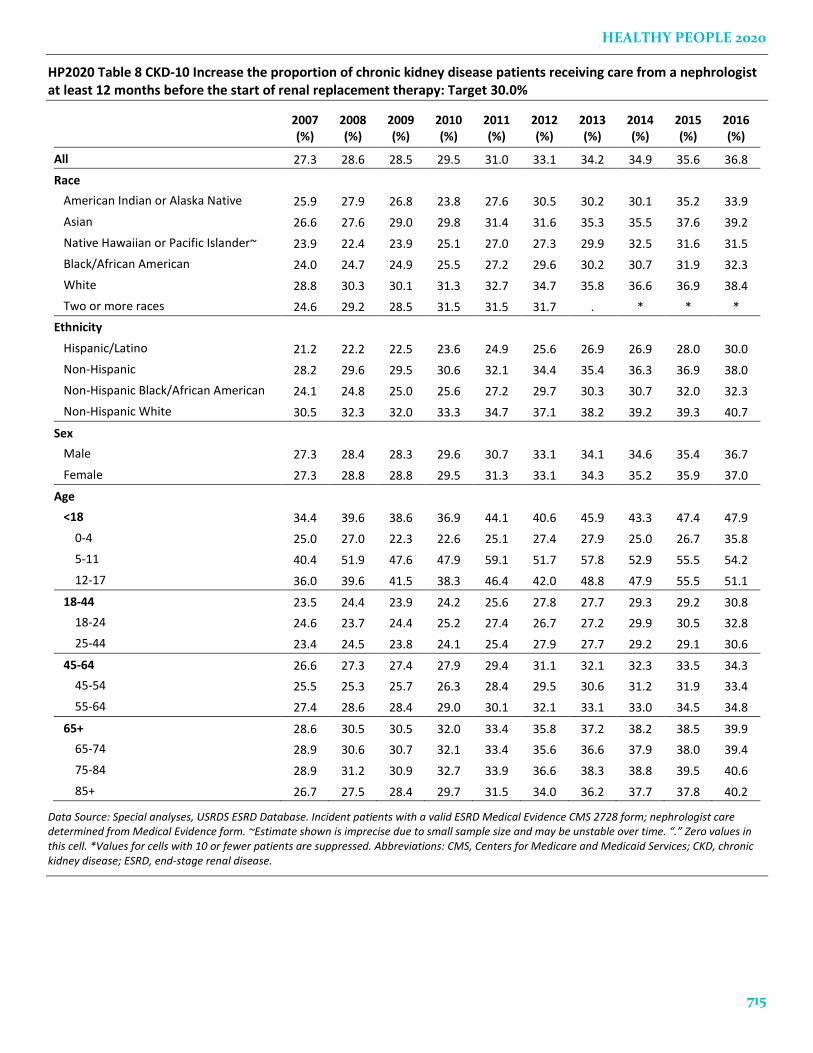
Nephrologist Care
At 36.8%, the proportion of CKD patients in 2016
receiving care from a nephrologist at least 12 months
before the start of renal replacement therapy exceeded
the HP2020 goal of 30.0%, which was based on a 10%
increase over the 2007 proportion (Table 8). Steady
improvement has been seen over the last decade, and
this is the sixth consecutive year of surpassing the
HP2020 goal.
Variations by race continued to be observed, with
Whites (38.4%) and Asians (39.2%) having a greater
proportion of care than Blacks (32.3%) and Native
Hawaiians and Pacific Islanders (31.5%). Percentages
by ethnicity were lowest among Hispanics and
Latinos, at 30.0%. However, all race and ethnicity
groups achieved the HP2020 goal.
Greater variation was observed by age, with the
proportions ranging from 30.8% among those aged 18-
44 to 47.9% among those under age 18. In contrast to
the differences seen by race and age, percentages of
pre-ESRD nephrologist care were similar by sex, at
36.7% among males and 37.0% among females.

2018 USRDS ANNUAL DATA REPORT | KIDNEY DISEASE IN THE UNITED STATES
714
HP2020 Table 7 CKD-9.2 Reduce kidney failure (or end-stage renal disease, ESRD) due to diabetes among persons with diabetes: Target 2,352.7 per million population
2007 2008 2009 2010 2011 2012 2013 2014 2015 2016
All 2614 2486 2403 2347 2280 2273 2309 2320 2414 2412
Race
American Indian or Alaska Native 2572 2916 2925 2594 2241 2289 2034 1744 1732 1798
Asian 2067 2190 2214 2111 2088 2166 2318 2317 2288 2362
Native Hawaiian or Pacific Islander~ N/A N/A N/A N/A N/A N/A N/A N/A N/A N/A
Black/African American 4472 4332 4242 3979 3834 3724 3605 3595 3553 3462
White 2275 2139 2051 2028 1978 1990 2046 2068 2180 2189
Two or more races 614 553 509 481 468 46 0 0 * *
Ethnicity
Hispanic/Latino 3320 3184 2967 2903 2910 2814 2826 2746 2795 2714
Non-Hispanic 2513 2388 2321 2263 2186 2185 2222 2242 2335 2345
Non-Hispanic Black/African American 4676 4522 4472 4192 4075 3932 3795 3803 3784 3720
Non-Hispanic White 2045 1898 1823 1801 1734 1769 1832 1864 1989 2012
Sex
Male 2926 2743 2624 2542 2531 2549 2622 2638 2727 2718
Female 2324 2236 2179 2143 2027 1998 1998 1997 2096 2101
Age
<18 * * 23 28 * 30 32 46 66 54
0-4 * * * * * * * * * *
5-11 . * * * * * * . * *
12-17 * * * * * * * . * *
18-44 1610 1537 1506 1462 1556 1522 1573 1716 1738 1723
18-24 347 268 284 295 338 294 287 203 295 240
25-44 1745 1684 1641 1580 1663 1659 1726 1904 1909 1898
45-64 2374 2256 2197 2136 2079 2124 2139 2156 2250 2215
45-54 2003 1844 1857 1867 1883 1893 1971 1984 2073 2034
55-64 2639 2571 2437 2310 2191 2266 2239 2255 2351 2314
65+ 3101 2938 2804 2724 2582 2518 2571 2521 2624 2629
65-74 3184 2989 2898 2774 2629 2574 2636 2583 2569 2621
75-84 3355 3158 2939 2880 2809 2732 2871 2789 3113 3004
85+ 1946 2065 1981 2067 1766 1701 1515 1527 1676 1709
Data Source: Special analyses, USRDS ESRD Database and CDC Bridged Race Intercensal Estimates Dataset, Incident ESRD patients. Adjusted for age/sex/race. Reference population: 2012. National Health Interview Survey 2006–2015 used to estimate diabetes mellitus prevalence. ~Estimate shown is imprecise due to small sample size and may be unstable over time. *Values for cells with 10 or fewer patients are suppressed. “.” Zero values in this cell. Abbreviations: CDC, Centers for Disease Control and Prevention; CKD, chronic kidney disease; ESRD, end-stage renal disease.
HEALTHY PEOPLE 2020
715
HP2020 Table 8 CKD-10 Increase the proportion of chronic kidney disease patients receiving care from a nephrologist at least 12 months before the start of renal replacement therapy: Target 30.0%
2007 (%)
2008 (%)
2009 (%)
2010 (%)
2011 (%)
2012 (%)
2013 (%)
2014 (%)
2015 (%)
2016 (%)
All 27.3 28.6 28.5 29.5 31.0 33.1 34.2 34.9 35.6 36.8
Race
American Indian or Alaska Native 25.9 27.9 26.8 23.8 27.6 30.5 30.2 30.1 35.2 33.9
Asian 26.6 27.6 29.0 29.8 31.4 31.6 35.3 35.5 37.6 39.2
Native Hawaiian or Pacific Islander~ 23.9 22.4 23.9 25.1 27.0 27.3 29.9 32.5 31.6 31.5
Black/African American 24.0 24.7 24.9 25.5 27.2 29.6 30.2 30.7 31.9 32.3
White 28.8 30.3 30.1 31.3 32.7 34.7 35.8 36.6 36.9 38.4
Two or more races 24.6 29.2 28.5 31.5 31.5 31.7 . * * *
Ethnicity
Hispanic/Latino 21.2 22.2 22.5 23.6 24.9 25.6 26.9 26.9 28.0 30.0
Non-Hispanic 28.2 29.6 29.5 30.6 32.1 34.4 35.4 36.3 36.9 38.0
Non-Hispanic Black/African American 24.1 24.8 25.0 25.6 27.2 29.7 30.3 30.7 32.0 32.3
Non-Hispanic White 30.5 32.3 32.0 33.3 34.7 37.1 38.2 39.2 39.3 40.7
Sex
Male 27.3 28.4 28.3 29.6 30.7 33.1 34.1 34.6 35.4 36.7
Female 27.3 28.8 28.8 29.5 31.3 33.1 34.3 35.2 35.9 37.0
Age
<18 34.4 39.6 38.6 36.9 44.1 40.6 45.9 43.3 47.4 47.9
0-4 25.0 27.0 22.3 22.6 25.1 27.4 27.9 25.0 26.7 35.8
5-11 40.4 51.9 47.6 47.9 59.1 51.7 57.8 52.9 55.5 54.2
12-17 36.0 39.6 41.5 38.3 46.4 42.0 48.8 47.9 55.5 51.1
18-44 23.5 24.4 23.9 24.2 25.6 27.8 27.7 29.3 29.2 30.8
18-24 24.6 23.7 24.4 25.2 27.4 26.7 27.2 29.9 30.5 32.8
25-44 23.4 24.5 23.8 24.1 25.4 27.9 27.7 29.2 29.1 30.6
45-64 26.6 27.3 27.4 27.9 29.4 31.1 32.1 32.3 33.5 34.3
45-54 25.5 25.3 25.7 26.3 28.4 29.5 30.6 31.2 31.9 33.4
55-64 27.4 28.6 28.4 29.0 30.1 32.1 33.1 33.0 34.5 34.8
65+ 28.6 30.5 30.5 32.0 33.4 35.8 37.2 38.2 38.5 39.9
65-74 28.9 30.6 30.7 32.1 33.4 35.6 36.6 37.9 38.0 39.4
75-84 28.9 31.2 30.9 32.7 33.9 36.6 38.3 38.8 39.5 40.6
85+ 26.7 27.5 28.4 29.7 31.5 34.0 36.2 37.7 37.8 40.2
Data Source: Special analyses, USRDS ESRD Database. Incident patients with a valid ESRD Medical Evidence CMS 2728 form; nephrologist care determined from Medical Evidence form. ~Estimate shown is imprecise due to small sample size and may be unstable over time. “.” Zero values in this cell. *Values for cells with 10 or fewer patients are suppressed. Abbreviations: CMS, Centers for Medicare and Medicaid Services; CKD, chronic kidney disease; ESRD, end-stage renal disease.

2018 USRDS ANNUAL DATA REPORT | KIDNEY DISEASE IN THE UNITED STATES
716
Substantial geographic variation was also observed
in the proportion of CKD patients receiving care from
a nephrologist at least 12 months before the start of
renal replacement therapy (Figure 1). While in 2016, 48
of the U.S. states met or exceeded the HP2020 target
of 30.0%, percentages varied by nearly 50% from the
twentieth percentile (37%) to the eightieth percentile
(48%). In general, the highest percentages of patients
receiving this care were observed in the North Atlantic
and Northern Plains regions, with the lowest
occurring in the Mid-South and Southern Plains
states.
HP2020 Figure 1 CKD-10: Geographic distribution of the adjusted proportion of chronic kidney disease patients receiving care from a nephrologist at least 12 months before the start of renal replacement therapy, by state, in the U.S. population, 2015: Target 30.0%
Data Source: Special analyses, USRDS ESRD Database. Incident hemodialysis patients with a valid ESRD Medical Evidence CMS 2728 form; nephrologist care determined from Medical Evidence form. Adjusted for age, sex, and race. Abbreviations: CKD, chronic kidney disease; CMS, Centers for Medicare and Medicaid Services.
Vascular Access
Vascular access is an important aspect of
hemodialysis care, and arteriovenous (AV) fistulas are
clinically established as the primary access of choice.
The HP2020 CKD Objective 11.1 examines the use of
AV fistulas among prevalent hemodialysis patients
(see Table 9). Prior to the 2014 ADR, we derived data
regarding vascular access from the ESRD Clinical
Performance Measures (CPM) Project that only
collected this information through 2007. In the 2014
ADR, we introduced data from CROWNWeb, a
dialysis data reporting system launched by CMS in
2012, and this remains the primary data source for this
objective.
In 2016, 64.1% of prevalent adult hemodialysis
patients were using an AV fistula as their primary
access. This proportion appears stable over the last
few years, but remains well above the last available
ESRD CPM data from 2007 (49.6%; USRDS, 2012). This
overall prevalence exceeded the previous HP2020
target of 50.6%, although comparisons should be
made with caution as this target was derived from a
different data source (ESRD CPM).
Among race groups, Blacks had the lowest
percentage of AV fistula use at 59.3%, compared to
66.4% of Whites, 68.4% of Asians, 76.3% of American
Indians or Alaska Natives, and 69.2% of Native
Hawaiians or other Pacific Islanders. The proportion
of males with an AV fistula (69.9%) was higher than
for females (56.4%).

HEALTHY PEOPLE 2020
717
HP2020 Table 9 CKD-11.1: Increase the proportion of adult hemodialysis patients who use arteriovenous fistulas as the primary mode of vascular access: Previous data source target 50.6%
2012 (%)
2013 (%)
2014 (%)
2015 (%)
2016 (%)
All 62.8 64.2 64.6 64.3 64.1
Race
American Indian or Alaska Native 72.5 75.7 76.2 76.4 76.3
Asian 67.7 69.4 69.9 69.2 68.4
Native Hawaiian or Pacific Islander~ 66.5 69.3 69.7 69.6 69.2
Black/African American 58.5 59.7 60.2 59.9 59.3
White 65.0 66.4 66.8 66.4 66.4
Two or more races 70.1 70.2 72.0 71.0 70.0
Ethnicity
Hispanic/Latino 68.7 69.5 69.8 69.6 70.0
Non-Hispanic 61.4 62.9 63.4 63.0 62.8
Non-Hispanic Black/African American 58.4 59.6 60.1 59.8 59.3
Non-Hispanic White 63.2 64.9 65.3 64.8 64.6
Sex
Male 69.0 70.1 70.3 70.0 69.9
Female 54.7 56.5 57.3 56.8 56.4
Age
18-44 66.7 67.5 68.0 67.5 67.2
18-24 66.0 67.7 68.8 67.6 67.7
25-44 66.8 67.4 67.9 67.5 67.1
45-64 64.4 65.8 66.3 66.2 66.3
45-54 66.2 67.5 68.1 67.9 68.1
55-64 63.1 64.6 65.0 64.9 65.0
65+ 58.4 60.2 60.7 60.4 60.2
65-74 60.2 62.0 62.4 62.4 62.2
75-84 57.2 58.9 59.4 58.8 58.7
85+ 48.0 50.0 50.4 49.8 50.0
Data Source: Special analyses, CROWNWeb. Prevalent hemodialysis patients with a valid ESRD Medical Evidence CMS 2728 form; vascular access type determined from CROWNWeb. ~Estimate shown is imprecise due to small sample size and may be unstable over time. Abbreviations: CKD, chronic kidney disease; CMS, Centers for Medicare and Medicaid Services; ESRD, end-stage renal disease.

2018 USRDS ANNUAL DATA REPORT | KIDNEY DISEASE IN THE UNITED STATES
718
In comparison to AV fistulas, reliance on
hemodialysis catheters as primary vascular access is
associated with increased morbidity and mortality.
HP2020 CKD Objective 11.2 aims to reduce the
proportion of hemodialysis patients that are
dependent on catheters. Data for this objective were
also obtained from CROWNWeb and thus
interpretation of target achievement may be limited,
as the former HP2020 target was derived from a
different data source (ESRD CPM Project).
In 2016, 15.9% of prevalent adult hemodialysis
patients were using catheters as the primary mode of
access (Table 10). This represents an improvement
from the most recent available data from the ESRD
CPM project, which found that 27.7% of prevalent
hemodialysis patients were using a catheter as their
primary access in 2007.
Percentage of catheter use was highest among
Whites at 16.9% compared to 15.1% in Blacks, 13.3% in
Asians, 11.6% in American Indian or Alaska Natives,
and 13.6% in Native Hawaiians or Pacific Islanders.
The proportion of patients with catheter access
increased by age group after the age of 45, rising from
14.1% among those aged 45-54 years to 25.2% in those
aged 85 years and older.
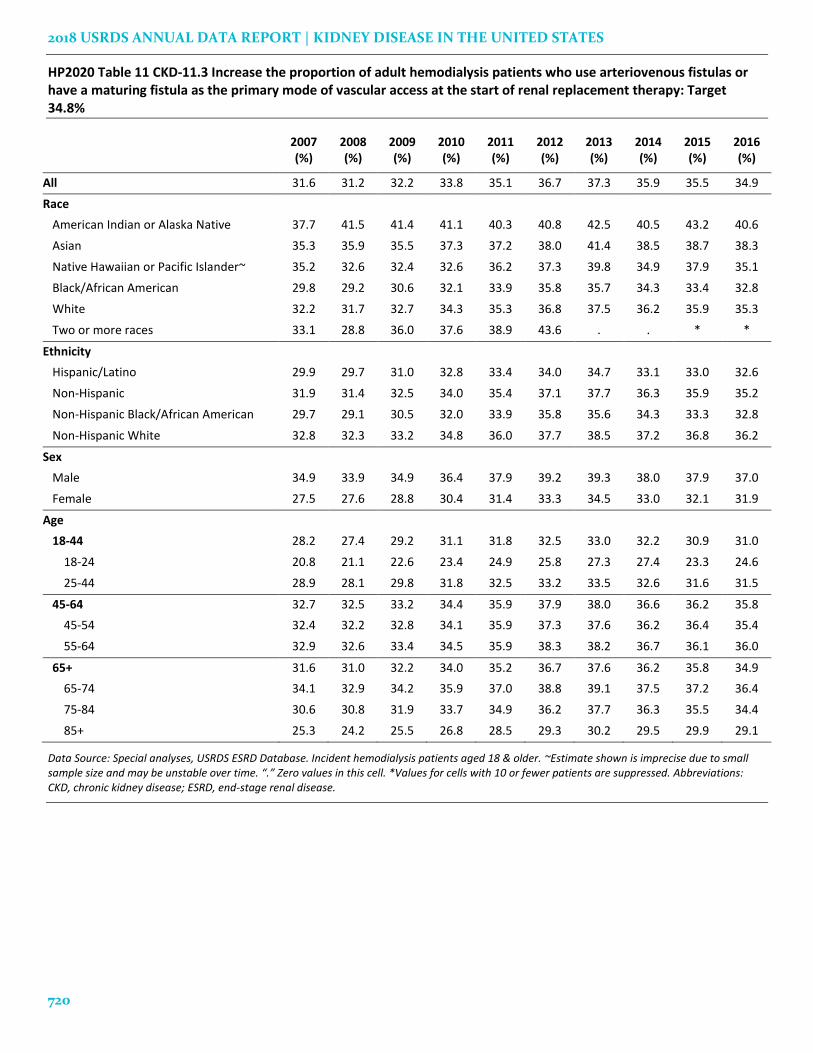
Programs such as HP2020 and the Fistula First
Initiative (a U.S. national quality improvement
program initiated in 2003) continue to work to
increase the use of fistulas, and to promote early
placement prior to initiation of ESRD therapy. In 2016,
34.9% of incident hemodialysis patients had a
maturing arteriovenous fistula, or were using one as
their primary vascular access (see Table 11). This was
the fourth consecutive year of slight decrease in this
proportion, but remains above the HP2020 goal of
34.8%.
By race, in 2016 Blacks had the lowest proportion of
AV fistula at 32.8%, compared to 35.3% in Whites,
40.6% in American Indian or Alaska Natives, 38.3% in
Asians, and 35.1% in Native Hawaiians or Pacific
Islanders. By age group, patients aged 65-74 had the
highest proportion at 36.4%, compared to just 24.6%
in patients aged 18-24.

HEALTHY PEOPLE 2020
719
HP2020 Table 10 CKD-11.2: Reduce the proportion of adult hemodialysis patients who use catheters as the only mode of vascular access: Previous data source target 26.1%
2012 (%)
2013 (%)
2014 (%)
2015 (%)
2016 (%)
All 15.0 14.3 16.0 16.1 15.9
Race
American Indian or Alaska Native 12.2 11.1 12.1 11.5 11.6
Asian 13.0 12.3 13.0 13.0 13.3
Native Hawaiian or Pacific Islander~ 13.4 13.7 14.0 14.3 13.6
Black/African American 14.1 13.4 14.9 15.1 15.1
White 15.9 15.2 17.1 17.2 16.9
Two or more races 10.4 10.0 8.5 8.3 9.9
Ethnicity
Hispanic/Latino 12.9 12.7 14.3 14.4 14.0
Non-Hispanic 15.5 14.7 16.4 16.5 16.4
Non-Hispanic Black/African American 14.1 13.4 14.9 15.1 15.1
Non-Hispanic White 17.3 16.4 18.5 18.5 18.2
Sex
Male 13.1 12.6 14.3 14.3 14.1
Female 17.4 16.5 18.2 18.4 18.4
Age
18-44 14.3 13.7 15.2 15.6 15.4
18-24 17.1 15.6 16.4 17.6 17.4
25-44 14.0 13.5 15.1 15.4 15.2
45-64 14.0 13.3 14.9 15.0 14.7
45-54 13.4 12.6 14.1 14.3 14.1
55-64 14.5 13.9 15.4 15.4 15.2
65+ 16.7 16.0 17.9 17.8 17.7
65-74 15.3 14.6 16.7 16.4 16.5
75-84 17.4 16.8 18.4 18.6 18.3
85+ 26.0 24.6 26.0 26.2 25.2
Data Source: Special analyses, CROWNWeb. Prevalent hemodialysis patients with a valid ESRD Medical Evidence CMS 2728 form; vascular access type determined from CROWNWeb. ~Estimate shown is imprecise due to small sample size and may be unstable over time. Abbreviations: CKD, chronic kidney disease; CMS, Centers for Medicare and Medicaid Services; ESRD, end-stage renal disease.
2018 USRDS ANNUAL DATA REPORT | KIDNEY DISEASE IN THE UNITED STATES
720
HP2020 Table 11 CKD-11.3 Increase the proportion of adult hemodialysis patients who use arteriovenous fistulas or have a maturing fistula as the primary mode of vascular access at the start of renal replacement therapy: Target 34.8%
2007 (%)
2008 (%)
2009 (%)
2010 (%)
2011 (%)
2012 (%)
2013 (%)
2014 (%)
2015 (%)
2016 (%)
All 31.6 31.2 32.2 33.8 35.1 36.7 37.3 35.9 35.5 34.9
Race
American Indian or Alaska Native 37.7 41.5 41.4 41.1 40.3 40.8 42.5 40.5 43.2 40.6
Asian 35.3 35.9 35.5 37.3 37.2 38.0 41.4 38.5 38.7 38.3
Native Hawaiian or Pacific Islander~ 35.2 32.6 32.4 32.6 36.2 37.3 39.8 34.9 37.9 35.1
Black/African American 29.8 29.2 30.6 32.1 33.9 35.8 35.7 34.3 33.4 32.8
White 32.2 31.7 32.7 34.3 35.3 36.8 37.5 36.2 35.9 35.3
Two or more races 33.1 28.8 36.0 37.6 38.9 43.6 . . * *
Ethnicity
Hispanic/Latino 29.9 29.7 31.0 32.8 33.4 34.0 34.7 33.1 33.0 32.6
Non-Hispanic 31.9 31.4 32.5 34.0 35.4 37.1 37.7 36.3 35.9 35.2
Non-Hispanic Black/African American 29.7 29.1 30.5 32.0 33.9 35.8 35.6 34.3 33.3 32.8
Non-Hispanic White 32.8 32.3 33.2 34.8 36.0 37.7 38.5 37.2 36.8 36.2
Sex
Male 34.9 33.9 34.9 36.4 37.9 39.2 39.3 38.0 37.9 37.0
Female 27.5 27.6 28.8 30.4 31.4 33.3 34.5 33.0 32.1 31.9
Age
18-44 28.2 27.4 29.2 31.1 31.8 32.5 33.0 32.2 30.9 31.0
18-24 20.8 21.1 22.6 23.4 24.9 25.8 27.3 27.4 23.3 24.6
25-44 28.9 28.1 29.8 31.8 32.5 33.2 33.5 32.6 31.6 31.5
45-64 32.7 32.5 33.2 34.4 35.9 37.9 38.0 36.6 36.2 35.8
45-54 32.4 32.2 32.8 34.1 35.9 37.3 37.6 36.2 36.4 35.4
55-64 32.9 32.6 33.4 34.5 35.9 38.3 38.2 36.7 36.1 36.0
65+ 31.6 31.0 32.2 34.0 35.2 36.7 37.6 36.2 35.8 34.9
65-74 34.1 32.9 34.2 35.9 37.0 38.8 39.1 37.5 37.2 36.4
75-84 30.6 30.8 31.9 33.7 34.9 36.2 37.7 36.3 35.5 34.4
85+ 25.3 24.2 25.5 26.8 28.5 29.3 30.2 29.5 29.9 29.1
Data Source: Special analyses, USRDS ESRD Database. Incident hemodialysis patients aged 18 & older. ~Estimate shown is imprecise due to small sample size and may be unstable over time. “.” Zero values in this cell. *Values for cells with 10 or fewer patients are suppressed. Abbreviations: CKD, chronic kidney disease; ESRD, end-stage renal disease.

HEALTHY PEOPLE 2020
721
Transplantation
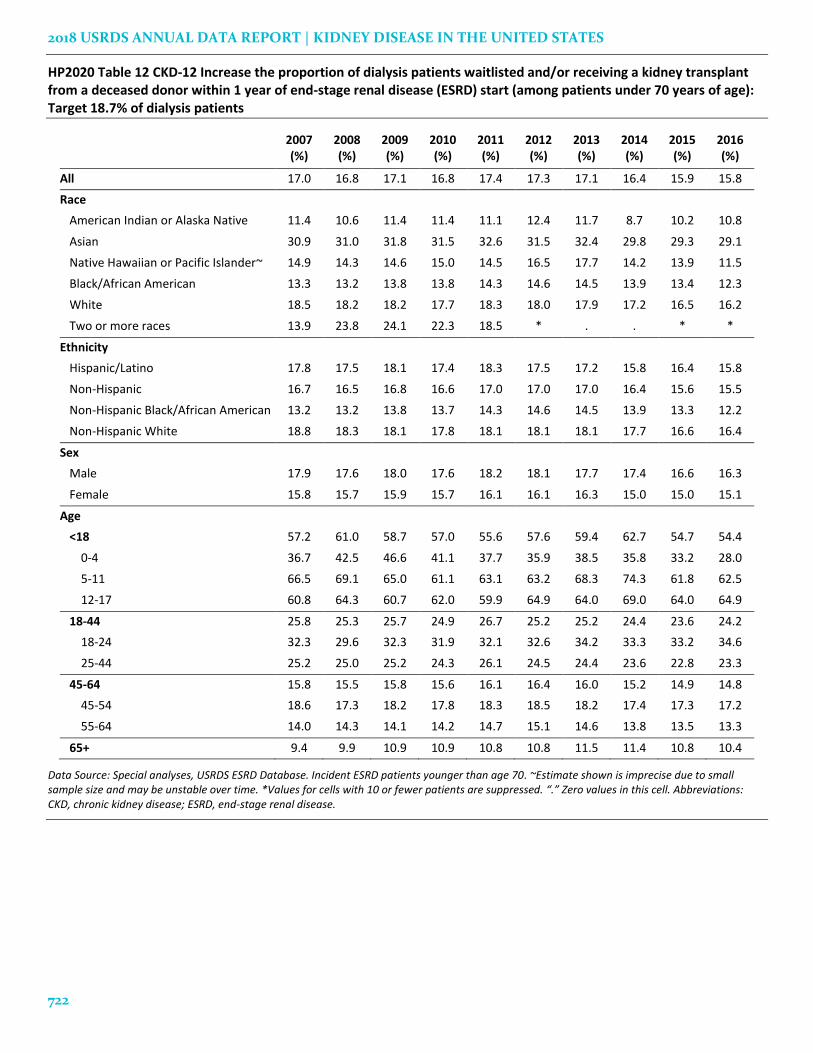
Objective CKD-12 examines the proportion of ESRD
patients younger than age 70 who were wait-listed or
received a kidney transplant from a deceased donor
within one year of initiating dialysis therapy. This
proportion has decreased in recent years, falling from
between 17.3% in 2012 to 15.8% in 2016 (Table 12).
Across race categories, the HP2020 target of 18.7% was
only achieved by those of Asian race (28.7%). Males
(16.3%) were closer to the target than females (15.1%).
Groups furthest from the target included American
Indians or Alaska Natives (10.8%), those aged 65+
(10.4%), Blacks (12.3%) and Native Hawaiians and
Pacific Islanders (11.5%). Gaps between groups with
the highest and lowest percentages have remained
stable, showing only minor decreases over time.
At 12.7%, the proportion of 2013 patients younger
than age 70 who received a kidney transplant within
three years of starting ESRD therapy (objective CKD-
12) remained well below the HP2020 target of 20.1%,
which was based on a 10% improvement over the
value in 2004 (see Table 13). This continued the slow
but consistent decrease observed since 2004, when
18.3% of patients received a transplant within three
years of initiating ESRD therapy.
Rates were lowest among Blacks (6.8%), and
American Indians and Alaska Natives (6.5%), and were
highest among Whites (15.5 %) and Asians (18.0%). At
13.0%, males were slightly more likely to receive a
transplant than females, at 12.3%. The percentage of
patients receiving transplants decreased with age,
from 77.2% in pediatric patients to 7.6% among those
aged 65-69.
2018 USRDS ANNUAL DATA REPORT | KIDNEY DISEASE IN THE UNITED STATES
722
HP2020 Table 12 CKD-12 Increase the proportion of dialysis patients waitlisted and/or receiving a kidney transplant from a deceased donor within 1 year of end-stage renal disease (ESRD) start (among patients under 70 years of age): Target 18.7% of dialysis patients
2007 (%)
2008 (%)
2009 (%)
2010 (%)
2011 (%)
2012 (%)
2013 (%)
2014 (%)
2015 (%)
2016 (%)
All 17.0 16.8 17.1 16.8 17.4 17.3 17.1 16.4 15.9 15.8
Race
American Indian or Alaska Native 11.4 10.6 11.4 11.4 11.1 12.4 11.7 8.7 10.2 10.8
Asian 30.9 31.0 31.8 31.5 32.6 31.5 32.4 29.8 29.3 29.1
Native Hawaiian or Pacific Islander~ 14.9 14.3 14.6 15.0 14.5 16.5 17.7 14.2 13.9 11.5
Black/African American 13.3 13.2 13.8 13.8 14.3 14.6 14.5 13.9 13.4 12.3
White 18.5 18.2 18.2 17.7 18.3 18.0 17.9 17.2 16.5 16.2
Two or more races 13.9 23.8 24.1 22.3 18.5 * . . * *
Ethnicity
Hispanic/Latino 17.8 17.5 18.1 17.4 18.3 17.5 17.2 15.8 16.4 15.8
Non-Hispanic 16.7 16.5 16.8 16.6 17.0 17.0 17.0 16.4 15.6 15.5
Non-Hispanic Black/African American 13.2 13.2 13.8 13.7 14.3 14.6 14.5 13.9 13.3 12.2
Non-Hispanic White 18.8 18.3 18.1 17.8 18.1 18.1 18.1 17.7 16.6 16.4
Sex
Male 17.9 17.6 18.0 17.6 18.2 18.1 17.7 17.4 16.6 16.3
Female 15.8 15.7 15.9 15.7 16.1 16.1 16.3 15.0 15.0 15.1
Age
<18 57.2 61.0 58.7 57.0 55.6 57.6 59.4 62.7 54.7 54.4
0-4 36.7 42.5 46.6 41.1 37.7 35.9 38.5 35.8 33.2 28.0
5-11 66.5 69.1 65.0 61.1 63.1 63.2 68.3 74.3 61.8 62.5
12-17 60.8 64.3 60.7 62.0 59.9 64.9 64.0 69.0 64.0 64.9
18-44 25.8 25.3 25.7 24.9 26.7 25.2 25.2 24.4 23.6 24.2
18-24 32.3 29.6 32.3 31.9 32.1 32.6 34.2 33.3 33.2 34.6
25-44 25.2 25.0 25.2 24.3 26.1 24.5 24.4 23.6 22.8 23.3
45-64 15.8 15.5 15.8 15.6 16.1 16.4 16.0 15.2 14.9 14.8
45-54 18.6 17.3 18.2 17.8 18.3 18.5 18.2 17.4 17.3 17.2
55-64 14.0 14.3 14.1 14.2 14.7 15.1 14.6 13.8 13.5 13.3
65+ 9.4 9.9 10.9 10.9 10.8 10.8 11.5 11.4 10.8 10.4
Data Source: Special analyses, USRDS ESRD Database. Incident ESRD patients younger than age 70. ~Estimate shown is imprecise due to small sample size and may be unstable over time. *Values for cells with 10 or fewer patients are suppressed. “.” Zero values in this cell. Abbreviations: CKD, chronic kidney disease; ESRD, end-stage renal disease.

HEALTHY PEOPLE 2020
723
HP2020 Table 13 CKD-13.1 Increase the proportion of patients receiving a kidney transplant within 3 years of end-stage renal disease (ESRD): Target 20.1%
2004 (%)
2005 (%)
2006 (%)
2007 (%)
2008 (%)
2009 (%)
2010 (%)
2011 (%)
2012 (%)
2013 (%)
All 18.3 17.8 17.2 16.6 15.6 14.7 14.1 13.7 13.2 12.7
Race
American Indian or Alaska Native 9.3 8.8 10.0 10.1 7.0 7.2 7.2 6.4 7.2 6.5
Asian 20.6 18.6 19.1 17.6 18.0 16.9 17.5 16.9 16.2 18.0
Native Hawaiian or Pacific Islander~ 12.7 9.8 9.6 10.5 11.2 8.3 7.5 8.0 8.3 6.7
Black/African American 10.0 9.6 9.1 9.0 8.7 7.8 7.7 7.3 7.0 6.8
White 22.7 22.2 21.4 20.7 19.3 18.1 17.2 16.9 16.2 15.5
Two or more races . 17.1 16.6 14.7 17.9 18.3 14.8 17.6 18.3 .
Ethnicity
Hispanic/Latino 14.9 15.1 14.7 14.0 12.8 11.8 11.3 11.4 11.0 10.8
Non-Hispanic 18.6 18.0 17.3 16.8 15.9 14.9 14.3 13.9 13.2 12.7
Non-Hispanic Black/African
American
9.9 9.5 8.9 8.9 8.6 7.7 7.6 7.2 6.9 6.6
Non-Hispanic White 25.1 24.5 23.7 23.0 21.7 20.4 19.4 19.0 18.1 17.3
Sex
Male 19.6 19.2 18.5 17.5 16.2 15.3 14.5 14.3 13.5 13.0
Female 16.5 15.9 15.4 15.3 14.8 13.8 13.5 12.9 12.7 12.3
Age
<18 76.3 76.7 78.1 78.3 76.8 78.2 74.6 75.0 74.4 77.2
0-4 78.0 75.5 77.3 75.9 68.7 77.0 71.2 68.8 62.7 73.3
5-11 84.1 82.1 83.0 86.9 85.6 83.0 81.0 85.6 84.0 83.6
12-17 72.6 75.1 76.8 76.0 76.3 76.9 73.2 73.4 75.6 76.0
18-44 29.3 27.7 26.7 25.4 23.9 22.6 21.8 21.4 21.2 21.0
18-24 42.0 40.3 37.1 35.1 33.1 34.0 33.8 30.5 31.9 35.0
25-44 27.8 26.3 25.5 24.2 22.8 21.4 20.5 20.3 20.1 19.5
45-64 15.2 15.0 14.5 14.0 13.2 12.3 11.8 11.5 11.0 10.2
45-54 18.5 17.6 17.1 16.9 15.6 14.8 13.8 13.4 12.8 11.8
55-64 12.6 13.1 12.6 12.0 11.6 10.7 10.5 10.3 9.9 9.2
65+ 8.1 7.9 8.4 8.3 8.3 7.9 8.0 7.9 7.0 7.6
Data Source: Special analyses, USRDS ESRD Database. Incident ESRD patients younger than age 70. ~Estimate shown is imprecise due to small sample size and may be unstable over time. “.” Zero values in this cell. Abbreviations: CKD, chronic kidney disease; ESRD, end-stage renal disease.

2018 USRDS ANNUAL DATA REPORT | KIDNEY DISEASE IN THE UNITED STATES
724
Geographic variation in the proportion of patients
receiving a kidney transplant within three years of
ESRD was also observed (Figure 2). In 2013, nine of the
U.S. states met or exceeded the HP2020 target of
20.1%; these were almost exclusively located in the
North Atlantic and Northern Plains regions. States
with the lowest percentages were generally observed
throughout the South and in the West.
In 2016, the percentage of patients receiving a
preemptive transplant at the start of ESRD remained
stable at 4.0%, consistent with the previous four years
(see Table 14). Not surprisingly, preemptive
transplants were most common in pediatric patients,
reaching 30.3% among those aged 5 to 11. Proportions
were equivalent between females at 4.1% and males at
3.9%. Broad variation was observed by race, however,
ranging from 0.9% among Blacks and to 3.6% among
Whites and 3.4% for Asians.
HP2020 Figure 2 HP2020 CKD-13.1 Geographic distribution of the adjusted proportion of patients receiving a kidney transplant within 3 years of end-stage renal disease (ESRD), by state, in the U.S. population, 2012: Target 20.1%
Data Source: Special analyses, USRDS ESRD Database. Incident ESRD patients younger than age 70. Adjusted for age, sex, and race. Alaska, Hawaii, and Wyoming are not reported due to small sample size. Abbreviations: CKD, chronic kidney disease; ESRD, end-stage renal disease.

HEALTHY PEOPLE 2020
725
HP2020 Table 14 CKD-13.2 Increase the proportion of patients who receive a preemptive transplant at the start of end-stage renal disease (ESRD): No applicable target
2007 (%)
2008 (%)
2009 (%)
2010 (%)
2011 (%)
2012 (%)
2013 (%)
2014 (%)
2015 (%)
2016 (%)
All 4.0 3.9 3.8 3.8 3.9 3.7 3.7 3.7 3.6 4.0
Race
American Indian or Alaska Native 1.2 * 1.6 * 1.6 1.3 1.2 1.3 1.4 *
Asian 3.1 3.6 3.2 3.5 3.8 3.3 4.5 3.9 4.1 3.4
Native Hawaiian or Pacific Islander~ 1.9 2.8 1.9 1.3 * * * 1.2 * *
Black/African American 1.1 1.2 1.1 1.2 1.3 1.0 1.2 1.0 0.9 0.9
White 5.3 5.1 4.7 4.8 4.8 4.5 4.4 4.3 3.9 3.6
Two or more races * * 4.0 * * * . . * *
Ethnicity
Hispanic/Latino 2.2 2.1 2.2 2.2 2.4 2.2 2.2 2.0 2.3 2.2
Non-Hispanic 4.1 3.9 3.7 3.8 3.9 3.5 3.6 3.5 3.3 3.5
Non-Hispanic Black/African American 1.1 1.1 1.1 1.2 1.2 1.0 1.1 1.0 0.9 0.9
Non-Hispanic White 6.3 6.0 5.5 5.7 5.7 5.3 5.3 5.1 4.5 4.2
Sex
Male 4.2 3.9 3.8 3.8 3.9 3.6 3.5 3.6 3.7 3.9
Female 3.8 4.0 3.8 3.9 3.9 3.8 3.9 3.9 3.6 4.1
Age
<18 21.3 20.9 25.0 22.5 24.0 24.2 24.2 22.9 26.4 25.1
0-4 19.7 10.6 19.2 15.0 18.3 17.4 18.5 14.6 15.8 15.0
5-11 31.0 30.7 33.0 31.1 28.3 30.0 32.1 31.5 37.0 30.3
12-17 18.1 20.9 24.1 21.9 24.9 24.8 23.0 22.7 27.8 27.7
18-44 6.0 6.0 5.7 5.5 5.9 5.5 5.4 5.8 5.7 6.4
18-24 8.1 8.6 8.9 8.9 9.2 9.1 8.0 10.3 9.3 9.6
25-44 5.8 5.8 5.4 5.2 5.5 5.1 5.1 5.4 5.4 6.1
45-64 3.6 3.5 3.3 3.5 3.3 3.1 3.2 3.2 3.2 3.4
45-54 4.6 4.3 4.0 4.4 4.0 3.8 3.7 3.8 3.9 4.3
55-64 3.0 3.0 2.8 2.9 2.9 2.7 2.8 2.9 2.7 2.9
65+ 1.8 2.0 1.9 2.2 2.3 2.2 2.4 2.3 2.0 2.5
Data Source: Special analyses, USRDS ESRD Database. Incident ESRD patients younger than age 70. ~Estimate shown is imprecise due to small sample size and may be unstable over time. *Values for cells with 10 or fewer patients are suppressed. “.” Zero values in this cell. Abbreviations: CKD, chronic kidney disease; ESRD, end-stage renal disease.

2018 USRDS ANNUAL DATA REPORT | KIDNEY DISEASE IN THE UNITED STATES
726
Mortality
Table 15 reports the mortality rate of prevalent
patients on dialysis. In the past decade, this rate has
fallen by nearly 17%, from 208.1 deaths per 1,000
patient-years in 2007 to 173.1 in 2016, although rates
appear to have stabilized in the past few years.
Nonetheless, this is the sixth consecutive year that
rates were below the HP2020 target of 187.3. In 2016,
mortality was slightly lower among males at 170.7
deaths per 1,000 patient-years, compared to females,
at 176.2 deaths.
Since 2007, reductions in mortality rates have been
observed across all age, race and ethnic groups.
Among race groups, mortality was highest among
Whites and continued to exceed the target at 202.8
deaths per 1,000 patient-years. Rates were lowest
among Native Hawaiians and Pacific Islanders (118.5
deaths per 1,000 patient-years), Asians (123.6 deaths
per 1,000), and Hispanics (127.1 per 1,000).
Since 2007, the rate of mortality among dialysis
patients in the first three months after initiation has
fallen by 21.7%, from 372.2 deaths per 1,000 patient-
years to 291.3 in 2016. For the fifth year in a row, the
rate was below the HP2020 target of 335.0 deaths per
1,000 patient-years (see Table 16). Whites remained
the only racial group who exceeded the target rate at
340.6 deaths per 1,000 patient-years. Rates were lowest
among American Indians and Alaska Natives, with
149.5 deaths. Native Hawaiians and Pacific Islanders
showed a rate of 164.4 deaths per 1,000 patient-years
at risk, and those with Hispanic or Latino ethnicity,
with 178.6 deaths. Males had slightly lower mortality
rates than females, at 289.7 deaths per 1,000 patient-
years compared to 293.5. Mortality rates were highest
among those aged 85 years or older, at 790.1 deaths
per 1,000 patient-years.

HEALTHY PEOPLE 2020
727
HP2020 Table 15 CKD-14.1 Reduce the total number of deaths for persons on dialysis: Target 187.3 deaths per 1,000 patient-years
2007 2008 2009 2010 2011 2012 2013 2014 2015 2016
All 208.1 200.8 195.5 188.6 184.6 177.2 173.4 171.6 174.0 173.1
Race
American Indian or Alaska Native 163.2 167.5 170.0 152.1 146.0 145.5 143.4 150.1 152.4 153.1
Asian 151.0 137.6 138.1 130.6 131.9 127.3 122.0 123.4 125.7 123.6
Native Hawaiian or Pacific Islander~ 157.5 146.2 152.2 148.3 135.2 132.2 119.3 124.1 115.2 118.5
Black/African American 164.2 157.8 153.3 145.6 140.9 135.9 133.5 131.9 135.4 137.9
White 246.6 238.5 231.6 225.3 221.8 212.3 207.7 204.7 206.5 202.8
Two or more races 144.6 148.7 144.4 133.3 127.0 120.3 120.8 134.9 119.6 124.0
Ethnicity
Hispanic/Latino 146.8 140.3 139.8 131.5 129.9 129.8 125.0 124.4 127.7 127.1
Non-Hispanic 219.5 212.4 206.5 200.1 195.9 187.3 184.0 182.0 184.3 183.3
Non-Hispanic Black/African American 164.7 158.2 153.9 146.1 141.3 135.7 133.6 132.2 135.7 138.1
Non-Hispanic White 278.5 271.6 264.2 259.8 257.2 246.3 242.0 238.6 240.0 234.8
Sex
Male 204.8 198.4 194.8 187.1 183.6 176.5 171.4 169.8 172.2 170.7
Female 212.1 203.7 196.4 190.4 185.8 178.0 176.0 173.9 176.3 176.2
Age
<18 36.8 35.8 41.6 36.6 30.0 31.5 29.9 33.0 26.0 33.1
0-4 85.4 94.8 100.7 77.4 60.2 60.1 67.4 65.1 55.7 61.6
5-11 34.8 40.6 49.3 42.7 38.9 34.8 32.4 40.9 28.0 32.4
12-17 24.8 16.9 19.3 20.4 15.7 18.8 12.6 15.4 * 17.0
18-44 75.6 70.6 69.8 63.1 61.2 59.3 57.5 57.0 58.7 61.2
18-24 48.0 43.6 39.2 36.7 37.4 33.1 32.8 32.2 32.0 35.8
25-44 77.8 72.8 72.4 65.2 63.1 61.4 59.4 58.9 60.6 62.9
45-64 151.2 144.8 141.1 135.5 132.4 127.0 122.5 122.0 123.3 123.5
45-54 125.4 117.2 113.6 106.9 105.5 98.1 96.2 94.9 95.5 97.9
55-64 170.5 165.2 160.9 155.7 150.8 146.4 139.9 139.8 141.5 140.1
65+ 315.2 305.8 296.6 287.4 281.3 268.4 262.9 257.4 259.4 253.9
65-74 247.4 242.1 236.7 227.5 221.4 212.3 209.9 206.7 208.1 207.4
75-84 361.0 348.9 335.5 325.8 319.0 303.2 296.8 290.4 295.4 286.0
85+ 514.1 488.0 468.7 457.4 452.4 434.6 423.0 414.8 420.7 404.5
Data Source: Special analyses, USRDS ESRD Database. Period prevalent dialysis patients. ~Estimate shown is imprecise due to small sample size and may be unstable over time. *Values for cells with 10 or fewer patients are suppressed. Abbreviations: CKD, chronic kidney disease; ESRD, end-stage renal disease.

2018 USRDS ANNUAL DATA REPORT | KIDNEY DISEASE IN THE UNITED STATES
728
HP2020 Table 16 CKD-14.2 Reduce the number of deaths in dialysis patients within the first 3 months of initiation of renal replacement therapy: Target 335.0 deaths per 1,000 patient-years at risk
2007 2008 2009 2010 2011 2012 2013 2014 2015 2016
All 372.2 369.4 362.4 362.6 343.2 325.6 321.3 322.0 311.2 291.3
Race
American Indian or Alaska Native 179.0 248.1 174.2 163.5 164.7 228.2 206.1 148.0 134.5 149.5
Asian 246.9 197.0 217.5 217.5 178.8 192.4 187.3 197.7 169.9 173.0
Native Hawaiian or Pacific Islander~ 169.9 160.4 200.0 167.4 183.2 117.7 156.7 139.3 138.4 164.4
Black/African American 257.7 258.8 251.1 247.6 231.2 213.4 222.1 226.4 218.2 203.4
White 438.9 436.0 429.6 431.2 411.5 390.4 379.5 378.2 366.2 340.6
Two or more races 312.6 321.9 219.8 278.7 283.2 253.4 * * * 449.3
Ethnicity
Hispanic/Latino 222.7 214.2 205.6 208.8 207.2 195.1 183.4 177.9 189.7 178.6
Non-Hispanic 391.8 389.9 383.0 384.7 364.1 344.0 343.4 344.5 330.1 308.7
Non-Hispanic Black/African American 256.8 254.6 247.4 246.9 231.1 210.0 221.4 225.9 218.0 202.2
Non-Hispanic White 486.7 488.9 482.1 485.8 465.7 439.4 431.2 430.3 410.5 381.5
Sex
Male 373.2 370.3 366.5 359.8 343.0 321.5 319.5 314.9 309.2 289.7
Female 370.8 368.2 357.1 366.4 343.5 331.2 323.8 331.8 313.9 293.5
Age
<18 37.8 42.7 68.7 34.0 29.2 29.7 36.3 19.1 32.6 51.9
0-4 143.8 * 194.7 91.4 * * 94.9 70.7 114.2 112.8
5-11 * * * * * * * * * *
12-17 * 46.5 * * 34.3 * * * * *
18-44 102.9 103.0 108.1 96.2 92.4 73.5 78.7 72.1 81.4 65.7
18-24 70.3 60.1 45.7 64.6 55.6 29.7 51.8 40.8 47.1 15.3
25-44 106.5 107.5 114.4 99.4 96.4 77.9 81.5 75.0 84.6 70.2
45-64 204.3 214.1 209.8 212.7 198.5 189.7 190.5 187.4 182.0 168.9
45-54 157.6 175.8 161.7 166.6 156.8 144.5 142.6 141.2 138.1 123.3
55-64 236.2 239.7 241.4 241.8 225.1 217.6 220.5 215.9 208.7 196.1
65+ 587.9 573.6 561.7 558.0 535.0 512.0 498.0 502.8 479.7 448.0
65-74 422.1 423.5 416.8 408.9 389.1 378.7 371.7 376.9 355.1 330.2
75-84 680.8 640.5 637.1 649.0 616.4 591.4 572.4 591.1 565.6 543.8
85+ 999.4 1003.6 940.8 911.8 914.8 867.4 879.1 860.1 861.8 790.1
Data Source: Special analyses, USRDS ESRD Database. Incident dialysis patients, unadjusted. ~Estimate shown is imprecise due to small sample size and may be unstable over time. *Values for cells with 10 or fewer patients are suppressed. Abbreviation: CKD, chronic kidney disease; ESRD, end-stage renal disease.

HEALTHY PEOPLE 2020
729
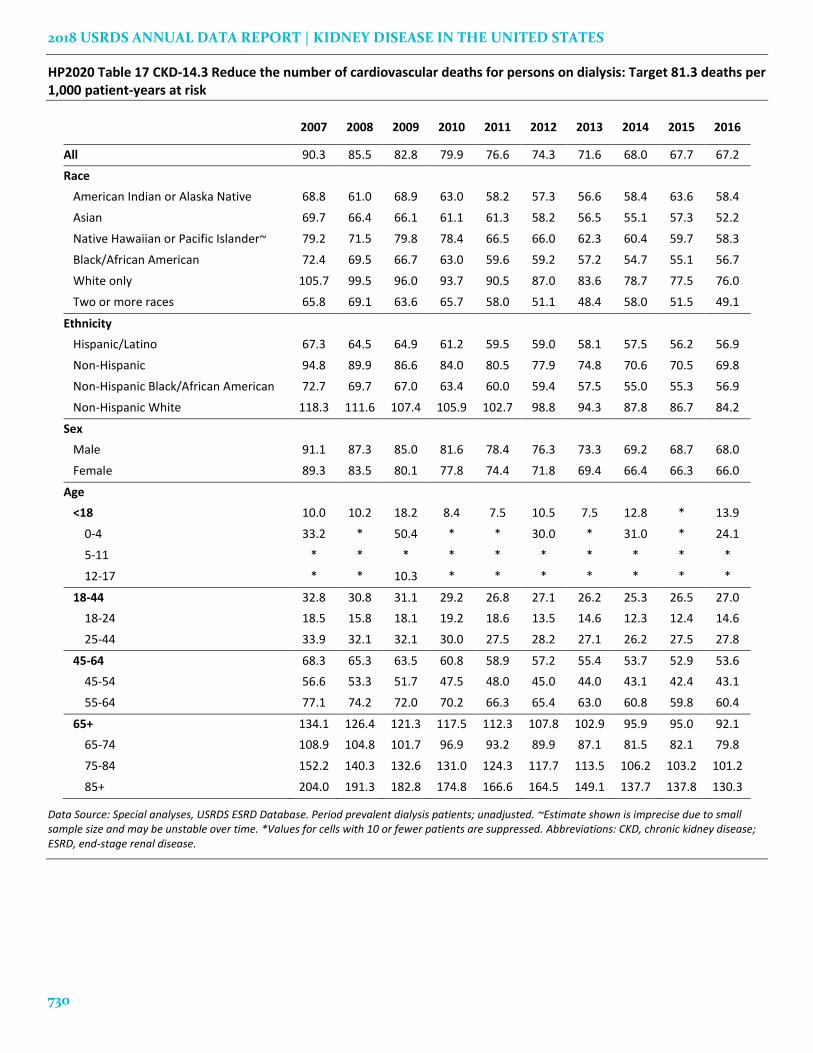
Since 2007, the overall rate of cardiovascular death
among those on dialysis has fallen by over 25%. In
2016, with a rate of 67.2, the HP2020 goal of 81.3
cardiovascular deaths per 1,000 patient-years at risk
was met for the seventh year in a row (see Table 17).
Though both exceeded the target, 2016 rates were
lower among females (66.0 deaths per 1,000) as
compared with males (68.0 deaths). Rates were lowest
among Blacks with 56.7 deaths per 1,000, and Asians,
with 52.2 deaths. Cardiovascular death continued to
be highest among Whites, at 76.0 deaths per 1,000
patient-years. Since 2006, large reductions in rates by
age have been observed. The largest reduction—
approximately 31% fewer deaths—was seen for
patients older than 65 years in 2016, with 92.1 deaths
per 1,000 patient-years, compared to the 2007 rate of
134.1 deaths.
The total death rate for patients with a functioning
transplant has not improved since 2007, and in 2016,
at 33.2 deaths per 1,000 patient-years at risk, still
remained above the HP2020 target of 27.7 (Table 18).
Consistent with previous trends, in 2016 males
experienced higher rates of 34.9 deaths per 1,000
patient-years, as compared with females at 30.5 deaths
per 1,000. Rates were lowest among Asians (21.9 per
1,000) and highest among Whites (34.8 per 1,000), and
American Indians and Alaska Natives (50.2 per 1,000).
Death rates for patients with a functioning transplant
were highest among those aged 65 and older, at 74.7
deaths per 1,000 patient-years compared with those
aged 45-64, at 23.9, and those aged 18-44, at 6.6
deaths.
2018 USRDS ANNUAL DATA REPORT | KIDNEY DISEASE IN THE UNITED STATES
730
HP2020 Table 17 CKD-14.3 Reduce the number of cardiovascular deaths for persons on dialysis: Target 81.3 deaths per 1,000 patient-years at risk
2007 2008 2009 2010 2011 2012 2013 2014 2015 2016
All 90.3 85.5 82.8 79.9 76.6 74.3 71.6 68.0 67.7 67.2
Race
American Indian or Alaska Native 68.8 61.0 68.9 63.0 58.2 57.3 56.6 58.4 63.6 58.4
Asian 69.7 66.4 66.1 61.1 61.3 58.2 56.5 55.1 57.3 52.2
Native Hawaiian or Pacific Islander~ 79.2 71.5 79.8 78.4 66.5 66.0 62.3 60.4 59.7 58.3
Black/African American 72.4 69.5 66.7 63.0 59.6 59.2 57.2 54.7 55.1 56.7
White only 105.7 99.5 96.0 93.7 90.5 87.0 83.6 78.7 77.5 76.0
Two or more races 65.8 69.1 63.6 65.7 58.0 51.1 48.4 58.0 51.5 49.1
Ethnicity
Hispanic/Latino 67.3 64.5 64.9 61.2 59.5 59.0 58.1 57.5 56.2 56.9
Non-Hispanic 94.8 89.9 86.6 84.0 80.5 77.9 74.8 70.6 70.5 69.8
Non-Hispanic Black/African American 72.7 69.7 67.0 63.4 60.0 59.4 57.5 55.0 55.3 56.9
Non-Hispanic White 118.3 111.6 107.4 105.9 102.7 98.8 94.3 87.8 86.7 84.2
Sex
Male 91.1 87.3 85.0 81.6 78.4 76.3 73.3 69.2 68.7 68.0
Female 89.3 83.5 80.1 77.8 74.4 71.8 69.4 66.4 66.3 66.0
Age
<18 10.0 10.2 18.2 8.4 7.5 10.5 7.5 12.8 * 13.9
0-4 33.2 * 50.4 * * 30.0 * 31.0 * 24.1
5-11 * * * * * * * * * *
12-17 * * 10.3 * * * * * * *
18-44 32.8 30.8 31.1 29.2 26.8 27.1 26.2 25.3 26.5 27.0
18-24 18.5 15.8 18.1 19.2 18.6 13.5 14.6 12.3 12.4 14.6
25-44 33.9 32.1 32.1 30.0 27.5 28.2 27.1 26.2 27.5 27.8
45-64 68.3 65.3 63.5 60.8 58.9 57.2 55.4 53.7 52.9 53.6
45-54 56.6 53.3 51.7 47.5 48.0 45.0 44.0 43.1 42.4 43.1
55-64 77.1 74.2 72.0 70.2 66.3 65.4 63.0 60.8 59.8 60.4
65+ 134.1 126.4 121.3 117.5 112.3 107.8 102.9 95.9 95.0 92.1
65-74 108.9 104.8 101.7 96.9 93.2 89.9 87.1 81.5 82.1 79.8
75-84 152.2 140.3 132.6 131.0 124.3 117.7 113.5 106.2 103.2 101.2
85+ 204.0 191.3 182.8 174.8 166.6 164.5 149.1 137.7 137.8 130.3
Data Source: Special analyses, USRDS ESRD Database. Period prevalent dialysis patients; unadjusted. ~Estimate shown is imprecise due to small sample size and may be unstable over time. *Values for cells with 10 or fewer patients are suppressed. Abbreviations: CKD, chronic kidney disease; ESRD, end-stage renal disease.

HEALTHY PEOPLE 2020
731
HP2020 Table 18 CKD-14.4 Reduce the total number of deaths for persons with a functioning kidney transplant: Target 27.8 deaths per 1,000 patient-years at risk
2007 2008 2009 2010 2011 2012 2013 2014 2015 2016
All 30.8 29.6 30.9 30.7 30.9 31.3 31.1 32.1 32.7 33.2
Race
American Indian or Alaska Native 37.1 37.4 54.1 46.0 44.0 43.1 35.1 34.3 33.3 50.2
Asian 23.6 18.6 16.9 17.4 21.7 22.4 19.0 21.7 23.7 21.9
Native Hawaiian or Pacific Islander~ 16.5 15.7 26.9 17.4 17.7 21.2 26.5 23.9 23.2 28.7
Black/African American 29.9 30.9 30.0 30.0 30.2 30.2 30.3 30.3 30.3 30.4
White 31.9 30.1 32.0 31.9 31.8 32.3 32.2 33.6 34.2 34.8
Two or more races 15.8 22.0 21.8 21.8 23.7 25.8 29.9 24.6 28.9 24.8
Ethnicity
Hispanic/Latino 21.4 22.0 22.4 22.6 22.3 22.3 23.8 22.6 23.4 24.7
Non-Hispanic 29.7 28.6 29.9 30.6 31.3 32.3 32.4 33.8 34.6 35.2
Non-Hispanic Black/African American 27.9 28.6 27.6 29.3 30.1 30.0 30.1 30.6 30.5 30.7
Non-Hispanic White 30.9 29.4 31.4 32.0 32.5 33.9 34.3 36.3 37.1 38.0
Sex
Male 32.7 31.2 32.4 32.8 32.9 33.3 32.8 34.2 34.8 34.9
Female 28.2 27.1 28.6 27.6 28.0 28.2 28.7 29.0 29.5 30.5
Age
<18 * 3.0 3.5 6.4 3.0 2.7 * 2.6 4.3 3.8
0-4
* * * * * * * * * *
5-11 * * * * * * * * * *
12-17 * * * 6.2 * * * * * *
18-44 10.4 9.5 9.8 8.9 8.0 7.7 7.4 7.5 6.8 6.6
18-24 5.6 5.8 6.3 6.2 4.2 4.5 4.7 3.6 5.4 4.0
25-44 10.9 9.9 10.2 9.2 8.5 8.1 7.7 8.0 7.0 6.9
45-64 29.7 28.2 27.9 27.0 27.5 25.5 25.1 24.6 24.8 23.9
45-54 21.8 21.3 21.4 18.9 18.6 16.6 16.6 15.9 16.5 15.4
55-64 38.1 35.1 34.2 34.5 35.5 33.3 32.4 31.9 31.6 30.8
65+ 78.8 72.3 75.4 73.9 71.8 75.0 71.8 73.7 73.0 74.7
65-74 70.1 62.7 65.3 64.3 61.2 63.0 59.7 62.2 59.4 60.7
75-84 119.8 116.4 119.0 111.7 112.1 117.6 115.1 111.2 117.6 120.3
85+ 212.8 134.6 149.6 163.4 157.5 194.3 166.1 186.2 184.9 176.2
Data Source: Special analyses, USRDS ESRD Database. Period prevalent transplant patients, unadjusted. ~Estimate shown is imprecise due to small sample size and may be unstable over time. *Values for cells with 10 or fewer patients are suppressed. Abbreviation: CKD, chronic kidney disease; ESRD, end-stage renal disease.

2018 USRDS ANNUAL DATA REPORT | KIDNEY DISEASE IN THE UNITED STATES
732
In 2016, for the ninth consecutive year, the HP2020
target of 4.5 cardiovascular deaths per 1,000 patient-
years was met among transplant recipients. The rate
of cardiovascular mortality among transplant
recipients has fallen by 48.0% since 2007, to the
observed 2.6 deaths per 1,000 patient-years in 2016
(see Table 19). Rates were lowest among Hispanics or
Latinos at 1.8 per 1,000 patient-years. Blacks and
Whites had higher rates, at 3.2 and 2.6 deaths per
1,000 patient-years. Also consistent with prior trends,
rates were lower among females at 2.2 deaths per 1,000
patient-years, compared with males at 2.9 per 1,000
patient-years, although both remained below the
HP2020 target.
HP2020 Table 19 CKD-14.5 Reduce the number of cardiovascular deaths in persons with a functioning kidney transplant: Target 4.5 deaths per 1,000 patient-years at risk
2007 2008 2009 2010 2011 2012 2013 2014 2015 2016
All 5.0 4.0 4.1 4.2 3.4 3.3 3.0 2.8 3.0 2.6
Race
American Indian or Alaska Native * * * * * * 6.3 * * *
Asian 4.0 1.8 * 1.9 2.0 2.5 1.3 1.5 2.4 1.3
Native Hawaiian or Pacific Islander~ * * * * * * * * * *
Black/African American 5.4 4.9 4.9 4.9 4.1 4.0 3.4 3.1 2.9 3.2
White 5.0 3.9 4.0 4.2 3.4 3.3 2.9 2.8 3.0 2.6
Two or more races * * 3.7 * * * * * * *
Ethnicity
Hispanic/Latino 3.2 3.3 3.2 2.7 2.9 2.1 2.3 1.9 2.0 1.8
Non-Hispanic 5.1 4.1 4.2 4.5 3.5 3.7 3.2 3.0 3.3 2.9
Non-Hispanic Black/African American 5.2 4.8 4.8 4.8 4.0 4.0 3.4 3.3 3.1 3.3
Non-Hispanic White 5.2 4.1 4.2 4.6 3.5 3.6 3.2 3.0 3.4 2.9
Sex
Male 5.7 4.5 4.1 4.7 3.8 3.4 3.3 3.1 3.1 2.9
Female 4.1 3.3 4.0 3.5 2.8 3.2 2.5 2.3 2.7 2.2
Age
<18 * * * * * * * * * *
0-4 * * * * * * * * * *
5-11 * * * * * * * * * *
12-17 * * * * * * * * * *
18-44 1.9 1.7 1.3 1.3 1.0 1.1 1.2 0.9 0.6 0.6
18-24 * * * * * * * * * *
25-44 2.0 1.8 1.4 1.4 1.0 1.2 1.3 1.0 0.6 0.7
45-64 5.1 4.1 3.8 4.0 3.3 2.9 2.6 2.3 2.6 2.2
45-54 4.3 3.2 3.1 2.8 2.1 1.9 1.9 1.4 2.0 1.7
55-64 5.9 5.1 4.5 5.1 4.4 3.7 3.3 3.1 3.0 2.6
65+ 11.6 8.4 9.4 9.1 7.1 7.3 5.8 5.7 5.9 5.3
65-74 10.2 7.7 8.1 8.6 6.7 6.2 5.1 4.9 5.2 4.7
75-84 18.0 11.6 15.4 10.8 8.6 11.6 8.5 8.9 7.7 7.0
85+ * * * * * * * * 19.2 *
Data Source: Special analyses, USRDS ESRD Database. Period prevalent transplant patients, unadjusted. ~Estimate shown is imprecise due to small sample size and may be unstable over time. *Values for cells with 10 or fewer patients are suppressed. Abbreviation: CKD, chronic kidney disease; ESRD, end-stage renal disease.

HEALTHY PEOPLE 2020
733
Methods
The findings presented in this chapter were drawn
from multiple data sources, including the Centers for
Medicare & Medicaid Services (CMS), the Organ
Procurement and Transplantation Network (OPTN),
the Centers for Disease Control and Prevention
(CDC), the Consolidated Renal Operations in a Web-
Enabled Network (CROWNWeb) and the United
States Census.
This section describes the analytical methods used
to generate the study cohorts, figures, and tables in
this chapter. Downloadable Microsoft Excel and
PowerPoint files containing the data and graphics for
these figures and tables are available on the
https://www.usrds.org/2018/view/Default.aspx.
In most cases, HP2020 targets are based on
percentage changes from an index value or year, e.g. a
10% reduction in the number of new cases of ESRD
per million population from the 2007 value (CKD-8).
These targets are updated annually to reflect any
changes in the index values that may have resulted
from recent data, change in the reference population
year for adjusted analyses, and improved
methodology.
All comparisons within this chapter are presented
without statistical testing for differences, as many of
these comparisons involve complete census counts
instead of statistical samples.
OBJECTIVE CKD-3: INCREASE THE PROPORTION OF
HOSPITAL PATIENTS WHO INCURRED ACUTE KIDNEY INJURY
WHO HAVE FOLLOW-UP RENAL EVALUATION IN 6 MONTHS
POST-DISCHARGE
Data for this objective include all patients in the
Medicare 5% sample who are aged 65 and older and
who have hospitalized acute kidney injury (AKI)
events in the given year (2007-2016). Hospitalized AKI
is defined by the presence of ICD-9-CM diagnosis
code 584 or by the presence of ICD-10-CM diagnosis
code N17 in any field of the inpatient claims, and renal
evaluation is identified by a urine albumin test.
Patients are followed from the discharge date to the
earliest date of death, ESRD, end of Medicare
coverage, or six months after the discharge date. CPT
codes for urinary albumin measurement are identified
from HEDIS 2008 specifications (HEDIS 2008, an
NCQA program, is used to monitor the performance
of managed health care plans), and include 82042,
82043, 82044, and 84156.
OBJECTIVE CKD-4.1: INCREASE THE PROPORTION OF
PERSONS WITH CHRONIC KIDNEY DISEASE WHO RECEIVE
MEDICAL EVALUATION WITH SERUM CREATININE, LIPIDS, AND URINE ALBUMIN
The cohort here is similar to that used for
Objective D-12, but includes all CKD patients. Testing
is tracked during each year. Patients are excluded if
they are enrolled in a managed care program (HMO),
acquire Medicare as secondary payer, are diagnosed
with ESRD during the year, have a missing date of
birth, or do not live in the 50 states, the District of
Columbia, Puerto Rico, or the U.S. territories. Racial
and ethnic categories are mutually exclusive. Methods
of defining CKD are described in the CKD Analytical
Methods chapter of Volume 1: Chronic Kidney Disease
(CKD) in the United States. Serum creatinine is
identified through CPT codes 80047–80050, 80053–
80054, 80069, and 82565, while lipid testing is
identified through CPT codes 80061, 82465, 82470,
83695, 83705, 83715–83721, 84478, 83700, 83701, and
83704. CPT codes for urinary albumin measurement
are the same as those used for Objective CKD-3 above.
OBJECTIVE CKD-4.2: INCREASE THE PROPORTION OF
PERSONS WITH TYPE 1 OR TYPE 2 DIABETES AND CHRONIC
KIDNEY DISEASE WHO RECEIVE MEDICAL EVALUATION WITH
SERUM CREATININE, URINE ALBUMIN, HbA1c, LIPIDS, AND
EYE EXAMINATIONS
Methods and codes used to determine rates of
HbA1c testing and eye examinations are taken from
HEDIS 2008 specifications. CPT codes 83036 and
83037 are used to identify HbA1c testing. Codes used
to identify diabetic eye examinations are as follows:
CPT codes, 92002, 92004, 92012, 92014, 92018, 92019,
92225, 92226, 92230, 92235, 92240, 92250, 92260, 67101,
67105, 67107, 67108, 67110, 67112, 67141, 67145, 67208,
67210, 67218, 67227, 67228, 67028, 67030, 67031, 67036,
67038, 67039, 67041, 67042, 67043, 67113, 67121, 67221,
67228, S0625, S0620, S0621, and S3000; ICD-9-CM
procedure codes, 14.1–14.5, 14.9, 95.02, 95.03, 95.04,
95.11, 95.12, and 95.16; and ICD-9-CM diagnosis code
V72.0. The cohort is similar to that used for Objective

2018 USRDS ANNUAL DATA REPORT | KIDNEY DISEASE IN THE UNITED STATES
734
CKD-4.1, but includes all diabetic CKD patients.
Methods of defining DM are described in the CKD
Analytical Methods chapter of Volume 1: Chronic
Kidney Disease (CKD) in the United States.
OBJECTIVE CKD-5: INCREASE THE PROPORTION OF
PERSONS WITH DIABETES AND CHRONIC KIDNEY DISEASE
WHO RECEIVE RECOMMENDED MEDICAL TREATMENT WITH
ANGIOTENSIN-CONVERTING ENZYME (ACE) INHIBITORS OR
ANGIOTENSIN II RECEPTOR BLOCKERS (ARBS )
The cohort includes general Medicare patients
diagnosed with both diabetes and chronic kidney disease
(CKD) in each year, continuously enrolled in the
Medicare inpatient/outpatient and physician/supplier
program during the entire year, age 65 or older at the
beginning of the year, and enrolled in Medicare Part D
during the entire year. Use of angiotensin-converting
enzyme inhibitors (ACEIs) or angiotensin II receptor
blockers (ARBs) is defined by at least one prescription fill
from either drug class during the year.
OBJECTIVE CKD-8: REDUCE THE RATE OF NEW CASES OF
END-STAGE RENAL DISEASE
Incident rates are calculated using the methods
described for Chapter 1 of Volume 2: End-stage Renal
Disease (ESRD) in the United States. Overall rates are
adjusted by age, sex, and race; rates by age are
adjusted for sex and race; rates by sex are adjusted for
age and race; and rates by race and ethnicity are
adjusted by age and sex.
OBJECTIVE CKD-9.1: REDUCE KIDNEY FAILURE DUE TO
DIABETES
Rates of kidney failure due to DM are also
calculated using the methods described for Chapter 1
of Volume 2: End-stage Renal Disease (ESRD) in the
United States, and adjustments are the same as those
described for Objective CKD-8, above.
OBJECTIVE CKD-9.2: REDUCE KIDNEY FAILURE DUE TO
DIABETES AMONG PERSONS WITH DIABETES
This table uses data from the National Health
Interview Survey; all ages are included. Three-year
data are used to estimate the prevalence of DM in the
middle year, and the size of the population with DM is
based on U.S. Census data. The incident rate per
million of ESRD caused by DM is calculated as the
number of incident ESRD patients with a primary
cause of ESRD of DM, divided by the size of the
population with DM in that group.
OBJECTIVES CKD-10: INCREASE THE PROPORTION OF
CHRONIC KIDNEY DISEASE PATIENTS RECEIVING CARE FROM
A NEPHROLOGIST AT LEAST 12 MONTHS BEFORE THE START
OF RENAL REPLACEMENT THERAPY & CKD-11.3: INCREASE
THE PROPORTION OF ADULT HEMODIALYSIS PATIENTS WHO
USE ARTERIOVENOUS FISTULAS OR HAVE A MATURING
FISTULA AS THE PRIMARY MODE OF VASCULAR ACCESS AT
THE START OF RENAL REPLACEMENT THERAPY
These tables and figure use data from the newest
version of the Center for Medicare and Medicaid
Services (CMS) Medical Evidence form (CMS 2728).
The cohorts include incident HD patients, with CKD-
11.3 limited to those aged 18 and older at initiation who
have a known vascular access at that time. CKD-10
includes only patients for whom it is known whether
they saw a nephrologist prior to initiation.
OBJECTIVES CKD-11.1: INCREASE THE PROPORTION OF
ADULT HEMODIALYSIS PATIENTS WHO USE AN
ARTERIOVENOUS FISTULA AS THE PRIMARY MODE OF
VASCULAR ACCESS & CKD-11.2: DECREASE THE
PROPORTION OF ADULT HEMODIALYSIS PATIENTS WHO USE
CATHETERS AS THE ONLY MODE OF VASCULAR ACCESS
These tables use data from CROWNWeb. The
cohort includes prevalent HD patients from 2012 to
2016, who are aged 18 and older. Access type
represents the last access type used in the year,
according to CROWNWeb data.
OBJECTIVE CKD-12: INCREASE THE PROPORTION OF
DIALYSIS PATIENTS WAIT-LISTED AND/OR RECEIVING A
DECEASED DONOR KIDNEY TRANSPLANT WITHIN 1 YEAR OF
END-STAGE RENAL DISEASE START (AMONG PATIENTS
UNDER 70 YEARS OF AGE)
The cohort includes patients from 2007-2016 who
are younger than 70 at the initiation of ESRD.
Percentages are calculated as the number of patients
placed on the deceased donor organ waiting list or
receiving a deceased donor transplant within one year
of initiation, divided by the number of patients
without a living donor available (i.e., patients
receiving a living donor transplant are excluded), and
are estimated using the Kaplan-Meier methodology.

HEALTHY PEOPLE 2020
735
OBJECTIVE CKD-13.1: INCREASE THE PROPORTION OF
PATIENTS RECEIVING A KIDNEY TRANSPLANT WITHIN 3
YEARS OF END-STAGE RENAL DISEASE
The cohort in Table 14 and Figure 2 includes
patients from 2004–2013 who are younger than 70 at
the initiation of ESRD. Patients are followed from
ESRD certification to transplant, censoring at death or
three years after the initiation of ESRD. Percentages
are calculated using the Kaplan-Meier methodology.
OBJECTIVE CKD-13.2: INCREASE THE PROPORTION OF
PATIENTS WHO RECEIVE A PRE-EMPTIVE TRANSPLANT AT
THE START OF END-STAGE RENAL DISEASE
The cohort includes patients from 2007–2016 who
are younger than 70 at the initiation of ESRD. Pre-
emptive transplants are those in which ESRD
initiation date is the date of transplant. Percentages
are calculated as 100 (N/D), where N=the number of
preemptive transplants in the year and D=the number
of ESRD patients in the year.
OBJECTIVES CKD-14.1: REDUCE THE TOTAL DEATH RATE
FOR PERSONS ON DIALYSIS & CKD-14.3: REDUCE THE
CARDIOVASCULAR DEATH RATE FOR PERSONS ON DIALYSIS
Cohorts for these tables include period prevalent
dialysis patients in each calendar year, 2007–2016,
whose first ESRD service date is at least 90 days prior
to the beginning of the year (point prevalent patients
on January 1) or who reach day 91 of ESRD treatment
during the year (incident patients). We exclude
patients with unknown age or sex and those with an
age calculated to be less than zero, as well as patients
who are not residents of the 50 states, the District of
Columbia, Puerto Rico, or the U.S. territories. Age is
calculated on January 1, and race is defined from the
Medical Evidence form. Cardiovascular mortality is
defined using codes from past and current Death
Notification forms: 01, 02, 03, 04, 1, 2, 3, 4, 23, 25, 26,
27, 28, 29, 30, 31, 32, 36, and 37. Patients are followed
from January 1 (for point prevalent dialysis patients) or
day 91 of ESRD (for incident dialysis patients) until
death, transplant, or December 31 of the year. Rates
are estimated as the number of patients who die from
any cause (Objective 14.1) and who die from
cardiovascular disease (Objective 14.3) in each year,
per 1,000 patient-years at risk.
OBJECTIVE CKD-14.2: REDUCE THE DEATH RATE IN
DIALYSIS PATIENTS WITHIN THE FIRST 3 MONTHS OF
INITIATION OF RENAL REPLACEMENT THERAPY
Cohorts here include incident dialysis patients in
each calendar year, 2007–2016. In addition to applying
the same exclusion criteria described for Objectives
14.1 and 14.3, we further exclude patients with
recovered kidney function. Age is calculated on the
first ESRD service date. Patients are followed from the
first service date until death, transplant, or 90 days
after ESRD. Rates are estimated as the number of
patients who die from any cause per 1,000 patient-
years at risk.
OBJECTIVES CKD-14.4: REDUCE THE TOTAL DEATH RATE
FOR PERSONS WITH A FUNCTIONING KIDNEY TRANSPLANT &
CKD-14.5: REDUCE THE CARDIOVASCULAR DEATH RATE IN
PERSONS WITH A FUNCTIONING TRANSPLANT
Patient cohorts here include period prevalent
transplant patients, 2007–2016, whose first ESRD
service date is at least 90 days prior to the beginning
of the year (point prevalent patients on January 1) or
who reach day 91 of ESRD treatment (incident
patients). Exclusion criteria are the same as those
described for Objectives 14.1 and 14.3. Patients are
followed from January 1 (for point prevalent dialysis
patients) or day 91 of ESRD (for incident dialysis
patients) until death or December 31 of the year. Rates
are estimated as the number of patients who die from
any cause (Objective 14.4) and who die from
cardiovascular disease (Objective 14.5) in each year,
per 1,000 patient-years at risk.

2018 USRDS ANNUAL DATA REPORT | KIDNEY DISEASE IN THE UNITED STATES
736
References
Centers for Disease Control and Prevention (CDC).
Native Americans with Diabetes
https://www.cdc.gov/vitalsigns/aian-
diabetes/index.html. Accessed 10/13/17.
Centers for Medicare & Medicaid Services. 2007
Annual Report, End Stage Renal Disease Clinical
Performance Measures Project. Department of
Health and Human Services, Centers for Medicare
& Medicaid Services, Office of Clinical Standards &
Quality, Baltimore, Maryland, December 2007.
Healthy People 2020 (HP2020). About Healthy People.
https://www.healthypeople.gov/2020/About-
Healthy-People. Accessed 1/18/19.
Healthy People 2020 (HP2020). Chronic Kidney Disease.
https://www.healthypeople.gov/2020/topics-
objectives/topic/chronic-kidney-disease. Accessed
10/8/17.
U.S. Renal Data System. USRDS 2013 Annual Data
Report: Atlas of Chronic Kidney Disease and End-
Stage Renal Disease in the United States. National
Institutes of Health, National Institute of Diabetes
and Digestive and Kidney Diseases, Bethesda, MD,
2013.