Healthy City Presentation
70
A Resource for all of California Information + action for social change
-
Upload
healthy-city -
Category
Business
-
view
255 -
download
1
Transcript of Healthy City Presentation

A Resource for all of California
Information + action for social change

A National civil rights POLICY/ ACTION TANK
Healthy City is a project of…

A National civil rights “ACTION TANK”

…is an information + action resource that unites rigorous research, community voices and innovative technologies
to solve the root causes of social inequity
DIRECT TECHNICAL SUPPORT TO:
COMMUNITY ORGSFOUNDATIONSGOVERNMENT
COMMUNITY RESEARCH LAB
Training community groups to lead and sustain action-oriented research &
technology projects
ONLINE MAPPING TECHNOLOGYwww.HealthyCity.org

PartnersChildren’s Hospital Los AngelesAdvancement ProjectUSC School of Social Work 2-1-1 LA CountyUnited Ways of CaliforniaChildren NowCalifornia Pan-Ethnic Health NetworkElla Baker Center for Human RightsPrevention InstituteThe California EndowmentLegal Services of No. Cal.California Rural Legal AssistanceSacramento Housing AllianceUC Davis – Center for Regional ChangeCommunity Services Planning CouncilUnited Way Bay AreaSanta Clara Comm. Benefits CoalitionUrban Strategies CouncilSan Mateo Healthy Communities CollaborativeOakland Progressive Empowerment Network
Contra Costa Crisis CenterUnited Way of Fresno/2-1-12-1-1 San Diego2-1-1 Monterey County2-1-1 San BernardinoVolunteer Center of Riverside CountyUnited Way Bay Area/HelplinkCommunity Service Planning Council – 2-1-1 SacramentoUW Silicon Valley/Santa Clara Eden I & R – 211 AlamedaInterface Children Family Services – 2-1-1 VenturaVolunteer Center of Sonoma County

The HealthyCity.org website

…to fuel social change and improve our communities
HealthyCity.orgWebsite
Service Provider
Case Manager
Policy Advocate
Funder
Community Organizer
Researcher
Who Uses HealthyCity.org?
Grant Writer

• Find services and partners• Map, Chart & Rank community data• Upload data & Share your community’s
story
HealthyCity.org is a statewide resources that enables you to:

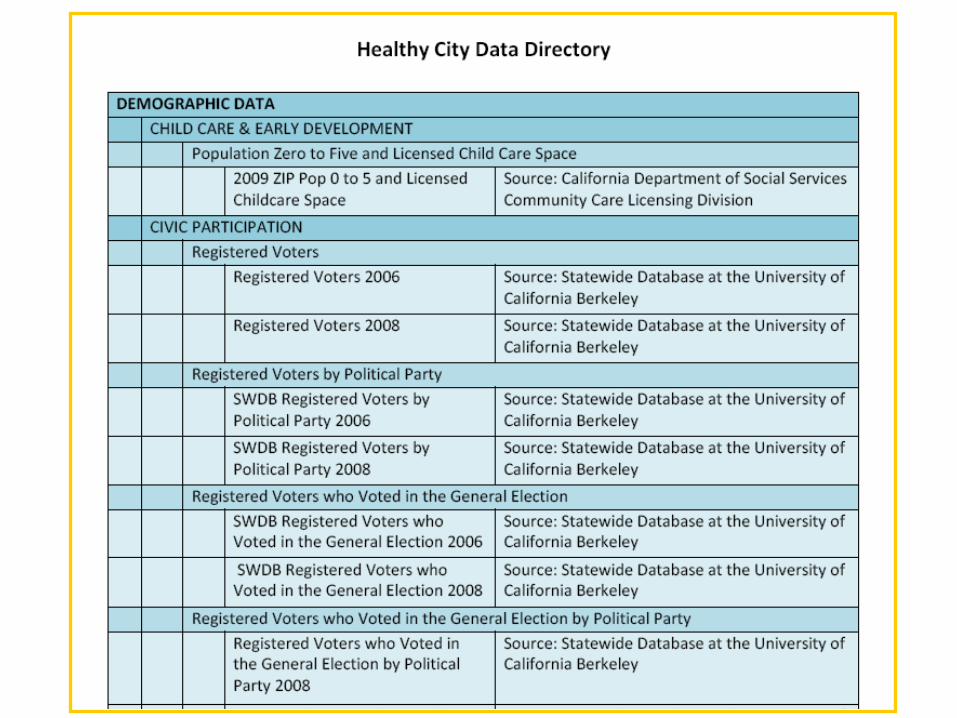
What’s on HealthyCity.org?
Oh, the Data You’ll See!

Types of Maps on HealthyCity.org
Point Thematic

Name SourceSocial Services 211s
Nonprofits IRS 990 Center for Nonprofit Management in Southern California
Schools Public & Private California Department of Edaucation
WIC Agencies & Vendors Network for a Healthy California
Hospitals (OSHPD) OSHPD
Head Start Agencies California Head Start Association
Child Care Department of Social Services Community Care Licensing Division
Alcohol Department of Alcoholic Beverage Control
EPA Environmental Protection Agency
Grocery DeLormeFQHC U.S. Department of Health and Human
Services Health Resources and Services Administration
Banks DeLormeCheck Cashing Businesses DeLorme
Services & Points

Healthy City has 2-1-1 data (health & human services) for the
following counties:
Alameda, Contra Costa, Fresno, Los Angeles, Marin, Monterey, Napa,
Riverside, Sacramento, San Bernardino, San Diego, San Francisco, Santa Clara, Solano, Sonoma, Ventura

Common Search Terms
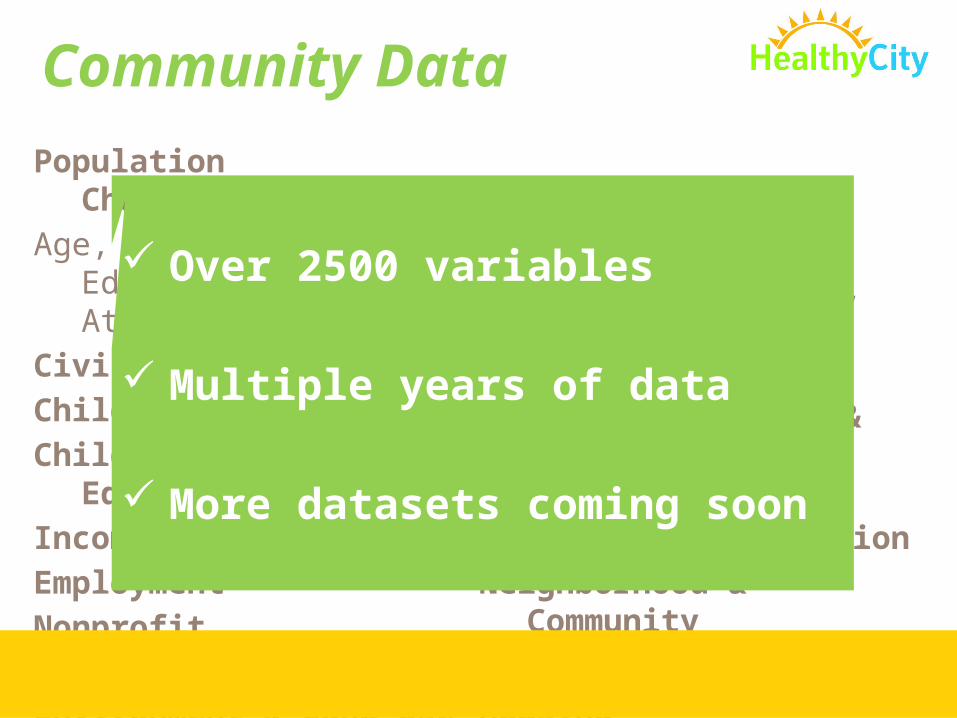
Community Data
Population Characteristics – Age, Ethnicity, Educational
Attainment, etc.Civic ParticipationChild WelfareChild Care & Early EducationIncome & PovertyEmploymentNonprofit InfrastructureEnvironment & Land Use
Health – Birth, Prenatal & Child
Health - Conditions, Disease & Injury
Health – DeathsHealth - Insurance & accessHealth – Physical Activity &
NutritionNeighborhood & CommunityCrime & Public SafetyHousing
Over 2500 variables
Multiple years of data
More datasets coming soon


You can save and share anything you
create while logged in
GET STARTED!
Find a Service:Help a family find services in
their neighborhood

*ZIP code 93710

*Look for Legal Services
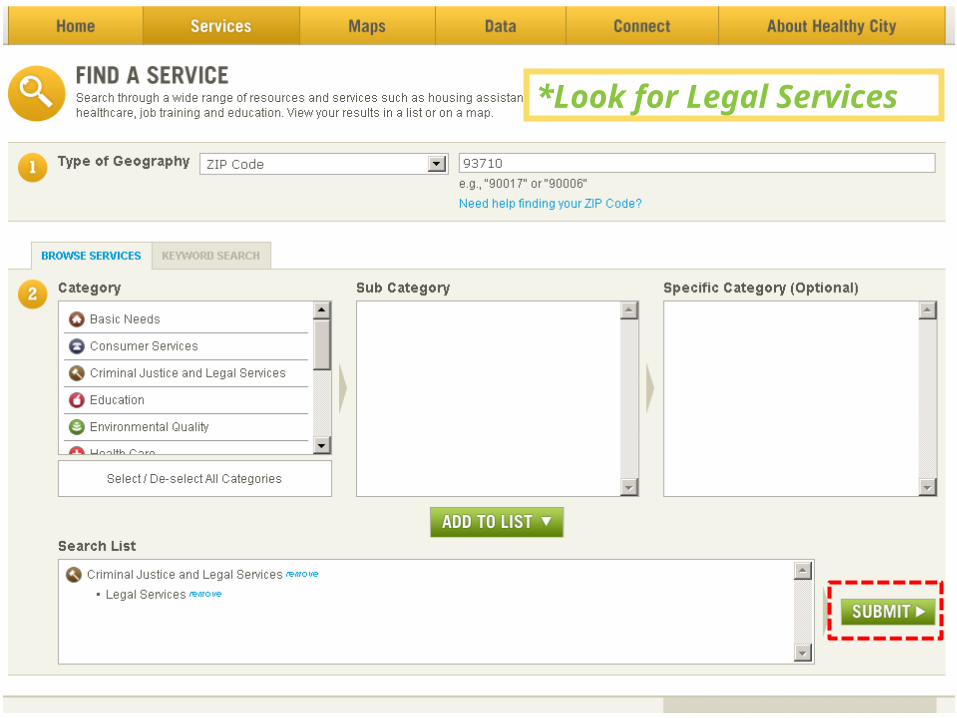
*Look for Legal Services

List the services ONLY within the
area you’ve selected
Browse through listings to look
at service details
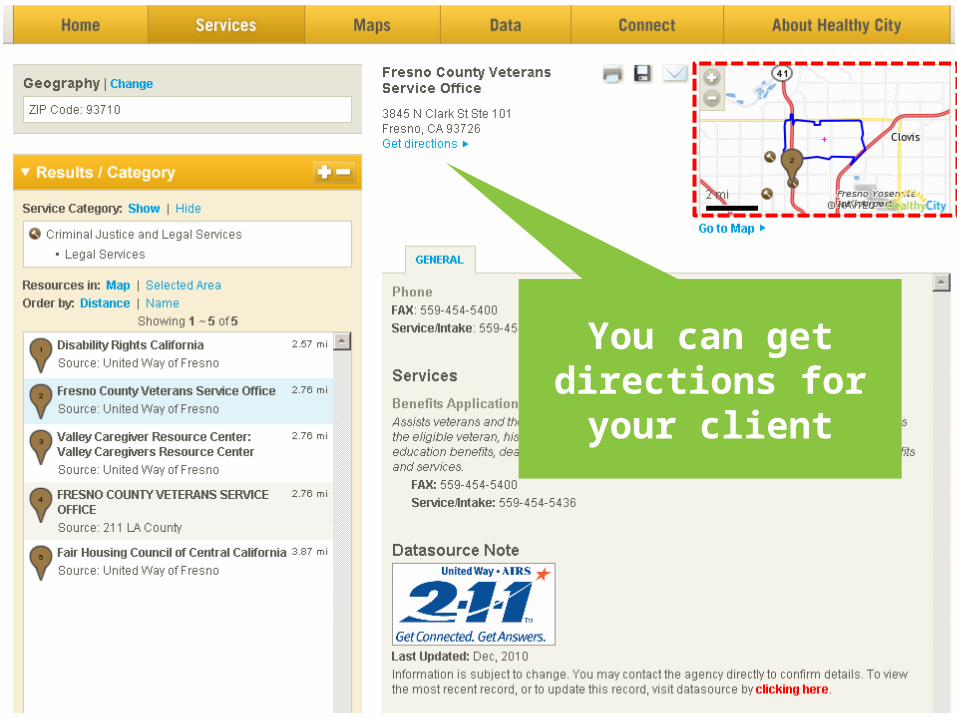
You can get directions for
your client

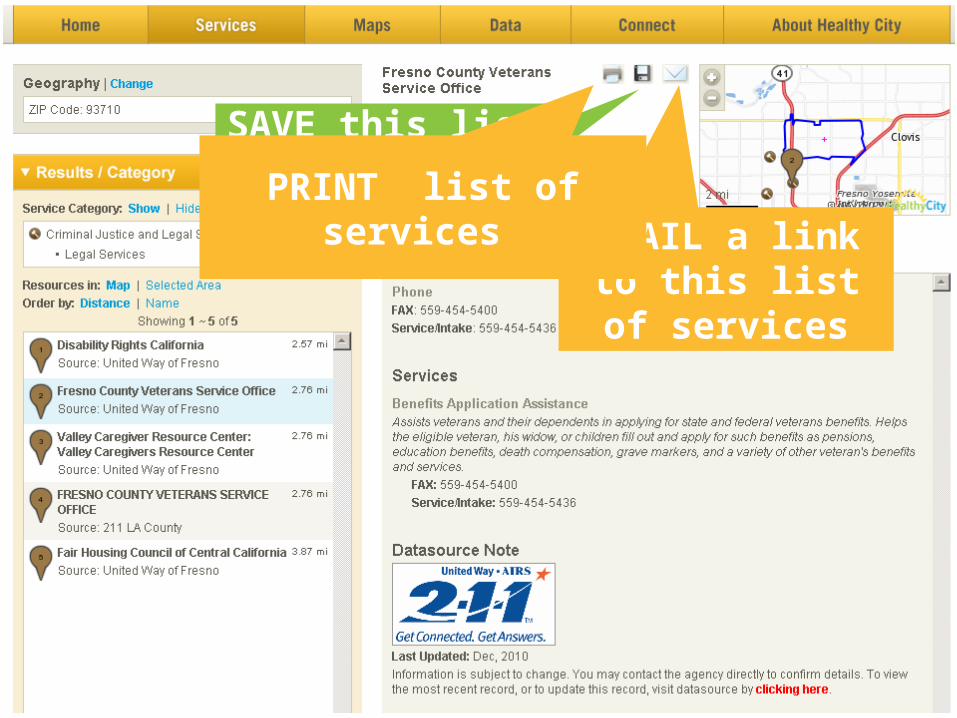
SAVE this list for future reference
EMAIL a link to this list of services
PRINT list of services

Extensive CDE school data


Resource Guides Available:
Click on • Service Categories


Finding a Service
Questions?

You can save and share anything you
create while logged in
GET STARTED!
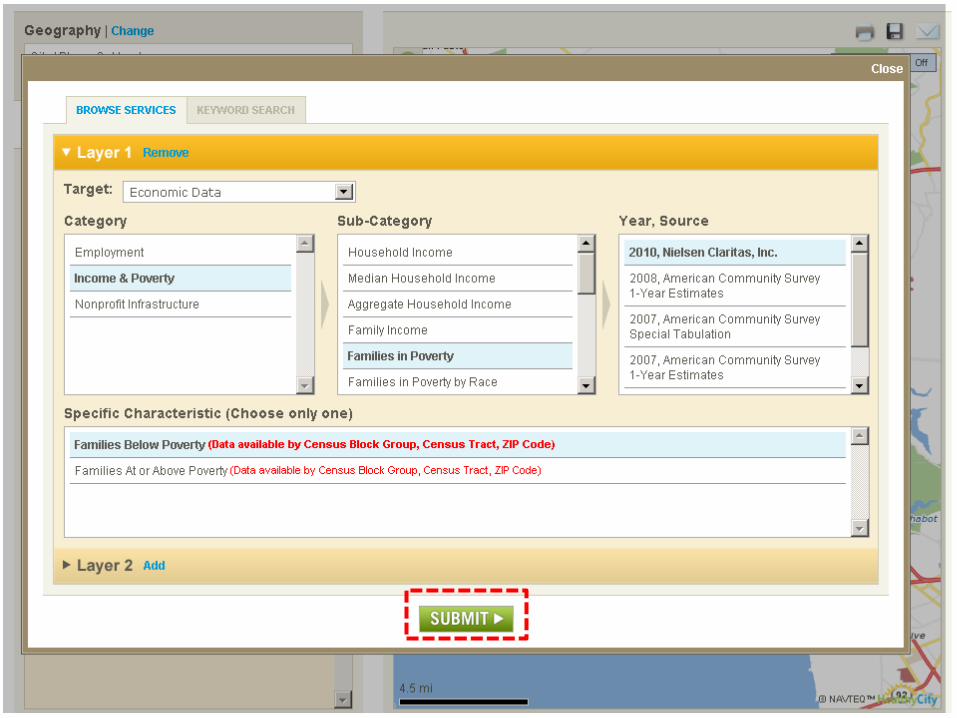
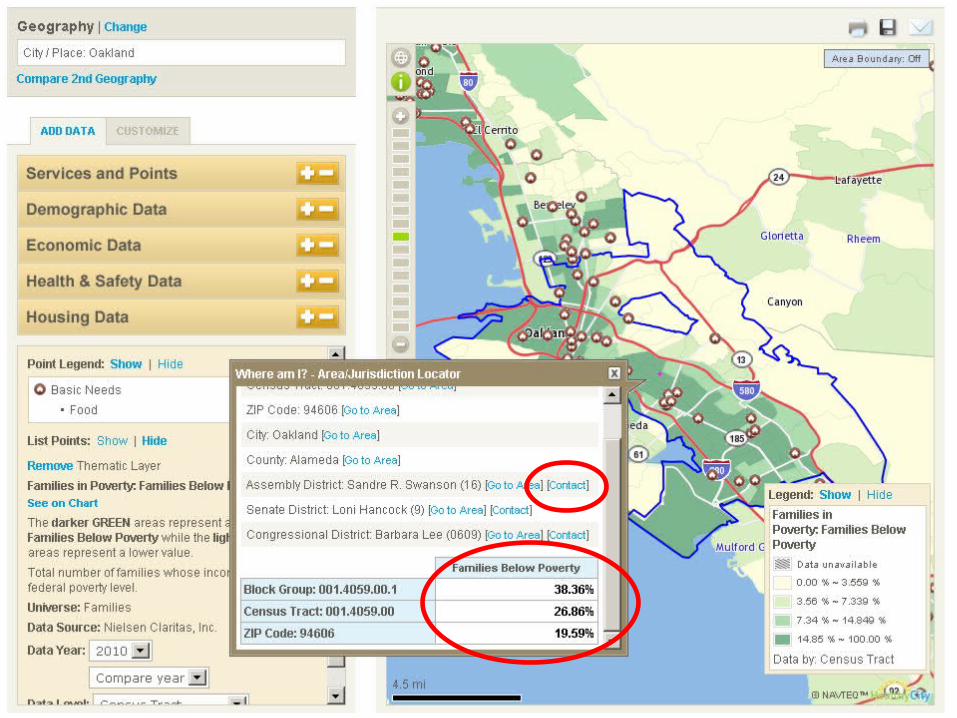
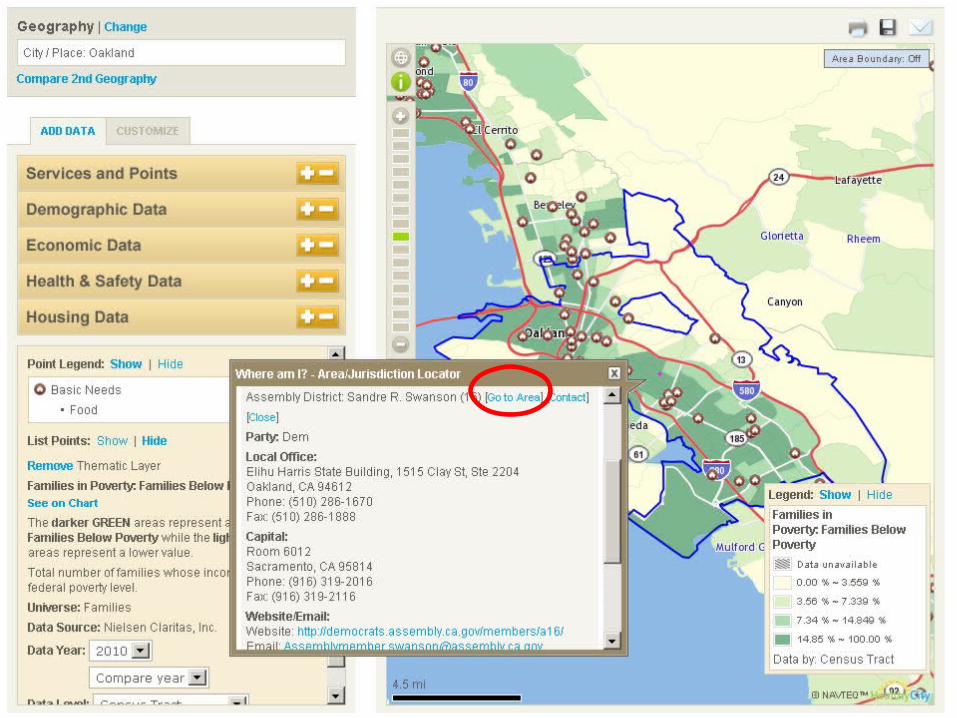
Mapping community data to demonstrate need and advocate for resources

Where are there families in poverty in Oakland?
Are there resources in these highly impoverished areas?

Click the +- buttons to add
Data to your map

Find local support services

Create a list of services to add to
your map
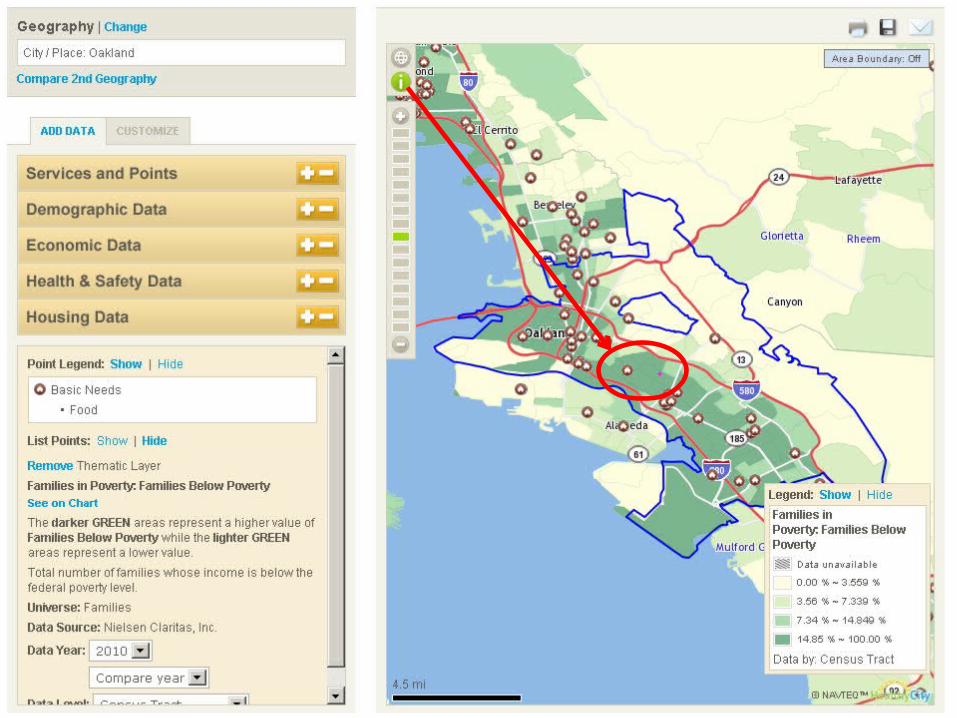


Add boundary labels like ZIP or city
CUSTOMIZE your map:
Change the display of data
Compare your region to another geography
Other Map Room Features

Learn about our data sources


Mapping community data to demonstrate the need
and advocate for resources
Questions?

Creating charts and tables to better understand a
community or region

In LA County, what is the percentage of Renters v. Owners?
QUICK STATSare provided
for the selected
geography


SCROLL DOWN to
select Housing
Data


Of the Housing Units in L.A. County:
48.52 % are Owner Occupied
51.48% are Renter Occupied
How does this compare to the state
of California?


L.A. County has a higher ratio of renters to
owners than the state of California
View it as a pie chart


Creating charts and tables to better
understand a community or region
Questions?

Learn about advanced features

A few HealthyCity.org Advanced Features
• Save searches, maps & charts
• Upload your own Point & Thematic Datasets
• Draw your own neighborhood boundaries
• Create a live mapping session
• Tell your Story (with Pictures, Video & Audio)
• Search Stories, live maps, and more in the Share & Connect room


Your Saved searches are stored here

Draw your own neighborhood boundaries
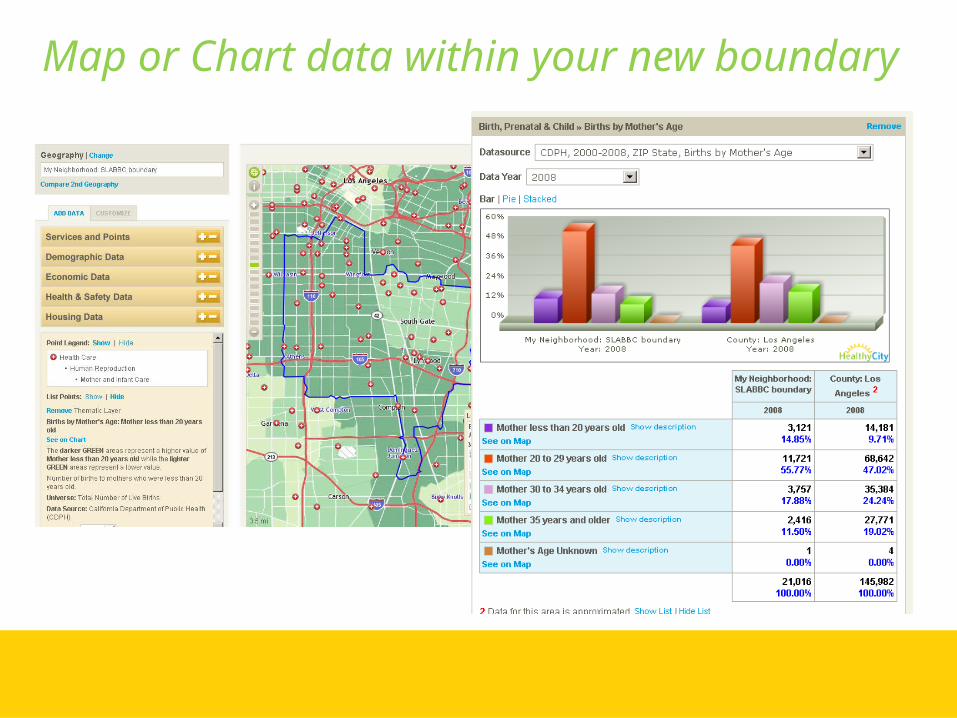
Map or Chart data within your new boundary
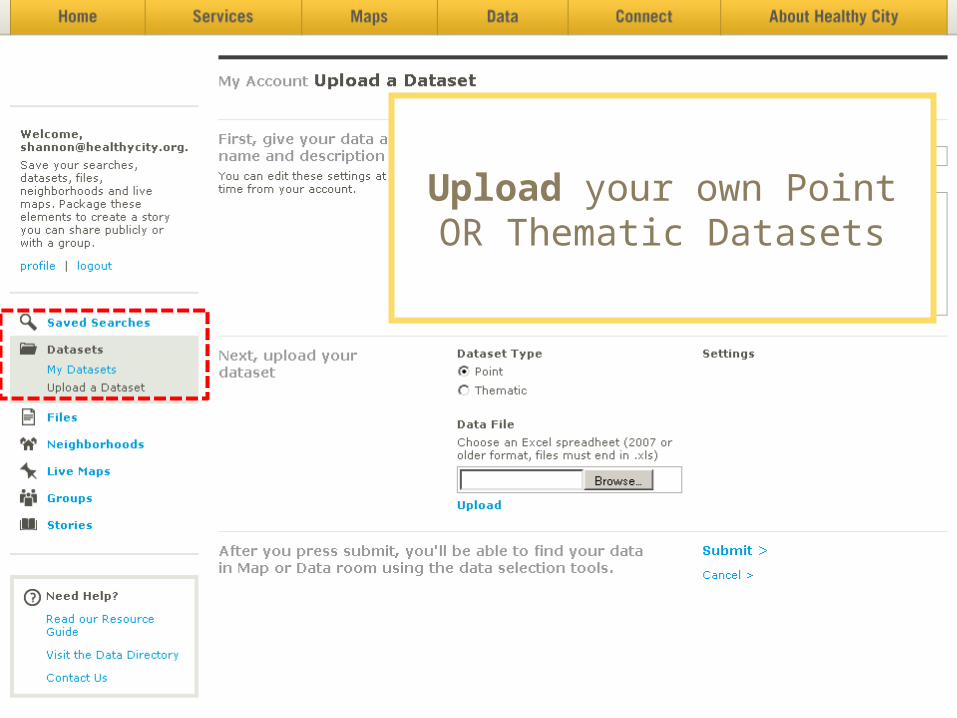
Upload your own Point OR Thematic Datasets

Create an Excel Spreadsheet with up to 1000 points
*Save as Excel 97-2003 workbook*

Upload your own Thematic Datasets
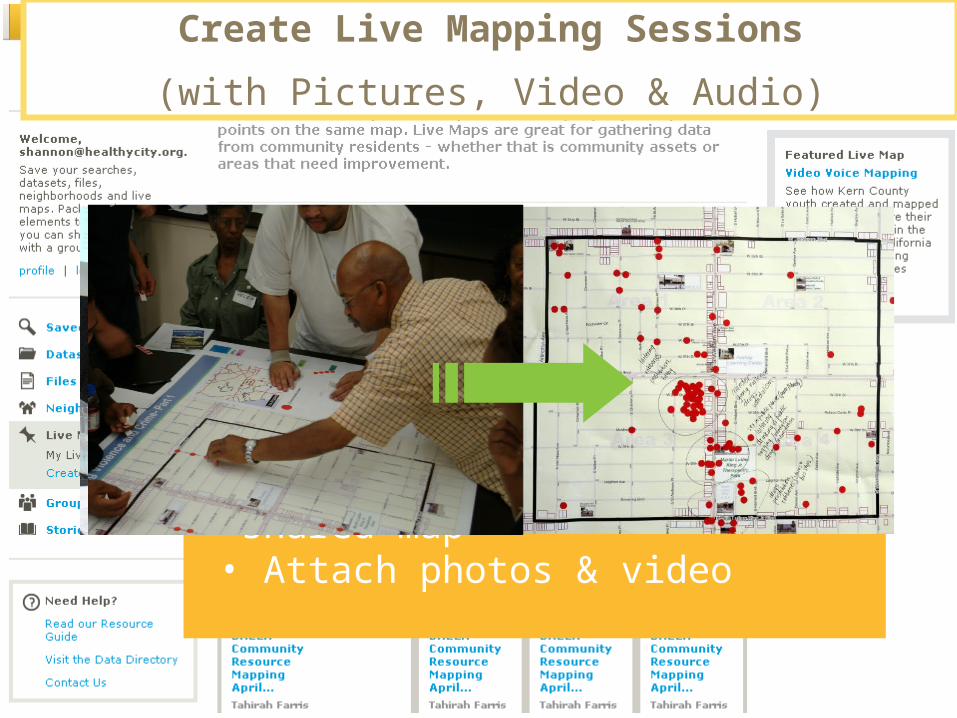
A Live Map enables multiple people to :
• Draw and drop points, lines, and shapes on a shared map
• Attach photos & video
Create Live Mapping Sessions
(with Pictures, Video & Audio)

Create a Story to:Promote your initiative or highlight your work!
Package your saved maps, live mapping sessions, reports, multi-media and more into a “story” that you can share
Create a Story

Share and Search Stories (& more) Statewide


Help is Available:
Click on • Healthy City User
Guideor
• FAQs

Thank You!