
Healthcare Workforce 2025 Part II - imercer healthcare report five... · H E A L T H W E A L T H C...
64
HEALTH WEALTH CAREER Healthcare Workforce 2025 Part II Trends In The Healthcare Workforce Jason Narlock, PhD Matthew Stevenson, PhD Q4 2016
-
Upload
dangnguyet -
Category
Documents
-
view
218 -
download
0
Transcript of Healthcare Workforce 2025 Part II - imercer healthcare report five... · H E A L T H W E A L T H C...

H E A L T H W E A L T H C A R E E R
Healthcare Workforce 2025
Part II
Trends In The Healthcare
Workforce
Jason Narlock, PhD
Matthew Stevenson, PhD
Q4 2016

© MERCER 2016 2
© MERCER 2015 2
Industry Trends

© MERCER 2016 3
—
Technology
—
—
Pressure on Costs and Outcomes
—
—
Value Over Volume
—
—
Consolidation And Expansion
—
Macro Trends In US Healthcare We see seven major themes driving the transformation of work within the healthcare industry.
—
Rise of Retail
—
— Rise of Consumerism
—
Changing Regulatory Environment

© MERCER 2016 4 Source: Bureau of Labor Statistics, 2015
Job Projections for the Fastest Growing Healthcare-Related Segments
Healthcare segment 2014
Employment 2024 Projected GROWTH %
Offices of physicians 2.4M 3.0M 25%
Offices of other health practitioners 784K 1.1M 40%
Private Hospitals 4.8M 5.2M 8%
Home health care services 1.3M 2.0M 54%
Nursing and residential care facilities 3.3M 4.0M 21%
Outpatient care centers 711K 1.1M 55%
Physician assistants 94K 123K 31%
Nurse practitioners 127K 172K 35%
Nursing assistants 1.5M 1.8M 20%
Lack of new talent across the nation Healthcare will account for a third of US job growth, especially in target segments.

© MERCER 2016 5
© MERCER 2015 5
Methodology

Our methodology The Workforce Opportunities and Investment Act (WOIA) requires states to provide regional-level occupational
projections every four years. Using these data, along with historical labor, demographic, and education data, we
assessed the projected demand for and supply of critical healthcare occupations in five states: New York, Florida,
Illinois, Texas, and California.
The most, the fastest. State occupational projections through 2023 or 2024 provide details on which
healthcare jobs are likely to grow the most (i.e., total job openings from growth and replacements) as well as
which jobs are likely to grow the fastest (i.e., percent increase in demand from 2014 to 2023 or 2024). We
focus on those occupations projected to grow both the most and the fastest relative to all other healthcare
occupations—that is, those jobs that fall within the upper right quadrant of each scatterplot.
The right stuff. Education data provided by the Department of Labor provide information on the
educational requirements for each of the fastest growing occupations identified above. We plotted these
requirements alongside projected demand in order to examine the distribution of skillsets needed to fill
high-growth jobs in each state.
Labor risks. We used a two-step process to estimate potential labor shortages for each county in the five
states examined. First, we used demographic information to calculate a ratio of individuals likely to enter
and likely to leave the workforce in the next decade. Next, we added trend data estimating the number of
individuals moving into each county from another state or country, and calculated a composite score
expressed as a standard deviation from the national mean. We mapped these scores, identifying counties
with very high to very low labor shortage risks through 2026.
-2,400
Critical Occupations. Using historical graduation data provided by the National Center for Education
Statistics, as well as demographic data provided by the Census Bureau, we estimated the projected supply
of graduates with the degrees required to fill high-growth jobs in each state. We compared this to the
projected demand and identified ‘critical occupations’ where demand may outpace supply.
Where the workers are(n’t). Using current labor statistics as well as regional projections, we
mapped where workers in critical occupations currently are, and where they need to be by 2023 or 2024.
We used demographic data to control for anticipated population shifts and highlight regions within
states where potential supply shortages may be most acute.

© MERCER 2016 7 © MERCER 2016 7
Workforce of the
future: 2025

Mind the Gaps: Workforce Trends in Healthcare Our analysis of future workforce trends in healthcare across five states reveals five major themes.
Support Needed. By far, the greatest anticipated gaps will be in healthcare support occupations, such as
Home Health Aides, as the US grapples with the confluence of community health, an aging population, and a
tightening labor pool.
Downstream Demand is Growing. Health practitioners, such as Nurse Practitioners, will also experience
‘downstream demand’ as healthcare systems seek to fill anticipated gaps in certain occupations such as General
Practitioners, and contain or manage costs. There are important policy implications here, especially in states
which do not allow for full practice authority.
High Growth in Low-Skill Occupations. Many of the fastest-growing occupations are comparatively
low-skill, which means health systems may need to compete with other industry sectors for available talent—
especially in areas were such labor can be tight. At the same time, the training threshold is low for these
occupations, so there’s opportunity here to build talent with the right incentives. Regardless, providers will
need to address the logistics and risks associated with a lower-skilled workforce.
Where demand for high-skill labor remains strong, providers will need to consider how to best attract and
retain talent in highly-competitive markets.
Every State Has It’s Own Story. Assessments of the healthcare workforce are often described in national
or regional terms. As this report illustrates, such assessments can be misleading. Each state examined faces
different challenges in developing the talent needed to meet future healthcare demands.

Mind the Gaps: Workforce Trends in Healthcare (Cont’d) Our analysis of future workforce trends in healthcare across five states reveals five major themes.
Regulatory change is coming, but some labor trends will not change. Regulatory changes, such
as the repeal of the Affordable Care Act (ACA) or changes to immigration policy are likely to cause major
disruption to the healthcare industry in coming years. These changes are likely to impact the type and quantity
of healthcare workers. However, we believe that broad, long-term changes in demographics, along with state-
level changes to healthcare regulations will continue to drive accelerated demand for healthcare labor in the
future.
Perhaps the biggest question becomes: will there by enough supply to fill potential demand?
Geographies of Demand. Critical occupations—that is, occupations where demand is projected to
outpace supply—not only vary by state but also within states. In other words, questions of supply or demand
should be answered in the context of distribution: which healthcare occupations are needed in the future and
where? And where are these healthcare workers likely to be located?

© MERCER 2016 10
CLINICAL EDUCATION SUPPLY
TECHNOLOGY, JOBS AND SKILLS
ROLE SHIFTS: TOP OF LICENSE
SHORTAGE OF SKILLED IT PROFESSIONALS
PHYSICIAN DISSATISFACTION
SHORTAGE OF CLINICAL STAFF
LACK OF NEW TALENT
IMPENDING TURNOVER
Key Trends in the Future of Healthcare The five major themes in the healthcare workforce uncovered in our state-level analysis align with broader, national
trends identified by other researchers and practitioners.

What’s Happening in Each State?
Big Growth, but just in the Big Apple. New York is expected to see a sizeable increase in demand
for healthcare support occupations and some practitioner occupations through 2023—meaning that the skill
profile for high-growth occupations is concentrated at the extremes of degree requirements. New York has a
relatively low risk of general labor shortages, but that’s mainly a result of very strong growth in the New York
City area. Healthcare providers should be aware of supply disparities for critical occupations.
A Balanced Boom. Florida remains one of the fastest growing states, and demand for healthcare
occupations reflect this continued growth. And yet, Florida is better positioned than most states to meet this
surge in demand. Filling the modest gaps in the mix of high- and low-skilled critical occupations is possible if
current supply trends hold, and Florida’s current healthcare workforce is located where future job growth is
most likely.
Rural Risks. Although population growth in Texas has been primarily concentrated in metropolitan areas
such as Dallas, Houston, and Austin, the geography of future healthcare demand is decidedly more rural.
Critical occupations are projected to grow quickly in more rural parts of the state, including West Texas and
the Concho Valley—places where current talent supply trends are unfavorable. Healthcare providers in
urban areas may need to look beyond the Lone Star State for some critical occupations in order to meet
expected demand increases.
Heading for the Exits. Future demand for healthcare occupations is compressed in Illinois, even in
Chicagoland where current supply trends will likely meet increases in demand. In other words, occupations
projected to grow the most and the fastest in Illinois aren’t growing all that much or that fast, and critical
occupations are less critical if people continue to leave. Rather than planning for large increases in demand,
providers should begin considering low/no-growth demand scenarios, especially for high-skill talent.
East-West Rather than North-South. Although California is economically and culturally oriented
between north and south, the geography of future healthcare demand suggests an east-west split is
emerging in the Golden State. Critical, primarily ‘mid-skill’ occupations are projected to grow more quickly
in interior communities where supply trends are less robust than coastal megacenters.

© MERCER 2015 12
© MERCER 2015 12
New York

New York: Increasing Demand for Healthcare Support and Non-specialist Jobs Health technologist and technician occupations are projected to grow the fastest in New York, alongside healthcare
support occupations such as Home Health Aides. Although demand for most practitioner occupations will remain
flat, demand for ‘non-specialist’ roles such as Physician Assistants and Nurse Practitioners will increase by 2023.

New York: The Most, The Fastest New York will need an additional 50,000 Home Health Aides by 2023—a 45% increase from 2013. Apart from
healthcare support roles such as PT Aides and Nurse Practitioners, New York will also require more surgeons and
nurses by 2023—occupations that both currently have national shortages.
Diagnosing and Treating Health Practitioners
Health Technologists and Technicians
Healthcare Support Occupations
OT and PT Asst. and Aides
Other Healthcare Practitioners
Other Healthcare Support
Healthcare Occupation Groups

New York: Critical Occupations Like the United States as a whole, there’s a potential nursing shortage in New York. Although the potential gap in
Home Health Aides is also large, the low-skill level required for this occupations means that there’s potentially a
much larger supply of labor to draw from. LPNs and NPs require more advanced training—and New York’s current
education pipeline is unlikely to meet demand by 2023.
Projected Openings through 2022
Projected Entrants through 2022
Potential Gap by 2022
Home Health Aides 50,000 30,000 -20,000
Licensed Practical and Licensed Vocational Nurses 23,000 2,000 -21,000
Medical and Clinical Laboratory Technicians 4,000 1,000 -3,000
Optometrists 1,300 700 -600
Nurse Practitioners 4,000 400 -3,600

New York: High Growth in Low-Skilled Labor Most new healthcare-related occupations created in New York over the next seven years will require a high school
degree or less—meaning that healthcare providers will need to consider how fluctuations in the general labor supply
may affect their ability to attract and retain talent. On the opposite end of the skill-level distribution, New Yorkers will
also need more healthcare providers with advanced professional degrees, mainly PTs and physicians.
Physician and Surgeons (all others)
PT
Anesthesiologists
Optometrists
Physician Assistants
Nurse Practitioners
OT
Therapists Dieticians
PT Asst.
Diagnostic Med. Son.
Cardio. Tech.
Radiation Therapists
Med. and Clinical Lab Techs
LPN and LVN
Medical Assistants
Surgical Tech.
Phlebotomists
Ophthalmic Med. Tech.
Emergency Paramedics and Technicians
Med. Records Tech.
Massage Therapist
PT Aides Pharmacy
Tech.
Home Health Aides
Source: New York Empire State Development Agency (2015). U.S. Department of Labor (2016). Calculations by Mercer

Critical Counties: Future Labor Shortages in New York Taken as a whole, New York is experiencing high rates of in-migration and boasts a sustainable ratio of young to
older workers. However, this rather encouraging picture is mainly the result of large growth in the New York City area.
Taken on a local level, much of New York faces at least a moderate risk of general labor shortage by the mid part of
the next decade.
Labor Shortage Risk
Very High
Very Low
New York’s generally healthy labor outlook is driven by big growth in the New York City Metro Area
Source: U.S. Census Bureau (2014). Calculations by Mercer

New York: Where the Workers Are(n’t) Indeed, areas where general labor shortages are most likely are also more likely to not have a sufficient number of
workers in critical occupations to meet demand. Medical and Clinical Lab Technicians are projected to grow fastest in
the Mohawk Region between Syracuse and Albany—the same region where the current number of these workers is
lowest.
Medical and Clinical Laboratory Technicians
Increase in demand
13% 29%
Current count
90 2,800
Data unavailable
Increase in demand
24% 51%
Current count
1,440 81,960
Data unavailable
Home Health Aides
Syracuse
Rochester
Buffalo
New York
Albany
Syracuse
Rochester
Buffalo
New York
Albany
Potential future supply constraints in Mohawk Valley
Source: New York Empire State Development Agency (2015). Calculations by Mercer
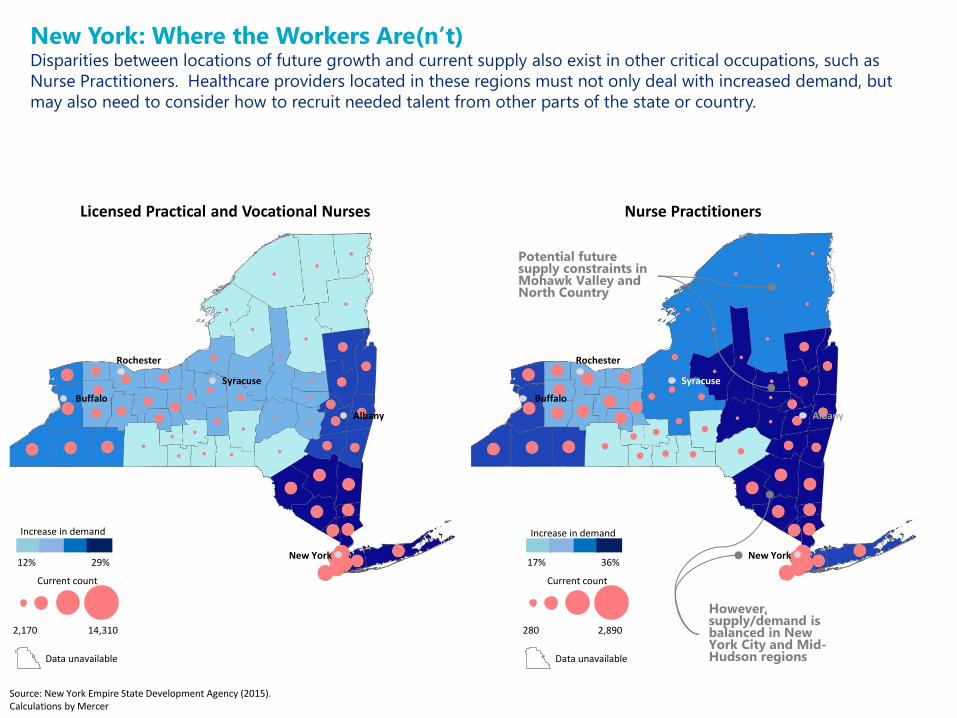
New York: Where the Workers Are(n’t) Disparities between locations of future growth and current supply also exist in other critical occupations, such as
Nurse Practitioners. Healthcare providers located in these regions must not only deal with increased demand, but
may also need to consider how to recruit needed talent from other parts of the state or country.
Nurse Practitioners
Increase in demand
17% 36%
Current count
280 2,890
Data unavailable
Increase in demand
12% 29%
Current count
2,170 14,310
Data unavailable
Licensed Practical and Vocational Nurses
Syracuse
Rochester
Buffalo
New York
Albany
Syracuse
Rochester
Buffalo
New York
Albany
Potential future supply constraints in Mohawk Valley and North Country
However, supply/demand is balanced in New York City and Mid-Hudson regions
Source: New York Empire State Development Agency (2015). Calculations by Mercer

New York: Where the Workers Are(n’t) Although disparities between locations of future growth and current supply exist, for some critical occupations the
difference is more muted. Optometrists are a critical occupation, however projected growth and current supply is
relatively balanced.
Optometrists
Increase in demand
13% 29%
Current count
50 920
Data unavailable
Syracuse
Rochester
Buffalo
New York
Albany
Source: New York Empire State Development Agency (2015). Calculations by Mercer

New York: Conclusions Like the United States as a whole, there’s a potential nursing shortage in New York. Although the potential gap in
Home Health Aides is also large, the low-skill level required for this occupations means that there’s potentially a
much larger supply of labor to draw from. LPNs and NPs require more advanced training—and New York’s current
education pipeline is unlikely to meet demand by 2023.
Projected Openings through 2022
Projected Entrants through 2022
Potential Gap by 2022
Home Health Aides 50,000 30,000 -20,000
Licensed Practical and Licensed Vocational Nurses 23,000 2,000 -21,000
Medical and Clinical Laboratory Technicians 4,000 1,000 -3,000
Optometrists 1,300 700 -600
Nurse Practitioners 4,000 400 -3,600
Source: New York Empire State Development Agency (2015). National Center for Education Statistics (2016). Calculations by Mercer

© MERCER 2015 22
© MERCER 2015 22
Florida

Florida: The Boom Continues Although the growth profile of Florida is similar to New York, with healthcare support and technologist occupations
projected to grow the most, the magnitude of this growth reflects Florida’s continued population boom. Rather than
clustering near the center of the chart below, occupations are spread out—indicating multiple high-growth
occupations.

Florida: The Most, The Fastest Health Technologists and Technician roles dominate those occupations projected to grow the most and the fastest in
Florida. However, unlike many other states examined, Florida will also require more high-skill workers such as
Surgeons, Physicians, and Physical Therapists.
Diagnosing and Treating Health Practitioners
Health Technologists and Technicians
Healthcare Support Occupations
OT and PT Asst. and Aides
Other Healthcare Practitioners
Other Healthcare Support
Healthcare Occupation Groups
Source: Florida Department of Economic Opportunity (2015). Calculations by Mercer

Florida: High Growth in Highly-Skilled Occupations Although a large number of new healthcare job openings will require less than a bachelor’s degree—suggesting that
high-demand occupations could be filled with the right incentives—Florida will also require a sizeable number of
highly-trained healthcare professionals.
PT
Physician and Surgeons (all others)
Surgeons
Anesthesiologists
Nurse Prac.
Phy. Asst.
Speech-Lang. Pathologists
OT
Nurse Anesth. Radiologic Technologist
Diagnostic Med. Son.
PT Asst.
Cardio. Tech.
Med. and Clinical Lab Techs
Nursing Assistants
Medical Assistants
LPN and LVN
Surgical Tech.
Phlebotomists
Ophthalmic Med. Tech.
Massage Therapist
Health Tech.
Home Health Aides
Source: Florida Department of Economic Opportunity (2015). U.S. Department of Labor (2016). Calculations by Mercer
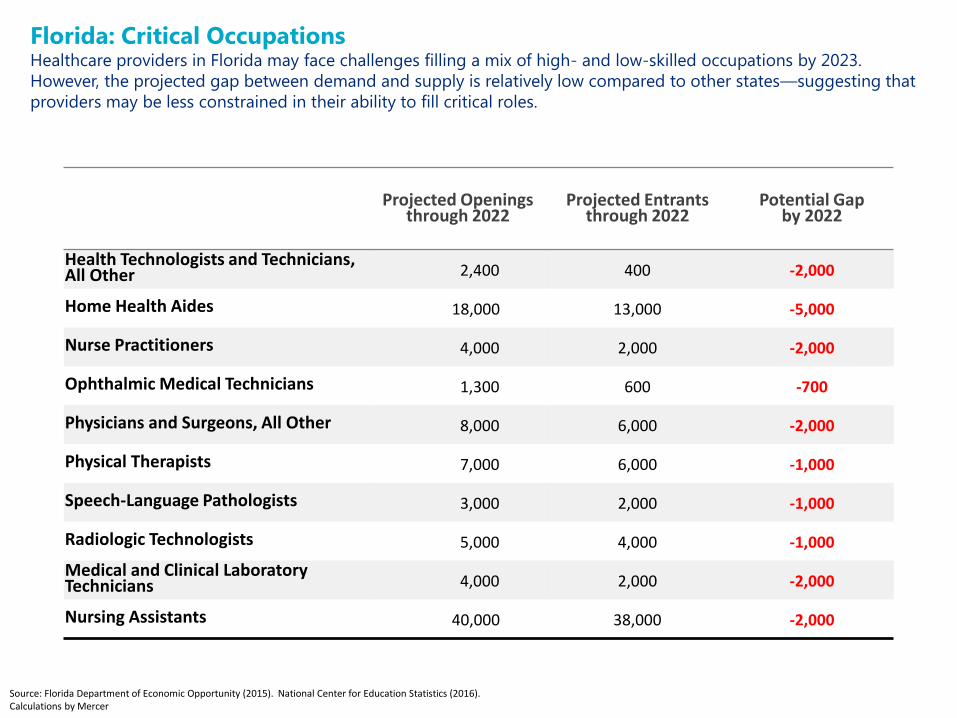
Florida: Critical Occupations Healthcare providers in Florida may face challenges filling a mix of high- and low-skilled occupations by 2023.
However, the projected gap between demand and supply is relatively low compared to other states—suggesting that
providers may be less constrained in their ability to fill critical roles.
Projected Openings through 2022
Projected Entrants through 2022
Potential Gap by 2022
Health Technologists and Technicians, All Other 2,400 400 -2,000
Home Health Aides 18,000 13,000 -5,000
Nurse Practitioners 4,000 2,000 -2,000
Ophthalmic Medical Technicians 1,300 600 -700
Physicians and Surgeons, All Other 8,000 6,000 -2,000
Physical Therapists 7,000 6,000 -1,000
Speech-Language Pathologists 3,000 2,000 -1,000
Radiologic Technologists 5,000 4,000 -1,000
Medical and Clinical Laboratory Technicians 4,000 2,000 -2,000
Nursing Assistants 40,000 38,000 -2,000
Source: Florida Department of Economic Opportunity (2015). National Center for Education Statistics (2016). Calculations by Mercer

Critical Counties: Future Labor Shortages in Florida Indeed, strong in-migration and natural population increases mean that a very few regions of Florida face potential
labor shortages in the future. Combined with relatively small supply gaps in critical occupations, healthcare providers
in Florida may be able to meet projected demand increases.
Labor Shortage Risk
Very High
Very Low
Source: U.S. Census Bureau (2014). Calculations by Mercer
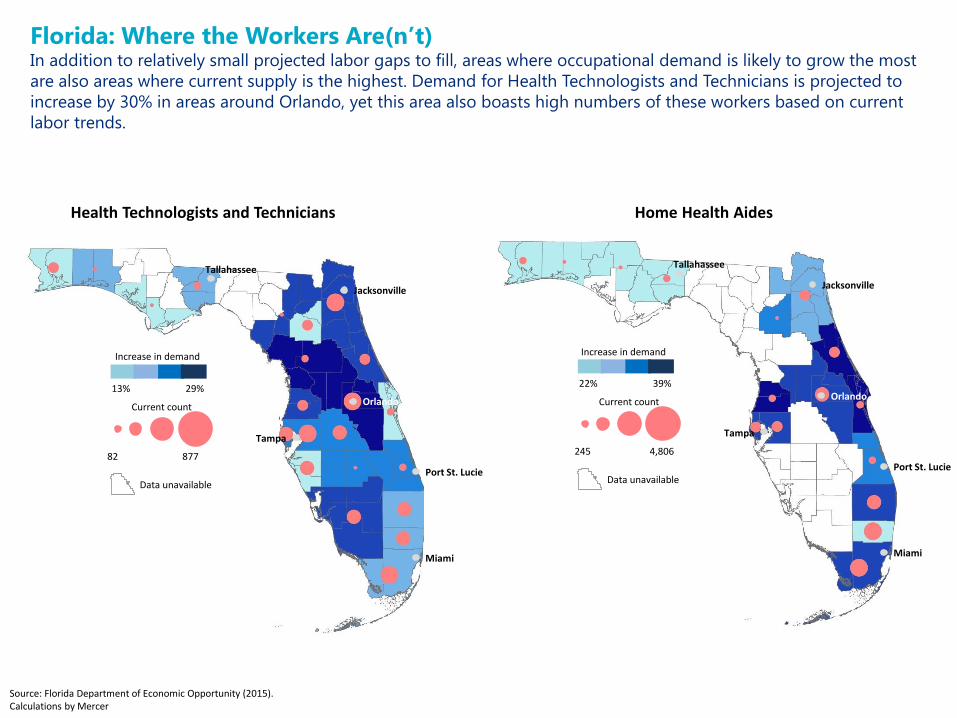
Florida: Where the Workers Are(n’t) In addition to relatively small projected labor gaps to fill, areas where occupational demand is likely to grow the most
are also areas where current supply is the highest. Demand for Health Technologists and Technicians is projected to
increase by 30% in areas around Orlando, yet this area also boasts high numbers of these workers based on current
labor trends.
Health Technologists and Technicians Home Health Aides
Increase in demand
13% 29%
Current count
82 877
Data unavailable
Increase in demand
22% 39%
Current count
245 4,806
Data unavailable
Miami
Port St. Lucie
Orlando
Jacksonville
Tampa
Tallahassee
Miami
Port St. Lucie
Orlando
Jacksonville
Tampa
Tallahassee
Source: Florida Department of Economic Opportunity (2015). Calculations by Mercer

Florida: Where the Workers Are(n’t) Demand and supply for Nurse Practitioners and Nursing Assistants are also well-balanced. Again, while projected
growth in demand for these occupations is high, healthcare providers in Florida should be able to draw on existing
supply to fill needs—assuming that current supply trends hold into the next decade.
Nurse Practitioners Nursing Assistants
Increase in demand
15% 28%
Current count
687 10,690
Data unavailable
Increase in demand
22% 39%
Current count
90 853
Data unavailable
Miami
Port St. Lucie
Orlando
Jacksonville
Tampa
Tallahassee
Miami
Port St. Lucie
Orlando
Jacksonville
Tampa
Tallahassee
Source: Florida Department of Economic Opportunity (2015). Calculations by Mercer
There’s a shortage risk for parts of East Central Florida and the Panhandle—and competition risk from nearby growth centers

Florida: Where the Workers Are(n’t) Although data is scare, there are potential oversupply issues for some critical occupations in more urban parts of
Florida.
Ophthalmic Medical Technicians Radiologic Technologists
Increase in demand
12% 29%
Current count
123 1,999
Data unavailable
Increase in demand
21% 34%
Current count
84 433
Data unavailable
Miami
Port St. Lucie
Orlando
Jacksonville
Tampa
Tallahassee
Miami
Port St. Lucie
Orlando
Jacksonville
Tampa
Tallahassee
Source: Florida Department of Economic Opportunity (2015). Calculations by Mercer
Potential oversupply in Miami-Dade?

Florida: Where the Workers Are(n’t) Demand for high-skilled occupations, including physicians and physical therapists, is likely to increase the most in
Central Florida’s urban centers, as well as high-growth areas around Jacksonville. Fortunately, supply trends suggest
that providers in these areas will be able to meet future demand.
Physicians and Surgeons Physical Therapists
Increase in demand
21% 36%
Current count
183 1,498
Data unavailable
Increase in demand
12% 29%
Current count
38 2,362
Data unavailable
Miami
Port St. Lucie
Orlando
Jacksonville
Tampa
Tallahassee
Miami
Port St. Lucie
Orlando
Jacksonville
Tampa
Tallahassee
Source: Florida Department of Economic Opportunity (2015). Calculations by Mercer

Florida: Where the Workers Are(n’t) Again, the balance between future demand and current supply trends suggests that healthcare providers can meet
the changing healthcare needs of Floridians over the next decade. There are some pockets of potential supply
constraints, however, especially in the Panhandle region.
Speech-Language Pathologists Medical and Clinical Laboratory Technicians
Increase in demand
15% 34%
Current count
52 948
Data unavailable
Increase in demand
14% 29%
Current count
77 698
Data unavailable
Miami
Port St. Lucie
Orlando
Jacksonville
Tampa
Tallahassee
Miami
Port St. Lucie
Orlando
Jacksonville
Tampa
Tallahassee
Source: Florida Department of Economic Opportunity (2015). Calculations by Mercer

© MERCER 2015 33
© MERCER 2015 33
Illinois

Illinois: Heading for the Exits Unlike other states examined, Illinois is losing population—though the rate of decline has moderated over the past
ten years. As a result, projected growth in healthcare occupations is compressed.

Illinois: The Most, The Fastest Illinois will experience increased demand in some occupations—with a mix of high- and low-skilled occupations more
similar to New York than Florida. But the magnitude of these increases is much less than other states examined. In
other words, occupations projected to grow the most and the fastest in Illinois aren’t growing that much, or that fast.
Diagnosing and Treating Health Practitioners
Health Technologists and Technicians
Healthcare Support Occupations
OT and PT Asst. and Aides
Other Healthcare Practitioners
Other Healthcare Support
Healthcare Occupation Groups
Source: Illinois Department of Commerce and Economic Opportunity (2014). Calculations by Mercer

Illinois: High Growth in Low-Skilled Labor Much of the growth in healthcare occupations for Illinois will be low-skilled labor, though a sizeable number of
occupations will require vocational training.
PT
Chiropractors
Optometrists
Anesthesiologists
Nurse Prac. Phy. Asst.
OT
Athletic Trainers
PT Asst.
Diagnostic Med. Son.
OT Asst.
Med. and Clinical Lab Techs
Home Health Aides
Nursing Assistants
LPN and LVN
Medical Assistants
Massage Therapist
Phlebotomists
Surgical Tech
Opticians PT Aides
Pharmacy Tech.
Source: Illinois Department of Commerce and Economic Opportunity (2014). U.S. Department of Labor (2016). Calculations by Mercer

Illinois: Critical Occupations Although the gap between projected demand and supply of some occupations is large—especially for Home Health
Aides—gaps for more skill-intensive occupations are modest.
Projected Openings through 2022
Projected Entrants through 2022
Potential Gap by 2022
Home Health Aides 18,000 8,000 -10,000
Physical Therapists 5,000 3,000 -2,000
Medical and Clinical Laboratory Technicians 2,500 700 -1,800
Licensed Practical and Licensed Vocational Nurses 10,000 9,000 -1,000
Nurse Practitioners 2,000 600 -1,400
Source: Illinois Department of Commerce and Economic Opportunity (2014). National Center for Education Statistics (2016). Calculations by Mercer

Critical Counties: Future Labor Shortages in Illinois Even as Illinois experiences anemic growth, the potential risk of future labor shortages remain. For areas outside of
Chicagoland and college towns such as Urbana-Champaign, this is largely the result of out-migration combined with
population decline.
Labor Shortage Risk
Very High
Very Low
Source: U.S. Census Bureau (2014). Calculations by Mercer
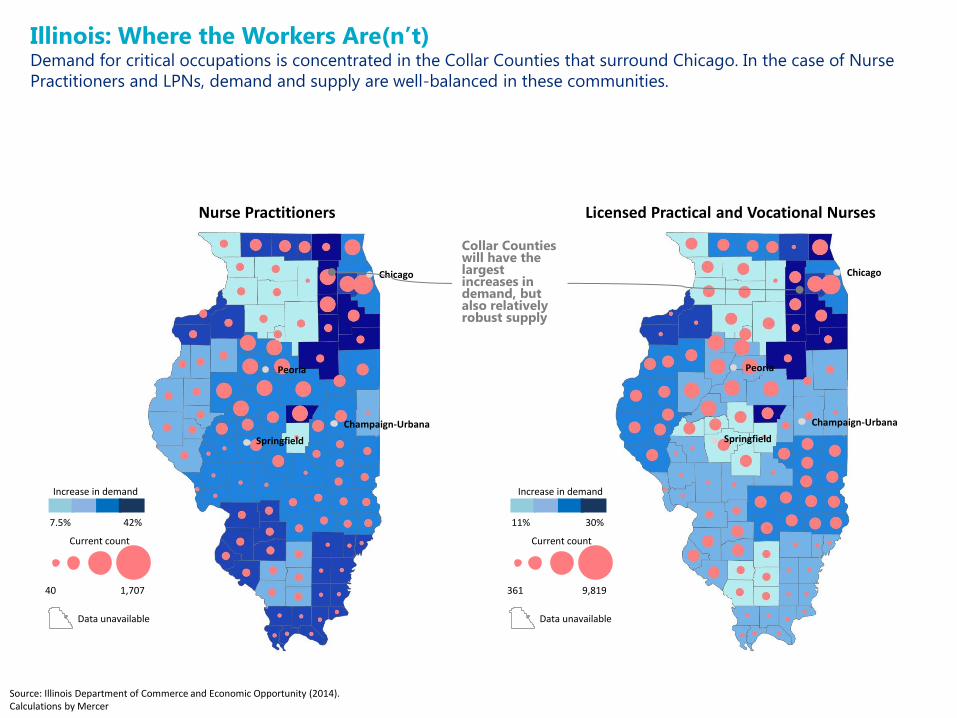
Illinois: Where the Workers Are(n’t) Demand for critical occupations is concentrated in the Collar Counties that surround Chicago. In the case of Nurse
Practitioners and LPNs, demand and supply are well-balanced in these communities.
Nurse Practitioners Licensed Practical and Vocational Nurses
Increase in demand
11% 30%
Current count
361 9,819
Data unavailable
Increase in demand
7.5% 42%
Current count
40 1,707
Data unavailable
Champaign-Urbana
Chicago
Springfield
Peoria
Champaign-Urbana
Chicago
Springfield
Peoria
Source: Illinois Department of Commerce and Economic Opportunity (2014). Calculations by Mercer
Collar Counties will have the largest increases in demand, but also relatively robust supply

Illinois: Where the Workers Are(n’t) A similar story is unfolding for Physical Therapists and Medical and Clinical Laboratory Technicians. Increased growth
is highest in and around Chicago, but across the state there is a good balance between future demand and current
supply.
Physical Therapists Medical and Clinical Laboratory Technicians
Increase in demand
7% 26%
Current count
79 2,668
Data unavailable
Increase in demand
21% 58%
Current count
97 4,175
Data unavailable
Champaign-Urbana
Chicago
Springfield
Peoria
Champaign-Urbana
Chicago
Springfield
Peoria
Source: Illinois Department of Commerce and Economic Opportunity (2014). Calculations by Mercer

Illinois: Where the Workers Are(n’t) An possible exception to Illinois’ balanced labor market exists for Home Health Aides. Graying suburbs in Lake and
Will Counties north of Chicago may face supply constraints in the future. Outside of Chicagoland, growth and supply
are projected to remain relatively balanced.
Home Health Aides
Increase in demand
21% 62%
Current count
476 23,947
Data unavailable
Champaign-Urbana
Chicago
Springfield
Peoria
Source: Illinois Department of Commerce and Economic Opportunity (2014). Calculations by Mercer
Graying suburbs may experience supply constraints

© MERCER 2015 42
© MERCER 2015 42
Texas
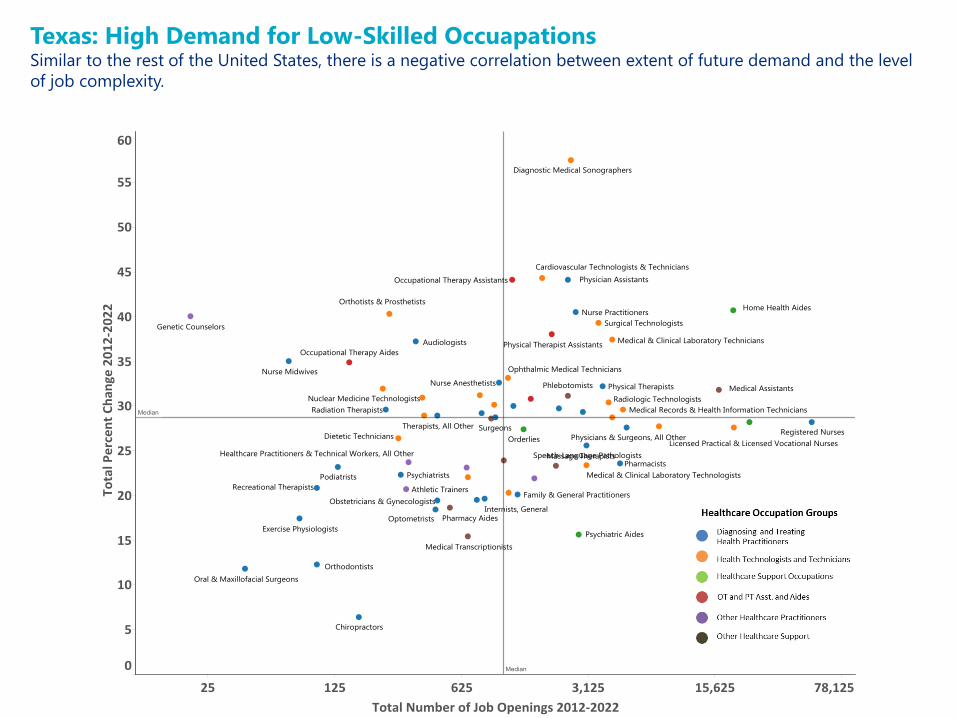
Texas: High Demand for Low-Skilled Occuapations Similar to the rest of the United States, there is a negative correlation between extent of future demand and the level
of job complexity.
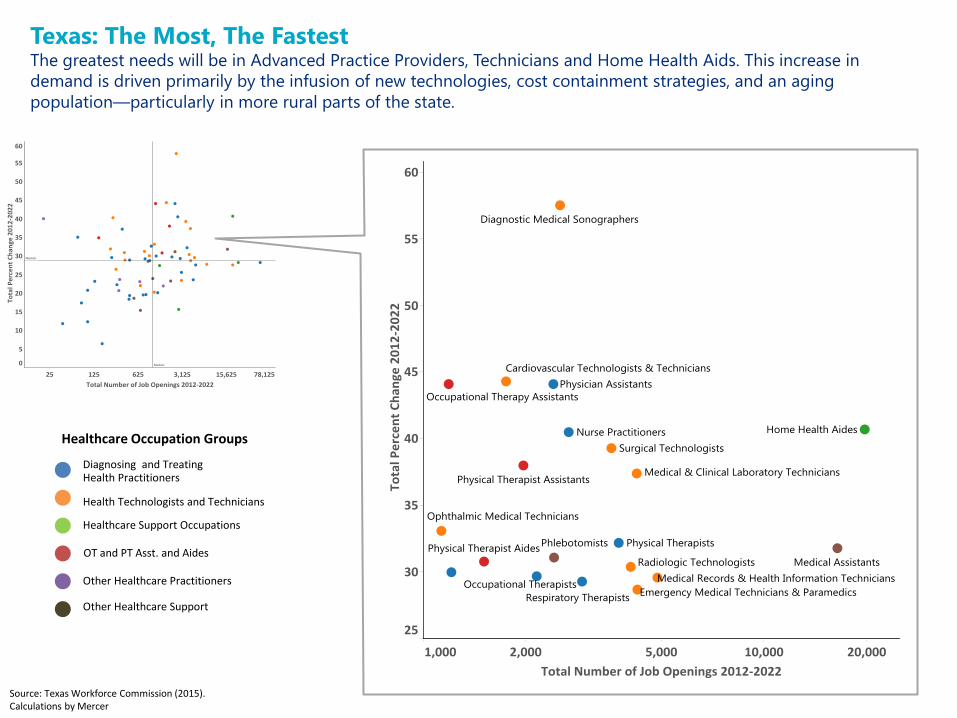
Texas: The Most, The Fastest The greatest needs will be in Advanced Practice Providers, Technicians and Home Health Aids. This increase in
demand is driven primarily by the infusion of new technologies, cost containment strategies, and an aging
population—particularly in more rural parts of the state.
Diagnosing and Treating Health Practitioners
Health Technologists and Technicians
Healthcare Support Occupations
OT and PT Asst. and Aides
Other Healthcare Practitioners
Other Healthcare Support
Healthcare Occupation Groups
Source: Texas Workforce Commission (2015). Calculations by Mercer

Texas: Future Roles Can Be Trained Quickly The vast majority of future need can be met with educational attainment far below physician levels—indicating that
solutions can be attained with the right incentives.
PT Nurse Prac.
Phy. Asst.
OT Dieticians
OT Asst.
Cardio. Tech.
PT Asst.
Diagnostic Med. Son.
Respiratory Therapists
Radiologic Technologist
Med. and Clinical Lab Techs
Ophthalmic Med. Tech.
Phlebotomists
Surgical Tech.
Emergency Paramedics and Tech.
Med. Records Tech.
Medical Assistants
PT Aides
Home Health Aides
Source: Texas Workforce Development Commission (2015). U.S. Department of Labor (2016). Calculations by Mercer

Texas: Critical Occupations Generally speaking, occupations where projected supply will be unable to meet projected demand in Texas are the
easiest to train—suggesting an opportunity for widening the supply pipeline. However, the nature of the role will
require different supervisory and management models than traditional medical practice.
Projected Openings through 2022
Projected Entrants through 2022
Potential Gap by 2022
Cardiovascular Technologists and Technicians 2,000 700 -1,300
Dietitians and Nutritionists 2,000 1,000 -1,000
Home Health Aides 29,000 20,000 -9,000
Physical Therapists 7,000 5,000 -2,000
Occupational Therapists 3,000 2,000 -1,000
Occupational Therapy Assistants 3,000 2,000 -1,000
Medical Records and Health Information Technicians 9,000 6,000 -3,000
Medical and Clinical Laboratory Technicians 7,000 3,000 -4,000
Nurse Practitioners 3,000 1,000 -2,000
Phlebotomists 4,000 1,000 -3,000
Source: Texas Workforce Development Commission (2015). National Center for Education Statistics (2016). Calculations by Mercer

Critical Counties: Future Labor Shortages in Texas Although Texas has experienced strong population growth over the past three decades—mainly the result of in-
migration—this growth has been primarily concentrated in urban centers. As a result, much of rural Texas is at a
relatively high risk of future labor shortages.
Labor Shortage Risk
Very High
Very Low
Source: U.S. Census Bureau (2014). Calculations by Mercer

Texas: Where the Workers Are(n’t) Critical occupations in Texas—that is, those occupations where projected supply may not meet projected demand—
vary widely by specialty and region. In the case of Cardiovascular Techs, for instance, current supply and future
demand are generally well aligned, except for the Texas Forest Country region where growth is expected to exceed
50% but current supply is low.
Cardiovascular Technologists and Technicians Medical and Clinical Laboratory Technicians
Increase in demand
.1% 58%
Current count
40 950
Data unavailable
Increase in demand
30% 47%
Current count
180 2,700
Data unavailable
New York
Dallas
Lubbock
El Paso
Corpus Christi
Austin
San Antonio
Houston
Dallas
Lubbock
El Paso
Corpus Christi
Austin
San Antonio
Houston
Potential future supply constraints in Texas Forest Country
Source: Texas Workforce Commission (2015). Calculations by Mercer

Texas: Where the Workers Are(n’t) Communities around and between Austin and Houston face potential supply issues for Physical Therapist and
Occupational Therapist workers by the middle of the next decade.
Physical Therapists Occupational Therapists
Increase in demand
20% 43%
Current count
140 2,780
Data unavailable
Increase in demand
14% 38%
Current count
90 1,780
Data unavailable
Dallas
Lubbock
El Paso
Corpus Christi
Austin
San Antonio
Houston
Dallas
Lubbock
El Paso
Corpus Christi
Austin
San Antonio
Houston
Rural Capital Area and Brazos Valley at risk for supply constraints in OT and PT jobs by 2023
Source: Texas Workforce Commission (2015). Calculations by Mercer

Texas: Where the Workers Are(n’t) The highest increase in demand for Nurse Practitioners will occur in west Texas—areas that have traditionally
struggled to attract and retain talent. For other occupations, such as Dietitians and Nutritionists, the entire state may
face supply constraints in the future—meaning that healthcare providers may need to look outside Texas in order to
fill roles.
Nurse Practitioners Dietitians and Nutritionists
Increase in demand
25% 50%
Current count
60 1,630
Data unavailable
Increase in demand
21% 67%
Current count
60 970
Data unavailable
Dallas
Lubbock
El Paso
Corpus Christi
Austin
San Antonio
Houston
Dallas
Lubbock
El Paso
Corpus Christi
Austin
San Antonio
Houston
Concho Valley may face supply constraints—and increased competition for talent from Borderplex
Source: Texas Workforce Commission (2015). Calculations by Mercer

Texas: Where the Workers Are(n’t) Projected demand and current supply trends for Medical Records and Health Information Technologists and
Phlebotomists exemplify the rural risks facing Texas. Increased demand is likely to be met by current supply trends in
metropolitan areas such as Dallas-Ft. Worth and Houston. But similar demand increases in more rural areas such as
West Central Texas will challenge healthcare providers as supply is currently low.
Medical Records and Health Info. Tech. Phlebotomists
Increase in demand
21% 38%
Current count
160 3,970
Data unavailable
Increase in demand
18% 40%
Current count
130 1,930
Data unavailable
Dallas
Lubbock
El Paso
Corpus Christi
Austin
San Antonio
Houston
Dallas
Lubbock
El Paso
Corpus Christi
Austin
San Antonio
Houston
Source: Texas Workforce Commission (2015). Calculations by Mercer

Texas: Where the Workers Are(n’t) A similar story is unfolding for other healthcare support occupations. Healthcare providers serving more rural parts
of the state may struggle to fill new roles expected to open over the next decade.
Occupational Therapist Assistant Home Health Aides
Increase in demand
33% 100%
Current count
30 610
Data unavailable
Increase in demand
28% 49%
Current count
560 9,480
Data unavailable
Dallas
Lubbock
El Paso
Corpus Christi
Austin
San Antonio
Houston
Dallas
Lubbock
El Paso
Corpus Christi
Austin
San Antonio
Houston
Source: Texas Workforce Commission (2015). Calculations by Mercer

© MERCER 2015 53
© MERCER 2015 53
California
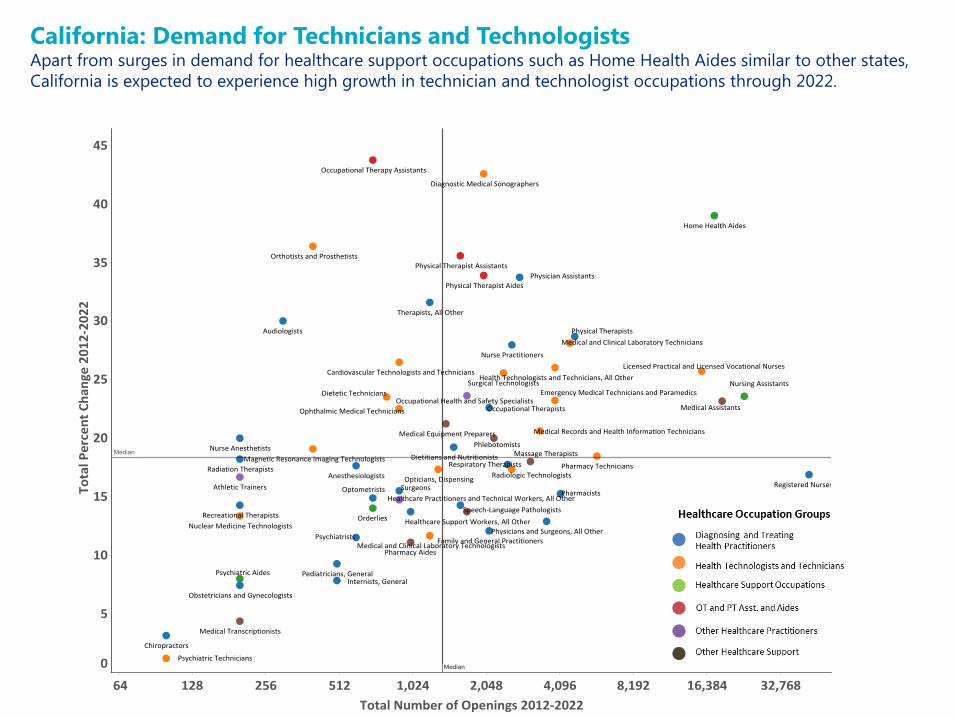
California: Demand for Technicians and Technologists Apart from surges in demand for healthcare support occupations such as Home Health Aides similar to other states,
California is expected to experience high growth in technician and technologist occupations through 2022.

California: The Most, The Fastest In addition to growth in health technologist and technician occupations, non-specialist provider roles such as Nurse
Practitioners will also grow quickly in California—reflecting the ‘downstream demand’ created by efforts to contain
costs and shift healthcare provision away from phyisicans.
Diagnosing and Treating Health Practitioners
Health Technologists and Technicians
Healthcare Support Occupations
OT and PT Asst. and Aides
Other Healthcare Practitioners
Other Healthcare Support
Healthcare Occupation Groups
Source: California Workforce Development Board (2015). Calculations by Mercer

California: Growth in ‘Mid-Skill’ Occupations The skills required to fill most of California’s new healthcare jobs falls between low- and high-skill occupations.
Similar to Texas, this suggests opportunities for providers to incentivize uptake of programs to quickly train workers
as Medical and Nursing Assistants.
Home Health Aides
PT Nurse Prac. Phy. Asst.
OT
Dieticians Occ. Health and Safety
Diagnostic Med. Son.
PT Asst.
Med. and Clinical Lab Techs
Surgical Tech.
Phlebotomists
Emergency Paramedics and Technicians
Med. Records Tech.
LPN and LVN
Medical Assistants
Nursing Assistants
Pharmacy Tech.
Health Tech.
Med. Equip. Preparers
PT Aides
Source: California Workforce Development Board (2015). U.S. Department of Labor (2016). Calculations by Mercer

California: Critical Occupations Potential gaps in Nursing Assistants and Medical and Laboratory Technicians are most acute in California.
Projected Openings through 2022
Projected Entrants through 2022
Potential Gap by 2022
Health Technologists and Technicians, All Other 5,400 200 -5,200
Home Health Aides 26,000 23,000 -4,000
Medical and Clinical Laboratory Technicians 9,000 1,000 -8,000
Medical Records and Health Information Technicians 8,000 6,000 -2,000
Phlebotomists 5,000 4,000 -1,000
Licensed Practical and Licensed Vocational Nurses 30,000 23,000 -7,000
Nursing Assistants 42,000 29,000 -13,000
Nurse Practitioners 4,000 2,000 -2,000
Source: California Workforce Development Board (2015). National Center for Education Statistics (2016). Calculations by Mercer

Critical Counties: Future Labor Shortages in California Geographically speaking, California’s risk of future labor shortages is less north and south and more east and west.
Metropolitan centers along the coast are less likely to experience labor shortages while communities farther east
have an elevated risk. Overall, however, California is less likely than other states to experience future labor shortages.
Labor Shortage Risk
Very High
Very Low
Elevated labor shortage risk in Silicon Valley and parts of Central Valley
Source: U.S. Census Bureau (2014). Calculations by Mercer

California: Where the Workers Are(n’t) Examining the balance between future demand and current supply reveals a continued east-west divide in California.
Supply constraints of Health Technologists and Technicians is likely the Central Sierra, while the supply of Medical and
Laboratory Technicians could be constrained for both the Northern Sacramento Valley and dessert interior of
Southern California.
Health Technologists and Technicians Medical and Clinical Laboratory Technicians
Increase in demand
10% 100%
Current count
120 4,020
Data unavailable
Increase in demand
7% 50%
Current count
60 5,180
Data unavailable
Santa Ana
Sacramento
San Jose
San Diego
Los Angeles
San Francisco
Santa Ana
Sacramento
San Jose
San Diego
Los Angeles
San Francisco
Source: California Workforce Development Board (2015). Calculations by Mercer

California: Where the Workers Are(n’t) An exception to the east-west split in future demand is for Medical Records and Health Information Technologists,
where multiple areas of high growth and low supply exist. Demand growth for Home Health Aides is greatest in those
areas experience the largest increases in older Californians—San Luis Obispo and Imperial counties.
Medical Records and Health Information Tech. Home Health Aides
Increase in demand
0% 50%
Current count
130 4,560
Data unavailable
Increase in demand
25% 74%
Current count
440 10,130
Data unavailable
Santa Ana
Sacramento
San Jose
San Diego
Los Angeles
San Francisco
Santa Ana
Sacramento
San Jose
San Diego
Los Angeles
San Francisco
Source: California Workforce Development Board (2015). Calculations by Mercer

California: Where the Workers Are(n’t) Although critical occupations may be ‘critical’ at a state level, regional variations mean that issues of demand are
sometimes more about distribution than supply. Nursing Assistants in California provide an excellent example. While
supply constraints are possible for most of Southern California, demand is projected to decrease in northwestern
California and parts of Silicon Valley.
Phlebotomists Nursing Assistants
Increase in demand
9% 100%
Current count
110 3,360
Data unavailable
Increase in demand
-1% 58%
Current count
1,030 31,050
Data unavailable
Santa Ana
Sacramento
San Jose
San Diego
Los Angeles
San Francisco
Santa Ana
Sacramento
San Jose
San Diego
Los Angeles
San Francisco
Source: California Workforce Development Board (2015). Calculations by Mercer

California: Where the Workers Are(n’t) Demand for nurses in California is more dispersed across the state, but the east-west split remains—especially for
Nurse Practitioners.
Nurse Practitioners Licensed Practical and Vocational Nurses
Increase in demand
17% 100%
Current count
50 2,100
Data unavailable
Increase in demand
5% 48%
Current count
540 19,720
Data unavailable
Santa Ana
Sacramento
San Jose
San Diego
Los Angeles
San Francisco
Santa Ana
Sacramento
San Jose
San Diego
Los Angeles
San Francisco
Source: California Workforce Development Board (2015). Calculations by Mercer

© MERCER 2015 63
© MERCER 2015 63
What can healthcare providers
do to address the future changes
and challenges to the healthcare
workforce?

© MERCER 2016 64
WORKFORCE PLANNING & ANALYTICS
How rigorous are your plans and insights for your current to
future workforce ?
LEADERSHIP BENCH
Do you have leaders who engage stakeholders and
drive the changes needed?
EMPLOYEE VALUE PROPOSITION (EVP)
AND TOTAL REWARDS
Are your Employee Value Proposition (EVP) and Total
Rewards compelling and differentiated for the
workforce of the future? TALENT ACQUISITION
Will you be able to recruit the numbers and quality of
employees you need?
DIVERSITY AND INCLUSION
Is your workforce culturally competent for the
population you serve?
FINANCIAL WELLBEING
Are you helping employees to build financial health (e.g.,
debt, retirement)?
REINVENTING THE HR FUNCTION
Is HR ready to support transformation and the talent
needs of the future?
The Way Forward While the future workforce of 2025 represents many challenges, it also is an opportunity for differentiation and
excellence. The seven areas shown below are each part of a proactive and systematic approach to create the
necessary future healthcare workforce.