HEALTHCARE SAFETY NET UPDATE - tn.gov · HEALTHCARE SAFETY NET. UPDATE ... A delineation of medical...
44
TENNESSEE DEPARTMENT OF HEALTH HEALTHCARE SAFETY NET UPDATE Presented to The General Assembly, State of Tennessee April 2016 John J. Dreyzehner, MD, MPH, Commissioner
Transcript of HEALTHCARE SAFETY NET UPDATE - tn.gov · HEALTHCARE SAFETY NET. UPDATE ... A delineation of medical...

TENNESSEE DEPARTMENT OF HEALTH
HEALTHCARE SAFETY NET UPDATE
Presented to
The General Assembly, State of
Tennessee
April 2016
John J. Dreyzehner, MD, MPH, Commissioner
Table of Contents i. EXECUTIVE SUMMARY for the Update on the HealthCare Safety Net .............. 1
I. INTRODUCTION ..........................................................................................................4
II. ACCESS TO CARE AND ARRAY OF SERVICES ..................................................4
A. Public Health Primary Care Safety Net Expansion .................................................. 4
1. Statewide Expansion of the Capacity of Local Health Departments ........................ 4
2. State Funded Expansion of the Capacity of Federally Qualified Health Centers or
FQHC Look-A- Likes & Local Health Department (LDH) Federally Qualified
Health Centers………………………………………………………………………5
3. Statewide Expansion of the Capacity of Selected Faith-Based, Community-Based
Rural Health and Federally Funded Centers............................................................ 8
4. Access To Statewide Dental Services .................................................................... 12
B. Behavioral Health Safety Net .................................................................................... 15
1. Program Background and Overview..………………………………………..…….15
C. Special Populations .....................................................................................................16
1. Ryan White Part B Funds ...................................................................................... 16
D. Insurance Options for Uninsured ............................................................................ 17
1. CoverKids ...............................................................................................................17
2. AccessTN ............................................................................................................... 17
E. Pharmacy Assistance ...................................................................................................17
1. CoverRX .................................................................................................................17
III. SUMMARY……………………………………………………………………………………….…..18
List of Visuals
Table 1: Non-FQHC Local Health Department Primary Care Clinics ...........................................5
Table 2: FQHC Growth and State Funding, FY2008-2015............................................................6
Table 3: Community/Faith Based Funding, FY 2008-2015 ...........................................................9
Table 4: HealthCare Safety Net Medical Encounters by Provider Type FY 2008 – FY 2015 .....12
Graph 1: HealthCare Safety Net Primary Care for Uninsured Adults 19-64 Years of Age….. 1
Graph 2: FQHC State Funding Picture FY 2008 – 2015………...……………………………6
Graph 3:Uninsured Adult Medical Encounters – FQHC FY 2008 – FY 2015…………..……7
Graph 4: Community/Faith Based Funding, FY 2008 – FY 2015………..………………….10
Graph 5: Uninsured Adult Medical Encounters Community/Faith Based
FY 2008 – FY 2015...……..……...……………………………….…………….……10
Graph 6: Safety Net Dental Providers FY 2008 – FY 2015……………………………………14
Graph 7: Emergency Dental Extractions FY 2008 – FY 2015……………………………..…...14
Map 1: Adult Healthcare Safety Net Provider Sites……….………………………………….. 2
List of Attachments
Attachment 1: Map & List of Primary Care Health Professional Shortage Areas (HPSAs)
Listings for Primary Care, Dental and Mental Health HPSAs .......................................... 19
Attachment 2: Medically Underserved Areas (MUAs) and Medically Underserved Populations
(MUPs) ........................................................................................................................ 20
Attachment 3: Adult Dental Data, FY2013-2014 & FY2014-2015 ............................................ 32
Attachment 4: FQHC Grant Recipients Serving a 30 Mile Radius ............................................ 42
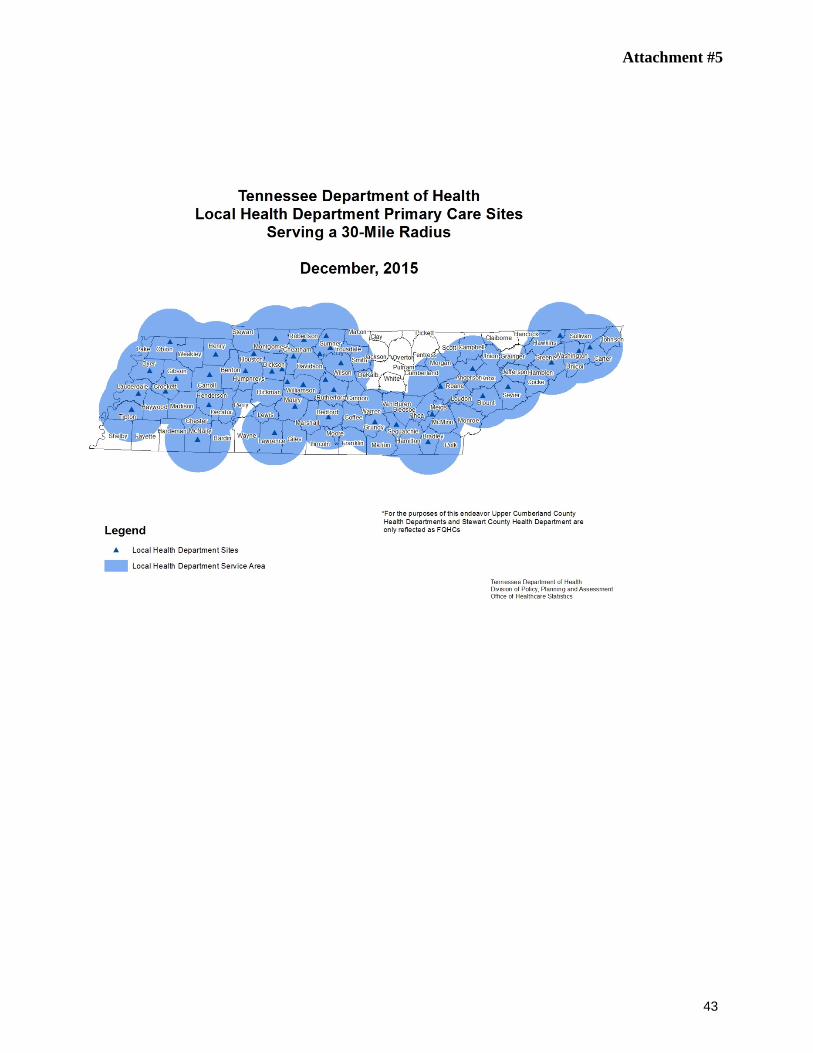
Attachment 5: Local Health Department Primary Care Sites Serving a 30 Mile Radius ........... 43
Attachment 6: Community and Faith Based Sites Serving a 30 Mile Radius ............................ 44
Attachment 7: HealthCare Safety Net Services………………………………………..……...…45

1
120,328
40,940
278,845 216,533
656,646
114,255
38,111
225,172 158,522
536,060
0
100,000
200,000
300,000
400,000
500,000
600,000
700,000
LHD LHD FQHC FQHCs (Non-LHD)
CFB Total AllProvider Types
Med
ical
Enc
ount
ers
Service Provider
HealthCare Safety Net Primary Care for Uninsured Adults 19-64 Years of Age
2013-2014
2014-2015
Executive Summary for the Update on the HealthCare Safety Net
Graph 1: HealthCare Safety Net Primary Care for Uninsured Adults 19-64 Years of Age
The Update to the HealthCare Safety Net Report as prepared by the Tennessee Department of Health provides an assessment of the FY 2014-2015 HealthCare Safety Net Program consistent with the intent of TCA 68-1-123, which is to evaluate “the array of services, adequacy of services, and access to care”. This annual update is a comprehensive look of access to care through the collaborative efforts among state, public, private not-for-profit and private for profit sectors.
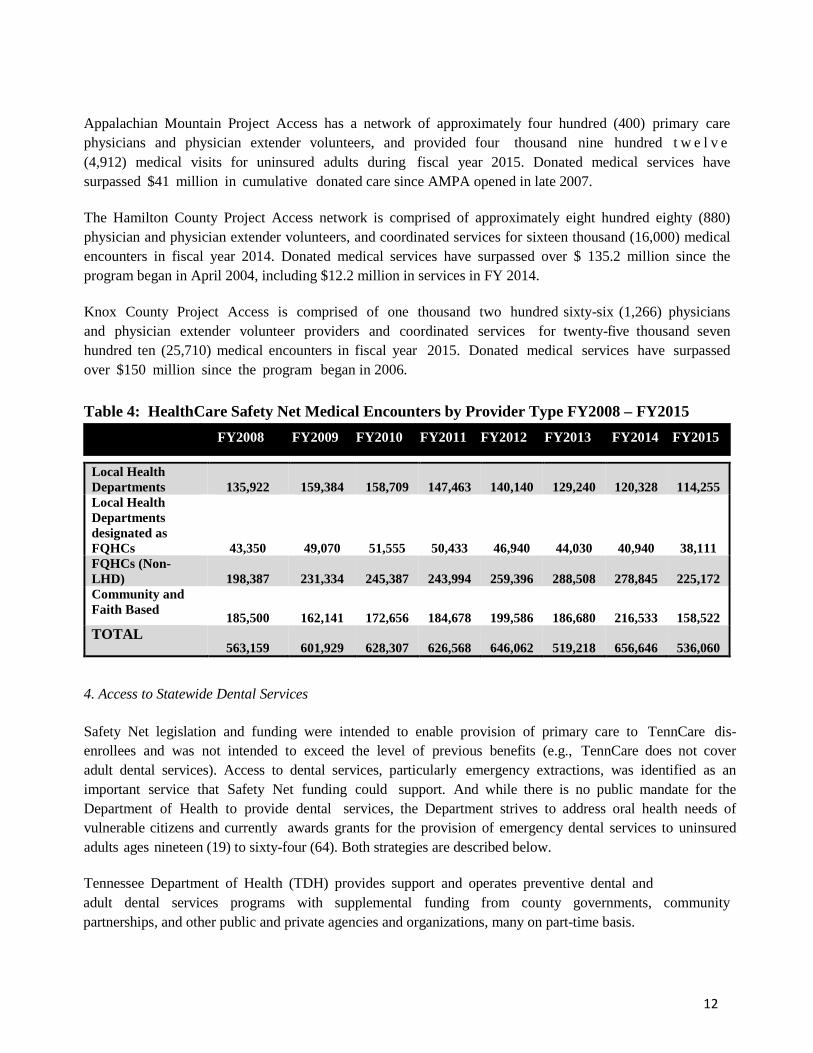
In FY 14-15 the HealthCare Safety Net Primary Care for Uninsured Adults 19-64 Years of Age, provided a total of five hundred thirty six thousand sixty (536,060) medical encounters by all service providers, as compared to six hundred fifty six thousand six hundred forty six (656,646) reported in FY 13-14 (18.3% decrease).
A delineation of medical encounters by service provider follows with supporting details is referenced in Table 4, of this report. Of the total five hundred thirty six thousand sixty (536,060) medical encounters, the Department of Health’s forty-one (41) Local Health Department (LHD) Clinics not designated as Federally Qualified Health Centers (FQHC) provided one hundred fourteen thousand two hundred fifty five (114,255) medical encounters, a slight decrease from the one hundred twenty thousand (120,328) reported in FY 13-14; fifteen (15) LDH clinics designated as FQHCs, provided thirty eight thousand one hundred eleven (38,111) as compared to forty thousand nine hundred forty (40,940) in FY 13-14 (6.9% decrease); all other Federally Qualified Health Centers (excluding the 15 LDH clinics with an FQHC designation) provided two hundred twenty five thousand one hundred seventy two (225,172) as compared to two hundred seventy eight thousand eight hundred forty five (278,845) in FY13-14 (19.2% decrease); Community & Faith-Based providers performed one hundred fifty eight thousand five hundred twenty two encounters (158,522) as compared to two hundred sixteen thousand five hundred thirty three (216,533) in FY 13-14, a (26.7% decrease). The 158,522 encounters were generated by approximately eighty nine thousand five hundred forty four (89,544) uninsured adult patients between the ages of 19-64. Funding is provided through the Tennessee Department of Health.
Safety Net Support Primary Health Care Services for Uninsured Adults

2
Map 1: Tennessee Safety Net Programs 2015
In FY 14-15 continued funding of the case management component of the HealthCare Safety Net Primary Care Program enabled uninsured adults with assistance obtaining necessary medical care and treatment that extends beyond the realm of primary care services. Programs which follow the National Project Access Model include: Nashville Academy of Medicine, Appalachian Mountain; Hamilton County Project Access and Knox County Project Access. These organizations provided care coordination for complicated health issues for seven thousand four hundred twenty seven (7,427) uninsured Tennesseans, obtaining access to specialty care, diagnostic testing procedures, in addition to surgery and hospitalization at little to no cost to the patient. Those 7,427 patients generated approximately forty three thousand seven hundred twenty one (43,721) encounter visits. Funding is provided through the Tennessee Department of Health.
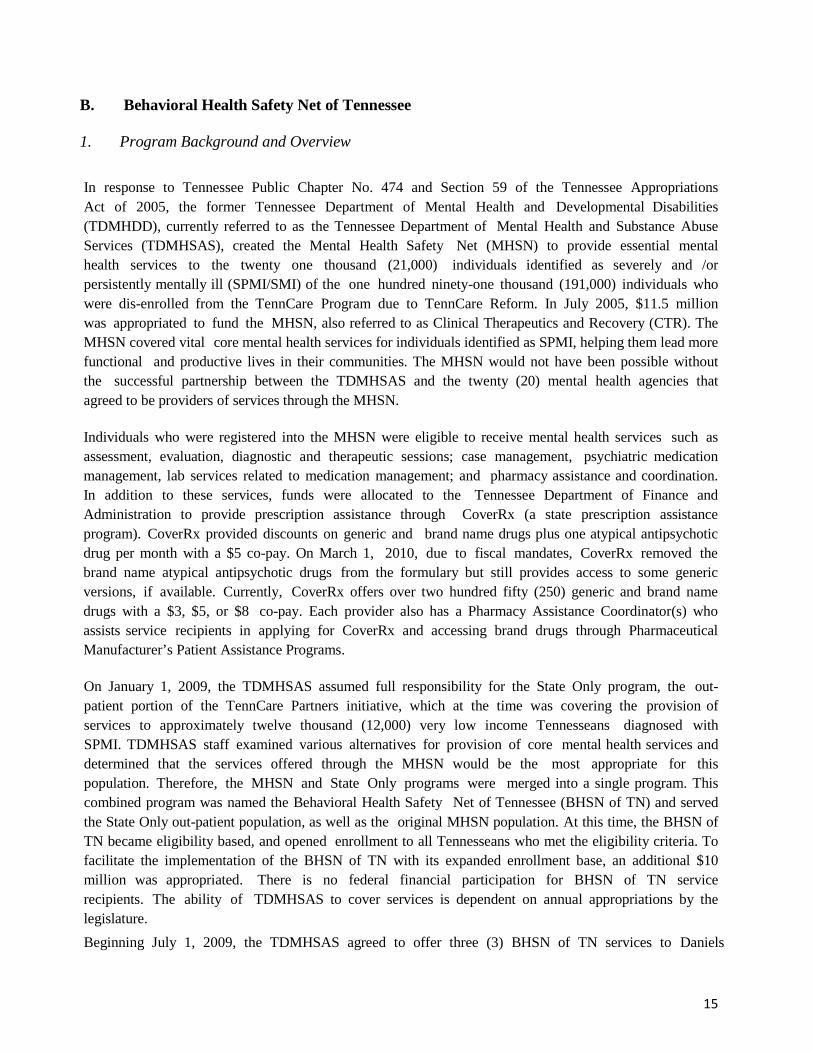
The Safety Net Emergency Dental Program for Uninsured Adults19-64 Years of Age, comprised of seventeen (17) Dental Providers, performed a total of eighteen thousand nine hundred thirty eight (18,938) extractions in FY 14- 15, as compared to seventeen thousand nine hundred eighty two (17,982) in FY 13-14. Funding is provided through the Tennessee Department of Health
In an effort to help Tennesseans with serious mental illness that lack behavioral health insurance coverage, the Behavioral Health Safety Net (BHSN) of TN collaborates with community mental health agencies across the state to provide vital services, helping people with serious mental illness lead functional and productive lives. Services include assessment, evaluation, diagnostic, therapeutic intervention, case management, peer support services, psychosocial rehabilitation services, psychiatric medication management, labs related to medication management, and pharmacy assistance and coordination.
During FY15, the BHSN of TN partnered with fifteen (15) Community Mental Health Agencies that provided vital behavioral health services to approximately thirty five thousand five hundred and ten (35,510) individuals across the state of Tennessee. The top three (3) services utilized were: Case Management; Office Visit for Evaluation and Pharmacological Management; and Individual Therapy. Funding for these services is provided through the Department of Mental Health and Substance Abuse Services. In addition to direct funding support to providers of care for services, the State of Tennessee enacted a series of insurance products which assisted the uninsured to gain coverage for all or part of their medical related expenses.

3
CoverKids continues to provide health coverage to children whose families earn within 250 percent of the federal poverty level (FPL), which was $60,625 per year for a family of four in 2015, as well as, providing unborn/maternity coverage through Healthy TNBabies.
AccessTN members with incomes at or below the federal poverty level AND who receive premium assistance were able to maintain their coverage in 2015. These individuals were transferred to a commercial health plan through BlueCross BlueShield of Tennessee which continues to administer the AccessTN program.
CoverRx continues to provide pharmacy assistance to eligible Tennesseans below the federal poverty level including members of the Mental Health Safety Net population.
Summary of Changes to Tennessee Healthcare Safety Net in 2015
Safety Net funding provides access to primary health care for uninsured adults in 88 of Tennessee’s 95 counties. Funding partially reimburses providers for their costs of care through payments for each visit documented and billed to the State. With support from the $12 million recurring appropriation, a total of 536,060 visits to Community and Faith Based Clinics, Federally Qualified Health Centers, and Project ACCESS Providers were delivered in 2015, as compared to, 656,646 in FY 13-14, an eighteen percent (18%) medical encounter reduction in FY15. This decline in patient medical encounters may be associated with effective medical home patient management, and the impact of the Affordable Care Act on accessibility to health insurance.
Affordable Care Act Health Insurance Enrollment
Safety-Net provider sites remained premium access points for providing people with assistance enrolling in the Health Insurance Marketplace in FY 15. The Safety Net patient demographic is comprised of the uninsured, low-income, disproportionately poor and in many communities they are a member of a racial, ethnic or cultural minority, challenged with transportation, health literacy, distance, or geographic barriers to access care, and experience unmet health needs due to delayed care or lack of preventative care. Even if this vulnerable population of uninsured adults obtains health insurance through the Affordable Care Act, evidence points to a continuing issue of affordability of new insurance premiums, co-pays, deductibles, and other out-of-pocket expenses which creates an additional barrier to accessing care. The Adult Health Care Safety Net provides a dedicated stream of funding support to Safety Net patients navigating economic challenges and access to a medical home for patients whose health needs would not have been met.
A noted decline in medical encounters, whether due to achievement of desired medical home patient management, or the impact of the Affordable Care Insurance Act, provides the Safety Net program with some unique opportunities to enhance the program; expansion of dental services to include preventative hygiene cleaning services (not just emergency extractions) and/or enhancement of primary care and dental provider reimbursement fees.
4
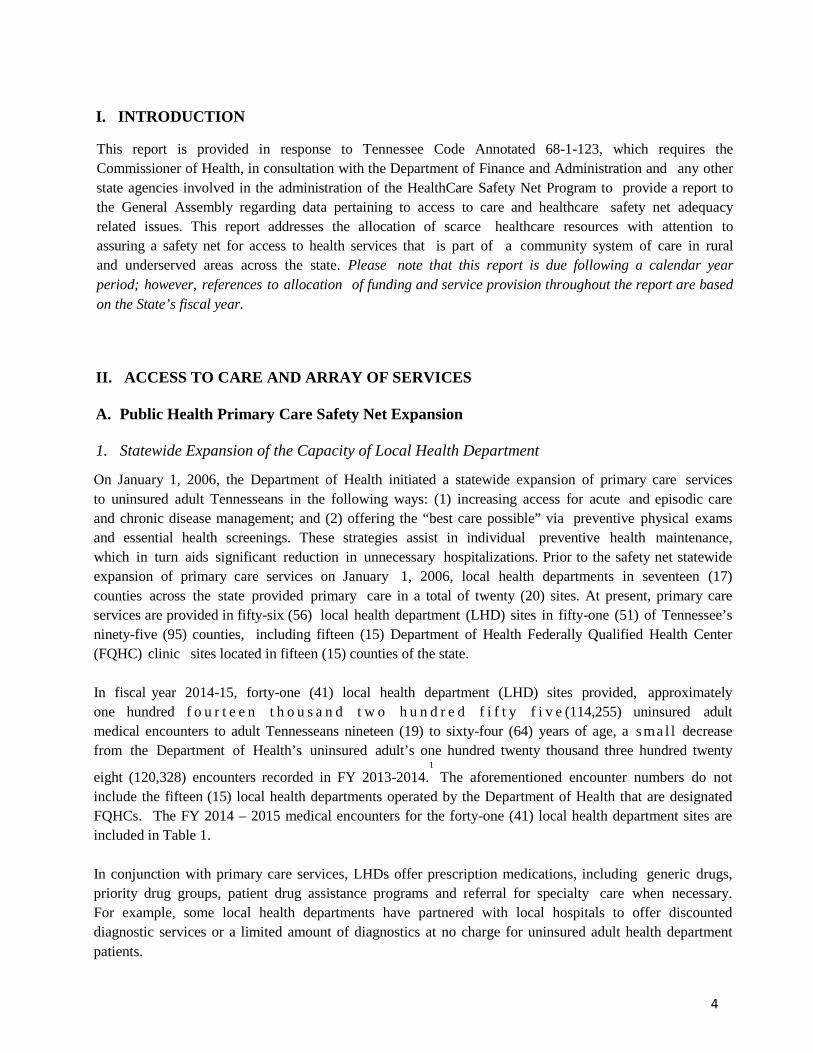
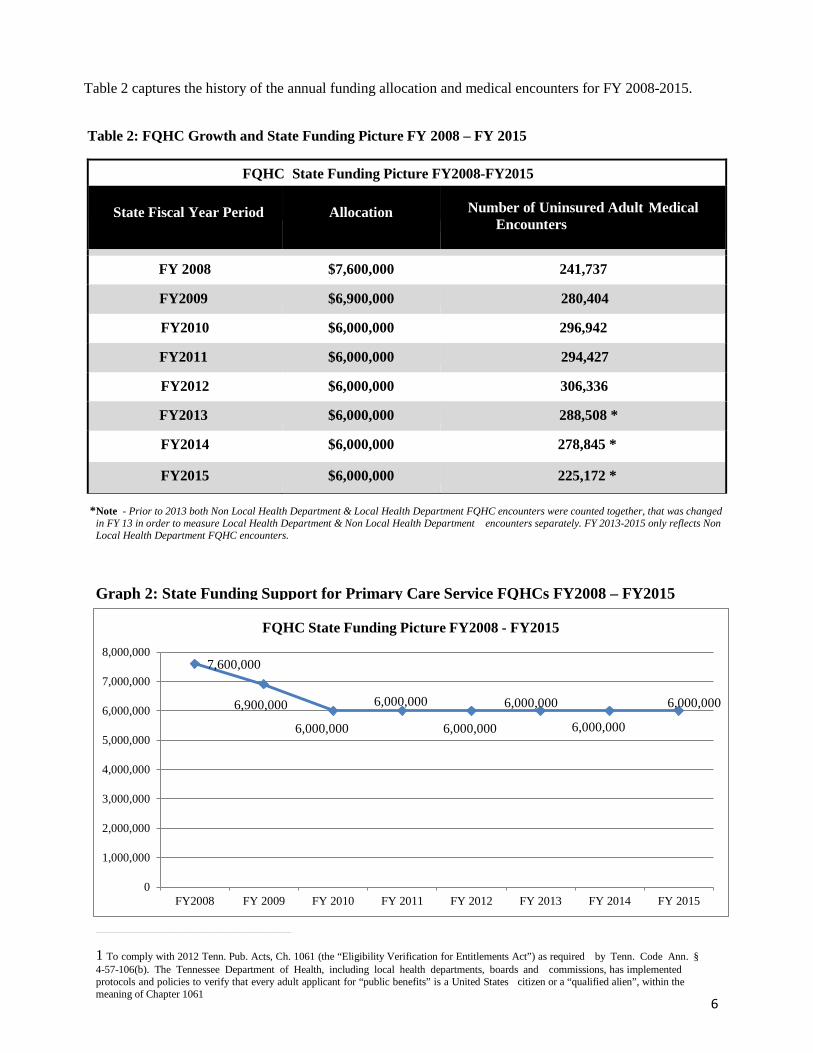
On January 1, 2006, the Department of Health initiated a statewide expansion of primary care services to uninsured adult Tennesseans in the following ways: (1) increasing access for acute and episodic care and chronic disease management; and (2) offering the “best care possible” via preventive physical exams and essential health screenings. These strategies assist in individual preventive health maintenance, which in turn aids significant reduction in unnecessary hospitalizations. Prior to the safety net statewide expansion of primary care services on January 1, 2006, local health departments in seventeen (17) counties across the state provided primary care in a total of twenty (20) sites. At present, primary care services are provided in fifty-six (56) local health department (LHD) sites in fifty-one (51) of Tennessee’s ninety-five (95) counties, including fifteen (15) Department of Health Federally Qualified Health Center (FQHC) clinic sites located in fifteen (15) counties of the state. In fiscal year 2014-15, forty-one (41) local health department (LHD) sites provided, approximately one hundred f o u r t e e n t h o u s a n d t w o h u n d r e d f i f t y f i v e (114,255) uninsured adult medical encounters to adult Tennesseans nineteen (19) to sixty-four (64) years of age, a s ma l l decrease from the Department of Health’s uninsured adult’s one hundred twenty thousand three hundred twenty
eight (120,328) encounters recorded in FY 2013-2014.1 The aforementioned encounter numbers do not
include the fifteen (15) local health departments operated by the Department of Health that are designated FQHCs. The FY 2014 – 2015 medical encounters for the forty-one (41) local health department sites are included in Table 1. In conjunction with primary care services, LHDs offer prescription medications, including generic drugs, priority drug groups, patient drug assistance programs and referral for specialty care when necessary. For example, some local health departments have partnered with local hospitals to offer discounted diagnostic services or a limited amount of diagnostics at no charge for uninsured adult health department patients.
I. INTRODUCTION
II. ACCESS TO CARE AND ARRAY OF SERVICES
A. Public Health Primary Care Safety Net Expansion
1. Statewide Expansion of the Capacity of Local Health Department
This report is provided in response to Tennessee Code Annotated 68-1-123, which requires the Commissioner of Health, in consultation with the Department of Finance and Administration and any other state agencies involved in the administration of the HealthCare Safety Net Program to provide a report to the General Assembly regarding data pertaining to access to care and healthcare safety net adequacy related issues. This report addresses the allocation of scarce healthcare resources with attention to assuring a safety net for access to health services that is part of a community system of care in rural and underserved areas across the state. Please note that this report is due following a calendar year period; however, references to allocation of funding and service provision throughout the report are based on the State’s fiscal year.
5
Table 1: Non-FQHC Local Health Department Primary Care Clinics
Non-FQHC Local Health Department Primary Care Clinics
Primary Care Age Groups Uninsured Adult Encounters
FY2014 -FY2015 19-20 Years 2,444 21-24 Years 7,605 25-29 Years 9,825 30-34 Years 9,100 35-39 Years 9,181 40-44 Years 11,872 45-49 Years 15,851 50-54 Years 20,109 55-59 Years 16,283 60-64 Years 11,985
Grand Total 114,255
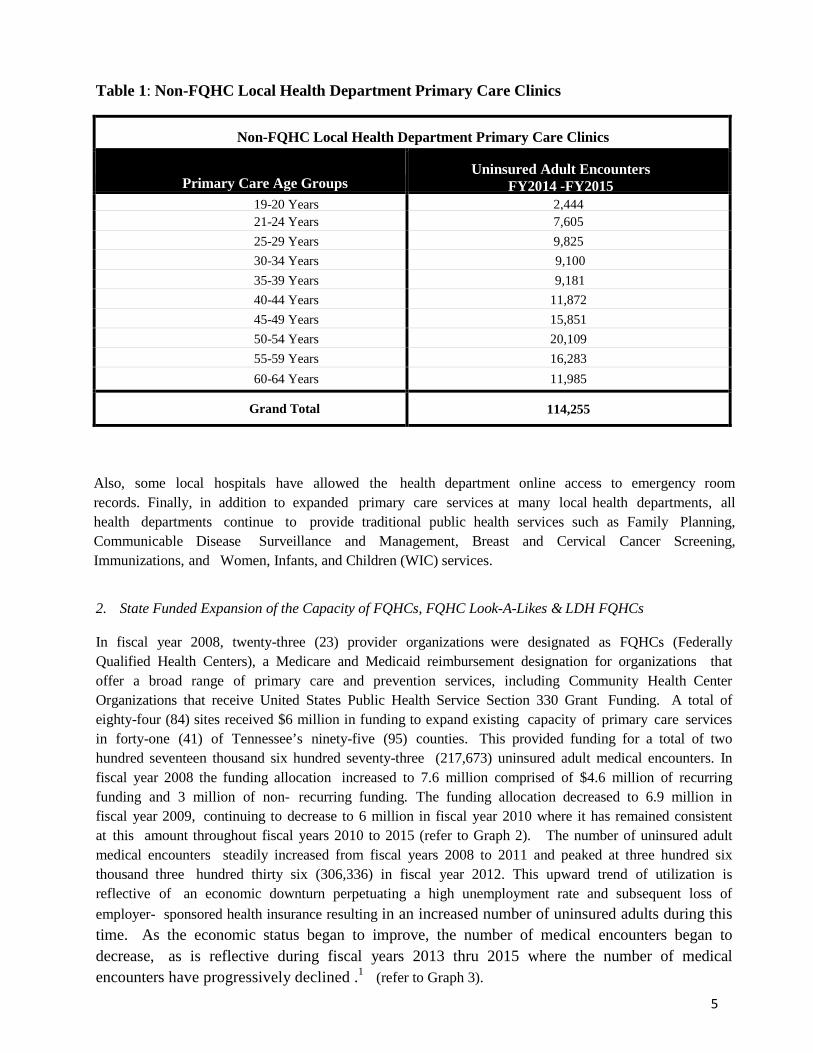
2. State Funded Expansion of the Capacity of FQHCs, FQHC Look-A-Likes & LDH FQHCs In fiscal year 2008, twenty-three (23) provider organizations were designated as FQHCs (Federally Qualified Health Centers), a Medicare and Medicaid reimbursement designation for organizations that offer a broad range of primary care and prevention services, including Community Health Center Organizations that receive United States Public Health Service Section 330 Grant Funding. A total of eighty-four (84) sites received $6 million in funding to expand existing capacity of primary care services in forty-one (41) of Tennessee’s ninety-five (95) counties. This provided funding for a total of two hundred seventeen thousand six hundred seventy-three (217,673) uninsured adult medical encounters. In fiscal year 2008 the funding allocation increased to 7.6 million comprised of $4.6 million of recurring funding and 3 million of non- recurring funding. The funding allocation decreased to 6.9 million in fiscal year 2009, continuing to decrease to 6 million in fiscal year 2010 where it has remained consistent at this amount throughout fiscal years 2010 to 2015 (refer to Graph 2). The number of uninsured adult medical encounters steadily increased from fiscal years 2008 to 2011 and peaked at three hundred six thousand three hundred thirty six (306,336) in fiscal year 2012. This upward trend of utilization is reflective of an economic downturn perpetuating a high unemployment rate and subsequent loss of employer- sponsored health insurance resulting in an increased number of uninsured adults during this time. As the economic status began to improve, the number of medical encounters began to decrease, as is reflective during fiscal years 2013 thru 2015 where the number of medical encounters have progressively declined .1 (refer to Graph 3).
Also, some local hospitals have allowed the health department online access to emergency room records. Finally, in addition to expanded primary care services at many local health departments, all health departments continue to provide traditional public health services such as Family Planning, Communicable Disease Surveillance and Management, Breast and Cervical Cancer Screening, Immunizations, and Women, Infants, and Children (WIC) services.
6
7,600,000
6,900,000
6,000,000
6,000,000
6,000,000
6,000,000
6,000,000
6,000,000
0
1,000,000
2,000,000
3,000,000
4,000,000
5,000,000
6,000,000
7,000,000
8,000,000
FY2008 FY 2009 FY 2010 FY 2011 FY 2012 FY 2013 FY 2014 FY 2015
FQHC State Funding Picture FY2008 - FY2015
Table 2 captures the history of the annual funding allocation and medical encounters for FY 2008-2015. Table 2: FQHC Growth and State Funding Picture FY 2008 – FY 2015
*Note - Prior to 2013 both Non Local Health Department & Local Health Department FQHC encounters were counted together, that was changed
in FY 13 in order to measure Local Health Department & Non Local Health Department encounters separately. FY 2013-2015 only reflects Non Local Health Department FQHC encounters.
FQHC State Funding Picture FY2008-FY2015
State Fiscal Year Period
Allocation Number of Uninsured Adult Medical Encounters
FY 2008 $7,600,000 241,737
FY2009 $6,900,000 280,404
FY2010 $6,000,000 296,942
FY2011 $6,000,000 294,427
FY2012 $6,000,000 306,336
FY2013 $6,000,000 288,508 *
FY2014 $6,000,000 278,845 *
FY2015 $6,000,000 225,172 *
Graph 2: State Funding Support for Primary Care Service FQHCs FY2008 – FY2015
___________________________________________________________________________________________________________________________________________________
1 To comply with 2012 Tenn. Pub. Acts, Ch. 1061 (the “Eligibility Verification for Entitlements Act”) as required by Tenn. Code Ann. § 4-57-106(b). The Tennessee Department of Health, including local health departments, boards and commissions, has implemented protocols and policies to verify that every adult applicant for “public benefits” is a United States citizen or a “qualified alien”, within the meaning of Chapter 1061

7
241,731
280,404 296,942
294,427
306,336
288,508
278,845 225,172
0
50,000
100,000
150,000
200,000
250,000
300,000
350,000
FY2008 FY 2009 FY 2010 FY 2011 FY 2012 FY 2013 FY 2014 FY 2015
Enco
unte
rs
Uninsured Adult Medical Encounters - FQHC
Currently, there are twenty-nine (29) community health center FQHCs and one (1) FQHC Look-A-Like in Tennessee with just under 200 service delivery sites. Delivery sites include primary care service delivery sites, dental service delivery sites, and other miscellaneous service delivery sites such as school based health centers and homeless clinics. Note: Attachment 7 lists only Safety Net primary care FQHC sites.
These private, nonprofit, community-directed health care facilities provide high-quality, cost- effective and comprehensive primary and preventive care to medically underserved and uninsured Tennesseans. In 2014 FQHCs in Tennessee provided care to over 369,000 patients. According to the Tennessee Primary Care Association (TPCA), on average approximately 37% of community health center patients are uninsured; however, that number may be as high as 80% for some centers. Approximately 84% of the total FQHC patients have income levels below 100% of the Federal Poverty Level. Historically, Community Health Centers participated in the Health Disparities Collaborative, a national effort to improve health outcomes for all medically underserved people with chronic diseases, such as diabetes, cardiovascular disease, depression and asthma. This initiative prepared Community Health Centers to begin transforming their practices into Patient Centered Medical Homes (PCMHs). The patient-centered medical home is a “way of organizing primary care that emphasizes care coordination and communication to transform primary care into ‘what patients want it to be.” Medical homes can lead to higher quality and lower costs, and can improve patients’ and providers’ experience of care.” (National Committee for Quality Assurance). Health centers in Tennessee are working on PCMH Recognition through the National Committee for Quality Assurance (NCQA) or Primary Care Medical Home Certification through The Joint Commission (TJC). The first Tennessee health center achieved PCMH Certification in March 2013. Through November 2015, sixty-one (61) sites from sixteen (16) health centers have achieved PCMH Recognition or Certification.
These centers are also working hard to improve clinical quality. The Center for Quality in
Community Health is a network of Community Health Centers and partners that supports a continually evolving health care system by sharing information and expertise to facilitate learning, support quality improvement and develop leadership. Through the use of timely, relevant data, the Center for
Graph 3: Uninsured Adult Medical Encounters FY2008 – FY2015
8
Quality in Community Health promotes collaboration, sustainability, cost effectiveness and healthier communities in Tennessee.
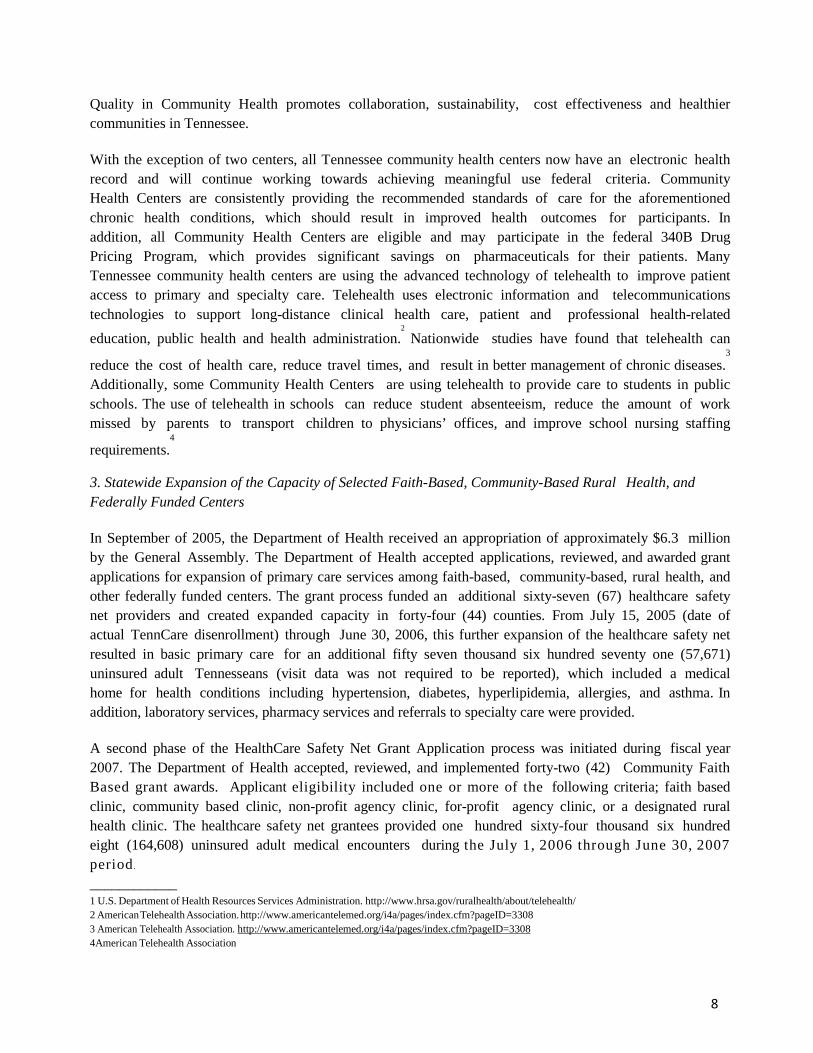
With the exception of two centers, all Tennessee community health centers now have an electronic health record and will continue working towards achieving meaningful use federal criteria. Community Health Centers are consistently providing the recommended standards of care for the aforementioned chronic health conditions, which should result in improved health outcomes for participants. In addition, all Community Health Centers are eligible and may participate in the federal 340B Drug Pricing Program, which provides significant savings on pharmaceuticals for their patients. Many Tennessee community health centers are using the advanced technology of telehealth to improve patient access to primary and specialty care. Telehealth uses electronic information and telecommunications technologies to support long-distance clinical health care, patient and professional health-related education, public health and health administration.
2 Nationwide studies have found that telehealth can
reduce the cost of health care, reduce travel times, and result in better management of chronic diseases.3
Additionally, some Community Health Centers are using telehealth to provide care to students in public schools. The use of telehealth in schools can reduce student absenteeism, reduce the amount of work missed by parents to transport children to physicians’ offices, and improve school nursing staffing
requirements.4
3. Statewide Expansion of the Capacity of Selected Faith-Based, Community-Based Rural Health, and Federally Funded Centers
In September of 2005, the Department of Health received an appropriation of approximately $6.3 million by the General Assembly. The Department of Health accepted applications, reviewed, and awarded grant applications for expansion of primary care services among faith-based, community-based, rural health, and other federally funded centers. The grant process funded an additional sixty-seven (67) healthcare safety net providers and created expanded capacity in forty-four (44) counties. From July 15, 2005 (date of actual TennCare disenrollment) through June 30, 2006, this further expansion of the healthcare safety net resulted in basic primary care for an additional fifty seven thousand six hundred seventy one (57,671) uninsured adult Tennesseans (visit data was not required to be reported), which included a medical home for health conditions including hypertension, diabetes, hyperlipidemia, allergies, and asthma. In addition, laboratory services, pharmacy services and referrals to specialty care were provided.
A second phase of the HealthCare Safety Net Grant Application process was initiated during fiscal year 2007. The Department of Health accepted, reviewed, and implemented forty-two (42) Community Faith Based grant awards. Applicant eligibility included one or more of the following criteria; faith based clinic, community based clinic, non-profit agency clinic, for-profit agency clinic, or a designated rural health clinic. The healthcare safety net grantees provided one hundred sixty-four thousand six hundred eight (164,608) uninsured adult medical encounters during the July 1, 2006 through June 30, 2007 period.
____________ 1 U.S. Department of Health Resources Services Administration. http://www.hrsa.gov/ruralhealth/about/telehealth/ 2 American Telehealth Association. http://www.americantelemed.org/i4a/pages/index.cfm?pageID=3308
3 American Telehealth Association. http://www.americantelemed.org/i4a/pages/index.cfm?pageID=3308 4American Telehealth Association
9
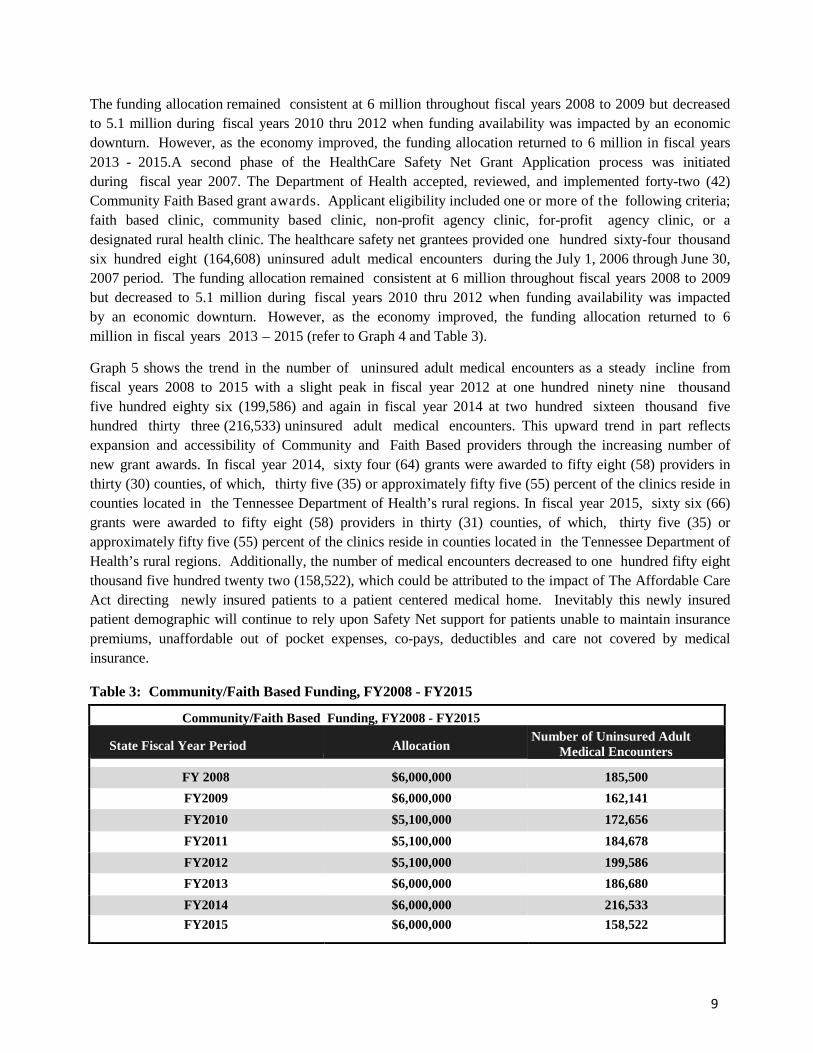
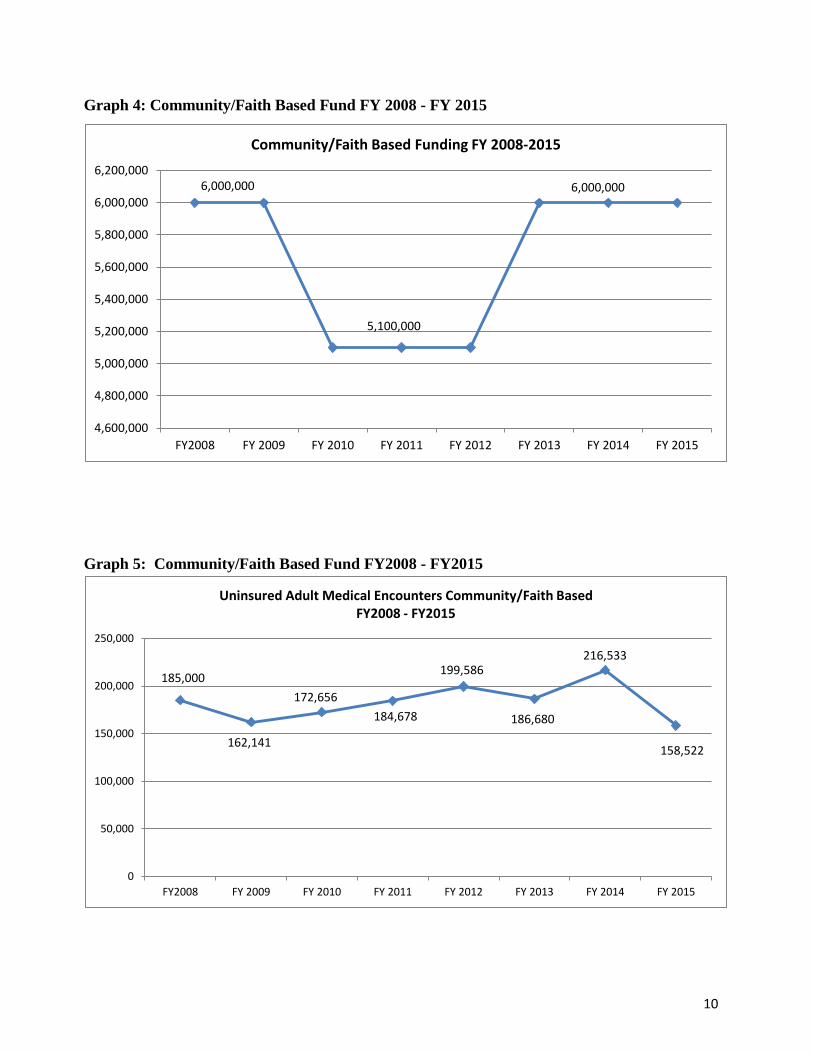
The funding allocation remained consistent at 6 million throughout fiscal years 2008 to 2009 but decreased to 5.1 million during fiscal years 2010 thru 2012 when funding availability was impacted by an economic downturn. However, as the economy improved, the funding allocation returned to 6 million in fiscal years 2013 - 2015.A second phase of the HealthCare Safety Net Grant Application process was initiated during fiscal year 2007. The Department of Health accepted, reviewed, and implemented forty-two (42) Community Faith Based grant awards. Applicant eligibility included one or more of the following criteria; faith based clinic, community based clinic, non-profit agency clinic, for-profit agency clinic, or a designated rural health clinic. The healthcare safety net grantees provided one hundred sixty-four thousand six hundred eight (164,608) uninsured adult medical encounters during the July 1, 2006 through June 30, 2007 period. The funding allocation remained consistent at 6 million throughout fiscal years 2008 to 2009 but decreased to 5.1 million during fiscal years 2010 thru 2012 when funding availability was impacted by an economic downturn. However, as the economy improved, the funding allocation returned to 6 million in fiscal years 2013 – 2015 (refer to Graph 4 and Table 3).
Graph 5 shows the trend in the number of uninsured adult medical encounters as a steady incline from fiscal years 2008 to 2015 with a slight peak in fiscal year 2012 at one hundred ninety nine thousand five hundred eighty six (199,586) and again in fiscal year 2014 at two hundred sixteen thousand five hundred thirty three (216,533) uninsured adult medical encounters. This upward trend in part reflects expansion and accessibility of Community and Faith Based providers through the increasing number of new grant awards. In fiscal year 2014, sixty four (64) grants were awarded to fifty eight (58) providers in thirty (30) counties, of which, thirty five (35) or approximately fifty five (55) percent of the clinics reside in counties located in the Tennessee Department of Health’s rural regions. In fiscal year 2015, sixty six (66) grants were awarded to fifty eight (58) providers in thirty (31) counties, of which, thirty five (35) or approximately fifty five (55) percent of the clinics reside in counties located in the Tennessee Department of Health’s rural regions. Additionally, the number of medical encounters decreased to one hundred fifty eight thousand five hundred twenty two (158,522), which could be attributed to the impact of The Affordable Care Act directing newly insured patients to a patient centered medical home. Inevitably this newly insured patient demographic will continue to rely upon Safety Net support for patients unable to maintain insurance premiums, unaffordable out of pocket expenses, co-pays, deductibles and care not covered by medical insurance.
Table 3: Community/Faith Based Funding, FY2008 - FY2015
Community/Faith Based Funding, FY2008 - FY2015
State Fiscal Year Period Allocation Number of Uninsured Adult
Medical Encounters FY 2008 $6,000,000 185,500
FY2009 $6,000,000 162,141 FY2010 $5,100,000 172,656 FY2011 $5,100,000 184,678 FY2012 $5,100,000 199,586 FY2013 $6,000,000 186,680 FY2014 $6,000,000 216,533 FY2015 $6,000,000 158,522
10
6,000,000
5,100,000
6,000,000
4,600,000
4,800,000
5,000,000
5,200,000
5,400,000
5,600,000
5,800,000
6,000,000
6,200,000
FY2008 FY 2009 FY 2010 FY 2011 FY 2012 FY 2013 FY 2014 FY 2015
Community/Faith Based Funding FY 2008-2015
185,000
162,141
172,656 184,678
199,586
186,680
216,533
158,522
0
50,000
100,000
150,000
200,000
250,000
FY2008 FY 2009 FY 2010 FY 2011 FY 2012 FY 2013 FY 2014 FY 2015
Uninsured Adult Medical Encounters Community/Faith Based FY2008 - FY2015
Graph 4: Community/Faith Based Fund FY 2008 - FY 2015
Graph 5: Community/Faith Based Fund FY2008 - FY2015
11
Throughout each of these grant application processes, the Department of Health gave preference to applicants that proposed to provide primary care services to meet the needs of a Medically Underserved Area (MUA), Medically Underserved Population (MUP), or a Health Professional Shortage Area (HPSA) where current Safety Net services are limited. HPSAs are federally designated counties, parts of counties (such as census tracts), or public facilities that have been recognized as meeting or exceeding the standards of need for certain services.
Primary care HPSAs status has been used nationally for years as a measure of difficulties in access to care. A HPSA must meet or exceed the following thresholds.
• For a geographic designation, the population to physician ratio is greater than 3,500:1. • For a population designation, a segment of the population experiencing barriers to care and a
population to physician ratio that is greater than 3,000:1. • For a facility designation, a public or private nonprofit medical facility is providing primary
medical care services to an area or population group designated as having a shortage of primary care professional(s), and the facility has insufficient capacity to meet the primary care needs of that area or population group. A community health center or homeless clinic is an example of such a designation.
A listing of HPSAs, MUAs, and MUPs for primary care, dental, and mental health services is included as Attachments 1 and 2. (Note: A map of the primary care HPSAs appears in Attachment 1)
Included in investments made through community and faith based organizations are contracts awarded to Project Access networks. These organizations do not deliver primary care services but instead offer essential care coordination services for uninsured adults in metropolitan areas and provide referrals to primary care medical homes, specialty care services, and diagnostics. This coordination of a client’s care needs, whether directly to a medical home or to a medical specialist is what defines a Project Access care coordination grantee. Diagnostics provided at either a medical home or by a specialist can in many cases prevent the necessity for a costly hospital emergency room visit. Agencies that received funding in fiscal year 2015 to serve as referral services for linking uninsured adults to these services were: Nashville Academy of Medicine, Appalachian Mountain Project Access, Hamilton County Project Access, and Knox County Project Access.
The Project Access Nashville network (formerly Bridges to Care) network is comprised of nine (9) hospitals, seven (7) federally subsidized primary care clinics, ten (10) faith-based public and private hospital sponsored primary care clinics, four (4) dental clinics, four (4) mental health centers, three (3) alcohol and drug treatment centers.
Uninsured adults who are enrolled in Project Access Nashville and are at 200% or below poverty level have access by referral to approximately one thousand one hundred thirteen (1,113) volunteer physician specialists through the Project Access Nashville- Specialty Care Program, operated by the Nashville Academy of Medicine. From July 1, 2014 through June 30, 2015, the Nashville Academy of Medicine coordinated services for one thousand eight hundred twelve (1,812) specialty care encounters with physicians and five hundred eighteen (518) hospital encounters. The reported value of coordinated care for FY 2015 is four million seven hundred eighty-four thousand ninety-seven dollars ($4,784,097).
12
Appalachian Mountain Project Access has a network of approximately four hundred (400) primary care physicians and physician extender volunteers, and provided four thousand nine hundred t w e l v e (4,912) medical visits for uninsured adults during fiscal year 2015. Donated medical services have surpassed $41 million in cumulative donated care since AMPA opened in late 2007.
The Hamilton County Project Access network is comprised of approximately eight hundred eighty (880) physician and physician extender volunteers, and coordinated services for sixteen thousand (16,000) medical encounters in fiscal year 2014. Donated medical services have surpassed over $ 135.2 million since the program began in April 2004, including $12.2 million in services in FY 2014.
Knox County Project Access is comprised of one thousand two hundred sixty-six (1,266) physicians and physician extender volunteer providers and coordinated services for twenty-five thousand seven hundred ten (25,710) medical encounters in fiscal year 2015. Donated medical services have surpassed over $150 million since the program began in 2006.
Table 4: HealthCare Safety Net Medical Encounters by Provider Type FY2008 – FY2015
4. Access to Statewide Dental Services
Safety Net legislation and funding were intended to enable provision of primary care to TennCare dis-enrollees and was not intended to exceed the level of previous benefits (e.g., TennCare does not cover adult dental services). Access to dental services, particularly emergency extractions, was identified as an important service that Safety Net funding could support. And while there is no public mandate for the Department of Health to provide dental services, the Department strives to address oral health needs of vulnerable citizens and currently awards grants for the provision of emergency dental services to uninsured adults ages nineteen (19) to sixty-four (64). Both strategies are described below.
Tennessee Department of Health (TDH) provides support and operates preventive dental and adult dental services programs with supplemental funding from county governments, community partnerships, and other public and private agencies and organizations, many on part-time basis.
Local Health Departments 135,922 159,384 158,709 147,463 140,140 129,240 120,328 114,255 Local Health Departments designated as FQHCs 43,350 49,070 51,555 50,433 46,940 44,030 40,940 38,111 FQHCs (Non-LHD) 198,387 231,334 245,387 243,994 259,396 288,508 278,845 225,172 Community and Faith Based 185,500 162,141 172,656 184,678 199,586 186,680 216,533 158,522 TOTAL
563,159 601,929 628,307 626,568 646,062 519,218 656,646 536,060
FY2008 FY2009 FY2010 FY2011 FY2012 FY2013 FY2014 FY2015

13
• In forty nine (49) rural counties and one regional office, there are fifty (50) dental clinics located within the local public health departments of which the TDH has oversight. As of October 2015, there were forty-four (44) of the fifty (50) dental clinics staffed and open one (1) to five (5) days per week. The days and times that clinics are open is dependent upon location. All staffed clinics provided emergency dental care for adults in fiscal year 2015.
• The West Tennessee Regional Office Dental Clinic opened in March 2011 and provides comprehensive care to adults and children. Fourth year dental students from the University of Tennessee Health Sciences Center in Memphis rotate through the facility providing care to the underserved.
• Both the M a u r y & Montgomery County Health Department Dental Clinics expanded their scope of services in September 2013. The Maury Clinic provides comprehensive care to primary care adult patients of the health department. The Montgomery Clinic provides comprehensive care to a targeted diabetic adult population. Both Clinics provide comprehensive care to children and emergency care to adults. Fourth year dental students and dental residents from the Meharry Medical College School of Dentistry rotate through these facilities providing dental care to the underserved.
• Both Hamilton and Knox County provide emergency dental services to uninsured and
underinsured adults ages nineteen (19) to sixty-four (64) at their health departments. Metro Public Health Department in Davidson County provides adult emergency dental services at the Lentz Public Health Center. The Metro Public Health Department also coordinates services with the Matthew Walker Comprehensive Care Clinic to access additional adult emergency dental care.
• The Shelby County Health Department provides comprehensive dental services to patients less than twenty-one (21) years of age and adult emergency dental services. Referrals are made. Adults seeking non-emergency dental services are referred to full service dental clinics in the community.
• The Jackson-Madison County and Su l l i van Coun ty Health Departments do not currently have
dent a l c l i n ic s t o provide dental services.
As part of its Safety Net investments in recognition of the shortage of oral health care for the uninsured, the Tennessee Department of Health initiated a dental safety net program for emergency dental services for uninsured adults’ ages nineteen (19) to sixty-four (64) in 2008. Grants were awarded to seven (7) dental providers; emergency dental services (extractions) were provided to approximately three thousand two hundred eighty-five (3,285) uninsured adults in the first year. The shortage of oral health services and access to care issues has continued, if not increased since 2008. By fiscal year 2015, seventeen (17) grantees received emergency dental grant awards and provided eighteen thousand nine hundred thirty eight (18,938) extractions. In addition to the seventeen Safety Net Grantee(s) forty-four (44) of the staffed fifty (50) regional Health Department dental clinics, performed six thousand five hundred and thirty (6,530) adult dental emergency procedures in FY14-15.
14
3,285
6,381
18,016 18,778
22,464 20,569
17,982 18,938
0
5,000
10,000
15,000
20,000
25,000
FY2008 FY2009 FY2010 FY2011 FY2012 FY2013 FY2014 FY2015
Ext
ract
ions
Emergency Dental Extractions FY 2008 - FY2015
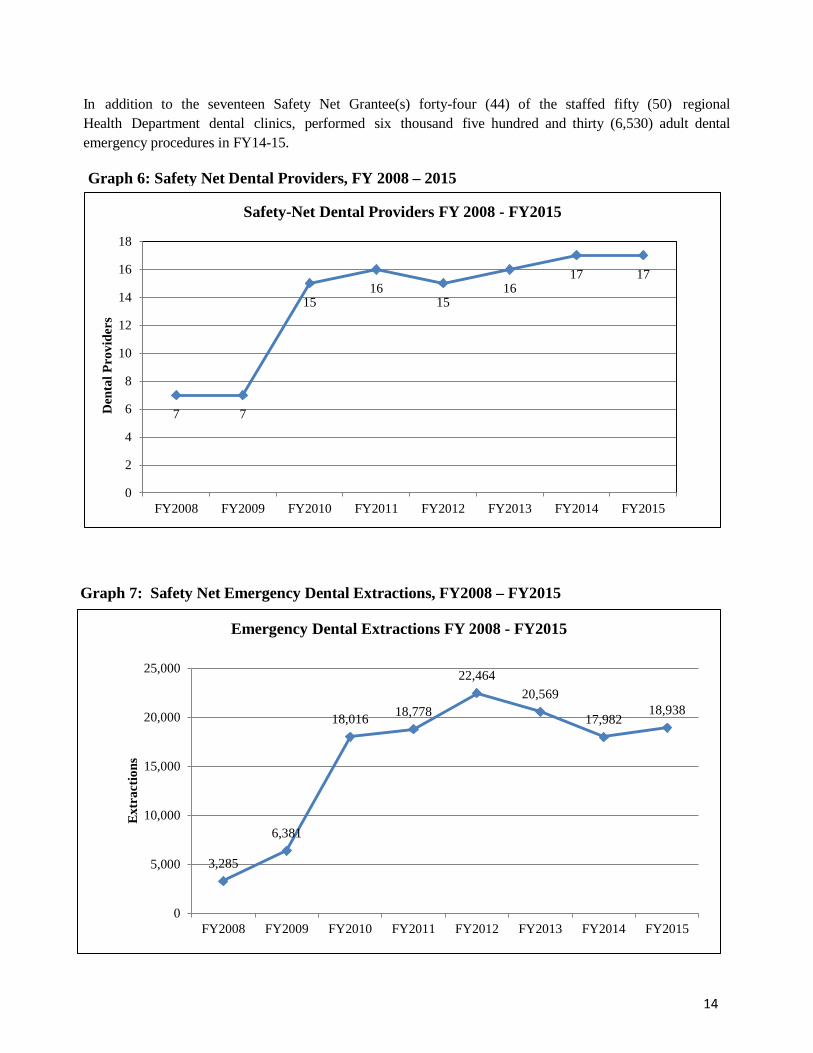
7 7
15 16
15 16
17 17
0
2
4
6
8
10
12
14
16
18
FY2008 FY2009 FY2010 FY2011 FY2012 FY2013 FY2014 FY2015
Den
tal P
rovi
ders
Safety-Net Dental Providers FY 2008 - FY2015
Graph 6: Safety Net Dental Providers, FY 2008 – 2015
In addition to the seventeen Safety Net Grantee(s) forty-four (44) of the staffed fifty (50) regional Health Department dental clinics, performed six thousand five hundred and thirty (6,530) adult dental emergency procedures in FY14-15.
Graph 7: Safety Net Emergency Dental Extractions, FY2008 – FY2015
15
B. Behavioral Health Safety Net of Tennessee 1. Program Background and Overview
In response to Tennessee Public Chapter No. 474 and Section 59 of the Tennessee Appropriations Act of 2005, the former Tennessee Department of Mental Health and Developmental Disabilities (TDMHDD), currently referred to as the Tennessee Department of Mental Health and Substance Abuse Services (TDMHSAS), created the Mental Health Safety Net (MHSN) to provide essential mental health services to the twenty one thousand (21,000) individuals identified as severely and /or persistently mentally ill (SPMI/SMI) of the one hundred ninety-one thousand (191,000) individuals who were dis-enrolled from the TennCare Program due to TennCare Reform. In July 2005, $11.5 million was appropriated to fund the MHSN, also referred to as Clinical Therapeutics and Recovery (CTR). The MHSN covered vital core mental health services for individuals identified as SPMI, helping them lead more functional and productive lives in their communities. The MHSN would not have been possible without the successful partnership between the TDMHSAS and the twenty (20) mental health agencies that agreed to be providers of services through the MHSN.
Individuals who were registered into the MHSN were eligible to receive mental health services such as assessment, evaluation, diagnostic and therapeutic sessions; case management, psychiatric medication management, lab services related to medication management; and pharmacy assistance and coordination. In addition to these services, funds were allocated to the Tennessee Department of Finance and Administration to provide prescription assistance through CoverRx (a state prescription assistance program). CoverRx provided discounts on generic and brand name drugs plus one atypical antipsychotic drug per month with a $5 co-pay. On March 1, 2010, due to fiscal mandates, CoverRx removed the brand name atypical antipsychotic drugs from the formulary but still provides access to some generic versions, if available. Currently, CoverRx offers over two hundred fifty (250) generic and brand name drugs with a $3, $5, or $8 co-pay. Each provider also has a Pharmacy Assistance Coordinator(s) who assists service recipients in applying for CoverRx and accessing brand drugs through Pharmaceutical Manufacturer’s Patient Assistance Programs.
On January 1, 2009, the TDMHSAS assumed full responsibility for the State Only program, the out-patient portion of the TennCare Partners initiative, which at the time was covering the provision of services to approximately twelve thousand (12,000) very low income Tennesseans diagnosed with SPMI. TDMHSAS staff examined various alternatives for provision of core mental health services and determined that the services offered through the MHSN would be the most appropriate for this population. Therefore, the MHSN and State Only programs were merged into a single program. This combined program was named the Behavioral Health Safety Net of Tennessee (BHSN of TN) and served the State Only out-patient population, as well as the original MHSN population. At this time, the BHSN of TN became eligibility based, and opened enrollment to all Tennesseans who met the eligibility criteria. To facilitate the implementation of the BHSN of TN with its expanded enrollment base, an additional $10 million was appropriated. There is no federal financial participation for BHSN of TN service recipients. The ability of TDMHSAS to cover services is dependent on annual appropriations by the legislature. Beginning July 1, 2009, the TDMHSAS agreed to offer three (3) BHSN of TN services to Daniels
16
Class dis-enrollees with Medicare and original MHSN individuals with Medicare who meet all other eligibility criteria except the age limit. The three (3) services offered were: Case Management; Medication Training and Support; and Clinically Related Group (CRG) Assessment, which were not covered by Medicare. These exception populations do NOT have access to CoverRx. Effective February 1, 2011, the CRG assessment was no longer being covered due to discontinuation as a tool used to determine eligibility. As a result of this change, only two (2) services were being offered: Case Management; and Medication Training and Support.
As of September 1, 2013, individuals who have Medicare Part B, and meet all other eligibility
requirements for the BHSN of TN may be enrolled. They are eligible only for the four (4) approved services: Case Management, Medication Training and Support, Peer Support and Psychosocial Rehabilitation Services.
During FY15, the BHSN of TN partnered with fifteen (15) Community Mental Health Agencies that provided vital behavioral health services to approximately thirty five thousand five hundred and ten (35,510) individuals across the state of Tennessee. The top three (3) services utilized were: Case Management; Office Visit for Evaluation and Pharmacological Management; and Individual Therapy.
C. Special Populations
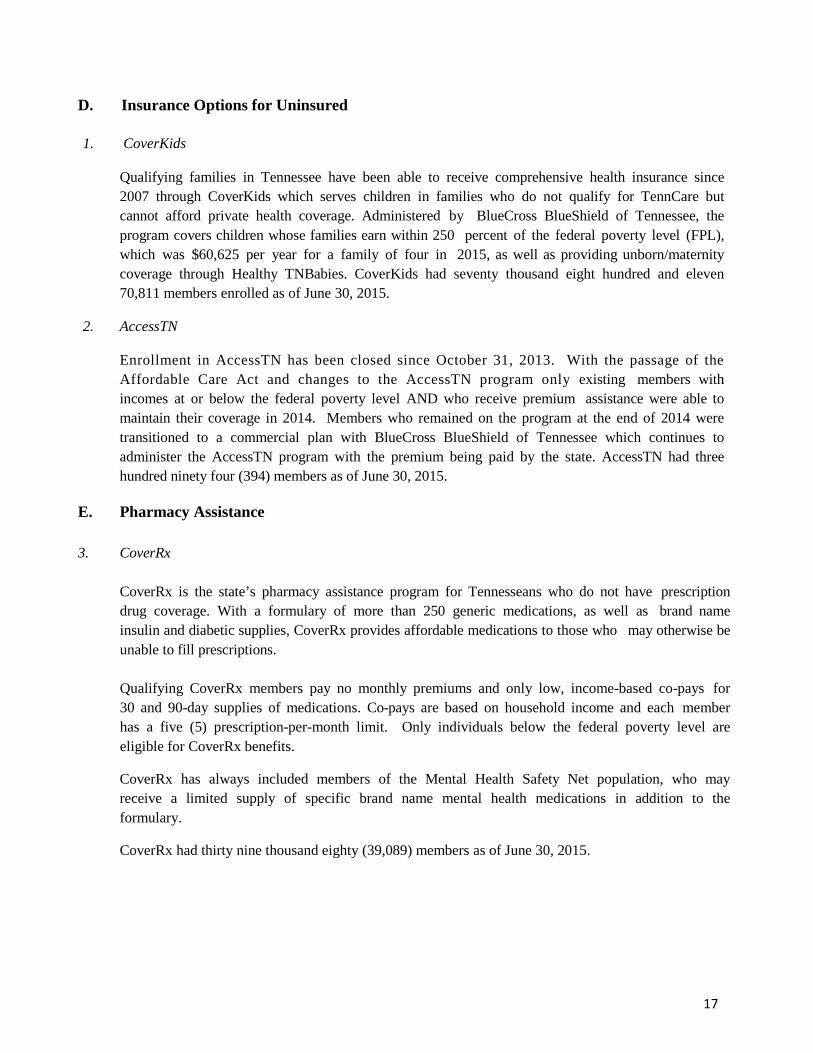
1. Ryan White Part B Funds The General Assembly has appropriated $7.2 million of recurring state funding to assist the Department of Health with providing HIV treatment for former TennCare clients and a growing population of uninsured low income clients. Initial safety net funding began in 2006 with an allocation of $1.2M. These funds have enabled the Department to provide health care services to almost 7,000 clients who received Ryan White Part B services. These funds, along with drug company rebates in 2014, have allowed the Department to continue serving all eligible individuals in a continuously growing state program with critical HIV medications and outpatient medical services through the HIV Centers of Excellence network of providers, including 3,980 unduplicated clients receiving assistance through the Insurance Assistance Program and 3,314 unduplicated clients who received medications through the HIV Drug Assistance Program. The Centers of Excellence clinics consist of a coordinated network of clinics and private practitioners across the State, which provides a comprehensive approach to AIDS and HIV therapy at thirteen locations including five health departments. Life-saving treatment is provided to some of the State’s most vulnerable populations; many would go without treatment and care if state funds were unavailable to supplement federal funds for the program. Annual ADAP Enrollment and Growth
17
D. Insurance Options for Uninsured
1. CoverKids
Qualifying families in Tennessee have been able to receive comprehensive health insurance since 2007 through CoverKids which serves children in families who do not qualify for TennCare but cannot afford private health coverage. Administered by BlueCross BlueShield of Tennessee, the program covers children whose families earn within 250 percent of the federal poverty level (FPL), which was $60,625 per year for a family of four in 2015, as well as providing unborn/maternity coverage through Healthy TNBabies. CoverKids had seventy thousand eight hundred and eleven 70,811 members enrolled as of June 30, 2015.
2. AccessTN
Enrollment in AccessTN has been closed since October 31, 2013. With the passage of the Affordable Care Act and changes to the AccessTN program only existing members with incomes at or below the federal poverty level AND who receive premium assistance were able to maintain their coverage in 2014. Members who remained on the program at the end of 2014 were transitioned to a commercial plan with BlueCross BlueShield of Tennessee which continues to administer the AccessTN program with the premium being paid by the state. AccessTN had three hundred ninety four (394) members as of June 30, 2015.
E. Pharmacy Assistance
3. CoverRx CoverRx is the state’s pharmacy assistance program for Tennesseans who do not have prescription drug coverage. With a formulary of more than 250 generic medications, as well as brand name insulin and diabetic supplies, CoverRx provides affordable medications to those who may otherwise be unable to fill prescriptions.
Qualifying CoverRx members pay no monthly premiums and only low, income-based co-pays for 30 and 90-day supplies of medications. Co-pays are based on household income and each member has a five (5) prescription-per-month limit. Only individuals below the federal poverty level are eligible for CoverRx benefits.
CoverRx has always included members of the Mental Health Safety Net population, who may receive a limited supply of specific brand name mental health medications in addition to the formulary.
CoverRx had thirty nine thousand eighty (39,089) members as of June 30, 2015.
18
III. SUMMARY The Tennessee Department of Health has assessed the state of the healthcare safety net in
Tennessee and evaluated “the array of services, adequacy of services, and access to care.” The assessment shows a comprehensive approach using multiple approaches to assure access for healthcare safety net services the approaches rely on strong collaborative efforts among state, public/private, not-for-profit and for-profit sectors.
Safety Net appropriations have proven invaluable to hundreds of thousands of Tennesseans caught in a changing health care landscape of hospital closures, changes in availability, cost and coverage of insurance products, and continuing shortages of primary care in selected communities. Attachment One (1) of this report documents the shortage situation across the state. Access to primary care and care coordination services is pivotal to restraining the cost of expensive emergency care. The TDH contracting mechanism with provider organizations already in communities is an efficient means of assuring this care.
Attachment One (1) of this report provides statewide pictures of the most current overview available
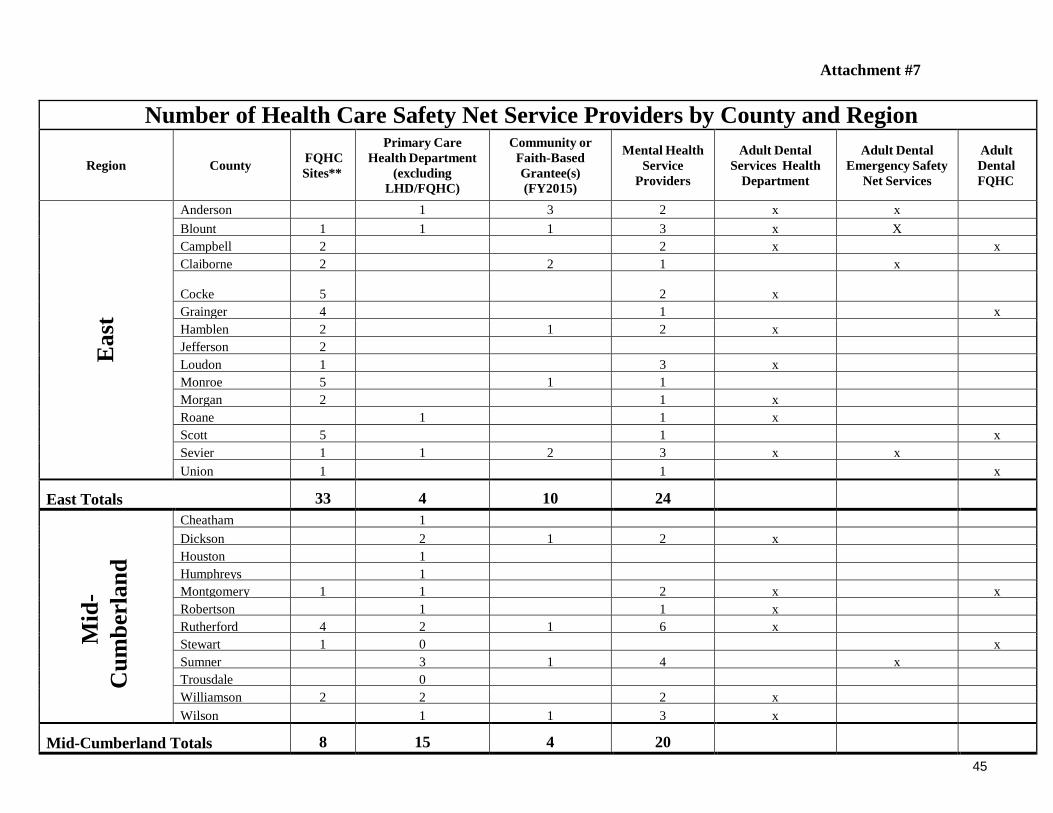
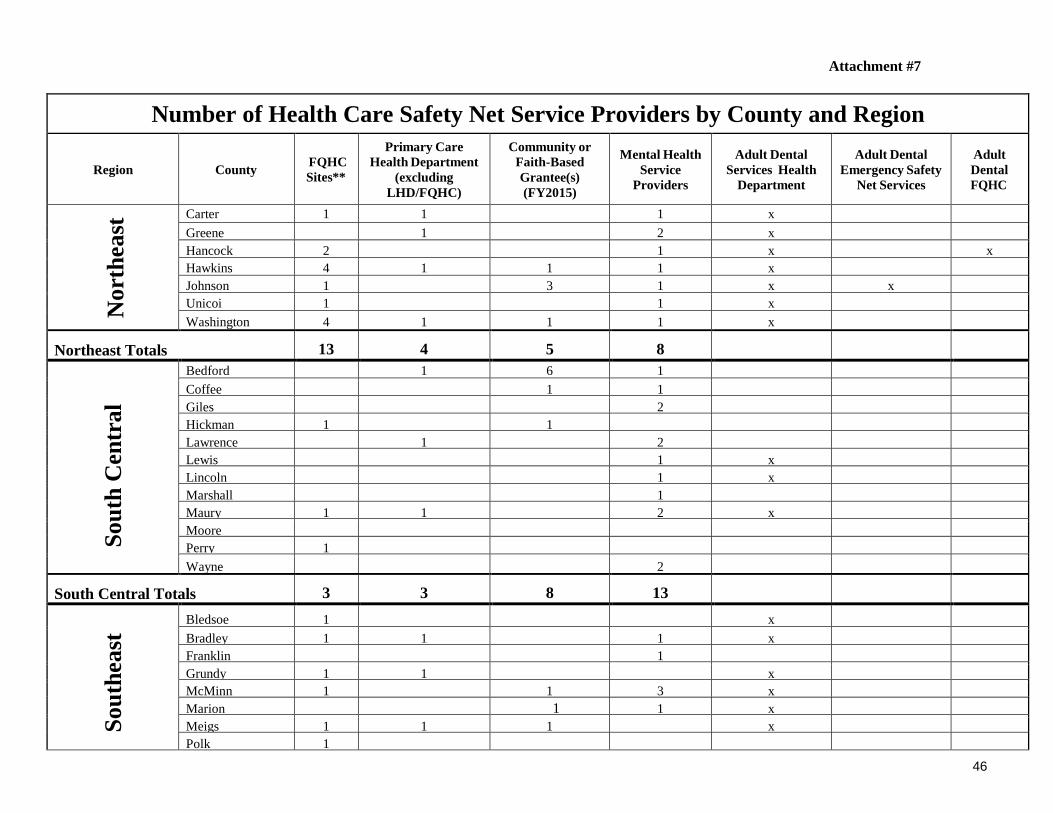
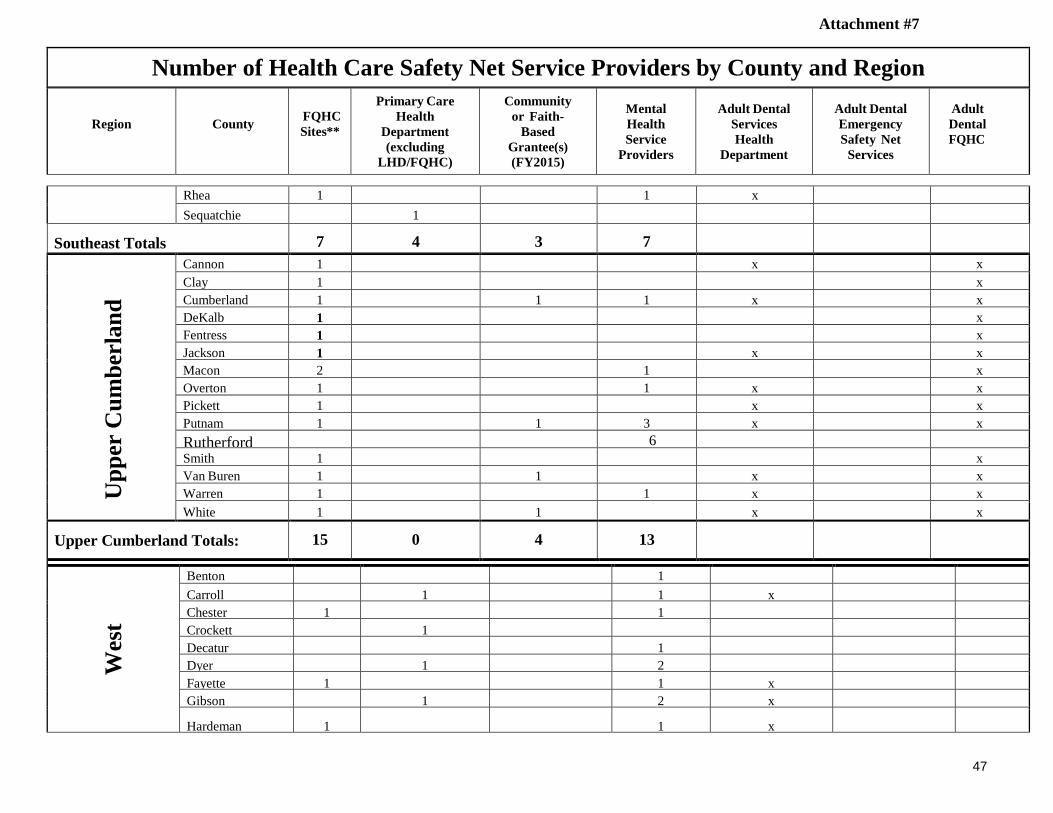
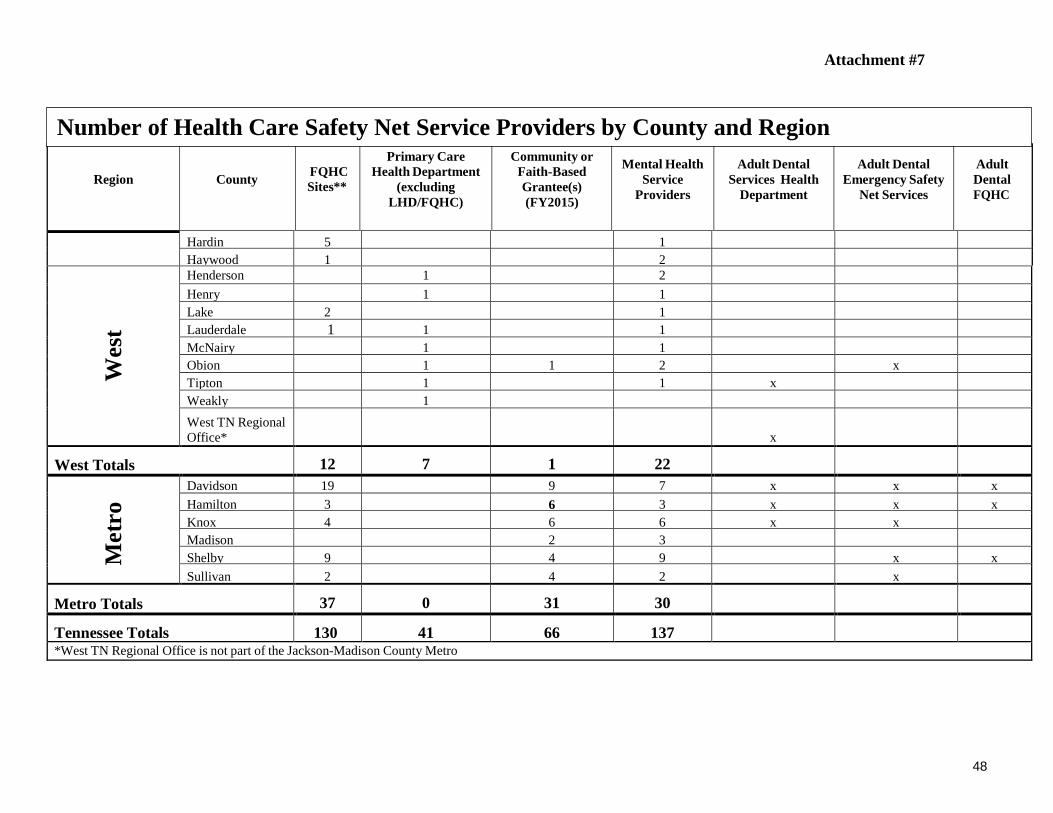
by county of the Federal Health Professional Shortage Areas (HPSA) for Primary Care, Dental Health, and Mental Health. Attachment Number 3 provides a table showing Unduplicated Department of Health Dental Patients and Visits by Region and County. Attachments Four (4), Five (5), and Six (6) are buffer maps showing accessibility of primary care services within a thirty (30) mile radius at local health departments, federally qualified health centers, and safety net primary care sites. Attachment Seven (7) is a table of healthcare safety net service provision delineated by region and county including FQHC sites, health departments offering primary care services, faith-based or community-based grantees, mental health service providers, adult dental services through the health departments, adult dental emergency safety net sites, and adult dental services available at FQHCs.

19
Attachment #1
20
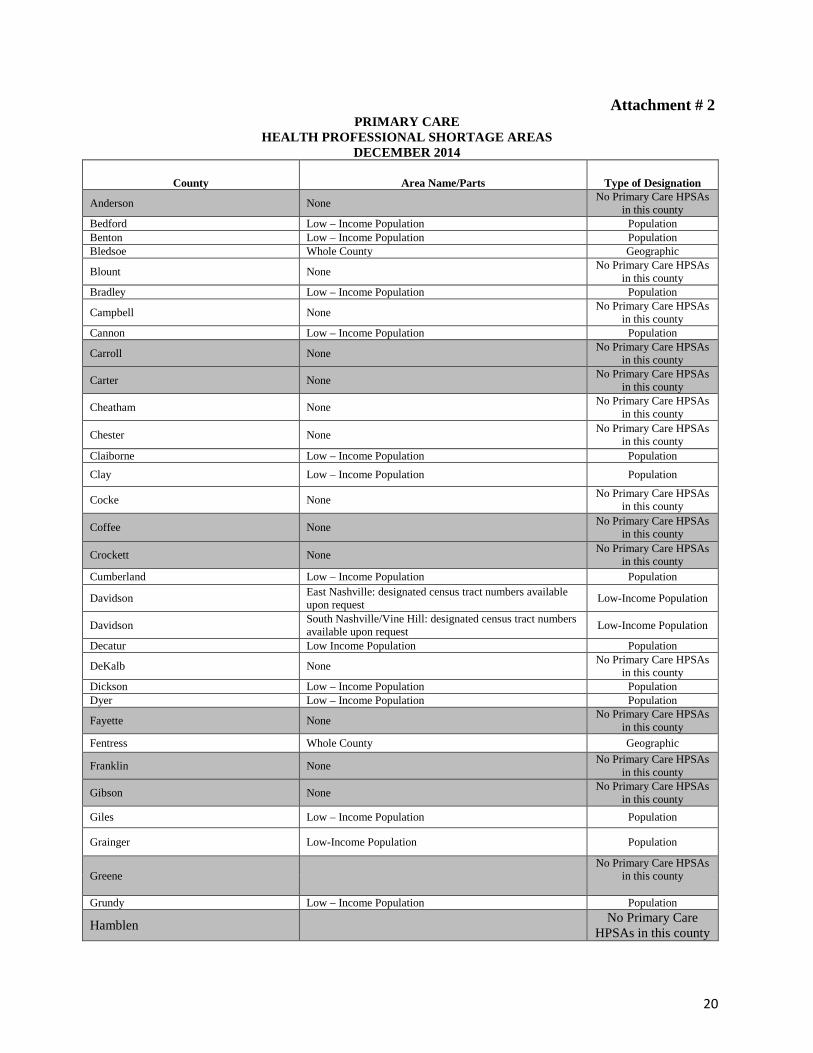
Attachment # 2 PRIMARY CARE
HEALTH PROFESSIONAL SHORTAGE AREAS DECEMBER 2014
County Area Name/Parts Type of Designation
Anderson None No Primary Care HPSAs in this county
Bedford Low – Income Population Population Benton Low – Income Population Population Bledsoe Whole County Geographic
Blount None No Primary Care HPSAs in this county
Bradley Low – Income Population Population
Campbell None No Primary Care HPSAs in this county
Cannon Low – Income Population Population
Carroll None No Primary Care HPSAs in this county
Carter None No Primary Care HPSAs in this county
Cheatham None No Primary Care HPSAs in this county
Chester None No Primary Care HPSAs in this county
Claiborne Low – Income Population Population
Clay Low – Income Population Population
Cocke None No Primary Care HPSAs in this county
Coffee None No Primary Care HPSAs in this county
Crockett None No Primary Care HPSAs in this county
Cumberland Low – Income Population Population
Davidson East Nashville: designated census tract numbers available upon request Low-Income Population
Davidson South Nashville/Vine Hill: designated census tract numbers available upon request Low-Income Population
Decatur Low Income Population Population
DeKalb None No Primary Care HPSAs in this county
Dickson Low – Income Population Population Dyer Low – Income Population Population
Fayette None No Primary Care HPSAs in this county
Fentress Whole County Geographic
Franklin None No Primary Care HPSAs in this county
Gibson None No Primary Care HPSAs in this county
Giles Low – Income Population Population
Grainger Low-Income Population Population
Greene No Primary Care HPSAs
in this county
Grundy Low – Income Population Population
Hamblen No Primary Care HPSAs in this county

21
Attachment #2 PRIMARY CARE
HEALTH PROFESSIONAL SHORTAGE AREAS DECEMBER 2014
County Area Name/Parts Type of Designation Hamilton None No Primary Care HPSAs in this county Hancock Whole County Geographic Hardeman Whole County Geographic Hardin Low-Income Population Population Hawkins Low-Income Population Population
Low – Income Population Population
Haywood Whole County Geographic Henry None No Primary Care HPSAs in this county Hickman Whole County Geographic
Houston Low – Income Population Population
Humphreys Low – Income Population Population
Jackson Whole County Geographic, No Primary Care HPSAs in this
county
Jefferson None
No Primary Care HPSAs in this county
Johnson Whole County Geographic Knox East Knoxville: designated census tract numbers available upon request Low-Income Population Lake Whole County Geographic Lauderdale Whole County Geographic Lawrence Low – Income Population Population Lewis Whole County Geographic Lincoln None No Primary Care HPSAs in this county Loudon None No Primary Care HPSAs in this county Macon Low –Income Population Population Madison East Jackson: designated census tract numbers available upon request Geographic Area Marion None No Primary Care HPSAs in this county Marshall Low – Income Population Population Maury None No Primary Care HPSAs in this county McMinn Low – Income Population Population McNairy Low – Income Population Population Meigs Low – Income Population Population Monroe None No Primary Care HPSAs in this county Montgomery Low-Income Population Population Moore Low – Income Population Population Morgan Whole County Geographic Obion Low – Income Population (Obion/Weakley) Population Overton Low – Income Population Population Perry Low – Income Population Population Pickett None No Primary Care HPSAs in this county Polk Low – Income Population Population Putnam Low – Income Population (Putnam/White) Population

22
Attachment #2
PRIMARY CARE HEALTH PROFESSIONAL SHORTAGE AREAS
DECEMBER 2014
*Counties highlighted in gray have no HPSA Source: Bureau of Health Professions, Health Resources and Services Administration, National Center for Health Workforce Analysis, U.S. Department of Health and Human Services
County
Area Name/Parts Type of Designation
Rhea Low – Income Population Population Roane Low – Income Population Population Robertson None No Primary Care HPSAs in this county
Rutherford None No Primary CareHPSAs in this county
Scott None No Primary Care HPSAs in this county
Sequatchie Low-Income Population Population
Sevier Low-Income Population Population
Shelby Frayser/Raleigh: designated census tract numbers available upon request Population
Shelby Southwest Memphis: designated census tract numbers available upon request
Population
Shelby Parkway Village/Fox Meadows: designated census tract numbers available upon request
Population
Stewart Whole County Geographic
Sullivan None No Primary Care HPSAs in this county
Sumner None No Primary Care Primary Care HPSAs in this
county
Tipton None No Primary Care HPSAs in this county
Trousdale Low-Income Population Population
Unicoi None No Primary Care HPSAs in this county
Union Whole County Geographic
Van Buren Low – Income Population Population
Warren Low – Income Population Population
Washington None No Primary Care HPSAs in this county
Wayne Low – Income Population Population
Weakley Low – Income Population (Obion / Weakley) Population
White Low – Income Population (Putnam/White) Population
Williamson None No Primary Care HPSAs in this county
Wilson None No Primary Care HPSAs in this county

23
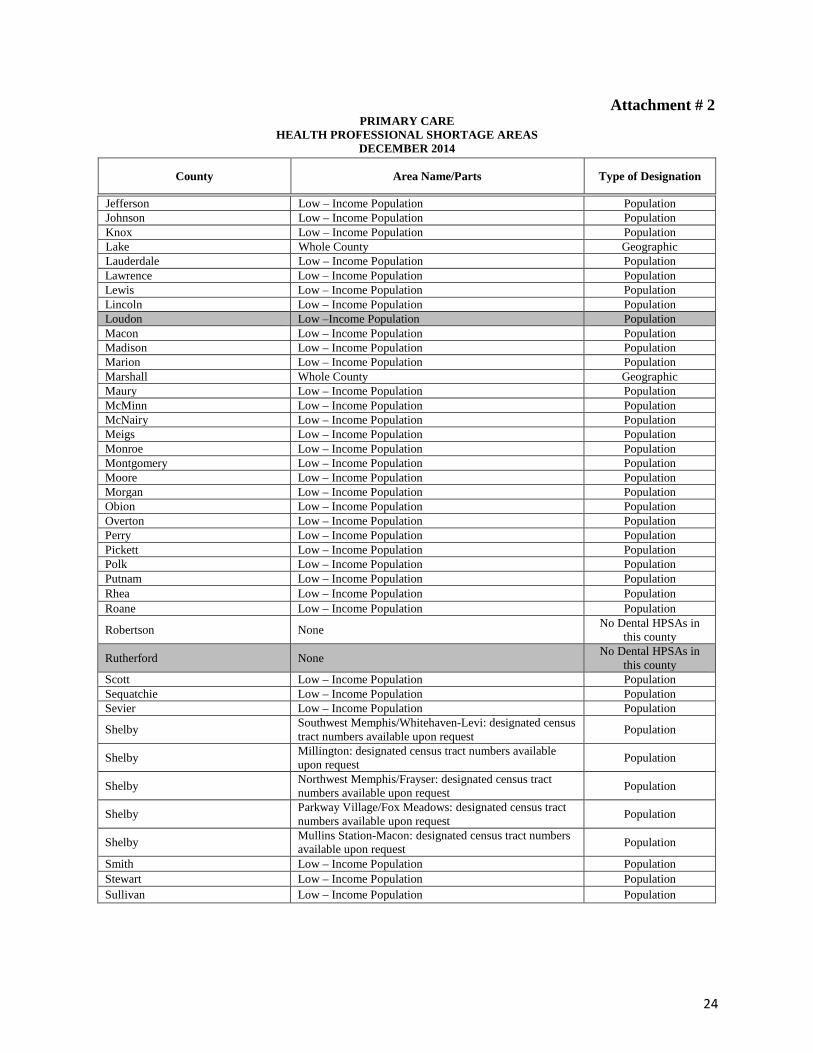
Attachment # 2 PRIMARY CARE
HEALTH PROFESSIONAL SHORTAGE AREAS DECEMBER 2014
County Area Name/Parts Type of Designation
Anderson Low – Income Population Population Bedford Low – Income Population Population Benton Low – Income Population Population Bledsoe Low – Income Population Population Blount Low – Income Population Population Bradley Low – Income Population Population Campbell Low – Income Population Population Cannon Low – Income Population Population Carroll Low – Income Population Population Carter Low – Income Population Population Cheatham None No Dental HPSAs in this county Chester Low – Income Population Population Claiborne Low – Income Population Population Clay Low – Income Population Population Cocke Low – Income Population Population Coffee Low – Income Population Population Crockett Low – Income Population Population Cumberland Low – Income Population Population Davidson Bordeaux/Inglewood: designated census tract numbers available upon request Geographic Area Davidson South Nashville/Vine Hill: designated census tract numbers available upon request Geographic Area Decatur Low – Income Population Population DeKalb Low – Income Population Population Dickson Low – Income Population Population Dyer Low – Income Population Population Fayette Low – Income Population Population Fentress Low – Income Population Population Franklin Low – Income Population Population Gibson Low – Income Population Population Giles Low – Income Population Population Grainger Low – Income Population Population Greene Low – Income Population Population Grundy Whole County Geographic Hamblen Low – Income Population Population Hamilton Chattanooga/East Ridge: designated census tract numbers available upon request Population Hamilton North Chattanooga: designated census tract numbers available upon request Population Hancock Whole County Geographic Hardeman Low – Income Population Population Hardin Low – Income Population Population Hawkins Low – Income Population Population Haywood Low – Income Population Population Henderson Low – Income Population Population Henry Low – Income Population Population Hickman Low – Income Population Population Houston Low – Income Population Population Humphreys Low – Income Population Population Jackson Low – Income Population Population
*Counties highlighted in gray have no HPSAs
Source: Bureau of Health Professions, Health Resources and Services Administration, National Center for Health Workforce Analysis, U.S. Department of Health and Human Services
24
Attachment # 2 PRIMARY CARE
HEALTH PROFESSIONAL SHORTAGE AREAS DECEMBER 2014
County Area Name/Parts Type of Designation
Jefferson Low – Income Population Population Johnson Low – Income Population Population Knox Low – Income Population Population Lake Whole County Geographic Lauderdale Low – Income Population Population Lawrence Low – Income Population Population Lewis Low – Income Population Population Lincoln Low – Income Population Population Loudon Low –Income Population Population Macon Low – Income Population Population Madison Low – Income Population Population Marion Low – Income Population Population Marshall Whole County Geographic Maury Low – Income Population Population McMinn Low – Income Population Population McNairy Low – Income Population Population Meigs Low – Income Population Population Monroe Low – Income Population Population Montgomery Low – Income Population Population Moore Low – Income Population Population Morgan Low – Income Population Population Obion Low – Income Population Population Overton Low – Income Population Population Perry Low – Income Population Population Pickett Low – Income Population Population Polk Low – Income Population Population Putnam Low – Income Population Population Rhea Low – Income Population Population Roane Low – Income Population Population
Robertson None No Dental HPSAs in this county
Rutherford None No Dental HPSAs in this county
Scott Low – Income Population Population Sequatchie Low – Income Population Population Sevier Low – Income Population Population
Shelby Southwest Memphis/Whitehaven-Levi: designated census tract numbers available upon request Population
Shelby Millington: designated census tract numbers available upon request Population
Shelby Northwest Memphis/Frayser: designated census tract numbers available upon request Population
Shelby Parkway Village/Fox Meadows: designated census tract numbers available upon request Population
Shelby Mullins Station-Macon: designated census tract numbers available upon request Population
Smith Low – Income Population Population Stewart Low – Income Population Population Sullivan Low – Income Population Population

25
Attachment #2 DENTAL
HEALTH PROFESSIONAL SHORTAGE AREAS DECEMBER 2014
County Area Name/Parts Type of Designation
Sumner None No Dental HPSAs in this county
Tipton Population Trousdale Low – Income Population Population
Unicoi Low – Income Population Population Union Low – Income Population Population
Van Buren Low – Income Population Population Warren Low – Income Population Population
Washington Low – Income Population Population Wayne Low – Income Population Population

26
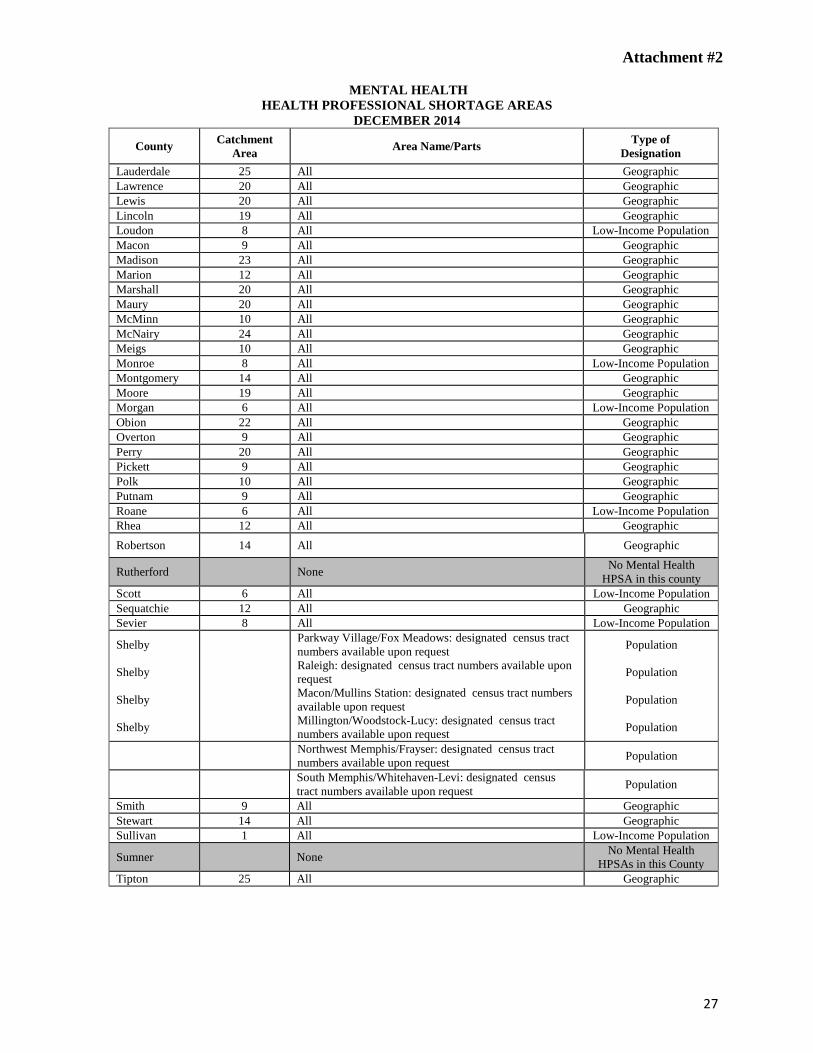
Attachment #2
MENTAL HEALTH HEALTH PROFESSIONAL SHORTAGE AREAS
DECEMBER 2014
County Catchment Area Area Name/Parts Type of
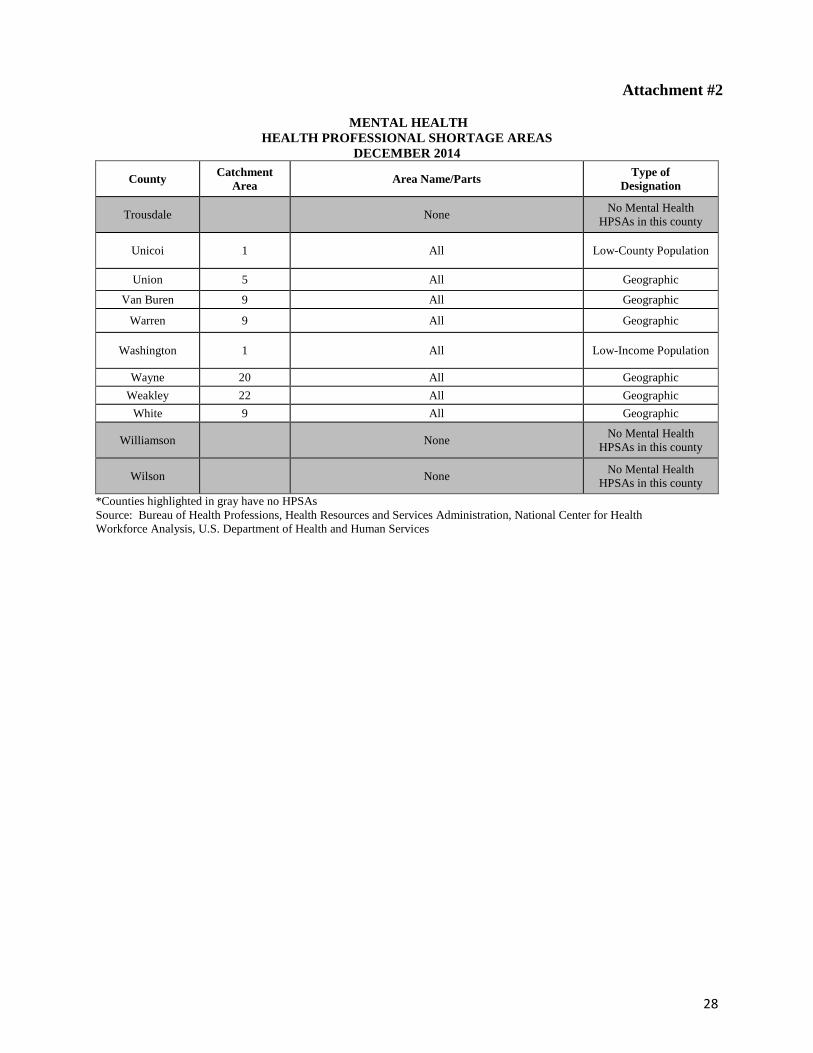
Designation Anderson 6 All Low-Income Population Bedford 19 All Geographic Benton 21 All Geographic Bledsoe 12 All Geographic Blount 8 All Low-Income Population Bradley 10 All Geographic Campbell 6 All Low-Income Population Cannon 9 All Geographic Carroll 21 All Geographic Carter 1 All Low-Income Population Cheatham 14 All Geographic Chester 24 All Geographic Claiborne 5 All Geographic Clay 9 All Geographic Cocke 5 All Geographic Coffee 19 All Geographic Crockett 22 All Geographic Cumberland 9 All Geographic Davidson All Low-Income Population Decatur 24 All Geographic DeKalb 9 All Geographic Dickson 14 All Geographic Dyer 22 All Geographic Fayette 25 All Geographic Fentress 9 All Geographic Franklin 19 All Geographic Gibson 21 All Geographic Giles 20 All Geographic Grainger 5 All Geographic Greene 4 All Geographic Grundy 12 All Geographic Hamblen 5 All Geographic Hamilton All Low-Income Population Hancock 4 All Geographic Hardeman 24 All Geographic Hardin 24 All Geographic Hawkins 4 All Geographic Haywood 23 All Geographic Henderson 23 All Geographic Henry 21 All Geographic Hickman 20 All Geographic Houston 14 All Geographic Humphreys 14 All Geographic Jackson 9 All Geographic Jefferson 5 All Geographic Johnson 1 All Low-Income Population
Knox All Low-Income Population
Lake 22 All Geographic
27
Attachment #2
MENTAL HEALTH HEALTH PROFESSIONAL SHORTAGE AREAS
DECEMBER 2014
County Catchment Area Area Name/Parts Type of
Designation Lauderdale 25 All Geographic Lawrence 20 All Geographic Lewis 20 All Geographic Lincoln 19 All Geographic Loudon 8 All Low-Income Population Macon 9 All Geographic Madison 23 All Geographic Marion 12 All Geographic Marshall 20 All Geographic Maury 20 All Geographic McMinn 10 All Geographic McNairy 24 All Geographic Meigs 10 All Geographic Monroe 8 All Low-Income Population Montgomery 14 All Geographic Moore 19 All Geographic Morgan 6 All Low-Income Population Obion 22 All Geographic Overton 9 All Geographic Perry 20 All Geographic Pickett 9 All Geographic Polk 10 All Geographic Putnam 9 All Geographic Roane 6 All Low-Income Population Rhea 12 All Geographic Robertson 14 All Geographic
Rutherford None No Mental Health HPSA in this county
Scott 6 All Low-Income Population Sequatchie 12 All Geographic Sevier 8 All Low-Income Population
Shelby Shelby Shelby Shelby
Parkway Village/Fox Meadows: designated census tract numbers available upon request Raleigh: designated census tract numbers available upon request Macon/Mullins Station: designated census tract numbers available upon request Millington/Woodstock-Lucy: designated census tract numbers available upon request
Population
Population
Population
Population
Northwest Memphis/Frayser: designated census tract numbers available upon request Population
South Memphis/Whitehaven-Levi: designated census tract numbers available upon request Population
Smith 9 All Geographic Stewart 14 All Geographic Sullivan 1 All Low-Income Population
Sumner None No Mental Health HPSAs in this County
Tipton 25 All Geographic
28
Attachment #2
MENTAL HEALTH HEALTH PROFESSIONAL SHORTAGE AREAS
DECEMBER 2014
County Catchment Area Area Name/Parts Type of
Designation
Trousdale None No Mental Health HPSAs in this county
Unicoi 1 All Low-County Population
Union 5 All Geographic
Van Buren 9 All Geographic
Warren 9 All Geographic
Washington 1 All Low-Income Population
Wayne 20 All Geographic Weakley 22 All Geographic
White 9 All Geographic
Williamson None No Mental Health HPSAs in this county
Wilson None No Mental Health HPSAs in this county
*Counties highlighted in gray have no HPSAs Source: Bureau of Health Professions, Health Resources and Services Administration, National Center for Health Workforce Analysis, U.S. Department of Health and Human Services

29
Attachment #2
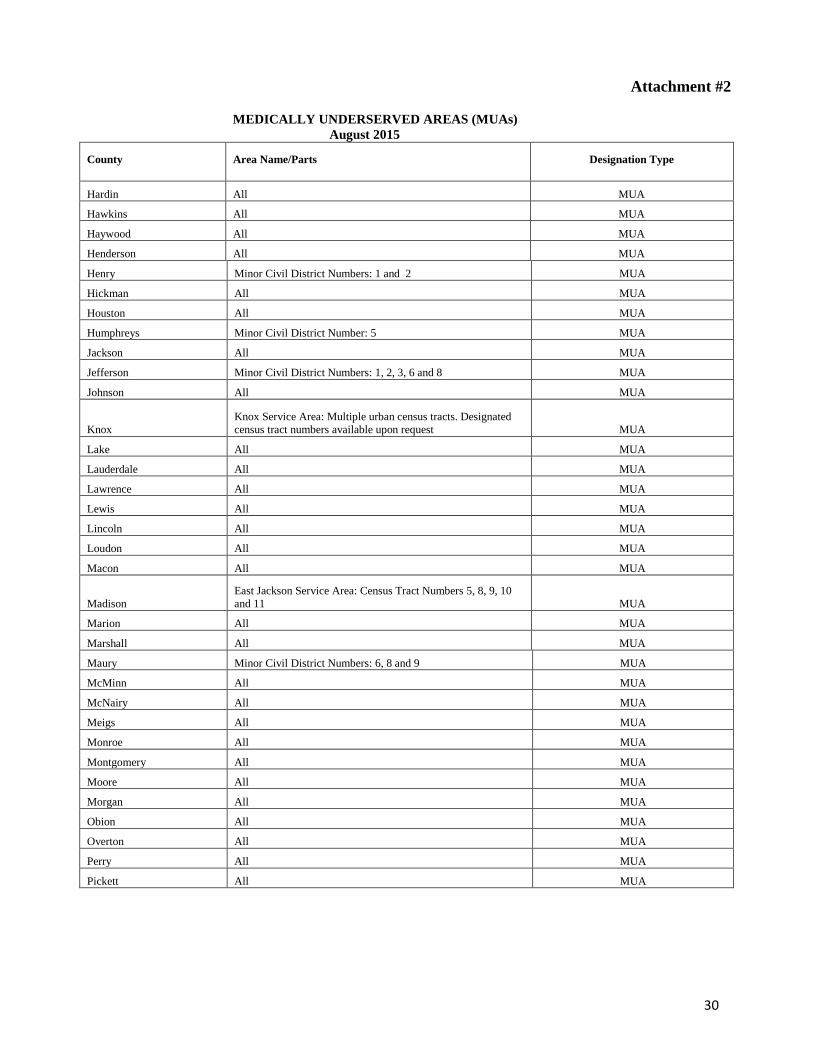
MEDICALLY UNDERSERVED AREAS (MUAs) August 2015
County Area Name/Parts Designation Type
Anderson Census Tract Numbers: 207,208,210,212.01 and 212.02 MUA
Bedford All MUA Benton All MUA Bledsoe All MUA
Blount Census Tract Numbers: 101, 105, 108, 112, 113, 114, and 116.02 MUA
Bradley Minor Civil District Numbers: 3, 5, 6 and 7 MUA Campbell All MUA Cannon All MUA Carroll All MUA Carter All MUA Cheatham All MUA Chester All MUA Claiborne All MUA Clay All MUA Cocke All MUA
Coffee Minor Civil District Numbers: 1, 2, 3, 4, 5, 7, 8, 9, 10, 11, 12 and 13 MUA
Crockett All MUA Cumberland All MUA
Davidson
Davidson Service Area: Multiple urban census tracts. Designated census tract numbers available upon request MUA
Davidson
Bordeaux/Inglewood Service Area: Multiple urban census tracts. Designated census tract numbers available upon request MUA
Decatur All MUA DeKalb All MUA Dickson Minor Civil District Number: 4 MUA Dyer Minor Civil Districts Numbers: 2, 4 and 5 MUA Fayette All MUA Fentress All MUA Franklin All MUA Gibson All MUA Giles All MUA Grainger All MUA Greene Minor Civil Districts Numbers: 1, 2, 3, 4 and 5 MUA Grundy All MUA Hamblen Minor Civil District Number: 9 MUA
Hamilton
Hamilton Service Area: Multiple urban census tracts. Designated census tract numbers available upon request MUA
Hancock All MUA Hardeman All MUA
30
Attachment #2
MEDICALLY UNDERSERVED AREAS (MUAs) August 2015
County Area Name/Parts Designation Type
Hardin All MUA
Hawkins All MUA
Haywood All MUA
Henderson All MUA
Henry Minor Civil District Numbers: 1 and 2 MUA
Hickman All MUA
Houston All MUA
Humphreys Minor Civil District Number: 5 MUA
Jackson All MUA
Jefferson Minor Civil District Numbers: 1, 2, 3, 6 and 8 MUA
Johnson All MUA
Knox Knox Service Area: Multiple urban census tracts. Designated census tract numbers available upon request MUA
Lake All MUA
Lauderdale All MUA
Lawrence All MUA
Lewis All MUA
Lincoln All MUA
Loudon All MUA
Macon All MUA
Madison East Jackson Service Area: Census Tract Numbers 5, 8, 9, 10 and 11 MUA
Marion All MUA
Marshall All MUA
Maury Minor Civil District Numbers: 6, 8 and 9 MUA
McMinn All MUA
McNairy All MUA
Meigs All MUA
Monroe All MUA
Montgomery All MUA
Moore All MUA
Morgan All MUA
Obion All MUA
Overton All MUA
Perry All MUA
Pickett All MUA

31
Attachment #2
MEDICALLY UNDERSERVED AREAS (MUAs) August 2015
County Area Name/Parts Designation Type
Polk Minor Civil District Number: 3 MUA Putnam Minor Civil District Numbers: 4 and 8 MUA Rhea All MUA Roane All MUA Robertson All MUA Rutherford Minor Civil District Number: 6 MUA Scott All MUA Sequatchie All MUA Sevier Minor Civil District Numbers: 1, 3, 4, 5, 7 and 10 MUA
Shelby Northwest Memphis Service Area: Multiple urban census tracts. Designated census tract numbers available upon request MUA
Shelby Southeast Memphis Service Area: Multiple urban census tracts. Designated census tract numbers available upon request MUA
Shelby Shelby County Service Area: Multiple urban census tracts. Designated census tract numbers available upon request MUA
Smith Minor Civil District Number: 8 MUA Stewart All MUA Sullivan None No MUA in this county
Sumner Census Tract Numbers: 201, 202.01, 202.02, 203, 207 and 208 MUA Tipton All MUA Trousdale All MUA Unicoi All MUA Union All MUA Van Buren All MUA Warren All MUA Washington Minor Civil District Numbers: 5, 8 and 9 MUA
Wayne All MUA Weakley All MUA White All MUA Williamson Minor Civil District Numbers: 2 and 3 MUA Wilson All MUA
Source: Bureau of Health Professions, Health Resources and Services Administration, National Center for Health Workforce Analysis, U.S Department of Health and Human Services

32
Attachment #3
FY 13-14 & FY 14 - FY 15 County Health Departments Adult Dental Data by Region* FY 13-14 FY 14 -15 FY 13-14 FY 14 - 15 HD Type
Adult Dental Patients Adult Dental Patients Adult Dental Visits
Adult Dental Visits
Rurals 1 - Northeast 1,267 707 1,765 873 2 - East Tennessee 678 682 908 909 3 - Southeast 309 416 350 585 4 - Upper
Cumberland 106 81 109 88
5 - Mid Cumberland 1,287 1,454 2,595 3,074 6 - South Central 628 717 1,601 1,515 7 - West 2,008 2,334 4,014 4,836 Totals: 6,283 6,391 11,342 11,880 Metros Knox 1,952 932 3,778 2,151
Davidson** 118 203 180 320 Hamilton 315 274 355 366 Shelby*** 0 0 0 0 Totals: 2,385 1,409 4,313 2,837 State Totals: 8,668 7,800 15,655 14,717
*Data reported is based upon adults defined as 21 years of age and older. ** The Metro Public Health Department provides adult dental emergency services at the Lentz Dental Clinic. They also coordinate services with the Matthew Walker Clinic to access additional adult emergency dental care.
***Data not entered into State Health Department’s statistical tracking system (PTBMIS).
40
Attachment 3
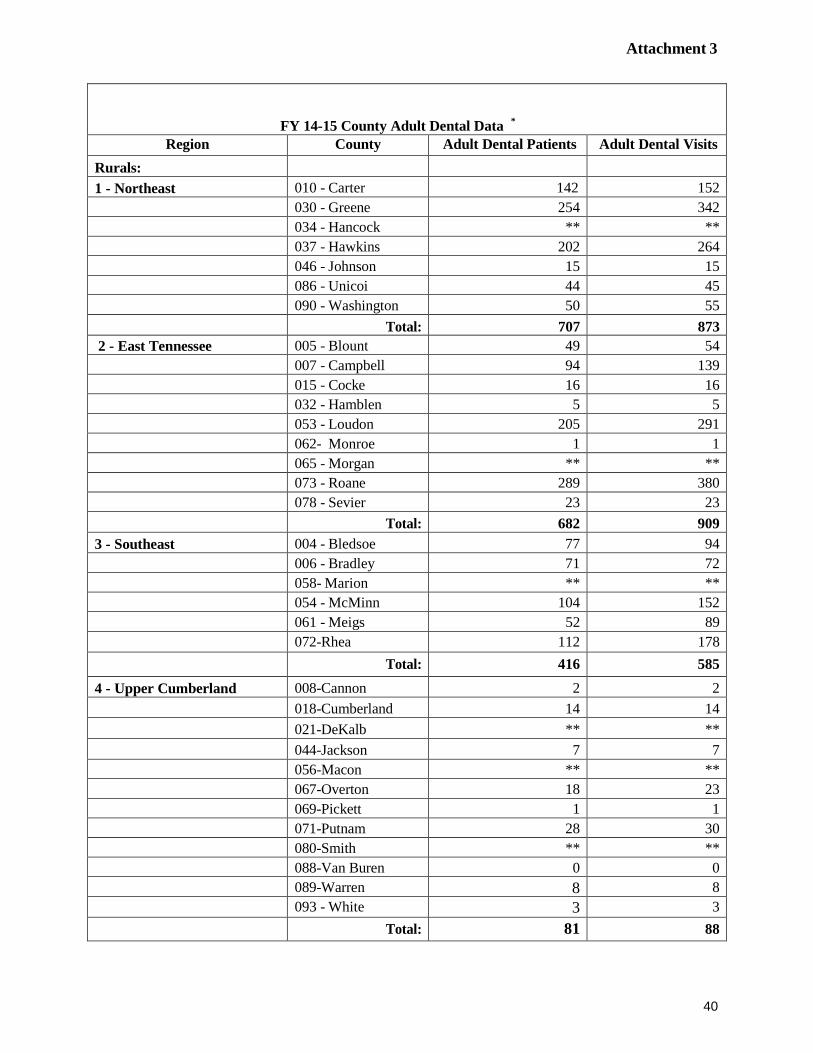
FY 14-15 County Adult Dental Data * Region County Adult Dental Patients Adult Dental Visits
Rurals: 1 - Northeast 010 - Carter 142 152
030 - Greene 254 342 034 - Hancock ** ** 037 - Hawkins 202 264 046 - Johnson 15 15 086 - Unicoi 44 45 090 - Washington 50 55 Total: 707 873
2 - East Tennessee 005 - Blount 49 54 007 - Campbell 94 139 015 - Cocke 16 16 032 - Hamblen 5 5 053 - Loudon 205 291 062- Monroe 1 1 065 - Morgan ** ** 073 - Roane 289 380 078 - Sevier 23 23 Total: 682 909 3 - Southeast 004 - Bledsoe 77 94
006 - Bradley 71 72 058- Marion ** ** 054 - McMinn 104 152 061 - Meigs 52 89 072-Rhea 112 178 Total: 416 585 4 - Upper Cumberland 008-Cannon 2 2
018-Cumberland 14 14 021-DeKalb ** ** 044-Jackson 7 7 056-Macon ** ** 067-Overton 18 23 069-Pickett 1 1 071-Putnam 28 30 080-Smith ** ** 088-Van Buren 0 0 089-Warren 8 8 093 - White 3 3 Total: 81 88
41
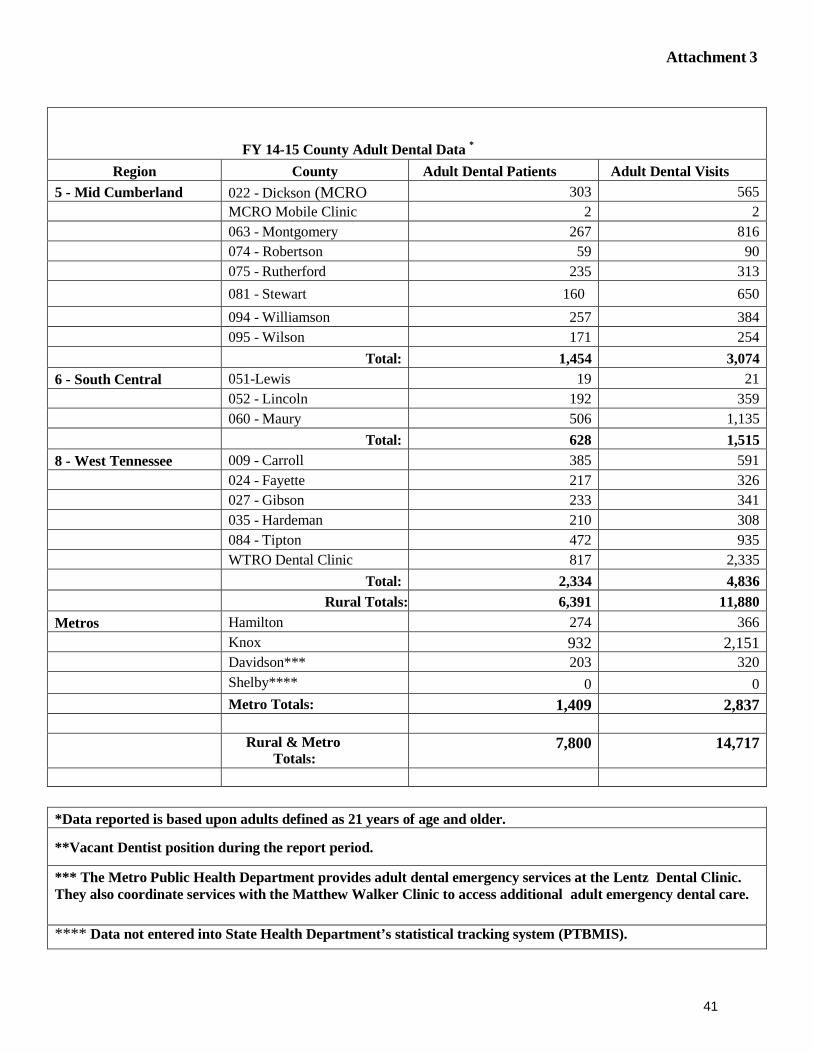
Attachment 3
FY 14-15 County Adult Dental Data * Region County Adult Dental Patients Adult Dental Visits
5 - Mid Cumberland 022 - Dickson (MCRO 303 565 MCRO Mobile Clinic 2 2 063 - Montgomery 267 816 074 - Robertson 59 90 075 - Rutherford 235 313 081 - Stewart 160 650 094 - Williamson 257 384 095 - Wilson 171 254 Total: 1,454 3,074 6 - South Central 051-Lewis 19 21
052 - Lincoln 192 359 060 - Maury 506 1,135 Total: 628 1,515 8 - West Tennessee 009 - Carroll 385 591
024 - Fayette 217 326 027 - Gibson 233 341 035 - Hardeman 210 308 084 - Tipton 472 935 WTRO Dental Clinic 817 2,335 Total: 2,334 4,836 Rural Totals: 6,391 11,880 Metros Hamilton 274 366
Knox 932 2,151 Davidson*** 203 320 Shelby**** 0 0 Metro Totals: 1,409 2,837
Rural & Metro Totals:
7,800 14,717
*Data reported is based upon adults defined as 21 years of age and older.
**Vacant Dentist position during the report period.
*** The Metro Public Health Department provides adult dental emergency services at the Lentz Dental Clinic. They also coordinate services with the Matthew Walker Clinic to access additional adult emergency dental care.
**** Data not entered into State Health Department’s statistical tracking system (PTBMIS).

42
Attachment #4
43
Attachment #5

44
Attachment # 6
45
Attachment #7
Number of Health Care Safety Net Service Providers by County and Region
Region
County
FQHC Sites**
Primary Care Health Department
(excluding LHD/FQHC)
Community or Faith-Based Grantee(s) (FY2015)
Mental Health
Service Providers
Adult Dental
Services Health Department
Adult Dental
Emergency Safety Net Services
Adult Dental FQHC
Eas
t
Anderson 1 3 2 x x Blount 1 1 1 3 x X Campbell 2 2 x x Claiborne 2 2 1 x
Cocke
5
2
x
Grainger 4 1 x Hamblen 2 1 2 x Jefferson 2 Loudon 1 3 x Monroe 5 1 1 Morgan 2 1 x Roane 1 1 x Scott 5 1 x Sevier 1 1 2 3 x x Union 1 1 x
East Totals 33 4 10 24
M
id-
Cum
berl
and
Cheatham 1 Dickson 2 1 2 x Houston 1 Humphreys 1 Montgomery 1 1 2 x x Robertson 1 1 x Rutherford 4 2 1 6 x Stewart 1 0 x Sumner 3 1 4 x Trousdale 0 Williamson 2 2 2 x Wilson 1 1 3 x
Mid-Cumberland Totals 8 15 4 20
46
Attachment #7
Number of Health Care Safety Net Service Providers by County and Region
Region
County
FQHC Sites**
Primary Care Health Department
(excluding LHD/FQHC)
Community or Faith-Based Grantee(s) (FY2015)
Mental Health
Service Providers
Adult Dental
Services Health Department
Adult Dental
Emergency Safety Net Services
Adult Dental FQHC
Nor
thea
st Carter 1 1 1 x
Greene 1 2 x Hancock 2 1 x x Hawkins 4 1 1 1 x Johnson 1 3 1 x x Unicoi 1 1 x Washington 4 1 1 1 x
Northeast Totals 13 4 5 8
Sout
h C
entr
al
Bedford 1 6 1 Coffee 1 1 Giles 2 Hickman 1 1 Lawrence 1 2 Lewis 1 x Lincoln 1 x Marshall 1 Maury 1 1 2 x Moore Perry 1 Wayne 2
South Central Totals 3 3 8 13
Sout
heas
t
Bledsoe 1 x Bradley 1 1 1 x Franklin 1 Grundy 1 1 x McMinn 1 1 3 x Marion 1 1 x Meigs 1 1 1 x Polk 1
47
Number of Health Care Safety Net Service Providers by County and Region
Region
County
FQHC Sites**
Primary Care Health
Department (excluding
LHD/FQHC)
Community or Faith-
Based Grantee(s) (FY2015)
Mental Health Service
Providers
Adult Dental
Services Health
Department
Adult Dental Emergency Safety Net
Services
Adult Dental FQHC
Upp
er C
umbe
rlan
d
Cannon 1 x x Clay 1 x Cumberland 1 1 1 x x DeKalb 1 x Fentress 1 x Jackson 1 x x Macon 2 1 x Overton 1 1 x x Pickett 1 x x Putnam 1 1 3 x x Rutherford 6 Smith 1 x Van Buren 1 1 x x Warren 1 1 x x White 1 1 x x
Upper Cumberland Totals: 15 0 4 13
Wes
t
Benton 1 Carroll 1 1 x Chester 1 1 Crockett 1 Decatur 1 Dyer 1 2 Fayette 1 1 x Gibson 1 2 x
Hardeman 1 1 x
Rhea 1 1 x Sequatchie 1
Southeast Totals 7 4 3 7
Attachment #7
48
Region
County
FQHC Sites**
Primary Care Health Department
(excluding LHD/FQHC)
Community or Faith-Based Grantee(s) (FY2015)
Mental Health
Service Providers
Adult Dental
Services Health Department
Adult Dental
Emergency Safety Net Services
Adult Dental FQHC
Hardin 5 1 Haywood 1 2
Wes
t
Henderson 1 2 Henry 1 1 Lake 2 1 Lauderdale 1 1 1 McNairy 1 1 Obion 1 1 2 x Tipton 1 1 x Weakly 1 West TN Regional Office*
x
West Totals 12 7 1 22
Met
ro Davidson 19 9 7 x x x
Hamilton 3 6 3 x x x Knox 4 6 6 x x Madison 2 3 Shelby 9 4 9 x x Sullivan 2 4 2 x
Metro Totals 37 0 31 30
Tennessee Totals 130 41 66 137
*West TN Regional Office is not part of the Jackson-Madison County Metro
Number of Health Care Safety Net Service Providers by County and Region
Attachment #7