Healthcare Market Access: Indonesia - phamax.ch · 4 Healthcare Market Access: Indonesia © phamax...
113
Transcript of Healthcare Market Access: Indonesia - phamax.ch · 4 Healthcare Market Access: Indonesia © phamax...


2
Healthcare Market Access: Indonesia
© phamax AG, 2015 - All Rights Reserved
1. COUNTRY LANDSCAPE .......................................................................................................................... 10
1.1 Economic environment ......................................................................................................... 10
1.2 Economic indicators ............................................................................................................. 11
1.2.1 Gross domestic product ................................................................................................ 11
1.2.2 Gross national income .................................................................................................. 12
1.2.3 Inflation ........................................................................................................................ 14
1.2.4 Foreign exchange reserves ............................................................................................ 15
1.2.5 Current account balance ............................................................................................... 16
1.2.6 Government gross debt ................................................................................................. 17
1.2.7 Exchange rate ............................................................................................................... 18
1.2.8 Foreign direct investment ............................................................................................. 18
1.2.9 Trade balance ................................................................................................................ 19
1.3 Demographics ....................................................................................................................... 21
1.3.1 Population ..................................................................................................................... 21
1.3.2 Growth of middle class ................................................................................................. 23
1.3.3 Education and literacy .................................................................................................. 23
1.3.4 Access to internet.......................................................................................................... 25
1.3.5 Employment ................................................................................................................. 25
1.4 Political structure and environment ...................................................................................... 28
1.4.1 Political history ............................................................................................................. 28
1.4.2 Political structure .......................................................................................................... 28
1.4.3 Current government ...................................................................................................... 29
1.5 Trade associations ................................................................................................................ 30
1.5.1 International Pharmaceutical Manufacturers Group ..................................................... 30
1.5.2 Indonesian Pharmaceutical Association ....................................................................... 30
1.6 Opportunities and challenges ................................................................................................ 31
1.6.1 Opportunities ................................................................................................................ 31
1.6.2 Challenges .................................................................................................................... 31
2 HEALTHCARE INFRASTRUCTURE ..................................................................................................... 32
2.1 Healthcare system ................................................................................................................. 32
2.2 Health status ......................................................................................................................... 35
TABLE OF CONTENTS
3
Healthcare Market Access: Indonesia
© phamax AG, 2015 - All Rights Reserved
2.2.1 Life expectancy............................................................................................................. 35
2.2.2 Mortality rate ................................................................................................................ 36
2.2.3 Total fertility rate .......................................................................................................... 36
2.3 Healthcare policy .................................................................................................................. 37
2.4 Healthcare financing and expenditure .................................................................................. 38
2.4.1 Healthcare expenditure as a percentage of GDP .......................................................... 38
2.5 Major components of healthcare spending ........................................................................... 40
2.6 Shares of the public and private sectors ............................................................................... 41
2.7 Pharmaceutical expenditure .................................................................................................. 42
2.8 Spending in pharmaceutical R&D ........................................................................................ 43
2.9 Health insurance ................................................................................................................... 44
2.10 Hospital sector ...................................................................................................................... 46
2.10.1 Major hospital profiles .................................................................................................. 50
2.10.1.1 Siloam Hospital Group ......................................................................................... 50
2.10.1.2 Eka Hospital ......................................................................................................... 51
2.10.1.3 Santosa Hospital ................................................................................................... 51
2.10.1.4 Dr. Cipto Mangunkusumo Hospital (RSCM) ....................................................... 52
2.10.1.5 Premier Hospital – Ramsey Healthcare Group .................................................... 52
2.10.1.6 Central Army Gatot Subroto Hospital .................................................................. 52
2.11 Healthcare personnel ............................................................................................................ 53
3 OVERVIEW OF PHARMACEUTICAL MARKET ............................................................................... 55
3.1 Market overview ................................................................................................................... 55
3.2 Industry structure .................................................................................................................. 56
3.3 Market segments ................................................................................................................... 57
3.4 Opportunities and challenges ................................................................................................ 58
3.4.1 Opportunities ................................................................................................................ 58
3.4.2 Challenges .................................................................................................................... 58
3.5 Major players ........................................................................................................................ 60
3.5.1 Kalbe Farma ................................................................................................................. 60
3.5.2 Sanbe Farma ................................................................................................................. 61
3.5.3 Kimia Farma ................................................................................................................. 62
3.5.4 PT Merck Tbk ............................................................................................................... 63
3.5.5 PT Novartis Indonesia .................................................................................................. 64
3.5.6 Sanofi Group Indonesia ................................................................................................ 64

4
Healthcare Market Access: Indonesia
© phamax AG, 2015 - All Rights Reserved
3.5.7 PT SOHO Industri Pharmasi ........................................................................................ 64
3.6 Key products ......................................................................................................................... 65
3.7 Leading therapeutic segments .............................................................................................. 66
3.8 Supply channel ..................................................................................................................... 67
3.8.1 Distribution / wholesale ................................................................................................ 68
3.8.2 Retail ............................................................................................................................. 69
3.9 Sales and marketing .............................................................................................................. 71
3.10 FDI in pharmaceutical industry ............................................................................................ 73
3.12 Events ................................................................................................................................... 74
3.13 Major diseases ...................................................................................................................... 75
3.13.1 Stroke ............................................................................................................................ 75
3.13.2 Cancer ........................................................................................................................... 76
3.13.3 Tuberculosis ................................................................................................................. 76
3.13.4 Diarrhea ........................................................................................................................ 77
3.13.5 Diabetes mellitus .......................................................................................................... 77
3.13.6 Ischemic heart disease .................................................................................................. 77
4 MARKET ACCESS .................................................................................................................................... 79
4.1 Stakeholder landscape .......................................................................................................... 79
4.2 Regulatory landscape ............................................................................................................ 80
4.2.1 Regulatory agencies ...................................................................................................... 80
4.2.2 Market authorization for pharmaceutical products ....................................................... 82
4.2.3 Clinical trial regulations ............................................................................................... 85
4.2.4 Licensing process for pharmaceutical manufacturing .................................................. 87
4.2.5 Post-marketing regulations ........................................................................................... 87
4.2.6 Labeling and advertising .............................................................................................. 87
4.2.7 Licensing process for pharmaceutical imports ............................................................. 88
4.2.9 Intellectual property rights ............................................................................................ 90
4.2.9.1 Patent ........................................................................................................................ 91
4.3 Pricing................................................................................................................................... 93
4.3.1 Pricing system............................................................................................................... 93
4.3.2 Pricing policy ................................................................................................................ 93
4.3.3 Price trends ................................................................................................................... 94
4.3.4 Discounts and margins .................................................................................................. 94
4.4 Reimbursement landscape .................................................................................................... 96
5
Healthcare Market Access: Indonesia
© phamax AG, 2015 - All Rights Reserved
4.4.1 Reimbursement process ................................................................................................ 96
4.4.2 Insurance providers ....................................................................................................... 96
4.4.2.1 Public insurance ........................................................................................................ 96
4.4.2.2 Private insurance....................................................................................................... 98
4.4.3 Co-payments ................................................................................................................. 98
4.5 Prescribing and dispensing ................................................................................................... 99
4.5.1 Prescribing guidelines ................................................................................................... 99
4.5.2 Prescribing influences ................................................................................................... 99
4.5.3 Dispensing .................................................................................................................... 99
4.6 Reimbursement drug lists ................................................................................................... 101
4.6.1 National List of Essential Medicines (NLEM) ........................................................... 101
4.6.2 Daftar Plafon Harga Obat (DPHO)............................................................................. 102
4.6.3 National formulary (Fornas) ....................................................................................... 103
4.7 Drug procurement ............................................................................................................... 104
4.8 Hospital formulary .............................................................................................................. 105
5 APPENDIX ................................................................................................................................................ 106
5.1 Glossary .............................................................................................................................. 106
5.2 Sources ............................................................................................................................... 108
5.3 Methodology ....................................................................................................................... 112
5.3.1 Secondary research ..................................................................................................... 112
5.3.2 Primary research ......................................................................................................... 112
5.3.3 Data validation ............................................................................................................ 112
5.4 Disclaimer ........................................................................................................................... 113
5.5 Contact us ........................................................................................................................... 113

6
Healthcare Market Access: Indonesia
© phamax AG, 2015 - All Rights Reserved
Table 1: GDP ($bn), Indonesia, 2009 - 2013.............................................................................................. 11 Table 2: Annual GDP growth (%), Indonesia, 2009 - 2013 ....................................................................... 12 Table 3: Gross national income ($bn), Indonesia, 2009 - 2013 .................................................................. 13 Table 4: GNI per capita ($), Indonesia, 2009 - 2013 .................................................................................. 14 Table 5: Inflation rate (%), Indonesia, 2009–2013 ..................................................................................... 14 Table 6: Consumer price index, Indonesia, 2009 - 2013 ............................................................................ 15 Table 7: Forex reserves ($bn), Indonesia, 2009 - 2013 .............................................................................. 16 Table 8: Current account balance ($bn), Indonesia, 2009 - 2013 ............................................................... 17 Table 9: Central government debt (% to GDP), Indonesia, 2009 - 2013 ................................................... 17 Table 10: Exchange rate (IDR per USD), Indonesia, 2009 - 2013 ............................................................. 18 Table 11: Foreign direct investment ($bn), Indonesia, 2009 - 2013 .......................................................... 19 Table 12: Imports ($bn), Indonesia, 2009 - 2013 ....................................................................................... 20 Table 13: Exports ($bn), Indonesia, 2009 - 2013 ....................................................................................... 20 Table 14: Population (mn), Indonesia, 2009 - 2013 ................................................................................... 21 Table 15: Urban and rural population (mn), Indonesia, 2009 - 2013 ......................................................... 22 Table 16: Population distribution by age groups (%), Indonesia, 2009 - 2013 .......................................... 22 Table 17: Literacy rate (15+ age), Indonesia, 2009 - 2013 ........................................................................ 24 Table 18: Gross enrolment ratio, Indonesia, 2009 - 2013 .......................................................................... 25 Table 19: Employment to population ratio (15+ age), Indonesia, 2009 - 2012 .......................................... 26 Table 20: Employment by sector (%), Indonesia, 2009 - 2012 .................................................................. 27 Table 21: Unemployment rate (% of labor force), Indonesia, 2009 - 2012 ................................................ 27 Table 22: Number of primary healthcare centers, Indonesia, 2008 - 2012 ................................................ 34 Table 23: Life expectancy (years), Indonesia, 2008 - 2012 ....................................................................... 35 Table 24: Mortality rate (per thousand), Indonesia, 2008 - 2012 ............................................................... 36 Table 25: Healthcare expenditure (% of GDP), Indonesia, 2008 - 2012 .................................................... 39 Table 26: Healthcare expenditure per capita, PPP ($), Indonesia, 2008 - 2012 ......................................... 39 Table 27: Share of components of healthcare spending, Indonesia, 2012 .................................................. 40 Table 28: Public-private share of healthcare expenditure, Indonesia, ........................................................ 41 Table 29: Health insurance coverage in Indonesia, 2012 ........................................................................... 45 Table 30: Number of hospitals, Indonesia, 2009 - 2013 ............................................................................. 46 Table 31: Hospital segmentation based on ownership, Indonesia, 2013 .................................................... 46 Table 32: Number of private and public hospitals, Indonesia, 2011 - 2013 ............................................... 47 Table 33: Number of hospitals by category, Indonesia, 2013 .................................................................... 48 Table 34: Number of general and specialty hospitals, Indonesia, 2009 - 2013 .......................................... 48 Table 35: Number of beds, Indonesia, 2009 - 2013 ................................................................................... 50 Table 36: Number of physicians, Indonesia, 2010 - 2013 .......................................................................... 54 Table 37: Healthcare personnel (per 100,000 population), Indonesia, ....................................................... 54 Table 38: Pharmaceutical market segments, Indonesia, 2009 - 2013 ......................................................... 57 Table 39: Market share of therapeutic classes (volume), Kalbe Farma, 2013 ............................................ 61 Table 40: Product portfolio, Sanbe Farma, 2013 ........................................................................................ 62 Table 41: Number of products in different product categories, Kimia Farma, .......................................... 63 Table 42: Key products, Indonesia, 2013 ................................................................................................... 65
LIST OF TABLES

7
Healthcare Market Access: Indonesia
© phamax AG, 2015 - All Rights Reserved
Table 43: Number of pharmaceutical distributors, Indonesia, 2009 - 2012 ............................................... 68 Table 44: Number of pharmacies and drugstores, Indonesia, 2009 - 2012 ................................................ 70 Table 45: Recent events in pharmaceutical industry, Indonesia ................................................................. 74 Table 46: Illustrative price build-up ranges for an imported pharmaceutical product in Indonesia .......... 95 Table 47: Public insurance schemes, Indonesia ......................................................................................... 97

8
Healthcare Market Access: Indonesia
© phamax AG, 2015 - All Rights Reserved
Figure 1: GDP ($bn), Peer countries, 2013 ................................................................................................ 10 Figure 2: GDP ($bn), Indonesia, 2009 - 2013 ............................................................................................ 11 Figure 3: Annual GDP growth (%), Indonesia, 2009 - 2013 ...................................................................... 12 Figure 4: Gross national income ($bn), Indonesia, 2009 - 2013 ................................................................ 13 Figure 5: GNI per capita ($), Indonesia, 2009 - 2013 ................................................................................ 13 Figure 6: Inflation rate (%), Indonesia, 2009 - 2013 .................................................................................. 14 Figure 7: Consumer price index, Indonesia, 2009 - 2013 ........................................................................... 15 Figure 8: Forex reserves ($bn), Indonesia, 2009 - 2013 ............................................................................. 16 Figure 9: Current account balance ($bn), Indonesia, 2009 - 2013 ............................................................. 16 Figure 10: Central government debt (% to GDP), Indonesia, 2009 - 2013 ................................................ 17 Figure 11: Exchange rate (IDR per USD), Indonesia, 2009 - 2013............................................................ 18 Figure 12: Foreign direct investment ($bn), Indonesia, 2009 - 2013 ......................................................... 19 Figure 13: Imports ($bn), Indonesia, 2009 - 2013 ...................................................................................... 20 Figure 14: Exports ($bn), 2009 - 2013 ....................................................................................................... 20 Figure 15: Population (mn), Indonesia, 2009 - 2013 .................................................................................. 21 Figure 16: Urban and rural population (% of total), Indonesia, 2009 - 2013 ............................................. 22 Figure 17: Population distribution by age groups (%), Indonesia, 2009 - 2013 ......................................... 22 Figure 18: Literacy rate (15+ age), Indonesia, 2009 - 2013 ....................................................................... 24 Figure 19: Gross enrolment ratio, Indonesia, 2009 - 2012 ......................................................................... 25 Figure 20: Employment to population ratio (15+ age), Indonesia, 2009 - 2012 ........................................ 26 Figure 21: Employment by sector (%), Indonesia, 2009 - 2012 ................................................................. 26 Figure 22: Unemployment rate (% of labor force), Indonesia, 2009 - 2012 .............................................. 27 Figure 23: Structure of government healthcare system, Indonesia ............................................................. 32 Figure 24: Number of primary healthcare centers, Indonesia, 2008 - 2012 ............................................... 33 Figure 25: Life expectancy (years), Indonesia, 2008 - 2012 ...................................................................... 35 Figure 26: Mortality rate (per thousand), Indonesia, 2008 - 2012 .............................................................. 36 Figure 27: Healthcare expenditure (% of GDP), Indonesia, 2008 - 2012 .................................................. 39 Figure 28: Healthcare expenditure per capita, PPP ($), Indonesia, 2008 - 2012 ........................................ 39 Figure 29: Share of components of healthcare spending (%), Indonesia, 2012 ......................................... 40 Figure 30: Public-private share of healthcare expenditure, Indonesia, 2008 - 2012 .................................. 41 Figure 31: Number of hospitals, Indonesia, 2009 - 2013 ........................................................................... 46 Figure 32: Number of private and public hospitals, Indonesia, 2011 - 2013 ............................................. 47 Figure 33: Number of general and specialty hospitals, Indonesia, 2009 - 2013 ......................................... 48 Figure 34: Distribution of specialized hospitals by type, Indonesia, 2012 ................................................. 49 Figure 35: Number of beds, Indonesia, 2009 - 2013 .................................................................................. 49 Figure 36: Number of physicians, Indonesia, 2010 - 2013 ......................................................................... 53 Figure 37: Healthcare personnel (per 100,000 population), Indonesia, 2010 - 2013 ................................ 54 Figure 38: Pharmaceutical market segments, Indonesia, 2009 - 2013 ....................................................... 57 Figure 39: Revenue by division, Kalbe Farma, 2013 ................................................................................. 60 Figure 40: Leading therapeutic segments, Indonesia, 2012 ....................................................................... 66 Figure 41: Pharmaceutical supply channel, Indonesia ............................................................................... 67 Figure 42: Number of pharmaceutical distributors, Indonesia, 2009 - 2012 .............................................. 68
LIST OF FIGURES

9
Healthcare Market Access: Indonesia
© phamax AG, 2015 - All Rights Reserved
Figure 43: Number of pharmacies and drugstores, Indonesia, 2009 - 2012 ............................................... 70 Figure 44: Pharmaceutical marketing channel, Indonesia .......................................................................... 72 Figure 45: Major diseases / conditions (% of total DALY), Indonesia ...................................................... 75 Figure 46: Organization structure of BPOM, Indonesia ............................................................................. 81 Figure 47: Market authorization process, Indonesia ................................................................................... 84 Figure 48: Clinical trial approval process, Indonesia ................................................................................. 86 Figure 49: Organization structure of DGIP office, Indonesia .................................................................... 90 Figure 50: Patent approval process, Indonesia ........................................................................................... 92 Figure 51: Revision process of NLEM, Indonesia ................................................................................... 102

10
Healthcare Market Access: Indonesia
© phamax AG, 2015 - All Rights Reserved
Source: World Bank
1. Country Landscape
1.1 Economic environment
During three decades of authoritarian rule by President Suharto, Indonesia achieved an average annual GDP growth of 6.1%. Conversely, the Asian financial crisis during 1997 - 1998 severely hit the economic growth and pushed it down to 0.3% in 1999. In 2004, President Yudhoyono took over the office and implemented a ‘pro-growth, pro-poor, pro-employment’ economic policy. In 2006, the government of Indonesia announced a policy package to improve the country’s economic growth by stimulating investments and infrastructure. Amidst the turmoil that affected the global economy in 2009, including South East Asian countries, Indonesia’s strong monetary and fiscal policies were able to repel a major dip in the country’s economic growth.
Indonesia has emerged as one of the biggest economies in South East Asia in recent years. Conforming to statistics revealed by World Bank, Indonesia ranked sixteenth in the world in terms of GDP and ranked fourth in East Asia after China, Japan and South Korea in 2013. Indonesia’s GDP growth has increased at a CAGR of 12% over the period of 2009 - 2013. Domestic consumption (more than 60% of the GDP), particularly in the private sector, was a major contributor to Indonesia's economic growth. Yet, Indonesia recorded a GDP growth of 5.8% in 2013, lower than 6.3% in 2012, as it was also not immune to the consequences of the fluctuating global economic dynamics.
Inflation amplified to 6.4% in 2013 primarily due to the rise in food and fuel prices. Indonesia is an attractive market for Foreign Direct Investment (FDI) due to its immense natural resources and large domestic market. The principal challenge in the path of economic development for Indonesia is the shortfall of infrastructure in the country. Persistent political corruption, poor export performance and poverty are the other chief hurdles to the advancement of Indonesia.
Figure 1: GDP ($bn), Peer countries, 2013
868
387 312 298 272
171
0
200
400
600
800
1,000
Indonesia Thailand Malaysia Singapore Philippines Vietnam
GD
P ($
bn)
Indonesia’s economy grew at a CAGR of 12% over 2009 - 2013, led by domestic consumption.
Lack of infrastructure, corruption, poor export s and poverty are the major hurdles in economic growth.

11
Healthcare Market Access: Indonesia
© phamax AG, 2015 - All Rights Reserved
Source: World Bank
Source: World Bank
1.2 Economic indicators
1.2.1 Gross domestic product
Gross domestic product (GDP) is the main indicator of the health of a country’s economy. Indonesia is South East Asia’s largest economy and is ranked sixteenth in the global GDP ranking. Indonesia’s GDP has grown from $540 bn in 2009 to $877 bn in 2012 at a CAGR of 18%, mostly driven by high domestic consumption. But, GDP tapered to $868 bn in 2013, predominantly due to the drop in prices of essential export commodities such as coal, natural rubber, gold and palm oil as well as the decrease in investment and domestic consumption. GDP per capita in Indonesia dwindled marginally to $3,475 in 2013 compared to $3,551 in 2012.
Table 1: GDP ($bn), Indonesia, 2009 - 2013
Year 2009 2010 2011 2012 2013 $bn 540 709 846 877 868
The annual GDP growth rate gradually slowed down in the last two years and reached 5.8% in 2013 from an average of 6.3% over the previous three years. This diluted growth was largely driven by monetary tightening, rising consumer price inflation and falling export prices. Amidst global uncertainties, Indonesia’s economic forecast, that was expected to be positive, has been contradicted by international authorities and the local government. Bank Indonesia forecasted the economic growth to plunge in the range of 5.5% - 5.9% in 2014, in spite of better imports and moderated domestic demand.
Figure 2: GDP ($bn), Indonesia, 2009 - 2013
540
709 846 877 868 2,272
2,947
3,470 3,551 3,475
0
1,000
2,000
3,000
4,000
0
300
600
900
1,200
2009 2010 2011 2012 2013
GD
P pe
r ca
pita
($)
GD
P ($
bn)
GDP growth rate has gradually slowed down in last two years due to monetary tightening, rising consumer price inflation and falling export prices. Bank Indonesia forecasted economic growth to plunge in the range of 5.5% - 5.9% in 2014.

12
Healthcare Market Access: Indonesia
© phamax AG, 2015 - All Rights Reserved
Source: World Bank
Source: World Bank
Figure 3: Annual GDP growth (%), Indonesia, 2009 - 2013
Table 2: Annual GDP growth (%), Indonesia, 2009 - 2013
Year 2009 2010 2011 2012 2013 Annual GDP Growth (%) 4.6 6.2 6.5 6.3 5.8
1.2.2 Gross national income
Gross national income (GNI) is the sum of a nation’s GDP and net income accumulated from overseas. It is an estimate of the size of an economy and has an exceedingly relevant part to play in economic, political, and societal implications.
Indonesia recorded a GNI of $841 bn in 2013, 1% down from the previous year’s value of $851 bn. Indonesia was ranked sixteenth in the world with this GNI. In comparison to other South East Asian countries, Indonesia recorded the highest GNI in 2013, twice the GNI of Thailand ($364 bn). Indonesia’s GNI in 2013 was also higher than the Philippines ($326 bn), Malaysia ($301 bn), Singapore ($291 bn) and Vietnam ($163 bn).
4.6
6.2 6.5 6.3 5.8
0
2
4
6
8
10
2009 2010 2011 2012 2013
Rea
l GD
P gr
oeth
(%)
13
Healthcare Market Access: Indonesia
© phamax AG, 2015 - All Rights Reserved
Source: World Bank
Source: World Bank
Source: World Bank
Table 3: Gross national income ($bn), Indonesia, 2009 - 2013
Year 2009 2010 2011 2012 2013 $bn 521 689 821 851 841
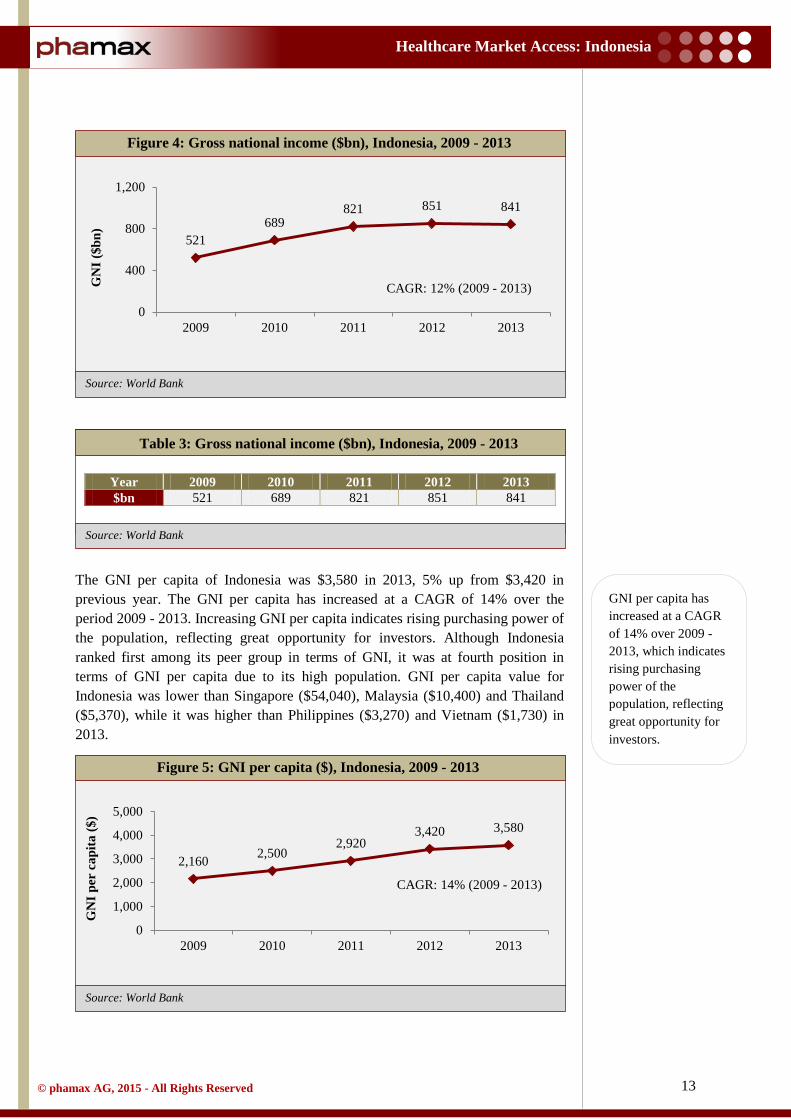
The GNI per capita of Indonesia was $3,580 in 2013, 5% up from $3,420 in previous year. The GNI per capita has increased at a CAGR of 14% over the period 2009 - 2013. Increasing GNI per capita indicates rising purchasing power of the population, reflecting great opportunity for investors. Although Indonesia ranked first among its peer group in terms of GNI, it was at fourth position in terms of GNI per capita due to its high population. GNI per capita value for Indonesia was lower than Singapore ($54,040), Malaysia ($10,400) and Thailand ($5,370), while it was higher than Philippines ($3,270) and Vietnam ($1,730) in 2013.
Figure 4: Gross national income ($bn), Indonesia, 2009 - 2013
Figure 5: GNI per capita ($), Indonesia, 2009 - 2013
521 689
821 851 841
0
400
800
1,200
2009 2010 2011 2012 2013
GN
I ($b
n)
CAGR: 12% (2009 - 2013)
2,160 2,500 2,920
3,420 3,580
0
1,000
2,000
3,000
4,000
5,000
2009 2010 2011 2012 2013
GN
I per
cap
ita ($
)
CAGR: 14% (2009 - 2013)
GNI per capita has increased at a CAGR of 14% over 2009 - 2013, which indicates rising purchasing power of the population, reflecting great opportunity for investors.

14
Healthcare Market Access: Indonesia
© phamax AG, 2015 - All Rights Reserved
Source: World Bank
Source: World Bank
Source: World Bank
Table 4: GNI per capita ($), Indonesia, 2009 - 2013
Year 2009 2010 2011 2012 2013 $ 2,160 2,500 2,920 3,420 3,580
1.2.3 Inflation
Inflation (consumer price) in Indonesia was 4.3% in 2012, lowest in the last five years. Still, in 2013, inflation increased to 6.4%, well above the targeted rate of 4.5±1%. High inflation was propelled by increase in the prices of gasoline and diesel, due to reduction in the subsidies on fuel by the Indonesian government. Increase in food prices also contributed to the high inflation. At the same time, core inflation remained under control due to moderate domestic demand and decline in price of global commodities.
The Indonesian government sets inflation targets as per the norms prescribed under the Bank Indonesia law. The government set it as 4.5% and 4% with ±1% deviation for 2014 and 2015. During periods when the domestic economy is not doing well, the Indonesian government and Bank Indonesia have a greater responsibility to implement policies to bring down inflation levels to estimated target levels.
In comparison to other South East Asian countries, inflation in Indonesia in 2013 was second highest after Vietnam (6.6%), while Malaysia had the lowest inflation rate of 2.1%.
Table 5: Inflation rate (%), Indonesia, 2009–2013
Year 2009 2010 2011 2012 2013 Annual % 4.8 5.1 5.4 4.3 6.4
Figure 6: Inflation rate (%), Indonesia, 2009 - 2013
4.8 5.1 5.4 4.3
6.4
0
3
6
9
12
15
2009 2010 2011 2012 2013
Infla
tion
rate
(%)
Compared to the lowest inflation of 4.3% in 2012 over last five years, inflation increased to 6.4% in 2013, propelled by increase in the price of gasoline and diesel due to reduction in subsidies on fuel by the government.

15
Healthcare Market Access: Indonesia
© phamax AG, 2015 - All Rights Reserved
Source: World Bank
Source: World Bank
Consumer price index (CPI) reflects price level changes for the average consumer purchasing a market basket of consumer goods and services. Changes in CPI are used to assess price changes linked to the cost of living. In conformance with World Bank data, CPI of Indonesia reached its highest in 2013 over a period of five years. The CPI was 95 in 2009, taking 2010 as base year and gradually increased to 117 in 2013.
Table 6: Consumer price index, Indonesia, 2009 - 2013
Year 2009 2010 2011 2012 2013 CPI 95 100 105 110 117
1.2.4 Foreign exchange reserves
The foreign exchange (forex) reserve is the foreign currency deposits held by a central bank or monetary authorities in a country. The reserve allows governments to keep their currencies stable and reduce the effect of economic shocks.
Indonesia had foreign exchange reserves (including gold) worth $66.1 bn in 2009, which grew to $99.4 bn 2013 at a CAGR of 10%. But, the forex reserves actually declined in 2013 since it was a higher $112.8 bn in the previous year. As per Bank Indonesia, the reserves in 2013 were well above the international standards of reserve adequacy and it was equivalent to 5.6 months of import or 5.4 months of imports and external debt servicing. Bank Indonesia expects to strengthen its forex reserve capabilities in the future to further reinforce the economy.
Figure 7: Consumer price index, Indonesia, 2009 - 2013
95 100 105 110 117
0
50
100
150
2009 2010 2011 2012 2013
CPI
CAGR: 5% (2009 - 2013)
Indonesia’s forex reserves have grown at a CAGR of 10% over 2009 - 2013. The reserves in 2013 were equivalent to 5.6 months of imports.

16
Healthcare Market Access: Indonesia
© phamax AG, 2015 - All Rights Reserved
Source: World Bank
Source: World Bank
Source: World Bank
Table 7: Forex reserves ($bn), Indonesia, 2009 - 2013
Year 2009 2010 2011 2012 2013 $bn 66 96 110 113 99
1.2.5 Current account balance
Current account was in surplus during the period 2009 - 2011. But, it underwent a structural shift and descended into a deficit of $24.1 bn (-2.7% of GDP) in 2012, mainly due to deficits in non-oil and gas trade accounts - a decrease in exports and increase in import of non-oil and gas goods accompanied by continuing deficits in income and service accounts. Import of non-oil and gas goods increased due to rising domestic consumption. Bank Indonesia estimated the current account deficit to widen and reach $29.1 bn in year 2013. Since import was expected to rise in 2014, the current account balance was expected to remain in the deficit. To bring down the current account deficit, government implemented structural reforms in the energy sector such as reducing the subsidy for fuel prices and promoting the use of biofuel to curb oil and gas imports.
Figure 8: Forex reserves ($bn), Indonesia, 2009 - 2013
Figure 9: Current account balance ($bn), Indonesia, 2009 - 2013
66.1
96.2 110.1 112.8
99.4
0
50
100
150
2009 2010 2011 2012 2013
Fore
x re
srve
($bn
)
CAGR: 10% (2009 - 2013)
10.6 5.1 1.7
-24.1 -29.1
-30
-15
0
15
30
2009 2010 2011 2012 2013
Cur
rent
acc
ount
ba
lanc
e ($
bn)
Decrease in exports and increase in import of non-oil and gas goods dragged the current account balance from surplus to deficit. Due to rising imports, it was expected to be in deficit in 2014.

17
Healthcare Market Access: Indonesia
© phamax AG, 2015 - All Rights Reserved
Source: World Bank
Source: IMF
Source: IMF
Table 8: Current account balance ($bn), Indonesia, 2009 - 2013
Year 2009 2010 2011 2012 2013e $bn 10.63 5.14 1.69 -24.07 -24.07
1.2.6 Government gross debt
Indonesia’s government debt is largely derived from bilateral and multilateral loans, commercial loans, bonds, export credit facilities and government securities. Government securities include government debt securities (SUN) and government Islamic securities (SBSN).
Indonesian government gross debt, as a share of its gross domestic product (GDP), has shown modest improvement from 2009 to 2012, mainly due to the noteworthy economic growth and a prudent fiscal policy. As reported by the International Monetary Fund (IMF), Indonesia’s gross external debt in 2012 was 24% of GDP, compared to 24.4% in 2011. In 2013, government debt slightly rose to 26.1% due to sluggish economy growth. IMF expected the government gross debt to be in the range of 22%-26% of GDP in 2014 - 2019.
Table 9: Central government debt (% to GDP), Indonesia, 2009 - 2013
Year 2009 2010 2011 2012 2013 % to GDP 28.6 26.1 24.4 24.0 26.1
Figure 10: Central government debt (% to GDP), Indonesia, 2009 - 2013
28.6% 26.1% 24.4% 24.0% 26.1%
0%
25%
50%
75%
100%
2009 2010 2011 2012 2013
Cen
tral
gov
ernm
ent d
ebt
(% to
GD
P)
Government gross debt as a percentage of GDP has declined over 2009 - 2012, mainly due to the noteworthy economic growth and a prudent fiscal policy. IMF forecasts the debt to be 22% - 26% of GDP during 2014 - 2019.

18
Healthcare Market Access: Indonesia
© phamax AG, 2015 - All Rights Reserved
Source World Bank:
Source: World Bank
1.2.7 Exchange rate
The official currency of Indonesia is Indonesian Rupiah (IDR). The central bank of Indonesia, Bank Indonesia, is the functional authority which regulates foreign exchange and trade in cooperation with the Ministry of Finance and custom authorities.
Indonesia has been witnessing a rapid depreciation in the value of Rupiah in the international market. The value of Rupiah reached 10,461 Rupiah per dollar in 2013 compared to 9,387 Rupiah per dollar in 2013. The primary reason for the decline was the uncertainty in the recovery of global economic slowdown. Falling international commodity prices, which eventually widened Indonesia’s current account deficit (due to less export) also contributed to the persistent devaluation of the Rupiah in 2013. Bank Indonesia, in cooperation with the government, applied measures and policies to shrink the current account deficit and inflation to prevent further depreciation of the Rupiah. Amidst the volatile foreign investment in the country due to global economic uncertainties, the main challenge for the government is to maintain the currency stability.
Table 10: Exchange rate (IDR per USD), Indonesia, 2009 - 2013
Year 2009 2010 2011 2012 2013 IDR per $ 10,390 9,090 8,770 9,387 10,461
1.2.8 Foreign direct investment
Over the past few years, Indonesia has become a bright prospect for global investors due to immense natural resources, low labor cost and a large and growing consumer base.
Figure 11: Exchange rate (IDR per USD), Indonesia, 2009 - 2013
10,390 9,090 8,770 9,387
10,461
0
5,000
10,000
15,000
2009 2010 2011 2012 2013Exc
hang
e ra
te (I
DR
)
CAGR: 0.5% (2009 - 2013)
Global economic uncertainties and falling international commodity prices led rapid depreciation of Indonesian Rupiah (IDR) against the USD in 2013.
Immense natural resources, low labor cost and a large and growing consumer base have fuelled FDI in Indonesia, with major investments happening in manufacturing, transportation and mining sectors.

19
Healthcare Market Access: Indonesia
© phamax AG, 2015 - All Rights Reserved
Source: World Bank
Source: World Bank
Despite the weakening foreign exchange rate and slowdown in economy, foreign direct investment has been on the rise at a great pace. Foreign direct investment (FDI) has shown persistent growth from $4.9 bn in 2009 to $19.6 bn in 2012. The rise in FDI was mainly due to increased inflow of equity capital and reinvested earnings. However, it slipped from $19.6 bn in 2012 to $18.4 bn in 2013 due to adverse global and domestic economic factors. Direct investment from ASEAN countries accounted for 47% of the FDI in 2013. According to Indonesia Investment Coordinating Board (BKPM), Japan was major contributor (16.5%) in FDI in Indonesia in 2013, followed by Singapore (16.3%), the US (8.5%), South Korea (7.7%), and United Kingdom (3.8%). Manufacturing, transportation and mining together contributed around 71% of the total FDI in 2013 (48%, 13% and 10% respectively).
Table 11: Foreign direct investment ($bn), Indonesia, 2009 - 2013
Year 2009 2010 2011 2012 2013 $bn 4.9 13.8 19.2 19.6 18.4
1.2.9 Trade balance
Trade balance is the difference between export and import of goods and services. It is a major component of the current account balance.
Trade balance of Indonesia recorded a deficit of $17.3 bn in 2013. The primary reasons for the deficit were shortfalls in the export of manufacturing products, caused by weakening global demand and increased import of goods and services. A huge depreciation of the Rupiah further impaired the trade balance of the country. Singapore, Japan, China, the US and Malaysia are the major trading partners of the country.
Import of goods and services in the country grew from $115 bn in 2009 to $227 in 2012, but declined slightly to $224 bn in 2013. Machinery and equipment, chemicals, fuel and food are the major commodities imported in Indonesia.
Figure 12: Foreign direct investment ($bn), Indonesia, 2009 - 2013
4.9
13.8 19.2 19.6 18.4
0
10
20
30
2009 2010 2011 2012 2013
FDI (
$bn)
CAGR: 35% (2009 - 2013)
Trade deficit in 2013 was due to shortfalls in export of manufacturing products caused by weakening global demand and increased import of goods and services.

20
Healthcare Market Access: Indonesia
© phamax AG, 2015 - All Rights Reserved
Source: World Bank
Source: World Bank
Source: World Bank
Source: World Bank
Export performance of Indonesia was on the rise from 2009 to 2011, but declined in 2012 due to the drop in export prices, impacted by the global slowdown. During 2013, Indonesia exported goods worth $206 bn, lower than the $213 bn exported the former year, principally due to the deceleration in the export of natural gas, coal and palm oil. Indonesia’s major export commodities include oil and gas, electrical appliances, plywood, textiles and rubber.
Table 12: Imports ($bn), Indonesia, 2009 - 2013
Year 2009 2010 2011 2012 2013 $bn 115 162 211 227 224
Table 13: Exports ($bn), Indonesia, 2009 - 2013
Year 2009 2010 2011 2012 2013 $bn 130 174 223 213 206
Figure 13: Imports ($bn), Indonesia, 2009 - 2013
Figure 14: Exports ($bn), 2009 - 2013
115 162
211 227 224
0
100
200
300
2009 2010 2011 2012 2013
Impo
rt ($
bn)
CAGR: 18% (2009 - 2013)
130 174
223 213 206
0
100
200
300
2009 2010 2011 2012 2013
Exp
ort (
$bn)
CAGR: 12% (2009 - 2013)

21
Healthcare Market Access: Indonesia
© phamax AG, 2015 - All Rights Reserved
Source: World Bank
Source: World Bank
1.3 Demographics
1.3.1 Population
Indonesia is the fourth most populous country in the world after China, India and the US. Indonesia’s population grew to 250 mn in 2013, with an average annual growth rate of 1.3% in five years. The growth was a modest 1.2% in 2012, compared to 247 mn in the previous year. Indonesia is a large archipelago with a land area land area of 1,904,569 square kilometers and a population density of 138 per square kilometer. Sumatra and Java are the highest populated islands while Papua and Maluku are the less populated ones. Statistics from the official census conducted in 2010 reveal that Indonesia has eleven cities with a population in excess of one million.
The Indonesian government has embarked on a family planning awareness program in recent years in a quest to curb the population growth. The results have not met the desired expectations. If the growth remains the same, Indonesian population is expected to touch 271 mn in 2020.
Table 14: Population (mn), Indonesia, 2009 - 2013
Year 2009 2010 2011 2012 2013 Population (mn) 237 241 244 247 250
Urbanization is on the rise in the country. Urban population grew at a CAGR of 3% and reached to 130.6 mn in 2013 from 116.7 mn in 2009. On the contrary, population in rural areas declined from 120.8 mn in 2009 to 119.3 mn in 2013. The urban vs. rural split in 2013 was 52% and 48% respectively.
Figure 15: Population (mn), Indonesia, 2009 - 2013
237 241 244 247 250
0
100
200
300
2009 2010 2011 2012 2013
Popu
latio
n (m
n)
CAGR: 1.3% (2009 - 2013)
Indonesia is the fourth most populous country in the world. In 2013, its population was 250 mn. It has eleven cities with population in excess of one million.

22
Healthcare Market Access: Indonesia
© phamax AG, 2015 - All Rights Reserved
Source: World Bank
Source: World Bank
Source: World Bank
Source: World Bank
Table 15: Urban and rural population (mn), Indonesia, 2009 - 2013
Year 2009 2010 2011 2012 2013 Rural 120.8 120.5 120.2 119.8 119.3 Urban 116.7 120.2 123.6 127.1 130.6
In 2013, around 65.5% of the population belonged to the age group of 14 - 64 years, making Indonesia a young country. Only 5% of the population was over 65 years of age, a persistent trend over five years.
Table 16: Population distribution by age groups (%), Indonesia, 2009 - 2013
Year 2009 2010 2011 2012 2013 0 -14 (%) 30.0 29.8 29.6 29.3 28.9
14 – 64 (%) 65.1 65.2 65.3 65.6 65.9 65+ (%) 5.0 5.0 5.1 5.1 5.2
Figure 16: Urban and rural population (% of total), Indonesia, 2009 - 2013
Figure 17: Population distribution by age groups (%), Indonesia, 2009 - 2013
51% 50% 49% 49% 48%
49% 50% 51% 51% 52%
2009 2010 2011 2012 2013
Popu
latio
n (%
)
Rural Urban
30% 30% 30% 29% 29%
65% 65% 65% 66% 66%
5% 5% 5% 5% 5%
2009 2010 2011 2012 2013
Popu
latio
n (%
)
0 - 14 15 - 64 >65
Indonesia is a young country with 66% in the age category of 14 - 64 years

23
Healthcare Market Access: Indonesia
© phamax AG, 2015 - All Rights Reserved
According to World Bank, birth rate in Indonesia was 19.2 per 1,000 people in 2012, higher than other South East Asian countries except Philippines (24.6 per 1,000 people). Death rate has remained stable over a period of five years in Indonesia, measured at 6.3 per 1,000 people in 2012.
1.3.2 Growth of middle class
Indonesia is classified as a lower-middle income country by the World Bank. Despite slow growth, the Indonesian economy is still largest among South East Asian countries. Strong domestic demand, particularly consumption, has been a major factor in Indonesia’s resilience in the wake of the global financial crisis. The country is in the middle of a consumer boom fueling its growth prospects, supplementing its status as a South East Asian giant. Members of the middle class are more likely to purchase consumer durables than the low income class. Further, the middle class is more prone to demand and consume advanced education, sophisticated healthcare and recreational services. The constant surge in the size of the middle income group and the rise in disposable income is an opportunity for domestic and foreign companies to sell their consumer goods. In conformance with World Bank reports, the middle class population in Indonesia proliferated remarkably from 81 mn people (37% of population) in 2003 to 131 mn (56.5%) in 2010. In contrast, the size of the low income group shrunk due to the movement of around seven mn people annually from the low income group to the middle income group. This number was expected to reach 150 mn (59%) by 2014. The middle income group is growing in all regions at similar pace throughout the country. As the number of affluent people in middle income slabs increase, the country is likely to further attract foreign investment, supporting the country’s long term sustainable economic growth.
1.3.3 Education and literacy
The overall literacy rate in Indonesia has improved; but disparity exists between literacy rate of males and females. The discrepancy exists between the young and adult population as well. Literacy rate amongst the population aged fifteen and above in Indonesia was last measured at 92.8% in 2011, estimated to reach 93.2% in 2013. The government is determined to bring reforms in education and literacy, in an initiative to support the development of the country.
Middle class population proliferated remarkably from 81 mn (37% of population) in 2003 to 131 mn (56.5%) in 2010, fueling strong domestic demand, boosting the country’s long term prospects of economic growth.

24
Healthcare Market Access: Indonesia
© phamax AG, 2015 - All Rights Reserved
Source: World Bank, phamax estimates
Source: World Bank, phamax estimates
Figure 18: Literacy rate (15+ age), Indonesia, 2009 - 2013
Table 17: Literacy rate (15+ age), Indonesia, 2009 - 2013
Year 2009 2010e 2011 2012e 2013e Literacy rate (%) 92.6 92.8 92.8 93.0 93.2
To eradicate illiteracy and to improve the quality of education, the Indonesian government issued a literacy policy, namely, ‘The National Movement of Compulsory Nine-year Basic Education and the Fight against Illiteracy’. The policy was designed for a nine year basic education and the motive was to provide primary and secondary education as part of a basic and compulsory education program. Pre-primary education is normally given to children from four to six years of age. However, it is not compulsory in Indonesia.
Gross enrolment ratio (GER) is the total enrolment at specific education levels, regardless of age, expressed as a percentage of the population of specific education age. GER can exceed 100% due to the inclusion of over-aged and under-aged students because of early or late school entry and grade repetition.
GER for primary education in Indonesia was 108.5% in 2012, showing a modest decline from 2011. But, GER for secondary and tertiary education increased from 2009 to 2012 and reached 82.5% and 31.5% respectively in 2012.
92.6 92.8 92.8 93.0 93.2
0
50
100
2009 2010 2011 2012 2013
Lite
racy
rat
e (%
)

25
Healthcare Market Access: Indonesia
© phamax AG, 2015 - All Rights Reserved
Source: World Bank
Source: World Bank
Table 18: Gross enrolment ratio, Indonesia, 2009 - 2013
Year 2009 2010 2011 2012 GER, pre-primary 44.8 40.4 41.5 47.6 GER, primary 109.9 109.9 109.1 108.5 GER, secondary 76.5 78.4 81.2 82.5 GER, tertiary 23.7 24.9 27.2 31.5
1.3.4 Access to internet
The internet penetration in Indonesia, although very low, is rapidly gaining strides. In 2013, the number of internet users in the country was around 71 mn, an increase of 13% from 63 mn in 2012. Most of them (about 60%) belonged to the age group of 12 - 35 years. Thus, the internet penetration was 28% in 2013. Out of the total internet users, 51.6% are males while 48.4% are females. It was estimated that 139 mn people would have access to the internet by 2015. The main factor for the growth would be the ever-increasing middle income group. Believing that access to internet impacts the economic, social and political development of the country, the Ministry of Communication and Information Technology has launched the Indonesia Connected program to boost internet connectivity in border and remote areas.
1.3.5 Employment
As a direct impact of Suharto's New Order, enforced by the second President of Indonesia, economic growth aided the employment rates in the country. Employment ratio to the population showed a steady growth during the period 2009 - 2011. It reached 64% in 2012 from 62.5% in 2009. The greatest challenge for the Indonesian government is to create enough jobs to soak up then 2.5 mn new entrants in the labor market every year.
Figure 19: Gross enrolment ratio, Indonesia, 2009 - 2012
45 40 42 48
110 110 109 109
77 78 81 83
24 25 27 32 0
40
80
120
2009 2010 2011 2012
Gro
ss e
nrol
lmen
t rat
io
Pre primary Primary
Although internet penetration remains low at 28%, it is growing rapidly.

26
Healthcare Market Access: Indonesia
© phamax AG, 2015 - All Rights Reserved
Source: World Bank
Source: World Bank
Source: World Bank
Table 19: Employment to population ratio (15+ age), Indonesia, 2009 - 2012
Year 2009 2010 2011 2012 % 62.5 63.0 63.3 63.3
The employment sector in the nation is categorized into agriculture, industry and service sectors. The share of employment in industry and service sectors has increased at the expense of the agriculture sector. 43% of the total employees were working in the services industry in 2012, up from 42% in 2009. Employment in the industry sector increased to 22%, while employment in the agriculture sector decreased by 5% (40% in 2009 to 35% in 2012).
Figure 20: Employment to population ratio (15+ age), Indonesia, 2009 - 2012
Figure 21: Employment by sector (%), Indonesia, 2009 - 2012
62.5% 63.0% 63.3% 63.3%
0%
20%
40%
60%
80%
100%
2009 2010 2011 2012
Em
ploy
men
t to
popu
latio
n ra
tio
40% 38% 39% 35%
19% 19% 20% 22%
42% 42% 41% 43%
0%
20%
40%
60%
2009 2010 2011 2012
% o
f tot
al e
mpl
oym
ent
Agriculture Industry
Employment in the agricultural sector has declined over the years while it has increased in industry and services sectors.

27
Healthcare Market Access: Indonesia
© phamax AG, 2015 - All Rights Reserved
Source: World Bank
Source: World Bank
Source: World Bank
Table 20: Employment by sector (%), Indonesia, 2009 - 2012
Year 2009 2010 2011 2012 Agriculture (%) 39.7 38.3 39.0 35.1 Industry (%) 18.8 19.3 20.3 21.7 Service (%) 41.5 42.3 40.8 43.2
The unemployment rate has also receded in the last few years. The total unemployment rate in 2012 was 6.1%, compared to 6.6% in the former year. This decline consisted of high levels of underemployment in informal sectors. The unemployment rate among females declined almost to the level of male unemployment rate, indicating increasing women employment in Indonesia.
Table 21: Unemployment rate (% of labor force), Indonesia, 2009 - 2012
Year 2009 2010 2011 2012 Total (%) 7.9 7.1 6.6 6.1 Male (%) 7.5 6.1 6.4 5.8
Female (%) 8.5 8.7 8.6 6.8
Figure 22: Unemployment rate (% of labor force), Indonesia, 2009 - 2012
7.9 7.1
6.6
6.1 7.5
6.1 6.4 5.8
8.5 8.7 8.6
6.8
4
6
8
10
2009 2010 2011 2012
% o
f lab
or fo
rce
Total Male Female

28
Healthcare Market Access: Indonesia
© phamax AG, 2015 - All Rights Reserved
1.4 Political structure and environment
1.4.1 Political history
In 1945, after proclaiming independence, Sukarno became the first President of Indonesia and established the Republic of Indonesia. Under his chaotic rule, the country suffered economy slowdown. After the constant ambiguity between military and political parties, Sukarno was replaced by the authoritarian General Suharto in 1967. General Suharto maintained complete control over the country’s political environment through an administrative structure dominated by the military. He effected a ‘New Order’ in the state to rehabilitate the economic condition. During his stint of three decades, Indonesia achieved pronounced and perpetual economic growth. After the fall of Suharto’s rule, triggered by the Asian financial crisis, Vice President B.J. Habibie became Indonesia's third President. First formal election was held in 1999 for national, provincial and sub-provincial levels, in which 48 political parties participated. Despite attaining only 13% of votes, People's Consultative Assembly (MPR) selected Abdurrahman Wahid (National Awakening Party) as the fourth President of Indonesia, although later he was replaced by Megawati Sukarnoputri in 2001.
As per the amendment made in the constitution in 2004, the first direct election for the President was held in Indonesia and Susilo Bambang Yudhoyono was elected the sixth President in 2004. He was re-elected for the second term in 2009 because he successfully led the country out of the global crisis of 2008 - ‘09. President Yudhoyono deployed the ‘pro-growth, pro-poor, pro-employment’ program as part of his initiatives to brace the economy. His government faced challenges like corruption, the European financial crisis and natural disasters like Tsunami and earthquakes. But, he emerged unscathed amongst all adversities and managed to navigate the country out of all its misfortunes to a new level of economic growth.
1.4.2 Political structure
Indonesia is a secular and democratic country. The political structure is the result of several constitutional changes and amendments after the collapse of President General Suharto’s authoritarian rule (1967-1998). The major reform after the fall of General Suharto’s regime was the decentralization of political power and its distribution at the regional level. The district-level and municipal-level governing bodies were empowered to make spending decisions on local projects.
The political system of Indonesia comprises three branches:
• Executive • Legislative • Judicial
The Executive consists of the President, the Vice President and the Cabinet. The presidential term is five years, extensible by another term of five years if re-
Indonesia’s political system consists three branches: Executive, Legislative and Judicial
29
Healthcare Market Access: Indonesia
© phamax AG, 2015 - All Rights Reserved
elected. The President and Vice President are elected by presidential elections. Once elected, they appoint their Cabinet.
The chief Legislative body in Indonesia is the People’s Consultative Assembly (Majelis Permusyawaratan Rakyat, abbreviated MPR). MRP includes (i) the People’s Representative Council (Dewan Perwakilan Rakyat, abbreviated DPR), which deals with the formation and implementation of the law, the annual budget and political affairs at the central level, and (ii) the Regional Representative Council (Dewan Perwakilan Daerah, abbreviated DPD) that handles the affairs in local regions. DRP consists of 560 members while DPD is made up of 132 members selected from 33 provinces across Indonesia.
The Judicial includes the highest court of Indonesia, the Supreme Court (Mahkamah Agung), which is independent. The government established a new court in 2003 known as the Constitutional Court (Mahkamah Konstitusi), which monitors whether the decisions made by the Cabinet and Parliament (MPR) are in line with the Indonesian Constitution.
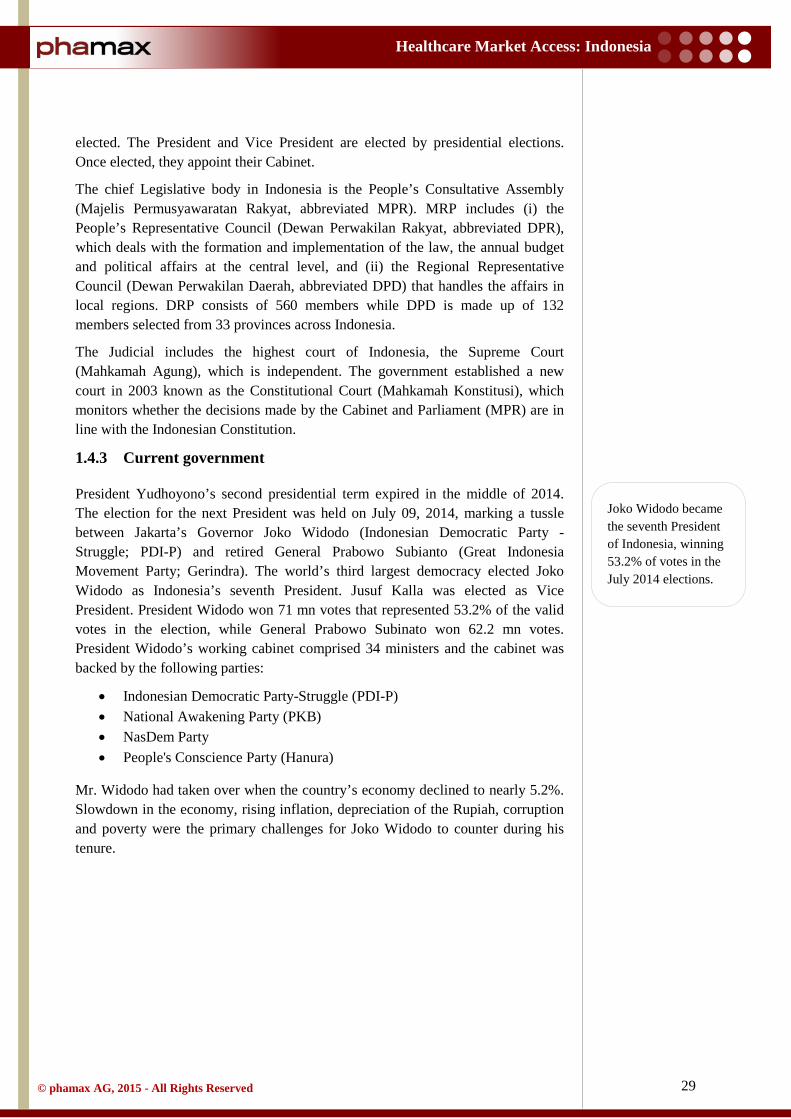
1.4.3 Current government
President Yudhoyono’s second presidential term expired in the middle of 2014. The election for the next President was held on July 09, 2014, marking a tussle between Jakarta’s Governor Joko Widodo (Indonesian Democratic Party - Struggle; PDI-P) and retired General Prabowo Subianto (Great Indonesia Movement Party; Gerindra). The world’s third largest democracy elected Joko Widodo as Indonesia’s seventh President. Jusuf Kalla was elected as Vice President. President Widodo won 71 mn votes that represented 53.2% of the valid votes in the election, while General Prabowo Subinato won 62.2 mn votes. President Widodo’s working cabinet comprised 34 ministers and the cabinet was backed by the following parties:
• Indonesian Democratic Party-Struggle (PDI-P) • National Awakening Party (PKB) • NasDem Party • People's Conscience Party (Hanura)
Mr. Widodo had taken over when the country’s economy declined to nearly 5.2%. Slowdown in the economy, rising inflation, depreciation of the Rupiah, corruption and poverty were the primary challenges for Joko Widodo to counter during his tenure.
Joko Widodo became the seventh President of Indonesia, winning 53.2% of votes in the July 2014 elections.

30
Healthcare Market Access: Indonesia
© phamax AG, 2015 - All Rights Reserved
1.5 Trade associations
1.5.1 International Pharmaceutical Manufacturers Group
International Pharmaceutical Manufacturers Group (IPMG) is a non-profit organization established in 2002. It encompasses 24 international research-based pharmaceutical companies located in Indonesia. IPMG members are involved in the research and development of innovative medicines which match international standards. IPMG also spreads the awareness of risks of counterfeit drugs and helps the government to eradicate them. IPMG is an active member of the International Federation of Pharmaceutical Manufacturers and Associations (IFPMA) and the Indonesian Chambers of Commerce (KADIN). The mission of IPMG is to play an important role as a partner to the government of Indonesia in improving healthcare by medical innovation and developing products matching international safety and quality standards.
1.5.2 Indonesian Pharmaceutical Association
Indonesian Pharmaceutical Association (Gabungan Perusahaan Farmasi Indonesia or GP Farmasi) was established on September 21, 1961 after the merger of three contemporary organizations - All Indonesia Association of Pharmacies, Pharmaceutical Importers Association of Indonesia and Pharmaceutical Industry Association of Indonesia. Indonesian Pharmaceutical Association, in coordination with government and other stakeholders, handles issues related to drug manufacturing, distribution and services. Pharmaceutical companies, distributors and owners of pharmacies are the main members of this association.

31
Healthcare Market Access: Indonesia
© phamax AG, 2015 - All Rights Reserved
1.6 Opportunities and challenges
1.6.1 Opportunities
Indonesia is one of the richest countries in the world in terms of natural resources. Abundance of natural resources make Indonesia an attractive country for foreign investment. Indonesia lies between the Indian Ocean and the Pacific Ocean, a major sea lane. This strategic location is advantageous for the country’s foreign trade (export and import). The population of Indonesia reached 250 mn in 2013 and is expected to touch 271 mn in 2020. A large portion of the population falls in the middle income group. A growing middle class and an affluent population provide ampules of opportunity for companies that sell consumer goods, further supporting the GDP of the country. Yet, the market is full of challenges. To penetrate the market, companies have to understand the marketing dynamics of the country such as demography, regional changes and consumer preferences.
The labor cost in Indonesia is low, even lower than other South East Asian countries. The abundance of low cost labor force offers a great opportunity for many international manufacturing companies and directly invites FDI to the country. But, wages for workers is likely to grow in the country as the government has started taking initiatives. Minimum wages have been increased by the government in some parts of the country. The increase in wages will pressurize companies to increase their costs of manufacturing.
1.6.2 Challenges
Indonesia’s economy is going through a slight deceleration, notably due to tumbling prices of export commodities at global level. Hence, the biggest challenge for Indonesia is to revive the economy through robust fiscal and monetary policies. Also, the following are some other impediments that deter its growth:
• Indonesia is a large archipelagic including almost 1,700 islands. Therefore, it is very difficult for the government to reach all the parts of the country due to inadequate infrastructure, which in turn unfavorably disturbs the economic evolution
• Corruption poses another stumbling block in Indonesia’s stipulated economic advancement. Widespread corruption has damaged Indonesia’s image in the international market, affecting FDI in the country. In spite of governmental measures to eradicate corruption, it still persists, hindering the nation’s impending progress
• Current account deficit is widening in the country due to the weak performance of exports
• As the Indonesian population grows, challenges lie in providing basic education, healthcare services and employment
Abundance of natural resources, a resurgent middle class, low labor costs and its strategic location for foreign trade make Indonesia an attractive destination for foreign investors.

32
Healthcare Market Access: Indonesia
© phamax AG, 2015 - All Rights Reserved
Source: MoH, phamax
2 Healthcare Infrastructure
2.1 Healthcare system
The challenge of ensuring universal healthcare for a massive and burgeoning population across a non-contiguous land mass is a massive undertaking. Indonesia is the fourth most populous country in the world, with 250 mn citizens (estimated to grow to 271 mn by 2020) spread across 17,508 islands. Fortunately, the Indonesian government recognizes the magnitude of this challenge and intends to achieve universal health coverage by 2019. In addition, the country has the benefit of a continuously increasing population-to-physician ratio. In 2010, there were only 36,736 physicians in Indonesia, but the number doubled to 78,597 by 2013.
Healthcare in Indonesia is provided by a mix of public and private institutions. The central government healthcare authority, that is, the Ministry of Health Republic of Indonesia (MoH RI), is the ultimate authority for all issues related to healthcare and public welfare. But, most of the responsibility of providing public healthcare services has been devolved to regional governments as part of a decentralization policy implemented in 2001 (as shown in figure below). In line with this policy, each sub-district (comprising several villages in a district) across the country must have a primary healthcare center, called a Puskesmas, with a doctor and supporting staff. This decentralization policy has revitalized healthcare in Indonesia, especially in terms of access for the population in remote and isolated regions.
Figure 23: Structure of government healthcare system, Indonesia
Ministry of Health
Province health office
District health office
Healthcare centers
Village midwives Sub health centers
National Hospitals
Province Hospitals
District Hospitals
Center
Province
District
Sub district
Village
Indonesia has a decentralized healthcare system, i.e., a mix of public and private institutions.

33
Healthcare Market Access: Indonesia
© phamax AG, 2015 - All Rights Reserved
Source: MoH
In addition, not-for-profit non-governmental organizations (NGOs), especially faith-based organizations, continue playing a progressively relevant role. Their number has swiftly grown over the last two decades (approximately 726 in early 2014, as recorded by the MoH).
In urban areas, the private for-profit sector dominates, although it is difficult to distinguish it from the public sector as most public healthcare employees also have private practices. The domination of the private sector, despite the vast public healthcare infrastructure began in the 1990s, when the Asian financial crisis crippled the economy and the government’s ‘zero-growth policy’ for public servants encouraged doctors and other healthcare service providers to step into the private sector en masse. In the last two decades, consumer acceptance of private healthcare providers has proliferated due to the better quality of services and the ever-increasing number of such institutions. Private healthcare now accounts for more than two-thirds of out-patient care, more than half of hospital contacts, and 30% - 50% of all deliveries (compared with only approximately 10% a decade ago).
The public healthcare delivery system in Indonesia has a well-established hierarchy for different levels of healthcare. At the primary care level, Indonesia relies on its network of Puskesmas to provide affordable care and implement public health programs such as immunization, sanitation, and health promotion. In addition, these centers also act as hubs for the government’s community-based health program (Upaya Kesehatan Bersumberdaya Masyarakat, UKBM). Under the UKBM, every village should have a village health post, called a Poskesdes, served by one midwife and one nurse or a midwife clinic, called a Posyandu, staffed by only a midwife. In 2008, there were 8,548 Puskesmas across Indonesia, which increased to 9,510 by 2012, comprising 6,358 out-patient centers (without bed) and 3,152 in-patient centers (with bed). With an annual average growth of 2% - 4%, primary health centers are increasing in almost every province in Indonesia. Moreover, the government has allocated special funds for the establishment of more such centers.
Figure 24: Number of primary healthcare centers, Indonesia, 2008 - 2012
8,548 8,737 9,005 9,321 9,510
0
3,000
6,000
9,000
12,000
2008 2009 2010 2011 2012
Num
ber
of p
rim
ary
heal
thca
re c
ente
rs
Government’s community based program mandates every village to have a health post, called a Poskesdes, served by one midwife and one nurse or a midwife clinic, called a Posyandu, staffed by only a midwife. Each sub-district (comprising several villages in a district) must have a primary healthcare center, called a Puskesmas, with a doctor and supporting staff.

34
Healthcare Market Access: Indonesia
© phamax AG, 2015 - All Rights Reserved
Source: MoH
Table 22: Number of primary healthcare centers, Indonesia, 2008 - 2012
Year 2008 2009 2010 2011 2012 Numbers 8,548 8,737 9,005 9,321 9,510
In case of referral hospitals, Indonesia has seen extensive involvement from the private sector and express growth in the last few years. The number of hospitals increased from just 1,523 units in 2009 to 2,228 units in 2013, comprising 1,562 public hospitals and 666 private hospitals. These referral hospitals can be directly accessed by patients, who do not need to be referred by a primary care center. Although a referral system does exist, poor controls and regulations allow patients to directly reach the higher levels. Unfortunately, this has led to overcrowded hospitals across the nation. To address the problem, the government is attempting to launch an online health referral system that will directly connect all primary healthcare centers with the urban referral hospitals.
In terms of health insurance coverage, Indonesia is at a significant inflection point with established, large scale government-funded coverage and a political mandate to achieve universal coverage. Until December 2012, around two-thirds of the population had some form of health insurance, with a third of the total population covered under a single program, Jamkesmas, the largest social insurance program for the poor. Only 2.5% of the population was covered by a private healthcare insurance scheme. However, beginning in 2014, the Indonesian government began rolling out its Jaminan Kesehatan Nasional (JKN) plan for universal social insurance by 2019.
Although a referral system exists, poor controls and regulations allow patients to directly reach the higher levels of healthcare, which has led to overcrowding at hospitals across the nation.
Until December 2012, around two-thirds of the population had some form of health insurance.

35
Healthcare Market Access: Indonesia
© phamax AG, 2015 - All Rights Reserved
Source: World Bank
Source: World Bank
2.2 Health status
The dawn of the 1990s saw Indonesia launch into the word of rapid economic growth, which led to sweeping improvements in its socioeconomic indicators. But, the unprecedented economic growth soon met strong structural headwinds that culminated in the Asian financial crisis of 1997. Expectedly, this economic downturn also affected the health of the nation. All the same, with the new millennium and the decentralization policy, health outcomes expressively upgraded, with excellent progress on many key indicators: Life expectancy at birth improved, infant mortality and maternal mortality declined, and the overall nutritional status of the populace improved. Though, communicable diseases continue to be the major cause of morbidity and mortality in Indonesia, with tuberculosis, HIV, diarrhea, and pneumonia being the most prevalent.
2.2.1 Life expectancy
Post the economic boom of the 1990s, life expectancy has shown a gradual increasing trend in Indonesia. Average life expectancy (at birth) increased from 70 years in 2008 to 71 years in 2012 (69 years for males and 73 years for females). This gradual increase is inextricably linked to the continuous improvements in the quality of Indonesian healthcare services and the average citizen’s ability to access them.
Table 23: Life expectancy (years), Indonesia, 2008 - 2012
Year 2008 2009 2010 2011 2012 Male 68 68 68 68 69
Female 72 72 72 72 73 Both 70 70 70 70 71
Figure 25: Life expectancy (years), Indonesia, 2008 - 2012
68 68 68 68 69 72 72 72 72 73 70 70 70 70 71
0
20
40
60
80
100
2008 2009 2010 2011 2012
Yea
rs
Male Female Both
Due to improving healthcare access and quality, average life expectancy (at birth) increased from 70 years in 2008 to 71 years in 2012.

36
Healthcare Market Access: Indonesia
© phamax AG, 2015 - All Rights Reserved
Source: World Bank
Source: World Bank
2.2.2 Mortality rate
Infant (less than one year old) and child (under five years old) mortality in Indonesia has been on the decline, reaching lowest values ever of 25.8 and 31 per 1,000 live births respectively in 2012. Thus, the country is very close to meeting its commitment under the WHO Millennium Development Goals (MDGs are eight goals that all 191 UN Member States have agreed to achieve by 2015), which requires Indonesia to reduce infant mortality to 23 per 1,000 live births by 2015. To this end, Indonesia has the advantages of a good distribution of quality healthcare services, improved nutrition status, and continued economic and income growth.
Table 24: Mortality rate (per thousand), Indonesia, 2008 - 2012
Year 2008 2009 2010 2011 2012 Infant 29.9 28.8 27.8 26.7 25.8
Under 5 36.6 35.1 33.6 32.3 31.0
2.2.3 Total fertility rate
Concomitant with its speedy economic progression, Indonesia has seen a continuous drop in the number of children being born per woman, although fertility is still at a moderate level. Total fertility rate (TFR) is the number of children that would be born to a woman if she were to live to the end of her childbearing years and bear children in accordance with current age-specific fertility rates; TFR ≤ 2.1 is classified as low; TFR 2.2 – 3.9 as moderate; and TFR ≥ 4 as high. In Indonesia, TFR dropped from 3.0 in 1988 - 1991, the beginning of the economic boom, to a comfortable 2.4 in 2012, which is just above the replacement level (2.1). This reduction was achieved through a successful campaign by the National Family Planning Coordinating Board (BKKBN) to educate citizens on family planning and to train healthcare professionals about the uses of different contraceptives. With this rate, Indonesia staged second after Philippines (3.1) among South East Asian peer nations.
Figure 26: Mortality rate (per thousand), Indonesia, 2008 - 2012
29.9 28.8 27.8 26.7 25.8
36.6 35.1 33.6 32.3 31.0
0
20
40
60
2008 2009 2010 2011 2012Infant Under 5

37
Healthcare Market Access: Indonesia
© phamax AG, 2015 - All Rights Reserved
2.3 Healthcare policy
Healthcare policy in Indonesia is guided by a long term (twenty year) federal plan, namely, Rencana Pembangunan Jangka Panjang Nasional (RPJPN) 2005 - 2025. Implementation of this plan is broken down into medium term (four year) plans called Rencana Pembangunan Jangka Menengah Nasional (RPJMN). The first phase, RPJMN 2005 - 2009, failed to fulfill the demands of the increasing population, but much is expected from the second phase, RPJMN 2010 - 2014.
For the second phase, the MoH focused on community medicine involving the private sector and the civil society. The plan covered the following areas:
• Improve public health, increase immunization, reduce maternal and infant mortality, and provide access to clean water
• Focus on family planning services through 23,500 government and private clinics
• Improve access to referral hospitals and enhance quality at the established hospitals in the five large urban centers
• Encourage and mandate the use of a national essential drug list for the procurement of medicines and limit the price of branded generic medicines
• Implement 100% health insurance coverage for the poor and expand coverage to other income groups
Moreover, the government of Indonesia is actively coordinating with the WHO and other international organizations to improve the health and nutrition status of the country. To this end, federal budgets for healthcare have been raised, showing the government’s commitment to healthcare. In addition, in January 2014, the President officially launched the National Health Insurance Plan (Jaminan Kesehatan Nasional, JKN), that is intended to cover the entire population by 2019. But, to achieve this goal, the government must prominently increase the number of healthcare facilities and healthcare providers in the realm.
Healthcare policy in Indonesia is guided by a long term (twenty year) federal plan, called RPJPN 2005 - 2025. Implementation of this plan is broken down into medium term (four year) plans.
National Health Insurance plan (Jaminan Kesehatan Nasional, JKN), launched in January 2014, is intended to cover the entire population by 2019.

38
Healthcare Market Access: Indonesia
© phamax AG, 2015 - All Rights Reserved
2.4 Healthcare financing and expenditure
The Indonesian government has made noteworthy efforts to increase investments in health, especially in the past few years. But, despite increased funding since decentralization in 2001, the healthcare system’s performance has remained unsatisfactory. Thus, patients tend to switch to private care, regardless of the out-of-pocket expenses. While public healthcare is almost wholly funded by the MoH, the private sector depends greatly on individual out-of-pocket expenditure, aside from funds from provident institutions and insurance companies (both social and private health insurance). Based on World Bank statistics, out-of-pocket spending accounted for 75% of the total private expenditure on healthcare in 2012, but only 45% of the total (private + public) healthcare expenditure in 2012.
All the same, the public sector is seeing increasing budget allocation. The MoH accounted for just 5.0% of total government expenditure in 2008, but this went up to 6.9% in 2012. In more specific terms, the MoH allocated a budget of $1.9 bn with a realization of $1.6 bn (85.6%) in 2008, which increased to $3.5 bn with a realization of $3.2 bn (92.1%) in 2012. In the past, districts accounted for around 50% of total health spending, the central government for one-third, and provincial governments just below 20%. But after implementation of the JKN in January 2014, the central government’s share of healthcare spending has to increase.
Apart from the budget allocated by the MoH, finance for healthcare services also comes from Jamkesmas, the national community health insurance scheme, and the Operational Assistance Health Fund, which started in 2010. The latter is allotted by the central government to help district and municipal governments in improving healthcare provisions at community-based health centers (Puskesmas, Poskesdes, Posyandu, etc.).
2.4.1 Healthcare expenditure as a percentage of GDP
Total expenditure on healthcare in Indonesia is growing ceaselessly, but is still very low, compared with its peer nations in the region. Total expenditure in Indonesia stood at just 3.03% of GDP in 2012 (up from 2.81% in 2008), leaving it at the bottom among regional peer nations. Vietnam spent the most (6.8%), followed by Singapore (4.65%), the Philippines (4.59%), Malaysia (3.95%), and Thailand (3.93%). Even in terms of per capita healthcare expenditure (adjusted for purchasing power parity [PPP] with the U.S. dollar in 2005), Indonesia is placed last in South East Asia at just $150 per person in 2012, although this is up 8% (CAGR) from the meager $109 spent in 2008. Singapore spends the most per person ($2,880), followed by Malaysia ($676), Thailand ($385), Vietnam ($233), and the Philippines ($203). Yet, urbanization and a slowly aging population is expected to drive greater demand for healthcare and hence greater healthcare expenditure in Indonesia.
While public healthcare is almost wholly funded by the MoH, the private sector depends greatly on individual out-of-pocket expenditure. Due to poor level of service in public sector, patients tend to switch to private healthcare providers.
Healthcare expenditure remains low in Indonesia at mere 3% of GDP. Indonesia ranks last among peer nations even in terms of per capita healthcare expenditure (PPP) with $105 per person in 2012.
Historically, districts accounted for around 50% of total healthcare spending followed by the central government (one-third) and provincial governments (<20%). But, after implementation of the JKN in January 2014, the central government’s share of healthcare spending may increase.

39
Healthcare Market Access: Indonesia
© phamax AG, 2015 - All Rights Reserved
Source: World Bank
Source: World Bank
Source: World Bank
Source: World Bank
Table 25: Healthcare expenditure (% of GDP), Indonesia, 2008 - 2012
Year 2008 2009 2010 2011 2012 %
of GDP 2.81 2.83 2.92 2.86 3.03
Figure 28: Healthcare expenditure per capita, PPP ($), Indonesia, 2008 - 2012
Table 26: Healthcare expenditure per capita, PPP ($), Indonesia, 2008 - 2012
Year 2008 2009 2010 2011 2012 Healthcare expenditure
per capita ($)* 109 114 125 132 150
Figure 27: Healthcare expenditure (% of GDP), Indonesia, 2008 - 2012
2.81 2.83 2.92 2.86 3.03
0
1
2
3
4
5
2008 2009 2010 2011 2012
Hea
lthca
re e
xpen
ditu
re
109 114 125 132 150
0
50
100
150
200
2008 2009 2010 2011 2012Hea
lthca
re e
xpen
ditu
re
per
capi
ta, P
PP ($
)
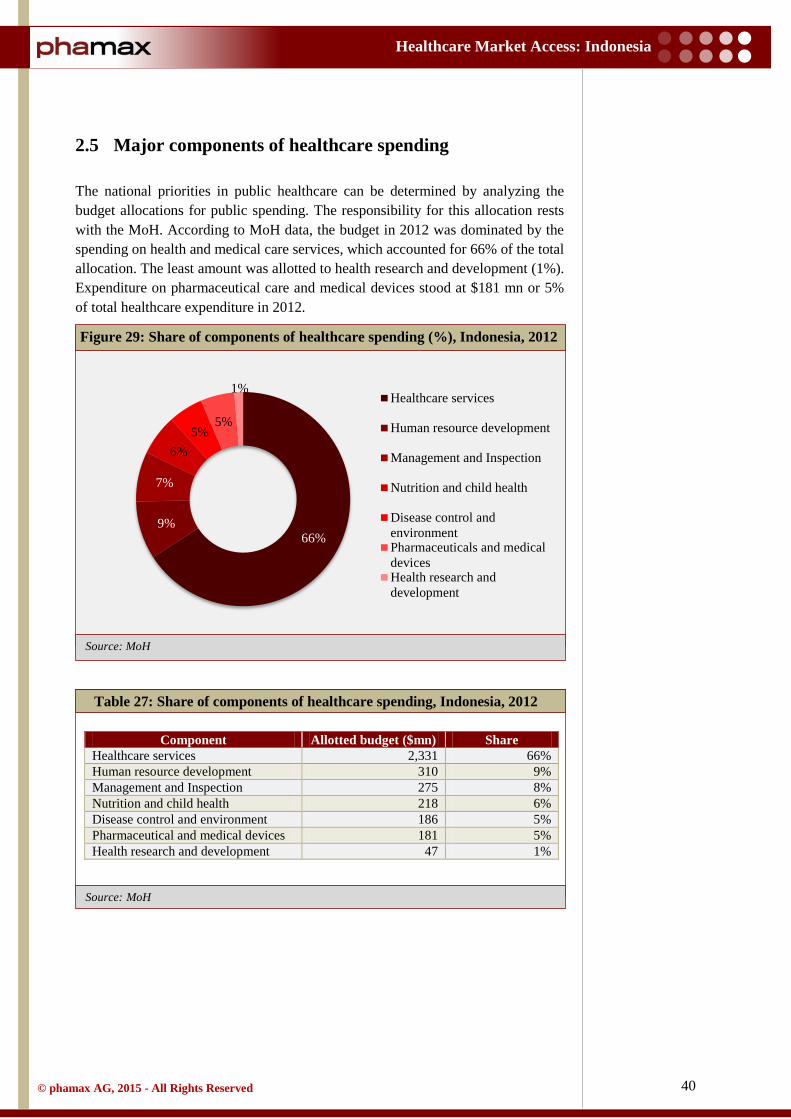
40
Healthcare Market Access: Indonesia
© phamax AG, 2015 - All Rights Reserved
Source: MoH
Source: MoH
2.5 Major components of healthcare spending
The national priorities in public healthcare can be determined by analyzing the budget allocations for public spending. The responsibility for this allocation rests with the MoH. According to MoH data, the budget in 2012 was dominated by the spending on health and medical care services, which accounted for 66% of the total allocation. The least amount was allotted to health research and development (1%). Expenditure on pharmaceutical care and medical devices stood at $181 mn or 5% of total healthcare expenditure in 2012.
Table 27: Share of components of healthcare spending, Indonesia, 2012
Component Allotted budget ($mn) Share Healthcare services 2,331 66% Human resource development 310 9% Management and Inspection 275 8% Nutrition and child health 218 6% Disease control and environment 186 5% Pharmaceutical and medical devices 181 5% Health research and development 47 1%
Figure 29: Share of components of healthcare spending (%), Indonesia, 2012
66% 9%
7%
6% 5%
5%
1% Healthcare services
Human resource development
Management and Inspection
Nutrition and child health
Disease control andenvironmentPharmaceuticals and medicaldevicesHealth research anddevelopment

41
Healthcare Market Access: Indonesia
© phamax AG, 2015 - All Rights Reserved
Source: World Bank
Source: World Bank
2.6 Shares of the public and private sectors
Healthcare expenditure in Indonesia is still dominated by private funds, but public expenditure is growing faster than private expenditure (4.2% vs. 0.2% CAGR during the period 2008 - 2012). In 2012, public funds accounted for 40% (up from 36% in 2008) of total expenditure on healthcare (or 1.2% of GDP). Private expenditure accounted for the other 60% (down from 64% in 2008) or 1.83% of GDP. Thus, private sector expenditure on health has continued to lose its share in total expenditure, although the total amount of private spending has increased over the period of 2008 - 2012. This trend shows that the government has become more focused towards the betterment of public health.
Table 28: Public-private share of healthcare expenditure, Indonesia, 2008 - 2012
Year 2008 2009 2010 2011 2012 Public 35.8% 36.1% 37.7% 37.9% 39.6% Private 64.2% 63.9% 62.3% 62.1% 60.4%
Figure 30: Public-private share of healthcare expenditure, Indonesia, 2008 -
2012
36% 36% 38% 38% 40%
64% 64% 62% 62% 60%
0%
20%
40%
60%
80%
100%
2008 2009 2010 2011 2012
Hea
lthca
re e
xpen
dtur
e (%
of t
otal
)
Public Private
Although private expenditure dominates healthcare spending, share of public healthcare expenditure is growing fast due to the government’s focus toward betterment of public health.

42
Healthcare Market Access: Indonesia
© phamax AG, 2015 - All Rights Reserved
2.7 Pharmaceutical expenditure
Confirming with OECD health data, pharmaceutical expenditure per capita in Indonesia is much lower than in other South East Asian countries. Indonesia’s spending on drugs per capita was a mere $18 (PPP) in 2009, compared with $369 in Singapore, $144 in Thailand, $104 in Vietnam, $55 in Malaysia, and $47 in the Philippines. In addition, this pharmaceutical expenditure, despite being very low, accounted for the majority of out-of-pocket spending in healthcare and approximately 50% of the total insurance cost. Thus, to control drug expenditure, insurance providers are forcing health providers to switch to more cost effective drugs, including generic drugs. Still, pharmaceutical expenditure in Indonesia is expected to increase due to the rise in per capita income and expected increases in government health expenditure.
At $18, pharmaceutical expenditure per capita in Indonesia is much lower than in other South East Asian countries. Still, it is likely to go up due to rising incomes and increase in government healthcare expenditure.

43
Healthcare Market Access: Indonesia
© phamax AG, 2015 - All Rights Reserved
2.8 Spending in pharmaceutical R&D
The local players in Indonesia have been ignoring the prominence of R&D and hence are compelled to replicate not only generics but also other prescription drugs and vitamin supplements. Unable to balance high production costs and low market prices, the local companies have compromised with the spending on research and development activities. While the innovators extensively focus on brand promotion and positioning, the local players confine themselves to generic products. Indonesia with its unique consumer profile, offers an untapped market conducive for both natural and chemical medicines. Global and local companies can seize this advantage with improved research and development capabilities and tailored marketing strategies specific to the country. Lack of government support in providing a platform to boost R&D and weak intellectual property rights regulations are currently hindering the initiatives from major MNCs to establish their R&D and manufacturing centers in Indonesia.
Unable to balance high production costs and low market prices, the local companies have compromised with the spending on R&D activities. Lack of government support and weak intellectual property rights regulations hinder the growth of R&D.

44
Healthcare Market Access: Indonesia
© phamax AG, 2015 - All Rights Reserved
2.9 Health insurance
Indonesia is one of the several low-to-middle-income countries aiming to improve their health financing systems and provide high-quality, affordable healthcare coverage to all its citizens. Already the average Indonesian has access to various sources of health insurance, which currently cover approximately 66% of the population in some form. This leaves a full one-third of the population without any health insurance coverage.
Social health insurance in Indonesia began in 1968 with the Askes plan for public sector employees - all civil servants, retired civil servants, retired military personnel, veterans, and their families. To fund Askes, civil servants contributed 2% of their basic salaries, which was matched by an equal contribution from the government. By 2012, Askes covered around 17.3 mn people, providing them comprehensive out-patient and in-patient care. Askes also has a provision for cost sharing in certain medical treatments, i.e., dialysis, heart surgery, and transplantation.
For employees in the organized private sector, who made up one-third of the workforce (in 2010), the government created PT Jamsostek in 1977 as a state-owned company designated to manage social insurance. A social security law passed in 1992 allowed this scheme to expand considerably. Jamsostek provides four programs, namely, employment injury insurance, life insurance, old age savings, and health insurance. It is funded by employers who must pay 3% (for singles) and 6% (for workers with dependents) of wages as premium. Jamsostek covers out-patient care by public and private providers but in-patient care by public providers only.
For the poor and the unorganized sector, the government started a program called Askeskin in 2005, which was renamed Jamkesmas and was expanded to cover the near-poor as well in 2007. Beneficiaries were selected through poverty lists prepared by the Indonesian Bureau of Statistics and the program was directly financed by the MoH. Jamkesmas is the largest program managed by a central government, covering more than 78 mn people, around one third of Indonesia’s population. Coverage includes basic out-patient care and in-patient care at basic level wards in public hospitals and in few designated private hospitals as well. In 2011, Jamkesmas was extended to cover delivery expenses through a free delivery scheme (Jampersal). The scheme covers antenatal care, delivery, and post-partum care, including family planning services and newborn care. Another program was also created, Jamkesda, which is similar to Jamkesmas but is financed by the local government. It covers almost 34 mn poor and near-poor people identified by local authorities, which accounts for around 14% of the total population.
Apart from these public insurance programs, there are several private insurance providers in Indonesia. According to a report published by the MoH, around 6.5% of the population was covered by corporate insurance programs, mainly in urban areas. Leading players in the health insurance sector include AXA, Prudential,
Approximately 66% of the Indonesian population is covered by health insurance, largely by various public health insurance schemes while 2.5% is covered by private health insurance.
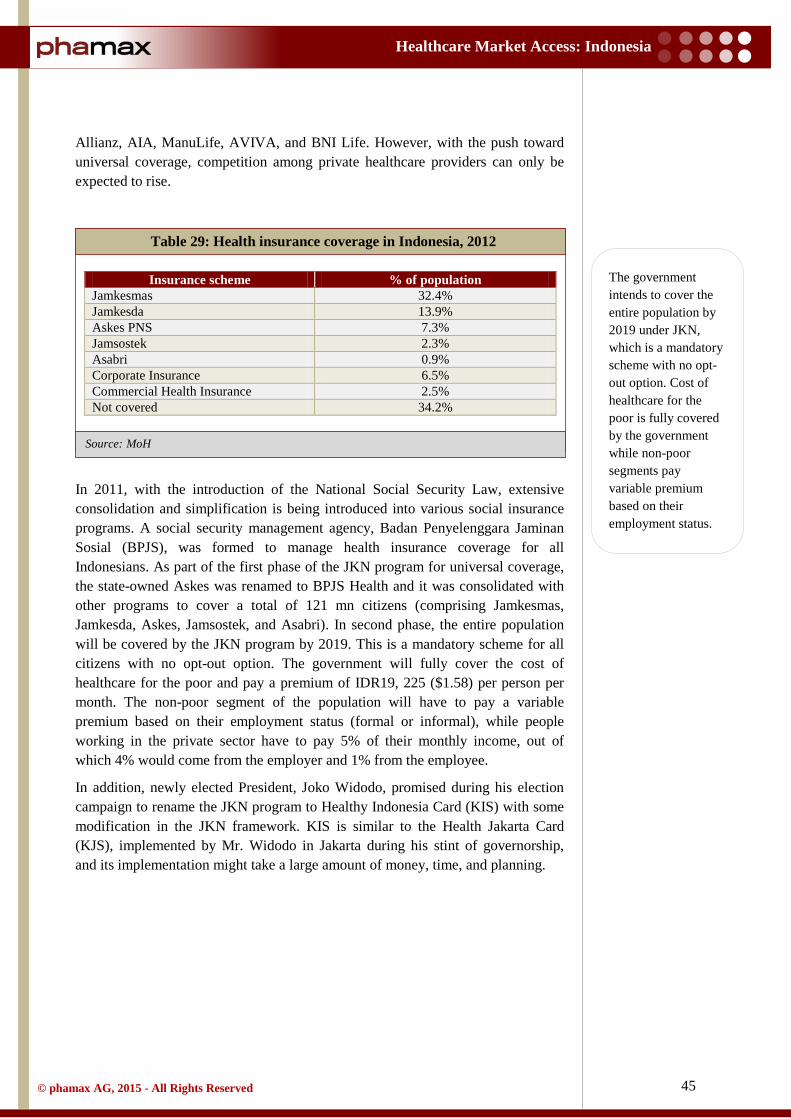
45
Healthcare Market Access: Indonesia
© phamax AG, 2015 - All Rights Reserved
Source: MoH
Allianz, AIA, ManuLife, AVIVA, and BNI Life. However, with the push toward universal coverage, competition among private healthcare providers can only be expected to rise.
Table 29: Health insurance coverage in Indonesia, 2012
Insurance scheme % of population Jamkesmas 32.4% Jamkesda 13.9% Askes PNS 7.3% Jamsostek 2.3% Asabri 0.9% Corporate Insurance 6.5% Commercial Health Insurance 2.5% Not covered 34.2%
In 2011, with the introduction of the National Social Security Law, extensive consolidation and simplification is being introduced into various social insurance programs. A social security management agency, Badan Penyelenggara Jaminan Sosial (BPJS), was formed to manage health insurance coverage for all Indonesians. As part of the first phase of the JKN program for universal coverage, the state-owned Askes was renamed to BPJS Health and it was consolidated with other programs to cover a total of 121 mn citizens (comprising Jamkesmas, Jamkesda, Askes, Jamsostek, and Asabri). In second phase, the entire population will be covered by the JKN program by 2019. This is a mandatory scheme for all citizens with no opt-out option. The government will fully cover the cost of healthcare for the poor and pay a premium of IDR19, 225 ($1.58) per person per month. The non-poor segment of the population will have to pay a variable premium based on their employment status (formal or informal), while people working in the private sector have to pay 5% of their monthly income, out of which 4% would come from the employer and 1% from the employee.
In addition, newly elected President, Joko Widodo, promised during his election campaign to rename the JKN program to Healthy Indonesia Card (KIS) with some modification in the JKN framework. KIS is similar to the Health Jakarta Card (KJS), implemented by Mr. Widodo in Jakarta during his stint of governorship, and its implementation might take a large amount of money, time, and planning.
The government intends to cover the entire population by 2019 under JKN, which is a mandatory scheme with no opt-out option. Cost of healthcare for the poor is fully covered by the government while non-poor segments pay variable premium based on their employment status.

46
Healthcare Market Access: Indonesia
© phamax AG, 2015 - All Rights Reserved
Source: MoH
Source: MoH
Source: MoH Note: * represents public hospitals and ^ represents private hospitals
2.10 Hospital sector
The hospital sector in Indonesia is served by both the government and private entities. Since 2011, hospitals have been formally categorized as being private or public based on a decree from the Minister of Health on hospital licensing. Public hospitals are normally managed by the central and local governments, but some are managed by non-profit NGOs. Private hospitals are, of course, managed by corporations or incorporated companies with a profit motive.
The total number of hospitals has grown to 2,228 in 2013, compared to 1,523 hospitals in 2009, at a CAGR of 11%.
Table 30: Number of hospitals, Indonesia, 2009 - 2013
Year 2009 2010 2011 2012 2013 Total
hospitals 1,523 1,632 1,719 2,083 2,228
Table 31: Hospital segmentation based on ownership, Indonesia, 2013
Organizer/Owner 2009 2010 2011 2012 2013 MoH/local
government* 552 585 614 656 676
Army/Police* 125 131 134 154 159
Other Ministries* 78 78
3 3 3 State-owned hospitals^ 77 75 67
Private^ 768 838
237 468 599 Non-profit
private* 654 727 724
Total 1,523 1,632 1,719 2,083 2,228
Figure 31: Number of hospitals, Indonesia, 2009 - 2013
1,523 1,636 1,719 2,083 2,228
0
1,000
2,000
3,000
2009 2010 2011 2012 2013
Num
ber
of h
ospi
tals
CAGR: 11% (2009–2013)

47
Healthcare Market Access: Indonesia
© phamax AG, 2015 - All Rights Reserved
Source: MoH
Source: MoH
Hospitals in the public sector grew at a steady rate of 5% over the period of three years from 2011 to 2013 and stretched to 1,562 units in 2013. The private sector, however, recorded much higher growth (46%) during the same time period to reach 666 units in 2013 from the 314 units already present in 2011. Realizing the great opportunity in the private sector, several major property developers have entered into the private hospital business. The Mayapada Group has built two hospitals, while the Ciputra Group, which established its first hospital in Banten in 2011, is planning to construct ten more hospitals in the next five years with a total investment of $150 bn. The Lippo Group currently owns more than fifteen hospitals in Indonesia and is striving for further expansion. In addition, the national investment coordinating board (BKPM) has relaxed restrictions on foreign ownership of hospitals for ASEAN investors, who can now own 70% stakes in specialty hospitals (up from 67%).
Table 32: Number of private and public hospitals, Indonesia, 2011 - 2013
Public hospitals are, of course, financed mainly through the government budget for healthcare, but also depend on out-of-pocket spending by patients and reimbursement from health insurance schemes. In addition, Indonesia introduced a financial management policy for public hospitals that enables hospital managements to operate autonomously. The main aim of this policy is to encourage hospitals to recover more of their costs from the patients who are able to pay and thus increase efficiency. In contrast, financing for private hospitals comes
Figure 32: Number of private and public hospitals, Indonesia, 2011 - 2013
Year 2011 2012 2013 Public hospitals 1,405 1,540 1,562 Private hospitals 314 543 666 Total hospitals 1,719 2,083 2,228
1,405 1,540 1,562
314 543 666
0
1,000
2,000
3,000
2011 2012 2013
Num
ber
of h
ospi
tals
Public Private
Compared to 5% growth in the number of hospitals in the public sector, the private sector saw a huge growth where the number of hospitals more than doubled over 2011 - 2013.

48
Healthcare Market Access: Indonesia
© phamax AG, 2015 - All Rights Reserved
Source: MoH
Source:
Source: MoH
largely from patients and private firms, while insurance covers only a small portion.
Hospitals in Indonesia are categorized into levels A, B, C, and D depending upon the facilities they provide, with A-level hospitals being the most advanced and D-level hospitals providing only the basic facilities. There were 57 hospitals (50 public and seven private hospitals) in the A category in 2013, compared with only 40 units (40 public and three private hospitals) in 2011, showing trends in advancement in hospital facilities in the last few years.
Table 33: Number of hospitals by category, Indonesia, 2013
In addition, hospitals are divided into two categories based on the types of services they provide: general and specialty. The number of general hospitals has risen to 1,718 in 2013 compared with only 1,202 in 2009 at a CAGR of 12%. Moreover, specialty hospitals have increased from 321 units in 2009 to 510 units in 2013, at CAGR of 21%. However, the private sector has recorded more growth in general and specialty hospitals than the public sector.
Table 34: Number of general and specialty hospitals, Indonesia, 2009 - 2013
A B C D Not classified Total
Public hospitals 50 233 543 352 384 1,562 Private hospitals 7 61 197 165 236 666 Total hospitals 57 294 740 517 620 2,228
Figure 33: Number of general and specialty hospitals, Indonesia, 2009 - 2013
Year 2009 2010 2011 2012 2013 General hospital 1,202 1,295 1,371 1,608 1,718 Specialty hospital 321 337 348 475 510
Total hospital 1,523 1,632 1,719 2,083 2,228
1,202 1,295 1,371 1,608 1,718
321 337 348 475 510
0
1,000
2,000
3,000
2009 2010 2011 2012 2013
Num
ber
of h
ospi
tals
General Specialilty
Hospitals in Indonesia are categorized into levels A, B, C, and D depending upon the facilities they provide, with A-level hospitals being the most advanced and D-level hospitals providing only the basic facilities.

49
Healthcare Market Access: Indonesia
© phamax AG, 2015 - All Rights Reserved
Source: MoH
Source: MoH
Of the 475 specialized hospitals in 2012, 33% (169 units) were maternal and child hospitals, 19% (94 units) were maternity hospitals, and 15% (53 units) were mental hospitals, as shown in the graph below. Other specialized hospitals included hospitals for tuberculosis, cancer, infectious diseases, orthopedics, internists, surgical care, cardiac attention, child care, kidney treatment, and dental and oral care.
The capacity of hospitals in terms of number of beds increased to 278,450 in 2013 compared with 163,680 beds in 2009, at a CAGR of 16%. Of these, a vast majority of beds (226,522 beds or 81%) were in public hospitals, while only 51,928 beds were in private hospitals. Likewise, the ratio of bed to population grew to 111 per 100,000 in 2013 from 69 per 100,000 in 2009. However, the MoH is targeting a bed-to-population ratio of 200 per 100,000 populations by 2025.
Figure 34: Distribution of specialized hospitals by type, Indonesia, 2012
Figure 35: Number of beds, Indonesia, 2009 - 2013
35.6%
33.5%
19.8%
11.2% Maternity and childhospitalsOther specialized hospitals
Maternity hospitals
Mental hospitals
164 159 171 238
278
69 66 70
97
111
-
20
40
60
80
100
120
0
100
200
300
2009 2010 2011 2012 2013
Num
ber
of b
eds p
er 1
00,0
00
popu
latio
n
Num
ber
of b
eds(
in th
ousa
nds)
Beds Number of beds per 100,000 population

50
Healthcare Market Access: Indonesia
© phamax AG, 2015 - All Rights Reserved
Source: MoH
Table 35: Number of beds, Indonesia, 2009 - 2013
To monitor and oversee the services provided by private and public hospitals, the Indonesian government established a hospital supervisory agency (Badan Pengawas Rumah Sakit Indonesia, BPRSI). This agency consists of government and public representatives who analyze reports from hospitals and provide recommendations to the central and provincial governments.
2.10.1 Major hospital profiles
The hospital sector in Indonesia is expanding rapidly, especially in the private sector. Moreover, most of the internationally recognized and Joint Commission International (JCI) accredited hospitals are private hospitals. Out of the more than sixteen JCI accredited hospitals in Indonesia, only two are public: Central Army Gatot Subroto Hospital and Dr. Cipto Mangunkusumo Hospital. The MoH is expecting more hospitals to gain accreditation from the JCI in the near future. Some of the major hospitals in Indonesia include:
• Siloam Hospital • Santosa Hospital • Eka Hospital • Premier Hospital (Ramsey Healthcare Group) • RSUP Sanglah • Dr. Cipto Mangunkusumo Hospital • Rumah Sakit Pondok Indah - Puri Indah • Central Army Gatot Subroto Hospital • Awal Brothers Hospital • Fatmawati General Hospital
2.10.1.1 Siloam Hospital Group
Siloam Hospital Group (SHG) is the one of the largest hospital groups in Indonesia, with sixteen hospitals spread over Java, Kalimantan, Sulawesi, and Sumatra provinces. SHG has more than 3,000 doctors and nurses to serve more than one million patients per annum. All SHG hospitals are equipped with contemporary and modern medical facilities. Besides, the group is planning to open 29 new hospitals in the country by 2017.
Year 2009 2010 2011 2012 2013 Number of beds (in thousands) 164 159 171 238 278
Number of beds per 100,000 population 69 66 70 97 111

51
Healthcare Market Access: Indonesia
© phamax AG, 2015 - All Rights Reserved
Siloam Hospital Lippo Village, established in 1996, is the one of the oldest and largest hospitals of the SHG group and is accredited by the JCI. This hospital is a Centre of Excellence for Neurosciences, Cardiology, and Radiology. As of December 2013, Siloam Hospital Lippo Village had 229 doctors (40 general and 189 specialists), 481 nurses and 251 operational beds. The hospital is equipped with state-of-the-art diagnostic and surgical facilities such as a 3-T Magnetic Resonance Imaging (MRI) machine, a 64-slice Dual-source Computed Tomography (DSCT) machine and a Gamma Knife radiosurgery facility.
2.10.1.2 Eka Hospital
Eka Hospital was established in 2008 and shortly after its inception received national accreditation from the MoH. It has two branches, Eka Hospital BSD, situated in Banten Province and Eka Hospital PKU, in Riau Province. The hospital employs an integrated Electronic Medical Record (EMR) system for enhanced efficiency levels. The two branches together have a total capacity of 400 beds, served by 40 full-time general physicians and over 180 specialists and surgeons. In addition, they operate a total of 65 out-patient clinics that focus on different specialties and cover almost all of them.
Eka Hospital BSD gained JCI accreditation in 2010 and again in February 2014. The hospital has 40 out-patient clinics and more than 180 beds in the building. It is well equipped as a referral hospital for neurological, cardiovascular, and maternal/pediatric care with modern diagnostic and intervention techniques such as MRI, Multi-slice Computed Tomography (MSCT), Angiography, Four-dimensional (4D) Ultrasound and Laparoscopy.
Eka Hospital PKU, which received JCI accreditation in March 2014, operates 30 out-patient clinics and has a bed capacity of 300. It employs 100 physicians (of which 54 are full-time) and 270 nurses.
2.10.1.3 Santosa Hospital
Santosa Hospital is a leading private hospital in Western Java, established in 2006. It received JCI accreditation in 2014. It is equipped with 400 beds that are served by 200 physicians (of which one-third are full-time), working with state-of-the-art diagnosis and intervention facilities. The hospital provides services in all specialties and sub-specialties, but is particularly noted for its excellence in neuroscience, cardiac care, minimal invasive surgery and skin and beauty. Further, Santosa Hospital has collaborations with multiple foreign institutions and hospitals from Australia and Singapore, including the Victorian Hearth Centre (Australia), SingHealth Group (Singapore) and Parkway Healthcare Group (Singapore).

52
Healthcare Market Access: Indonesia
© phamax AG, 2015 - All Rights Reserved
2.10.1.4 Dr. Cipto Mangunkusumo Hospital (RSCM)
Dr. Cipto Mangunkusumo Hospital in Central Jakarta is the largest hospital owned by the MoH. Besides being a public hospital, it is also a teaching hospital affiliated with the University of Indonesia. With more than 1000 beds, this hospital serves an average of 4,000 patients per annum, of which 2,000 visit the OPD and 65% are poor. Dr. Cipto Mangunkusumo Hospital also serves as a referral hospital for healthcare centers (Puskesmas) in Jakarta through an online referral system.
2.10.1.5 Premier Hospital – Ramsey Healthcare Group
The Premier Hospitals chain is owned by Australia’s largest private group of hospitals, the Ramsey Healthcare Group, which has more than 100 hospitals in Australia, the U.K., France, Malaysia and Indonesia. The chain in Indonesia currently includes three hospitals: Premier Hospital Bintaro, Premier Hospital Surabaya, and Premier Hospital Djatinegara.
Premier Hospital Bintaro, in Bintaro province, was established in 1998 as the RS Premier Plastica Hospital, but was renamed in 2010. The hospital, which was accredited by JCI in 2014, continuously attempts to provide the latest technology in an effort to provide the best possible services.
Premier Hospital Surabaya was established by Ramsay Healthcare group in 1998 in Eastern Surabaya. The hospital has a capacity of 168 beds and it provides healthcare services in all therapeutic and diagnosis areas through its outpatient and inpatient services.
Premier Hospital Djatinegara, in the capital Jakarta, is a leading private hospital with more than 280 beds and is also well-equipped in terms of diagnostic and interventional technologies, including three-dimensional (3D) ultrasound, a 1.5-T MRI and MSCT.
2.10.1.6 Central Army Gatot Subroto Hospital
Gatot Subroto Army Hospital, established in 1819 by the colonial Dutch army, was renamed after Lt. Gen. Gatot Subroto, a national hero. It is the main hospital of the Indonesian Army, but also serves civilians as a public hospital. It received JCI accreditation in 2014 and serves all specialty and sub-specialty areas. It is equipped with the latest equipment, including a 64-slice MSCT, 1.5-T MRI, a linac CT simulator, 3D Digital Subtraction Angiography (3D-DSA), and 4D ultrasound.
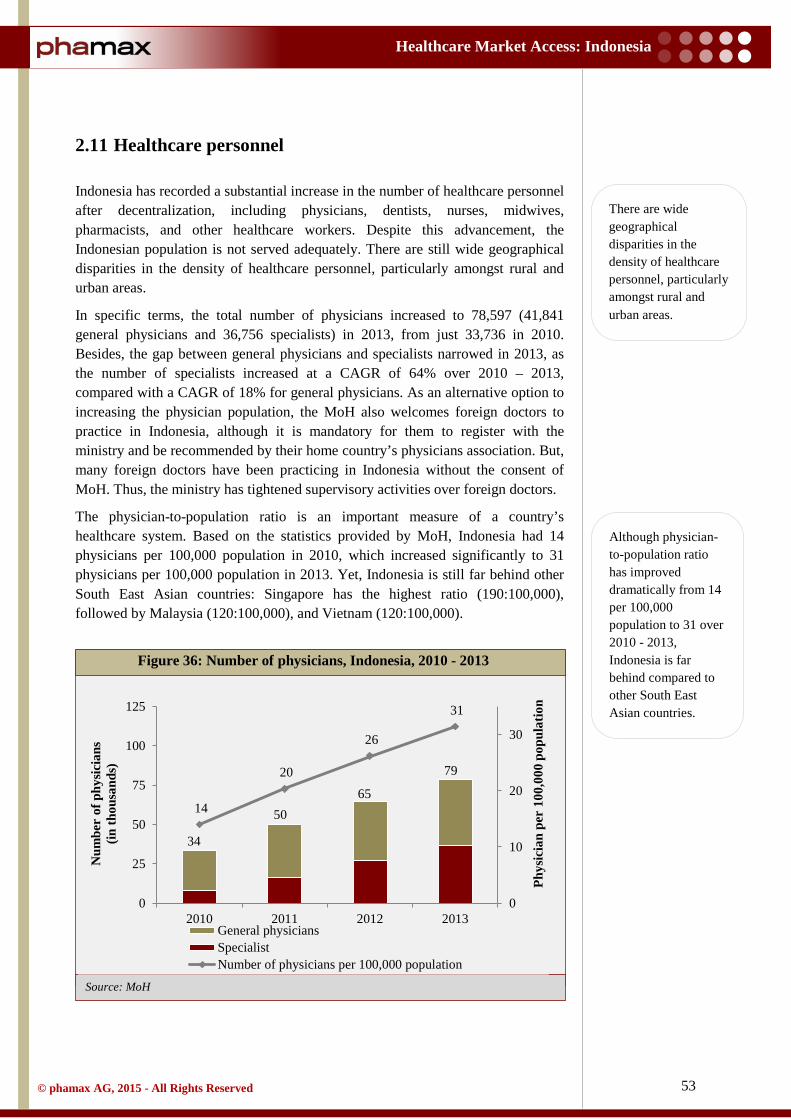
53
Healthcare Market Access: Indonesia
© phamax AG, 2015 - All Rights Reserved
Source: MoH
2.11 Healthcare personnel
Indonesia has recorded a substantial increase in the number of healthcare personnel after decentralization, including physicians, dentists, nurses, midwives, pharmacists, and other healthcare workers. Despite this advancement, the Indonesian population is not served adequately. There are still wide geographical disparities in the density of healthcare personnel, particularly amongst rural and urban areas.
In specific terms, the total number of physicians increased to 78,597 (41,841 general physicians and 36,756 specialists) in 2013, from just 33,736 in 2010. Besides, the gap between general physicians and specialists narrowed in 2013, as the number of specialists increased at a CAGR of 64% over 2010 – 2013, compared with a CAGR of 18% for general physicians. As an alternative option to increasing the physician population, the MoH also welcomes foreign doctors to practice in Indonesia, although it is mandatory for them to register with the ministry and be recommended by their home country’s physicians association. But, many foreign doctors have been practicing in Indonesia without the consent of MoH. Thus, the ministry has tightened supervisory activities over foreign doctors.
The physician-to-population ratio is an important measure of a country’s healthcare system. Based on the statistics provided by MoH, Indonesia had 14 physicians per 100,000 population in 2010, which increased significantly to 31 physicians per 100,000 population in 2013. Yet, Indonesia is still far behind other South East Asian countries: Singapore has the highest ratio (190:100,000), followed by Malaysia (120:100,000), and Vietnam (120:100,000).
Figure 36: Number of physicians, Indonesia, 2010 - 2013
34
50 65
79
14
20
26
31
0
10
20
30
0
25
50
75
100
125
2010 2011 2012 2013
Phys
icia
n pe
r 10
0,00
0 po
pula
tion
Num
ber
of p
hysic
ians
(in
thou
sand
s)
General physiciansSpecialistNumber of physicians per 100,000 population
There are wide geographical disparities in the density of healthcare personnel, particularly amongst rural and urban areas.
Although physician-to-population ratio has improved dramatically from 14 per 100,000 population to 31 over 2010 - 2013, Indonesia is far behind compared to other South East Asian countries.

54
Healthcare Market Access: Indonesia
© phamax AG, 2015 - All Rights Reserved
Source: MoH
Source: MoH
Source: MoH
Table 36: Number of physicians, Indonesia, 2010 - 2013
Indonesia has a promising future in terms of other categories of healthcare personnel as well. As reported by the Institute of Health Human Resources under the MoH, the total number of nurses per 100,000 population increased to 1,154 from just 705 in 2010. Likewise, the number of dentists has seen a positive and steady growth to reach 47 per 100,000 population in 2013 from just 36 in 2010. Similarly, the number of pharmacists has also increased from 75 per 100,000 population in 2010 to 161 in 2013.
Table 37: Healthcare personnel (per 100,000 population), Indonesia, 2010 - 2013
Year 2010 2011 2012 2013 Specialists 8,403 16,574 27,333 36,756
General physicians 25,333 33,172 37,364 41,841
Total physicians 33,736 49,746 64,697 78,597
Physician-to-population ratio (per 1,00,000) 14 20 26 31
Figure 37: Healthcare personnel (per 100,000 population), Indonesia,
2010 - 2013
Year 2010 2011 2012 2013 Dentist 36 43 48 47
Pharmacist 75 104 126 161
Nurses 705 945 954 1,154
705
945 954
1,154
75 104 126 161
36 43 48 47 0
300
600
900
1,200
2010 2011 2012 2013
Num
ber
of p
erso
nnel
Nurses Pharmacist Dentist

55
Healthcare Market Access: Indonesia
© phamax AG, 2015 - All Rights Reserved
3 Overview of Pharmaceutical Market
3.1 Market overview
Indonesia represents one of the most attractive emerging markets for the pharmaceutical industry. With an estimated population of 250 mn, Indonesia is the fourth most populous country in the world and is bound to continue its growth as one of the fastest-expanding pharmaceutical markets in the Asia-Pacific (APAC) region. The pharmaceutical industry in Indonesia is already growing at a double-digit rate and is expected to become one of the largest pharmaceutical markets in the region within the next few years. More specifically, the Indonesian pharmaceutical market, worth $5.1 bn in 2013, is expected to grow at a CAGR of 12.7% over the next few years.
A total of 239 pharmaceutical companies currently operate in the country, comprising domestic and multinational (MNC) players. The former currently dominates the Indonesian drug market with an approximate 75% share. The major domestic players are PT Kalbe Farma, PT Sanbe Farma, PT Kimia Farma, and PT SOHO Industri Pharmasi. However, these local companies are largely generic producers that are dependent on imported active pharmaceutical ingredients (API), mainly from China and India. The MNCs, which hold the rest of the market, generally source their APIs from the US, Europe and Japan. The major MNCs in Indonesia include global majors such as Pfizer, Bayer, Novartis, GSK, and Merck.
Cost-containment being a high priority for the Indonesian government, the local players could benefit greatly. The generics segment, dominated by local players, already accounts for more than 90% of the total pharmaceutical market. Although branded generics (off-patent drugs sold with a new name) hold a key position with one-third market share, the government is focusing on greater use of cheaper unbranded generics. An additional factor favoring local players is the over-the-counter (OTC) segment, which they dominate. OTCs have captured almost 41% of the total market and are expected to grow further, driven by the increasing self-medication behavior of the population. Given the expected market growth, many MNCs and domestic pharmaceutical companies have started to expand their manufacturing capacity in the country. This expansion has also received some regulatory help with a relaxation in foreign direct investment (FDI) limits for the pharmaceutical industry from 75% to 85%.
Overall, the growth in the Indonesian market is broad, with a strong boost from increasing consumer spending, rapid urbanization and the transition towards universal healthcare insurance coverage. Thus, as seen in other emerging markets, lifestyle segments such as cardiovascular drugs, anti-diabetes, anti-depressants and anti-cancers will continue to be lucrative and fast growing. Additionally, increasing government spending on healthcare and the implementation of the Grand National Health Insurance plan (JKN) will increase both the quality of health services and their accessibility to the average citizen, contributing to further expansion of the Indonesian pharmaceutical market.
Indonesian pharmaceutical market, worth $5.1 bn in 2013, is expected to grow at a CAGR of 12.7% over the next few years.
Local companies are largely generic producers that are dependent on imported active pharmaceutical ingredients (API), mainly from China and India.
56
Healthcare Market Access: Indonesia
© phamax AG, 2015 - All Rights Reserved
3.2 Industry structure
The pharmaceutical industry in Indonesia is highly competitive, with around 239 local and foreign players. Interestingly, most of these companies (~90%) are concentrated in only four contiguous provinces on Java Island: West Java (94), East Java (46), Central Java (23), and Jakarta (50).
Local pharmaceutical companies such as PT Kalbe Farma, PT Sanbe Farma, PT SOHO Industri Pharmasi, Indofarma, and Kimia Farma dominate the Indonesian pharmaceutical market. Notably, Kimia Farma and Indofarma are state owned and the government has long intended to merge them. MNCs also have a strong presence in Indonesia, although they are subject to several restrictions. For example, according to Decree 1010 of the Ministry of Health Republic of Indonesia (MoH RI), foreign companies must produce drugs locally or in partnership with local manufacturing companies. Moreover, foreigners can only own up to 85% of a pharmaceutical company registered in Indonesia. In response to the above policy, companies such as Pfizer, MSD, and Sanofi have strategically started or expanded local production operations, while others have acquired or partnered with local companies. Despite the limitations on ownership and the mandatory local production policy, Indonesia has no dearth of foreign companies, including the established presence of global giants such as Novartis, Novo Nordisk, Sanofi, Merck, and Pfizer.
Despite the competition, there is a severe lack of production capability for active pharmaceutical ingredients (API) in Indonesia. Manufacturers are dependent on imports for around 85% - 90% of APIs, mainly from China, India and (to a lesser extent) the US. The National Agency of Drug and Food Control revealed that acetaminofen, amoxicillin, thiamine, and diclofenec were the most frequently imported APIs in 2012. Furthermore, 95% of the pharmaceutical products produced in the country are consumed domestically. But, the export trend is rising, although its share is not significant due to the high tax rate on exports imposed by the Indonesian government and the stiff competition from China and India. This import dependence for domestic consumption has led to generally higher prices for medicines in Indonesia.
FDI is allowed up to 85% in the pharma sector. But, foreign companies must produce drugs locally or in partnership with local manufacturing companies.
Lack of production capability for APIs force Indonesian manufacturers to rely on imports for around 85% - 90% of APIs.

57
Healthcare Market Access: Indonesia
© phamax AG, 2015 - All Rights Reserved
Source: Kalbe Farma Annual Report 2013 * by value
Source: Kalbe Farma Annual Report 2013 * by value
3.3 Market segments
The pharmaceutical market in Indonesia has two main segments: prescription (ethical) drugs and OTC drugs. The prescription segment is further divided into three sub-segments: patented drugs, off-patent drugs (branded generics) and unbranded generics. Branded generics are off-patent drugs repackaged with a new name at a lower price than patented drugs, but higher than unbranded generics.
Table 38: Pharmaceutical market segments, Indonesia, 2009 - 2013
Figure 38: Pharmaceutical market segments, Indonesia, 2009 - 2013
Year 2009 2010 2011 2012 2013 Prescription * 58% 61% 60% 59% 59%
OTC * 42% 39% 40% 41% 41%
42% 39% 40% 41% 41%
58% 61% 60% 59% 59%
0%
50%
100%
2009 2010 2011 2012 2013
Pha
mra
ceut
ical
mar
ket
segm
ent (
%) *
OTC Prescription drugs

58
Healthcare Market Access: Indonesia
© phamax AG, 2015 - All Rights Reserved
3.4 Opportunities and challenges
3.4.1 Opportunities
At the fundamental level, Indonesia is a highly attractive market, simply because of its large, growing population (fourth most populous country in the world) and its very low healthcare expenditure per capita in comparison to its peers in South East Asia. In 2009, Indonesia spent a mere $18 per capita on pharmaceuticals, compared with $369 in Singapore, $144 in Thailand, $104 in Vietnam, $55 in Malaysia and $47 in the Philippines. Thus, Indonesia has a very long way to go even to be on par with other ASEAN countries. Hence, its growing stature is a lucrative investment opportunity for investors.
Regardless of its structural problems and low healthcare spending, Indonesia is still witnessing rapid growth in urbanization. Further, the fast expansion of its middle class and its rising purchasing power makes Indonesia a lucrative market. Also, increasing healthcare investments by the government, especially as it rolls out its National Health insurance plan (JKN), will further help pharmaceutical companies penetrate the market. As JKN coverage progressively increases, it can be expected that the demand for pharmaceutical products will only increase.
Other than increased access and universal coverage, a vital opportunity stems from the fact that Indonesia is experiencing a paradigm shift in the epidemiology of chronic lifestyle-related diseases such as diabetes, cardiovascular disorders and obesity. As already seen in the larger emerging markets of China and India, the incidence and prevalence of lifestyle-related conditions are on the rise. This represents window of opportunity for pharmaceutical companies to fulfill growing unmet healthcare needs, especially those with established portfolios in the lifestyle-related segment. Again, communicable diseases such as Tuberculosis (TB) and HIV are also on the rise and require attention.
Indonesia has drawn much global attention purely because of its remarkably low healthcare expenditure and the government’s ambitious plan for universal healthcare insurance (JKN) for its massive population by 2019. The government is also encouraging greater use of unbranded generics to control costs; in fact, healthcare professionals working in public setups are already required to refer generics. This represents a exceedingly attractive opportunity for generics manufacturers: the low profit margins for generics will be easily offset by the potential size of the market. Interestingly, exports of pharmaceutical products from Indonesia, despite local unmet needs, are actually increasing because of government support and the fact that an increasingly greater number of manufacturers are meeting current good manufacturing practice (GMP) standards.
3.4.2 Challenges
Indonesia is a large, developing archipelago with a massive population spread across thousands of islands. Thus, a lack of basic infrastructure and poor access to healthcare services, especially in rural areas, are the largest challenges for the
Growth in urbanization, growing middle class and the government’s ambitious National Health Insurance Plan (JKN) make Indonesian pharma market one of the most attractive markets in South East Asia.
Paradigm shift in the epidemiology of chronic lifestyle-related diseases such as diabetes, cardiovascular disorders and obesity represents a window of opportunity for pharmaceutical companies.

59
Healthcare Market Access: Indonesia
© phamax AG, 2015 - All Rights Reserved
healthcare industry in Indonesia. Besides, the country has a dearth of technology and skills to produce APIs amply, even for local consumption. In fact, almost 90% of the APIs used domestically for the manufacture of medicines are imported. Though, the depreciation of the Rupiah and the increasing inflation rate are making continued reliance on imports a major burden.
Foreign pharmaceutical companies looking to enter the Indonesian market face many structural hurdles that stem from government policies and restrictions. For example, the MoH passed Decree 1010 in 2008 that mandated foreign pharmaceutical companies to manufacture all drugs locally in order to gain registration. Further, foreign ownership of local companies is limited to a maximum of 85%. Finding a suitable local partner to invest the remaining 15% is a difficult task. Additionally, weak laws and regulations involving Intellectual Property (IP) are a great deterrent to foreign pharmaceutical companies.
Besides regulations on indigenization and FDI, another relevant factor is that Indonesia is a Muslim-majority nation and a member of the Organization of Islamic Cooperation (OIC). Thus, all pharmaceutical companies looking to enter the market have to strongly comply with Halal. The government is in process of implementing a legislation which, if implemented, will mandate the Halal certification for medicines. The regulation may prohibit the distribution of pharmaceutical products not meeting Halal standards, barring a few that are allowed in emergencies (in which case, they must carry a special label).
Furthermore, Indonesia suffers from a proliferation of counterfeit drugs, largely in the OTC segment. In fact, counterfeit OTC products from China and Hong Kong can be easily found at drugstores across the nation. Also, as per International Pharmaceutical Manufacturers Group (IPMG), the current market for counterfeit drugs is estimated to be worth 10% of the total pharmaceutical market. Although the government, through its National Authority of Drug and Food Safety (BPOM), has initiated some countermeasures, they are remotely far from even mitigating the problem. Hence, the government needs a more sophisticated and committed approach to tackle the issue of counterfeit drugs.
Another important characteristic of the Indonesian market is the strong consensus on greater use of generics to contain costs. Hence, innovative pharmaceutical companies might face tough competition from local generic manufacturers. Profitability in the generics market is low, especially due to price controls implemented by the MoH. Retail price caps are already in place on 498 generic drugs for pharmacies, hospitals, and other healthcare institutions throughout Indonesia.
Finally, unlike in the rapid growth years of the 1990s and 2000s, Indonesia’s economy is seeing sluggish growth due to its high rate of inflation, weak currency and increasing minimum wages. All these factors have had an effect on the profit margins of the Indonesian pharmaceutical industry. Indonesia is also struggling with endemic corruption, discouraging foreign investment in all industries, including the pharmaceutical industry.
Lack of basic infrastructure, poor access to healthcare services in rural areas, counterfeit drugs, dearth of technology and skills to produce APIs are some of the major challenges for the healthcare industry.
Foreign pharma companies find it difficult to find a suitable local partner to comply with FDI norms. Weak IP laws also work as deterrents for them.
Innovative pharmaceutical companies might face tough competition from local generic manufacturers due to the growing consensus on greater use of generics to contain costs.

60
Healthcare Market Access: Indonesia
© phamax AG, 2015 - All Rights Reserved
Source: Kalbe Farma Annual Report 2013
3.5 Major players
Indonesia’s pharmaceutical market comprises 239 pharmaceutical companies and is chiefly dominated by the local companies. Local pharmaceutical companies command over 75% of the market. Rest of the share is controlled by more than 50 foreign pharmaceutical companies. A brief insight into major players in the pharmaceutical market is given below:
3.5.1 Kalbe Farma
Kalbe Farma, established in 1966, is the largest publicly listed pharmaceutical company in Southeast Asia. It is headquartered in Jakarta, but has a nationwide reach with over 16,000 permanent and contractual employees, including 6,000 sales and marketing professionals. In fact, Kalbe’s sales force reaches 70% of all general physicians and 90% of all specialists in Indonesia.
In 2013, the company registered total sales of $1.53 bn, up 5% from $1.45 bn in 2012. The company has four divisions for its products and services: prescription pharmaceuticals, consumer health, nutrition and distribution and logistics. Prescription pharmaceuticals accounted for 24% ($0.37 bn) of the total company revenue in 2013. Of these prescription products, branded generics were the biggest contributor to the total sales, with the major brands being Brainact, Cefspan, Mycoral, Cernevit, Cravit, Neuralgin, Broadced, Neurotam, and Hemapo.
The distribution and logistics division of the company is run through a subsidiary, PT Enseval Putera Megatrading Tbk (EPMT), which is responsible for delivering Kalbe’s and other third-party products to over one million outlets spread across the country.
Figure 39: Revenue by division, Kalbe Farma, 2013
36%
24%
24%
16% Distribution and Logistics
PrescriptionpharmaceuticalsNutritionals
Consumer health

61
Healthcare Market Access: Indonesia
© phamax AG, 2015 - All Rights Reserved
Source: Kalbe Farma Company Update 2013
The company has a significant presence in multiple therapeutic classes, especially antacids, anti-diarrheal, and cough and cold remedies, as shown below:
Table 39: Market share of therapeutic classes (volume), Kalbe Farma, 2013
Kalbe owns ten manufacturing facilities that comply with the international GMP standard, some of which manufacture products under license from Astellas, Daiichi and Baxter. In addition, Kalbe has expanded its generic tablet production plant to meet the growing demand for unbranded generics under the National Health Insurance plan (JKN).
3.5.2 Sanbe Farma
Sanbe, founded in 1975, is a large domestic manufacturer with more than 8,000 personnel. The company is associated with PT Bina San Prima, a distribution company with 35 depots, 60 sub-depots and more than 1,000 sales personnel that reach around 37,000 physicians all over Indonesia. Sanbe has eight GMP-compliant manufacturing sites across the country, which manufactures both branded and unbranded generics for both human and animal use and also products licensed from other international pharmaceutical companies. Sanbe’s international operations cover more than twenty countries, largely developing and under-developed countries to which it exports its generics and EU countries in which it has partnerships and alliances.
Therapeutic Class Market Share 2013 Antacid 75.2% Anti-diarrheal 44.8% Cough Remedies 33.9% Cold Remedies 37.4% Multivitamin 30.8% Pediatric Multivitamin 18.1% Energy Drink 25.0%
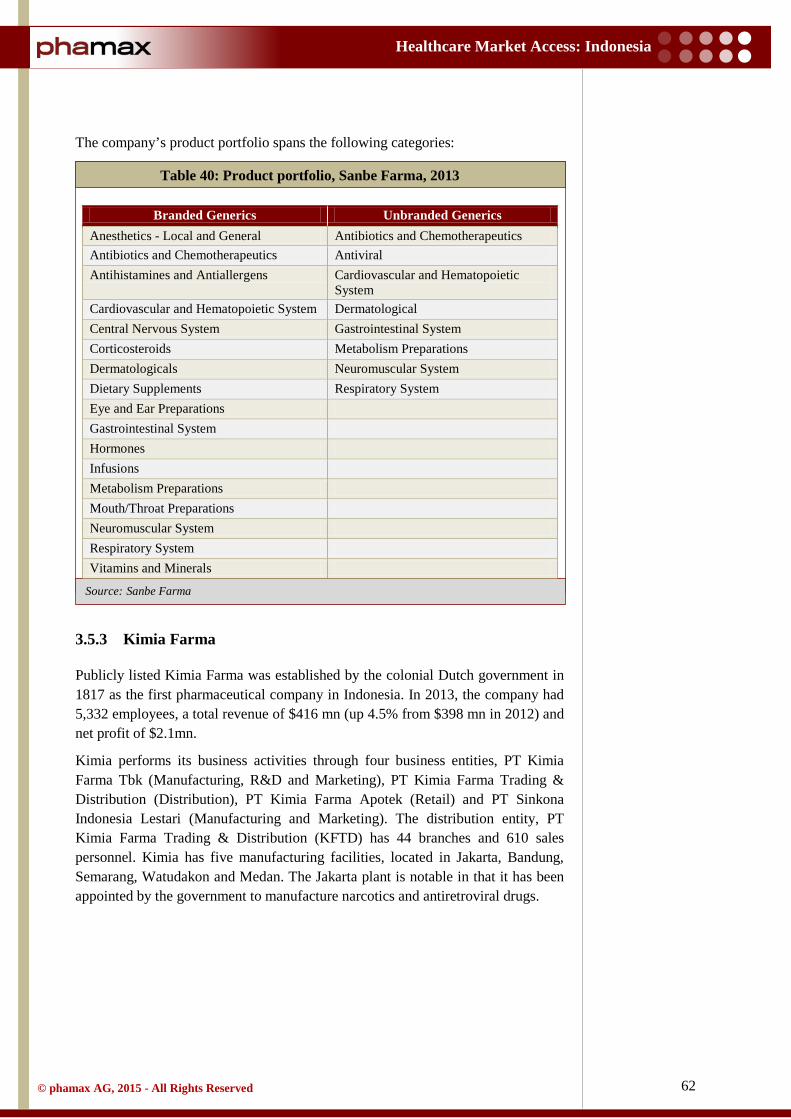
62
Healthcare Market Access: Indonesia
© phamax AG, 2015 - All Rights Reserved
Source: Sanbe Farma
The company’s product portfolio spans the following categories:
Table 40: Product portfolio, Sanbe Farma, 2013
3.5.3 Kimia Farma
Publicly listed Kimia Farma was established by the colonial Dutch government in 1817 as the first pharmaceutical company in Indonesia. In 2013, the company had 5,332 employees, a total revenue of $416 mn (up 4.5% from $398 mn in 2012) and net profit of $2.1mn.
Kimia performs its business activities through four business entities, PT Kimia Farma Tbk (Manufacturing, R&D and Marketing), PT Kimia Farma Trading & Distribution (Distribution), PT Kimia Farma Apotek (Retail) and PT Sinkona Indonesia Lestari (Manufacturing and Marketing). The distribution entity, PT Kimia Farma Trading & Distribution (KFTD) has 44 branches and 610 sales personnel. Kimia has five manufacturing facilities, located in Jakarta, Bandung, Semarang, Watudakon and Medan. The Jakarta plant is notable in that it has been appointed by the government to manufacture narcotics and antiretroviral drugs.
Branded Generics Unbranded Generics Anesthetics - Local and General Antibiotics and Chemotherapeutics Antibiotics and Chemotherapeutics Antiviral Antihistamines and Antiallergens Cardiovascular and Hematopoietic
System Cardiovascular and Hematopoietic System Dermatological Central Nervous System Gastrointestinal System Corticosteroids Metabolism Preparations Dermatologicals Neuromuscular System Dietary Supplements Respiratory System Eye and Ear Preparations Gastrointestinal System Hormones Infusions Metabolism Preparations Mouth/Throat Preparations Neuromuscular System Respiratory System Vitamins and Minerals
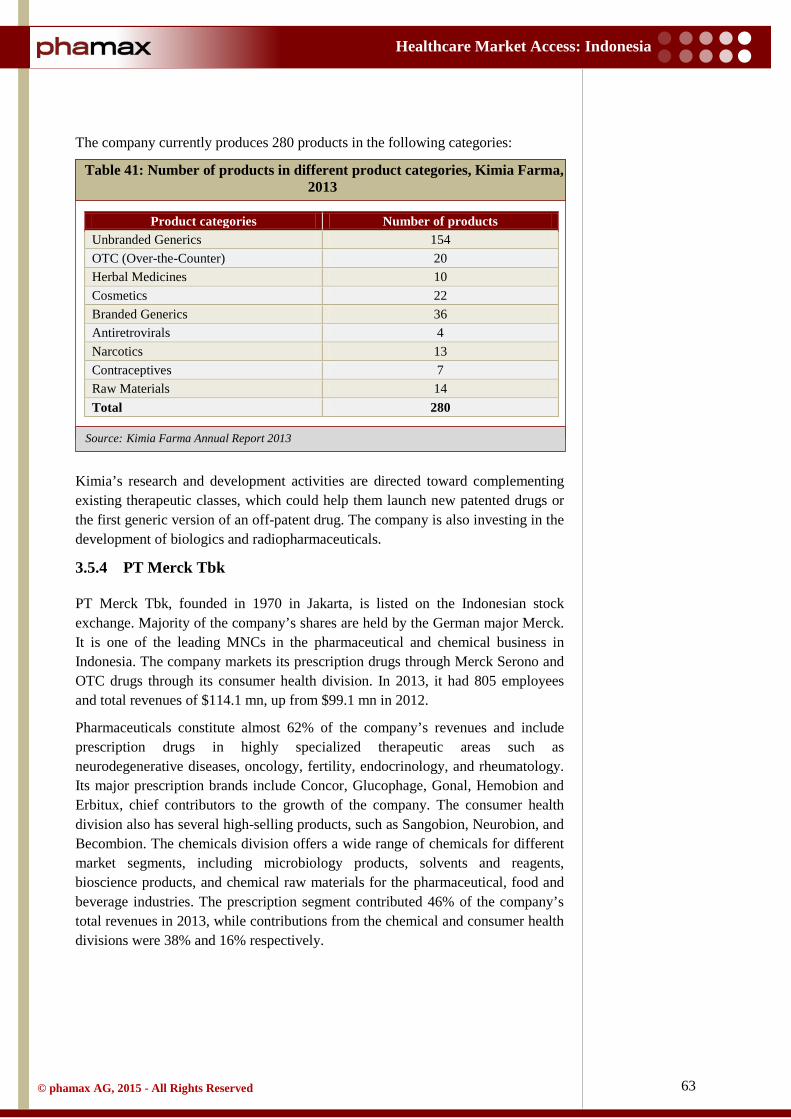
63
Healthcare Market Access: Indonesia
© phamax AG, 2015 - All Rights Reserved
Source: Kimia Farma Annual Report 2013
The company currently produces 280 products in the following categories:
Table 41: Number of products in different product categories, Kimia Farma, 2013
Kimia’s research and development activities are directed toward complementing existing therapeutic classes, which could help them launch new patented drugs or the first generic version of an off-patent drug. The company is also investing in the development of biologics and radiopharmaceuticals.
3.5.4 PT Merck Tbk
PT Merck Tbk, founded in 1970 in Jakarta, is listed on the Indonesian stock exchange. Majority of the company’s shares are held by the German major Merck. It is one of the leading MNCs in the pharmaceutical and chemical business in Indonesia. The company markets its prescription drugs through Merck Serono and OTC drugs through its consumer health division. In 2013, it had 805 employees and total revenues of $114.1 mn, up from $99.1 mn in 2012.
Pharmaceuticals constitute almost 62% of the company’s revenues and include prescription drugs in highly specialized therapeutic areas such as neurodegenerative diseases, oncology, fertility, endocrinology, and rheumatology. Its major prescription brands include Concor, Glucophage, Gonal, Hemobion and Erbitux, chief contributors to the growth of the company. The consumer health division also has several high-selling products, such as Sangobion, Neurobion, and Becombion. The chemicals division offers a wide range of chemicals for different market segments, including microbiology products, solvents and reagents, bioscience products, and chemical raw materials for the pharmaceutical, food and beverage industries. The prescription segment contributed 46% of the company’s total revenues in 2013, while contributions from the chemical and consumer health divisions were 38% and 16% respectively.
Product categories Number of products Unbranded Generics 154 OTC (Over-the-Counter) 20 Herbal Medicines 10 Cosmetics 22 Branded Generics 36 Antiretrovirals 4 Narcotics 13 Contraceptives 7 Raw Materials 14 Total 280

64
Healthcare Market Access: Indonesia
© phamax AG, 2015 - All Rights Reserved
3.5.5 PT Novartis Indonesia
Novartis entered Indonesia in 1968 with the incorporation of PT Ciba Indonesia. Today, it operates in Indonesia through three subsidiaries: Patented pharmaceuticals and OTC products are marketed by PT Novartis, which has a total of 650 employees in the country, generics have been consolidated under PT Sandoz, which manufactures them at two plants in Pasar Rebo (Jakarta) and Bandung (West Java), each with approximately 600 employees and finally, PT Ciba Vision produces contact lenses in Indonesia, which it markets globally.
In terms of research and development in Indonesia, Novartis is focused on the development of drugs for Dengue, TB, and Malaria through a partnership between the Novartis Institute for Tropical Diseases (NITD) and Hasanuddin University Research Institute (NHCRI), located in Makassar, Sulawesi.
3.5.6 Sanofi Group Indonesia
Sanofi entered Indonesia in 1969 and currently operates there through two subsidiaries, PT Sanofi-Aventis Indonesia and PT Aventis Pharma, both based in East Jakarta. The company has around 700 employees and a GMP-approved manufacturing facility in Jakarta. Sanofi’s portfolio in Indonesia includes products in cardiovascular disease, metabolic disorder and other therapeutic classes. Notably, the company has built a strong presence in the vaccine market with a portfolio spanning more than twenty diseases such as influenza, rabies, hepatitis, pneumonia, typhoid, diphtheria, pertussis and tetanus.
3.5.7 PT SOHO Industri Pharmasi
SOHO Global Health is an Indonesian healthcare conglomerate that manufactures pharmaceuticals in Indonesia through its subsidiary PT SOHO Industri Pharmasi (founded in 1951). It has a broad product portfolio under three business segments: prescription drugs, consumer health and natural products. The company produces branded and unbranded generics across most therapeutic classes.
The group has 1,500 employees, one-third of them dedicated to sales. Their distribution activities are conducted by another subsidiary, PT Parit Padang. The company also promotes the products of MNCs such as Pfizer and AstraZeneca in Indonesia through alliances. The group has two manufacturing plants capable of producing solid, liquid and semi-solid dosage forms along with herbal and nutraceutical products.

65
Healthcare Market Access: Indonesia
© phamax AG, 2015 - All Rights Reserved
Source: phamax on-ground network
3.6 Key products
The Indonesian pharmaceutical market is characterized by a strong preference for branded products (both patented and branded generics). Despite governmental preference for unbranded generics, the top ten leading pharmaceutical products in the Indonesian market are all branded products from leading pharmaceutical companies.
Table 42: Key products, Indonesia, 2013
Product Molecule Company Therapeutic class
Norvask amlodipine Pfizer Cardiovascular disease
Neurobion pyridoxine + thiamine + cyanocobalamin Merck KGaA Nutritional supplement
Diovan valsartan Novartis Cardiovascular disease
Lipitor atorvastatin Pfizer Cardiovascular disease
Plavix clopidogrel Sanofi Cardiovascular disease
Nourish Skin ascorbic acid + vitamin E + beta-carotene + collagen + proteins
Pharos Indonesia Nutritional supplement
Pantozol pantoprazole Nycomed Gastrointestinal disorder
Lipanthyl fenofibrate Abbott Cardiovascular disease
Crestor rosuvastatin AstraZeneca Cardiovascular disease
Plasbumin albumin Dipa Pharmalab Blood product
Despite governmental preference for unbranded generics, branded products (both patented and branded generics) command strong preference.

66
Healthcare Market Access: Indonesia
© phamax AG, 2015 - All Rights Reserved
Source: UNCTAD report, 2012
3.7 Leading therapeutic segments
The United Nations Conference on Trade and Development (UNCTAD) reported that 72% of the Indonesian pharmaceutical market comprised products from only five therapeutic classes: anti-infective, gastrointestinal and metabolic disorder, cardiovascular disease, central nervous system (CNS) disease and respiratory diseases.
Of these five leading classes, anti-infective class was the largest at 23% of the overall pharmaceutical market (in 2008). This could be attributed to the high prevalence of communicable diseases in the country, such as TB, HIV/AIDS and Hepatitis. Coming at a close second place behind the anti-infective class was the gastrointestinal and metabolic disorder class at 20% of the market, followed by cardiovascular disease at 13%, which comprised conditions such as hypertension and ischemic stroke. Drugs used in CNS disease constituted 9% of all pharmaceutical sales, with the most commonly treated disorders being Depression, Anxiety, Bipolar Disorder, Parkinson’s disease and Alzheimer’s disease. Drugs for respiratory diseases accounted for 7% of the market, largely comprising cough and cold remedies and anti-histamines. Beyond these top-five was the oncology class, which accounted for only 3%, but was expected to grow in the future.
Figure 40: Leading therapeutic segments, Indonesia, 2012
23%
20%
13% 10%
9%
7%
5% 4%
3% 3% 3%
Anti-infectives Gastrointestinal and metabolismCardiovascular system OthersCentral nervous system RespiratoryMusculoskeletal DermatologyGenitourinary and hormones BloodOncology
Anti-infective, gastrointestinal and metabolic disorder, cardiovascular disease, central nervous system disease, and respiratory diseases are major therapeutic segments.

67
Healthcare Market Access: Indonesia
© phamax AG, 2015 - All Rights Reserved
Source: International Trade Center, 2005
3.8 Supply channel
Statutory limitations on pharmaceutical companies operating in Indonesia prevent them from directly selling their products to the consumer or retailer. Instead, the distribution channel for pharmaceutical products begins at the licensed wholesaler/distributor (called a pedagang besar farmasi or PBF), who then sells the products to retailers. These retailers are largely pharmacies (apotek) that sell both prescription and OTC products and general drugstores (toko obat) that can only sell OTC products. Hospitals, clinics and individual doctors also dispense directly to patients.
In the public sector, the procurement of drugs has been managed by local district governments since the implementation of the decentralization policy in 2001. Specifically, the district health office is solely responsible for procuring and distributing all drugs to the primary care facilities in the district, including primary healthcare centers (puskesmas), maternal and child health clinics (polindes), community clinics (posyandus) and mobile clinics (puskesling). The drug procurement process involves annual tenders inviting wholesalers at both the
Figure 41: Pharmaceutical supply channel, Indonesia
Exporter of pharmaceutical active ingredients
Importer of pharmaceutical active ingredients
Pharmaceutical manufacturers
Pharmaceutical wholesalers
Importer of special drugs
Grey market
Toko obat Hospitals Clinics Doctors Apotek
Consumer
Statutory limitations prohibit pharmaceutical companies from directly selling their products to the consumer or retailer.
In the public sector, the drug procurement process involves annual tenders inviting wholesalers at both central and provincial levels.

68
Healthcare Market Access: Indonesia
© phamax AG, 2015 - All Rights Reserved
Source: MoH
Source: MoH
central and provincial levels. The tender is awarded to the wholesaler who bids the lowest and has a good track record of service.
3.8.1 Distribution / wholesale
As mentioned earlier, the distribution of drugs in Indonesia begins with a PBF. Since Indonesia is an archipelago with a population spread over many islands, effective and timely supply of medicines are crucial responsibilities of PBFs. In 2009, there were only 2,821 PBFs in Indonesia, which grew to 2,860 by 2012.
Table 43: Number of pharmaceutical distributors, Indonesia, 2009 - 2012
PBFs must be licensed, with each license being valid for only fiveyears, and they must operate under a set of stringent regulations created by the MoH. These regulations have been recently revised and now require PBFs to:
• Appoint a registered Indonesian pharmacist in their warehouse(s). • Meet the good distribution practice (GDP) guidelines. • Have proper drug procurement and storage facilities.
Further, PBFs must report their activities every three months to the Directorate General of Pharmaceuticals and Medical Supplies. For narcotics and psychotropics, the reporting must be on a monthly basis.
Figure 42: Number of pharmaceutical distributors, Indonesia, 2009 - 2012
Year 2009 2010 2011 2012 Total number 2,821 2,855 2,695 2,860
2,821 2,855 2,695 2,860
-
1,000
2,000
3,000
4,000
2009 2010 2011 2012
Num
ber
of d
istr
ibut
ors

69
Healthcare Market Access: Indonesia
© phamax AG, 2015 - All Rights Reserved
Ownership of PBFs is also highly regulated in Indonesia. In fact, this sector was completely closed to foreign investment in the recent past. But, the recently revised list of investments has opened this sector to up to 33% FDI, provided a special license is obtained from the MoH.
Some large pharmaceutical companies have their own distribution division and some are affiliated with other distributors. For example, PT Anugerah Pharmindo Lestari (APL), one of the largest distributors in the country, is a subsidiary of Hong Kong-based Zuellig Pharma. Similarly, Kalbe and Kimia, which are major local manufacturers, rely on their subsidiaries PT Enseval Putera Megatrading Tbk and PT Kimia Farma Trading & Distribution (KFTD) respectively to distribute their products. KFTD, a large-scale distributor, has a network of 44 distribution branches across Indonesia. Another large distributor is PT Anugrah Argon Medica (AAM), which has 40 branches in the country.
3.8.2 Retail
In Indonesia, at the consumer-facing end of the distribution channel, there are retailers such as pharmacies (apotek), drugstores (toko obat) and hospital pharmacies. Medicines are also dispensed by some doctors (dispensing doctors) and general stores. The pharmacies and drugstores dominate, as they account for 80% of the total distribution of drugs in the country (50% distributed by pharmacies and 30% distributed by drug stores), with the remaining 20% dispensed by hospitals, clinics and doctors.
There were 17,613 pharmacies and 7,040 drugstores in the country in 2012, while the numbers were 13,671 and 7,953 respectively in 2009. The convention of pharmacy chains is increasing in Indonesia. Many foreign and local players are inaugurating their chains in the country. Apotek K-24, Century Healthcare, Guardian, Kimia farma Apotek and Melawai are some major pharmacy chains operating in Indonesia. Kimia farma Apotek, subsidiary of Kimia farma, has 394 pharmacies throughout Indonesia.
As mentioned before, pharmacies (Apotek) are licensed to sell both prescription and OTC drugs, whereas drugstores are only allowed to sell OTC products. In contrast, drugstores are involved in the sales of prescription drugs also. The law which mandates the dispensing of prescription drug by registered pharmacists is often overlooked in Indonesia. Hence, stringent implementation of the law is required to control this practice. The drugstores often offer a 10% - 20% discount, compared with licensed pharmacies for the same products. Wholesalers maintain a 10% - 15% margin over the ex-factory price, while retailers have margins of 20% - 30%.
Indonesia is currently suffering a glut of counterfeit drugs, largely OTC products imported from Taiwan, Singapore and Hong Kong. These counterfeit drugs are cheaper than legal products and are widely available at drugstores and also online.
Pharmacies are licensed to sell both prescription and OTC drugs, whereas drugstores are only allowed to sell OTC products.
Pharmacies and drugstores dominate distribution of drugs with 50% and 30% shares respectively. Remaining 20% are dispensed by hospitals, clinics and doctors.
FDI in distribution sector was closed in the past. Recent reforms allow up to 33% FDI.

70
Healthcare Market Access: Indonesia
© phamax AG, 2015 - All Rights Reserved
Source: MoH
Source: MoH
Table 44: Number of pharmacies and drugstores, Indonesia, 2009 - 2012
Figure 43: Number of pharmacies and drugstores, Indonesia, 2009 - 2012
Year 2009 2010 2011 2012 Pharmacies 13,671 16,603 16,735 17,613
Drugstores 7,953 8,447 8,247 7,040
13,671 16,603 16,735 17,613
7,953 8,447 8,247 7,040
-
5,000
10,000
15,000
20,000
2009 2010 2011 2012Pharmacy Drugstore

71
Healthcare Market Access: Indonesia
© phamax AG, 2015 - All Rights Reserved
3.9 Sales and marketing
In Indonesia, companies are not allowed to promote prescription drugs (ethical drugs) to physicians through ordinary channels. Thus, pharmaceutical companies in Indonesia spend heavily on promoting prescription products to healthcare professionals through:
• Medical representatives who explain the indications and benefits of a drug directly to doctors.
• Detail men who promote prescription drugs to retail outlets. • Workshops, seminars and academic journals that provide a platform to
present the latest information about a prescription drug to doctors.
Thus, pharmaceutical companies rely greatly on their sales force, and expectedly, most companies have built large teams. For example, domestic players such as Kimia and Kolbe each have over 1,000 sales representatives, while the MNCs are aggressively expanding to compete.
All professional sales representatives are responsible for maintaining a scientific and highly ethical approach to their business. It is through these representatives only that pharmaceutical companies have built a strong relationship with some physicians, who prescribe a particular medicine for perks and bonuses. The representatives themselves are often remunerated on a commission or performance basis, which can drive unethical marketing practices. An additional function fulfilled by these representatives is the collection of actual sales and prescription data from individual retail establishments, which is used for market intelligence and assessment of sales effectiveness.
The International Pharmaceutical Manufactures Group (IPMG), an association of research-based multinational pharmaceutical companies operating in Indonesia, developed a code of conduct to ensure ethical marketing practices.
Pharmaceutical companies spend heavily on promoting prescription products to healthcare professionals and rely greatly on their sales force for the same.

72
Healthcare Market Access: Indonesia
© phamax AG, 2015 - All Rights Reserved
Source: OECD
For OTC and consumer health products, marketing and promotion activities are directed toward the end consumer and include advertisements (TV, radio, print and billboards) and sometimes a brand ambassador.
Figure 44: Pharmaceutical marketing channel, Indonesia
Marketing
OTC drug
Traditional drugs
Food supplements
Ethical drugs
Radio
Newspaper
Billboard
Medical rep
Magazine
Television
Detail man
Seminar
Specific magazine
Doctor
Drug store
Pharmacy
Hospital
Consumer

73
Healthcare Market Access: Indonesia
© phamax AG, 2015 - All Rights Reserved
3.10 FDI in pharmaceutical industry
The implementation of the Ministry of Health Decree No. 1010/MENKES/PER/XI/2008 has severely affected the business of foreign pharmaceutical companies in Indonesia. According to this, all foreign pharmaceutical companies who do not manufacture drugs locally, have to register as distributors (PBF). In order to register their own product in Indonesia, foreign pharmaceutical companies must establish their manufacturing unit in Indonesia or they have to partner with a local manufacturing company. First condition involves huge investments and second condition is a threat to intellectual property rights. In addition, Decree 1010 mandated foreign companies to manufacture an imported product locally within five years of expiration of patent. Overall, Decree 1010 adversely affected foreign investment in the pharmaceutical industry.
In 2010, Presidential Decree No. 36 stipulated that foreign companies could hold up to 75% of equity in a pharmaceutical business while the remaining 25% was mandated for ownership by an Indonesian national. In 2014, this limit was relaxed by 10% to 85% in order to increase the inflow of FDI. Ownership of PBFs is also highly regulated in Indonesia. In fact, this sector was completely closed to foreign investment in the recent past. The recently revised list of investments has opened this sector to up to 33% FDI, provided a special license is obtained from the MoH.
Despite all odds, foreign investment in Indonesian pharmaceutical industry has escalated as foreign companies compete relentlessly to grab a share of the rapidly rising pharmaceutical market in Indonesia. In 2013, FDI in the pharmaceutical and chemical industry reached $3.1 bn, contributing approximately 11% of all FDI that year and registering a large increase from the mere $0.6 bn in 2008.
At $3.1 bn, FDI in the pharmaceutical and chemical industry accounted for approximately 11% of total FDI in Indonesia in 2013.

74
Healthcare Market Access: Indonesia
© phamax AG, 2015 - All Rights Reserved
Source: Company news
3.12 Events
Table 45: Recent events in pharmaceutical industry, Indonesia
Year Event
March, 2014
London based pharmaceutical company GSK took full control of its consumer healthcare unit to strengthen its presence in the fast growing market. GSK bought the 30% stakes held by Sarasvati Venture Capital for $40 mn to gain full ownership
March, 2014
Pfizer revealed plans to invest $3.5 mn to expand its solid manufacturing capacity at its Pasar Rebo site in East Jakarta. The expansion will allow Pfizer to produce 300 mn tablets in a year, a 75% boost in production capability. Pfizer intends to capture a greater share of the rapidly expanding generics market in the country
August, 2013
German pharmaceutical company Fresenius Kabi entered into a joint venture with PT SOHO Global Healthcare after buying a majority stake in PT Ethica Industri Farmasi. The plan was to build an IV generics and infusion solution manufacturing plant worth $60 mn in West Java with the aim of providing high-quality and affordable drugs in Indonesia and other Southeast Asian countries
October, 2012
Merck opened a new pharmaceutical packaging plant in Jakarta. Merck invested $21 mn in the plant to seize opportunities in the Asian market, which was barely affected by the EU slowdown. At this plant, the company manufactures packaging for cardiovascular, respiratory and oncology products for the Indonesian market (25%) and for export as well

75
Healthcare Market Access: Indonesia
© phamax AG, 2015 - All Rights Reserved
Source: WHO
3.13 Major diseases
The disability-adjusted life year (DALY) is a measure of overall disease burden and is expressed as the number of years lost due to ill health, disability or early death. DALY quantifies both premature mortality (years of life lost, YLLs) and disability (years lost due to disability, YLDs) within a population. More specifically, one DALY represents the loss of one year of healthy life. Hence, the sum of DALYs across an entire population is directly proportional to the burden of disease in that population.
In Indonesia, stroke, a major condition, is the single largest contributor (7.5%) to the total DALYs lost due to all conditions, as per statistics revealed by the WHO.
3.13.1 Stroke
Stroke is the leading cause of morbidity and mortality in Indonesia. It is caused by an interruption of blood flow to the brain (ischemic stroke) or the rupture of blood vessels in the brain. Although it affects the elderly more often, it is also prevalent amongst youngsters. Delay in hospital admission is one of the main reasons for the high mortality associated with stoke. Such delays occur due to the lack of awareness of the condition and the general lack of basic infrastructure in the country. The most common risk factors are hypertension, heart disease, cigarette
Figure 45: Major diseases / conditions (% of total DALY), Indonesia
7.5%
6.5%
6.3%
5.6%
4.2%
4.1%
3.5%
3.1%
3.0%
3.0%
Stroke
Cancer
Lower respiratory infections
Tuberculosis
Preterm birth complications
Diarrheal diseases
Ischemic heart disease
Road injury
Unipolar depressive disorders
Diabetes mellitus
Maj
or d
iseas
es/ c
ondi
tions
Communicable diseases continue to be the major cause of morbidity and mortality in Indonesia with Tuberculosis, HIV, Diarrhea and Pneumonia being the most prevalent.
As seen in the larger emerging markets of China and India, the incidence and prevalence of lifestyle-related conditions are increasing.
76
Healthcare Market Access: Indonesia
© phamax AG, 2015 - All Rights Reserved
smoking and diabetes. Ischemic stroke alone accounts for 6.1 mn DALYs lost per year, which amounts to 7.5% of all DALYs lost due to all causes in the country.
The Indonesian Stroke Foundation (Yayasan Stroke Indonesia) was established in 1989 in Jakarta to educate and counsel groups with high risk for stroke. Additionally, the Nusantara Medical Centre provides diagnosis, pre-emptive care and rehabilitation activities for stroke sufferers. Their chief mission is to help reduce the incidence and impact of strokes.
3.13.2 Cancer
Cancer is the seventh largest cause of deaths in Indonesia and accounts for 5.2 mn DALYs annually. Malignancies associated with the cervix, breast, lymph nodes, skin and nasopharynx are prominent in the country. In fact, it is estimated that out of 100,000 people, 143 new cancer cases arise in Indonesia every year.
The MoH introduced a policy for cancer control in 2006. The program consists of the following:
• Nationwide hospital-based cancer registry programs and community-based programs in smaller provinces.
• Awareness and education campaigns with informative materials. • Early detection program for cervical and breast cancer. • Campaigns to reduce smoking habits in relation to lung cancer.
There are many organizations in the country striving to improve the cancer status. In 1977, a non-government non-profit organization was founded by the former Indonesian Vice President Dr. Mohammad Hatta and former Minister of Health Dr. G.A. Siwabessy to support the government in its efforts to fight cancer. In 1993, the Dharmais Cancer Centre was established in Jakarta and has since become the top referral cancer hospital in Indonesia. The Touch of Love Children's Foundation Indonesia (YSKAI) is an organization that supports children with cancer.
3.13.3 Tuberculosis
Tuberculosis (TB) represents a major problem in Indonesia. The WHO estimates that in 2012, there were 730,000 cases of all forms of TB (0.3% prevalence) and 460,000 new cases of TB (0.19% incidence) and the mortality rate was 0.03%. With these numbers, Indonesia has joined the group of countries categorized as having a high burden of TB. Nonetheless, Indonesia has made progress in diagnosing and treating standard TB and has achieved a case detection rate of 70% and a successful treatment rate of 90%. Estimates show that the overall TB mortality rate has declined by approximately 50% as compared to 1990. Multidrug-resistant TB, however, remains a critical issue in the country. In order to improve the treatment rate of TB, the government has implemented the WHO recommended Direct Observed Treatment Short-Course (DOTS) program in all 33 provinces.

77
Healthcare Market Access: Indonesia
© phamax AG, 2015 - All Rights Reserved
In Indonesia, the TB CARE I program was started in 2010, which was led by the KNCV Tuberculosis Foundation (an international non-profit organization) with other collaborative partners such as the WHO. The program supports the National TB Control Program (NTP), primarily at the district and provincial levels, but also provides assistance at the national level. The program has the following priorities:
• Ensure universal access to quality TB services. • Strengthen the laboratory network and quality assurance for laboratories. • Improve drug and pharmaceutical management to ensure uninterrupted
supply of drugs.
3.13.4 Diarrhea
Diarrhea is endemic to Indonesia, which has an outbreak potential that can lead to death if untreated, especially in children. In fact, an official health research report (Riskesdas) has identified diarrhea as the leading cause of death for children under five years of age. In 2011, four out of every 100 cases of diarrhea led to death. In some provinces, the case fatality rate is high primarily due to delayed treatment and geographical distance from health service centers. Poor nutrition and lack of clean water are also important contributors to child mortality from diarrhea.
The MoH is determined to control the outbreak of diarrhea and is coordinating its efforts with local governments and community healthcare centers. In 2013, the Global Action Plan for the Prevention and Control of Pneumonia and Diarrhea (GAPPD) was developed and promulgated by the WHO and UNICEF. The goal of the program is to reduce pneumonia and diarrhea-related mortality in children by 2025 at the global level.
3.13.5 Diabetes mellitus
Diabetes mellitus (DM) and diseases of the heart and blood vessels are the major non-communicable diseases in Indonesia. According to Riskesdas data, DM is the second leading cause of death in the age group of 45 - 55 years in urban areas and the sixth leading cause in rural areas. The prevalence of diabetes in urban Indonesia is 5.7% (6.4% in women and 4.9% in men). Changes in lifestyle, reduced physical exercise, poor dietary habits as well as increased human life expectancy have inadvertently increased the prevalence of DM in Indonesia. The lack of public awareness about DM and the shortage of DM specialists are the biggest barriers to quality care in Indonesia. DM accounts for 2.4 mn DALYs lost per year, which is 3% of all DALYs lost due to all conditions.
The Indonesian Diabetics Association (Persatuan) is an association of diabetic patients, supporters and physicians that aims to increase awareness of and knowledge on the management and prevention of diabetes.
3.13.6 Ischemic heart disease
Ischemic heart disease or coronary heart disease (CHD) is one of the main causes of mortality in most countries in the world. In Indonesia, it is one of the top ten

78
Healthcare Market Access: Indonesia
© phamax AG, 2015 - All Rights Reserved
diseases in terms of mortality. Poor dietary habits and lifestyle changes are associated with elevated serum cholesterol concentrations and increased CHD mortality. WHO reports revealed that ischemic heart disease is responsible for 2.8 mn DALYs lost per year (3.5% of total) in the country.
The MoH sponsors community-based programs that aim to curb hypertension, ischemic heart disease, and other heart-related issues. The government has also distributed mass‐screening devices and has conducted a health surveillance program to detect and manage heart disease. The MoH is also involved in activities conducted through health groups in association with NGOs and other stakeholders to control risk factors associated with heart diseases.

79
Healthcare Market Access: Indonesia
© phamax AG, 2015 - All Rights Reserved
4 Market Access
4.1 Stakeholder landscape
Indonesia, the fourth-most populous country in the world, is witnessing soaring health awareness levels, changing demographics and an escalating lifestyle disease burden, making it one of the largest markets for healthcare in Southeast Asia and a major prospect for both payers and providers. Moreover, with rising per capita incomes and spending capacities, Indonesian patients are often ready to pay out-of-pocket for high-quality healthcare. This tendency is driving the proliferation of private hospitals in the country, making private healthcare more diverse and promising than the public healthcare sector. However, this phenomenon is still limited to the burgeoning urban areas, while access to healthcare services in rural areas remains very limited. To bridge the gap, the federal government has committed large sums toward rural healthcare services.
The pharmaceutical industry in Indonesia is highly competitive, comprising domestic companies and foreign multinational companies (MNCs). The domestic companies meet a large part of the Indonesian pharmaceutical demand, but have a long way to go to achieve international standards of quality, efficiency and innovation. Foreign MNCs are drawn to Indonesia for its huge potential, but struggle to navigate through the regulatory and market environments, which are not always in their favor. For example, limits on foreign direct investment (FDI) preclude a full venture in the country and necessitate sharing of intellectual property with local manufacturers. Delayed registration processes are another set of obstacles for foreign companies to gain access in the market.
A notable feature of Indonesia is that it is a very brand-conscious market, where people prefer branded/original medicines or branded generics regardless of the premium prices. Yet, to contain costs in the public sector, the government has introduced a series of policies that mandate the use of low-cost unbranded generics at public health facilities. In response to the initiative, many domestic and foreign companies are gearing up to increase their generics manufacturing capabilities. All pharmaceutical companies, however, have been adversely affected by the e-catalog system of drug procurement and other policies related to price, which have increased competition for tenders and have reduced profit margins.
In Indonesia, prescribers, although important stakeholders, have lost their power of individual decision making on use of the drugs and are no longer major influencers on payers. In fact, it is the payers (insurance providers) that now strongly influence the consumers’ healthcare choices through their regulated reimbursement policy and formularies. Implementation of JKN and use of the national formulary further limits the decision-making power of physicians.
Domestic companies currently meet a large part of the Indonesian pharmaceutical demand, but lack international standards of quality, efficiency and innovation. Foreign MNCs are drawn to Indonesia for its large potential, but struggle to navigate through unfavorable regulatory and market environments.
Indonesia is a very brand-conscious market, where people prefer branded/original medicines or branded generics regardless of the premium prices.
Payers (insurance providers) now strongly influence the consumers’ healthcare choices through their regulated reimbursement policy and formularies.

80
Healthcare Market Access: Indonesia
© phamax AG, 2015 - All Rights Reserved
4.2 Regulatory landscape
4.2.1 Regulatory agencies
The Indonesian national regulator in charge of drugs is the Badan Pengawas Obat dan Makanan (BPOM, National Agency for Drug and Food Control). BPOM is a non-departmental government institution directly responsible to the President and works in coordination with the Ministry of Health Republic of Indonesia (MoH RI). It grants drug approvals and is hence responsible for ensuring the efficacy and safety of drugs sold in the country.
The specific functions of BPOM are:
• Assessment and formulation of national policies for supervision of food and drugs.
• Implementation of government policies for medicine and food control. • Monitoring, mentoring and guiding government agencies in decisions on
medicine and food control. • Premarket evaluation and standardization of medical products. • Supervision of traditional medicines, cosmetics and health supplements. • Supervision of manufacturing facilities for medicinal products and Good
Manufacturing Practice (GMP) certification.

81
Healthcare Market Access: Indonesia
© phamax AG, 2015 - All Rights Reserved
Source: BPOM
Figure 46: Organization structure of BPOM, Indonesia
Head
Inspectorate
Head Secretary • Bureau of planning and
finance • Foreign cooperation • Legal and public relations
The National Center of Food and
Drug Testing
The Center of Drug and
Food Investigation
The Center of Drug and
Food Research
The Center of Drug and
Food Information
Deputy 1 Supervision of
therapeutic products, narcotics,
psychotropic and addictive substances
Deputy 2 Supervision of
traditional medicines, cosmetics and
complementary products
Deputy 3 Supervision of food
safety and hazardous materials
Assessment of drug and biological products
Supervision of therapeutic products production and distribution
Therapeutic product standardization
Supervision of narcotic and psychotropic substances
Assessment of traditional medicines, food supplements and cosmetics
Standardization Inspection and
certification Director of original
drug
Assessment of food and hazardous material
Standardization Inspection and
certification Food safety
surveillance and counseling
Implementation unit

82
Healthcare Market Access: Indonesia
© phamax AG, 2015 - All Rights Reserved
4.2.2 Market authorization for pharmaceutical products
The BPOM manages and regulates the drug registration process in Indonesia and grants drug approvals by issuing a marketing authorization license which is valid for the five years. The drug registration in Indonesia can be divided into three categories, i.e.,
• New registrations - registration of new drug, biologics including biosimilar or copy drugs.
• Registration of variations - registration of the changes in any aspect of drugs that have distribution permit in Indonesia, including but not limited to changes in formulation, method, process, specifications for drug and raw materials, containers, packaging and labeling.
• Re-registration - registration of the drug after the expiry of previous registration.
This drug registration process involves two distinct steps, pre-registration and registration. Pre-registration is compulsory before going to the next step of actual registration and applications for both steps can be filed electronically. The registration documents attached with the application should be in accordance with the Common Technical Documents (CTD) for the Association of Southeast Asian Nations (ASEAN).
Pre-registration:
The pre-registration step is intended to screen applications that go on to the drug registration process and involves multiple evaluations, including determination of registration category, determination of evaluation path and assessment of drug registration documents. After submitting the pre-registration application, evaluation of the application is done by the head of the agency and within forty days, the head of the agency grants the letter of pre-registration (HPR) to the applicant. However, the agency may ask for additional data, which the registrant must submit within twenty days of the request.
Registration:
After obtaining an HPR, the registrant must submit an application for registration to the BPOM with documents including:
• Product information, labeling, and administrative documents. • Quality and technology documents to ensure the quality of drug. • Pre-clinical trial document that shows pharmacokinetic and
pharmacodynamics profile of the drug. • Clinical trial documents that shows safety and efficacy of the drug. • GMP certificate.
Evaluation of these documents by the BPOM follows the following timelines depending on the path:
BPOM (National Agency for Drug and Food Control) grants drug approvals by issuing a marketing authorization license which is valid for the five years.
Drug registration process involves two steps, pre-registration and registration where pre-registration is compulsory before going for actual registration.

83
Healthcare Market Access: Indonesia
© phamax AG, 2015 - All Rights Reserved
1) Path - I is for drugs intended for export or for minor variations in the label.
2) Path - II takes 100 days and includes evaluation of: • New drugs used in rare diseases. • Drugs indicated in life-threatening diseases. • Drugs for public health programs. • New drugs that have been developed in Indonesia and all phases of
clinical trials have been conducted in Indonesia. • Registration of generics with standard electronic information data
(Stinel). • Registration of the drug with major variations such as indication
and posology. 3) Path - III takes 150 days and includes evaluation of:
• New drugs that have been approved in countries with a harmonized evaluation system, or in a country with a well-known evaluation system.
• Registration of the copy drug without standard electronic information (Stinel).
4) Path - IV takes 300 days and includes the evaluation of new drugs, new biologics and biosimilars not included in paths II and III.
In case BPOM needs surplus data for further evaluation, BPOM may request for it in writing and the registrant must submit the supplementary data within 100 days after the date of request. The BPOM may grant the registration or reject it based on the evaluation results and the recommendations of the following:
• National Committee on Drug Evaluation (KOMNAS). • Efficacy and Safety Assessment Team. • Quality Assessment Team. • Product Information and Labeling Assessment Team.
In case of rejection for any reason, the applicant may appeal to the head of the BPOM for a review within six months. However, only one appeal is available and the review application must be accompanied by new data or the previous data with a clear justification. In addition, a registrant can also apply for re-registration with new data one year after the previous rejection.
Generally, BPOM takes 100 - 300 days for granting the registration of the product but PhRMA reports in its special 301 submission that its member companies are facing burdensome delay in the registration of the new product. The delay in approval can be attributed to short staffing of the agency. BPOM is taking initiatives to counter this problem by implementing electronic submission.
Generally, BPOM takes 100 - 300 days to grant marketing authorization for a product. However, companies are facing burdensome delay in getting approval due to short staffing in the agency.

84
Healthcare Market Access: Indonesia
© phamax AG, 2015 - All Rights Reserved
Source: BPOM
Figure 47: Market authorization process, Indonesia
Pre-registration form
Head of the agency
Applicant
Request for additional data
Issues letter of pre-registration (HPR)
Registration application
Drugs for rare disease /
for public health.
Path III
Path IV 300
Evaluation
Drugs approved in
countries with known evaluation systems.
Path II 150
Drugs like similar
biological products or other than
stated in Path I and Path II.
Approval of drug registration
Rejection of drug registration
Decision by evaluation committee (KOMNAS)
Appeal
Re-registration
Step 1
Step 2
Drugs for export or for
minor variation.
Path I 40

85
Healthcare Market Access: Indonesia
© phamax AG, 2015 - All Rights Reserved
4.2.3 Clinical trial regulations
Clinical trials in Indonesia are regulated by the BPOM under Decree 02002/SK/KBPOM. All clinical trials must comply with this decree to gain approval by the BPOM. The scope of regulation covers the following type of products:
• Pharmaceutical drugs • Herbal drugs • Health supplements • Food • Cosmetics
The clinical trial can be conducted directly by the sponsor or through a contract research organization (CRO), provided the CRO is based in Indonesia and complies with Good Clinical Trial Practice standards. Before applying to the BPOM for permission to begin a clinical trial, the sponsor should gain approval from the ethics committee which conducts the scientific and ethical review of the clinical trial documents. Again, the sponsor can also apply simultaneously to the BPOM and the ethics committee. After the approval of the ethics committee, BPOM evaluates the clinical trial documents in consultation with a national team of clinical trial experts appointed by the agency and grants approval or rejection within twenty days of the submission. In some cases, the head of the agency may ask for additional data that must be promptly supplied to ensure that the process is completed in due time. Finally, if approved, an approval letter is provided that is valid for two years.
The head of the agency has the liberty to inspect the site before, during or after the clinical trial and has authority to terminate the project in case of any serious health risk. In addition, the sponsor must inform the BPOM about:
• The progress of the clinical trial every six months. • Premature termination, if any. • Any adverse effects that arise during the trials. • Any changes made to the trial procedure that were not mentioned earlier.
When applying to the BPOM for consent to initiate a clinical trial, the ensuing documents are essential:
• Clinical trial documents
- Clinical Trial Protocol - Informed Consent - Form Appendix
• Product documentation
The clinical trial can be conducted directly by the sponsor or through a CRO, provided the CRO is based in Indonesia and complies with Good Clinical Trial Practice standards.
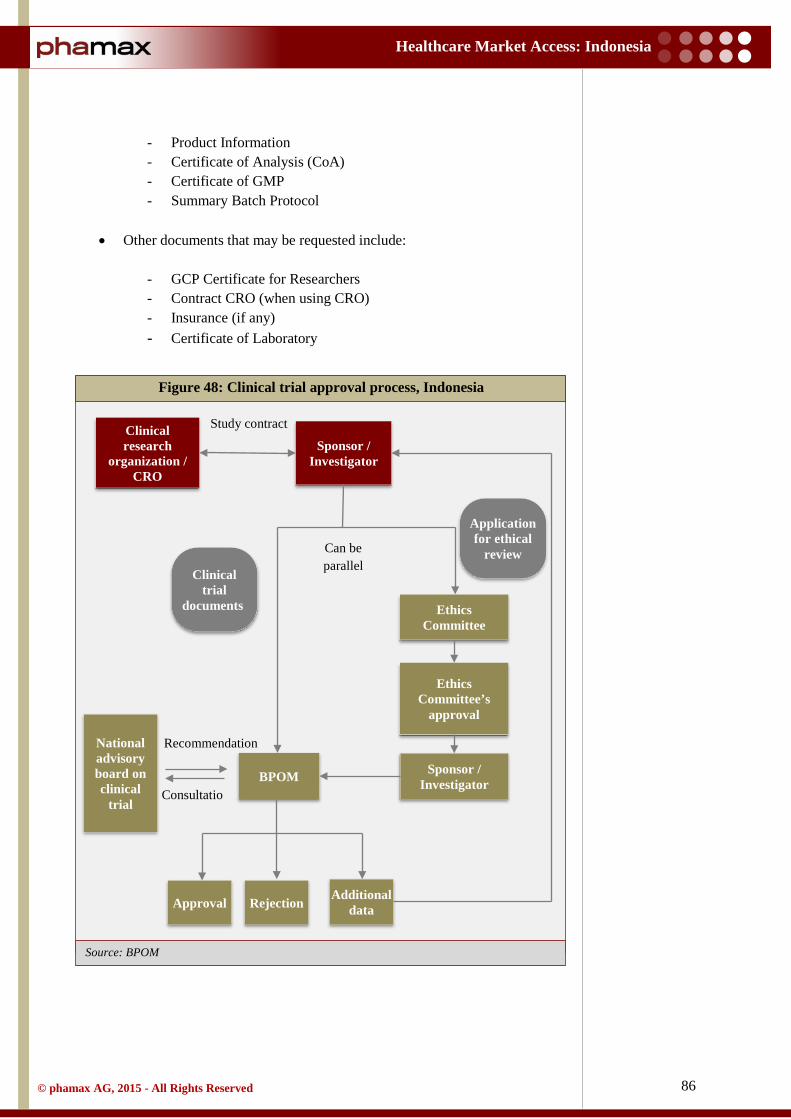
86
Healthcare Market Access: Indonesia
© phamax AG, 2015 - All Rights Reserved
Source: BPOM
- Product Information - Certificate of Analysis (CoA) - Certificate of GMP - Summary Batch Protocol
• Other documents that may be requested include:
- GCP Certificate for Researchers - Contract CRO (when using CRO) - Insurance (if any) - Certificate of Laboratory
Figure 48: Clinical trial approval process, Indonesia
Clinical research
organization / CRO
Sponsor / Investigator
Study contract
Ethics Committee’s
approval
Ethics Committee
Sponsor / Investigator
Application for ethical
review
BPOM
National advisory board on clinical
trial
Clinical trial
documents
Recommendation
Consultatio
Approval Rejection Additional data
Can be parallel

87
Healthcare Market Access: Indonesia
© phamax AG, 2015 - All Rights Reserved
4.2.4 Licensing process for pharmaceutical manufacturing
To get a manufacturing license in Indonesia, manufacturers are obliged to get a GMP certificate from the BPOM. An applicant must submit the application to the head of the BPOM to get the approval for the manufacturing site and within twenty days from submitting an application, an expert panel appointed by the BPOM inspects the manufacturing plant for compliance with GMP standards. The BPOM may grant a manufacturing license based on the inspection report of the panel or it may ask for further improvements, as necessary.
A GMP certificate is awarded for each manufacturing unit and each process that produces a different dosage form. In addition, the certificate holder must gain approval from the BPOM before making any changes to the structure of the production facility or the process, equipment etc. The GMP certificate is valid for five years and the manufacturer must re-apply for certification six months prior to the expiration of the old certificate.
4.2.5 Post-marketing regulations
Post-marketing surveillance also comes under the ambit of the BPOM, which aims to ensure the continued quality and safety of the approved product and to regulate the promotional activities of the companies.
To this end, marketing and manufacturing licenses must be renewed every five years. Moreover, it is mandatory to report any adverse drug reactions (ADRs) observed within fifteen days in case of a serious ADR and within six months if the ADR is non-serious. In addition, for any new chemical entity, the BPOM mandates that periodic safety update reports be provided.
4.2.6 Labeling and advertising
Drug labeling requirements for Indonesia are stipulated in the drug registration guidelines and are regulated by the BPOM. In alignment with the labeling requirements, the following information must be present on the unit carton (outer box):
• Brand name • Nonproprietary (generic) name • Dosage form • Package size • Name and strength of the active substance • Name and address of the manufacturer and importer • Registration number • Batch number • Date of production • Expiration date • Specific warning • Storage condition
88
Healthcare Market Access: Indonesia
© phamax AG, 2015 - All Rights Reserved
In addition, for over-the-counter (OTC) products, the outer box must mention the indications and recommended dosage of the drug and all the information must be in Indonesian language. Other information such as contraindications, adverse drug reactions, drug interactions and warning/precautions must be printed in the product brochure. The legislation for halal certification and labeling is a major amendment in process in Indonesian’s parliament. This legislation mandates halal labeling for pharmaceutical products, which must mention if the product contains any non-halal ingredients.
Indonesia permits advertisements targeting the general public for OTC products, but not for prescription drugs. Further, advertisements for OTC products, whether on Television, Radio or Print media are also regulated through Decree 386/Men.Kes/SK/IV/1994 published by the MoH. As per this decree, only BPOM approved drugs can be advertised and all advertising material must be submitted to the BPOM for approval. The advertisement should not offer gifts, provide a warranty statement on indications or usefulness/benefits or encourage excessive use of the drug. Moreover, these advertisements should include the following information:
• Composition of the active drug substance with the international non-proprietary name (INN)
• Main indications of the drug and drug safety information. • Trade names of the drug • Name of the pharmaceutical company • Registration number
4.2.7 Licensing process for pharmaceutical imports
The BPOM regulates the import of pharmaceutical and food products in Indonesia. BPOM issued a new regulation No. 27 (2013) on import control of drugs and food into Indonesian territory, replacing the previous regulations. To import products, importers must have written approvals from overseas pharmaceutical companies involved, which must be GMP certified. In addition, an importer must register the product in Indonesia in order to get a distribution license. Under the regulation, an importer has to get an Import certificate (Surat Keterangan Impor, SKI) from the head of the BPOM. For this, the importer must first register on the BPOM website and submit the supporting documents to get an ID and password. Supporting documents for submission must contain:
• Application letter. • Import Identification Number (API). • Trading Business Permit. • Tax Identification Number. • Pharmaceutical Company Permit.
As per regulations, OTC products can be advertised directly to the general public, but not prescription drugs.
Prior to import, products must be registered in Indonesia. Import certificate (SKI), issued by BPOM is mandatory to import products.

89
Healthcare Market Access: Indonesia
© phamax AG, 2015 - All Rights Reserved
After completing the registration successfully, the applicant must submit an online application for SKI, accompanied by the following relevant documents:
• Certificate of analysis. • Invoice. • Packing list. • Bill of Lading or Airway bill. • Proof of payment of Non-Tax State Revenue (PNPB).
BPOM will issue the SKI within one working day if the application meets all the requirements. The issued SKI will be valid for one import.

90
Healthcare Market Access: Indonesia
© phamax AG, 2015 - All Rights Reserved
Source: DGIP
4.2.9 Intellectual property rights
Indonesian laws on patent, copyright and trademark protection have a historical provenance that can be traced back to the Dutch colonial laws like ‘Octrooiwet of 1910’, ‘Auterswet of 1912’, and ‘Reglement Industriele Eigendom of 1912’ respectively. In the present era, Indonesia is a signatory to numerous international agreements protecting intellectual property rights (WIPO, TRIPS and Hague Convention for Designs). Under these laws and agreements, the government’s obligations on intellectual property rights are enforced by the Directorate General of Intellectual Property (DGIP), Ministry of Justice and Human Rights. Thus, the DGIP is responsible for all issues related to patent, copyright, trademark and technology information. The structure of the DGIP is as shown below.
Also, the MoH passed Decree 1010/MENKES/PER/XI/2008, formally implemented in November 2010, which requires foreign companies to either open a local manufacturing unit in the country or transfer their intellectual property rights to a local partner. This decree has had an adverse effect on the ability of
Figure 49: Organization structure of DGIP office, Indonesia
Director General of Intellectual Property
Rights
Secretary to the Director General
Directorate of
Trade-mark
Directorate of Patent
Directorate of Copyright,
Industrial Design and
Trade Secrets
Directorate of
Cooperation and
Promotion
Directorate of
Technology Information
Directorate of
Investigation

91
Healthcare Market Access: Indonesia
© phamax AG, 2015 - All Rights Reserved
innovative MNCs to gain marketing authorization for their products. This is because financial viability, timelines and regulatory concerns have made it infeasible for many MNCs to establish their own manufacturing units in Indonesia. Again, the policy on foreign investment (Negative Investment List 2014) restricts FDI to not more than 85% for a pharmaceutical company. For the remaining 15%, MNCs struggle to find a reliable local partner with whom they can share their sensitive intellectual property information.
Compulsory licensing is another concern area when discussing intellectual property rights. Indonesia issued compulsory licenses for nine patented drugs related to HIV/AIDS and Hepatitis B in 2012 and 2013. In such cases, other than accepting the stipulated royalties, which are generally very low, there is no provision for appeal against a compulsory license or for a judicial or independent body review, although mandated by TRIPS. Thus, at present, companies and interest groups are working in collaboration with Indonesian authorities to find a feasible solution that benefits patents in Indonesia while maintaining adequate and effective intellectual property protection.
4.2.9.1 Patent
The DGIP is responsible for issuing patents in Indonesia through a procedure defined in Patent Law No. 14 of 2001. According to this law, a patent is granted to any invention that is novel, involves an inventive step and shows promise for industrial application. After a patent application is filed, the DGIP conducts a formal examination to verify the administrative and physical requirements of the application. When an application meets all requirements, it is published in the official gazette by the DGIP for a period of six months, during which any objections to the patent can be made. In order to propagate the patent procedure, an applicant must file an application of substantive examination to the Directorate General within 36 months from the date of patent filing. If the application meets the substantive requirements and no objection is made to the application, the DGIP will issue a patent that is valid for twenty years and cannot be extended. The whole patent process takes a minimum of 24 months from the date of filing.
Compulsory licensing is a growing concern. Indonesian authorities issued compulsory licenses for nine patented drugs related to HIV and Hepatitis during 2012 - 13.
The DGIP is responsible for issuing patents which is valid for twenty years. The whole patent approval process takes a minimum of 24 months from the date of filing.

92
Healthcare Market Access: Indonesia
© phamax AG, 2015 - All Rights Reserved
Source: DGIP
Figure 50: Patent approval process, Indonesia
Requirements
Incomplete
Applicant files the application of patent to the
DGIP
Notify the applicant to fulfill in 3
months
Announcement in official gazette
(Prevails for 6 months, after 18 months from the filing date or
priority date)
Withdrawn
Request for substantive examination
(Within 36 months from filing date)
Substantive examination (36 months from the date of
request) Rejected
Success Rejected Granted
Issuance of certificate
Formal examination
Not requested
Fulfillment
Not fulfilled
Requested
Appeal

93
Healthcare Market Access: Indonesia
© phamax AG, 2015 - All Rights Reserved
4.3 Pricing
4.3.1 Pricing system
Indonesia has no formal price control mechanisms for prescription medications. But, regulations on the prices of medicines cover only public healthcare facilities. Hence, most consumers expect to pay more for drugs at private hospitals. Newly implemented systems such as the e-catalog for procurement and the listing of products in the national drug formulary pressurize the prices of medicines used in the public system. The e-catalog system of drug procurement controls drug purchase costs and the national drug formulary encourages the use of cheaper generics. Moreover, the government regulates the price of the unbranded generics through the National List of Essential Medicine (NLEM).
Branded generics are far more expensive than unbranded generics, in some cases, almost six times the international reference price for the drug and four times the price of the cheapest unbranded generic substitute available in Indonesia. These high prices are attributed to anti-competitive practices across the industry as a whole. The Business Competition Supervisory Commission (KPPU) is advocating the policymakers to have a better regulation on prescription and pricing of the medicines that could protect consumer welfare and competition process as well.
4.3.2 Pricing policy
The government has introduced a series of policies to curb prices, such as an e-catalog system for drug procurement, a maximum retail price policy, and a National List of Essential Medicines (NLEM). The key features of these policies are as follows:
• The government actively promotes the use of cheaper unbranded generics, whose prices are regulated by the government (but not branded products). Through Decree 092 /Menkes/SK/II/2012, the MoH has set price caps on 498 key generics for pharmacies, hospitals and other healthcare institutions across Indonesia.
• Under Decree 436/Menkes/SK/XI /2013, pharmaceutical manufacturers are required to print a maximum retail price on all product labels. This maximum price includes the factory price, distribution-retail margin (maximum of 25%) and taxes (value added tax est. 10%). Since the implementation of this law in 2013, distributors and retailers cannot charge more than the price already printed on the label.
• The government has implemented an e-catalog system for the procurement of drugs for the public sector. As a buyer, the government publishes an electronic catalog of the products it intends to buy and the price range it is prepared to pay. Pharmaceutical companies place competitive bids within the stated price range.
• The Obat Generic Berlogo (OGB) initiative, launched by the government in 1989, certifies specific unbranded generics, which carry a logo on the
There is no formal price control mechanism for prescription medications. Regulations on the prices of medicines cover only public healthcare facilities.
The government has introduced a series of policies to curb prices, such as an e-catalog system for drug procurement, a maximum retail price policy and a National List of Essential Medicines (NLEM).

94
Healthcare Market Access: Indonesia
© phamax AG, 2015 - All Rights Reserved
packaging for quality and price. The prices of OGB drugs are fixed at retailer levels, with a maximum retail margin of 50% throughout the country, regardless of the cost of distribution.
• The public sector insurance provider PT Askes controls large variations in prices of drugs by releasing a maximum price list (Daftar Plafon Harga Obat, DPHO) that includes not just unbranded generics, but also branded generics and patented drugs that will be reimbursed.
4.3.3 Price trends
The prices of pharmaceutical products in Indonesia have been climbing over the last few years. The Indonesian Pharmaceutical Association (GP Farmasi) expects these prices to only increase, especially for branded products, mainly due to hikes in fuel prices, import duties and increased wages. But, these factors will not have a large impact on the public healthcare procurement, given the rigid controls on the prices of the drugs through the e-catalog and tender systems. Moreover, those covered under state-funded social insurance schemes such as Jamkesmas and Askes will not be affected given the fairly strong bargaining power of these insurance providers.
Competition in the generics market is becoming more intense since the implementation of the JKN scheme. To meet the demand, local and international pharmaceutical companies are gearing up to increase production. This competition is bound to impact prices. Promotional practices of the pharmaceutical companies contribute to the high price of drugs, especially in the private sector. Private hospitals are also likely to seek low-priced medicines as they have to offset the cost of treating the patients covered under JKN.
4.3.4 Discounts and margins
Generally, large hospitals purchase medicines in very high volumes, giving them substantial leverage in price negotiations with pharmaceutical companies or distributors. They usually secure heavy discounts on branded drugs, although the quantum varies from hospital to hospital (15% - 30%) depending upon the volume. Discounts are also sometimes offered to retail customers due to high competition in certain therapeutic areas. In general, retail margins for pharmaceutical products range from 20% - 30% and margins for distributors are about 10% - 15%. These distributor margins are rather low, given the fact that the cost of distribution can be very high in Indonesia due to its geography and lack of basic infrastructure.
Branded generics are far more expensive than unbranded generics, in some cases, almost six times the international reference price and four times the price of the cheapest unbranded generic substitute available in Indonesia.
To meet the increasing demand of generics and the implementation of the JKN scheme, local and international pharmaceutical companies are gearing up to increase production.

95
Healthcare Market Access: Indonesia
© phamax AG, 2015 - All Rights Reserved
Source:phamax
An illustrative price build up for an imported pharmaceutical product is shown below:
Table 46: Illustrative price build-up ranges for an imported pharmaceutical
product in Indonesia
Tax rate/Mark-up (approx.)
Index
Price to patient after VAT 10% 222
Price to patient at mark-up 33% 202
Price to customer after VAT 10% 152
Price to customer at mark-up 15% 138
Ex-distributor price at mark-up 12% 120
Landed cost after VAT 7% 107
Invoice price to distributor at import 100
96
Healthcare Market Access: Indonesia
© phamax AG, 2015 - All Rights Reserved
4.4 Reimbursement landscape
4.4.1 Reimbursement process
In Indonesia, the MoH is responsible for all procedures related to reimbursement. Thus, those covered by some form of public healthcare insurance can access healthcare services without financial trouble. In fact, public sector hospitals and other public healthcare facilities provide services either at a subsidized rate or free of charge.
Jamkesmas beneficiaries, in particular, have zero out-of-pocket obligations for healthcare services provided by the public sector and other enlisted hospitals. The MoH reimburses hospitals for patients with Jamkesmas coverage based on a mixed system that includes capitation, fee-for-service or diagnosis-related groups (DRGs, called INA-CBG), depending on the type of provider. Reimbursement rates applied for public and private hospitals in the network are same, but vary by the degree of specialization of the hospital.
Private and other public healthcare schemes reimburse hospitals on a fee-for-service basis. Negotiations between the insurance provider and healthcare service provider play a great role in determining the degree of reimbursement. Insurance providers reimburse the cost of hospital drugs for their members, only if the drugs prescribed are listed in the insurer’s formulary. PT Askes, Jamsostek, Jamkesmas, and the various other public and private health insurance schemes have different formularies of their own. But, all these formularies are in line with the NLEM. Public hospitals can only prescribe medicines present in the hospital formulary (prepared based on NLEM) and those medicines are provided without any charge.
The NLEM constitutes the basis for public hospitals to develop their own hospital formularies. This adaptation is performed by a committee of medical experts and Pharmacy and the therapeutic committee of the hospital. All drugs listed in the hospital formulary are reimbursed by public insurance providers.
4.4.2 Insurance providers
Indonesia has shown remarkable progress in healthcare insurance coverage over the last ten years under the management of the MoH, National Social Security Council and Ministry for Social Affairs. By 2012, the government estimated that 154 mn people or 66% of the population were covered by public and private health insurance programs. This still left a significant minority (34%) untouched by healthcare insurance programs.
4.4.2.1 Public insurance
Public health insurance in Indonesia has captured a considerable share of the insurance market since the launch of the first social insurance program, Askes, in 1968. The number has expanded and now five different major public insurance
Public sector hospitals and other public healthcare facilities provide services either at a subsidized rate or free of charge. Private and other public healthcare schemes reimburse hospitals on a fee-for-service basis.
Negotiations between the insurance provider and healthcare service provider play a great role in determining the degree of reimbursement.
Various public and private health insurance schemes have different formularies of their own. All these formularies are in line with the NLEM.

97
Healthcare Market Access: Indonesia
© phamax AG, 2015 - All Rights Reserved
Source: MoH
programs are available in Indonesia, which together covered around 57% of the population in 2012. Askes covered 17 mn civil servants, retired personnel, and their family members. In 1992, PT Jamsostek was launched as a state-owned company designated to manage social insurance for private-sector employees. Finally, Askeskin/Jamkesmas have contributed to an increase in the utilization of health services, both in general and among the poor.
Table 47: Public insurance schemes, Indonesia
In January 2014, the government launched its ambitious universal healthcare insurance plan Jaminan Kesehatan Nasional (JKN), intended to cover all Indonesians by 2019. Under this plan, all existing insurance schemes will be merged. The biggest challenge in the path of JKN is the gap between the
Insurance scheme Beneficiary Funding Benefits
Population covered in mn
(% of total)
Jamkesmas Poor and near
poor population.
Financed by the
government.
Comprehensive out and in-patient care
in public health clinics and third-class hospitals.
78.7 mn (32%)
Jamkesda
Poor and near-poor identified
by local authorities, not
covered by Jamkesmas.
Financed by local
government.
Benefits are provided only in certain provinces and districts and vary from one to
the other.
33.9 mn (14%)
Askes Civil servants
and their dependents.
2% of basic salary that is
matched by the
government.
Comprehensive out and
in-patient care, no additional payment
needed for prescribed medicine.
17.7 mn (7%)
Jamsostek
Formal sector workers and their families who work in
private enterprises
with at least ten workers
and a turnover of at least IDR
one million.
3% of the salary for
single employees and 6% for
married employees.
Healthcare package that includes a wide
range of medical services, drugs, and treatment for out-
patients and in‑ patients.
5.7 mn (2.3%)
Asabri Military and
police personnel.
2% of the basic salary.
Pension, old age savings,
occupational injury and life insurance.
2.2 mn (1%)
The biggest challenge in the path of JKN is the gap between the healthcare benefits covered by the plan and the actual healthcare services available in the country.

98
Healthcare Market Access: Indonesia
© phamax AG, 2015 - All Rights Reserved
healthcare benefits covered by the plan and the actual healthcare services available in the country.
4.4.2.2 Private insurance
The penetration of private healthcare insurance is low (about 2.5%) and is mainly concentrated in the urban areas. Private insurance providers cover both inpatient and outpatient services. High-income and upper-middle-income groups are the largest buyers of private insurance. In addition, employees of medium and large-scale companies are increasingly recognizing the benefits of health insurance, which will increase the pool for private insurance providers. But, JKN is likely to have a negative effect on the private health insurance market. Nevertheless, many international health insurance companies are present in Indonesia, including leading players such as Allianz, AXA, AIA, Prudential, ManuLife, AVIVA, and BNI Life.
4.4.3 Co-payments
In Indonesia, healthcare insurance programs rarely reimburse all medical expenses and often require a high level of co-payment. At public hospitals, patients have to pay an initial fee to avail the healthcare services and the government subsidizes the remaining costs. Co-payment varies based on the insurance scheme and the type and level of services that the patient avails.
Askes (mandatory insurance for civil servants and retired personnel) provides comprehensive benefits for both outpatient and inpatient care through an organized health service provider mechanism. Though, to avail some specific treatments, Askes applies a cost-sharing policy. Thus, beneficiaries have a high co-payment burden for hospital fees, especially for inpatient care. As a result, less than half of the members who fall sick visit a hospital for treatment. Jamkesmas covers the poor and near poor, and is fully funded by the central government from general tax revenues. The benefit package is generous and does not require any co-payments, except at hospitals not within the network. Similarly, co-payment is not required for JKN, although charges apply for upgraded services.
Most of the healthcare insurance programs rarely reimburse all medical expenses and often require a high level of co-payment.

99
Healthcare Market Access: Indonesia
© phamax AG, 2015 - All Rights Reserved
4.5 Prescribing and dispensing
4.5.1 Prescribing guidelines
There are very few controls over the prescribing behavior of the physicians in Indonesia. Drug directories such as NLEM and Askes Drug List (Daftar Plafon Harga Obat, DPHO) serve as the guideline for the prescription. Physicians at public facilities are required to prescribe the medicine from the above mentioned drug lists. Yet, their prescriptions deviate from the list due to non-availability and other issues. The MoH decree of 2010 mandates the use of unbranded generics in the public facilities. But, the decree has never been implemented effectively. In private hospitals, the hospital formulary limits the prescribing choices of the physicians. Going forward, the national formulary will serve the basis of prescriptions in public as well many private hospitals as they intend to receive reimbursement from JKN.
4.5.2 Prescribing influences
The prescribing behavior of individual physicians is influenced by the promotional practices of pharmaceutical companies. These companies promote their products to doctors through detailing calls, advertisements in medical journals, brochures in the mail and at symposiums. Again, pharmaceutical companies offer incentives and gifts to doctors who prescribe their medicines, which results in irrational prescribing and overprescribing. As mentioned earlier, the promotional activities in Indonesia are regulated by the BPOM (Decree HK.00.05.3.02706). Furthermore, drug promotion practices are regulated by the Code of Pharmaceutical Marketing Practices created by the International Pharmaceutical Manufacturer Group (IPMG) and the Code of Conduct enforced by GP Farmasi.
In Indonesia, branded drugs are preferred by patients and physician equally. Moreover, pharmaceutical companies influence the drug procurement of the private hospitals at some extent, which limits the prescribing choices of physicians. However, a national formulary has been developed which influences the prescribing practice of physicians both in public and private sectors. This formulary has been developed on the basis of NLEM and Daftar Plafon Harga Obat (DPHO). The government is also attempting to reduce the prescription of costly branded generics by lawfully enforcing the prescription of unbranded generics in public healthcare facilities.
4.5.3 Dispensing
A large proportion of drugs are dispensed at pharmacies (hospital or other), drugstores and through dispensing doctors in Indonesia. Pharmacists are prohibited from substituting a prescribed drug with a generic or cheaper equivalent without the approval of the prescriber. Patients can easily purchase prescription medicines without any prescription. As per regulations, prescription drugs can be dispensed only by a qualified pharmacist. There is a need for tighter enforcement and
Although physicians at public facilities are required to prescribe based on NLEM and Askes Drug List, their prescriptions deviate from the lists due to non-availability and other issues.
Going forward, the national formulary will serve as the basis of prescription in public as well many private hospitals as they intend to receive reimbursement from JKN.
The prescribing behavior of individual physicians is influenced by the promotional practices of pharmaceutical companies.
Patients can easily purchase prescription medicines without any prescription due to poor enforcement of dispensing laws.

100
Healthcare Market Access: Indonesia
© phamax AG, 2015 - All Rights Reserved
monitoring for effective implementation of regulations. Although prescribing doctors are not allowed to dispense, some doctors dispense drugs directly to the patients.
101
Healthcare Market Access: Indonesia
© phamax AG, 2015 - All Rights Reserved
4.6 Reimbursement drug lists
Drug costs are reimbursed by healthcare insurance providers only if the prescribed drug is in their respective reimbursement lists. Most of the insurance providers use NLEM as the base for their reimbursement lists while Askes uses the Daftar Plafon Harga Obat (DPHO). But, the national drug formulary serves as the base for reimbursements under JKN.
4.6.1 National List of Essential Medicines (NLEM)
For the NLEM, ‘essential’ medicines are those drugs that are most needed for diagnosis, prophylaxis, and therapy rehabilitation and are mandatorily available at all health facilities. The concept of ‘essential’ medicines in Indonesia was introduced with the issuance of the NLEM in 1980, and with the publication of the National Drug Policy in 1983.Tthe NLEM contains more than 500 generic medicines. This list forms the basis for planning guidelines and the procurement of drugs for various government health facilities, both at the central and local levels. Drug reimbursements by Jamkesmas and Jamsostek are based on the NLEM.
The NLEM was formulated by the National Committee, comprising a team of experts, a team of consultants, an implementation team and the secretariat. The essential drugs are selected as per the following criteria:
• Risk–benefit analysis which must result in more benefits to the patient • Assured quality with high stability and bioavailability • High benefit-cost ratio • High compliance and acceptance by patients • Practical storage and transport
The NLEM is revised every three to four years. The most recent version, NLEM 2013, was created by the MoH Decree 312/Menkes/SK/IX/ 2013, which mandated revision of the version created in 2011. The revision process is as following:
• Proposal - The revision process starts once the secretariat sends a request for proposals on revisions (addition or deletion of a drug) to the healthcare units (central, provincial and district levels)
• Compilation - All proposals received from healthcare units are compiled by the secretariat according to the drug category after one month of receipt.
• Material revision - After compilation, all relevant proposals are revised by a team of experts one week before a technical discussion meeting
• Technical discussion meeting - At the technical discussion meeting, the committee members decide on the rationale behind the addition or deletion of a drug from the NLEM based on the safety-efficacy data and availability of the drug on the market. At the end of the meeting, a draft is prepared for further discussion and approval
• Approval - The Directorate General of Pharmaceutical Services and Medical Devices and MoH approve the revised NLEM
The NLEM contains more than 500 generic medicines. It is revised every three to four years.

102
Healthcare Market Access: Indonesia
© phamax AG, 2015 - All Rights Reserved
Source: MoH
4.6.2 Daftar Plafon Harga Obat (DPHO)
Askes, which provides insurance to civil servants, state officials, retirees, veterans and their family members, introduced a reimbursable list of drugs with a ceiling price on each drug. Askes intends to control costs without reducing the quality of service with this list. The list is called the Drug Ceiling Price List (Daftar Plafon Harga Obat, DPHO).
The DPHO was formulated by a team of experts from various facets of the medical domain and members from the MoH and BPOM. The expert team selected the products to be incorporated into DPHO based on quality, continuity of production, distribution scope and price. The list last included more than 900 products, including unbranded generics, branded generics and patented drugs. The DPHO prices are often lower than those determined by the OBG initiative of MoH.
Figure 51: Revision process of NLEM, Indonesia
The National Formulary (Fornas) is composed of 92% branded or unbranded generic drugs and 2.5% branded innovative drugs. The remaining percentage is taken up by dental and diagnostic materials.
Request for proposals sent to healthcare units
Compilation of received proposals
Preliminary meeting of team of experts
Technical discussion meeting
Preparation of the draft
Approval by the Directorate General of Pharmaceutical Services and Medical
Devices and MoH
103
Healthcare Market Access: Indonesia
© phamax AG, 2015 - All Rights Reserved
4.6.3 National formulary (Fornas)
The National Formulary (Fornas) is a list of drugs that is organized the by National Committee on Preparation of National Formulary. The drugs in the Fornas list are nominated based on latest scientific evidence and are the most efficacious and safe drugs available at affordable prices. The Fornas includes over 500 active ingredients and more than 900 preparations covering 29 therapeutic classes and 90 sub therapeutic classes. Branded or unbranded generic drugs constitute 92% of the list while branded innovative drugs account for 2.5%, with the remaining taken up by dental and diagnostic materials. Fornas is used as a reference for prescriptions in the JKN. The use of the national formulary is naturally going to improve the rational use of drugs. Also, it will also govern the quality of treatment and cost of therapy and optimize healthcare services to attain higher levels.

104
Healthcare Market Access: Indonesia
© phamax AG, 2015 - All Rights Reserved
4.7 Drug procurement
Post the decentralization in the healthcare sector in Indonesia, drug procurement has augmented at district levels. The District Health Office (DHO) is responsible for procurement for healthcare centers. Although, hospital procurement is managed by individual hospital managements as per the budget allocated by the local government. The drug procurement at the central level is carried out by the Director of Public Supply and mainly applies to medicines for emergencies and disease outbreaks.
Earlier, procurement was carried out by the annual tendering process in which suppliers submitted a bid for drugs and one supplier was selected as per pricing and other technical specifications. This tendering system was severely prejudiced in favor of the local government and politicians. To counter this prevailing corruption, the government implemented the e-catalog system for drug procurement. All procurement activities involving JKN is steered by this system. All healthcare providers under JKN can purchase medicines at listed prices, which is generally lower than the individual tender system. The e-catalog system has reduced prices by 40% in comparison to other tendering and bidding processes in Indonesia. Out of 900 drugs only 300 have been included in the list. These medicines are supplied by the 49 companies which have won their respective bids. The e-catalog system is:
• Transparent and accountable. • Supports monitoring and audit. • Provides real-time access to information.
To contain costs and deal with corruption in tendering, the government introduced the e-catalog system for drug procurement. Prices reduced by 40% in comparison to other tendering and bidding processes.

105
Healthcare Market Access: Indonesia
© phamax AG, 2015 - All Rights Reserved
4.8 Hospital formulary
Hospital formularies guide physicians in their prescribing choices. Each hospital has its own formulary, which is revised periodically. Hospital formularies are prepared by an expert panel specialized in the field of medicine. At public hospitals, the formulary is entirely based on the NLEM. But, at private hospitals, formularies deviate from the NLEM, usually with a heavy preference for branded drugs. Pharmaceutical companies try to influence physicians and the hospital management to include their product in the formulary. The application of hospitals formularies must be regularly monitored. The monitoring results are used for the evaluation and revision of the formulary to match developments in medical science and technology.
Formularies at public hospitals are entirely based on the NLEM. But, formularies at private hospitals deviate from the NLEM, usually with a heavy preference for branded drugs.

106
Healthcare Market Access: Indonesia
© phamax AG, 2015 - All Rights Reserved
5 Appendix
5.1 Glossary
AAM PT Anugrah Argon Medica ADR Adverse Drug Reaction APAC Asia-Pacific API Active Pharmaceutical Ingredients APL PT Anugerah Pharmindo Lestari ASEAN Association of Southeast Asian Nations BKKBN National Family Planning Coordinating Board BKMP Indonesia Investment Coordinating Board BOK Operational Assistance Health Fund BPJS health Badan Penyelenggara Jaminan Sosial Kesehatan
BPOM Badan Pengawas Obat dan Makanan (National Authority of Drug and Food Safety)
CAGR Compound Annual Growth Rate CHD Coronary Heart Disease CPI Consumer Price Index CRO Contract Research Organization CTD Common Technical Documents DALY The Disability-Adjusted Life Year DGIP Directorate General of Intellectual Property DOTS Direct Observed Treatment Short-Course DPD Dewan Perwakilan Daerah (Regional Representative Council) DPHO Daftar Plafon Harga Obat (Drug Ceiling Price List) DPR Dewan Perwakilan Rakyat (People’s Representative Council) EU European Union FDI Foreign Direct Investment Forex Foreign Exchange Fornas National Formulary GDP Gross Domestic Product GNI Gross National Income GER Gross Enrolment Ratio GMP Good Manufacturing Practice GP Farmasi Indonesian Pharmaceutical Association IDR Indonesian Rupiah
IFPMA International Federation of Pharmaceutical Manufacturers & Associations
IMF International Monetary Fund INA CBG Diagnosis-related Group/Case-mix System IPMG International Pharmaceutical Manufacturers Group IPR Intellectual Property Rights JCI Joint Commission International JKN Jaminan Kesehatan Nasional (National Health Insurance) KADIN Indonesian Chambers of Commerce KFTD PT Kimia Farma Trading & Distribution KPPU Business Competition Supervisory Commission MNC Multinational Company

107
Healthcare Market Access: Indonesia
© phamax AG, 2015 - All Rights Reserved
MoH Ministry of Health MPR Majelis Permusyawaratan Rakyat (People’s Consultative Assembly) NGO Non-government Organization NLEM National List of Essential Medicines NTP National Tuberculosis Control Program OGB Obat Generic Berlogo OIC Organization of Islamic Cooperation OOP Out-of-Pocket OTC Over-the-Counter PBF Pedagang Besar Farmasi (Distributor/wholesaler) PDI-P Indonesian Democratic Party - Struggle PhRMA Pharmaceutical Research and Manufacturers of America PKB National Awakening Party PPP Purchasing Power Parity TB Tuberculosis TRIPS Trade-Related Aspects of Intellectual Property Rights
UKBM Upaya Kesehatan Bersumberdaya Masyarakat (Community-Based Health Program)
WHO World Health Organization WIPO World Intellectual Property Organization YLD Years Lost Due to Disability YLL Years of Life Lost YSKAI The Touch of Love Children's Foundation Indonesia

108
Healthcare Market Access: Indonesia
© phamax AG, 2015 - All Rights Reserved
5.2 Sources
• AAM at a Glance; 2014; PT Anugrah Argon Medica (AAM); Available from: http://www.anugrah-argon.com/index.php/aam-at-a-glance/vision-and-mission; [Accessed September, 2014]
• About Counterfeit Drugs; 2014; International Pharmaceutical Manufacturers Group; Available from: http://www.ipmg-online.com/index.php?modul=issues&cat=icounterfeit&lang=eng; [Accessed September, 2014]
• Balance of Payment; 2014; Bank Indonesia; Available from: http://www.bi.go.id/sdds/series/bop/index_bop.asp; [Accessed September, 2014]
• Brodjonegoro Bambang PS; Economic Turbulence and the Indonesian Economy; 2014; Asian Development Bank; No. 12; Available from: http://aric.adb.org/pdf/policy_brief/economic_turbulence_and_the_Indonesian_economy.pdf. [Accessed September, 2014]
• Central Army Gatot Subroto Hospital Profile; 2014; Central Army Gatot Subroto Hospital; Available from: http://www.rspadgatsu.com/profil.php; [Accessed September, 2014]
• Clinical Trials Approval Procedures; 2014; BPOM Republic of Indonesia; Available from: http://jdih.pom.go.id/showpdf.php?u=818; [Accessed September, 2014]
• Competition Issues in the Distribution of Pharmaceuticals, Contribution from Indonesia; 2014; OECD; Available from: http://www.oecd.org/officialdocuments/publicdisplaydocumentpdf/?cote=DAF/COMP/GF/WD%282014%2932&docLanguage=En; [Accessed September, 2014]
• Control of Active Pharmaceutical Ingredients; 2014; The 2nd Indonesia-Japan Symposium; Available from: http://www.pmda.go.jp/english/events/2nd_Indonesia-Japan_Sympo/7-Ratna_Irawati.pdf; [Accessed October, 2014]
• Economic Report on Indonesia; 2013; Bank Indonesia; Available from: http://www.bi.go.id/en/publikasi/laporan-tahunan/perekonomian/Pages/lpi_2013.aspx; [Accessed October, 2014]
• Export Growth (HS 6 Digits) Period : 2009-2014; 2014; Ministry of Trade Republic of Indonesia; Available from: http://www.kemendag.go.id/en/economic-profile/indonesia-export-import/export-growth-hs-6-digits; [Accessed October, 2014]
• Harimurti P, et al; The Nuts and Bolts of Jamkesmas; 2013; The World Bank; Available from: https://openknowledge.worldbank.org/bitstream/handle/10986/13304/74996.pdf?sequence=1 ; [Accessed September, 2014]
• Health at a Glance: Asia/Pacific 2012; 2012; OECD; Available from: http://www.oecd-ilibrary.org/docserver/download/8112131e.pdf?expires=1417090895&id=id&accname=guest&checksum=699D715B4DF8F1A45A9141DBAC24ADA8; [Accessed September, 2014]
• History; Indonesia Pharmaceutical Association; 2014; Available from: http://www.gpfarmasi.org/index.php?option=com_content&view=article&id=19&Itemid=56; [Accessed September, 2014]
• Holloway KA; Indonesia, Pharmaceuticals in Health Care Delivery; 2011; World Health Organization; Available from: http://www.searo.who.int/entity/medicines/indonesia_situational_analysis.pdf; [Accessed September, 2014]
• Hospital Profile; 2014; Eka Hospital; Available from: http://www.ekahospital.com/about; [Accessed September, 2014]
• Identification and Clarification of the Differences in Regulatory Requirements between Asian Economies; 2013; Asia Partnership Conference of Pharmaceutical Associations (APAC); 2013; Japan; Available from: http://www.jpma.or.jp/english/apac/pdf/130722_05.pdf; [Accessed

109
Healthcare Market Access: Indonesia
© phamax AG, 2015 - All Rights Reserved
September, 2014] • Illiteracy Rate by Age Group; 2014;Badan Pusat statistik; Available from:
http://www.bps.go.id/eng/tab_sub/view.php?kat=1&tabel=1&daftar=1&id_subyek=28¬ab=2; [Accessed September, 2014]
• Indonesia Human Resources for Health Development Plan Year 2011-2025; Available from: http://www.who.int/workforcealliance/countries/indonesia_hrhplan_summary_en.pdf; [Accessed September, 2014]
• Indonesia in National Social Health Insurance System; 2013; Directorate General of Pharmaceutical and Medical Device; Indonesia Pharmaceutical Association; Available from: http://www.eibd-conference.com/assets/files/Pharmaceutical%202013/Pharmaceutical%20-%20Engko%20Socialine.pdf; [Accessed October, 2014]
• Indonesia: Universal Health Care Program Implemented; 2014; Library of Congress; Available from: http://www.loc.gov/lawweb/servlet/lloc_news?disp3_l205403816_text; [Accessed September, 2014]
• Innovation to Make a Difference, Annual Report 2013; 2014; Kalbe Farma; Available from: http://www.kalbe.co.id/Portals/3/Investor/Annual%20Report/Annual%20Report%202013%20Kalbe%20Farma.pdf; [Accessed September, 2014]
• IPMG Code of Pharmaceutical Marketing Practices; 2013; International Pharmaceutical Manufacturers Group; Available from: http://ifpma.org/fileadmin/content/About%20us/2%20Members/Associations/Code-Indonesia/IPMG_Code_of_Pharmaceutical_Marketing_Practices_July_2013_Revision.pdf; [Accessed September, 2014]
• Johannes Setijono; Pharmaceutical Market in Indonesia, EIBD Conference 2012; 2012; Ball; Available from: http://www.eibd-conference.com/assets/files/Pharmaceutical/Johannes%20Setijono.pdf; [Accessed September, 2014]
• Kimia Farma Annual Report 2013; 2014; Kimia Farma; Available from: http://www.kimiafarma.co.id/up_images/artikel_file_37011.pdf; [Accessed September, 2014]
• List of Pharmacy; 2014; Kimia Farma Apotek; Available from: http://kimiafarmaapotek.com/index.php?option=com_weblinks&view=category&id=902&Itemid=104; [Accessed September, 2014]
• Local Production of Pharmaceuticals and Related Technology Transfer in Developing Countries; 2011; UNCTAD; Available from: http://unctad.org/en/PublicationsLibrary/diaepcb2011d7_en.pdf; [Accessed September, 2014]
• Mihardja L, et al; Prevalence and determinants of diabetes mellitus and impaired glucose tolerance in Indonesia (a part of basic health research/Riskesdas); 2009; Acta Medica Indonesia; 41(4):169-74 Available from: http://www.ncbi.nlm.nih.gov/pubmed/20124611; [Accessed September, 2014]
• National Formulary and Quality Control Health Care Costs; 2013; Directorate General of Pharmaceutical and Medical Device; Available from: http://binfar.kemkes.go.id/2013/06/formularium-nasional-kendalikan-mutu-dan-biaya-pengobatan/;[Accessed September, 2014]
• Novartis presence in Indonesia; 2014; Novartis Indonesia; Available from: http://www.id.novartis.com/about-history.shtml.htm; [Accessed September, 2014]
• Organization Profile; International Pharmaceutical Manufacturers Group; 2014; Available from: http://www.ipmg-online.com/index.php?modul=profil&cat=PWho; [Accessed September, 2014]
• Pharmaceutical Research and Manufacturers of America (PhRMA), Special 301 Submission;

110
Healthcare Market Access: Indonesia
© phamax AG, 2015 - All Rights Reserved
2014; PhRMA; Available from: http://www.phrma.org/sites/default/files/pdf/2014-special-301-submission.pdf; [Accessed October, 2014]
• Pneumonia and Diarrhea Progress Report; 2013; International Vaccine Access Center (IVAC), Johns Hopkins Bloomberg School of Public Health; Available from: http://www.jhsph.edu/research/centers-and-institutes/ivac/resources/IVAC-2013-Pneumonia-Diarrhea-Progress-Report.pdf; [Accessed September, 2014]
• Private Sector Health in Indonesia; 2009; USAID; Available from: http://pdf.usaid.gov/pdf_docs/Pnadx714.pdf; [Accessed September, 2014]
• Procedures for Certification of GMP; 2011; BPOM Republic of Indonesia; Available from: http://jdih.pom.go.id/showpdf.php?u=158; [Accessed September, 2014]
• Profil Kesehatan indonesia 2012; Ministry of Health Republic of Indonesia; Available from: Available from: http://www.depkes.go.id/resources/download/pusdatin/profil-kesehatan-indonesia/profil-kesehatan-indonesia-2012.pdf; [Accessed September, 2014]
• Projected Population by Province; 2014; Badan Pusat statistik; Available from: http://www.bps.go.id/tab_sub/view.php?kat=1&tabel=1&daftar=1&id_subyek=12¬ab=12; [Accessed September, 2014]
• PT Merck Tbk Annual Report 2013; 2014; PT Merck Tbk; Available from: http://www.merck.co.id/country.id/en/images/PTMI_AR_2013_tcm172_122505.pdf?Version=; [Accessed September, 2014]
• PT Merck Tbk Indonesia; 2014; PT Merck Tbk Indonesia; Available from: http://www.merck.co.id/en/company/merck_in_indonesia/Copy_of_pt_merck_tbk.html; [Accessed September, 2014]
• PT SOHO at a Glance; 2014; PT SOHO Industri Pharmasi; Available from: http://www.sohogroup.com/pharma/pt-soho-at-a-glance; [Accessed September, 2014]
• Recapitulation Hospital By Category RS; 2014; Ministry of Health Republic of Indonesia ; Available from: http://202.70.136.52/rsonline/report/report_by_catrs_2011.php; [Accessed September, 2014]
• Recapitulation of Pharmaceutical Industry Indonesia; 2014; Ministry of Health Republic of Indonesia; Available from: http://apif.binfar.depkes.go.id/grafik-industrifarmasi.php; [Accessed September, 2014]
• Recapitulation Realization of Budget; 2014; Ministry of Health Republic of Indonesia; Available from: http://ppid.kemkes.go.id/dmdocuments/lapkeuangan/2012/LRA-2012.pdf; [Accessed September, 2014]
• Regulation of the President of the Republic of Indonesia, Number 5 of 2010, National Medium-Term Development Plan (RPJMN) 2010-2014; 2010; Ministry of National Development Planning Agency of Indonesia; Available from: http://theredddesk.org/sites/default/files/rpjmn-2010-2014-english-version__20100521111052__2608__0.pdf; [Accessed September, 2014]
• Sanbe at a Glance; 2014; anbe Farma; Available from: http://www.sanbe-farma.com/index.php?option=com_content&task=view&id=13&Itemid=37; [Accessed September, 2014]
• Sanofi in Indonesia; 2014; Sanofi Group Indonesia; Available from: http://www.sanofi.co.id/l/id/in/layout.jsp?scat=849510E2-CE8A-4D74-9CFC-027777A28978; [Accessed September, 2014]
• Santosa Hospital Profile; 2014; Santosa Hospital; Available from: http://www.santosa-hospital.com/index.php; [Accessed September, 2014]
• Siloam Hospital Overview; 2013; Siloam Hospital; Available from: http://www.siloamhospitals.com/siloam-hospitals-overview; [Accessed October, 2014]
111
Healthcare Market Access: Indonesia
© phamax AG, 2015 - All Rights Reserved
• Structural Policy Country Notes, Indonesia; 2013; OECD; Available from: http://www.oecd.org/dev/asia-pacific/Indonesia.pdf; [Accessed September, 2014]
• Supply and Demand Survey on Pharmaceuticals and Natural products, Indonesia; 2005; International Trade Centre; Available from: http://apps.who.int/medicinedocs/documents/s18012en/s18012en.pdf; [Accessed October, 2014]
• TB Care I; 2014; USAID; Available from: http://www.tbcare1.org/countries/asia/ind/; [Accessed September, 2014]
• The recapitulation of Health Human Resource utilized in Health Care Facilities (Fasyankes) in Indonesia; 2014; Ministry of Health Republic of Indonesia; Available from: http://www.bppsdmk.depkes.go.id/sdmk/index.php; [Accessed Septe
• WHO Country Cooperation Strategy 2007–2011; World Health Organization; Available from: http://www.who.int/countryfocus/cooperation_strategy/ccs_idn_en.pdf; [Accessed September, 2014]
• World Data on Education; 2011; UNESCO; Available from: http://unesdoc.unesco.org/images/0019/001931/193181e.pdf; [Accessed September, 2014]
• World Development Indicators; World Bank; Available from: http://data.worldbank.org/country/indonesia; [Accessed October, 2014]
• World Economic Outlook Database; 2014; International Monetary Fund; Available from: Available from: http://www.imf.org/external/pubs/ft/weo/2014/02/weodata/weoselgr.aspx; [Accessed September, 2014]
• Yayasan Stroke Indonesia (Yastroki) Profile; 2014; Yayasan Stroke Indonesia; Available from: http://www.yastroki.or.id/profil.php; [Accessed September, 2014]

112
Healthcare Market Access: Indonesia
© phamax AG, 2015 - All Rights Reserved
5.3 Methodology
5.3.1 Secondary research
In-depth and extensive secondary research was conducted to capture quantitative and qualitative information by a team of experienced consultants with advanced analytical skills and expertise in the pharmaceutical industry. The data was collected from multiple credible and authentic sources within public domain, including but not limited to:
• Websites of Ministry of Health and its affiliates as well as various regulatory and government bodies.
• Company websites, annual reports, investor presentations and press releases of various pharmaceutical companies and hospitals.
• Reports of various healthcare and pharmaceutical trade associations. • Reports published by various internationally recognized bodies such as World Health
Organization (WHO), United Nations (UN), and others. • Reports and articles published by globally accredited institutions such as the World Bank,
International Monetary Fund (IMF), Asian Development Bank (ADB), the Organization for Economic Cooperation and Development (OECD), Central Banks of respective countries and many more.
• News, press releases and bulletins of domestic as well as foreign newspapers and magazines. • Publications in various scientific, healthcare and other related journals.
5.3.2 Primary research
To address the data gaps and further consolidate the secondary research findings, phamax collected primary data through e-mails, telephone calls and interviews with various sources including:
• Ministry of Health officials. • Key officials serving in government agencies. • Healthcare and Pharmaceutical trade associations and other similar bodies. • Pharmaceutical distributors/stockists/retailers. • Hospitals and their affiliates. • KOLs in therapy area and disease management. • Industry experts. • Executives of both domestic and foreign pharmaceutical companies.
In addition to the above mentioned primary sources, phamax leveraged the experience and expertise of its ‘Dendron Network’, which comprises top KOLs and scientific experts in respective countries.
5.3.3 Data validation
Both the primary and secondary data was validated by a panel of experts including industry experts, KOLs, thought leaders and members of phamax Dendron Network.

113
Healthcare Market Access: Indonesia
© phamax AG, 2015 - All Rights Reserved
5.4 Disclaimer
All information contained in this publication has been thoroughly researched and compiled from various sources that are believed to be accurate and credible at the time of publishing. However, in view of the natural scope for human and/or mechanical error, either at source or during production, phamax accepts no liability whatsoever for any loss or damage resulting from errors, inaccuracies or omissions from any part of the publication. All information is provided without warranty, and phamax makes no representation of warranty of any kind as to the accuracy or completeness of any information hereto contained.
The information contained in this report is strictly confidential and has been provided to the client under a non-exclusive and non-transferable license for the client’s direct benefit and use only. The report should not be copied, electronically transmitted, sold or divulged to any other party without the prior written consent of phamax.
© 2015 phamax AG. All rights reserved.
5.5 Contact us
All communications pertaining to this report should be addressed to:
SWITZERLAND OFFICE
phamax AG Passage 6, 4104 Oberwil (BL), SWITZERLAND Phone: +41 61821 5687 Fax: +41 61821 5836 E-mail: [email protected]
INDIA OFFICE
phamax Analytic Resources Pvt. Ltd. #19, “KMJ Ascend”, 1st Cross, 17th C Main, 5th Block, Koramangala, Bangalore 560 095, INDIA Phone no: +91 80 6745 1100 Fax no: +91 80 6745 1122 E-mail: [email protected]