Healthcare Landscape in Vietnam
47
STUDY ABOUT HEALTHCARE LANDSCAPE IN VIETNAM October, 2017
-
Upload
di-marketing -
Category
Healthcare
-
view
265 -
download
1
Transcript of Healthcare Landscape in Vietnam
STUDY ABOUT HEALTHCARE LANDSCAPE
IN VIETNAM
October, 2017
1DI Marketing Co., Ltd.
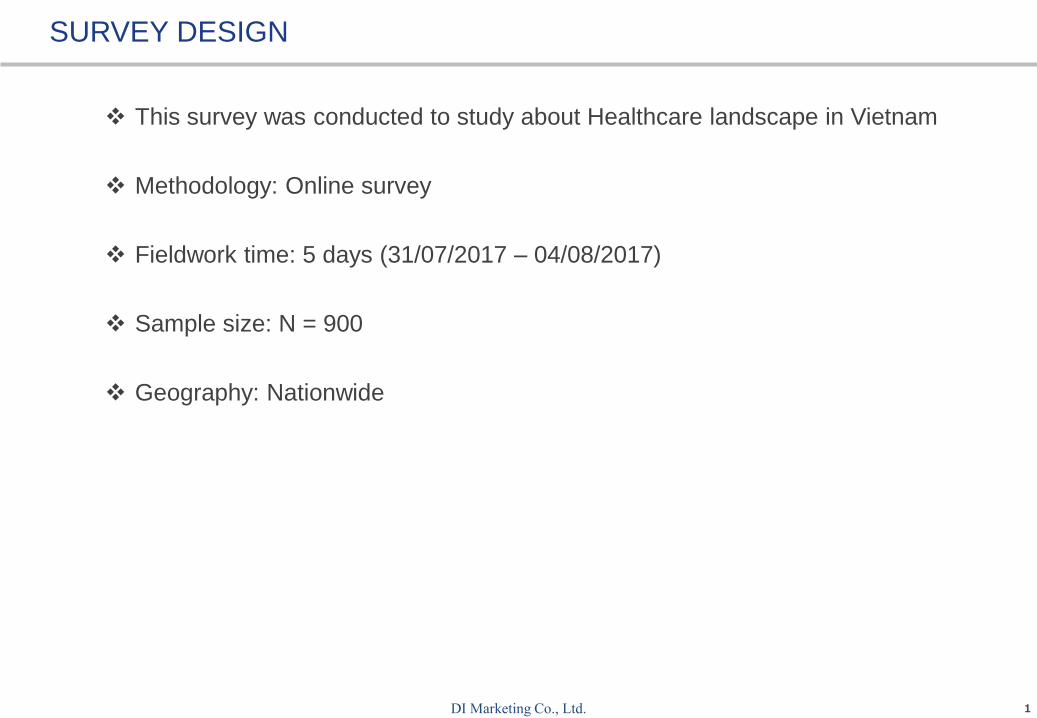
SURVEY DESIGN
This survey was conducted to study about Healthcare landscape in Vietnam
Methodology: Online survey
Fieldwork time: 5 days (31/07/2017 – 04/08/2017)
Sample size: N = 900
Geography: Nationwide
2DI Marketing Co., Ltd.
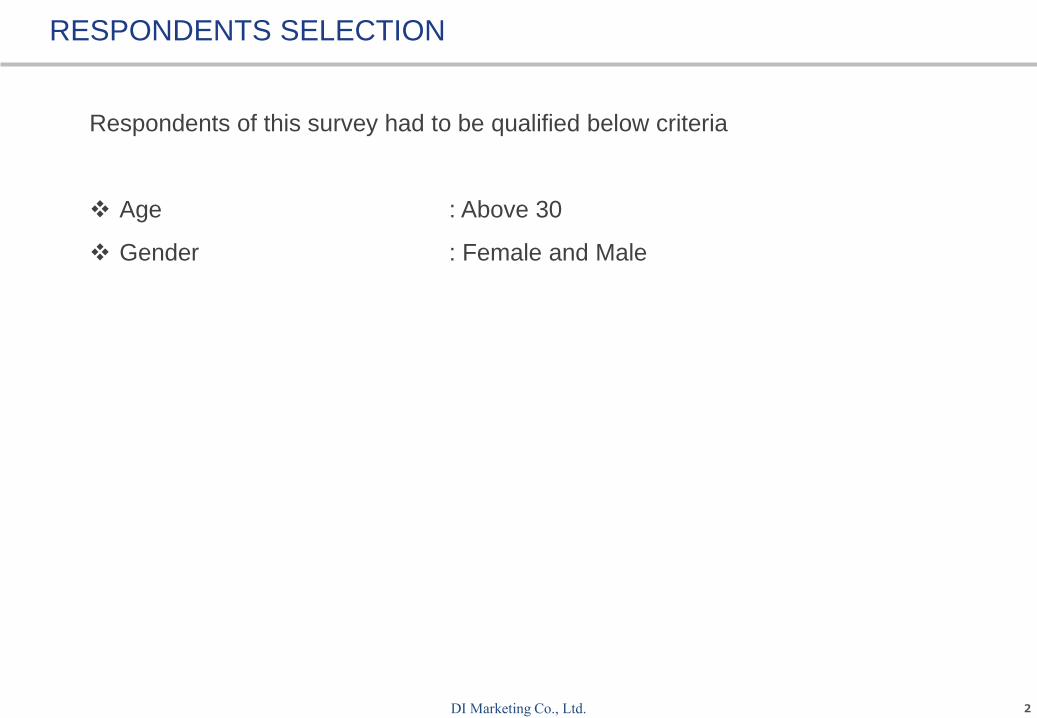
RESPONDENTS SELECTION
Respondents of this survey had to be qualified below criteria
Age : Above 30
Gender : Female and Male
3DI Marketing Co., Ltd.
KEY FINDINGS
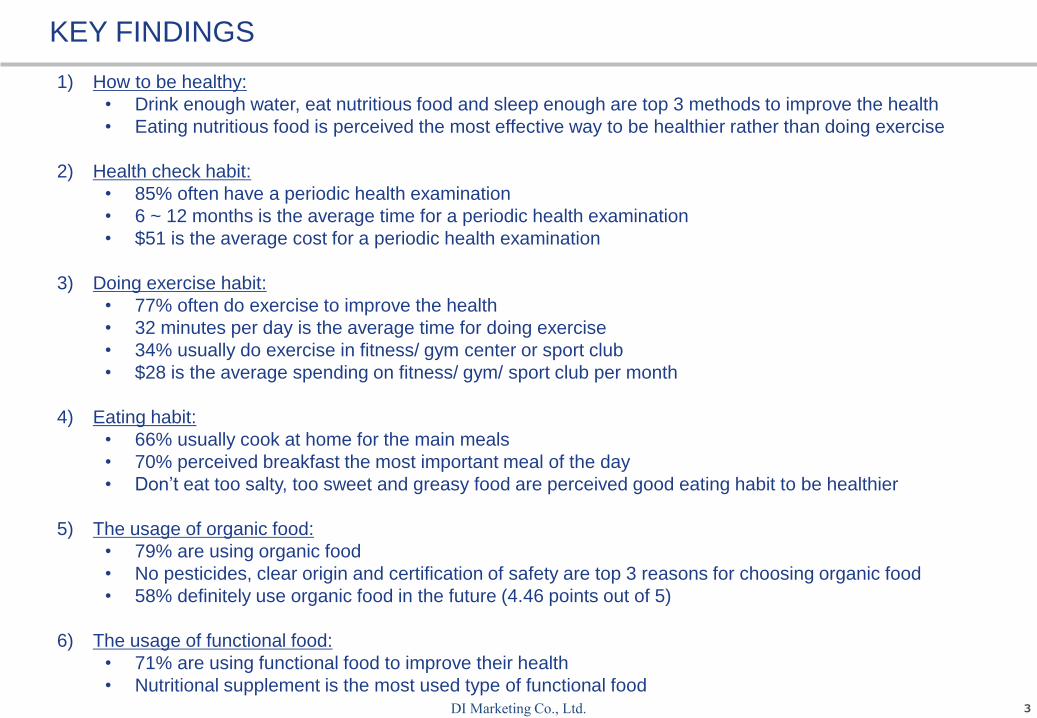
1) How to be healthy:
• Drink enough water, eat nutritious food and sleep enough are top 3 methods to improve the health
• Eating nutritious food is perceived the most effective way to be healthier rather than doing exercise
2) Health check habit:
• 85% often have a periodic health examination
• 6 ~ 12 months is the average time for a periodic health examination
• $51 is the average cost for a periodic health examination
3) Doing exercise habit:
• 77% often do exercise to improve the health
• 32 minutes per day is the average time for doing exercise
• 34% usually do exercise in fitness/ gym center or sport club
• $28 is the average spending on fitness/ gym/ sport club per month
4) Eating habit:
• 66% usually cook at home for the main meals
• 70% perceived breakfast the most important meal of the day
• Don’t eat too salty, too sweet and greasy food are perceived good eating habit to be healthier
5) The usage of organic food:
• 79% are using organic food
• No pesticides, clear origin and certification of safety are top 3 reasons for choosing organic food
• 58% definitely use organic food in the future (4.46 points out of 5)
6) The usage of functional food:
• 71% are using functional food to improve their health
• Nutritional supplement is the most used type of functional food
4DI Marketing Co., Ltd.
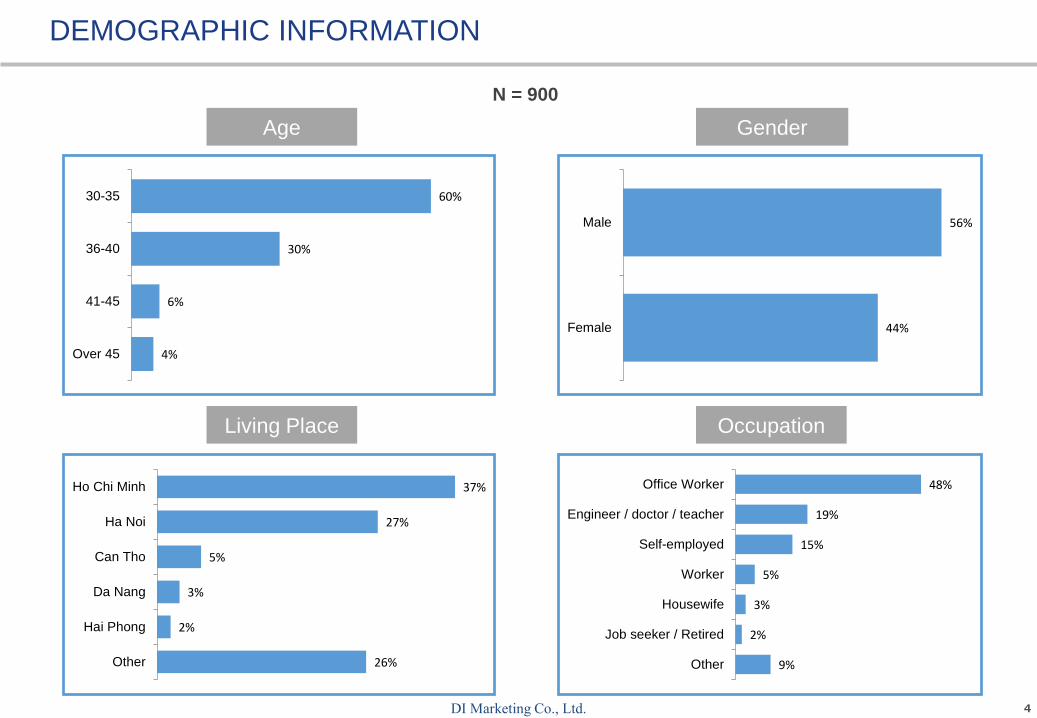
N = 900
DEMOGRAPHIC INFORMATION
GenderAge
OccupationLiving Place
4%
6%
30%
60%
Over 45
41-45
36-40
30-35
44%
56%
Female
Male
26%
2%
3%
5%
27%
37%
Other
Hai Phong
Da Nang
Can Tho
Ha Noi
Ho Chi Minh
9%
2%
3%
5%
15%
19%
48%
Other
Job seeker / Retired
Housewife
Worker
Self-employed
Engineer / doctor / teacher
Office Worker
5DI Marketing Co., Ltd.
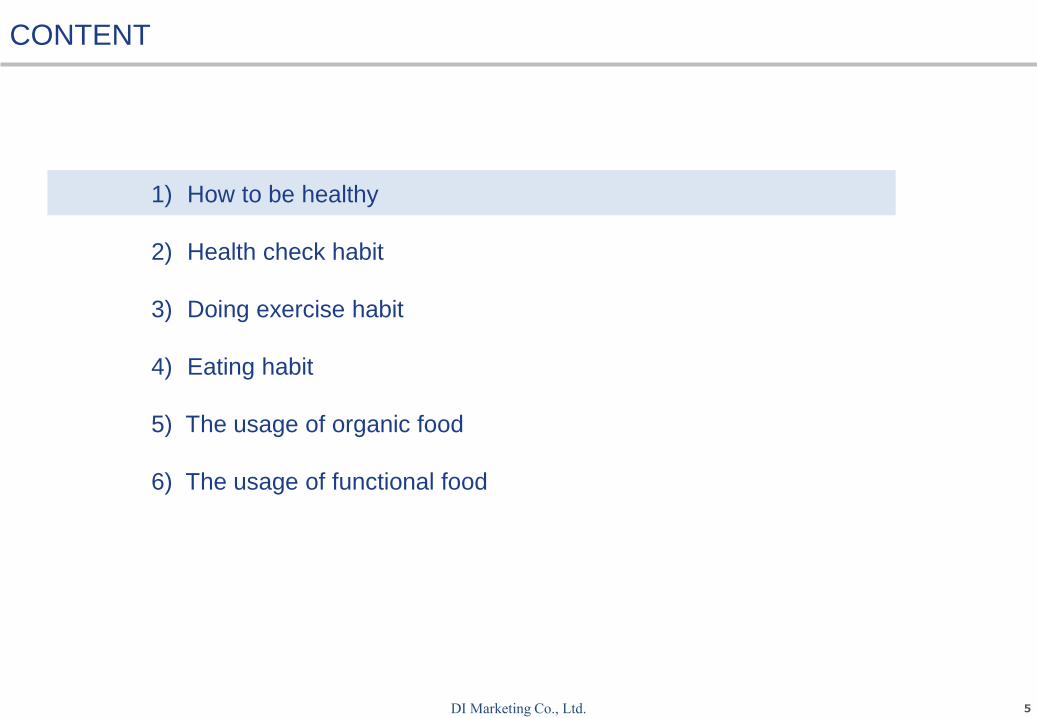
1) How to be healthy
2) Health check habit
3) Doing exercise habit
4) Eating habit
5) The usage of organic food
6) The usage of functional food
CONTENT
6DI Marketing Co., Ltd.
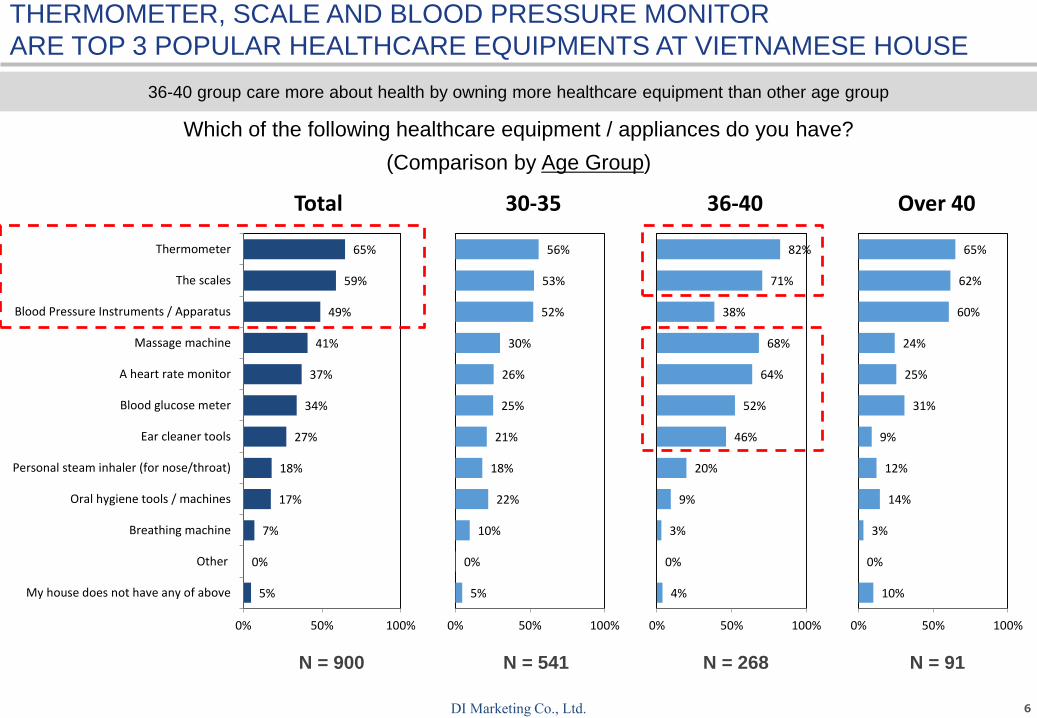
THERMOMETER, SCALE AND BLOOD PRESSURE MONITOR
ARE TOP 3 POPULAR HEALTHCARE EQUIPMENTS AT VIETNAMESE HOUSE
Which of the following healthcare equipment / appliances do you have?
(Comparison by Age Group)
N = 900 N = 541 N = 268 N = 91
5%
0%
7%
17%
18%
27%
34%
37%
41%
49%
59%
65%
0% 50% 100%
My house does not have any of above
Other
Breathing machine
Oral hygiene tools / machines
Personal steam inhaler (for nose/throat)
Ear cleaner tools
Blood glucose meter
A heart rate monitor
Massage machine
Blood Pressure Instruments / Apparatus
The scales
Thermometer
Total
5%
0%
10%
22%
18%
21%
25%
26%
30%
52%
53%
56%
0% 50% 100%
30-35
4%
0%
3%
9%
20%
46%
52%
64%
68%
38%
71%
82%
0% 50% 100%
36-40
10%
0%
3%
14%
12%
9%
31%
25%
24%
60%
62%
65%
0% 50% 100%
Over 40
36-40 group care more about health by owning more healthcare equipment than other age group
7DI Marketing Co., Ltd.
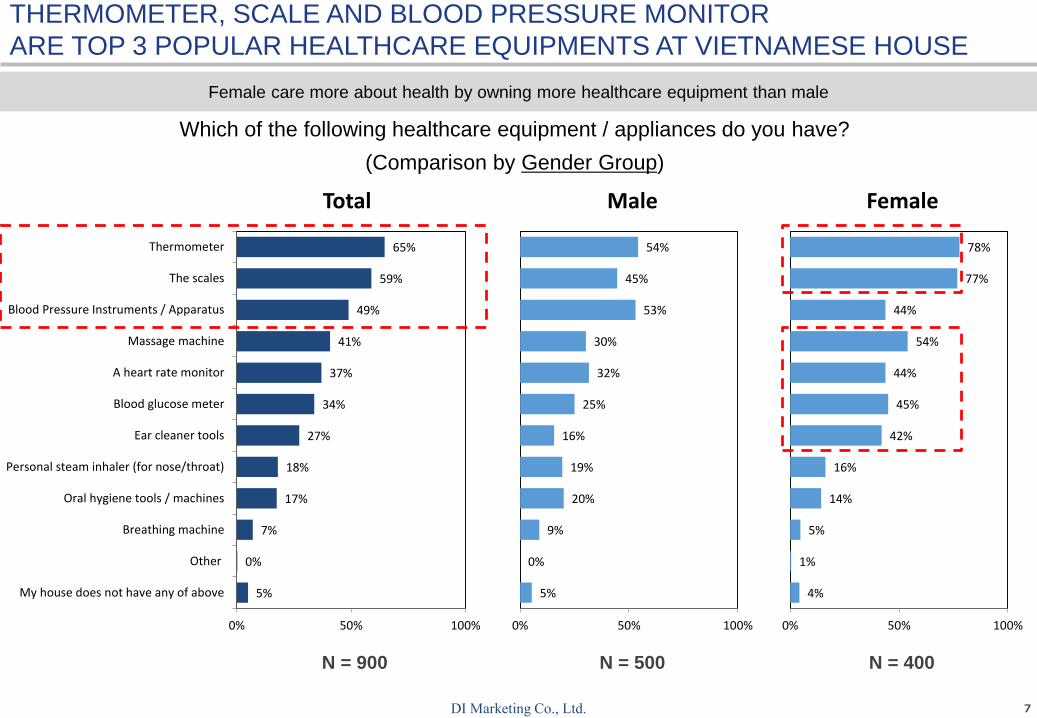
Which of the following healthcare equipment / appliances do you have?
(Comparison by Gender Group)
N = 900 N = 500 N = 400
5%
0%
7%
17%
18%
27%
34%
37%
41%
49%
59%
65%
0% 50% 100%
My house does not have any of above
Other
Breathing machine
Oral hygiene tools / machines
Personal steam inhaler (for nose/throat)
Ear cleaner tools
Blood glucose meter
A heart rate monitor
Massage machine
Blood Pressure Instruments / Apparatus
The scales
Thermometer
Total
5%
0%
9%
20%
19%
16%
25%
32%
30%
53%
45%
54%
0% 50% 100%
Male
4%
1%
5%
14%
16%
42%
45%
44%
54%
44%
77%
78%
0% 50% 100%
Female
Female care more about health by owning more healthcare equipment than male
THERMOMETER, SCALE AND BLOOD PRESSURE MONITOR
ARE TOP 3 POPULAR HEALTHCARE EQUIPMENTS AT VIETNAMESE HOUSE
8DI Marketing Co., Ltd.
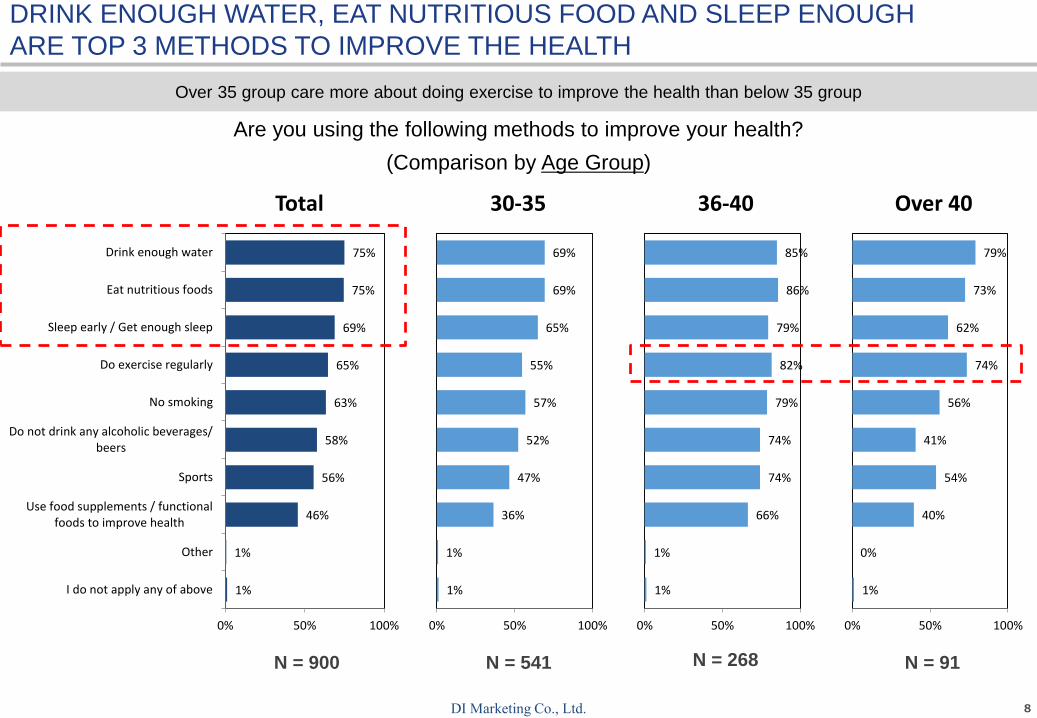
DRINK ENOUGH WATER, EAT NUTRITIOUS FOOD AND SLEEP ENOUGH
ARE TOP 3 METHODS TO IMPROVE THE HEALTH
Are you using the following methods to improve your health?
(Comparison by Age Group)
N = 900 N = 541 N = 268 N = 91
1%
1%
46%
56%
58%
63%
65%
69%
75%
75%
0% 50% 100%
I do not apply any of above
Other
Use food supplements / functionalfoods to improve health
Sports
Do not drink any alcoholic beverages/beers
No smoking
Do exercise regularly
Sleep early / Get enough sleep
Eat nutritious foods
Drink enough water
Total
1%
1%
36%
47%
52%
57%
55%
65%
69%
69%
0% 50% 100%
30-35
1%
1%
66%
74%
74%
79%
82%
79%
86%
85%
0% 50% 100%
36-40
1%
0%
40%
54%
41%
56%
74%
62%
73%
79%
0% 50% 100%
Over 40
Over 35 group care more about doing exercise to improve the health than below 35 group
9DI Marketing Co., Ltd.
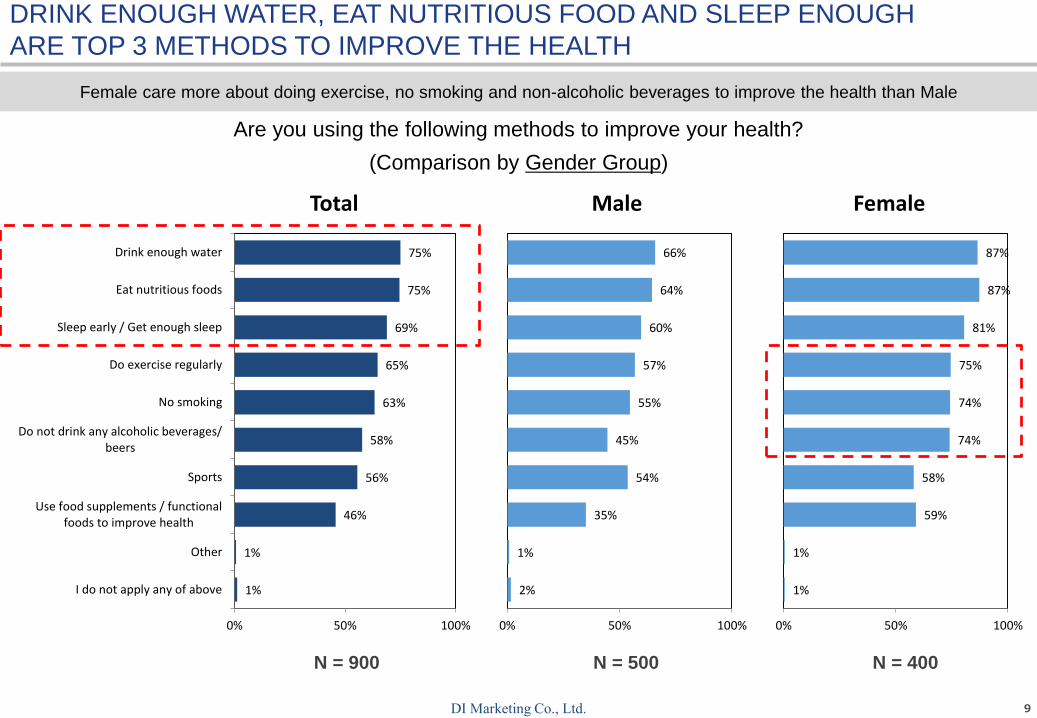
Are you using the following methods to improve your health?
(Comparison by Gender Group)
N = 900 N = 500 N = 400
1%
1%
46%
56%
58%
63%
65%
69%
75%
75%
0% 50% 100%
I do not apply any of above
Other
Use food supplements / functionalfoods to improve health
Sports
Do not drink any alcoholic beverages/beers
No smoking
Do exercise regularly
Sleep early / Get enough sleep
Eat nutritious foods
Drink enough water
Total
2%
1%
35%
54%
45%
55%
57%
60%
64%
66%
0% 50% 100%
Male
1%
1%
59%
58%
74%
74%
75%
81%
87%
87%
0% 50% 100%
Female
Female care more about doing exercise, no smoking and non-alcoholic beverages to improve the health than Male
DRINK ENOUGH WATER, EAT NUTRITIOUS FOOD AND SLEEP ENOUGH
ARE TOP 3 METHODS TO IMPROVE THE HEALTH
10DI Marketing Co., Ltd.
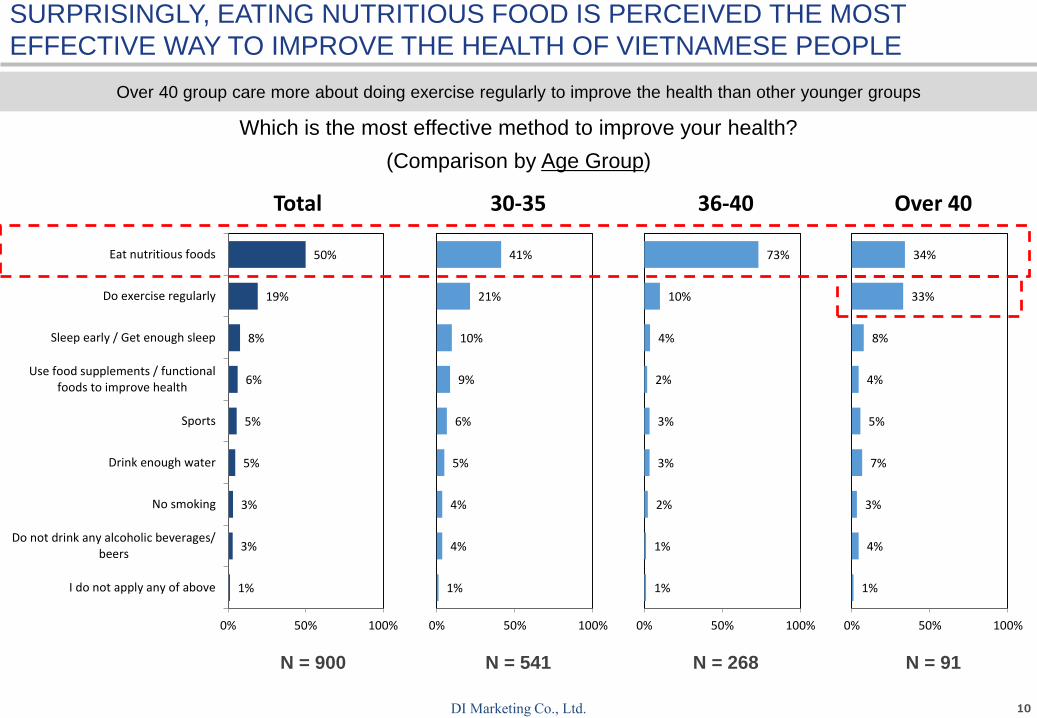
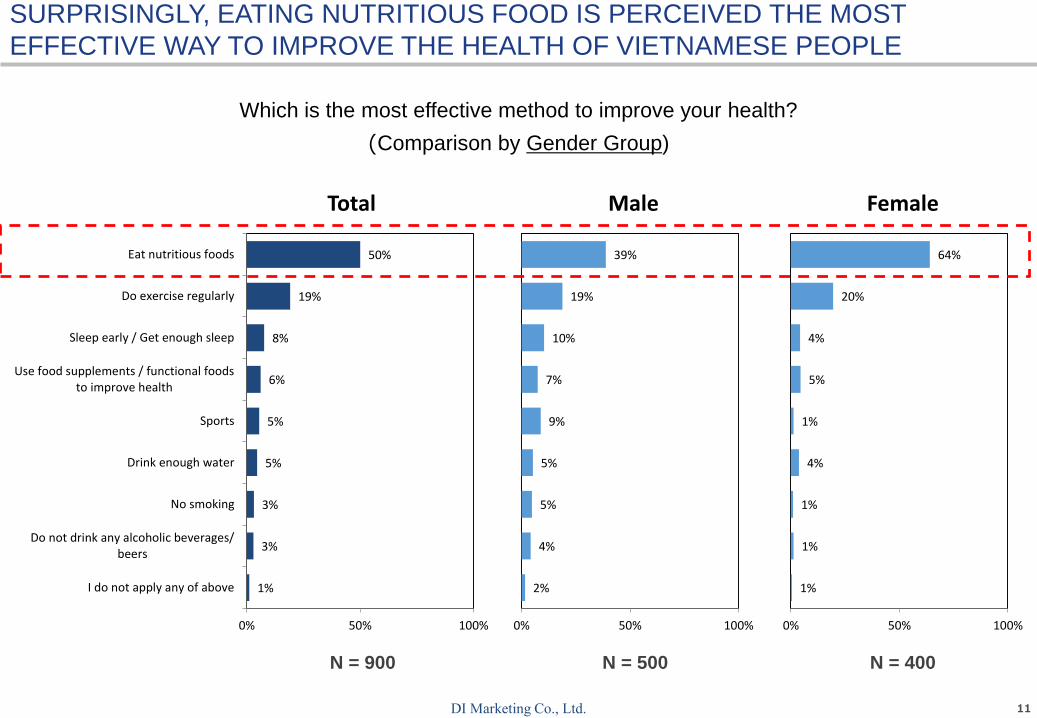
SURPRISINGLY, EATING NUTRITIOUS FOOD IS PERCEIVED THE MOST
EFFECTIVE WAY TO IMPROVE THE HEALTH OF VIETNAMESE PEOPLE
Which is the most effective method to improve your health?
(Comparison by Age Group)
N = 900 N = 541 N = 268 N = 91
1%
3%
3%
5%
5%
6%
8%
19%
50%
0% 50% 100%
I do not apply any of above
Do not drink any alcoholic beverages/beers
No smoking
Drink enough water
Sports
Use food supplements / functionalfoods to improve health
Sleep early / Get enough sleep
Do exercise regularly
Eat nutritious foods
Total
1%
4%
4%
5%
6%
9%
10%
21%
41%
0% 50% 100%
30-35
1%
1%
2%
3%
3%
2%
4%
10%
73%
0% 50% 100%
36-40
1%
4%
3%
7%
5%
4%
8%
33%
34%
0% 50% 100%
Over 40
Over 40 group care more about doing exercise regularly to improve the health than other younger groups
11DI Marketing Co., Ltd.
Which is the most effective method to improve your health?
(Comparison by Gender Group)
N = 900 N = 500 N = 400
1%
3%
3%
5%
5%
6%
8%
19%
50%
0% 50% 100%
I do not apply any of above
Do not drink any alcoholic beverages/beers
No smoking
Drink enough water
Sports
Use food supplements / functional foodsto improve health
Sleep early / Get enough sleep
Do exercise regularly
Eat nutritious foods
Total
2%
4%
5%
5%
9%
7%
10%
19%
39%
0% 50% 100%
Male
1%
1%
1%
4%
1%
5%
4%
20%
64%
0% 50% 100%
Female
SURPRISINGLY, EATING NUTRITIOUS FOOD IS PERCEIVED THE MOST
EFFECTIVE WAY TO IMPROVE THE HEALTH OF VIETNAMESE PEOPLE
12DI Marketing Co., Ltd.
1) How to be healthy
2) Health check habit
3) Doing exercise habit
4) Eating habit
5) The usage of organic food
6) The usage of functional food
CONTENT
13DI Marketing Co., Ltd.
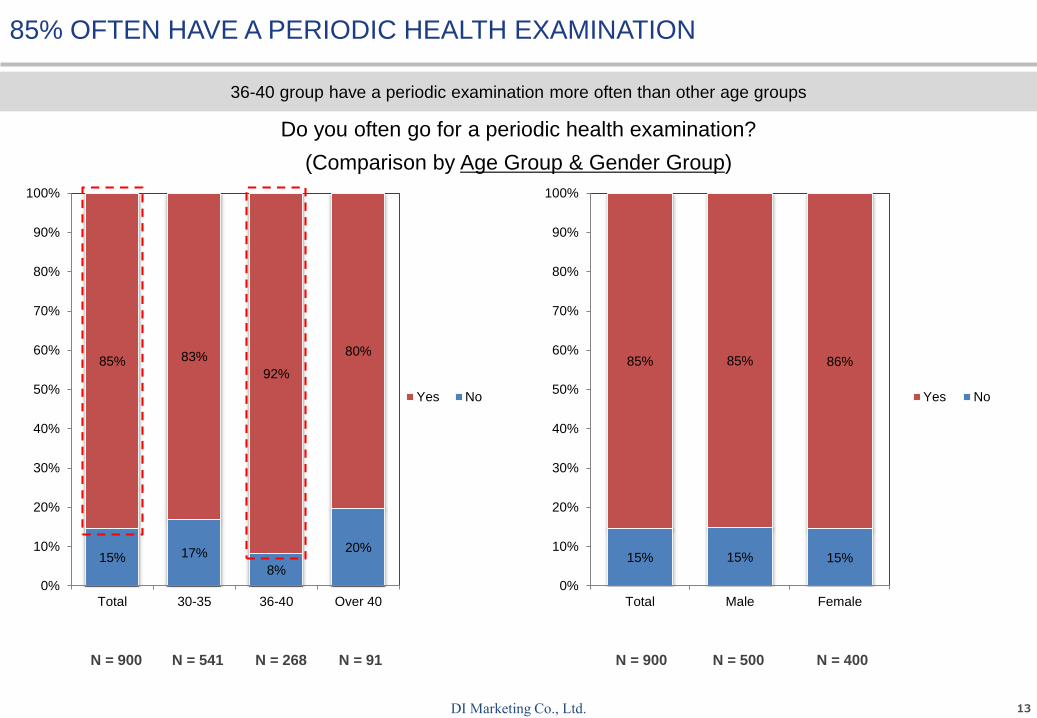
85% OFTEN HAVE A PERIODIC HEALTH EXAMINATION
Do you often go for a periodic health examination?
(Comparison by Age Group & Gender Group)
15% 17%
8%
20%
85% 83%
92%
80%
0%
10%
20%
30%
40%
50%
60%
70%
80%
90%
100%
Total 30-35 36-40 Over 40
Yes No
15% 15% 15%
85% 85% 86%
0%
10%
20%
30%
40%
50%
60%
70%
80%
90%
100%
Total Male Female
Yes No
N = 900 N = 541 N = 268 N = 91 N = 900 N = 500 N = 400
36-40 group have a periodic examination more often than other age groups
14DI Marketing Co., Ltd.
3% 5%
38%
49%
24%
50%
37%
65%
8% 7% 8%
0%
10%
20%
30%
40%
50%
60%
70%
80%
90%
100%
Total Male Female
Every 3 months
Every 6 months
Every 12 months
Every 18 months
Every 24 months
Not fixed / onlywhenever i feel notgood
3% 4% 2% 1%
38%
44%
29%27%
50%43%
60%
53%
8% 7% 7%
16%
0%
10%
20%
30%
40%
50%
60%
70%
80%
90%
100%
Total 30-35 36-40 Over 40
Every 3 months
Every 6 months
Every 12 months
Every 18 months
Every 24 months
Not fixed / onlywhenever i feelnot good
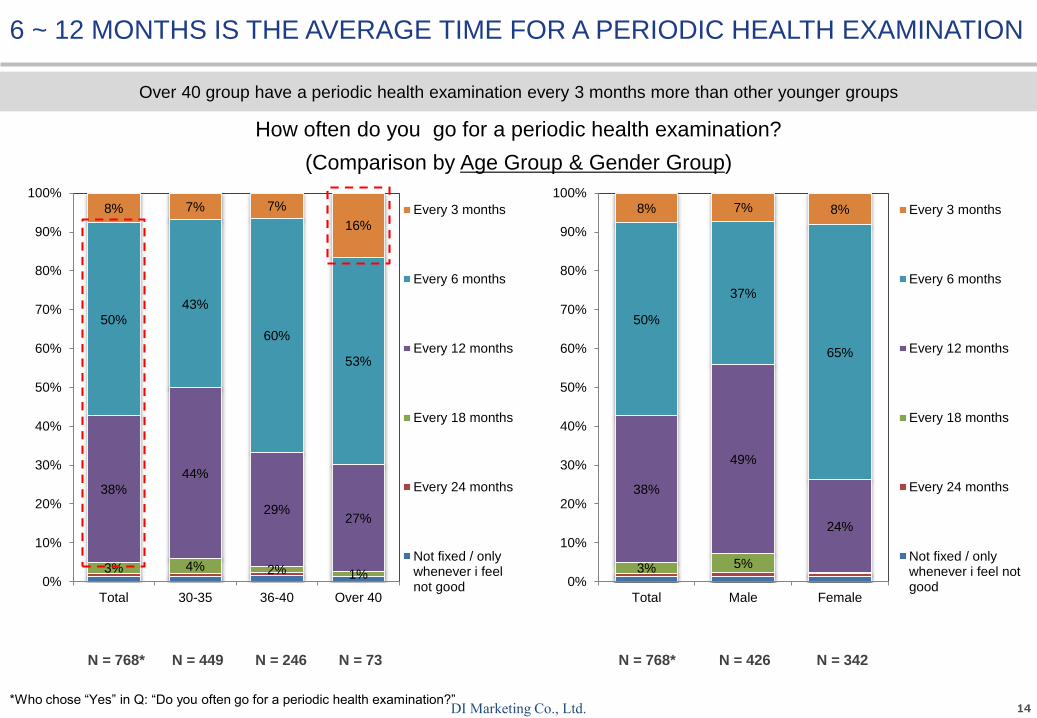
How often do you go for a periodic health examination?
(Comparison by Age Group & Gender Group)
N = 768* N = 449 N = 246 N = 73 N = 768* N = 426 N = 342
*Who chose “Yes” in Q: “Do you often go for a periodic health examination?”
6 ~ 12 MONTHS IS THE AVERAGE TIME FOR A PERIODIC HEALTH EXAMINATION
Over 40 group have a periodic health examination every 3 months more than other younger groups
15DI Marketing Co., Ltd.
2% 3% 3%
8%11%
2%
10%
10%
14%
5%
8%
16%
20%
10%
14%
22%
27%
11%
29%
42%
26%
72%
37%
0%
10%
20%
30%
40%
50%
60%
70%
80%
90%
100%
Total 30-35 36-40 Over 40
City LevelHospital
General hospital
District LevelHospital
Central hospital
Private clinic
Other 2% 2% 2%
8% 10%6%
10%12%
9%
16%17%
15%
22%
26%
17%
42%
33%
52%
0%
10%
20%
30%
40%
50%
60%
70%
80%
90%
100%
Total Male Female
City Level Hospital
General hospital
District LevelHospital
Central hospital
Private clinic
Other
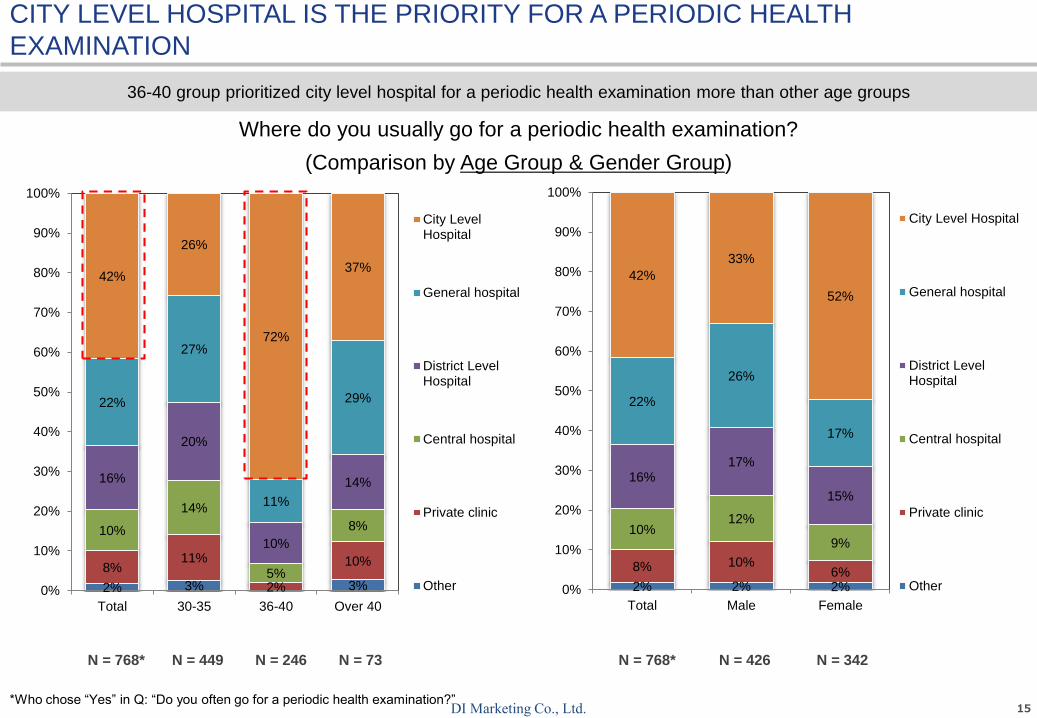
CITY LEVEL HOSPITAL IS THE PRIORITY FOR A PERIODIC HEALTH
EXAMINATION
Where do you usually go for a periodic health examination?
(Comparison by Age Group & Gender Group)
36-40 group prioritized city level hospital for a periodic health examination more than other age groups
N = 768* N = 449 N = 246 N = 73 N = 768* N = 426 N = 342
*Who chose “Yes” in Q: “Do you often go for a periodic health examination?”
16DI Marketing Co., Ltd.
22%
8%
51%
11%
10%
12%
5%
16%
18%
23%
8%
18%
32%38%
26%
12%
16% 17%
9%
36%
2% 2%7%
0%
10%
20%
30%
40%
50%
60%
70%
80%
90%
100%
Total 30-35 36-40 Over 40
Under $5
$5 - $24
$25 - $45
$46 - $69
$70 - $90
Over $9022%
7%
42%
10%
11%
8%
18%
21%
14%
32%
42%
18%
16% 16% 16%
2% 3% 1%
0%
10%
20%
30%
40%
50%
60%
70%
80%
90%
100%
Total Male Female
Under $5
$5 - $24
$25 - $45
$46 - $69
$70 - $90
Over $90
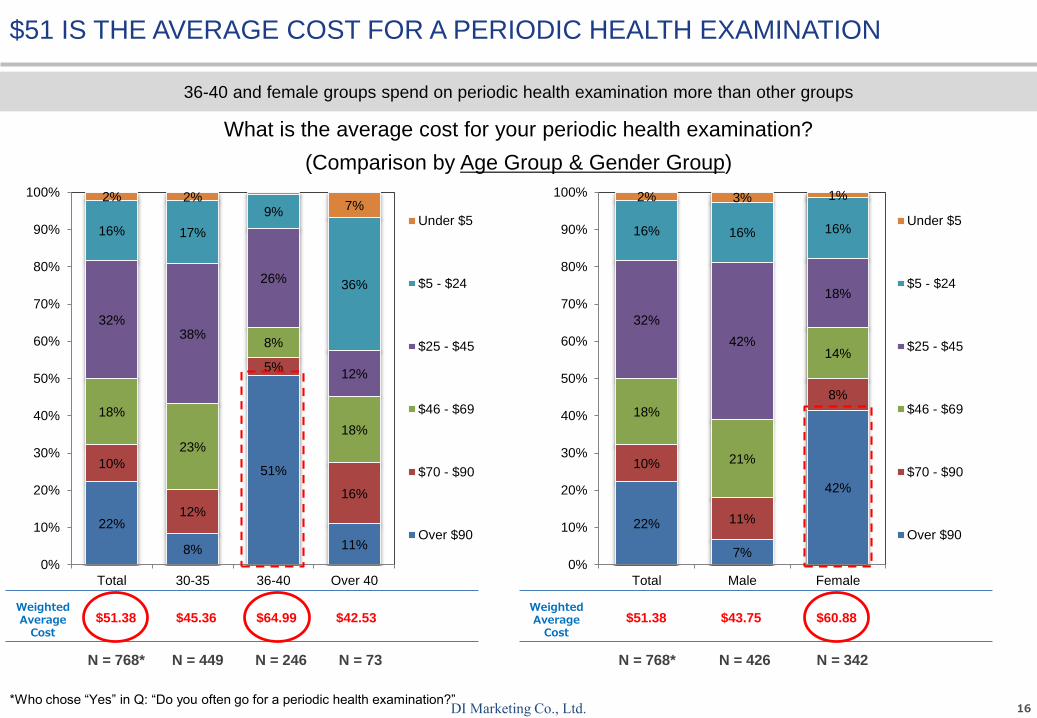
$51 IS THE AVERAGE COST FOR A PERIODIC HEALTH EXAMINATION
What is the average cost for your periodic health examination?
(Comparison by Age Group & Gender Group)
WeightedAverageCost
WeightedAverageCost
$51.38 $45.36 $64.99 $42.53 $51.38 $43.75 $60.88
36-40 and female groups spend on periodic health examination more than other groups
N = 768* N = 449 N = 246 N = 73 N = 768* N = 426 N = 342
*Who chose “Yes” in Q: “Do you often go for a periodic health examination?”
17DI Marketing Co., Ltd.
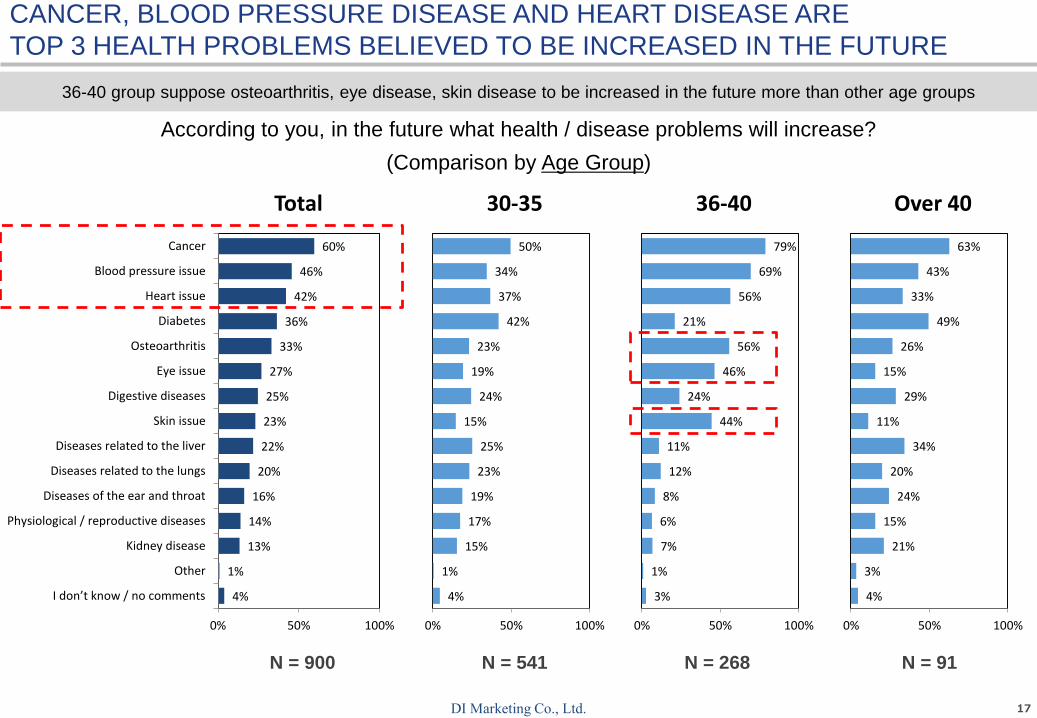
CANCER, BLOOD PRESSURE DISEASE AND HEART DISEASE ARE
TOP 3 HEALTH PROBLEMS BELIEVED TO BE INCREASED IN THE FUTURE
According to you, in the future what health / disease problems will increase?
(Comparison by Age Group)
N = 900 N = 541 N = 268 N = 91
4%
1%
13%
14%
16%
20%
22%
23%
25%
27%
33%
36%
42%
46%
60%
0% 50% 100%
I don’t know / no comments
Other
Kidney disease
Physiological / reproductive diseases
Diseases of the ear and throat
Diseases related to the lungs
Diseases related to the liver
Skin issue
Digestive diseases
Eye issue
Osteoarthritis
Diabetes
Heart issue
Blood pressure issue
Cancer
Total
4%
1%
15%
17%
19%
23%
25%
15%
24%
19%
23%
42%
37%
34%
50%
0% 50% 100%
30-35
3%
1%
7%
6%
8%
12%
11%
44%
24%
46%
56%
21%
56%
69%
79%
0% 50% 100%
36-40
4%
3%
21%
15%
24%
20%
34%
11%
29%
15%
26%
49%
33%
43%
63%
0% 50% 100%
Over 40
36-40 group suppose osteoarthritis, eye disease, skin disease to be increased in the future more than other age groups
18DI Marketing Co., Ltd.
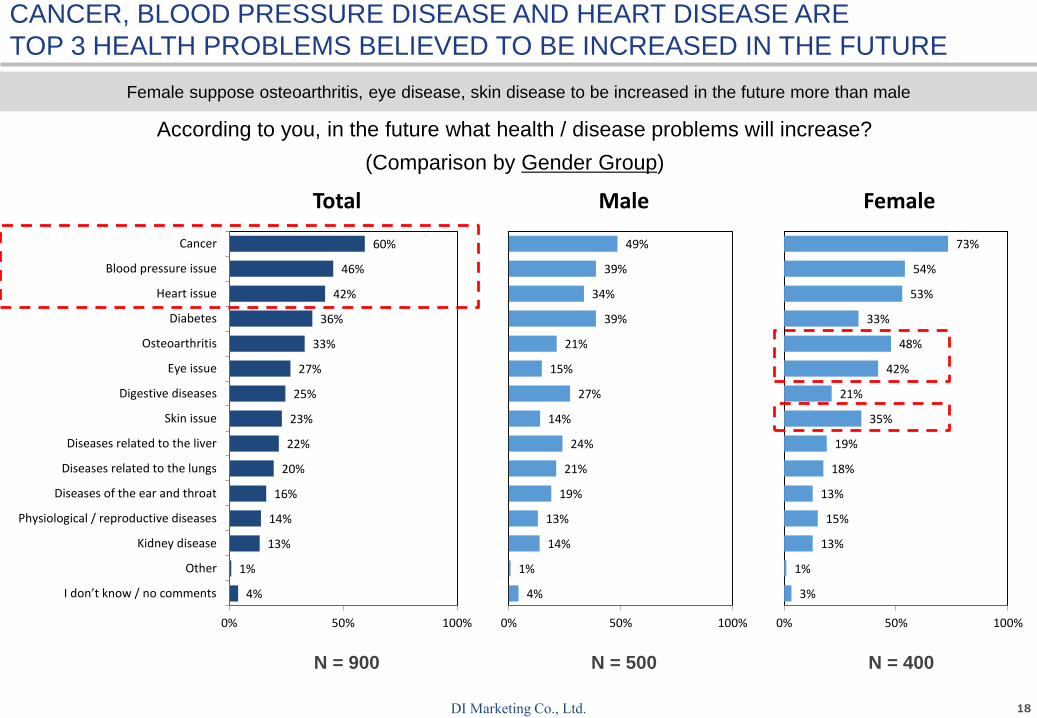
According to you, in the future what health / disease problems will increase?
(Comparison by Gender Group)
N = 900 N = 500 N = 400
4%
1%
13%
14%
16%
20%
22%
23%
25%
27%
33%
36%
42%
46%
60%
0% 50% 100%
I don’t know / no comments
Other
Kidney disease
Physiological / reproductive diseases
Diseases of the ear and throat
Diseases related to the lungs
Diseases related to the liver
Skin issue
Digestive diseases
Eye issue
Osteoarthritis
Diabetes
Heart issue
Blood pressure issue
Cancer
Total
4%
1%
14%
13%
19%
21%
24%
14%
27%
15%
21%
39%
34%
39%
49%
0% 50% 100%
Male
3%
1%
13%
15%
13%
18%
19%
35%
21%
42%
48%
33%
53%
54%
73%
0% 50% 100%
Female
CANCER, BLOOD PRESSURE DISEASE AND HEART DISEASE ARE
TOP 3 HEALTH PROBLEMS BELIEVED TO BE INCREASED IN THE FUTURE
Female suppose osteoarthritis, eye disease, skin disease to be increased in the future more than male
19DI Marketing Co., Ltd.
1) How to be healthy
2) Health check habit
3) Doing exercise habit
4) Eating habit
5) The usage of organic food
6) The usage of functional food
CONTENT
20DI Marketing Co., Ltd.
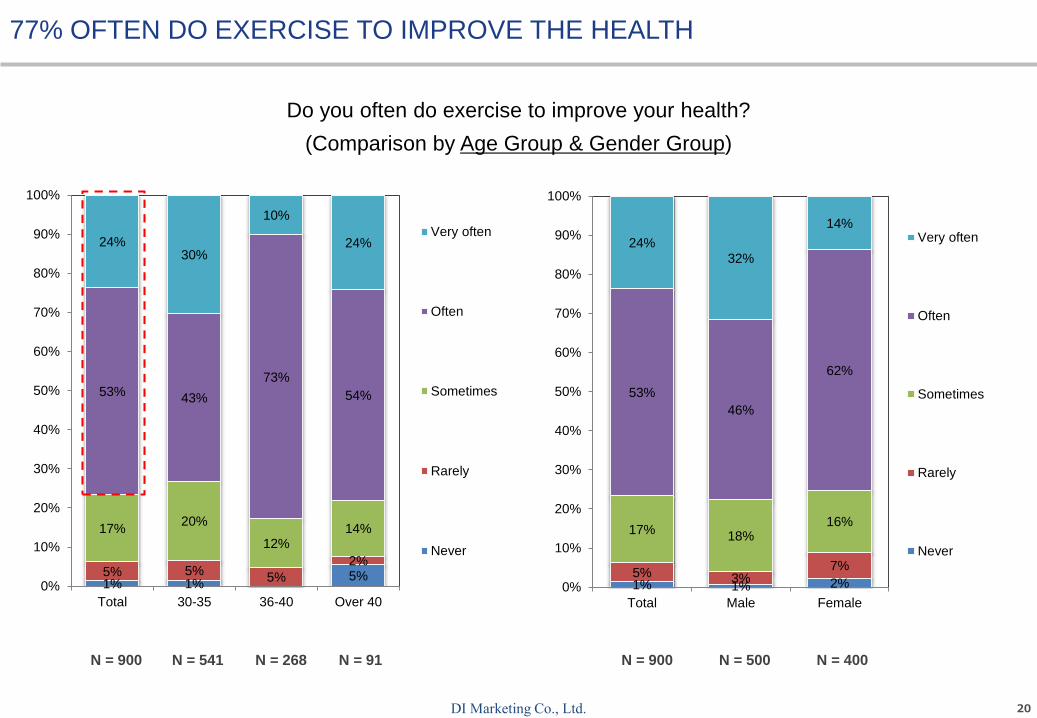
1% 1% 2%5% 3%
7%
17%18%
16%
53%
46%
62%
24%32%
14%
0%
10%
20%
30%
40%
50%
60%
70%
80%
90%
100%
Total Male Female
Very often
Often
Sometimes
Rarely
Never
1% 1%5%5% 5%
5%
2%
17%20%
12%14%
53%43%
73%
54%
24%30%
10%
24%
0%
10%
20%
30%
40%
50%
60%
70%
80%
90%
100%
Total 30-35 36-40 Over 40
Very often
Often
Sometimes
Rarely
Never
77% OFTEN DO EXERCISE TO IMPROVE THE HEALTH
Do you often do exercise to improve your health?
(Comparison by Age Group & Gender Group)
N = 900 N = 541 N = 268 N = 91 N = 900 N = 500 N = 400
21DI Marketing Co., Ltd.
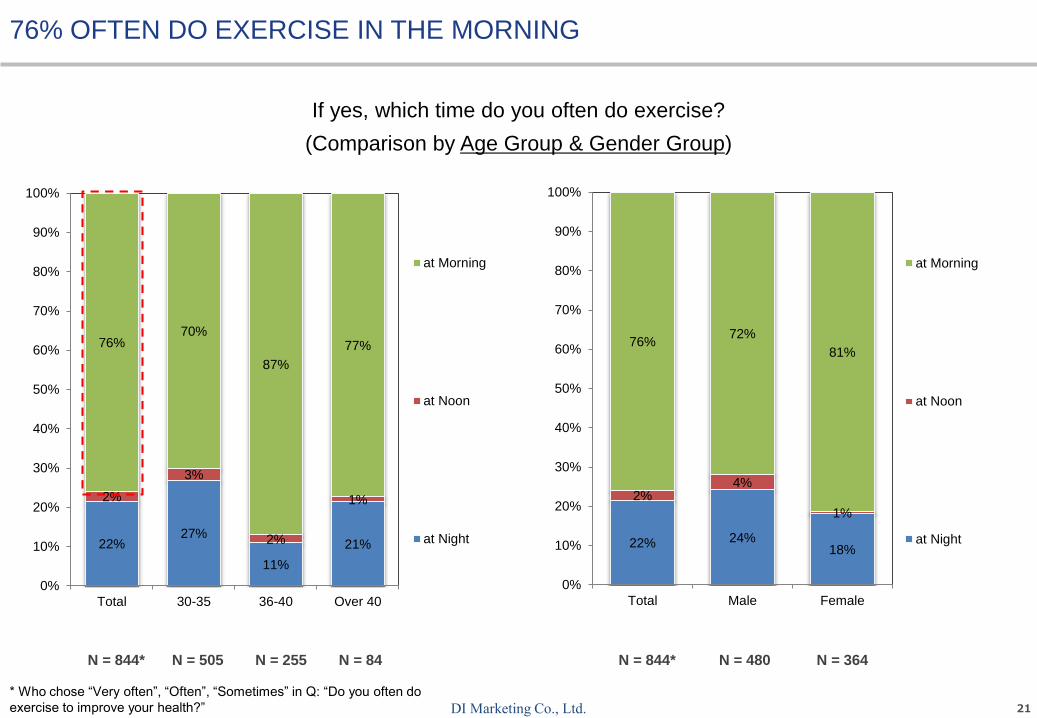
22% 24%18%
2%4%
1%
76%72%
81%
0%
10%
20%
30%
40%
50%
60%
70%
80%
90%
100%
Total Male Female
at Morning
at Noon
at Night22%27%
11%
21%
2%
3%
2%
1%
76%70%
87%
77%
0%
10%
20%
30%
40%
50%
60%
70%
80%
90%
100%
Total 30-35 36-40 Over 40
at Morning
at Noon
at Night
76% OFTEN DO EXERCISE IN THE MORNING
If yes, which time do you often do exercise?
(Comparison by Age Group & Gender Group)
N = 844* N = 505 N = 255 N = 84 N = 844* N = 480 N = 364
* Who chose “Very often”, “Often”, “Sometimes” in Q: “Do you often do
exercise to improve your health?”
22DI Marketing Co., Ltd.
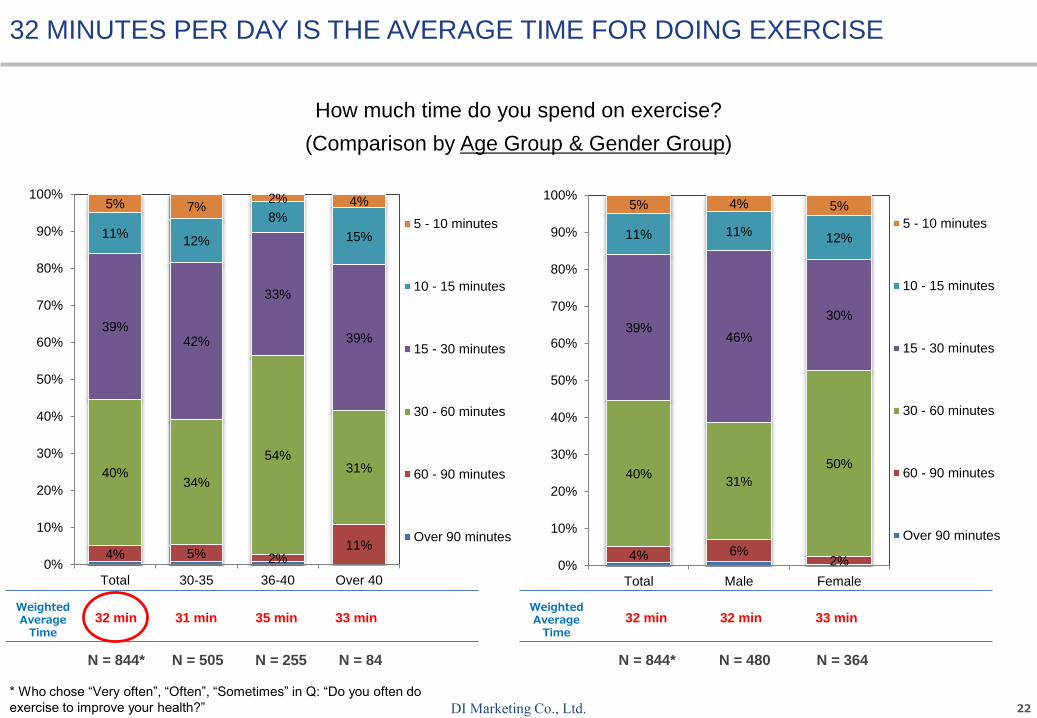
4% 5% 2%11%
40%34%
54%31%
39%42%
33%
39%
11%12%
8%
15%
5% 7%2% 4%
0%
10%
20%
30%
40%
50%
60%
70%
80%
90%
100%
Total 30-35 36-40 Over 40
5 - 10 minutes
10 - 15 minutes
15 - 30 minutes
30 - 60 minutes
60 - 90 minutes
Over 90 minutes
4% 6%2%
40%31%
50%
39%46%
30%
11% 11%12%
5% 4% 5%
0%
10%
20%
30%
40%
50%
60%
70%
80%
90%
100%
Total Male Female
5 - 10 minutes
10 - 15 minutes
15 - 30 minutes
30 - 60 minutes
60 - 90 minutes
Over 90 minutes
32 MINUTES PER DAY IS THE AVERAGE TIME FOR DOING EXERCISE
How much time do you spend on exercise?
(Comparison by Age Group & Gender Group)
N = 844* N = 505 N = 255 N = 84 N = 844* N = 480 N = 364
WeightedAverageTime
WeightedAverageTime
32 min 31 min 35 min 33 min 32 min 32 min 33 min
* Who chose “Very often”, “Often”, “Sometimes” in Q: “Do you often do
exercise to improve your health?”
23DI Marketing Co., Ltd.
1% 2% 1% 1%
16% 17% 16%
7%
18%
24%
9%
8%
22%
24%
10%
48%
42%
33%
64%
36%
0%
10%
20%
30%
40%
50%
60%
70%
80%
90%
100%
Total 30-35 36-40 Over 40
At home
At Park
Fitness / gymcenters
Sports club in thedistrict
Other1% 2% 1%
16%
24%
5%
18%
22%
12%
22%
24%
20%
42%
28%
62%
0%
10%
20%
30%
40%
50%
60%
70%
80%
90%
100%
Total Male Female
At home
At Park
Fitness / gymcenters
Sports club inthe district
Other
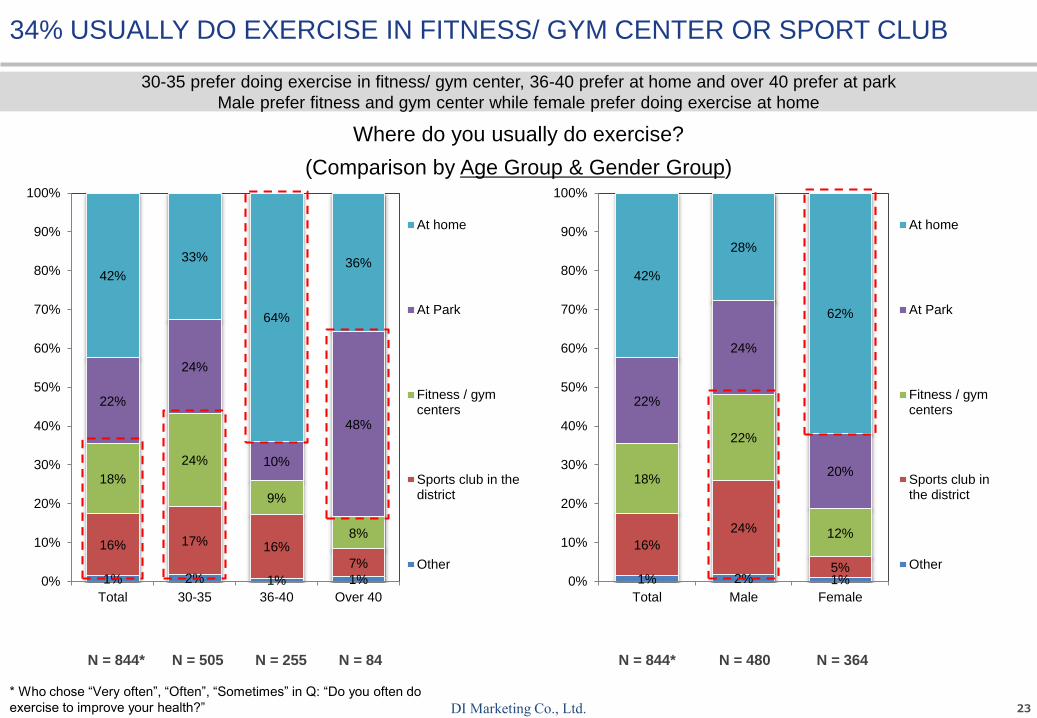
34% USUALLY DO EXERCISE IN FITNESS/ GYM CENTER OR SPORT CLUB
Where do you usually do exercise?
(Comparison by Age Group & Gender Group)
N = 844* N = 505 N = 255 N = 84 N = 844* N = 480 N = 364
* Who chose “Very often”, “Often”, “Sometimes” in Q: “Do you often do
exercise to improve your health?”
30-35 prefer doing exercise in fitness/ gym center, 36-40 prefer at home and over 40 prefer at park
Male prefer fitness and gym center while female prefer doing exercise at home
24DI Marketing Co., Ltd.
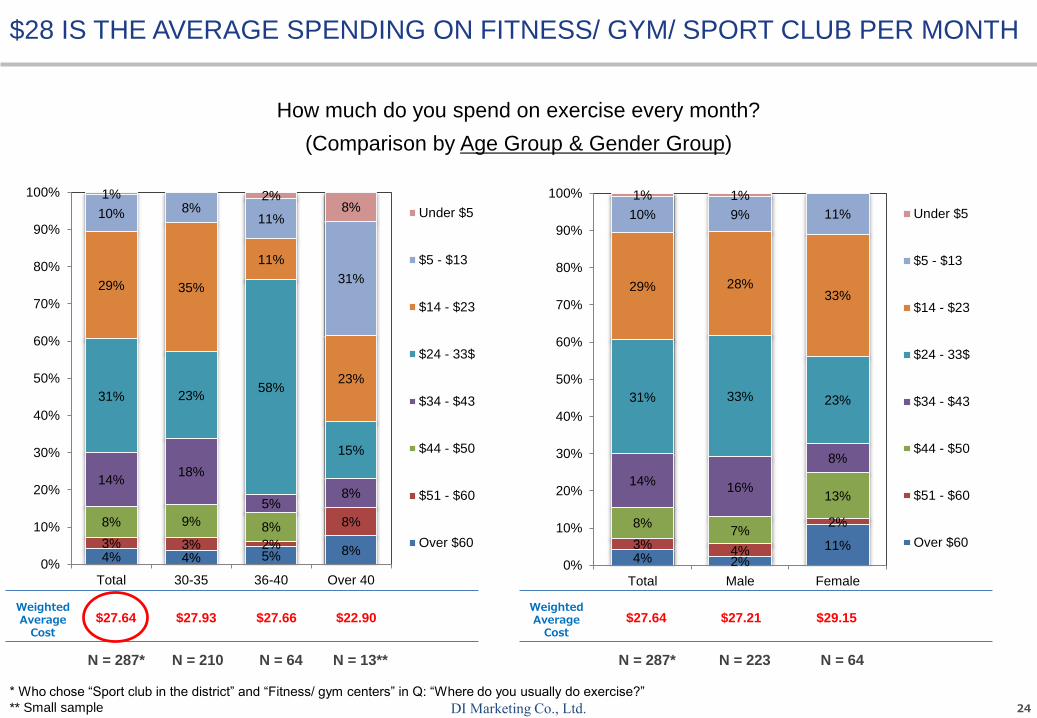
$28 IS THE AVERAGE SPENDING ON FITNESS/ GYM/ SPORT CLUB PER MONTH
How much do you spend on exercise every month?
(Comparison by Age Group & Gender Group)
N = 287* N = 210 N = 64 N = 13** N = 287* N = 223 N = 64
* Who chose “Sport club in the district” and “Fitness/ gym centers” in Q: “Where do you usually do exercise?”
** Small sample
WeightedAverageCost
WeightedAverageCost
$27.64 $27.93 $27.66 $22.90 $27.64 $27.21 $29.15
4% 4% 5% 8%3% 3% 2%
8%8% 9% 8%
14%18%
5%8%
31% 23%58%
15%
29% 35%
11%
23%
10% 8%11%
31%
1% 2%8%
0%
10%
20%
30%
40%
50%
60%
70%
80%
90%
100%
Total 30-35 36-40 Over 40
Under $5
$5 - $13
$14 - $23
$24 - 33$
$34 - $43
$44 - $50
$51 - $60
Over $604% 2%
11%3%4%
2%8%7%
13%14%
16%
8%
31% 33% 23%
29% 28%33%
10% 9% 11%
1% 1%
0%
10%
20%
30%
40%
50%
60%
70%
80%
90%
100%
Total Male Female
Under $5
$5 - $13
$14 - $23
$24 - 33$
$34 - $43
$44 - $50
$51 - $60
Over $60
25DI Marketing Co., Ltd.
2% 3% 2%3% 2% 4%3% 3%
4%
9% 13%3%
20%6%
37%
25%
31%
16%
38%42%
34%
0%
10%
20%
30%
40%
50%
60%
70%
80%
90%
100%
Total Male Female
I practicealone
Friends
Brothers /sisters
Colleague
Lover
Parents
Other2% 3% 2%3% 4% 2%
2%
3% 4%3%
1%
9%13%
2%4%
20% 7%
48%
10%
25%31%
10%
32%
38% 39%33%
51%
0%
10%
20%
30%
40%
50%
60%
70%
80%
90%
100%
Total 30-35 36-40 Over 40
I practicealone
Friends
Brothers /sisters
Colleague
Lover
Parents
Other
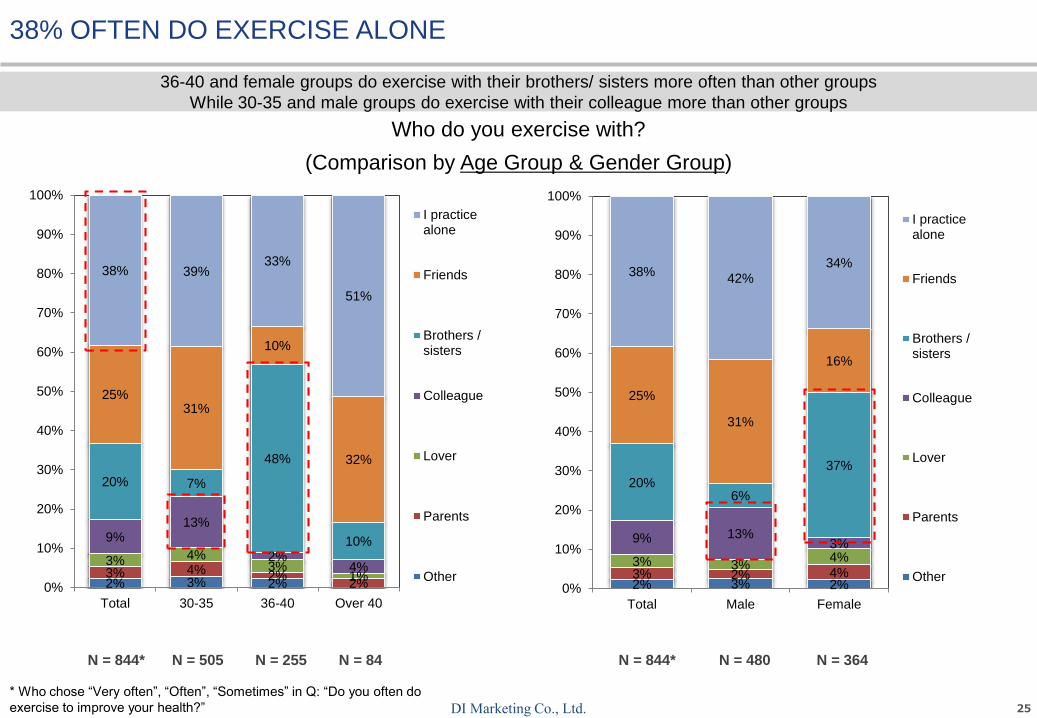
38% OFTEN DO EXERCISE ALONE
Who do you exercise with?
(Comparison by Age Group & Gender Group)
N = 844* N = 505 N = 255 N = 84 N = 844* N = 480 N = 364
36-40 and female groups do exercise with their brothers/ sisters more often than other groups
While 30-35 and male groups do exercise with their colleague more than other groups
* Who chose “Very often”, “Often”, “Sometimes” in Q: “Do you often do
exercise to improve your health?”
26DI Marketing Co., Ltd.
1) How to be healthy
2) Health check habit
3) Doing exercise habit
4) Eating habit
5) The usage of organic food
6) The usage of functional food
CONTENT
27DI Marketing Co., Ltd.
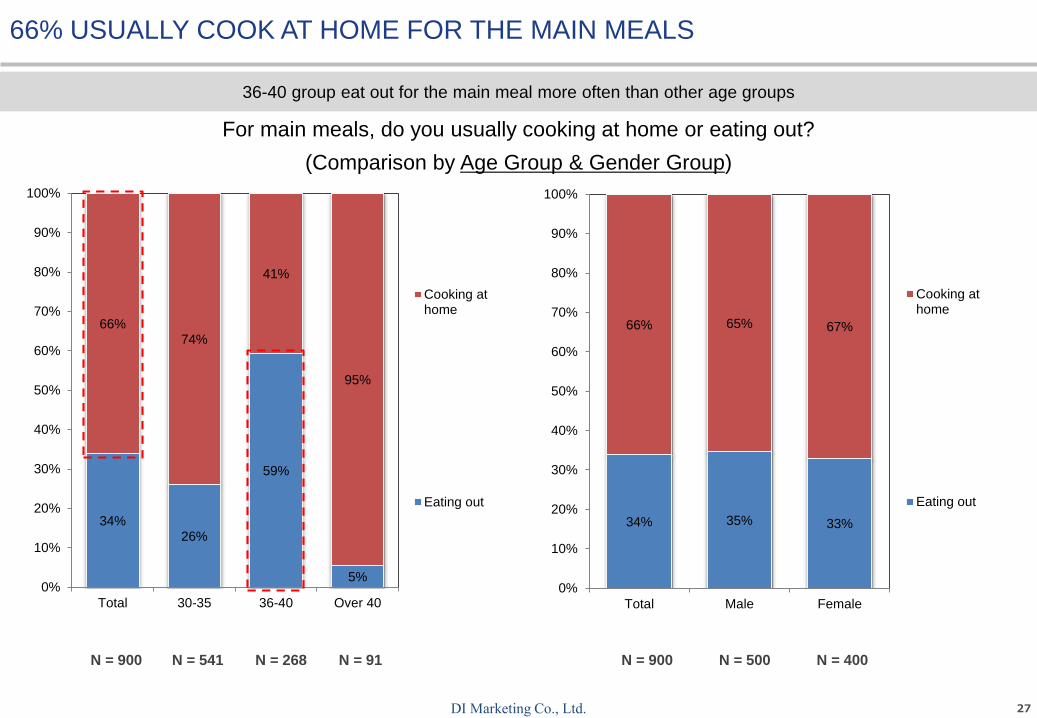
34%26%
59%
5%
66%74%
41%
95%
0%
10%
20%
30%
40%
50%
60%
70%
80%
90%
100%
Total 30-35 36-40 Over 40
Cooking athome
Eating out
34% 35% 33%
66% 65% 67%
0%
10%
20%
30%
40%
50%
60%
70%
80%
90%
100%
Total Male Female
Cooking athome
Eating out
66% USUALLY COOK AT HOME FOR THE MAIN MEALS
For main meals, do you usually cooking at home or eating out?
(Comparison by Age Group & Gender Group)
N = 900 N = 541 N = 268 N = 91 N = 900 N = 500 N = 400
36-40 group eat out for the main meal more often than other age groups
28DI Marketing Co., Ltd.
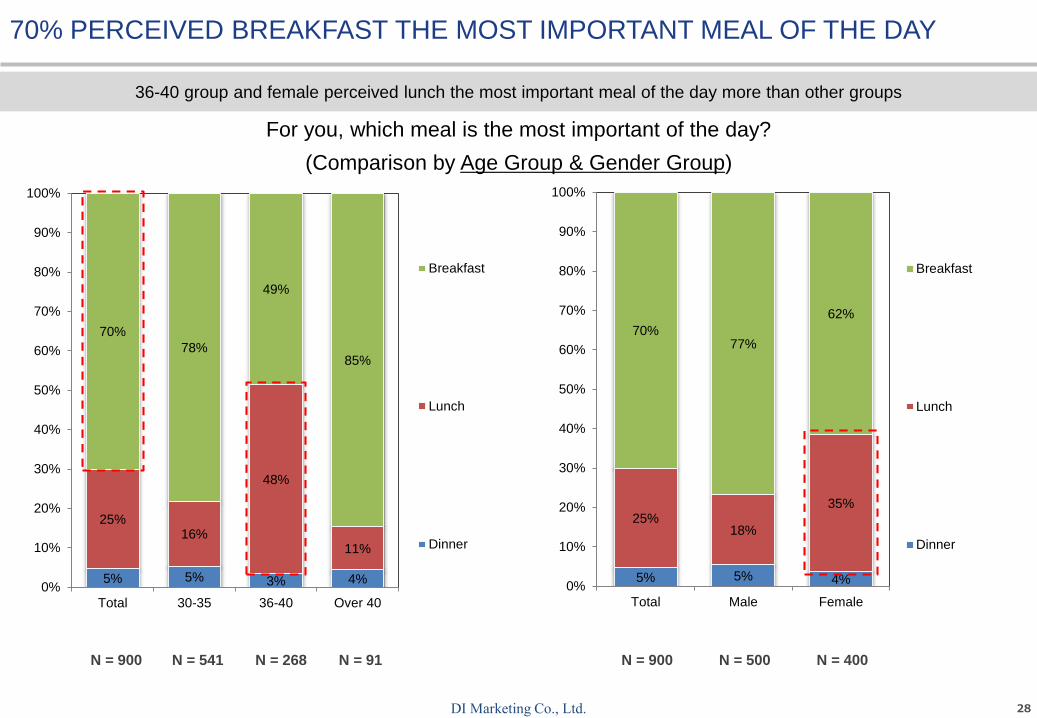
5% 5% 3% 4%
25%16%
48%
11%
70%
78%
49%
85%
0%
10%
20%
30%
40%
50%
60%
70%
80%
90%
100%
Total 30-35 36-40 Over 40
Breakfast
Lunch
Dinner
5% 5% 4%
25%18%
35%
70%77%
62%
0%
10%
20%
30%
40%
50%
60%
70%
80%
90%
100%
Total Male Female
Breakfast
Lunch
Dinner
70% PERCEIVED BREAKFAST THE MOST IMPORTANT MEAL OF THE DAY
For you, which meal is the most important of the day?
(Comparison by Age Group & Gender Group)
N = 900 N = 541 N = 268 N = 91 N = 900 N = 500 N = 400
36-40 group and female perceived lunch the most important meal of the day more than other groups
29DI Marketing Co., Ltd.
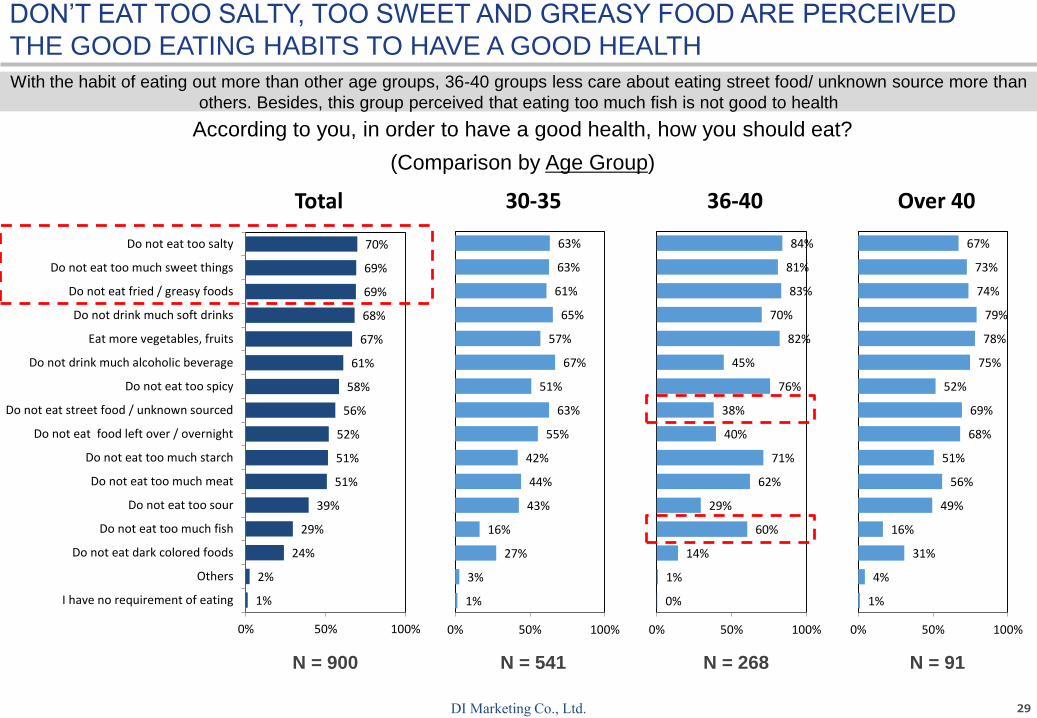
DON’T EAT TOO SALTY, TOO SWEET AND GREASY FOOD ARE PERCEIVED
THE GOOD EATING HABITS TO HAVE A GOOD HEALTH
According to you, in order to have a good health, how you should eat?
(Comparison by Age Group)
N = 900 N = 541 N = 268 N = 91
1%
2%
24%
29%
39%
51%
51%
52%
56%
58%
61%
67%
68%
69%
69%
70%
0% 50% 100%
I have no requirement of eating
Others
Do not eat dark colored foods
Do not eat too much fish
Do not eat too sour
Do not eat too much meat
Do not eat too much starch
Do not eat food left over / overnight
Do not eat street food / unknown sourced
Do not eat too spicy
Do not drink much alcoholic beverage
Eat more vegetables, fruits
Do not drink much soft drinks
Do not eat fried / greasy foods
Do not eat too much sweet things
Do not eat too salty
Total
1%
3%
27%
16%
43%
44%
42%
55%
63%
51%
67%
57%
65%
61%
63%
63%
0% 50% 100%
30-35
0%
1%
14%
60%
29%
62%
71%
40%
38%
76%
45%
82%
70%
83%
81%
84%
0% 50% 100%
36-40
1%
4%
31%
16%
49%
56%
51%
68%
69%
52%
75%
78%
79%
74%
73%
67%
0% 50% 100%
Over 40
With the habit of eating out more than other age groups, 36-40 groups less care about eating street food/ unknown source more than
others. Besides, this group perceived that eating too much fish is not good to health
30DI Marketing Co., Ltd.
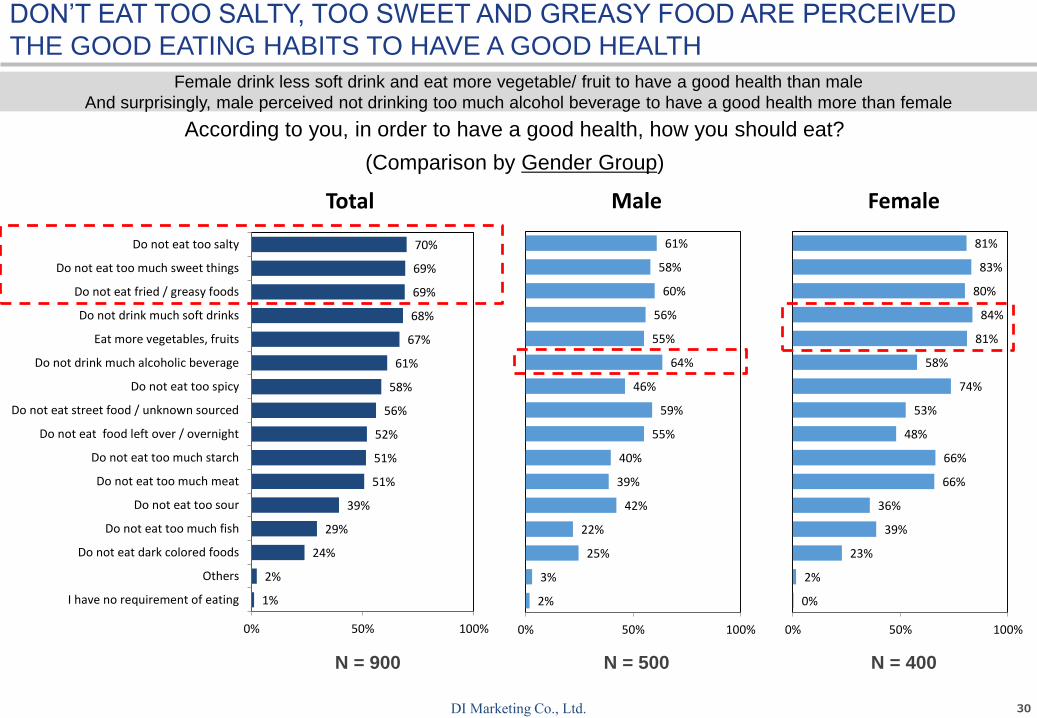
According to you, in order to have a good health, how you should eat?
(Comparison by Gender Group)
N = 900 N = 500 N = 400
1%
2%
24%
29%
39%
51%
51%
52%
56%
58%
61%
67%
68%
69%
69%
70%
0% 50% 100%
I have no requirement of eating
Others
Do not eat dark colored foods
Do not eat too much fish
Do not eat too sour
Do not eat too much meat
Do not eat too much starch
Do not eat food left over / overnight
Do not eat street food / unknown sourced
Do not eat too spicy
Do not drink much alcoholic beverage
Eat more vegetables, fruits
Do not drink much soft drinks
Do not eat fried / greasy foods
Do not eat too much sweet things
Do not eat too salty
Total
2%
3%
25%
22%
42%
39%
40%
55%
59%
46%
64%
55%
56%
60%
58%
61%
0% 50% 100%
Male
0%
2%
23%
39%
36%
66%
66%
48%
53%
74%
58%
81%
84%
80%
83%
81%
0% 50% 100%
Female
Female drink less soft drink and eat more vegetable/ fruit to have a good health than male
And surprisingly, male perceived not drinking too much alcohol beverage to have a good health more than female
DON’T EAT TOO SALTY, TOO SWEET AND GREASY FOOD ARE PERCEIVED
THE GOOD EATING HABITS TO HAVE A GOOD HEALTH
31DI Marketing Co., Ltd.
1) How to be healthy
2) Health check habit
3) Doing exercise habit
4) Eating habit
5) The usage of organic food
6) The usage of functional food
CONTENT
32DI Marketing Co., Ltd.
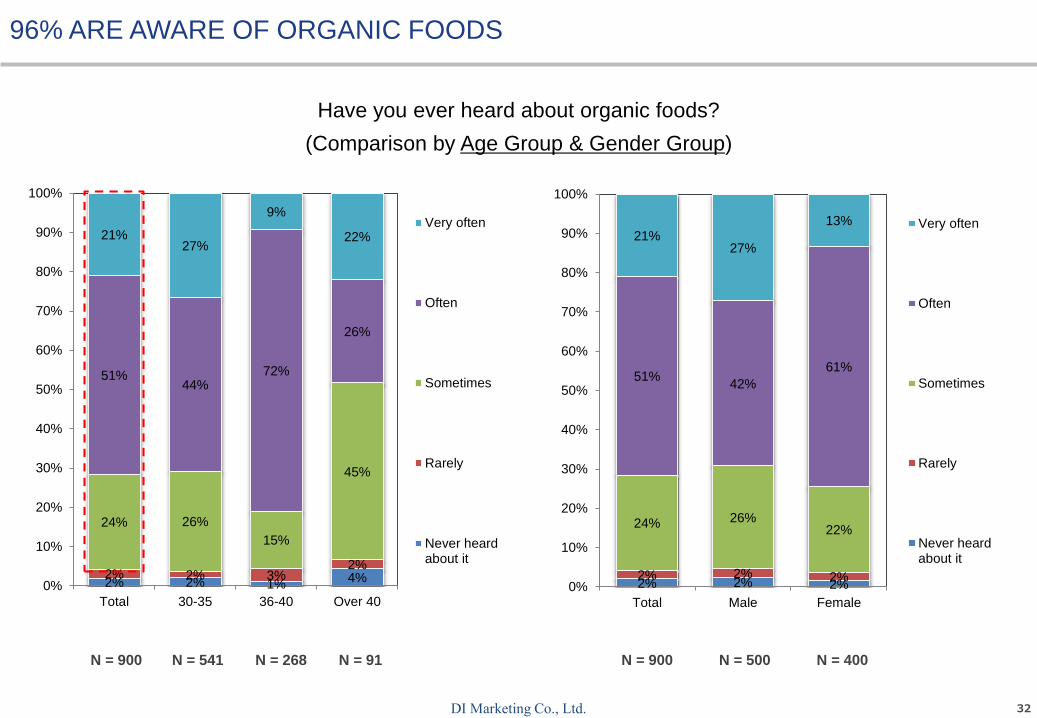
2% 2% 1%4%2% 2% 3%2%
24% 26%
15%
45%
51%44%
72%
26%
21%27%
9%
22%
0%
10%
20%
30%
40%
50%
60%
70%
80%
90%
100%
Total 30-35 36-40 Over 40
Very often
Often
Sometimes
Rarely
Never heardabout it
2% 2% 2%2% 2% 2%
24% 26%22%
51%42%
61%
21%27%
13%
0%
10%
20%
30%
40%
50%
60%
70%
80%
90%
100%
Total Male Female
Very often
Often
Sometimes
Rarely
Never heardabout it
96% ARE AWARE OF ORGANIC FOODS
Have you ever heard about organic foods?
(Comparison by Age Group & Gender Group)
N = 900 N = 541 N = 268 N = 91 N = 900 N = 500 N = 400
33DI Marketing Co., Ltd.
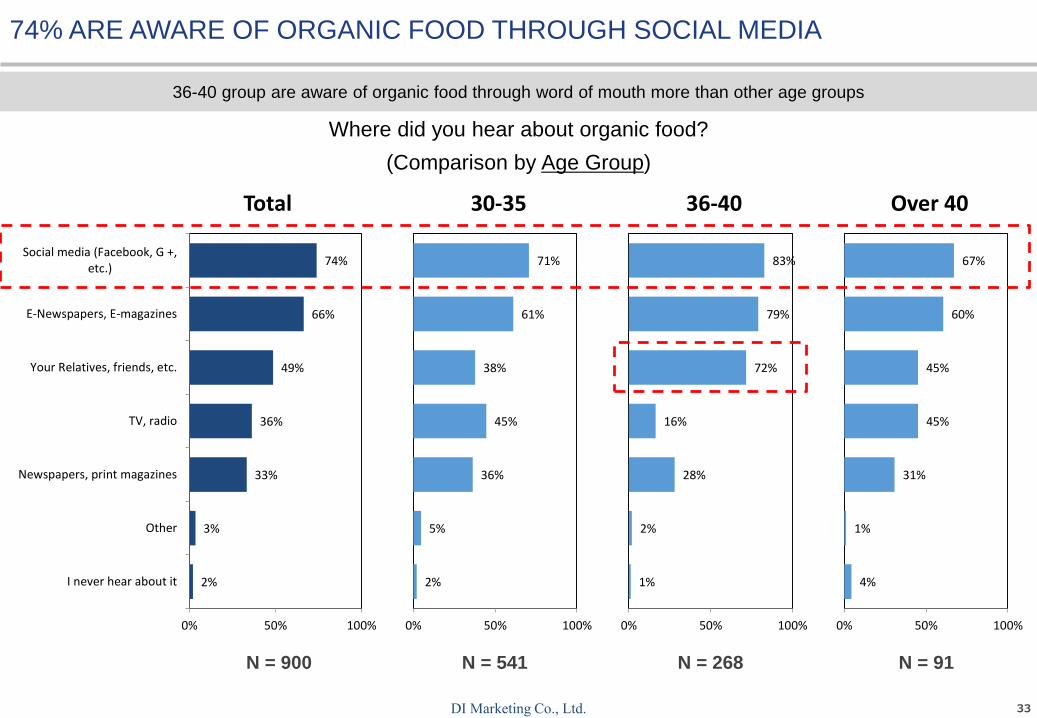
2%
3%
33%
36%
49%
66%
74%
0% 50% 100%
I never hear about it
Other
Newspapers, print magazines
TV, radio
Your Relatives, friends, etc.
E-Newspapers, E-magazines
Social media (Facebook, G +,etc.)
Total
2%
5%
36%
45%
38%
61%
71%
0% 50% 100%
30-35
1%
2%
28%
16%
72%
79%
83%
0% 50% 100%
36-40
4%
1%
31%
45%
45%
60%
67%
0% 50% 100%
Over 40
Where did you hear about organic food?
(Comparison by Age Group)
N = 900 N = 541 N = 268 N = 91
74% ARE AWARE OF ORGANIC FOOD THROUGH SOCIAL MEDIA
36-40 group are aware of organic food through word of mouth more than other age groups
34DI Marketing Co., Ltd.
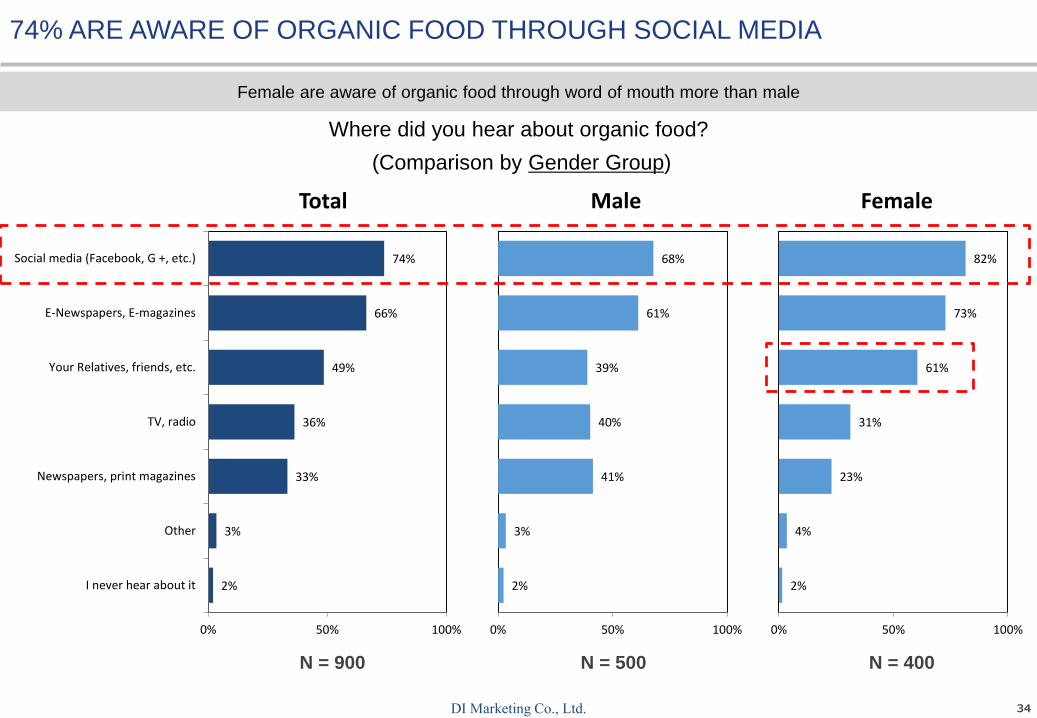
2%
3%
33%
36%
49%
66%
74%
0% 50% 100%
I never hear about it
Other
Newspapers, print magazines
TV, radio
Your Relatives, friends, etc.
E-Newspapers, E-magazines
Social media (Facebook, G +, etc.)
Total
2%
3%
41%
40%
39%
61%
68%
0% 50% 100%
Male
2%
4%
23%
31%
61%
73%
82%
0% 50% 100%
Female
Where did you hear about organic food?
(Comparison by Gender Group)
N = 900 N = 500 N = 400
Female are aware of organic food through word of mouth more than male
74% ARE AWARE OF ORGANIC FOOD THROUGH SOCIAL MEDIA
35DI Marketing Co., Ltd.
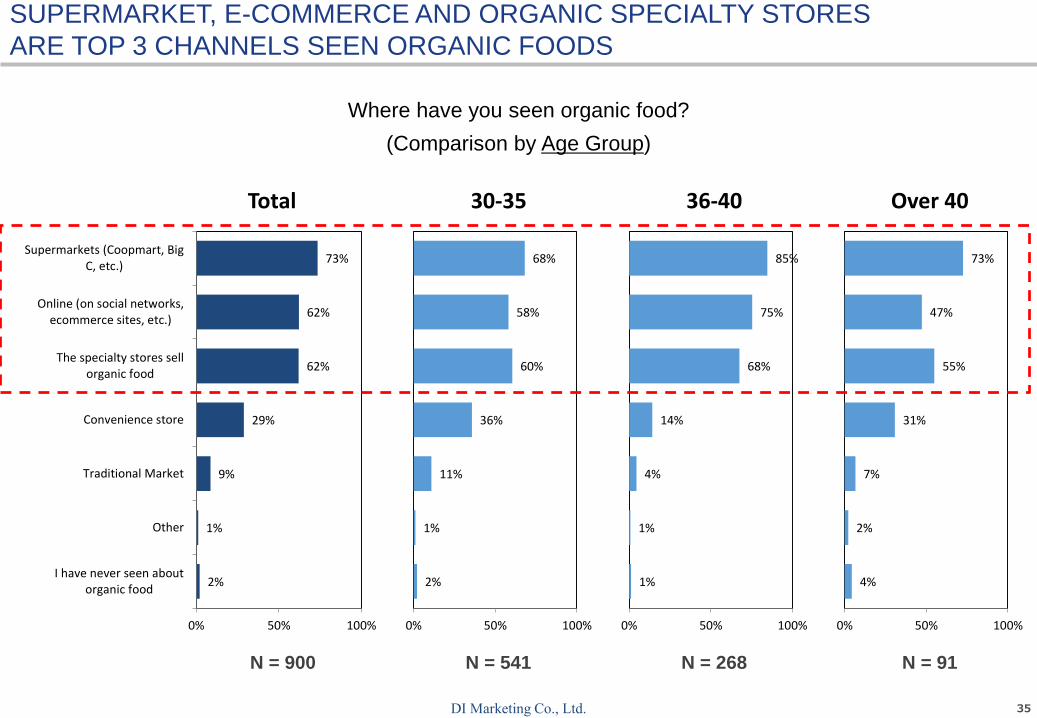
2%
1%
9%
29%
62%
62%
73%
0% 50% 100%
I have never seen aboutorganic food
Other
Traditional Market
Convenience store
The specialty stores sellorganic food
Online (on social networks,ecommerce sites, etc.)
Supermarkets (Coopmart, BigC, etc.)
Total
2%
1%
11%
36%
60%
58%
68%
0% 50% 100%
30-35
1%
1%
4%
14%
68%
75%
85%
0% 50% 100%
36-40
4%
2%
7%
31%
55%
47%
73%
0% 50% 100%
Over 40
SUPERMARKET, E-COMMERCE AND ORGANIC SPECIALTY STORES
ARE TOP 3 CHANNELS SEEN ORGANIC FOODS
Where have you seen organic food?
(Comparison by Age Group)
N = 900 N = 541 N = 268 N = 91
36DI Marketing Co., Ltd.
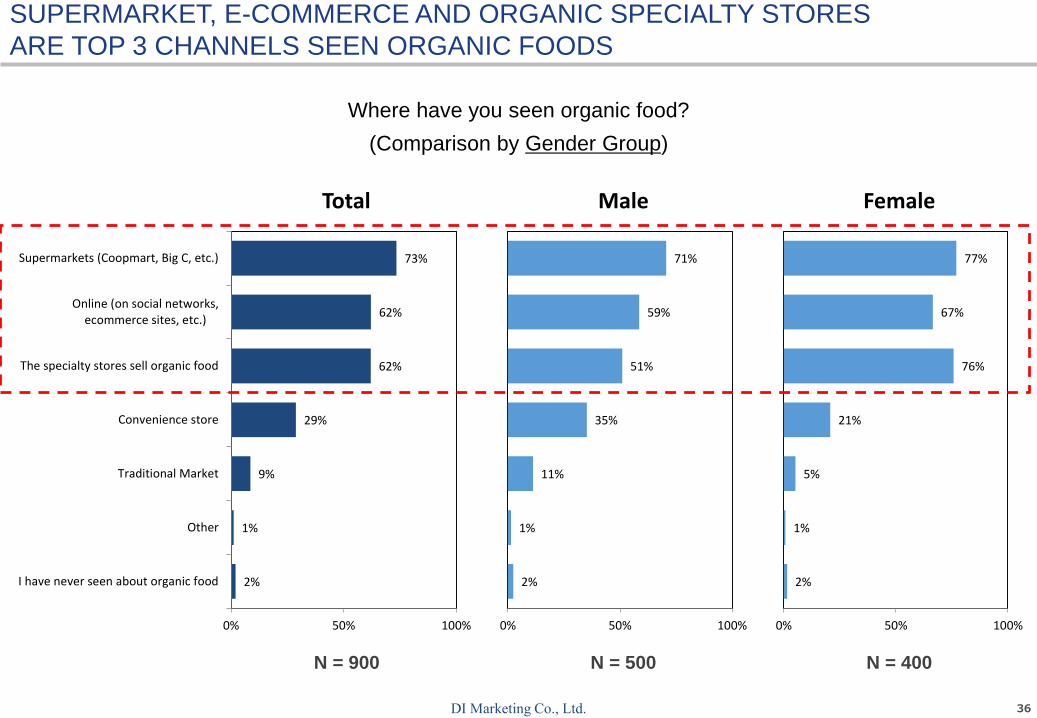
2%
1%
9%
29%
62%
62%
73%
0% 50% 100%
I have never seen about organic food
Other
Traditional Market
Convenience store
The specialty stores sell organic food
Online (on social networks,ecommerce sites, etc.)
Supermarkets (Coopmart, Big C, etc.)
Total
2%
1%
11%
35%
51%
59%
71%
0% 50% 100%
Male
2%
1%
5%
21%
76%
67%
77%
0% 50% 100%
Female
Where have you seen organic food?
(Comparison by Gender Group)
N = 900 N = 500 N = 400
SUPERMARKET, E-COMMERCE AND ORGANIC SPECIALTY STORES
ARE TOP 3 CHANNELS SEEN ORGANIC FOODS
37DI Marketing Co., Ltd.
21% 24%
13%
32%
79% 76%
87%
68%
0%
10%
20%
30%
40%
50%
60%
70%
80%
90%
100%
Total 30-35 36-40 Over 40
Yes No
21% 23%19%
79% 77%81%
0%
10%
20%
30%
40%
50%
60%
70%
80%
90%
100%
Total Male Female
Yes No
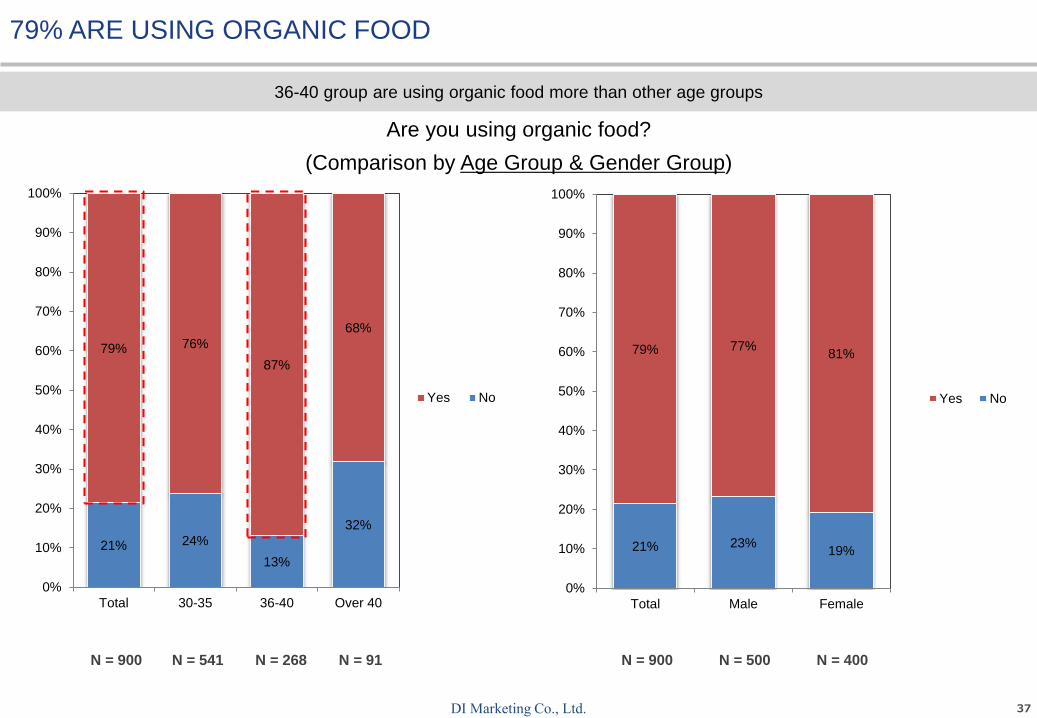
79% ARE USING ORGANIC FOOD
Are you using organic food?
(Comparison by Age Group & Gender Group)
N = 900 N = 541 N = 268 N = 91 N = 900 N = 500 N = 400
36-40 group are using organic food more than other age groups
38DI Marketing Co., Ltd.
2%
16%
23%
33%
39%
42%
42%
45%
52%
55%
67%
70%
71%
0% 50% 100%
Other
Because of good reviews from other users
More delicious
Recommended by a doctor / specialist
Contribute to protect the environment
Nutritional content is higher than others
Recommended by friends / relatives
Fear of cancer
No harmful chemicals / food coloring
Hygiene during production
Products are certified for clean / safe
Clear origin
Not contain pesticides, plant protection
Total
1%
17%
28%
33%
43%
47%
32%
28%
57%
62%
63%
60%
62%
0% 50% 100%
30-35
1%
18%
12%
31%
28%
31%
60%
74%
37%
37%
73%
86%
85%
0% 50% 100%
36-40
5%
3%
29%
45%
50%
44%
45%
44%
77%
71%
71%
73%
74%
0% 50% 100%
Over 40
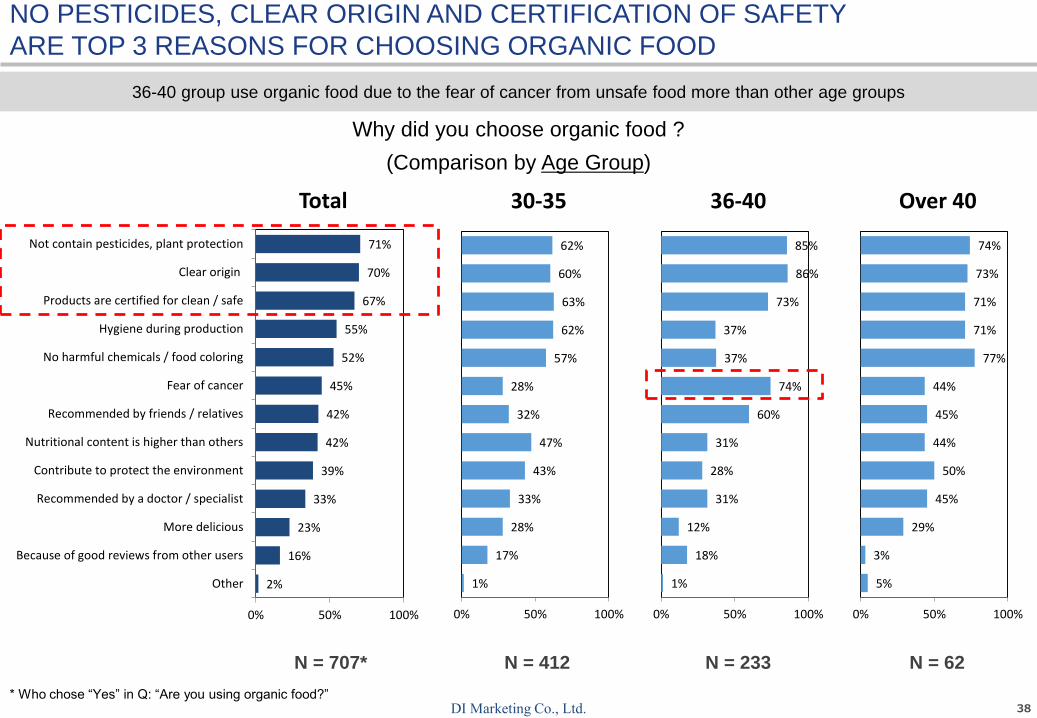
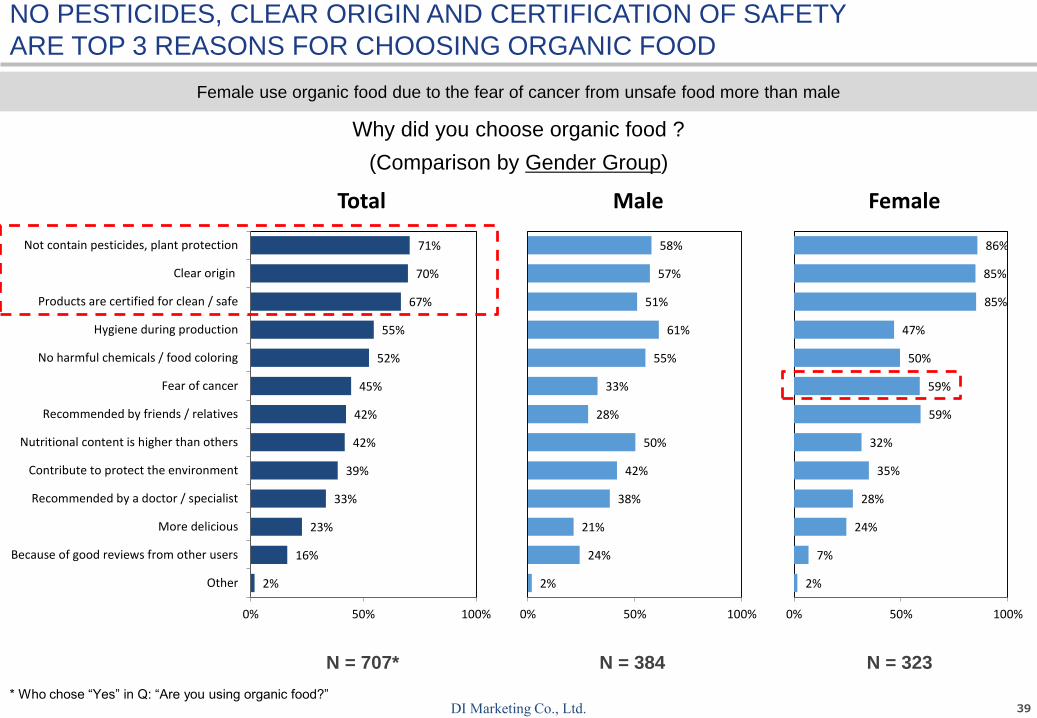
NO PESTICIDES, CLEAR ORIGIN AND CERTIFICATION OF SAFETY
ARE TOP 3 REASONS FOR CHOOSING ORGANIC FOOD
Why did you choose organic food ?
(Comparison by Age Group)
N = 707* N = 412 N = 233 N = 62
36-40 group use organic food due to the fear of cancer from unsafe food more than other age groups
* Who chose “Yes” in Q: “Are you using organic food?”
39DI Marketing Co., Ltd.
2%
16%
23%
33%
39%
42%
42%
45%
52%
55%
67%
70%
71%
0% 50% 100%
Other
Because of good reviews from other users
More delicious
Recommended by a doctor / specialist
Contribute to protect the environment
Nutritional content is higher than others
Recommended by friends / relatives
Fear of cancer
No harmful chemicals / food coloring
Hygiene during production
Products are certified for clean / safe
Clear origin
Not contain pesticides, plant protection
Total
2%
24%
21%
38%
42%
50%
28%
33%
55%
61%
51%
57%
58%
0% 50% 100%
Male
2%
7%
24%
28%
35%
32%
59%
59%
50%
47%
85%
85%
86%
0% 50% 100%
Female
Why did you choose organic food ?
(Comparison by Gender Group)
N = 707* N = 384 N = 323
Female use organic food due to the fear of cancer from unsafe food more than male
NO PESTICIDES, CLEAR ORIGIN AND CERTIFICATION OF SAFETY
ARE TOP 3 REASONS FOR CHOOSING ORGANIC FOOD
* Who chose “Yes” in Q: “Are you using organic food?”
40DI Marketing Co., Ltd.
9% 10%6% 10%
32%36%
18%
45%
58%52%
76%
45%
0%
10%
20%
30%
40%
50%
60%
70%
80%
90%
100%
Total 30-35 36-40 Over 40
Definitely use
Use
May or Maynot
Will not use
Definitely willnot use 9% 10%
7%
32%
37%
24%
58%50%
68%
0%
10%
20%
30%
40%
50%
60%
70%
80%
90%
100%
Total Male Female
Definitely use
Use
May or Maynot
Will not use
Definitely willnot use
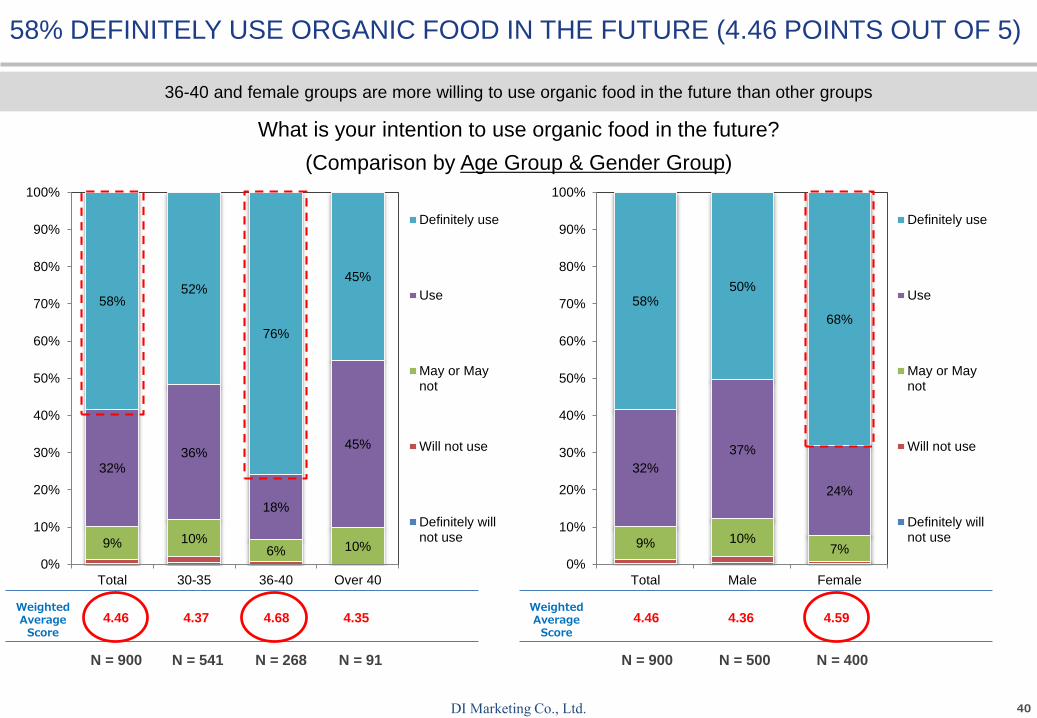
58% DEFINITELY USE ORGANIC FOOD IN THE FUTURE (4.46 POINTS OUT OF 5)
What is your intention to use organic food in the future?
(Comparison by Age Group & Gender Group)
N = 900 N = 541 N = 268 N = 91 N = 900 N = 500 N = 400
WeightedAverageScore
WeightedAverageScore
4.46 4.37 4.68 4.35 4.46 4.36 4.59
36-40 and female groups are more willing to use organic food in the future than other groups
41DI Marketing Co., Ltd.
1) How to be healthy
2) Health check habit
3) Doing exercise habit
4) Eating habit
5) The usage of organic food
6) The usage of functional food
CONTENT
42DI Marketing Co., Ltd.
29%33%
17%
40%
71%67%
83%
60%
0%
10%
20%
30%
40%
50%
60%
70%
80%
90%
100%
Total 30-35 36-40 Over 40
Yes No
29% 29% 29%
71% 71% 72%
0%
10%
20%
30%
40%
50%
60%
70%
80%
90%
100%
Total Male Female
Yes No
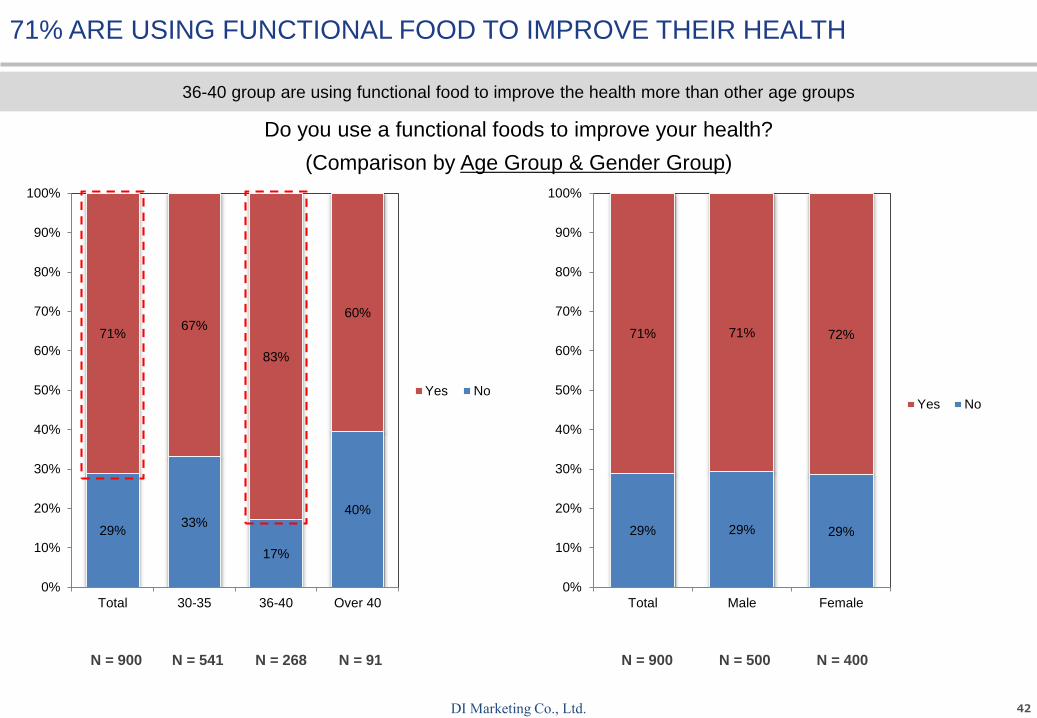
71% ARE USING FUNCTIONAL FOOD TO IMPROVE THEIR HEALTH
Do you use a functional foods to improve your health?
(Comparison by Age Group & Gender Group)
N = 900 N = 541 N = 268 N = 91 N = 900 N = 500 N = 400
36-40 group are using functional food to improve the health more than other age groups
43DI Marketing Co., Ltd.
1%
20%
31%
48%
0% 50% 100%
Other
Supplement for diseasetreatment
Supplement for preventdisease
Nutritional supplement
Total
1%
28%
15%
55%
0% 50% 100%
30-35
0%
5%
59%
35%
0% 50% 100%
36-40
2%
22%
20%
56%
0% 50% 100%
Over 40
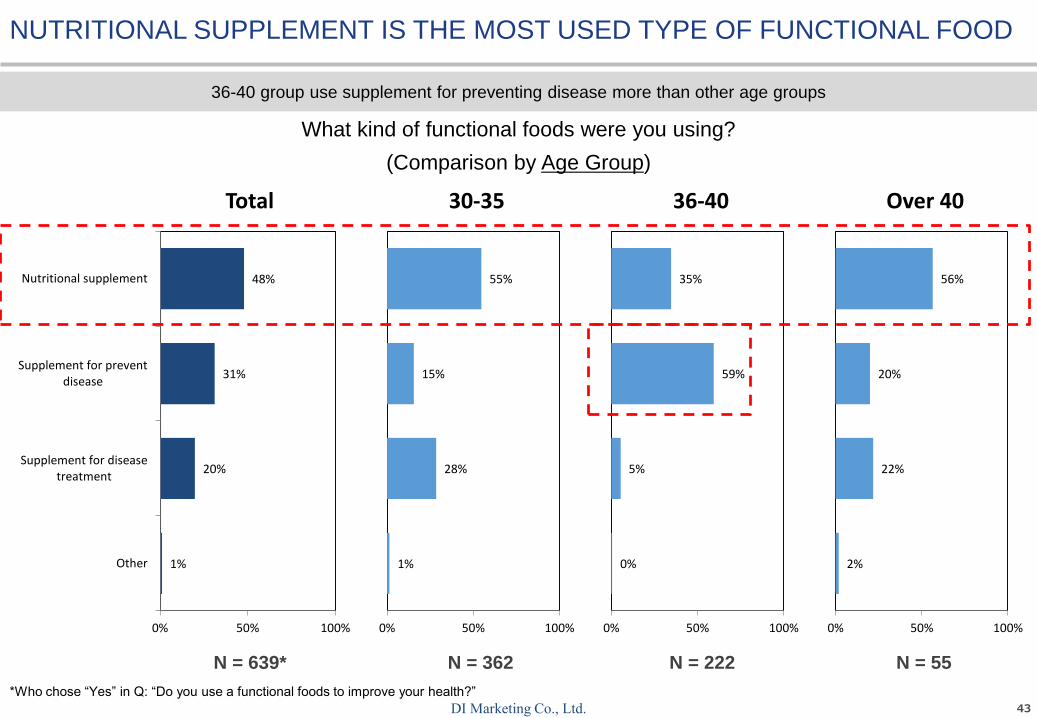
NUTRITIONAL SUPPLEMENT IS THE MOST USED TYPE OF FUNCTIONAL FOOD
What kind of functional foods were you using?
(Comparison by Age Group)
N = 639* N = 362 N = 222 N = 55
36-40 group use supplement for preventing disease more than other age groups
*Who chose “Yes” in Q: “Do you use a functional foods to improve your health?”
44DI Marketing Co., Ltd.
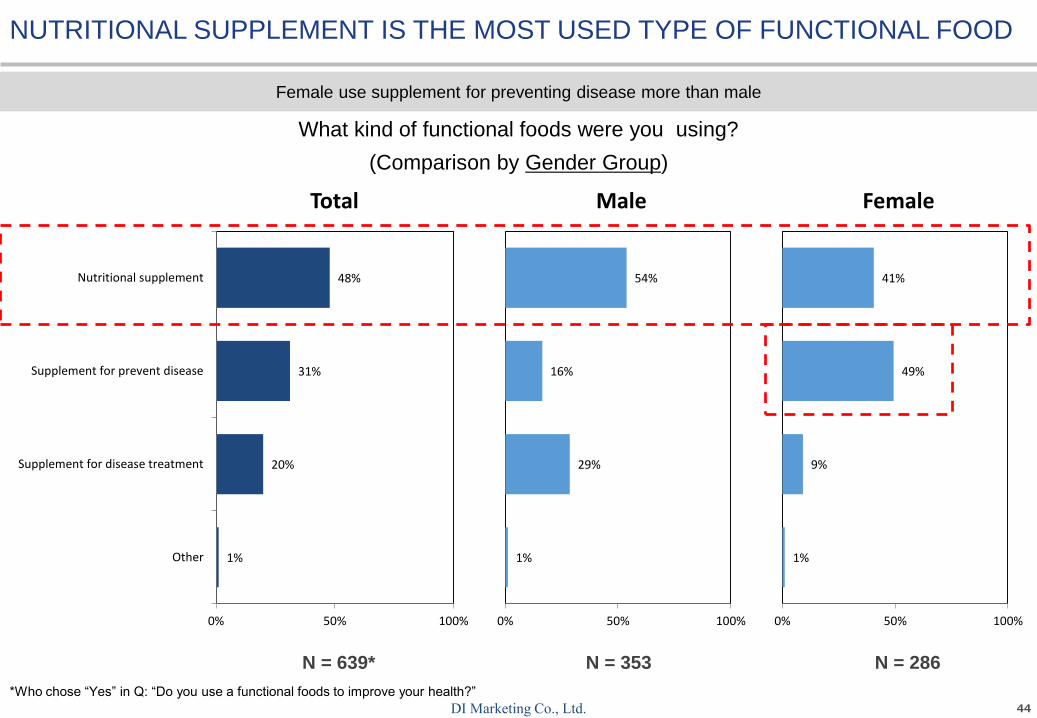
What kind of functional foods were you using?
(Comparison by Gender Group)
N = 639* N = 353 N = 286
1%
20%
31%
48%
0% 50% 100%
Other
Supplement for disease treatment
Supplement for prevent disease
Nutritional supplement
Total
1%
29%
16%
54%
0% 50% 100%
Male
1%
9%
49%
41%
0% 50% 100%
Female
NUTRITIONAL SUPPLEMENT IS THE MOST USED TYPE OF FUNCTIONAL FOOD
Female use supplement for preventing disease more than male
*Who chose “Yes” in Q: “Do you use a functional foods to improve your health?”
45DI Marketing Co., Ltd.
FEEL FREE TO DROP US ANY QUESTION
• Japan
o Address: 3 Chome-2-6 Kasumigaseki, Chiyoda, Tokyo 100-0013, Japan
o Contact person: Mr. Hideyuki Kato (CEO)
o Email: [email protected]
o Contact number: +81 3-5532-3200
• Vietnam
o Address: 9-15, Vincom center, 45A Ly Tu Trong, Ben Nghe ward, District 1,
Ho Chi Minh City, Vietnam
o Contact person: Mr. Ho Hai Dang (Country Manager)
o Email: [email protected]
o Contact number: +84 902-73-9944
• Thailand
o Address: 246 Time Square Bld., 10th Fl., Room 10/04, Sukhumvit 12-14 Rd. Klongtoey, Bangkok
10110, Thailand
o Contact person: Ms. Sariya Achawananthakul (Marketing & Operation Manager)
o Email: [email protected]
o Contact number: +66 876 724 832
• Indonesia
o Address: Jalan Prof Dr Satrio Kav 18, 45th floor AXA Tower, Jakarta 12940, Indonesia
o Contact person: Mr. Hendry Pratama (Country Manager)
o Email: [email protected]
o Contact number: +62 21 3005 3541

46
DI Marketing Co., Ltd.