Healthcare Imaging Informatics · Elevate the reading experience with embedded advanced...
38
3 Healthcare Imaging Informatics Product Portfolio www.vitalimages.com © 2017 Vital Images, Inc. | M-06320H Vitrea and all third party marks designated with an ® are registered in the US and may have protection in other countries. Marks not owned by Vital Images, Inc. are the property of their respective holders. Vital Images, Inc. | 5850 Opus Parkway, Suite 300 | Minnetonka, MN 55343 | USA | +1 866.433.4624 Vital Images Europe | Zilverstraat 1 | 2718 RP Zoetermeer | Netherlands | +31 79 206 5800 Vital Images, Inc., a Toshiba Medical Company, is a leading provider of healthcare imaging informatics solutions, including advanced visualization, enterprise image viewing solutions and business intelligence technology designed to help healthcare organizations deliver exceptional care while optimizing resources across multi-facility organizations. The company’s solutions are scalable to meet the unique needs of hospitals and imaging centers and are accessible throughout the enterprise anytime and anywhere.
-
Upload
truongdien -
Category
Documents
-
view
218 -
download
0
Transcript of Healthcare Imaging Informatics · Elevate the reading experience with embedded advanced...

2 3
Healthcare Imaging InformaticsProduct Portfolio
www.vitalimages.com
© 2017 Vital Images, Inc. | M-06320H
Vitrea and all third party marks designated with an ® are registered in the US and may have protection in other countries. Marks not owned by Vital Images, Inc. are the property of their respective holders.
Vital Images, Inc. | 5850 Opus Parkway, Suite 300 | Minnetonka, MN 55343 | USA | +1 866.433.4624 Vital Images Europe | Zilverstraat 1 | 2718 RP Zoetermeer | Netherlands | +31 79 206 5800
Vital Images, Inc., a Toshiba Medical Company, is a leading provider of healthcare imaging informatics solutions, including advanced visualization, enterprise image viewing solutions and business intelligence technology designed to help healthcare organizations deliver exceptional care while optimizing resources across multi-facility organizations. The company’s solutions are scalable to
meet the unique needs of hospitals and imaging centers and are accessible throughout the enterprise anytime and anywhere.

For more than 25 years, Vital has been a pioneer in imaging solutions. Our Vitrea family of software products help healthcare organizations deliver exceptional care, while optimizing resources across multi-facility organizations. Vitrea solutions orchestrate data, making it easily accessible throughout the enterprise and focus on providing context and clarity to the information presented at the point of care. Our solutions are scalable to meet the unique and
evolving needs of your organization.

6 7
At Vital, we:
Know that people and data are constantly in motion
Believe that data must be available for connection and interpretation
Orchestrate data in real time providing context and clarity to understand the ever-evolving patient story

8
Contents
8 Vitrea® 10 Bringing the Future Forward12 A Different Approach16 Vitrea Connection20 Vitrea Vision24 Vitrea View 27 - Benefits28 EasyVizTM
32 Vitrea Advanced Visualization34 - Benefits36 - Deployments 38 - Clinical Applications48 - Integrated Applications54 - Clinical Workflows56 - Olea Pulse®
58 Vitrea Intelligence60 - Practice Management64 - Opportunity Navigator68 Support70 Vital U® Education

1110
Vital is VitreaOur Vitrea solutions are founded in our steadfast belief
that the patient is first.
Vitrea Vision You see your patient.
We help you see inside the body.
Vitrea ConnectionYou connect with your patient.
We help you connect to and understand your data in a meaningful way.
Vitrea IntelligenceYou care for your patient.
We help you to better know your business to create efficiency, quantifiable value and improve the patient experience.
Vitrea®

12 13
Bringing the Future Forward
By the year 2025, organizations must have in place a Learning Health Systemas defined by the US Office of the National Coordinator.
A Learning Health System:nmakes the right data available to the right people at the right time in a way that can be relied
upon and meaningfully used by recipientsnallows individuals to securely share electronic health information with care providers
and make use of information to support their own health and wellness through informed, shared decision making.1
Our Vitrea solutions deliver this system today.
1 Adapted from Connecting Health and Care for the Nation A Shared Nationwide Interoperability Roadmap https://www.healthit.gov/sites/default/files/hie-interoperability/nationwide-interoperability-roadmap-final-version-1.0.pdf

14 15
A Different Approach Our customers are valued partners. We work side by side with you to clearly identify your needs and deliver progressive, tailored solutions built upon our modular image management, workflow, visualization and resource planning platform.
Vitrea | One Modular Solution
HIS/RIS EMR
PACS Multimedia
Access | Workflow | Archive
Vitrea Connection
Vitrea View
Vitrea Vision
EasyViz
Vitrea Advanced Visualization
ModalitiesModalities
Modalities
Modalities
Opportunity Navigator
Vitrea Intelligence
Practice Management
Vitrea Enterprise Imaging®
Vital is your strong choice as a technology partner for the future because we:nhave a patient-centric focusnhave decades of experience and knowledge in building solutions for healthcare imagingnlove to solve problems, allowing us to constantly enrich our solutionsnstrive for simplicity – we take complex matters and deliver simple solutions that worknare a Canon company with all the power and resources of a global company
We invite you to join us on our quest to revitalize patient care.

1716
Vitrea® Connection Our experience tells us that the patient story is never complete.Often unseen by the clinician, Vitrea Connection is the foundation upon which our visualization and resource planning solutions excel. It is the engine that constantly renews and refreshes all the relevant information from disparate sources in real-time and seamlessly delivers it to the applications at the point of care. You stay connected to the ever-changing patient story, able to make effective decisions and improve patient care because you have the longitudinal view of the patient record.

18 19
Vitrea Connection offers a flexible, service-oriented architecture:nSupport a variety of deployment scenarios targeting multi-facility, multi-PACS environments
at a departmental, enterprise, regional or national scalenDeliver patient-centric orchestration of mulitiple data types – DICOM and non-DICOM
– contained in other systems, allowing you to leverage your existing investments while immediately improving workflow and interoperability
nFacilitate a progressive migration and replacement strategy en route to a consolidated solution, avoiding costly data migrationsnProvide massive, horizontal scalability to quickly expand capacity without downtimenLeverage industry standards to maximize interoperabilitynSimplify business continuance and disaster recovery
Vitrea Connection®
EMR
HL7, MINT, WADO,DICOMweb
HL7 HL7 DICOM XDS, MHD, FHIR
HIS/EMPI RIS PACS ECM

2120
Vitrea® Vision Vitrea Vision is built on Vital’s 25-year legacy in advanced visualization technology. We are a pioneer in this field, proudly continuing to deliver innovative imaging analysis and viewing solutions. Through our years of experience, we have developed a modular viewing platform that can be configured to meet the unique viewing needs of all users, providing access to required images from across your enterprise anytime, anywhere.

22 23
Vitrea ViewInform clinicians with fast and secure access to diagnostic quality images and multi-media files.
EasyVizProvide your radiologists with a personalized, highly contextualized diagnostic viewing experience.
Vitrea Advanced VisualizationElevate the reading experience with embedded advanced visualization applications providing premier tools to aid in diagnosis.
The Vitrea Vision family of products is designed to streamline image viewing workflows, enhance collaboration, increase diagnostic accuracy and provide significant cost reduction.

2524
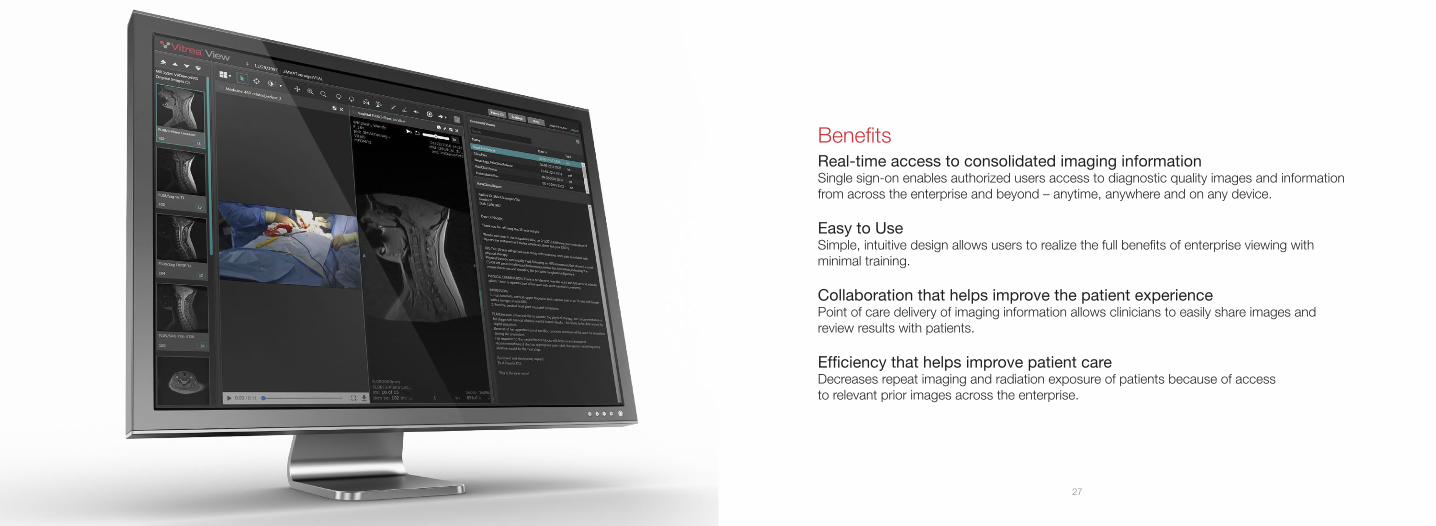
Vitrea View Your Zero Footprint Enterprise Viewing SolutionThe patient record is quickly becoming an array of multimedia images and related documents. This content is often stored in disparate systems and external media scattered across your enterprise, making it difficult for clinicians to stay informed on the current patient condition.
Vitrea View provides fast and secure access to patient imaging information – DICOM and non-DICOM – from across the enterprise and beyond. It integrates images effectively into the primary clinical workflows to improve care coordination by providing a single point of access from a browser on a desktop, laptop or mobile device. Vitrea View also image-enables your EMR, allowing image access directly from the patient record.
Vitrea View is not intended for diagnostic use when accessed from a mobile device.
26 27
Benefits Real-time access to consolidated imaging information Single sign-on enables authorized users access to diagnostic quality images and information from across the enterprise and beyond – anytime, anywhere and on any device.
Easy to UseSimple, intuitive design allows users to realize the full benefits of enterprise viewing with minimal training.
Collaboration that helps improve the patient experiencePoint of care delivery of imaging information allows clinicians to easily share images and review results with patients.
Efficiency that helps improve patient care Decreases repeat imaging and radiation exposure of patients because of access to relevant prior images across the enterprise.
2928
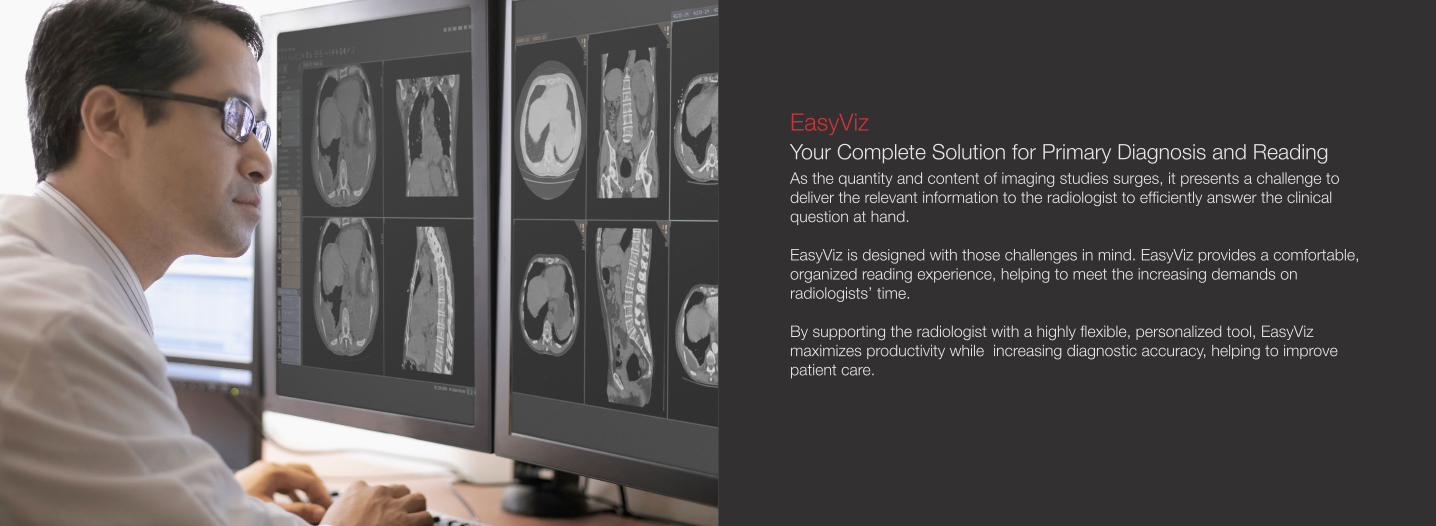
EasyVizYour Complete Solution for Primary Diagnosis and ReadingAs the quantity and content of imaging studies surges, it presents a challenge to deliver the relevant information to the radiologist to efficiently answer the clinical question at hand.
EasyViz is designed with those challenges in mind. EasyViz provides a comfortable, organized reading experience, helping to meet the increasing demands on radiologists’ time.
By supporting the radiologist with a highly flexible, personalized tool, EasyViz maximizes productivity while increasing diagnostic accuracy, helping to improve patient care.

30 31
Flexibly supports your unique workflow needsnMultiple deployment options – thick, thin and zero footprint – allow diagnosis from local or remote
environments with uncompromised image quality and performancenEnhance the communication that supports improved patient care with real-time session collaboration,
interrupted workflow and multi-disciplinary team meetings
Personalized for optimal user experiencenThe customizable diagnostic toolset provides radiologists with a fast and reliable viewing experience
that is consistent regardless of device or locationnAdvanced hanging protocols are highly contextualized, driven by modality, body part and your
individual reading preferences
Clinically advanced for improved diagnostic accuracynComplete 2D/3D toolset across all modalities, including mammography and fusion* expansion
modules, provides single system support for subspecialty readsnIntuitive user interface for fast and easy navigation, image interaction and manipulationnContextualized launch into advanced visualization applications, providing premier tools for diagnosis
Superior accessibility reduces complexity of retrieving data nEasily integrated with existing image repositories - PACS systems and VNAs - EasyViz allows for
seamless access to distributed imaging data, including intelligent management of relevant priors nAdaptive streaming technology reduces network traffic and cost while maintaining high image
reading performance and efficiency
* EasyViz Fusion is not available in the US.

3332
Vitrea Advanced VisualizationFull-powered Solutions for 2D, 3D and 4DVitrea software is a multi-modality advanced visualization system providing comprehensive applications in a variety of IT environments.
Multi-modality applications enhance diagnostic confidence across the organization. By providing access to advanced clinical tools, Vitrea software enables physicians to have meaningful interactions wherever they are.
Advanced imaging tools, such as in-suite 3D viewing and automated measurements, facilitate improved clinical outcomes with powerful applications, streamlined partner integrations and clinical solutions and workflows tailored to your needs.

34 35
Vitrea Advanced Visualization BenefitsIntuitive DesignIntuitive user interface with a dark color scheme designed for viewing in the reading room
Clinical OutcomesHelps facilitate improved clinical outcomes with powerful clinical workflows and superior partnerapplications seamlessly integrated into Vitrea Advanced Visualization
Improved WorkflowIncreased efficiency with consistent user protocols and experience across all modalities
IT EfficiencyEasy to deploy thin client solution does not require specialized software to reside on client computers

36 37
Vitrea Advanced Visualization DeploymentsWorkstationA one user, intuitive, multi-modality workstation increases productivity helping to optimize the time and resources needed to produce clinical results.
ExtendA three-user, multi-modality solution that increases your department workflow with a cost-effective alternative to enterprise integration, all with minimal IT impact.
EnterpriseAn enterprise-wide advanced visualization solution provides scalable thin client access to multi-modality clinical solutions anywhere in your medical enterprise.

3938
Vitrea Advanced Visualization Clinical ApplicationsVital’s suite of applications offers full-powered solutions for 2D, 3D and 4D advanced visualization used to process and analyze clinical data from multiple modalities – CT, MR, XA, PET, US and SPECT. Applications for Cardiology, Neurology and Oncology provide comprehensive toolsets that supply medical specialists with information for planning procedures and treating patients.

40 41
CT Body Perfusion 4Dn Single-input organ workflow for
display of Arterial Flow (AF) mapn Dual-input lung workflow for
display of Pulmonary Flow (PF), Arterial Flow (AF) and pulmonary Perfusion Index (PI) maps
n Dual-input liver workflow for display of AF, PF and hepatic PI maps
n Deformable registration and motion correction
n Patlak Plot method for display of Arterial Flow maximum slope, Patlak Equivalent Blood Volume and Patlak Flow
CT Brain Perfusion 4D n Automatic calculation of quantitative
brain perfusion results: Regional Cerebral Blood Volume (rCBV), Mean Transit Time (MTT), Regional Cerebral Blood Flow (rCBF), Time-to-Peak of tissue response curve (TTP), delay of tissue response curve
n Single-view summary map for communicating the perfusion results
n 4D cine of the DSA view for visualizing the flow of contrast through the vessels
n Automatic arterial and venous phase separation in 3D views of the arteriogram and venogram (generated CTA-V view)
n Fusion of parametric and anatomical CT view
CT Brain Perfusion 2D n Automatic calculation of quantitative
brain perfusion results: Regional Cerebral Blood Volume (rCBV), Mean Transit Time (MTT), Regional Cerebral Blood Flow (rCBF), Time-to-Peak of tissue response curve (TTP), delay of tissue response curve
n Summary map with single view for communication of the perfusion results
n Automatic curve-fitting and motion correction
CT Cardiac Analysis n Streamlined coronary workflow
with automatic extraction of the coronary arteries and optimized viewports such as volume rendering, MIP, MPR, curved and straightened MPR views
n SUREPlaqueTM* tool assists clinicians in evaluating the characteristics inside blood vessels
n Full vessel probe capabilities for coronary artery analysis including the Lesion tool, Vessel Walk and Cath view
n Key findings classification for consolidated reporting of cardiac workflows
CT Cardiac Functional Analysis n Automatic segmentation of
the heart, left ventricle and myocardium in multiple phases
nAutomatic calculation of global metrics, including: end diastolic volume, end systolic volume, stroke volume, ejection fraction, cardiac output, cardiac index, stroke index and myocardial mass
nShort-axis, long-axis and four chamber views of the heart
nAutomatic calculation of regional metrics, including: wall motion; percentage of wall thickening and regional ejection fraction; and polar maps with live 3D beating heart visualization
nKey findings classification for consolidated reporting of all cardiac workflows
3D Printingn3D models can be created
from CT, MR, or XA images and exported from Vitrea in the form of stereolithography (STL). STL files are used in a wide variety of other applications.
n3D print on-demandnBest-in-class 3D printing nAbility to print 3D models in a wide
range of materials and colors– from soft and dissectable to rigid and durable
*SUREPlaqueTM is a separately licensed application.

42 43
CT Colon Analysisn Auto-segmentation of colon with
creation of 2D and 3D centerline for simultaneous multiplanar reformatting (MPR) and 3D review
n Single-click polyp segmentation for morphological characterization and quantification of size, density and distance to rectum or anal verge
n Integrated filet view and endoluminal fly-through
n Automatic fluid/stool tagging and subtraction
n Polyp assessment and reporting using C-RADS guidelines
CT Endovascular Stent Planning n Automated segmentation of the
aorta with centerline and contour editing tools
nStent-graft templates for abdominal and thoracic aortic aneurysms
nUser-guided workflow with automated identification of anatomical landmarks and stent-specific endovascular measurements
nKey measurements supporting fenestrated grafts using the clock angle tool and clock overlay functionality
nCreate new, add or modify stent planning templates with the Custom Device Template Editor
CT EP Planning n Automated segmentation of the left
atrium and pulmonary veinsnAutomatic centerline and lumen
boundaries with 3D fly-through for visualization and measurement of the pulmonary vein ostia
nAbility to export results in a STL file nExport the 3D model to an
EP navigation and mapping system (EnSite®)
CT Fat Measurement*n Segment subcutaneous and
visceral fat regions nEvaluate fat segmentation resultsnDedicated application report
with results based on the obesity standard associated with the selected report guideline
CT Liver Analysis n Tumor tracking with RECIST
and WHO measurementsn Single-click liver and vascular
segmentationn Single-click tumor probe with
tumor margin borders viewing in 2D/3D
n Volume fusion, support for up to four timed phases. For example, arterial, venous or delayed
n Virtual resection planning
CT Lung Analysis n Semi-automated segmentation
of lung and airwaysn Restore previously segmented
nodules from prior studies for comparison
n Quantification of lung nodules with nodule growth and doubling times in comparison studies
n Dictation table with Lung-RADS®, Fleischner Criteria and export options to PowerScribe® 360
n Structured reporting available for export in the Viewer tab as well as the Reporting tab
n Single click lung nodule segmentation tools to include solid nodules and ground glass opacity (GGO) nodules
*CT Fat Measurement is only available in select countries. It is not available in the US.

44 45
CT Lung Density Analysis n Semi-automatic right lung, left lung
and airway segmentationn Visualization of lung density with
color-defined Hounsfield Unit (HU) ranges
n Lung density result quantification with HU density range, volume measurements, lung density index and the PD15% measurement
n Density graph/histogram of the classified lung voxels’ relative frequencies
n Comparison of upper and lower lung density index ratios
n Adjustable density thresholds for refining and optimizing HU ranges
CT Lung Screening Solution* n Vitrea Advanced Visualization’s
flagship CT Lung Analysis application with Image Denoising
n Support of Nuance PowerScribe® 360 Reporting
n PenLungTM by RenRad unified software solution
n Integrated with VisiaTM CT Lung CAD
n Custom report templates with Lung-RADSTM and ACR guideline
n Comprehensive resource center for education
CT Multi-Chamber CFA nSemi-automatic segmentation of
left atrium (LA), right ventricle (RV), left ventricle (LV) and myocardium, including identification of long axis and mitral valve boundaries across multiple phases
nAutomatic calculation of RV/LV End Diastolic Volume (EDV), End Systolic Volume (ESV), Stroke Volume (SV), Cardiac Output (CO), 3-point LA metrics, LV/RV regurgitation fraction, cardiac index and myocardial mass
nCalculation of regional metrics including wall motion, percentage of wall thickening, regional ejection fraction and polar plots
nKey findings classification for consolidated reporting of cardiac workflows
*PenLung™, Lung-RADS™, Visia™ and PowerScribe® are trademarks of their respective owners.
46 47
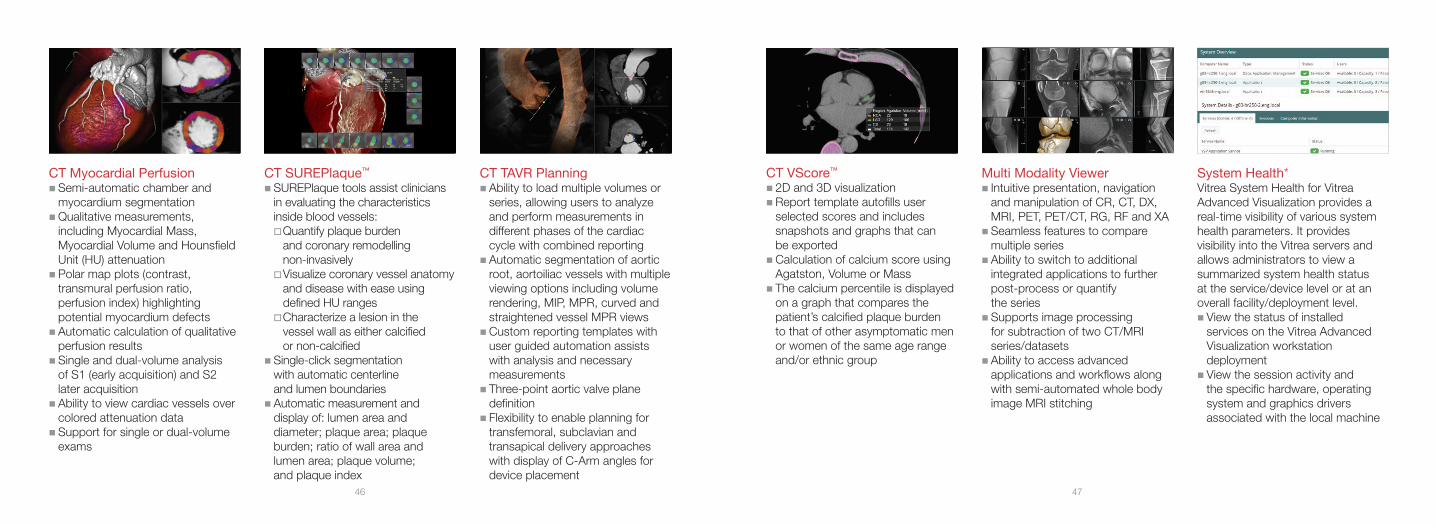
CT VScore™ n2D and 3D visualizationnReport template autofills user
selected scores and includes snapshots and graphs that can be exported
nCalculation of calcium score using Agatston, Volume or Mass
nThe calcium percentile is displayed on a graph that compares the patient’s calcified plaque burden to that of other asymptomatic men or women of the same age range and/or ethnic group
System Health*Vitrea System Health for Vitrea Advanced Visualization provides a real-time visibility of various system health parameters. It provides visibility into the Vitrea servers and allows administrators to view a summarized system health status at the service/device level or at an overall facility/deployment level.nView the status of installed
services on the Vitrea Advanced Visualization workstation deployment
nView the session activity and the specific hardware, operating system and graphics drivers associated with the local machine
Multi Modality Viewer n Intuitive presentation, navigation
and manipulation of CR, CT, DX, MRI, PET, PET/CT, RG, RF and XA
n Seamless features to compare multiple series
n Ability to switch to additional integrated applications to further post-process or quantify the series
n Supports image processing for subtraction of two CT/MRI series/datasets
n Ability to access advanced applications and workflows along with semi-automated whole body image MRI stitching
CT Myocardial PerfusionnSemi-automatic chamber and
myocardium segmentationnQualitative measurements,
including Myocardial Mass, Myocardial Volume and Hounsfield Unit (HU) attenuation
nPolar map plots (contrast, transmural perfusion ratio, perfusion index) highlighting potential myocardium defects
nAutomatic calculation of qualitative perfusion results
nSingle and dual-volume analysis of S1 (early acquisition) and S2 later acquisition
nAbility to view cardiac vessels over colored attenuation data
nSupport for single or dual-volume exams
CT SUREPlaque™
nSUREPlaque tools assist clinicians in evaluating the characteristics inside blood vessels:oQuantify plaque burden
and coronary remodelling non-invasively
oVisualize coronary vessel anatomy and disease with ease using defined HU ranges
oCharacterize a lesion in the vessel wall as either calcified or non-calcified
nSingle-click segmentation with automatic centerline and lumen boundaries
nAutomatic measurement and display of: lumen area and diameter; plaque area; plaque burden; ratio of wall area and lumen area; plaque volume; and plaque index
CT TAVR PlanningnAbility to load multiple volumes or
series, allowing users to analyze and perform measurements in different phases of the cardiac cycle with combined reporting
nAutomatic segmentation of aortic root, aortoiliac vessels with multiple viewing options including volume rendering, MIP, MPR, curved and straightened vessel MPR views
nCustom reporting templates with user guided automation assists with analysis and necessary measurements
nThree-point aortic valve plane definition
nFlexibility to enable planning for transfemoral, subclavian and transapical delivery approaches with display of C-Arm angles for device placement

48 49
Olea MR Body OptionsThe MR Body options, powered by Olea Medical®, provide users with access to the latest tools and applications for Breast, Prostate and Body Imaging. The MR Body options include the following:n MR Body Fulln MR Breastn MR Female Pelvisn MR Head and Neckn MR MSKn MR Prostaten MR Rectum
Olea MR Neuro OptionsThe Olea MR Neuro options, powered by Olea Medical, provide expert stroke post-processing options, parameters, maps and metrics incorporated into a fully automated workflow saves time. State of the art applications provide users with the latest tools and applications for neuro imaging.
The Olea MR Neuro options include the following:nMR Basic StrokenMR NeuronMR Neuro FullnMR Neuro ASL
Vessel ProbenThe Vessel Probe tool creates a
centerline through the vessel lumen nMultiple Image viewing formats
including orthogonal MPR (multiplanar reformatted), oblique MPR, curved MPR, 3D, and curved reformat views of the selected vessel
nAutomated Stenosis Measurement tools that include single and dual reference, NASCET and average
nAutomated internal and external lumen boundary detection, including maximum and minimum lumen diameters
Vitrea® Image DenoisingnSPD denoising algorithmnCustomized filter, with reduced
pixel noise and improved signal contrast to noise ratio (SNR)
nReal time toggle between original and denoised volumes
nPredefined image filter presets may be modified and saved for future use
nInteractive denoising preview capability
nCompatible with multi-phase and multi-volume datasets within select corresponding protocols
XA 3D-AngionDigital subtraction angiography
(DSA) protocol with preset visualization settings for 3D evaluation of vessels
nMulti-volume fusion for display of vessels, device and bone
nStandard 3D tools for dataset worknSingle-click segmentation, with
automatic centerline and lumen boundaries
nDisplay of clinical angles, which update automatically as volume view rotates and can be sent back to the X-ray system for position of the C-Arm with a single click**
*System Health is an administrative tool and not a clinical application. **Toshiba Infinix labs only.

5150
Vitrea Advanced Visualization Integrated ApplicationsTo provide the best tools to our customers, Vital provides partner applications integrated seamlessly into our software.*
*Check with your Vital Sales Representative or Solutions Architect for your supported applications set.

52 53
Mirada Nuclear Medicinen Vendor neutral software allows
data from different scanners to be read using the same display format and protocols
n Unlimited number of configurable workflows for reading planar static and dynamic NM data
n Mirada Workflow Designer enables easy creation and customization of workflows
n Smart workflow rules provide data which is available within your perferred workflow throughout your institution
4DM by INVIAnDelivers advanced processing
algorithms, precise co-registration and reproducible quantification and image displays
nQuality assurance measuresnIntelligent workflows for greater
efficiencynThe quantification of myocardial
perfusion, function and viabilitynMultiple review screensnIntegrated reporting with
customizable templates
Cedars-Sinai Medical Center Cardiac SuitenQuantitative Gated SPECT (QGS)nQuantitative Perfusion SPECT (QPS)nQuantitative Blood Pool SPECT
(QBS)nQuantitative PET (QPET)nAutoReconnMoCo (Motion Correction)
iCAD VeraLook® CT Colon CADn 2D and 3D fly-through visualizationn Automated identification of regions
of interest (ROI)n Bookmark CAD markingsn CAD summary paneln Extracts features from potential
polyps based on shape, morphology, texture, contrast, brightness and other attributes
Medis® Suite Cardiovascular MRMedis Suite provides an efficient and flexible workflow, including CVMR Viewer, QMass, and QFlow.n Scanline views for cross referencing n Perform caliper measurements n Take snapshots n Flexible reporting, including
predefined texts
Mirada Oncology FusionTM
nIndustry leading comprehensive PET/CT reading platform
nCustom layouts, custom reports and hotkeys for any tool
nSoftware based PET/MRnSupport for Response Evaluation
Criteria in Solid Tumors (RECIST), PET Response Criteria in Solid Tumors (PERCIST) and World Health Organization (WHO)
nSupport for multi-timepoint gated, multi-sequence MR and multi-phase CT data
nAutomatic image alignment of datasets upon load
nCT Segmentation Tool

54 55
Mirada RTxnMulti-modal deformable fusion
incorporates any combination of CT, PET, PET/CT, MRI, CT Angiography and CBCT, including 4D data sets
nMulti-atlas contouring provides single-click automated contouring using an atlas or previously contoured case
nDose deformation and summationnAdaptive re-planningnMirada software works seamlessly
with any treatment planning system, scanner vendor or PACS
TOMTEC®*nTOMTEC Cardiology
Ultrasound BasicnTOMTEC Cardiology
Ultrasound EssentialsnTOMTEC Cardiology
Ultrasound PremiumnTOMTEC Cardiac Cath CompletenTOMTEC Cardiac Echo CathnTOMTEC Radiology Ultrasound
*TOMTEC and Visia Dynamic Review are only available in version 6.x.
Visia™ Dynamic Review*nAutomated processing and display
of dynamic MRI studiesnSophisticated 3D rigid or elastic
algorithms allow for advanced motion correction
nInteractive time-intensity curvesnFlexible color overlays through
on-the-fly adjustments of thresholds and time points
nMRI-optimized layoutsnColor overlays available on
interactive 3D Maximum Intensity Projection, subtraction images and any oblique plane
Visia™ CT Lung CADVisia enables the detailed segmentation of anatomical pulmonary structures as well as the automatic detection of abnormalities (lung tumors, pulmonary embolism), their evaluation and quantification. nClinically validated CAD
performance - proven to improve reader accuracy and efficiency
nAutomated tracking for lung nodules in longitudinal exams
nDictation table with Lung-RADS®, Fleischner Criteria and export options to PowerScribe® 360

56 57
CT Abdominal AnalysisThe CT Abdominal Analysis workflow visualizes the aorta in the abdomen. CT Aorta AnalysisThe CT Aorta Analysis workflow enables users to visualize and evaluate the aorta vasculature.
CT CarotidThe CT Carotid workflow provides tools to visualize and evaluate the carotid and vertebral vessels.
CT Circle of WillisThe CT Circle of Willis workflow demonstrates the vascular anatomy of the intracranial vessels for possible occlusion or aneurysms.
CT Larynx AirwayThe CT Larynx Airway Analysis workflow is used for the visualization and evaluation of the larynx airway.
CT MusculoskeletalThe CT Musculoskeletal workflow provides clinical tools and visualization of muscles, soft tissue injuries, cortical bone and joint displacement.
CT RenalThe CT Renal workflow enables the visualization of renal anatomy using CT angiography studies.
CT RunoffThe CT Runoff workflow assists in the evaluation of occlusion or focal stenosis in patients with peripheral artery diseases.
CT UrogramThe CT Urogram workflow enables the ability to evaluate the kidneys, ureters and bladder.
MR Abdominal AnalysisThe MR Abdominal Analysis workflow provides general clinical tools and visualization settings to review and analyze MR abdominal exams.
MR Brain TumorThe MR Brain Tumor workflow is intended for the analysis/quantification of tumor volumes obtained from MR brain series scans using a special 2D view.
MR MusculoskeletalThe MR Musculoskeletal workflow views types of orthopedic studies with presets for optimal visualization of soft tissue and bony structures.
MR VascularThe MR Vascular workflow evaluates vascular anatomy from MR angiography studies.
The following are some of the workflows available in our clinical applications:
Vitrea Advanced Visualization Clinical WorkflowsVital’s clinical applications contain many workflows to assist users when working on specific clinical exams. These can be used to automatically optimize the screen layout and customized visualization settings.
5958
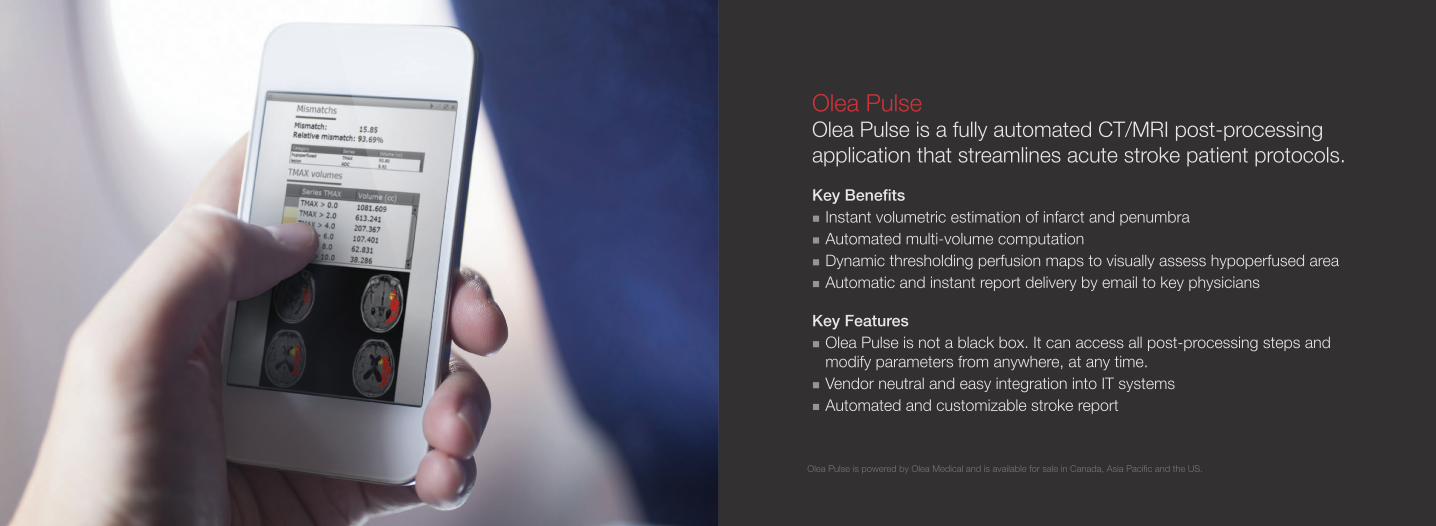
Olea PulseOlea Pulse is a fully automated CT/MRI post-processing application that streamlines acute stroke patient protocols.
Key BenefitsnInstant volumetric estimation of infarct and penumbranAutomated multi-volume computationnDynamic thresholding perfusion maps to visually assess hypoperfused areanAutomatic and instant report delivery by email to key physicians
Key FeaturesnOlea Pulse is not a black box. It can access all post-processing steps and modify parameters from anywhere, at any time. nVendor neutral and easy integration into IT systemsnAutomated and customizable stroke report
Olea Pulse is powered by Olea Medical and is available for sale in Canada, Asia Pacific and the US.
6160
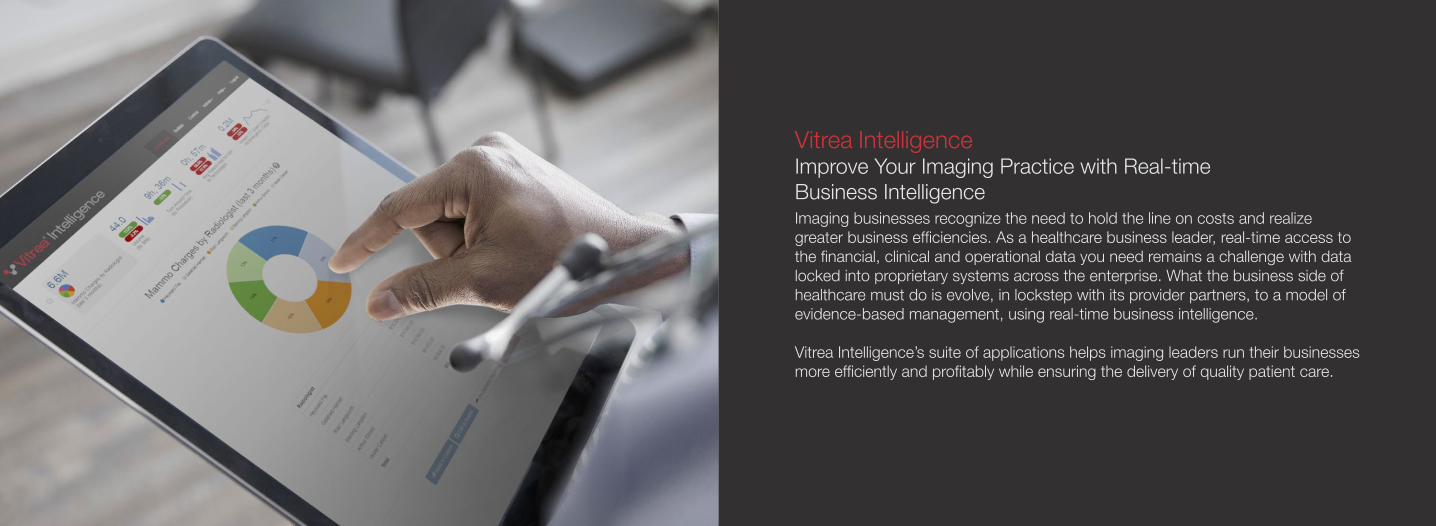
Vitrea IntelligenceImprove Your Imaging Practice with Real-time Business IntelligenceImaging businesses recognize the need to hold the line on costs and realize greater business efficiencies. As a healthcare business leader, real-time access to the financial, clinical and operational data you need remains a challenge with data locked into proprietary systems across the enterprise. What the business side of healthcare must do is evolve, in lockstep with its provider partners, to a model of evidence-based management, using real-time business intelligence.
Vitrea Intelligence’s suite of applications helps imaging leaders run their businesses more efficiently and profitably while ensuring the delivery of quality patient care.

6362
Practice ManagementThe Practice Management module makes running your imaging business easier byallowing you to make informed business decisions. We reveal the information you need to strategically manage your organization, as well as your referring physicianbase, and help you enhance your exam revenue stream.
Operational BenefitsnManage your entire organizationnGain an integrated view into operational, financial, and clinical data in real timenObtain access to critical data
Clinical BenefitsnManage and optimize modality throughputnSearch clincial reports by keywordnVisualize patient waits in real-timenBetter manage sites, departments, and resourcesnLeverage KPIs to propagate best practices
IT BenefitsnEnable easy end-user interaction with data visualizationnFree your IT resources from report generation tasks with user access to datanLeverage standard communication protocols such as HL7 and DICOMnSupport enterprise data warehouse integrationnAcquire a scalable solution that grows with your organization

64 65
Track recommendations for follow-up with ‘Checklist’nAutomatically identify recommendations made
by radiologists in diagnostic reportsnCreate checklists for appropriate follow-upnDocument communication and workflow steps
for quality process improvementsnCreate cohort analysis for improved discovery
and communication
Improve Quality of Care with ‘Clinical Report Search’nSearch all clinical reports by keywordsnUse advanced search options to filter resultsnSave and reuse common searchesnExport search results to .xls files
Understand Your Business with ‘On Demand Reporting’nManage your entire organizationnView operational, financial and clinical datanEnable self-service access to critical informationnInteract with your data using drill-down filters
Manage Business Performance with a ‘Key Performance Indicator (KPI) Dashboard’nManage sites, departments and resourcesnIntuitively view focused performance metricsnBuild user configurable KPI’s using simple filtersnShare KPI’s with others to propagate best practices
Visualize Patient Modality Throughput with ‘Scanner Utilization’nManage and optimize modality throughputnVisualize patient waits in real-timenDefine and monitor custom resource groupsnView current or past equipment usage patterns

6766
Opportunity NavigatorImprove Your Imaging Practice’s Financial Performance with Predictive Financial AnalyticsRunning a profitable imaging business in today’s complex healthcare environment can be challenging. Adjusting to the demands of value-based reimbursement models and declining margins calls for a data-driven approach to managing your bottom-line.
Existing analytics products present historical data to users and help them visualize information to infer future trends and make corresponding business decisions. Opportunity Navigator goes further by combining your operational and financial data and then presenting a menu of financial “opportunities” that might be realized by taking specific actions to increase revenues or avoid costs.
Operational benefitsnProactively identify revenue and cost saving opportunitiesnReceive customized data to support achieving revenue targetsnGain access to operational and financial datanAnalyze resources affecting business performance
Clinical benefitsnManage and optimize modality throughputnReduce variation in exam performancenIdentify opportunities to standardize clinical workflownImprove operations associated with specific ICD-10 diagnostic codes
IT benefits nEnable easy end-user interaction with data visualizationnGain access to data and free IT resources from report generation tasksnLeverage standard communications protocols such as HL7 and DICOMnSupport enterprise data warehouse integrationnAcquire a scalable solution that grows with your organization

68 69
Opportunity Navigator recommends specific actionsto take towards achieving financial objectives andprovides actionable information to help you get there.

70 7170
Identify financial opportunities with the ‘Smart Board’nView proposed revenue and savings opportunitiesnReceive prescriptive recommendations on how to achieve
proposed financial opportunitiesnRank and classify financial opportunities automatically nView financial impact of each opportunity
Achieve financial targets using ‘Actionable Information’nView actionable information associated with each opportunitynSupport management decisions with evidence-based,
customized datanDrill-down into operational detailsnObtain configurable fixed expense and equipment
depreciation details for computing costs
Optimize business performance with the ‘Operational Dashboard’nManage exam process flows to optimize modality throughputnView operational metrics affecting financial performance
by facilitynManage referring providers’ exam pipelinenDiscover and optimize business performance metrics sorted
by specific procedures
Plan for the future using the ‘Projection Dashboard’nCompare current vs projected future performancenExamine revenue and cost of proceduresnView profitability projectionsnProject exam volume and equipment utilization trends

72 73
SupportVital understands that the success of your organization depends on reliable technology and minimal downtime. Our dedicated Customer Success Management program and quick response times ensure that you receive the help you need, when you need it. Our consulting services provide the technical and clinical expertise necessary to customize our product to your environment.
Maintenance and ServicesThe following features are available with our maintenance and services contracts:
nSoftware updates and upgradesnRapid response remote technical supportnAccess to Vital U live webinarsnAccess to Vital U online librarynStandard support hoursnAccess to online technical knowledge basenVital Customer Success ManagernHardware support assistancen24/7 technical support nProactive system activity review with customer success manager nEducation credits (at additional cost) nOn-site assistance for critical issues

74 75
Vital U® EducationWhen you purchase software from Vital, you receive education units per the terms of your purchase. Your Maintenance and Support agreement may include additional, automatically renewing education units. You may purchase more units any time you need them.
Vital U is Vital’s professional educational organization. Vital offers various learning opportunities for you to choose from. Because we value fostering partnerships with our customers, we tailor ongoing education programs for each organization’s size, needs and desired outcomes.
Classroom EducationFor uninterrupted learning in a hands-on classroom environment, sign up for a Vital U classroom course at our headquarters in Minneapolis.
On-Site Classroom EducationOn-site facility education teaches the fundamentals of Vital’s advanced visualization software.
Vital U WebinarsOur live webinars offer lecture-style instruction on the use of clinical applications. New modules are offered every week.
eLearningResources are available online, exactly when and where you need them. Access to our eLearning, educational courses, videos, workflows, user guides and other release-related documentation are available to customers.

76