Health, wealth and lifestyles of the older population in ...
74
Health, wealth and lifestyles of the older population in England: The 2002 English Longitudinal Study of Ageing Technical Report Authors: Rebecca Taylor, Laura Conway, Lisa Calderwood, Carli Lessof, Hayley Cheshire, Kate Cox and Shaun Scholes. Date July 2007 P2058
Transcript of Health, wealth and lifestyles of the older population in ...

Health, wealth and lifestyles of the older population in England: The 2002 English Longitudinal Study of Ageing Technical Report Authors: Rebecca Taylor, Laura Conway, Lisa Calderwood, Carli Lessof, Hayley
Cheshire, Kate Cox and Shaun Scholes. Date July 2007 P2058

Contents
Acknowledgements................................................................................................................. 5
1 Introduction......................................................................................................................... 6
2 Sample design .................................................................................................................... 8 2.1 The Health Survey for England ..........................................................................................................................8
Health Survey for England’s two-stage sampling strategy ..........................................................................8 Advantages and disadvantages of using the HSE as a sampling frame .....................................................9
2.2 Selecting the ELSA sample for issuing to field.................................................................................................10 Stage 2 ......................................................................................................................................................10 Stage 3 ......................................................................................................................................................11 Stage 4 ......................................................................................................................................................11 Stage 5 ......................................................................................................................................................12 Checking eligibility in field and identifying new partners............................................................................12 Approaching individuals.............................................................................................................................13
2.3 Characteristics of the age-eligible, excluded and issued sample ....................................................................13 Age-sex distribution of the issued sample .................................................................................................15
2.4 Allocating fieldwork ..........................................................................................................................................15
3 Questionnaire development and structure.................................................................... 17 3.1 Pilots ................................................................................................................................................................17 3.2 Administering the main interview .....................................................................................................................18 3.3 Interview length ................................................................................................................................................20 3.4 Dependent interviewing....................................................................................................................................20 3.5 Innovations.......................................................................................................................................................21
4 Fieldwork procedures ...................................................................................................... 22 4.1 Rules for contacting potential ELSA respondents............................................................................................22 4.2 Appointments ...................................................................................................................................................23 4.3 Proxy interviews ...............................................................................................................................................23 4.4 Quality checking of the interviews....................................................................................................................24 4.5 Tracing rules ....................................................................................................................................................24 4.6 Attempts to include all respondents and maximise response ..........................................................................25 4.7 Editing and coding............................................................................................................................................26 4.8 Feedback to participants ..................................................................................................................................26
5 Fieldwork response at Wave 1 ........................................................................................ 27 5.1 Defining response ............................................................................................................................................27
Ineligibility ..................................................................................................................................................27 Unknown eligibility .....................................................................................................................................28
5.2 Full, proxy and partial interviews achieved ......................................................................................................28 Proxy interviews.........................................................................................................................................29 Partial interviews........................................................................................................................................29
5.3 Module and item non-response........................................................................................................................30 Item non-response in financial information ................................................................................................31
5.4 Stages of non-response and reasons for ineligibility .......................................................................................32 Ineligibility ..................................................................................................................................................33
5.5 Wave 1 fieldwork response rates .....................................................................................................................34 Fieldwork household contact rate - sample members ...............................................................................34 Fieldwork individual co-operation rate - sample members ........................................................................34 Fieldwork household response rate - sample members ............................................................................35 Fieldwork individual response rate - sample members..............................................................................35 Fieldwork individual response rate - partners ............................................................................................36
6 Study response................................................................................................................. 37 6.1 Response at Wave 1 taking account of all those eligible.................................................................................37

National Centre for Social Research
3
Comparison with fieldwork response rate..................................................................................................40 6.2 Response at Wave 0 (HSE) .............................................................................................................................40 6.3 Sample representativeness at Wave 1 ............................................................................................................41 6.4 Longitudinal analysis........................................................................................................................................41
Patterns of response..................................................................................................................................41 Subsequent waves ....................................................................................................................................42
6.5 HSE weights.....................................................................................................................................................43 6.6 Analysis and modelling of non-response .........................................................................................................43 6.7 Calibration weighting........................................................................................................................................45 6.8 Weighted sample .............................................................................................................................................46 6.9 Comparison of unweighted and weighted data ................................................................................................46
Effect of the weights on key estimates from ELSA data ............................................................................46 6.10 Estimating errors in complex sample designs ...........................................................................................47 References .............................................................................................................................................................50
Appendix A Response rates for each HSE year............................................................... 51
Appendix B HSE sampling information............................................................................. 54
Appendix C Issued sample characteristics by HSE year ................................................ 57
Appendix D Excluded households .................................................................................... 59
Appendix E Proxy and partial interviews.......................................................................... 62
Appendix F Income and wealth imputation...................................................................... 63
Appendix G Further response rate information ............................................................... 66
Appendix H Response rates framework............................................................................ 70
Appendix I Population characteristics............................................................................. 72
Appendix J Weighting – non-response modelling .......................................................... 73
List of Tables Table 2-1 Age-eligible sample – potential sample members (not younger partners) ..............................................................................14 Table 2-2 Individuals known to have died since their HSE interview.......................................................................................................14 Table 2-3 Sample members in households excluded because refused to be re-interviewed .................................................................15 Table 2-4 Issued sample, by age and sex................................................................................................................................................15 Table 5-1 Total interviews achieved .........................................................................................................................................................28 Table 5-2 Achieved sample, by age and sex............................................................................................................................................28 Table 5-3 Response rates to key sections of the interview......................................................................................................................30 Table 5-4 Reason for ineligibility: sample members.................................................................................................................................33 Table 5-5 Household fieldwork response: sample members ...................................................................................................................35 Table 5-6 Individual fieldwork response rate: sample members ..............................................................................................................36 Table 6-1 Individual response rate: sample members .............................................................................................................................40 Table 6-2 Reason for ineligibility: sample members.................................................................................................................................40 Table 6-3 Achieved sample of core sample, by age and sex...................................................................................................................44 Table 6-4 Relationship between individual and household weight...........................................................................................................46 Table 6-5 Age-sex distribution unweighted and weighted........................................................................................................................46 Table 6-6 Key estimates from the ELSA data - true standard errors .......................................................................................................49 Apx. Table A.1 HSE interview response rates - HSE 1998 ..............................................................................................................................51 Apx. Table A.2 HSE interview response rates - HSE 1999 ..............................................................................................................................52 Apx. Table A.3 HSE interview response rates - HSE 2001 ..............................................................................................................................53 Apx. Table B.1 Age-sex distribution of all age-eligible individuals in sampling frame – HSE 1998 .................................................................55 Apx. Table B.2 Age-sex distribution of all age-eligible individuals in sampling frame – HSE 1999 .................................................................55 Apx. Table B.3 Age-sex distribution of all age-eligible individuals in sampling frame – HSE 2001 .................................................................56 Apx. Table C.1 Age-sex distribution of issued individuals – HSE 1998............................................................................................................57 Apx. Table C.2 Age-sex distribution of issued individuals – HSE 1999............................................................................................................57 Apx. Table C.3 Age-sex distribution of issued individuals – HSE 2001............................................................................................................58 Apx. Table D.1 Excluded households: age-sex distribution of individuals who had died .................................................................................59 Apx. Table D.2 Excluded households: age-sex distribution of individuals who had died – HSE 1998 ............................................................59
National Centre for Social Research
4
Apx. Table D.3 Excluded households: age-sex distribution of individuals who had died – HSE 1999 ............................................................60 Apx. Table D.4 Excluded households: age-sex distribution of individuals who refused to be recontacted – HSE 1998 .................................60 Apx. Table D.5 Excluded households: age-sex distribution of individuals who refused to be recontacted – HSE 1999 .................................61 Apx. Table D.6 Excluded households: age-sex distribution of individuals who refused to be recontacted – HSE 2001 .................................61 Apx. Table E.1 Proxy respondent sample, including new and younger partners, by age and sex ..................................................................62 Apx. Table E.2 Partial respondent sample, including new and younger partners, by age and sex .................................................................62 Apx. Table F.1 Income variable data types.......................................................................................................................................................63 Apx. Table F.2 Wealth variable data types .......................................................................................................................................................65 Apx. Table G.1 Household contact rate by HSE source year ...........................................................................................................................66 Apx. Table G.2 Household fieldwork response rate: core sample members from HSE 1998..........................................................................66 Apx. Table G.3 Household fieldwork response rate: core sample members from HSE 1999..........................................................................67 Apx. Table G.4 Household fieldwork response rate: core sample members from HSE 2001..........................................................................67 Apx. Table G.5 Individual co-operation rate: core sample members by HSE source year...............................................................................67 Apx. Table G.6 Individual fieldwork response rate: core sample members from HSE 1998............................................................................68 Apx. Table G.7 Individual fieldwork response rate: core sample members from HSE 1999............................................................................68 Apx. Table G.8 Individual fieldwork response rate: core sample members from HSE 2001............................................................................69 Apx. Table G.9 Individual response rate: younger partners..............................................................................................................................69 Apx. Table G.10 Individual response rate: new partners ....................................................................................................................................69 Apx. Table I.1 Population distribution for 2001................................................................................................................................................72 Apx. Table J.1 Characteristics of respondents and non-respondents .............................................................................................................73 Apx. Table J.2 Non-response model ................................................................................................................................................................74
List of Figures Figure 2-1 ELSA sample definition ............................................................................................................................................................10 Figure 5-1 Response tree ..........................................................................................................................................................................33 Figure 6-1 Progress of sample members over time, from Wave 0 to Wave 1 ..........................................................................................38 Figure 6-2 Response across waves for sample members ........................................................................................................................42

National Centre for Social Research
5
Acknowledgements We would like to acknowledge the contribution that many people have made to the ELSA study. The following people have been involved in the development of the study in the three collaborating institutions. At the National Centre for Social Research: Bob Erens, Elizabeth Hacker, Michelle Lee, Dan Philo, Susan Nunn, Natasha Wood and Ruth Fletcher. At the Institute for Fiscal Studies: James Banks, Richard Blundell, Maria Casanova, Zoë Oldfield and Gemma Tetlow with additional advice from Carl Emmerson, Orazzio Attanasio, Richard Disney and Costas Meghir. At University College London: Michael Marmot, James Nazroo, Edlira Gjonja, Martin Hyde, Mary Janevic, Saffron Karlsen, Meena Kumari, Anne McMunn, Elizabeth Breeze, Panayotes Demakakos, Faiza Tabassum, Paola Zaninotto, and Mary Pierce with additional advice from Mel Bartley, Paul Higgs and Mike Wadsworth. We have benefited from significant contributions from a number of academics based in other universities including: Felicia Huppert, Brenda McWilliams and David Melzer (University of Cambridge), Nicholas Steel (University of East Anglia) and David Blane (Imperial College, London). We would like to thank our international advisers Mike Hurd and Jim Smith (RAND, California), Beth Soldo (University of Pennsylvania), Bob Wallace (University of Iowa), Bob Willis and the ELSA Advisory Group, chaired by Baroness Sally Greengross, and including Sir Tony Atkinson, Michael Bury, Julian Farrand, Tom Kirkwood, Tom Ross, Jacqui Smith, Anthea Tinker, Christina Victor and Alan Walker. We would also like to thank all the members of the computing and operations departments at NatCen who have worked so hard to implement the study and to our interviewers and survey nurses who carry out the fieldwork. Most of all we would like to thank all the members of the public who give so much of their time to the study. We are very grateful to them.

National Centre for Social Research
6
1 Introduction The English Longitudinal of Ageing (ELSA) is a study of people aged 50 and over and their partners. ELSA has been developed through a collaboration between University College London, the Institute of Fiscal Studies and the National Centre for Social Research (NatCen), with academics at the Universities of Cambridge, Nottingham and East Anglia and from the Health and Retirement Study (HRS). Funding for data collection for the early waves of the study was provided by the National Institute on Aging and a consortium of British Government Departments. The ELSA sample was drawn from households who had responded to the Health Survey for England (HSE) in 1998, 1999, and 2001. Detailed eligibility criteria are provided in Section 2. In brief, all those aged 50 and over were selected as were any partners living with the sample member at the time of the HSE who were not age-eligible or who had joined the household since the HSE interview. A face to face interview was attempted with all those still living in private households in England during the fieldwork period in 2002 to 2003. The core ELSA questionnaire was administered by computer aided personal interviewing (CAPI). A paper self-completion questionnaire was also given to respondents. The topic areas covered at Wave 1 included: individual and household characteristics; physical, cognitive, mental and psychological health; social participation and social support; housing, work, pensions, income and assets; and expectations for the future. A shorter interview was attempted with a proxy informant if the eligible sample member was unable to respond because of a physical or mental ill health, or cognitive impairment. All those interviewed in person were asked for permission to link their responses to administrative data sources. Respondents at Wave 1 comprise the baseline study and will be re-approached every two years (with a nurse visit offered at alternate interviews, that is to say at Wave 2 and Wave 4). Ethical approval for Wave 1 of ELSA was granted by the Medical Research and Ethics Committee. ELSA data is being used to explore the dynamics of ageing, to inform policy debates and for comparative analysis with the Health and Retirement Study (HRS) in the USA and the Survey of Health and Retirement in Europe (SHARE). Preliminary findings from the Wave 1 survey can be found in the report entitled “Health and lifestyles of the older population in England: The 2002 English Longitudinal Study of Ageing” (Marmot et al, 2003). Further analyses and publications are listed at the ELSA web site, www.ifs.org.uk/elsa. This technical report focuses specifically on the study’s methodology and the conduct of the ELSA Wave 1 survey. Throughout, this report is based on data that was available before the Wave 1 data had been fully reconciled. Since the report was written, two minor sources of error have come to light. First, two duplicate households were found (one had, in fact, participated twice at Wave 1). Secondly, a small number of original HSE outcome codes were corrected (fewer than 20 individuals). Additionally further data cleaning activities have been conducted that resulted in a small number of changes to outcome codes. Because the numbers involved with these errors are relatively small they have little to no effect on the overall estimates presented in this report. For example, Table 5-1 shows 12,100 respondents

National Centre for Social Research
7
which will decrease to 12,099 in tables produced in the future. This technical report should be used in conjunction with the extensive materials deposited at the UK data archive http://www.data-archive.ac.uk/, study number 5050 and Economic and Social Data Service http://www.esds.ac.uk/longitudinal/access/elsa/l5050.asp. These include a User Guide which shows how to analyse the data and provides information about weights and other information needed for analysis. The UK data archive also provides the route to access core ELSA data. Some sensitive data, such as geographical information, is not available through the archive but can be applied for directly from the study team by emailing [email protected].

National Centre for Social Research
8
2 Sample design The ELSA sample was designed to represent people aged 50 and over, living in private households in England and was selected from households that had previously responded to the Health Surveys for England (HSE) in 1998, 1999 or 2001. This chapter provides background information about the HSE and describes the two-stage sampling design that was used to select the HSE sample (Section 2.1). Detailed criteria were used to select the ELSA sample that was issued to field and to check each individual’s eligibility once in field (Section 2.2). This chapter concludes with a description of the age-sex distribution of the issued sample (Section 2.3) and a brief summary of the approach taken to allocating fieldwork (Section 2.4).
2.1 The Health Survey for England The HSE is an annual cross-sectional household survey that collects a wide range of health data and biometric measures. It is conducted by the Joint Health Surveys Unit of the Department of Epidemiology and Public Health, University College London, and the National Centre for Social Research (NatCen), on behalf of the Department of Health. Each of the main HSE samples is designed to be representative of the English population living in private households. Interviewing for HSE is continuous and the sample is issued to interviewers evenly throughout the year. The HSE response rates are relatively constant from year to year1. Further details about the HSE are available from its Technical Reports (Erens and Primatesta, 1999; Erens, Primatesta and Prior, 2001; Prior et al., 2003). HSE years were selected as a sampling frame for ELSA if they were recent and if they could provide a sufficiently large sample size. HSE 1998 and 2001 had a single ‘core’ sample that was nationally representative. The HSE 1999 sample design had two components: a ‘core’ sample that was nationally representative and a boost sample that represented ethnic minorities. The ethnic minority boost sample was discarded since there was insufficient resource to include sufficient sample to boost the representation of ethnic minority groups.
Health Survey for England’s two-stage sampling strategy Each HSE sample is drawn in two stages. The method ensures that every address on the small users Postcode Address File (PAF) in England has an equal chance of inclusion. First, postcode sectors are selected from the PAF. Postcode sectors are stratified by health authority and the proportion of households in the non-manual socio-economic groups. Sectors are selected with probability proportional to their size, measured by delivery point count. Interviewing for each HSE year is continuous over a twelve-month period. The sample for each year is systematically sub-divided, where each postcode sector is assigned to a month of the year. The fieldwork conducted in each quarter of the year is carried out with a fully representative sub-set of the total sample. Secondly, a fixed number of addresses are selected systematically from each postcode sector. Within each address, households are identified and up to three households randomly
1 For the three HSE surveys chosen, the household response rate ranged from 74% to 76% and the adult individual response rate ranged from 67% to 70%. Details are provided in Appendix A.

National Centre for Social Research
9
selected. A specified number of adults and children in each household are deemed eligible for interview. Eligible individuals are asked to participate in a personal interview followed by a nurse visit.
Advantages and disadvantages of using the HSE as a sampling frame There are both advantages and disadvantages of using the HSE as a sampling frame for ELSA. The advantages of the HSE as a sampling source are that: • it is representative of private households nationally2, • it provides information to screen representative households from which we can identify
eligible individuals at reasonable cost, • as part of the HSE survey, extensive data has already been collected about respondents’
health (details of morbidity, lifestyle, diets and blood samples) before they even take part in ELSA,
• the majority of eligible individuals have participated in a previous survey which led to an expectation that they would be more likely to take part in this new study.
There are two main disadvantages of using HSE: Most important is the potential loss of representativeness before the first ELSA interview
through non-response at HSE, refusal to be re-contacted after HSE and attrition between HSE and ELSA. This has the potential to bias the responding sample. Some data is available to enable us to understand and try to correct for differential non-response but this offers only a partial solution.
A further disadvantage of the HSE is that the study concentrates on individuals living in private households, as is the case for many national surveys. This means that individuals living in institutions such as residential and nursing homes, are not included in the ELSA sample. However, conducting a longitudinal sample within care homes is fraught with difficulties and, even if the selected HSE years had included a boost sample of individuals in care homes as was the case in HSE 2000, the ELSA study would not have attempted to follow them. Instead, ELSA aims to look at the circumstances surrounding the move into an institution and ELSA will follow moves from private households into institutions after baseline.
A further point worth noting that affects ELSA and many other longitudinal studies is the
under-coverage of immigrants arriving into England after the first wave of interviewing. A judgement was made that the advantages of sampling from the HSE outweigh any disadvantages. Taking the three HSE years used for the ELSA sample together, a total of 31,051 households were sampled. These are shown as Stage 1 in Figure 2.1 below.
2 The use of the PAF as a sampling frame for HSE means that a very small percentage of households (less than 1% of all households) will not have had a chance of being included. This ‘coverage’ problem affects all PAF-based surveys. However the PAF is generally accepted as having the best coverage for surveys of private households in the UK. ELSA would face this limitation whether or not the HSE had been used as a sampling frame.

National Centre for Social Research
10
2.2 Selecting the ELSA sample for issuing to field The process of selecting the ELSA sample is summarised in the tree diagram shown in Figure 2.1 below which should be read from the top to the bottom. The shaded areas of the tree diagram show the number of households that were dropped. At the top of the tree are the sample of 31,051 households issued for HSE – this is represented as Stage 1 and has been described in the section above. Following this, four stages took place. In brief, the ELSA sample was only selected from households that responded to HSE (Stage 2). Furthermore, households were only issued to field if they included at least one age–eligible individual (Stage 3) who, according to administrative records, remained alive (Stage 4) and gave permission to be recontacted in the future (Stage 5). The result of this was that a sample of 11,578 households were eventually issued for ELSA.
Figure 2-1 ELSA sample definition
HSE sample
31,051 households
Households responding to HSE23,132 households
Households non-responding to HSE7,919 households
Households containing 1+ age-eligible individual13,203 households
containing 21,193 SM/YP
Households without age eligible individuals9,929 households
Households dropped401 households
Households containing 1+ living age-eligible individual12,802 households
containing 20,764 SM/YP
Stage 1
Stage 2
Stage 3
Stage 4
Households dropped1224 Households
containing 1,951 individuals (including 43 dead)
Households permitting re-interview11,578 households
containing 18,813 SM/YP
Stage 5
The following paragraphs describe Stages 2 to 5 in more detail and present the characteristics of individuals issued to field.
Stage 2 In the early stages of the HSE interview, all responding households were asked to provide the date of birth for every resident regardless of whether each went on to complete a full individual HSE interview3. This meant that all age-eligible individuals could be identified in responding households. On the other hand, non-responding households had to be discarded because there was no available information about residents that would make it possible to identify those who were aged 50 or older, or indeed would make it possible to trace those who 3 In fact, most sample members and younger partners identified in responding HSE households took part in an interview at HSE (94% of sample members and 93% of younger partners).

National Centre for Social Research
11
were resident in the household at the time of the HSE interview to collect this information belatedly4. A sampling frame was constructed from the HSE responding households using information about the residents at the time of the HSE. Records show that 23,132 households responded to HSE and so formed the foundation of the ELSA sample while a further 7,919 households did not respond to HSE and so were discarded. These two groups are shown as Stage 2 in Figure 2.1. Although this is not shown in the figure, within the 21,132 responding households, there were 43,200 individuals who were initially identified as eligible for HSE. Further details are given in Appendix A. Two sample types were then identified for the ELSA interview. First, potential sample members (SM) were identified. These were defined as individuals
who were living within an HSE responding household at the time of the HSE interview and were born on or before 29th February 1952. This date was chosen to ensure that all sample members would be aged 50 or over at the beginning of the planned fieldwork period (in March 2002). In total, 19,924 individuals were identified.
Secondly, the sampling frame was used to identify the cohabiting spouses or partners of
sample members who were younger than 50 years old. These potential younger partners (YP) were defined as the cohabiting spouses or partners of sample members, who were living within the household at the time of the HSE interview and were born after 29 February 1952. In total, 1,269 of these individuals were identified5.
Stage 3 Taking potential sample members and younger partners together, Stage 3 in Figure 2.1 shows that there were 13,203 households containing one or more age-eligible individuals and a total of 21,193 sample members or younger partners within these households (comprised of the 19,924 potential sample members and 1,269 younger partners mentioned above). The shaded box in Stage 3, Figure 2.1 also shows that a further 9,929 households were discarded because they did not contain an age-eligible individual. Two restrictions applied to the individuals selected, set out in Stage 4 and Stage 5.
Stage 4 First, potential sample members and younger partners were deselected if all HSE respondents aged 50 years or older within the household had refused, when asked, to being re-contacted in the future. Even though these people had not directly refused to take part in ELSA (they would not have been aware of the study at that time) it would have been unethical
4 In the UK, there are no population registers that would make it possible to compensate for this lack of information. 5 The main focus of ELSA is on the age-eligible sample members. Younger partners were not included in the sample for analysis as individuals in their own right. Rather, they were included in the ELSA study so that more complete information is available about the sample member and their partnership. Furthermore, their inclusion in the study makes it possible to carry out analyses of a representative sample of couples where at least one spouse is 50 or older.

National Centre for Social Research
12
to have re-contacted them6. This is depicted in Stage 4 of Figure 2.1 which shows that of the 13,203 households who contained one or more age-eligible individuals, 401 households were dropped because no age eligible individual had consented to re-contact and 12,802 households remained (containing 20,764 sample members or younger partners). That said, if one age-eligible sample member did consent to re-contact, the household was issued to field, though only ‘consenters’ were directly approached, with an advance letter. Nevertheless, an implication of this is that ‘refusing’ individuals that lived with other eligible individuals had a chance of being interviewed, but other ‘refusing’ individuals had to be dropped from the sample without any contact attempt.
Stage 5 Secondly, potential sample members and younger partners were deselected if it was known that they had died since their HSE interview. This check was carried out before fieldwork began to reduce the number of attempts to contact people who had died, since this could cause unnecessary distress for relatives and, in the case where there were no longer any eligible individuals to approach, would also improve fieldwork efficiency. Mortality information was obtained from the National Health Service Central Register (NHSCR) held by ONS as close to issuing the sample as was practically possible. However, no check was conducted on the HSE 2001 sample as little time had passed since that interview. Occasionally, deselecting individuals who were known to have died meant that there were no remaining potential sample members within the household (i.e. only a younger partner would remain)7. In these cases, the whole household was deselected. This is depicted in Stage 5 of Figure 2.1 which shows that of the 12,802 households who contained one or more living age-eligible individuals, 1,224 households were dropped because no age-eligible individual had consented to be re-contacted. This left 11,578 households, containing 18,813 sample members or younger partners. These individuals constituted the eligible sample issued for interview. A more detailed description of how HSE data was used to define eligibility, and the composition of each of the three samples, can be found in Appendix B.
Checking eligibility in field and identifying new partners The sampling frame for ELSA reflected the household composition at the time of the HSE interview. However, the ELSA interview was conducted between one and four years after the HSE interview took place. As a result, some changes were anticipated. It was expected that relationships between individuals would change, individuals would join the household or leave to form a new household, as well as entire households moving. There were three particular ways in which the status of an individual could change at the time of the ELSA interview.
6 In fact, most sample members and younger partners identified in responding HSE households who took part in an interview at HSE agreed to be re-contacted. Of the 94% of sample members who took part in an interview at HSE, 93% agreed to be re-contacted. And of the 93% of younger partners took part in an HSE interview, 96% of these agreed to be re-contacted. 7 In other instances, the interviewer was notified that a potential sample member or younger partner had died, so that their approach to the household was more sensitive.

National Centre for Social Research
13
The status of the selected individuals needed to be checked during fieldwork to ascertain whether they were living in a private residential address in England at the time of the ELSA interview. Any who had moved out of England or out of the private residential sector, that is into an institution, were not interviewed. The status of younger partners was also checked. Younger partners were approached for interview if, at the time of the ELSA interview, they were still living with an eligible sample member. That is to say, younger partners who had split from the potential sample member before the ELSA interview were no longer eligible to be interviewed. Also anticipated was a further subgroup of individuals that could only be identified during fieldwork for interview. New partners (NP) were defined as the cohabiting spouses or partners of sample members at the time of the first ELSA interview, of any age, who had joined the household since the HSE interview. Like younger partners, they are not considered part of the main sample and are not included in analyses as individuals in their own right. New partners could be of any age. It is important to note that household members aged over 50 years (including new partners) do not become sample members.
Approaching individuals Responses to the question at the end of the HSE interview (asking for their permission to be re-contacted at a later date) determined how they were approached in the field. As explained above, for ethical reasons individuals that refused to give permission could not be approached directly to take part in ELSA and households were not issued to field if there were no potential sample members who had given consent to be re-approached. Sample members and younger partners were approached directly, initially by letter, if they
had responded to the HSE and had not refused to be re-contacted after HSE. Sample members and younger partners who had not responded to the HSE but were
partners of someone who had responded and consented to be re-contacted were also approached directly.
Sample members and younger partners who had responded to the HSE but refused to be re-contacted were approached indirectly if another member of the household was eligible for ELSA had agreed to be re-contacted. An indirect approach consisted of contact being made at the household while interviewing another member.
New partners were also approached indirectly since no information was held about them that would have made a direct approach before the interview possible.
2.3 Characteristics of the age-eligible, excluded and issued sample This section considers the characteristics of all age-eligible individuals identified on the sampling frame and the subgroups that had to be de-selected. There are only a limited number of characteristics that can be compared: age and sex. Stage 3 in Figure 2-1above shows that there were 13,203 households containing at least one age-eligible individual and that in total there were 21,193 eligible individuals within these households. These individuals can be broken down into 19,924 sample members and 1,269 younger partners. The age-sex distribution of the 19,924 age-eligible potential sample members is shown here, with this further breakdown by HSE year in Appendix B.

National Centre for Social Research
14
Table 2-1 Age-eligible sample – potential sample members (not younger partners)
Ageband (years) at W1
Male Female Unknown Total Male
% Female
% Unknown
Total %
50-54 1862 1964 3826 20% 18% 19% 55-59 1693 1814 1 3508 18% 17% 50% 18% 60-64 1383 1412 2795 15% 13% 14% 65-69 1296 1373 1 2670 14% 13% 50% 13% 70-74 1120 1275 2395 12% 12% 12% 75-79 881 1080 1961 10% 10% 10% 80-84 565 936 1501 6% 9% 8% 85+ 431 778 1209 5% 7% 6% Unknown 34 25 59 0% 0% 0% Total 9265 10657 2 19924 100% 100% 100%
As explained, the households that the age-eligible sample reside in contain different numbers of individuals to be invited to be interviewed (sample members and younger partners). Taken together, thirty-nine per cent of the households had one person eligible for an ELSA interview and 59 per cent of households had two people eligible for an ELSA interview. Just two per cent of households had three or more individuals eligible for interview. ELSA includes all of these individuals in the sample, unlike the Health and Retirement Study (HRS), the US version of ELSA, which randomly selects one financial unit from each household. It is important to compare the characteristics of the excluded households to the population as a whole to try to understand whether the individuals that could not be approached are a random subgroup of the age-eligible sample. The age-sex distribution of the potential sample members who died between HSE and ELSA are shown in Table 2-2. Some households were excluded as a result. Others living in households that did not agree to be re-interviewed are shown in Table 2-3 below. Further characteristics of the households that were excluded are given in Appendix D.
Table 2-2 Individuals known to have died since their HSE interview
Ageband (years) at W1
Male Female Total Male
% Female
% Total
% Under 50 0 2 2 0% 1% 0% 50-54 13 9 22 3% 2% 3% 55-59 11 16 27 3% 4% 3% 60-64 22 10 32 5% 3% 4% 65-69 40 21 61 10% 5% 8% 70-74 57 40 97 14% 10% 12% 75-79 84 65 149 21% 17% 19% 80-84 75 81 156 18% 21% 20% 85+ 106 146 252 26% 37% 32% Total 408 390 798 100% 100% 100%

National Centre for Social Research
15
Table 2-3 Sample members in households excluded because refused to be re-interviewed
Ageband (years) at W1
Male Female Unknown Total Male
% Female
% Unknown
Total %
50-54 134 74 208 17% 8% 12% 55-59 148 127 276 19% 14% 50% 16% 60-64 109 94 203 14% 11% 12% 65-69 102 120 223 13% 13% 50% 13% 70-74 75 97 172 10% 11% 10% 75-79 84 105 189 11% 12% 11% 80-84 56 104 160 7% 12% 10% 85+ 52 150 202 7% 17% 12% Unknown 26 22 48 3% 2% 3% Total 786 893 1681 100% 100% 100% 100%
The exclusion of households because the age-eligible potential sample member(s) refused to be re-interviewed affected the age-sex distribution of the issued sample. The characteristics of the individuals living in excluded households do not follow the population distribution with respect to age and sex. Relatively more older individuals (80 year olds or more) were omitted and fewer younger individuals (less than 65 years) were omitted, which adversely affected the representativeness of the issued sample. The differences are more pronounced for women.
Age-sex distribution of the issued sample The age-sex distribution of the ‘anticipated’ issued sample pre-fieldwork is shown in Table 2-4.8 Most of the issued sample were potential sample members (94%) with the remaining 1,042 individuals being younger partners (shown in the first row as ‘under 50’).
Table 2-4 Issued sample, by age and sex
Ageband (years) at W1
Male Female Total Male %
Female %
Total %
Under 50 220 822 1042 3 8 6 50-54 1645 1838 3483 19 18 19 55-59 1579 1690 3269 19 16 17 60-64 1255 1301 2556 15 13 14 65-69 1195 1255 2450 14 12 13 70-74 1013 1154 2167 12 11 12 75-79 779 923 1702 9 9 9 80-84 475 771 1246 6 7 7 85+ 327 558 885 4 5 5 Unknown 9 4 13 0 0 0 Total 8497 10316 18813 100 100 100
2.4 Allocating fieldwork If fieldwork takes place over a period of time it has the potential to induce seasonal variation in some survey responses. Whilst seasonality cannot be prevented, it is possible to minimise the risk of it undermining the survey data by careful allocation of the sample over the fieldwork
8 The information is broken down by HSE source year in Appendix C.

National Centre for Social Research
16
period. For example, the fieldwork for each HSE source year was designed to be conducted over twelve months where each primary sampling unit (PSU) was assigned to a month of the year so that fieldwork conducted in each quarter of the year was carried out with a fully representative sub-set of the total sample. The ELSA Wave 1 sample was issued in three batches according to HSE source year: HSE 1998 was issued in March 2002, HSE 2001 was issued in June 2002 and HSE 1999 was issued in November 2002. Postcode sectors covered in both HSE 1998 and 2001 source years were grouped together and issued as HSE 2001. Each batch is a representative sub-set of the whole sample.

National Centre for Social Research
17
3 Questionnaire development and structure ELSA benefited from a relatively long development period. Initial questionnaire design meetings for Wave 1 took place in late 2000, piloting in 2001 and the study went into field in 2002. Questionnaire development involved a period of consultation with a range of academics, sponsors, members of the advisory group to the study and consultants from the Health and Retirement Study (HRS). In its formative stages, a number of Expert Panels9 were convened to debate specific elements of the survey and new modules of questions underwent cognitive testing10. Two extensive pilots were conducted in August and November 2001.
3.1 Pilots The pilot samples were drawn from the HSE 2000. HSE 2000 was not used to select the sample for the main study and offered a set of addresses that had been approached relatively recently so would not present great difficulties in terms of tracing movers. From the start, the intention was to select a group of people who could be re-approached in future years to pilot each stage of the study. This would make it possible to test the survey instruments and procedures on a group of individuals who were similar to ‘true’ sample members, having experienced all the same elements as the main study sample. However it would avoid compromising the main sample since pilot interviews necessarily vary from the final one and so are difficult to include in the final data set and, if excluded, reduce the number of achieved interviews. The initial pilot was chosen to be of sufficient size to provide reasonable feedback about sub-modules and questions which were only answered by part of the sample. For the first pilot, we sampled 498 sample members and 25 younger partners and for the second pilot, we sampled 239 sample members and 11 younger partners. Both pilots tested the survey instruments and fieldwork approach. The content of many modules was guided by the desire to use standardised instruments11, for example to measure physical, cognitive and mental health, to ensure comparability with the Health and Retirement Study (HRS), the HSE and other studies. However, in other areas of the questionnaire, ensuring comparability meant developing modules of questions from first principles, for example to measure household assets or pension wealth. Because of this, the cognitive tests and pilots were crucial in ensuring that the questions met their objectives and produced reliable data.
9 NatCen carries out what it calls ’Expert Panels’ in which a small group of subject and/or survey specialists are brought together to discuss a drafted set of questions on a particular topic. Discussion combines critical thinking with experience drawn from a range of past studies and often generates improvements. 10 Cognitive testing is a qualitative approach to questionnaire development which uses techniques drawn from cognitive psychology, to uncover aspects of the response process which are usually hidden. The techniques used focus on four processes: how respondents understand and interpret survey questions, how they recall information that applies to the question, the judgements they make as to what information to use when formulating their answer and how they respond to the question. For self-completion questionnaires, the focus also includes examining the interaction between the wording of the questions with the layout of the form. 11 The great majority of questions were asked using Computer Assisted Personal Interviewing (CAPI) while the remainder were administered using a paper self-completion questionnaire.

National Centre for Social Research
18
In addition to identifying many amendments to specific modules, many other decisions were made as a result of findings from the pilot. For example, we revised the order of modules, established the need for a paper self-completion questionnaire, introduced concurrent interviewing, identified the value of using the self-completion to separate individuals who were responding concurrently so that each could then have a private session with the interviewer, and so on. In its final form, the Wave 1 survey comprised of a personal face-to-face interview and a self-completion questionnaire. A brief outline of the content of the face to face interview is given in Box 3.1 below. In addition, the self-completion questionnaire covered quality of life, psychosocial wellbeing as measured by GHQ12, social participation, mobility, life satisfaction, perceived social position, social networks and social capital.
3.2 Administering the main interview The Wave 1 ELSA questionnaire covered a wide range of topics. It was important that the questionnaire flowed well but it also needed to allow the interviewer sufficient flexibility to respond to the needs of individual households, for example where a respondent’s ill health increased the need for breaks. In households with one respondent, or where two respondents in a household were interviewed separately, each interview tended to follow the order of modules set out in Box 3.1 below. That said, the walking-speed test could be administered at any convenient time after the health module had been completed. Furthermore, interviewers could skip the questions on income and assets and those on housing and return to them later in the interview. Interviewers were also allowed to suspend an interview and return to it at a later date if this met the respondent’s needs. These flexible arrangements also applied in households with more than one eligible sample member, but the structure of the ELSA interview was slightly different. To begin with, only one eligible individual in each household was asked to complete the information about household demographics at the start of the interview. The interviewer also asked the respondents to nominate a key informant to report on housing and a key informant within each financial unit12 to report on income and assets. The informant for these two sections were often, but not always, the same person. This meant that one respondent in a household would often have a slightly longer interview than the other. Individuals living alone or who were the only eligible respondent in the household, were interviewed in private whenever possible. For example, care was taken to ensure a visitor or non-resident carer was only present in the room if this was necessary for the well being of the respondent. In households with more than one eligible respondent, however, two individuals could be interviewed concurrently. Where this was the case, the questions were split into short blocks with the same questions asked to one person then to the other. Any two eligible respondents could be interviewed in this way – regardless of their relationship. The concurrent interview began following the same linear pattern shown in Box 3.1 below. However, when the start of the cognitive function module was reached, the interviewer asked one of the respondents to leave the room, taking their paper self-completion with them to
12 Where two individuals within the same household kept their finances separately, we considered them to be two separate financial units and data on each financial unit was collected for each.

National Centre for Social Research
19
Box 3.1. Content of the ELSA face to face interview
Household demographics (HD) – collected basic demographic information about everyone in the household, including sex, age and relationships to each other. It identified any individuals who had entered the household since the HSE interview, established their eligibility for interview and collected information about children living outside the household.
Individual demographics (ID) – collected details from the respondents about their legal marital status, whether their parents were alive or dead (and, if dead, their age at and cause of death), number of living children including adopted, foster and stepchildren, number of grandchildren and great-grandchildren, number of siblings and circumstances in childhood.
Health (HE) – covered many different dimensions: self-reported general health, long-standing illness or disability; eyesight and hearing; specific diagnoses and symptoms; pain; difficulties with activities of daily living (ADLs) and instrumental activities of daily living (IADLs); and health behaviours. Respondents aged 60 and over were asked about falls and fractures.
Social participation (SP) – covered the frequency with which respondents participated in certain social activities, whether they were limited from participating, and questions about care-giving and use of public transport.
Work and pensions (WP) – collected respondents’ current work activities and any current or past pensions that they had. If retired and receiving a pension, details were collected about pensions and the amount received.
Income and assets (IA) – collected the income that respondents received from a variety of sources over the last 12 months: wages, state pensions, private pensions, other annuity income and state benefits. It also collected the amount of financial and non-financial assets held, any income from these assets, regular transfers from non-household members and one-off payments in the last year.
Housing (HO) – gathered information about current housing situation (including size and quality), housing-related expenses, ownership of durable goods and cars, and expenditure on food. Owners and mortgagers were asked about the value of their property, and questions were asked housing costs including mortgages and rent.
Cognitive function (CF) – measured different aspects of the respondent’s cognitive function, including memory, speed, mental flexibility and numeracy.
Expectations (EX) – measured people’s expectations in a number of dimensions, the level of certainty respondents felt about the future, financial decision-making within households and optimal planning horizons.
Psychosocial health (PS) – measured how the respondent viewed his or her life across a variety of dimensions.
Final questions (FQ) – gathered further demographic information such as ethnic group, country of birth and education, a stable contact address and consent to obtain health and economic data from administrative sources.
Walking speed (MM) – measured a ‘timed walk’. This involved recording the time taken by the respondent to walk a distance of 8 feet (244cm) at their usual walking pace. It was completed for all individuals aged 60 and over who responded to the survey in person (rather than via proxy), where it was judged to be safe to do so.

National Centre for Social Research
20
complete quietly, elsewhere. The interviewer was then able to administer the final modules to the remaining respondent, in private. When this had been completed, the interviewer asked the respondents to swap places, with the first respondent returning to the room to complete the final modules of their personal interview, while the second left the room with their paper self-completion to fill in quietly, elsewhere. This arrangement worked very well in practice and ensured that the most sensitive modules, about psychosocial health, expectations for the future and, crucially, the assessment of cognitive function, took place without interruption and without being overheard. In some households where there were two eligible individuals, respondents did not want to carry out the interview concurrently or it was not appropriate for them to do so. In these instances, the interviewer was able to complete the full interview with each household member separately, just as if they were living alone or were the only eligible individual in the household. However, only one of the eligible respondents would answer the module which covered household demographics and housing and, depending on the financial arrangements within the household, one or both would answer the questions about income and assets. In cases where respondents completed the full interview in a session with the interviewer alone, the self-completion questionnaire was usually left with the respondent, to be returned by post. However, in instances where two respondents completed the interview in a concurrent session, with the self-completion questionnaire being completed by each respondent while the other carried out the ‘private’ section of the personal interview, the interviewer usually collected both self-completions before they left the household and returned them to the office. Reminder letters were sent to those who did not return their self-completion questionnaire and if this was unsuccessful, they were then called by the NatCen Telephone Unit who offered to complete the questionnaire with the respondent by telephone.
3.3 Interview length The main advantage of concurrent interviewing is perceived to be time saving, however other factors were also important in determining interview length, such as the fact that the housing module need only be answered once in each household. The interview was on average one hour and twenty five minutes for an individual in a single session. Two people in a concurrent interview took on average two hours and five minutes.
3.4 Dependent interviewing Dependent interviewing is a technique in which answers from a respondent’s previous interview are “fed-forward” within their current interview. This technique was used in ELSA Wave 1 by pre-loading some household and individual level data collected during the HSE into the ELSA questionnaire. Dependent interviewing is said to reduce interview length though this is uncertain. More likely benefits are that it reduces burden by limiting the need to repeat information that will not change between interviews (such as the respondent’s date of birth). In this way it assists with the flow of interview and shows the respondent that the study has regard to information given previously. In particular, it reduces inconsistencies in people’s responses from wave to wave,

National Centre for Social Research
21
thus improving data quality. It reduces trivial errors where, for example, the respondent’s date of birth might be incorrectly recorded at one wave or another or where the same job may be described slightly differently at two points in time, leading to a job being incorrectly coded as new. Dependent interviewing can also reduce seam effects, where respondents’ failure to recall the timing of specific events leads to errors. There are also disadvantages associated with using the answer given at a previous interview to control the wording of a current question or whether or not a question is asked. For example, dependent interviewing may suppress genuine change, effectively ‘anchoring’ respondents to what they have told us in the past. Because of this, dependent interviewing is used where there is an expectation that a response is largely factual (do you still own a Ford Mondeo, registration R?) and is not subject to rapid change. It is possible to identify three main approaches to dependent interviewing. Most of the dependent interviewing carried out in ELSA Wave 1 is termed ‘proactive’, where the interviewer informs the respondent what the survey records show. To illustrate, ‘our records show that last time we interviewed you, you were a school teacher. Are you still a school teacher?’. A small proportion of dependent interviewing used at Wave 1 was ‘reactive’, where information from a past wave is only fed forward if an inconsistency is identified (e.g. where a respondent says they do not smoke, ‘our records show that last time we interviewed you, you did smoke cigarettes. Can I just check, have I understood that correctly?). Finally, some dependent interviewing is only used for routing. For example, some questions are only asked if a respondent has not given a valid response during the previous interview, in this case the HSE, if they were not interviewed, refused or gave an answer of “don’t know”.
3.5 Innovations Some of the measures and approaches used in the study were innovative or new to the UK. One example is the use of unfolding bracket methods to mitigate non-response on financial variables. This is where an answer of “don’t know” or “refuse” was counter-acted by asking respondents whether their answer was higher or lower than a suggested monetary amount. The entry points for unfolding brackets were randomised across cases. This was the first study in the UK to use this technique13. Randomisation was also used at other points during the interview. Firstly it was used for allocating people to sessions (i.e. to control who answers the questions first in a concurrent interview) and then to control which questions were asked – for example which version of a general health question was asked, which word list was used in the cognitive function section, and which version of the “expected housing value” question in the expectations module was asked. Another example of innovation was the use of ‘percentage chance’ questions to understand people’s expectations of the future, also believed to be new to the UK. Sound clips were used in the cognitive function section of the questionnaire. This was to achieve standardisation in the presentation of the word lists (rather than relying on
13 For further information see Marmot et al, 2003 ‘Health and lifestyles of the older population in England: The 2002 English Longitudinal Study of Ageing’, Annex 9.1.

National Centre for Social Research
22
interviewers to read out the words themselves) and to ensure that the time given to respondents was consistent without the interviewer relying on a stopwatch.
4 Fieldwork procedures Fieldwork for Wave 1 began in May 2002. Before starting work, all interviewers underwent a two day personal briefing by a researcher. The briefing covered all fieldwork procedures including training on how to administer the assessments (walking speed and cognitive function), fully explained the documents needed for the study and provided an introduction to all questions within the CAPI interview. Interviewers were provided with written study guidelines to reinforce the briefing. Addresses within the same postcode sector were clustered and issued to a given interviewer. Before starting work, all interviewers were instructed to report to the police station local to where they were working and were expected to show a copy of the ELSA advance letter, leave their name and NatCen’s contact details and explain how long they would be carrying out ELSA interviews in the area. A total of 277 interviewers worked over the course of Wave 1. The average number of achieved interviews conducted by each interviewer was 44, with a minimum of 2 and a maximum of 112.
4.1 Rules for contacting potential ELSA respondents All households eligible for ELSA contained at least one sample member who had agreed to be re-contacted after the HSE interview. All household members were categorised into the following groups: • Individuals that agreed to be re-interviewed at HSE – Most sample members and younger
partners (95%) conducted a full individual HSE interview and agreed to be re-approached. All of these were sent an ‘advance letter’ advising them of the ELSA study, and informing them that an interviewer would be visiting shortly. Their individual HSE data was fed-forward to their ELSA interview. If they had moved or their household had split since the HSE, the ELSA interviewer would attempt to trace and interview them providing they still lived in a private household within England.
• Individuals who had not completed an HSE interview – A minority of individuals (almost 5%) did not complete a full individual HSE interview although a different household member did. An advance letter was not sent to this group, leaving the task of persuasion to the interviewer. As the respondent had not been interviewed at HSE, there was no individual HSE data to feed-forward to the ELSA interview. Like the sample members and younger partners who conducted a full HSE interview, if they had moved or their household had split since the HSE, they were traced by the ELSA interviewer as mentioned above.
• Individuals who refused to be re-approached after taking part in the HSE – A few
individuals (less than 1%) completed a full individual HSE interview but did not agree to be re-approached for a further health survey. Like the individuals who had not completed

National Centre for Social Research
23
an HSE interview, no advance letter was sent, and interviewers were briefed that they should not assume that these individuals would want to take part. On the other hand, it would not have been appropriate to exclude them from the study if they showed an interest. Consequently, the HSE respondents who had previously refused a follow-up (and were still living with an ELSA sample member) were invited to take part in ELSA by the interviewer just as a new partner would. If they agreed to take part in ELSA their individual HSE feed forward data was not used. The rationale behind requesting information from this subgroup is that some analyses will be at the household level requiring details about partners. If these individuals had moved out of the household since HSE (and so were not living with an ELSA sample member who had agreed to be re-approached) they were not traced by the interviewer.
In some instances, individuals were found to be ineligible because of an error in recording their age at the previous contact. These individuals were not interviewed for ELSA. In addition, households that had moved out of England since their HSE interview were treated as ineligible, as were households where all potentially eligible individuals had moved into an institution or had died. These eligibility rules would change in subsequent waves of ELSA, after the baseline survey, as the intention was always to ‘follow’ and interview respondents who move into institutions, as well as to conduct interviews with surviving spouses, partners or other relatives after members of the sample have died.
4.2 Appointments As the ELSA interviews tended to be fairly long, most interviewers made an appointment before conducting the interview. The average number of calls to achieve an interview was 3.3 with a minimum of 1 call and a maximum of 20 calls.
4.3 Proxy interviews A personal interview was attempted with all eligible respondents. If cognitive impairment, physical or mental ill health prevented a respondent from conducting a face to face interview, a proxy interview was attempted. Likewise if the respondent was away in hospital or temporary care throughout the whole fieldwork period, a proxy interview was permitted. However, poor English-speaking skills or reluctance to take part were not a sufficient reason for conducting a proxy interview. The proxy informant (i.e. the person who answered on behalf of the eligible respondent) could be any responsible adult of at least 16 years who knew enough about the respondent’s circumstances to be able to provide information about them. Where possible, a close family member such as a partner, son or daughter was approached, but other people such as carers sometimes fulfilled this role. All proxy interviews included questions on individual demographics (ID), health (HE), work and pensions (WP) and final questions (FQ). However, the three modules asterisked in the table below were asked only in specific circumstances.
HD* Household grid ID Individual demographics HE Health (variant on main module) WP Work and Pensions

National Centre for Social Research
24
IA* Income and Assets HO* Housing FQ Final questions and consents
In cases where there was no-one else in the household eligible for interview, the sections on household demographics and housing were completed as part of the proxy interview. In cases where there was no-one else in the financial unit eligible for interview, the proxy interview included the section on income and assets. If one member of a couple needed a proxy interview, the other member was automatically asked the income and assets section on behalf of the couple when they were interviewed in person. The question normally included, about whether or not they share finances, was not asked. If both members of a couple needed a proxy interview, the section on income and assets was only asked in one of their proxy interviews, and referred to both of their finances. For single people requiring a proxy, income and assets was always asked as part of the proxy interview. The length of the proxy interview was much shorter than the main interview when held in person.
4.4 Quality checking of the interviews One in 10 respondents were contacted by telephone to verify key details given in the interview.
4.5 Tracing rules When the whole household had moved since the HSE interview, or a specific sample member who had consented to be re-approached in future had moved away, interviewers were directed to attempt to find a follow-up address. Interviewers approached the present occupants, neighbours, or friends etc. to obtain the new address. They were not expected to consult electoral registers, phone books or other public records. A “mover letter” was offered if interviewers identified a member of the public who was aware of the sample member’s new address but was reluctant to reveal it to the interviewer. This letter, which was forwarded with a prepaid envelope by the member of the public who had been identified, asked the sample member to contact the office with their new address. If in-field tracing was unsuccessful, a three-stage approach was used to trace sample Members. 1. General Practitioner approach – In the HSE, respondents are asked for the name and
address of their family doctor or General Practitioner (GP). The GPs of respondents who could not be traced at ELSA were sent a letter explaining the situation and asking them to forward on to the respondent an opt-in advance letter and a respondent information pack. GPs were asked to send back a reply slip stating what action they had taken. On receiving the opt-in advance letter, respondents were asked to send back a reply slip giving details of their address. The address was then assigned to an interviewer so they could attempt to conduct the interview.

National Centre for Social Research
25
2. Health Authority approach – This approach was used when there were not sufficient details about the respondent’s GP, or when approach (1) was unsuccessful. The National Health Service Central Register (NHSCR) was used to establish the sample member’s Health Authority, with the assistance of the Office for National Statistics. A letter was sent to the Health Authority explaining the situation and asking them to firstly forward on a pack to the respondent’s GP and secondly return a reply slip telling us what action they had taken. The GP and respondent then received their packs in turn through the same mechanism as outlined in approach (1).
3. Department for Work and Pensions approach – For cases where (1) and/or (2) were
unsuccessful, the Department for Work and Pensions (DWP) agreed to help with tracing using their state pension databases. The respondent’s name, date of birth and address at HSE were provided to DWP and they matched this to their databases in order to identify the most up-to-date contact details for the respondent. If a new address was found, an advance letter was sent to the respondent at this address.
4.6 Attempts to include all respondents and maximise response Various attempts were made to encourage participation among the sample, including the measures in Box 4.1 below.
Box 4.1. Methods of encouraging response
Each respondent was sent an advance letter and given an information leaflet. The advance letter offered an incentive payment in the form of a £10 gift voucher which was provided at the end of the ELSA interview. Interviewers initially made contact by personal visit with respondents. Interviewers were asked to make at least four calls at varying times of the day and on different days of the week (with at least one call at the weekend). Interviewers were asked to return to the address a few weeks or months later if they found someone to be temporarily away, or if one of the sample members was unwell at the time of their first visit. In cases where households had split, interviews were sought at both the old and the new households to ensure that all eligible individuals had a chance to respond. Ten additional households were identified as a result of splits of this kind. In cases where an eligible sample member had moved and the new occupant was reluctant to provide the address of their predecessor, interviewers provided a ‘mover letter’, which could be forwarded by the new occupant to the individual, asking them to make contact with the survey organisers.

National Centre for Social Research
26
A thorough strategy for tracing and contacting eligible individuals who had moved since their last interview was developed. This involved requesting the co-operation of respondents’ family doctors (by approaching them directly where this information was known), Health Authorities and family doctors (through the auspices of the Office for National Statistics) and the Department for Work and Pensions. In cases where an eligible individual was unable to participate in the interview due to a cognitive, physical or mental impairment, an interview with a proxy informant was attempted. Many households for which the first interview attempt had not been successful were reissued to another interviewer. The second approach was preceded by a new letter, explaining the importance of interviewing respondents in the respondent’s age bracket. The letter offered a £20 gift voucher. Self-completion questionnaires that had not been returned by respondents were also followed up. These respondents were first sent a reminder letter with a new questionnaire and, if this was unsuccessful, they were then called by the NatCen Telephone Unit who offered to complete the questionnaire with the respondent by telephone.
4.7 Editing and coding A code-frame was developed for open-ended variables. Questions with “other” answers were ‘back-coded’ to the original answer codes where possible. A few new answer codes were generated for common “other” answers which did not fit existing codes. The code book and editing instructions can be viewed at the UK Data Archive (www.data-archive.ac.uk, study number 5050).
4.8 Feedback to participants Strategies were developed after the Wave 1 interview to keep in touch with respondents. Soon after the interview, a thank you letter was posted, and a Christmas card was sent in December 2002 to those who had already been interviewed, which included a refrigerator magnet. A further Christmas Card was sent in 2003 and subsequent years. A respondent website (www.natcen.ac.uk/elsa) was set-up with information about Wave 1 of ELSA. Participants were also sent a summary of the key Wave 1 findings in the post, near the time of the launch of the study findings, with a letter of thanks from the Principal Investigator.

National Centre for Social Research
27
5 Fieldwork response at Wave 1 This chapter presents information about the fieldwork response rates achieved at Wave 1 and corresponds with those published in the full report of the survey (Marmot et al, 2003). It shows the progress of the sample whose selection was described in Chapter 2. The chapter begins with definitions of the fieldwork response rates of interest (Section 5.1). It provides a summary of the total interviews achieved and some indicators of data quality such as the number of proxy and partial interviews (Section 5.2) as well as the level of module and item non-response (Section 5.3). It then builds on the tree diagram presented in Figure 2-1 and sets out the stages of response and the reasons given for ineligibility (Section 5.4). The final section provides the fieldwork contact, co-operation and household response rates for sample members (who are the main group of interest), as well as the individual response rates for sample members and for partners (Section 5.5). This chapter focuses exclusively on response during the fieldwork period and is based on the issued sample. It does not take account of other groups, such as individuals who were not issued to field, perhaps because the household did not respond at HSE or refused to be re-contacted subsequently. A broader discussion of response to the study as a whole, which takes account of these other important groups, is presented in Chapter 6.
5.1 Defining response The way that eligibility for a survey is defined affects the response rate calculation. The response rates presented here are based on the AAPOR (American Association for Public Opinion Research) standard definitions.14 They have been calculated from a number of sources: outcome codes from fieldwork, sampling re-contact information15 and mortality updates16. In order to be clear about how response is calculated, we describe who is ineligible and set out how we treat subgroup of individuals whose eligibility is unknown. The definitions of the contact, co-operation and response rates are presented later in the chapter.
Ineligibility Individuals who were thought to be eligible for an interview as a sample member or younger partner prior to fieldwork could be reclassified as ineligible if it became known that they had died17, moved into an institution, or moved outside England. Additionally some individuals were found to be ineligible because of an error on the sampling frame, where their age or relationship with other household residents had been recorded incorrectly. The response rates presented below exclude ineligible individuals.
14 Note that there are some differences which are country-specific. For example, in the UK the Postcode Address File is often used as a sampling frame whereas in the US area sampling is often used for face-to-face surveys which is likely to result in lower rates of ineligible and unknown eligibility in the US. 15 This is ad hoc information held by the Operations Department about the sample to assist re-contact. 16 This was information about deaths of HSE respondents who had agreed to have their records linked to the National Health Service Central Register and was provided by the Office of National Statistics (ONS). This mortality data provided information about deaths before the start of fieldwork which were used to determine eligibility. 17 Deaths identified by interviewers during fieldwork and from mortality updates after fieldwork, were taken into account when calculating response.

National Centre for Social Research
28
Unknown eligibility It is good practice to isolate the sub-group of individuals whose eligibility is unknown so that they can be split into two groups; those likely to have been eligible for interview and those likely to have been ineligible. Response rates can be adjusted to include the sub-group of individuals ‘unknown, but likely to be eligible’. For the ELSA sample, the proportion of outcomes with unknown eligibility is small and the proportion of the issued sample that are known to be ineligible is small. Therefore we assume that most of the sub-group with unknown eligibility are in fact eligible. Different assumptions would not affect the response rate significantly.
5.2 Full, proxy and partial interviews achieved Over the fieldwork period 12,100 interviews were conducted. The majority of these (11,392) were with core members (Table 5-1) but a significant number of interviews were conducted with new and younger partners (708). These partner interviews will be used to supplement the data collected from the core members and to understand behaviour within a couple or household.
Table 5-1 Total interviews achieved
Sample type Total interviews Core Member (CM) 11,392 Younger Partner (YP) 636 New Partner (NP) 72 Total 12,100
The age-sex profile of the achieved sample is given below (Table 5-2). A brief comparison of the issued and achieved distributions shows that the Wave 1 respondents under-represent the oldest age group for both men and women. There may be other significant differences in characteristics. A wider discussion of non-response is found in Chapter 6.
Table 5-2 Achieved sample, by age and sex18
Ageband (years) at W1
Male Female Total Male
% Female
% Total
% Under 50 125 535 660 2 8 5 50-54 1019 1223 2242 19 18 19 55-59 1001 1127 2128 19 17 18 60-64 800 892 1692 15 13 14 65-69 803 882 1685 15 13 14 70-74 659 782 1441 12 12 12 75-79 477 591 1068 9 9 9 80-84 292 477 769 5 7 6 85+ 160 255 415 3 4 3 Total 5336 6764 12100 100 100 100
18 The difference between this table and Table 9.2 in the main ELSA report is due to the way age has been defined. Here age is defined as age at the start of Wave 1 fieldwork, whereas the table in the main ELSA report refers to age at interview.
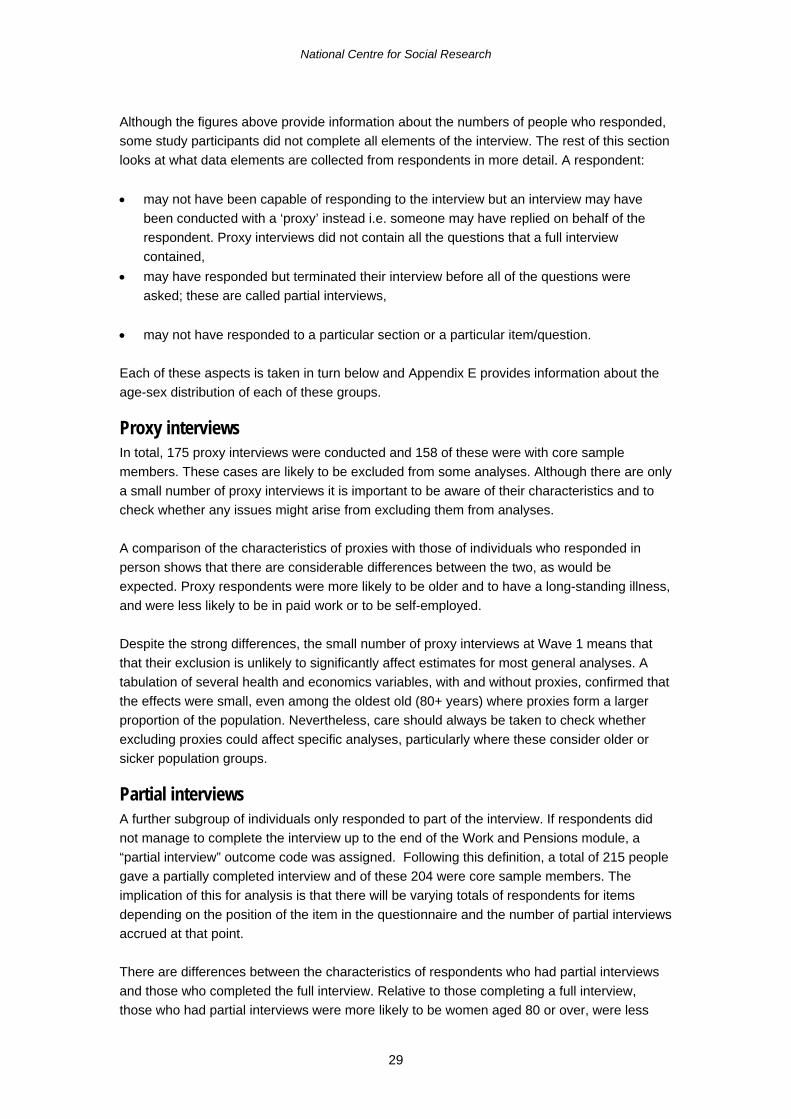
National Centre for Social Research
29
Although the figures above provide information about the numbers of people who responded, some study participants did not complete all elements of the interview. The rest of this section looks at what data elements are collected from respondents in more detail. A respondent: • may not have been capable of responding to the interview but an interview may have
been conducted with a ‘proxy’ instead i.e. someone may have replied on behalf of the respondent. Proxy interviews did not contain all the questions that a full interview contained,
• may have responded but terminated their interview before all of the questions were asked; these are called partial interviews,
• may not have responded to a particular section or a particular item/question. Each of these aspects is taken in turn below and Appendix E provides information about the age-sex distribution of each of these groups.
Proxy interviews In total, 175 proxy interviews were conducted and 158 of these were with core sample members. These cases are likely to be excluded from some analyses. Although there are only a small number of proxy interviews it is important to be aware of their characteristics and to check whether any issues might arise from excluding them from analyses. A comparison of the characteristics of proxies with those of individuals who responded in person shows that there are considerable differences between the two, as would be expected. Proxy respondents were more likely to be older and to have a long-standing illness, and were less likely to be in paid work or to be self-employed. Despite the strong differences, the small number of proxy interviews at Wave 1 means that that their exclusion is unlikely to significantly affect estimates for most general analyses. A tabulation of several health and economics variables, with and without proxies, confirmed that the effects were small, even among the oldest old (80+ years) where proxies form a larger proportion of the population. Nevertheless, care should always be taken to check whether excluding proxies could affect specific analyses, particularly where these consider older or sicker population groups.
Partial interviews A further subgroup of individuals only responded to part of the interview. If respondents did not manage to complete the interview up to the end of the Work and Pensions module, a “partial interview” outcome code was assigned. Following this definition, a total of 215 people gave a partially completed interview and of these 204 were core sample members. The implication of this for analysis is that there will be varying totals of respondents for items depending on the position of the item in the questionnaire and the number of partial interviews accrued at that point. There are differences between the characteristics of respondents who had partial interviews and those who completed the full interview. Relative to those completing a full interview, those who had partial interviews were more likely to be women aged 80 or over, were less

National Centre for Social Research
30
likely to be younger and were less likely to be younger partners. There are relatively more respondents with partial interviews who were males aged 60-64 years, and females aged 65-69 years compared to those completing a full interview in person.
5.3 Module and item non-response In addition to the overall level of response, an analysis of the level of response to key sections within the survey questionnaire was conducted19. However it should be recognised that in the ELSA interview, not all sections of the interview required responses from every individual. The household demographics and the housing sections were asked at a household level, that is, one individual was asked to respond on behalf of the household. The income and assets section was asked at a financial-unit level, that is, one individual from each financial unit was asked to respond on behalf of the whole financial unit. The sections asked at an individual level were split into those that could be asked concurrently20 (individual demographics, health, work and pensions, and social participation) and those that were asked privately21 (cognitive function, psychosocial health, expectations, and final questions). As a result, response rates for different elements of the study are based on different bases. Table 5-3 gives the response rates for three key sections.
Table 5-3 Response rates to key sections of the interview
Section Total eligible Level Respond
(%) Non-respond
(%) Housing22 7913 Household 99.6 0.4 Income & assets23 8582 Financial unit 99.9 0.1 Self-completion24 11234 Individual 92.0 8.0
The analysis shows that the levels of response for the housing and the income and assets sections were very high (99.6% and 99.9% respectively). The level of response for the self-completion (92.0%) was very good in survey terms, but for the purpose of analysis was sufficiently low to warrant some further investigation.25 The conclusion was, however, that it was not necessary to include any weighting to account for non-response for the purpose of
19 A household or financial unit or individual was classified as responding if data was available for the nominated unit and key questions asked of all respondents within the module were not missing. 20 With the individual’s partner present when the individual has a partner. Both individuals were asked to respond to the same set of questions one after the other, i.e. concurrently, before moving on to the next set of questions (see Section 3.2). 21 With no other person present. 22 The housing section response rate uses all households containing at least one responding sample member as a base. 23 The income and assets section has a response rate calculated at the financial unit level which includes all financial units that contain at least one responded sample member. 24 The calculation of the self-completion response rate uses a base of all sample members who responded in person (proxy respondents were excluded because they were not invited to respond to this section). 25 A comparison was made of the characteristics of the sub-group who responded to the self-completion and the sub-group who did not respond to the self-completion. Significant differences in the characteristics of the two sub-groups suggested that weighting is necessary to try to account for any bias caused by the differences. A weight has been made available.

National Centre for Social Research
31
general analyses but that future analysts should take care to check whether non-response to the self-completion needed to be accounted for.
Item non-response in financial information Item non-response is the term used to describe missing information from any one data item or question, for example when an individual does not give their date of birth. Whilst it is possible that all data items may suffer from non-response there is an expectation that questions about an individual’s finances will suffer from high levels of item non-response. We have restricted the discussion and analysis to financial information because it is expected to exhibit higher levels of item non-response than most other items and is, therefore, likely to represent the ‘worst case'. Furthermore, a strategy was implemented to try to overcome the item non-response within the economic sections of the questionnaire, involving the use of ‘unfolding brackets’. This strategy is described here. Each financial variable in ELSA is collected by initially requesting an exact answer and then following up with a series of what are commonly referred to as ‘unfolding brackets’. Unfolding brackets operate by asking respondents who are unable or refuse to give an exact answer a series of follow-up questions designed to elicit a minimum and a maximum number defining a range or ‘closed band’ within which the value lies. So, for example, if a respondent did not know how much the last payment they received from a particular pension was, then they would have been asked an unfolding bracket question such as “Was it less than £600, more than £600, or what?” If the respondent said they received “less than £600”, then they could have been asked “Was it less than £300, more than £300, or what?” In a small number of cases, individuals are able to provide a minimum value but not a maximum, and these individuals, along with those who are in the highest bracket, end up in a band that does not have a maximum, which we refer to as an ‘open band’. The amount referred to in the first unfolding bracket question for each financial variable was randomly ordered for each respondent. Therefore, any possible anchoring effects from the procedure were averaged across the distribution, and the bracket values were selected to fall at the 25th, 50th, 75th and 99th percentiles of the density of the underlying financial variable. Unfolding brackets significantly reduce the number of observations for which we have no information on any one source of income or wealth. Nevertheless, some cases remain (for example, if the respondent refused to or could not answer the unfolding bracket questions), which means that for each financial variable we have a varying quality of data: continuous (exact answer given by respondent), closed-band, open-band or missing.26 Tables in Appendix F report the percentages of cases that fall into each of the categories of data quality. The missing cases are split into cases where there is no information at all on that variable (‘missing completely’) and cases where we know that the individual has some income 26Banded information can also arise when only one member of a couple responds to the survey. The wealth and income data are imputed at the benefit-unit level (a single person or a couple, plus any dependent children that they have), therefore information on income and wealth is ascertained from both members of the couple. This is done by generating banded information for the couple, using the wealth of the responding member as the minimum of an open-band classification for the couple.
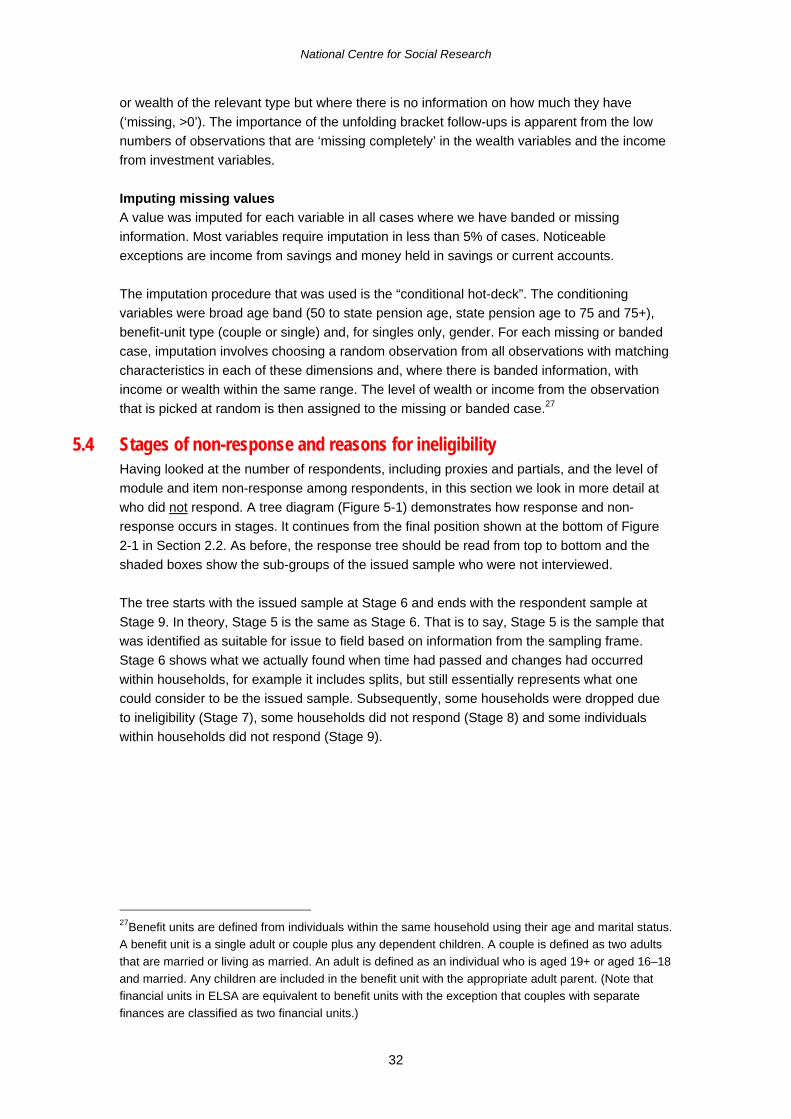
National Centre for Social Research
32
or wealth of the relevant type but where there is no information on how much they have (‘missing, >0’). The importance of the unfolding bracket follow-ups is apparent from the low numbers of observations that are ‘missing completely’ in the wealth variables and the income from investment variables. Imputing missing values A value was imputed for each variable in all cases where we have banded or missing information. Most variables require imputation in less than 5% of cases. Noticeable exceptions are income from savings and money held in savings or current accounts. The imputation procedure that was used is the “conditional hot-deck”. The conditioning variables were broad age band (50 to state pension age, state pension age to 75 and 75+), benefit-unit type (couple or single) and, for singles only, gender. For each missing or banded case, imputation involves choosing a random observation from all observations with matching characteristics in each of these dimensions and, where there is banded information, with income or wealth within the same range. The level of wealth or income from the observation that is picked at random is then assigned to the missing or banded case.27
5.4 Stages of non-response and reasons for ineligibility Having looked at the number of respondents, including proxies and partials, and the level of module and item non-response among respondents, in this section we look in more detail at who did not respond. A tree diagram (Figure 5-1) demonstrates how response and non-response occurs in stages. It continues from the final position shown at the bottom of Figure 2-1 in Section 2.2. As before, the response tree should be read from top to bottom and the shaded boxes show the sub-groups of the issued sample who were not interviewed. The tree starts with the issued sample at Stage 6 and ends with the respondent sample at Stage 9. In theory, Stage 5 is the same as Stage 6. That is to say, Stage 5 is the sample that was identified as suitable for issue to field based on information from the sampling frame. Stage 6 shows what we actually found when time had passed and changes had occurred within households, for example it includes splits, but still essentially represents what one could consider to be the issued sample. Subsequently, some households were dropped due to ineligibility (Stage 7), some households did not respond (Stage 8) and some individuals within households did not respond (Stage 9).
27Benefit units are defined from individuals within the same household using their age and marital status. A benefit unit is a single adult or couple plus any dependent children. A couple is defined as two adults that are married or living as married. An adult is defined as an individual who is aged 19+ or aged 16–18 and married. Any children are included in the benefit unit with the appropriate adult parent. (Note that financial units in ELSA are equivalent to benefit units with the exception that couples with separate finances are classified as two financial units.)

National Centre for Social Research
33
Figure 5-1 Response tree
All ELSA HH containing 1+ age-eligible individual
11,373 householdscontaining 18,563 individuals
ELSA HH dropped(ineligible)
296 householdscontaining 357 individuals
Responding HH(at least 1 CM/YP/NP responding)
7,935 householdscontaining 12,942 individuals
Non-responding HH
3,438 householdscontaining 5,621 individuals
Individuals dropped(ineligible)
340
New HH91 households
containing 96 individuals
HH issued11,577 households
containing 18,824 individuals
Respondingindividuals
12,099
CM = 11,392YP = 635NP = 72
Non-respondingindividuals
502
Stage 6
Stage 7
Stage 8
Stage 9 RespondingindividualNot issued
became eligible
YP = 1
Put another way, at the top of the response tree is the post-fieldwork representation of the issued sample (Stage 6). Whilst the sampling frame described the issued sample as 11,578 households containing 18,813 individuals, during fieldwork it became clear that there were actually 11,577 households that could be considered ‘original’ and 91 that could be seen as split or newly formed households. This gave a total of 11,669 households containing 18,920 individuals. Households not in the original HSE sampling frame are labelled as ‘New HH’ in Stage 6. During fieldwork some households and individuals were found to be ineligible (Stage 7). Non-responding households and individuals are shown at Stages 8 and 9.
Ineligibility Before looking at the respondents in more detail, sample members who became ineligible are reviewed. 785 sample members identified in the sampling frame had become ineligible at the time of fieldwork (shown in Table 5-428). The overwhelming reason for becoming ineligible was through death (81%). This is not surprising given the age of the sample. Some individuals had moved into an institution, most likely a residential or nursing home (10%), and others had moved out of England (5%). Younger partners followed a similar trend: 85% died, 5% moved into an institution and 10% other reason.
Table 5-4 Reason for ineligibility: sample members Reason Frequency % Death 634 81 Moved into an institution 75 10 Moved out of England 42 5 Other 34 4
28 The 785 ineligible sample members have been expressed differently in Figure 5-1 response tree.

National Centre for Social Research
34
Total 785 100
5.5 Wave 1 fieldwork response rates Finally, we move on to consider the contact, co-operation and response rates. There are two ways of looking at response rates for the ELSA sample. Firstly, because the sample is derived from a sample of households and non-response can occur at the household level, the household response rate can be calculated and subsequently the individual response rate within responding households. Secondly, as ELSA is ultimately a sample of individuals, the individual response rate can be calculated. One of the most interesting ways of looking at response is to consider performance at a given wave, where the focus rests on fieldwork activity and the willingness of sampled individuals to take part. Indeed, it may be misleading to evaluate the quality of fieldwork using a broader study response rate (as discussed in Chapter 6) because interviewers are not given the opportunity to interview all non-respondents. For example, Section 2.2 described the sub-group of age-eligible individuals that was not issued at Wave 1 because the individuals in question had refused to give permission to be re-contacted; these individuals are effectively treated as ineligible when considering fieldwork response rates. There are four measures which successfully summarise fieldwork activity and are based on the sub-group who were issued to field. In all four instances, respondents are defined as those who gave a full or partial interview either in person or by proxy. The following sections cover the four measures sequentially; fieldwork household contact rate for sample members, fieldwork co-operation rate for individual sample members, fieldwork household response rate for sample members, fieldwork individual response rate for sample members, and finally the fieldwork individual response rate for partners.
Fieldwork household contact rate - sample members The fieldwork contact rate is calculated by dividing the number of households where the interviewer made contact with at least one member of the sample, by the number of eligible households found during fieldwork (that is, issued plus newly formed households). This is an indicator of the combined quality of the contact details from the sampling frame and the processes used to track movers. We are interested here in sample members only. At Wave 1, the household contact rate was 95%. The reason given for three quarters of non-contacts was that the household had moved but could not be traced. Separate analyses show that around a tenth of issued households had moved house by the Wave 1 fieldwork period. Two thirds of the movers were eventually traced (see tracing rules described Section 4.5 ). The contact rate is broken down by HSE source year in Appendix G.
Fieldwork individual co-operation rate - sample members The fieldwork co-operation rate is calculated by dividing the number of achieved individual interviews by the number of eligible individuals identified by interviewers in households where contact was established. Here we look specifically at the behaviour of sample members. The co-operation rate was 70%. The co-operation rate is broken down by HSE source year in Appendix G.

National Centre for Social Research
35
Fieldwork household response rate - sample members The fieldwork household response rate is calculated by dividing the number of households containing at least one achieved interview by the number of eligible households found during fieldwork (that is, issued plus newly formed households). Again, we look specifically at sample members. Table 5-5 provides details of the response at the household level. A small percentage of households in the issued sample were reclassified as not containing any eligible individuals (3%). A household response rate of 70% was achieved. The majority of non-responding households refused to participate (22% of the eligible sample of households), while a smaller proportion could not be traced (4%) or were not interviewed for other reasons (3%). The response rate is broken down by HSE source year in Appendix G. Table 5-5 Household fieldwork response: sample members
Frequency29 % of issued % of eligible
Total issued (households) 11667 100 Ineligible30 296 3 Total eligible 11371 97 100 Respond 7935 70 Non-respond 3436 30
Non-respondents 3436 30 No contact 138 1 Refuse 2499 22 Moved – unable to trace 429 4 Other 370 3
Most of the non-response occurred at the household level. Since the individual response rate within responding households is very high a detailed analysis is omitted. Only a small percentage of individuals within the 7935 responding households were reclassified as ineligible (3%). Of the remaining sample of individuals within responding households, a response rate of 96% was achieved. Non-response within households was almost always because of refusal to take part.
Fieldwork individual response rate - sample members The fieldwork individual response rate is calculated by dividing the number of achieved individual interviews by the number of eligible issued individuals. Here we look at the fieldwork individual response rate for sample members and in the next section we look at younger partners. The individual level response rate shows that a small percentage of the issued sample (4%) were reclassified as ineligible (Table 5-6). These cases were set aside before the individual response rates were calculated. In total, a response rate of 67% was achieved. Again this shows that a small proportion of non-productive interviews were the result of movers remaining untraced (3% of the eligible sample of individuals) but the majority of the non-
29 25 single-person households have been included that were accidentally omitted from Table 9.3 in the main ELSA report. Households were either ineligible or eligible but non-responding. 30 Includes one postcode sector not covered by fieldwork for safety reasons.

National Centre for Social Research
36
respondents were refusers (25%). The response rate is broken down by HSE source year in Appendix G.
Table 5-6 Individual fieldwork response rate: sample members Frequency31 % of issued % of eligible
Total issued (individuals) 17768 100 Ineligible32 785 4 Total eligible 16983 96 100 Respond 11392 67 Non-respond 5591 33
Non-respondents 5591 33 No contact 237 1 Refuse 4284 25 Moved – unable to trace 532 3 Other 538 3
Fieldwork individual response rate - partners Here we consider the response rates of the new and younger partners. Neither are considered to be part of the main sample but their response rate, as a separate subgroup, is of interest. Further details can be found in Appendix G. Only the individual response rates are given. The percentage of younger partners reclassified as ineligible was similar to that of sample members. A slightly lower response rate, of 63%, was achieved. Although younger partners were treated in the same way as sample members, they may have felt that they were not the focus of the study about ‘ageing’ and that it had less salience. The components of non-response among younger partners were similar to those for sample members but the sample size is too small to make detailed comparisons. The response rate for new partners is largely conjecture because new partners are only discovered in responding households. Nevertheless new partners seemed as likely to respond to the survey as sample members (with a response rate of 68% compared with 67% for sample members).
31 25 single-person households have been included that were accidentally omitted from Table 9.5 in the main ELSA report. Individuals were either ineligible or eligible but non-responding. The ineligibility definition has also been corrected. 32 Includes one postcode sector not covered by fieldwork for safety reasons.

National Centre for Social Research
37
6 Study response In this chapter we take a step back to look at the response at Wave 1 and how it can be understood in a wider context. In particular, we expand our focus to include more than the sub-group of the sample who had the opportunity to take part in the study. This includes households that did not agree to be re-contacted at the end of the HSE interview and who were not, consequently, issued to field. The way in which the response rates for these different sub-groups fit together and compare to the whole sample is documented in Appendix H. Furthermore, to help understand the progress of the sample over the lifetime of the study a timeline of significant events is set out in Figure 6-1 below. Each box represents a separate point in the study. Along the time line, two types of information have been superimposed: (1) the number of sample members remaining and (2) a variety of response rates. An explanation of each aspect of the figure is attempted throughout the rest of the chapter. To give an example, the fieldwork household response rate of 70% presented in Table 5-5 above is shown on Figure 6-1 as the last of the five arrows, and the fieldwork individual response rate of 67% presented in Table 5-6 is shown as the fourth arrow down on Figure 6-1.
6.1 Response at Wave 1 taking account of all those eligible There are a number of similarities between this calculation of response and the one presented in Chapter 5. This measure uses the same definition for being a respondent (those who gave a full or partial interview either in person or by proxy). Similarly the calculation used sampling re-contact information and fieldwork outcomes updated with external mortality information provided by ONS to identify individuals that had died before fieldwork as accurately as possible. Also, as before, age-eligible individuals could become ineligible if it became known that they had died, moved into an institution, moved outside England or if there was an error on the sampling frame. The eligibility criteria differs in one important way – those living in HSE co-operating households who had refused to be re-interviewed beyond HSE (and were not issued) have been classified as eligible here. The individual response rate at Wave 1 for sample members is 61% (calculated by dividing the number of achieved individual interviews by the number of eligible individuals within eligible households). This is shown in Table 6-1 and illustrated as the third of the five arrows in Figure 6-1.
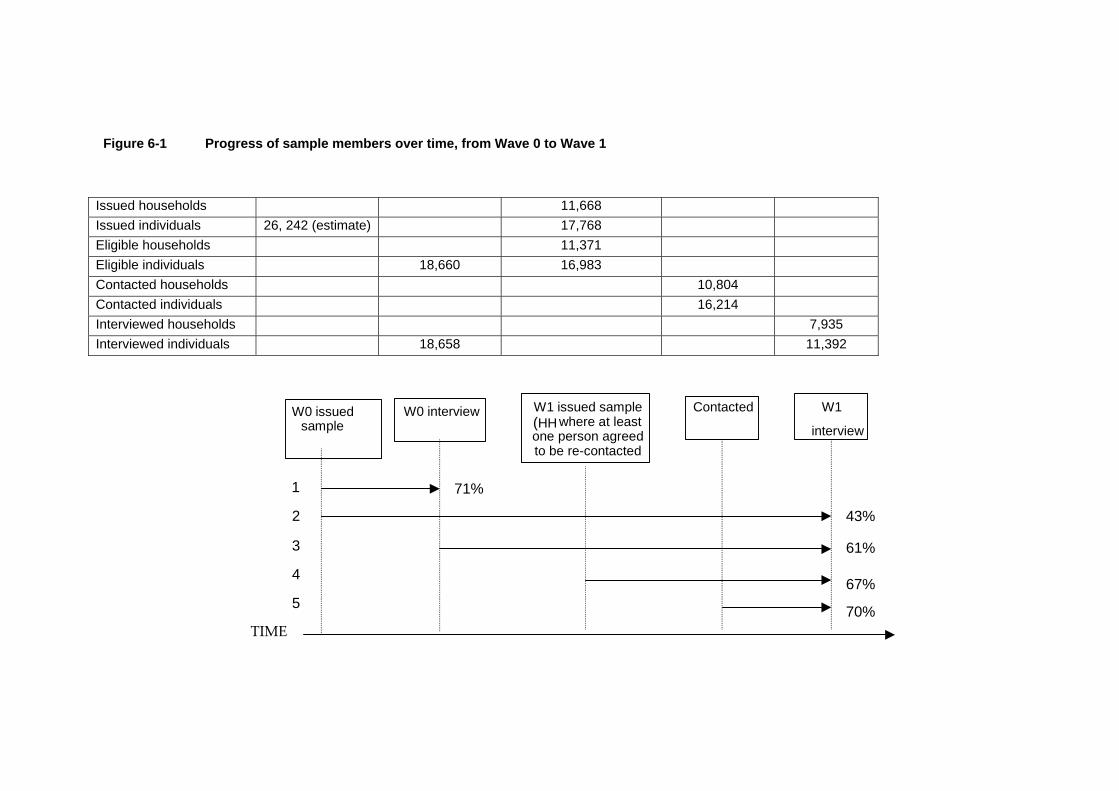
Figure 6-1 Progress of sample members over time, from Wave 0 to Wave 1
Issued households 11,668 Issued individuals 26, 242 (estimate) 17,768 Eligible households 11,371 Eligible individuals 18,660 16,983 Contacted households 10,804 Contacted individuals 16,214 Interviewed households 7,935 Interviewed individuals 18,658 11,392
W0 issued
sampleW0 interview W1 issued sample
(HH where at least one person agreed to be re-contacted
Contacted W1
interview
TIME
71%
61%
43%
67%
70%
1
2
3
4
5


Table 6-1 Individual response rate: sample members Frequency % of issued % of eligible
Total age-eligible (individuals) 19924 100 Ineligible 1264 6 Total eligible 18660 94 100 Respond 11392 61 Non-respond 7268 39
Non-respondents 7268 39 No contact 237 1 Refuse 5960 32 Moved – unable to trace 532 3 Other 539 3
Table 6-1 shows that 1,264 sample members identified in the sampling frame had become ineligible at the time of fieldwork. The reasons are given in Table 6-2. The reasons are distributed in similar proportions to those described in the fieldwork response section, with the exception that there is a higher proportion who became ineligible because they had died.
Table 6-2 Reason for ineligibility: sample members Reason Frequency % Death 1113 88 Moved into an institution 75 6 Moved out of England 42 3 Other 34 3 Total 1264 100
7,268 sample members were eligible but did not respond. The reason for the majority of non-response was refusal to participate. A small percentage moved but could not be traced and a smaller percentage could not be contacted during the fieldwork period. The efforts made to contact and follow movers are reflected in the low percentages of non-contacts and untraceable movers. The category ‘other’ are reasons such as being too sick during the interview period and there being no suitable proxy informant, language difficulties, or being away during the survey period. A full analysis of the non-respondents was conducted to evaluate the possibility of non-response bias (see Section 6.5).
Comparison with fieldwork response rate The response rate given here is lower than the fieldwork response rate. This is because the rate given here takes into account non-respondents who were not issued (classified as refusals because they refused to be re-interviewed after HSE).
6.2 Response at Wave 0 (HSE) The ELSA study began at Wave 1 when baseline data was collected although the sample was drawn from households that had previously responded at HSE. It is vital to consider the non-response at HSE since this was the origin of the sample. The Wave 0 response rate is estimated below, followed by an assessment of sample representativeness. The left hand side of the diagram (Figure 6-1) shows the start of the sample process where addresses were issued for the W0 sample.
National Centre for Social Research
41
Although the HSE response rate is published for each HSE survey year, the rates for the full HSE sample are not strictly applicable for ELSA since they relate to the general population rather than adults aged 50 plus years. Interrogating the three HSE source years shows that sample members have a 2.8% average higher response rate in co-operating households compared to all adults. An estimated response rate has been calculated by applying this difference to the published HSE response rates for each source year and then weighting the rates for each year to reflect the proportion of the sample taken from each. As a consequence, the response rate at Wave 0 for sample members is estimated as 71%. This is illustrated on Figure 6-1 as the first of the five arrows.
6.3 Sample representativeness at Wave 1 The response rates provided so far can be seen as a measure of quality of the responding sample. However, to get a better idea of the extent of dropout since the original (population-representative) sample was drawn, it is necessary to establish the proportion of the sample who were asked to participate at Wave 0 that remain in the sample after Wave 1 fieldwork. This can only be estimated since the number of eligible individuals is not known exactly (see the discussion of unknown eligibility in Section 5.1 above). We estimate that 46% of 50+ year olds issued at Wave 0 have remained in the sample after Wave 1 fieldwork. It is worth noting that this is not the same as the longitudinal response rate which takes into account the eligibility criteria for ELSA.
6.4 Longitudinal analysis Strictly speaking Wave 1 is the first wave of the ELSA study but some analysts will also use data collected from the HSE (Wave 0). In this instance, the sub-group of interest would be those who were eligible and responded to both interviews. Within households co-operating at Wave 0, 94% of 50+ year olds responded to Wave 0. This shows that most of the Wave 1 respondents also responded to Wave 0. For an assessment of the quality of the combined data a longitudinal response rate would need to be calculated.
Patterns of response The patterns of response across the two waves so far are set out here. Figure 6-2 represents the combinations of responses to the main interviews conducted. It also shows which sub-groups will be followed up in the next wave. In the figure, Wave 0 is comprised of co-operating households for whom age information was available and of non-cooperating households. The ELSA sample was drawn from the co-operating households. The non-respondent households are shown for completeness, with an estimate of the number of 50+ year olds residing within them.

National Centre for Social Research
42
Figure 6-2 Response across waves for sample members
Wave 0 (HSE) Wave 1 Respond
18,658 Respond
11,206 Follow up
Non-respond
6,228
Ineligible
1,224 Non-respond
1,266 Respond
186 Follow up
Non-respond
1,041
Ineligible
39 Non-respond
6,318 (estimate)
Subsequent waves All Wave 1 responding individuals will be approached for an interview at Wave 2. Higher rates of response are hoped for, for individuals re-contacted in future waves. This group is the ‘baseline sample’ for ELSA. However during Wave 2 there will be the potential to interview non-responders in those households. A pre-fieldwork check will be conducted to identify people who have died or moved out of Great Britain. From Wave 3 onwards the whole of the baseline sample living in Great Britain will be approached for interviews regardless of their response status at Wave 2.
HS
E c
oope
ratin
g ho
useh
olds
H
SE
non
-coo
pera
ting
hous
ehol
ds

National Centre for Social Research
43
Implications for analyses - weighting When data are not weighted, each respondent is treated as being equally important. However the respondents may not represent the population exactly. If certain types of households or individuals were more or less likely to participate in ELSA then the non-response cannot be considered to be random and failure to take this into account may mean that the analysis of the respondents may not represent the intended population. Weights can be calculated to increase the importance of respondents who are under-represented in the data. The main aim of the weighting for ELSA is to try to reduce any bias from non-response and to be confident that the respondent sample is representative of the population. The equal probability sample design of the HSE samples, and the fact that the ELSA sample selected all eligible adults from the HSE, eliminate any need for weights to account for selection probabilities. However, non-response at HSE, refusals to be re-interviewed post-HSE and non-response at ELSA Wave 1 all have the potential to make the ELSA respondent sample unrepresentative of the population. In addition, the original complex sample design of the HSE samples has to be incorporated. The HSE weighting strategy is described briefly in Section 6.5. A thorough analysis of non-response was conducted for ELSA to examine the different stages of drop-out and the extent of the drop-out at each stage. A technique called ‘calibration weighting’ was used to produce the weights. The two stages of the process are described in sections 6.6 and 6.7 below. The effect of the weights and the complex sample design for key estimates is shown in sections 6.9 and 6.10.
6.5 HSE weights The equal probability sample design of the HSE samples eliminates any need for weights to account for selection probabilities. Until recently there was no weighting strategy to account for non-response at HSE. A weighting strategy was being developed at the same time as the ELSA weighting strategy. The developing HSE strategy considered each stage that non-response could occur to evaluate whether weighting was needed and the factors that could be used to predict non-response at each stage. The ELSA strategy was informed by the on-going analysis of HSE non-response.
6.6 Analysis and modelling of non-response For the non-response investigation our attention is restricted to the analysis sample i.e. core members. The age-sex profile of core member respondents is given in Table 5-9. When the sample profile is compared to the population (given in Appendix I) it is clear that younger men (50-54 years) are under-represented as are the oldest women (85+ years). The respondents also over-represent 55-59 year old women and 65-74 year old men. There are a number of stages prior to the Wave 1 interview where these differences may have arisen.

National Centre for Social Research
44
Table 6-3 Achieved sample of core sample, by age and sex
Ageband (years) at W1
Male Female Total Male
% Female
% Total
% 50-54 1015 1215 2230 20 20 20 55-59 991 1121 2112 19 18 19 60-64 795 889 1684 15 14 15 65-69 802 877 1679 15 14 15 70-74 655 780 1435 13 13 13 75-79 477 591 1068 9 10 9 80-84 292 477 769 6 8 7 85+ 160 255 415 3 4 4 Total 5187 6205 11392 100 100 100
The information presented in Figure 2-1 and Figure 5-1 was used to identify the significant stages of non-response. The high level of individual response within responding household shows that where there were at least two core sample members in the household, their response was strongly dependent on each other. Around 60% of respondents were in households containing two eligible respondents (either two core sample members or a core sample member plus a new or younger partner), and a small proportion of households contained more than two eligible respondents. Two stages of non-response were identified as having significant levels of non-response. These were: • households that did not contain an age-eligible individual who agreed to be re-interviewed
beyond HSE (Stages 5 and 6); and • household-level non-response at ELSA Wave 1 (Stage 8). To try to overcome the effect of any non-random response at these stages, it is necessary to calculate weights. Both stages of non-response were amalgamated into a single response model. 11,37633 households containing at least one age-eligible individual were put together with 1,125 randomly selected households dropped at Stage 5. Of these 12,501 households, 7,938 had responded at Wave 1. It was suspected that a proportion of the households dropped at Stage 5 would have been found to be ineligible had an attempt to contact them been made. To account for this, around 100 households were removed at random (but in proportion to the age distribution) from this sub-group before conducting the non-response modelling. The proportion removed is the same as the proportion found to be ineligible in the households that had contact attempts. For example, 18% of the known ineligible households contained an oldest member of the household over 90 years old, and 18% of the randomly removed households also contained an oldest member of the household over 90 years old. The remaining households better represent the age-eligible sample for ELSA Wave 1. 33 The 11,376 age-eligible households (and 7,938 responding households) include three that were subsequently found to be ineligible (living in Scotland). The response trees show the updated figures of 7,935 responding households from 11,371 age-eligible households.

National Centre for Social Research
45
Response was modelled using logistic regression. Factors that might influence response were derived from information collected during the HSE interview to use in the model: region of residence, age of oldest person, household size, social class, and incidence of longstanding illness. These characteristics describe the nature of the household that the individual was residing within at the time of the HSE interview. If a single HSE household had split into two households at ELSA Wave 1, identical HSE information was used for both ELSA households in the model. Missing values in HSE data were replaced with the modal value. The data show that, relative to responding households, non-responding households were: • more likely to have a 50-54 or 85+ year old as the oldest in the household and less likely
to have a 65-74 year old as the oldest household member, • more likely to have more than two people in the household, • less likely to have any member of the household with a longstanding illness, • more likely to reside in the North West, West Midlands or North Thames Health
Authorities, and less likely to be in the Northern and Yorkshire, or Trent Authorities, • more likely to have a head of household who is classified as ‘unskilled manual’ or ‘other’,
and less likely to be classified as ‘professional’ or ‘managerial/ technical’, • more likely to have been sourced from HSE years 1999 or 2001 rather than HSE 1998. More details, including the model estimates, can be found in Appendix J. The predicted probability of response estimated by the model was inverted for the responding households in order to provide the initial non-response weight.
6.7 Calibration weighting A further round of weighting was needed to adjust the initial household non-response weight to try to ensure that the weighted sample of respondents matched the population of interest. This adjustment helps to account for any bias caused by households non-responding to HSE. The population of interest has been defined as adults of 50 years and over in England, living in private households in 2001, as represented by the Census 2001 (see Appendix I). In this situation the calibration method proposed by Lemaitre and Dufour (1987) is appropriate.34 This form of calibration weighting matches the weighted age-sex distribution of responding individuals35 resulting from the actions described in Section 6.6, with that of the target population, by means of a single household weight. The final weights produced are based on the initial non-response weights from Section 6.6. These weights modify the initial non-response weights as little as possible whilst correcting any discrepancies between the weighted sample and the target population 36 (for further details see Deville and Sarndal
34 The adjustments were carried out by the Office for National Statistics using CALMAR (a SAS-based macro). 35 Non-core sample member respondents were included in the age-sex distributions with core sample members because they may improve the weight through adding extra information about the household composition. 36In principle, if we had population estimates for age and sex by household composition (for example, the number of households with two adults – one man aged 70 and one woman aged 68), then we could calculate a direct estimate of the probability of a household responding in terms of its age–sex composition. However, because we do not have data to this level of detail, calibration weighting is a means of modelling the probabilities across household compositions whilst controlling for the marginal age–sex distribution.

National Centre for Social Research
46
(1992)). In fact the single weight produced is appropriate for both individual and household-level estimation. The individual-level weight is identical to the household-level weight, and each responding individual in the same household is assigned the same weight (illustrated in Table 6-4). A key advantage of this is that in the absence of substantial within-household non-response, estimates about individuals derived from the household-level data should match estimates derived from the individual-level data.
Table 6-4 Relationship between individual and household weight Household Person Household weight Individual weight
1 1 1.01 1.01 1 2 1.01 2 1 0.98 0.98 3 1 1.05 1.05 3 2 1.05 3 3 1.05
The final weights were re-scaled so that the weighted number of households was equal to the number of responding households.
6.8 Weighted sample Weights were calculated for core sample members only because this is the sample of interest. All other individuals that were interviewed (new and younger partners) have a weight of zero. If non-core sample members are to be analysed they should be analysed unweighted.
6.9 Comparison of unweighted and weighted data The age-sex distribution of the unweighted and weighted data for core sample members is given in Table 6-5. The weighted distribution is closer to the population distribution than the unweighted distribution. The most significant changes can be seen in the percentages of 50-54 year old men, 55-59 year old women and 85+ year old women.
Table 6-5 Age-sex distribution unweighted and weighted
Ageband (years) at W1
Male
%
Unweighted Female
%
Total
%
Male
%
Weighted Female
%
Total
% 50-54 20 20 20 23 20 22 55-59 19 18 19 18 16 17 60-64 15 14 15 15 14 15 65-69 15 14 15 14 13 13 70-74 13 13 13 12 12 12 75-79 9 10 9 9 11 10 80-84 6 8 7 5 7 7 85+ 3 4 4 3 6 5 Total 100 100 100 100 100 100
Effect of the weights on key estimates from ELSA data Where possible it is recommended that analysis be conducted on weighted data. The extent of the effect that the weights have on the data is likely to differ by each data item and each

National Centre for Social Research
47
estimate. Key estimates from across the range of topics covered in the interview have been identified to illustrate the effects. The effect of weighting on key estimates is illustrated in Table 6-6 by comparing unweighted and weighted estimates. Column 3 shows the size of the sample on which it is based, Column 4 shows the weighted sample size, Columns 5 and 6 show the unweighted and weighted estimates. The estimates are similar. A comparison of the design factors can also illustrate the effect of the weighting. The design factor, ‘deft’, is the factor by which the standard error of an estimate from a simple random sample has to be multiplied to give the true standard error of the complex design. In other words, it is the ratio of the standard error of the complex sample to that of the simple random sample of the same size. The defts were calculated in STATA. If the deft=1 this implies that the estimates are the same as the estimate would be from a simple random sample. A value of less than 1 implies that the weighting has improved the efficiency of the estimate, and a value of more than 1 that the weighting has introduced some inefficiency to the estimate. The design factors (not shown in Table 6-6) are all relatively close to 1 (ranging from 0.99 to 1.04) indicating that there is not substantial variance inflation.
6.10 Estimating errors in complex sample designs There are two aspects of the sample design that impact on standard errors: clustering and stratification. The ELSA sample used a stratified multi-stage design which was clustered within postal sectors. An effect of using this complex design is that standard errors for survey estimates are generally higher than they would be if derived from a simple random sample of the same size. Standard errors for survey estimates should account for the complex sample design and the weights. Where possible it is recommended that all aspects of the design and weights are accounted for. Strictly speaking, the age-sex post-stratification should also be accounted for, but it is difficult to achieve this in most software packages. This is because the post-stratification is likely to reduce standard errors of estimates slightly and so, by ignoring this, the standard errors and design factors calculated may be slightly conservative. Table 6-6 shows the standard errors and design factors associated with each estimate. As a reminder, Column 3 shows the size of the sample on which it is based, Column 4 shows the weighted sample size and Columns 5 and 6 show the unweighted and weighted estimates. The additional information is provided in Column 7 which shows the estimated true standard error, Column 8 which shows the 95% confidence interval for the estimate, and the final column which shows the design factor. The design factors vary by estimate. Design factors for key estimates tend to fall within the range 1.0 to 1.7, where values above 1.2 are commonly described as indicating sizeable variance inflation. The estimates most affected are income, net wealth and walking speed. Taking walking speed as an example, the uncorrected standard error is 0.27, correcting for weighting gives 0.37, and correcting for weighting and sample design gives 0.57. On the other hand the standard error of the self-assessed general health estimate changes only slightly (uncorrected standard error is 0.28 and correcting for weighting and sample design gives 0.29). While it is recommended that the design is accounted for analysts are likely to experience estimation problems if the analysis is being conducted on sub-groups. A problem arises when

National Centre for Social Research
48
a stratification cell contains only one person. To reduce this problem an alternative stratification variable has been created. The alternative only accounts for one aspect of the stratification (Health Authorities combined over HSE years) and therefore comes with a health warning that the full sample design is clearly not being accounted for. However it reduces the number of stratification cells considerably. It should be noted that there are other ways of eliminating the estimation problem that are not discussed here. Furthermore information is provided in the User Guides deposited in the UK data archive http://www.data-archive.ac.uk/, study number 5050.

Table 6-6 Key estimates from the ELSA data - true standard errors37
Key estimate description
Col 2. Survey variable
names
Col 3. N
Unweighted
Col 4. n
weighted
Col 5. Value
unweighted
Col 6. Value
weighted
Col 7. True standard
error
Col 8. 95% CI
Col 9. DEFT
Income totinc (derived) 11,135 11,123 348* 347* 5.5 336 – 358 1.40 Net wealth nettotw (derived) 11,135 11,123 158434* 155663* 4407 147013 – 164314 1.42 Self-assessed general health (good) hehelf, hegenh 11,220 11,208 91.14 91.26 0.29 90.69 – 91.83 1.09 Non-limiting longstanding illness heill, helim 11,383 11,383 21.35 20.91 0.42 20.08 – 21.74 1.11 Limiting longstanding illness “ 11,383 11,383 35.50 35.04 0.52 34.01 – 36.08 1.17 No difficulty walking quarter mile Hefunc 11,216 11,204 70.64 70.66 0.52 69.65 – 71.68 1.20 Some difficulty walking quarter mile “ 11,216 11,204 13.28 13.11 0.35 12.43 – 13.79 1.09 Much difficulty walking quarter mile “ 11,216 11,204 5.98 5.87 0.24 5.40 – 6.35 1.09 Unable to walk quarter mile “ 11,216 11,204 10.09 10.35 0.33 9.70 – 10.99 1.14 Diagnosed heart attack hedia01-hedia10 11,385 11,385 5.99 5.93 0.23 5.48 – 6.37 1.02 Walking speed mmwlka, mmwlkb 6,193 6,077 5.35* 5.47* 0.57 4.35 – 6.58 1.62 Feeling depressed psceda 11,041 11,024 17.92 17.95 0.41 17.15 – 18.75 1.12 Self-reported memory (good/v good/excellent) cfmetm 11,093 11,078 67.61 67.68 0.49 66.72 – 68.65 1.10 Memory test – mean number of animals cfani 11,034 11,017 19.18* 19.14* 0.08 19.00 – 19.29 1.24 Completing Self-Completion section scmiss$ 11,234 11,221 7.97 8.31 0.32 7.68 – 8.95 1.24 SC – taking a holiday abroad scptpa5 10,275 10,223 47.00 46.53 0.60 45.35 – 47.71 1.22 SC – not being a member of any organisation scorg9 9,871 9,810 30.65 30.83 0.54 29.76 – 31.89 1.17 $ Variable not publicly available.
37 All estimates are percentages unless starred, starred estimates are means.

References Erens and Primatesta, 1999; Erens, Primatesta and Prior, 2001; Prior et al., 2003 “Health and lifestyles of the older population in England: The 2002 English Longitudinal Study of Ageing” (Marmot et al, 2003). Further “Health Survey for England 1998. Volume 2: Methodology & Documentation” (1999) edited by B. Erens and P. Primatesta, The Stationary Office. “Health Survey for England. The Health of Minority Ethnic Groups 1999. Volume 2: Methodology & Documentation” (2001) edited by B. Erens, P. Primatesta and G Prior, The Stationary Office. “Health Survey for England 2001. Methodology & Documentation” (2003) edited by G. Prior, C. Deverill, K. Malbut and P. Primatesta, The Stationary Office. “An integrated method for weighting persons and families” (1987), G. Lemaitre and J. Dufour, Survey Methodology, Volume 13, pages 199-207. “Calibration estimators in survey sampling” (1992), J.D. Deville and C.E. Sarndal, Journal of the American Statistical Association, Volume 87, pages 376-382.

National Centre for Social Research
51
Appendix A Response rates for each HSE year Response for each HSE year is given below. For each year there are three tables: • Household response rates • Individual response rates • Percentages of the co-operating sample that took part in the different stages of the HSE.
This table indicates the size of the sample that have different items of information that can be used as the baseline for ELSA.
Apx. Table A.1 HSE interview response rates - HSE 1998
Status
Number of households
% of eligible
Eligible 12,446 Non-respond 3,238 26% Co-operate 9,208 74% - interview all eligible 8,078 65% - interview & measurements taken from all eligible 7,698 62%
Status
Number of individuals
% of eligible
Estimated eligible 23,085 Non-respond 7,177 31% - estimate, non-co-op hh 2,058 9% - known, non-co-op hh 3,787 16% - known, co-op hh 1,332 6% Interview 15,908 69%
Status
Number of individuals
% of eligible
Eligible in co-operating hh 17,240 Non-respond 1,332 8% Interview only 15,908 92% - plus nurse visit 13,586 79% - plus nurse and blood sample 10,773 62%

National Centre for Social Research
52
Apx. Table A.2 HSE interview response rates - HSE 1999
Status
Number of households
% of eligible
Eligible 5,975 Non-respond 1,424 24% Co-operate 4,551 76% - interview all eligible 3,988 67% - interview & measurements taken from all eligible 3,788 63%
Status
Number of individuals
% of eligible
Estimated eligible 11,095 Non-respond 3,297 30% - estimate, non-co-op hh 2,644 24% - known, co-op hh 653 6% - Interview 7,798 70%
Status
Number of individuals
% of eligible
Eligible in co-operating hh 8,451 Non-respond 653 8% Interview only 7,798 92%
Note that in the table above it shows that the core sample were not asked to take part in a nurse visit or give blood samples in HSE 1999.

National Centre for Social Research
53
Apx. Table A.3 HSE interview response rates - HSE 2001
Status
Number of households
% of eligible
Eligible 12,630 Non-respond 3,257 26% Co-operate 9,373 74% - interview all eligible 7,823 62% - interview & measurements taken from all eligible 6,691 53%
Status
Number of individuals
% of eligible
Estimated eligible 23,314 Non-respond 7,667 33% - estimate, non-co-op hh 2,202 9% - known, non-co-op hh 3,603 15% - known, co-op hh 1,862 8% Interview 15,647 67%
Status
Number of individuals
% of eligible
Eligible in co-operating hh 17,509 Non-respond 1,862 11% Interview only 15,647 89% - plus nurse visit 12,404 71% - plus nurse and blood sample 9,413 54%

National Centre for Social Research
54
Appendix B HSE sampling information An individual’s age was determined by their date of birth given in the individual HSE interview if available. Alternatively age (in years) was obtained from the HSE household grid which was the first stage of data collection in the household. Note that this could be an estimate, i.e. an age band rather than the exact year (variables - dobm/doby (1998), dobmon/dobyear (1999 & 2001), hdbmonth/hdbyear (2001), idbmonth/idbyear (1999 & 2001), age (1998 & 1999 & 2001)). If an estimate of age had been used rather than calculating it from their date of birth, and the individual was between 49 and 51 years an additional check was made against the date of their HSE interview (variables - yintb/mintb). The time period between the HSE interview and the cut-off for ELSA eligibility was examined to establish the maximum and minimum number of years the individual could have aged. For some this resulted in an adjustment to the age estimate (plus or minus one year) and a flag attached where there was some uncertainty. Age could not be determined for 25 individuals. The additional criteria for eligibility for inclusion in the ELSA sample was whether an HSE interview had been conducted with the specific individual, and if so whether they had agreed to be re-interviewed at a later date (variables - hseint, reinter). The ‘sample type’ classification derived from the sampling frame (used to identify potential sample members and partners) was checked after fieldwork. Most people had been classified correctly except: one person had been excluded from the issued sample but responded as a younger partner (relationship information had been incorrect), two core members had been issued as younger partners and two younger partners had been issued as sample members (age information had not been sufficient). This implies that the sampling frame was accurate on the whole. While it is possible that there may be some potential sample members and partners who were excluded incorrectly at the sampling stage that cannot be identified as such, the check performed on responding individuals suggests this would be a negligible number of cases.

National Centre for Social Research
55
Age-eligible sample for each HSE source year
Apx. Table B.1 Age-sex distribution of all age-eligible individuals in sampling frame – HSE 1998
Ageband (years) at W1
Male Female Unknown Total Male %
Female %
Unknown Total %
50-54 764 758 1522 20% 17% 18% 55-59 683 755 1 1439 18% 17% 50% 17% 60-64 533 569 1102 14% 13% 13% 65-69 523 580 1 1104 14% 13% 50% 13% 70-74 454 521 975 12% 12% 12% 75-79 371 455 826 10% 10% 10% 80-84 248 415 663 7% 9% 8% 85+ 239 388 627 6% 9% 8% Total 3815 4441 2 8258 100% 100% 100%
The 8258 individuals live within 5422 households. Additionally there are 497 younger partners.
Apx. Table B.2 Age-sex distribution of all age-eligible individuals in sampling frame – HSE 1999
Ageband (years) at W1
Male Female Total Male %
Female %
Total %
50-54 384 418 802 20% 20% 20% 55-59 316 342 658 17% 16% 17% 60-64 292 274 566 16% 13% 14% 65-69 269 255 524 14% 12% 13% 70-74 226 251 477 12% 12% 12% 75-79 185 202 387 10% 10% 10% 80-84 116 186 302 6% 9% 8% 85+ 84 162 246 4% 8% 6% Unknown 2 6 8 0% 0% 0% Total 1874 2096 3970 100% 100% 100%
The 3970 individuals live within 2626 households. Additionally there are 266 younger partners.
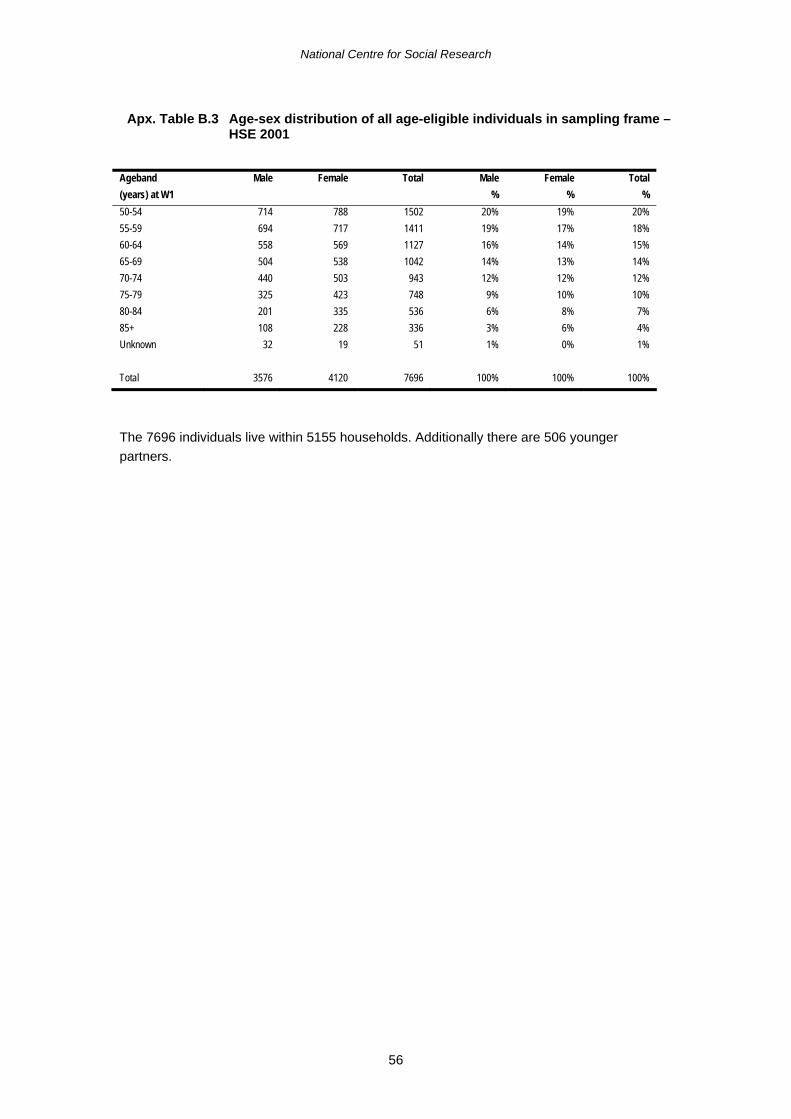
National Centre for Social Research
56
Apx. Table B.3 Age-sex distribution of all age-eligible individuals in sampling frame – HSE 2001
Ageband (years) at W1
Male Female Total Male %
Female %
Total %
50-54 714 788 1502 20% 19% 20% 55-59 694 717 1411 19% 17% 18% 60-64 558 569 1127 16% 14% 15% 65-69 504 538 1042 14% 13% 14% 70-74 440 503 943 12% 12% 12% 75-79 325 423 748 9% 10% 10% 80-84 201 335 536 6% 8% 7% 85+ 108 228 336 3% 6% 4% Unknown 32 19 51 1% 0% 1% Total 3576 4120 7696 100% 100% 100%
The 7696 individuals live within 5155 households. Additionally there are 506 younger partners.

National Centre for Social Research
57
Appendix C Issued sample characteristics by HSE year
Apx. Table C.1 Age-sex distribution of issued individuals – HSE 1998
Ageband (years) at W1
Male Female Total Male %
Female %
Total %
Under 50 83 335 418 2 8 5 50-54 684 722 1406 19 17 18 55-59 637 712 1349 18 17 17 60-64 497 538 1035 14 12 13 65-69 488 538 1026 14 12 13 70-74 417 476 893 12 11 11 75-79 328 386 714 9 9 9 80-84 209 345 554 6 8 7 85+ 176 262 438 5 6 6 Unknown 1 1 2 0 0 0 Total 3520 4315 7835 100% 100% 100%
Apx. Table C.2 Age-sex distribution of issued individuals – HSE 1999
Ageband (years) at W1
Male Female Total Male %
Female %
Total %
Under 50 38 179 217 2 9 6 50-54 340 385 725 20 19 20 55-59 294 310 604 18 15 16 60-64 258 257 515 15 13 14 65-69 244 230 474 15 11 13 70-74 201 230 431 12 11 12 75-79 159 170 329 9 8 9 80-84 91 146 237 5 7 6 85+ 53 102 155 3 5 4 Total 1678 2009 3687 100% 100% 100%

National Centre for Social Research
58
Apx. Table C.3 Age-sex distribution of issued individuals – HSE 2001
Ageband (years) at W1
Male Female Total Male %
Female %
Total %
Under 50 99 308 407 3 8 6 50-54 621 731 1352 19 18 19 55-59 648 668 1316 20 17 18 60-64 500 506 1006 15 13 14 65-69 463 487 950 14 12 13 70-74 395 448 843 12 11 12 75-79 292 367 659 9 9 9 80-84 175 280 455 5 7 6 85+ 98 194 292 3 5 4 Unknown 8 3 11 0 0 0 Total 3299 3992 7291 100% 100% 100%

National Centre for Social Research
59
Appendix D Excluded households The tables below show the characteristics of the individuals in households that were excluded from the study. Some were found to have died between the HSE interview and the ELSA interview (through pre-fieldwork checking), and others had not agreed to be re-contacted. The first set of tables show the individuals in excluded households that were known to have died.
Apx. Table D.1 Excluded households: age-sex distribution of individuals who had died
Ageband (years) at W1
Male Female Total Male %
Female %
Total %
50-54 11 3 14 5% 1% 3% 55-59 3 8 11 1% 3% 2% 60-64 8 6 14 4% 2% 3% 65-69 13 11 24 6% 4% 5% 70-74 24 19 43 12% 7% 9% 75-79 31 48 79 15% 18% 17% 80-84 43 64 107 21% 24% 23% 85+ 60 111 180 34% 41% 38% Total 202 250 472 100% 100% 100%
Apx. Table D.2 Excluded households: age-sex distribution of individuals who had died – HSE 1998
Ageband (years) at W1
Male Female Total Male %
Female %
Total %
50-54 9 2 11 7% 1% 3% 55-59 3 5 8 2% 3% 3% 60-64 7 6 13 5% 3% 4% 65-69 6 7 13 4% 4% 4% 70-74 16 13 29 12% 7% 9% 75-79 16 33 49 12% 18% 16% 80-84 28 39 67 21% 22% 21% 85+ 50 75 125 37% 42% 40% Total 135 180 315 100% 100% 100%
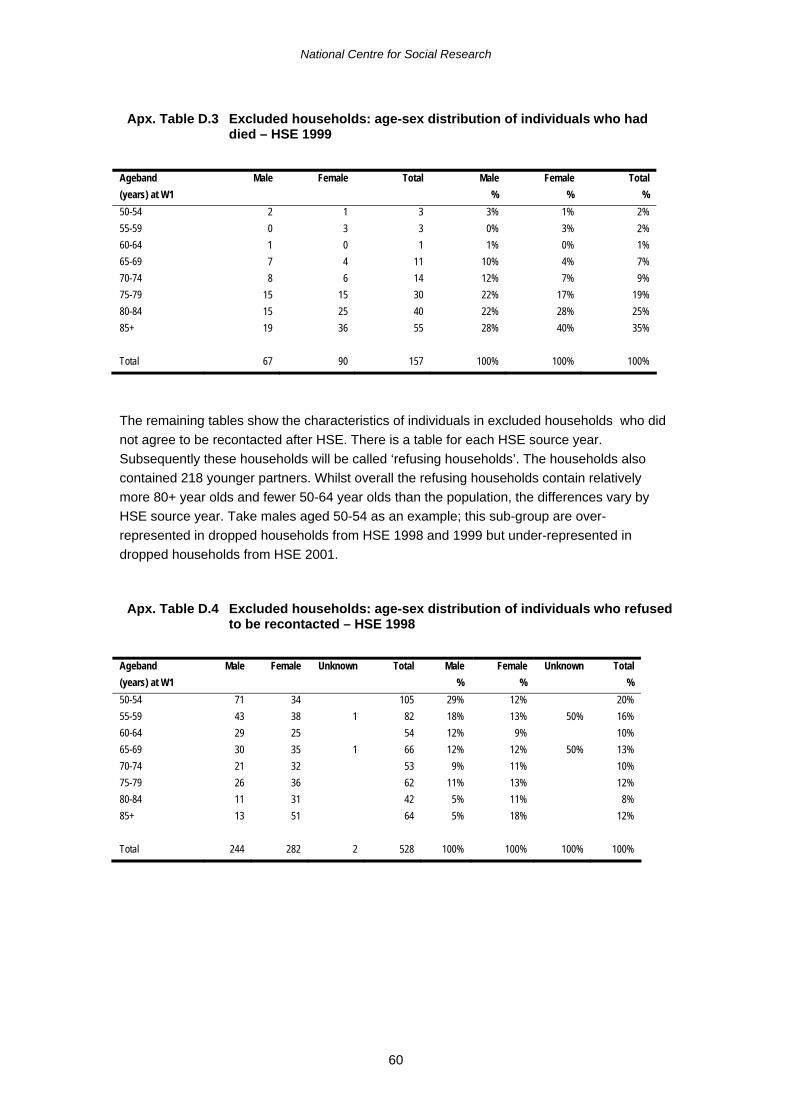
National Centre for Social Research
60
Apx. Table D.3 Excluded households: age-sex distribution of individuals who had died – HSE 1999
Ageband (years) at W1
Male Female Total Male %
Female %
Total %
50-54 2 1 3 3% 1% 2% 55-59 0 3 3 0% 3% 2% 60-64 1 0 1 1% 0% 1% 65-69 7 4 11 10% 4% 7% 70-74 8 6 14 12% 7% 9% 75-79 15 15 30 22% 17% 19% 80-84 15 25 40 22% 28% 25% 85+ 19 36 55 28% 40% 35% Total 67 90 157 100% 100% 100%
The remaining tables show the characteristics of individuals in excluded households who did not agree to be recontacted after HSE. There is a table for each HSE source year. Subsequently these households will be called ‘refusing households’. The households also contained 218 younger partners. Whilst overall the refusing households contain relatively more 80+ year olds and fewer 50-64 year olds than the population, the differences vary by HSE source year. Take males aged 50-54 as an example; this sub-group are over-represented in dropped households from HSE 1998 and 1999 but under-represented in dropped households from HSE 2001.
Apx. Table D.4 Excluded households: age-sex distribution of individuals who refused to be recontacted – HSE 1998
Ageband (years) at W1
Male Female Unknown Total Male %
Female %
Unknown Total %
50-54 71 34 105 29% 12% 20% 55-59 43 38 1 82 18% 13% 50% 16% 60-64 29 25 54 12% 9% 10% 65-69 30 35 1 66 12% 12% 50% 13% 70-74 21 32 53 9% 11% 10% 75-79 26 36 62 11% 13% 12% 80-84 11 31 42 5% 11% 8% 85+ 13 51 64 5% 18% 12% Total 244 282 2 528 100% 100% 100% 100%

National Centre for Social Research
61
Apx. Table D.5 Excluded households: age-sex distribution of individuals who refused to be recontacted – HSE 1999
Ageband (years) at W1
Male Female Total Male %
Female %
Total %
50-54 42 32 74 25% 18% 22% 55-59 22 29 51 13% 16% 15% 60-64 33 17 50 20% 10% 15% 65-69 18 21 39 11% 12% 11% 70-74 17 15 32 10% 9% 9% 75-79 11 17 28 7% 10% 8% 80-84 10 15 25 6% 9% 7% 85+ 12 24 36 7% 14% 10% Unknown 2 6 8 1% 3% 2% Total 167 176 343 100% 100% 100%
Apx. Table D.6 Excluded households: age-sex distribution of individuals who refused to be recontacted – HSE 2001
Ageband (years) at W1
Male Female Total Male %
Female %
Total %
50-54 21 8 29 6% 2% 4% 55-59 83 60 143 22% 14% 18% 60-64 47 52 99 13% 12% 12% 65-69 54 64 118 14% 15% 15% 70-74 37 50 87 10% 11% 11% 75-79 47 52 99 13% 12% 12% 80-84 35 58 93 9% 13% 11% 85+ 27 75 102 7% 17% 13% Unknown 24 16 40 6% 4% 5% Total 375 435 810 100% 100% 100%

National Centre for Social Research
62
Appendix E Proxy and partial interviews
Apx. Table E.1 Proxy respondent sample, including new and younger partners, by age and sex38
Ageband (years) at Wave 1
Male Female Total Male %
Female %
Total %
Under 50 7 7 14 8 8 8 50-54 10 5 15 12 6 9 55-59 14 7 21 16 8 12 60-64 14 9 23 16 10 13 65-69 8 5 13 9 6 7 70-74 12 6 18 14 7 10 75-79 6 11 17 7 12 10 80-84 8 17 25 9 19 14 85+ 6 23 29 7 26 17 Total 85 90 175 100 100 100
Apx. Table E.2 Partial respondent sample, including new and younger partners, by age and sex
Ageband (years) at W1
Male Female Total Male %
Female %
Total %
Under 50 3 6 9 3 5 4 50-54 16 9 25 16 8 12 55-59 22 19 41 23 16 19 60-64 14 18 32 14 15 15 65-69 12 21 33 12 18 15 70-74 10 13 23 10 11 11 75-79 11 12 23 11 10 11 80-84 5 12 17 5 10 8 85+ 4 8 12 4 7 6 Total 97 118 215 100 100 100
38 The difference between this table and Table 9.7 in the main ELSA report can be explained by the way age has been defined. Here age is defined as age at the start of Wave 1 fieldwork, whereas the table in the main ELSA report refers to age at interview.

National Centre for Social Research
63
Appendix F Income and wealth imputation
Apx. Table F.1 Income variable data types
Zero
%
Continuous
%
closed Band
%
open band
%
missing, >0
%
missing completely
% Wage and salary income (BU) 49.9 44.1 2.9 0.5 1.8 0.9
Take home pay 68.9 29.0 0.7 0.1 1.1 0.3 Self-employment profit 94.8 3.2 1.2 0.1 0.5 0.2
Self-employment drawings 98.3 1.4 0.1 0.0 0.0 0.2
Income from subsidiary jobs 95.8 3.4 0.4 0.0 0.2 0.2 Private pension income 50.8 43.1 2.7 0.3 2.8 0.4
Annuity income 96.2 2.1 0.1 0.0 0.2 1.4
Annuity income (partner) 97.2 1.4 0.0 0.0 0.1 1.3 State pension income 48.3 48.5 0.7 0.1 1.3 1.1
State pension income (partner) 69.6 28.0 0.4 0.1 0.9 1.1
Incapacity benefit 94.1 4.5 0.1 0.0 0.3 1.1 Incapacity benefit (partner) 96.2 2.9 0.0 0.0 0.1 0.7
Severe disablement allowance 98.1 0.7 0.0 0.0 0.1 1.1
Severe disablement allowance (partner) 98.8 0.4 0.0 0.0 0.0 0.7 Statutory sick pay 98.6 0.2 0.0 0.0 0.1 1.1
Statutory sick pay (partner) 99.1 0.2 0.0 0.0 0.0 0.7
Attendance allowance 95.1 3.4 0.1 0.0 0.3 1.1 Attendance allowance (partner) 97.7 1.6 0.0 0.0 0.1 0.7
Disability living allowance 93.4 4.9 0.1 0.0 0.4 1.1
Disability living allowance (partner) 95.9 3.2 0.0 0.0 0.2 0.7 Industrial injuries benefit 98.0 0.9 0.0 0.0 0.0 1.1
Industrial injuries benefit (partner) 98.6 0.7 0.0 0.0 0.0 0.7
War pension income 98.2 0.6 0.0 0.0 0.1 1.1 War pension income (partner) 98.9 0.4 0.0 0.0 0.0 0.7
Invalid care allowance 98.1 0.7 0.0 0.0 0.0 1.1
Invalid care allowance (partner) 98.7 0.6 0.0 0.0 0.0 0.7
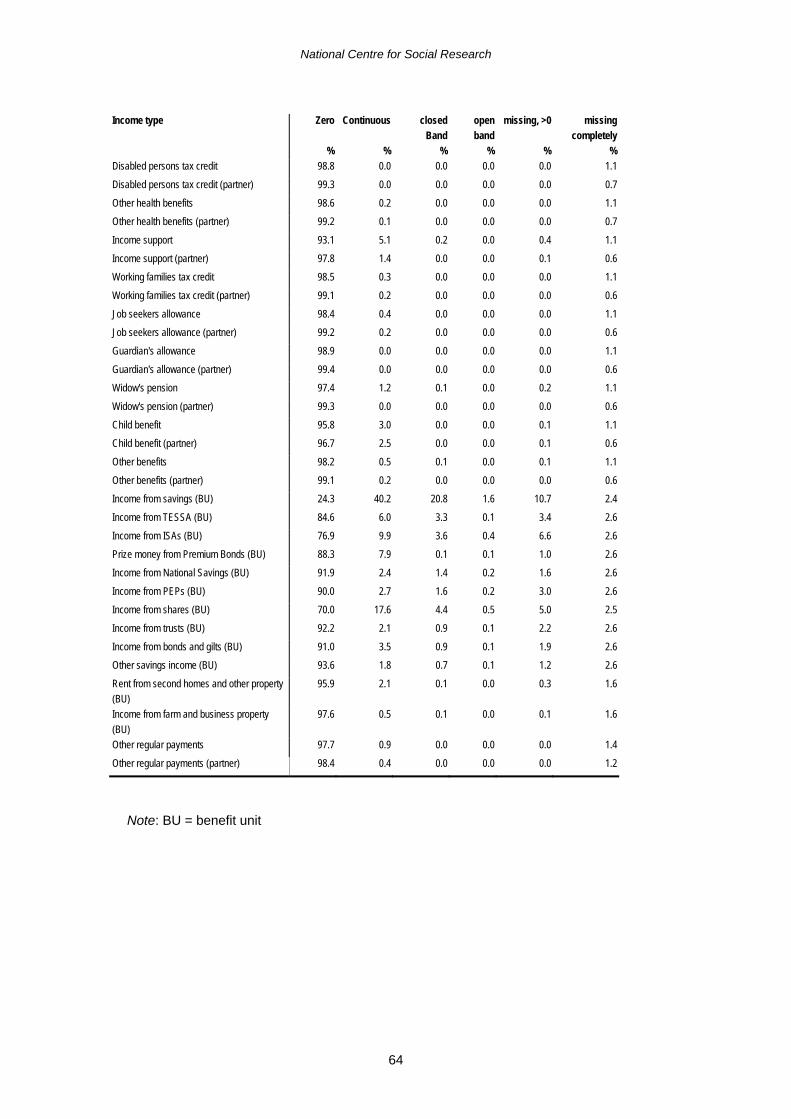
National Centre for Social Research
64
Income type Zero
%
Continuous
%
closed Band
%
open band
%
missing, >0
%
missing completely
% Disabled persons tax credit 98.8 0.0 0.0 0.0 0.0 1.1
Disabled persons tax credit (partner) 99.3 0.0 0.0 0.0 0.0 0.7
Other health benefits 98.6 0.2 0.0 0.0 0.0 1.1 Other health benefits (partner) 99.2 0.1 0.0 0.0 0.0 0.7
Income support 93.1 5.1 0.2 0.0 0.4 1.1
Income support (partner) 97.8 1.4 0.0 0.0 0.1 0.6 Working families tax credit 98.5 0.3 0.0 0.0 0.0 1.1
Working families tax credit (partner) 99.1 0.2 0.0 0.0 0.0 0.6
Job seekers allowance 98.4 0.4 0.0 0.0 0.0 1.1 Job seekers allowance (partner) 99.2 0.2 0.0 0.0 0.0 0.6
Guardian's allowance 98.9 0.0 0.0 0.0 0.0 1.1
Guardian's allowance (partner) 99.4 0.0 0.0 0.0 0.0 0.6 Widow's pension 97.4 1.2 0.1 0.0 0.2 1.1
Widow's pension (partner) 99.3 0.0 0.0 0.0 0.0 0.6
Child benefit 95.8 3.0 0.0 0.0 0.1 1.1 Child benefit (partner) 96.7 2.5 0.0 0.0 0.1 0.6
Other benefits 98.2 0.5 0.1 0.0 0.1 1.1
Other benefits (partner) 99.1 0.2 0.0 0.0 0.0 0.6 Income from savings (BU) 24.3 40.2 20.8 1.6 10.7 2.4
Income from TESSA (BU) 84.6 6.0 3.3 0.1 3.4 2.6
Income from ISAs (BU) 76.9 9.9 3.6 0.4 6.6 2.6 Prize money from Premium Bonds (BU) 88.3 7.9 0.1 0.1 1.0 2.6
Income from National Savings (BU) 91.9 2.4 1.4 0.2 1.6 2.6
Income from PEPs (BU) 90.0 2.7 1.6 0.2 3.0 2.6 Income from shares (BU) 70.0 17.6 4.4 0.5 5.0 2.5
Income from trusts (BU) 92.2 2.1 0.9 0.1 2.2 2.6
Income from bonds and gilts (BU) 91.0 3.5 0.9 0.1 1.9 2.6 Other savings income (BU) 93.6 1.8 0.7 0.1 1.2 2.6
Rent from second homes and other property (BU)
95.9 2.1 0.1 0.0 0.3 1.6
Income from farm and business property (BU)
97.6 0.5 0.1 0.0 0.1 1.6
Other regular payments 97.7 0.9 0.0 0.0 0.0 1.4
Other regular payments (partner) 98.4 0.4 0.0 0.0 0.0 1.2
Note: BU = benefit unit

National Centre for Social Research
65
Apx. Table F.2 Wealth variable data types
Zero
%
Continuous
%
closed Band
%
open band
%
missing, >0
%
missing completely
% Current/savings account (BU) 8.5 71.2 9.5 1.6 6.8 2.4
TESSA (BU) 81.3 13.1 1.1 0.1 1.9 2.6 Cash ISA (BU) 62.1 28.5 2.1 0.2 2.3 2.8
Life insurance ISA (BU) 94.2 0.5 0.2 0.1 0.2 2.9
Shares ISA (BU) 81.1 10.2 2.5 0.3 1.2 2.8 Premium bonds (BU) 62.9 31.9 0.7 0.3 1.7 2.5
National Savings (BU) 90.1 5.7 0.6 0.2 0.9 2.6
PEPs (BU) 79.9 12.0 2.7 0.2 2.5 2.6 Shares (BU) 64.6 23.2 5.1 0.7 3.8 2.5
Trusts (BU) 87.3 6.5 1.7 0.2 1.8 2.6
Bonds and gilts (BU) 87.1 7.4 1.3 0.2 1.6 2.6 Other savings and investments (BU) 91.6 4.4 0.5 0.1 0.8 2.6
Life insurance savings component (BU) 84.4 7.5 2.8 0.2 1.3 3.9
Value of second home and other property 85.2 11.5 0.9 0.4 0.5 1.5 Value of farm and business property 96.5 1.4 0.2 0.1 0.2 1.6
Life insurance future pay-out 55.6 30.8 8.7 0.2 3.0 1.8
Life insurance future pay-out (partner) 66.6 24.0 5.8 0.2 2.3 1.1 Total other physical assets 87.6 8.6 1.2 0.3 0.7 1.6
Value of business 97.5 1.1 0.7 0.1 0.5 0.1
Value of other business assets 96.6 1.0 0.4 0.0 0.2 1.6 Credit card debt (BU) 78.4 18.7 0.7 0.1 0.4 1.6
Other private debt (BU) 97.3 1.1 0.0 0.0 0.0 1.6
Other loans and debt (BU) 74.9 22.2 0.7 0.2 0.4 1.6 Joint assets (BU separate finance couples only) 96.6 2.0 0.3 0.4 0.4 0.4
Value of house (BU) 20.9 73.9 3.4 0.5 1.4 0.0
Housing debt (BU) 76.4 18.1 3.3 1.6 0.4 0.2
Note: BU = benefit unit

National Centre for Social Research
66
Appendix G Further response rate information Contact rate by HSE year The table below highlights the slightly higher contact rate for households sourced from the more recent HSE 2001. The contact rates for households sourced from 1998 and 1999 HSE years are likely to have been similar if the fieldwork periods had been similar (households from HSE 1999 had a shorter fieldwork period restricting contact efforts compared to other HSE years).
Apx. Table G.1 Household contact rate by HSE source year Contact rate
% Households
issued & eligible
HSE 1998 95.1 4642 HSE 1999 92.3 2230 HSE 2001 96.2 4499 Total 95.0 11371
Household response by HSE year The three tables below show reasonably similar household response rates for each HSE year. The highest response rate is from households sourced from HSE 1998; a smaller percentage of households refused to take part. Similar percentages of households were found to be ineligible or non-contactable by HSE year. The highest percentage of households that had moved and could not be traced was from HSE 1999. Less time was available to trace individuals sourced from HSE 1999 because this sub-group was issued relatively late in the fieldwork period.
Apx. Table G.2 Household fieldwork response rate: core sample members from HSE 1998
Frequency % of issued % of eligible
Total issued (households) 4805 100 Ineligible 163 3 Total eligible 4642 97 100 Respond 3365 72 Non-respond 1277 28
Non-respondents 1277 28 No contact 44 1 Refuse 891 19 Moved – unable to trace 183 4 Other 159 3

National Centre for Social Research
67
Apx. Table G.3 Household fieldwork response rate: core sample members from HSE 1999
Frequency % of issued % of eligible
Total issued (households) 2264 100 Ineligible 34 2 Total eligible 2230 98 100 Respond 1497 67 Non-respond 733 33
Non-respondents 733 33 No contact 34 2 Refuse 479 21 Moved – unable to trace 137 6 Other 83 4
Apx. Table G.4 Household fieldwork response rate: core sample members from HSE 2001
Frequency % of issued % of eligible Total issued (households) 4598 100 Ineligible 99 2 Total eligible 4499 98 100 Respond 3073 68 Non-respond 1426 32 Non-respondents 1426 32 No contact 60 1 Refuse 1129 25 Moved – unable to trace 109 2 Other 128 3
Co-operation rate by HSE year The co-operation rate is calculated by dividing the number of achieved individual interviews by the number of individuals contacted by interviewers. The table below highlights the similarity of the co-operation rates for core sample members. The rate was higher for the individuals sourced from HSE 1998.
Apx. Table G.5 Individual co-operation rate: core sample members by HSE source year
Co-operation rate %
Individuals contacted
HSE 1998 73.4 6659 HSE 1999 69.7 3058 HSE 2001 67.3 6497 Total 70.3 16214

National Centre for Social Research
68
Individual fieldwork response by HSE year The three tables below show reasonably similar individual (core sample member) response rates for each HSE year. Again the tables show that the highest response rate is from individuals sourced from HSE 1998. The lower response rate from HSE 1999 was due to higher refusals and movers that could not be traced, and from HSE 2001 due to higher refusals, perhaps because of how recent the last interview had been. Less time was available to trace individuals sourced from HSE 1999 because this sub-group was issued relatively late in the fieldwork period. A smaller percentage of individuals were found to be ineligible from HSE 2001, this is likely to be because fewer individuals had died between the two interview attempts. Similar percentages of individuals could not be contacted for each HSE year.
Apx. Table G.6 Individual fieldwork response rate: core sample members from HSE 1998
Frequency % of issued % of eligible
Total issued (individuals) 7416 100 Ineligible 461 6 Total eligible 6955 94 100 Respond 4885 70 Non-respond 2070 30
Non-respondents 2070 30 No contact 81 1 Refuse 1545 22 Moved – unable to trace 215 3 Other 229 3
Apx. Table G.7 Individual fieldwork response rate: core sample members from HSE 1999
Frequency % of issued % of eligible
Total issued (individuals) 3470 100 Ineligible 166 5 Total eligible 3304 95 100 Respond 2132 65 Non-respond 1172 35
Non-respondents 1172 35 No contact 60 2 Refuse 812 25 Moved – unable to trace 186 6 Other 114 3

National Centre for Social Research
69
Apx. Table G.8 Individual fieldwork response rate: core sample members from HSE 2001
Frequency % of issued % of eligible
Total issued (individuals) 6882 100 Ineligible 158 2 Total eligible 6724 98 100 Respond 4375 65 Non-respond 2349 35
Non-respondents 2349 35 No contact 96 1 Refuse 1927 29 Moved – unable to trace 131 2 Other 195 3
Individual response rates for new and younger partners for all HSE years New partners were just as likely to respond to the survey as core sample members (with a response rate of 68% compared with 67% for core sample members) but younger partners had a slightly lower response rate (63%).
Apx. Table G.9 Individual response rate: younger partners Frequency % of issued % of eligible
Total issued (individuals) 1046 100 Ineligible 39 4 Total eligible 1007 96 100 Respond 636 63 Non-respond 371 37
Non-respondents 371 37 No contact 20 2 Refuse 262 26 Moved – unable to trace 59 6 Other 30 3
Apx. Table G.10 Individual response rate: new partners Frequency % of issued % of eligible
Total recorded (individuals) 106 100 Respond 72 68 Non-respond 34 32
Non-respondents 34 32 No contact 6 6 Refuse 24 23 Moved – unable to trace N/A Other 4 4

National Centre for Social Research
70
Appendix H Response rates framework Although we strive to offer transparency and clarity about all aspects of the survey design and process, response issues for longitudinal studies are complex. Crucially it is necessary to understand response both in practical terms – how successful have we been in any given wave – but also in the wider context of how representative the sample is in the long term. This appendix attempts to present a more comprehensive framework in which the range of response rates presented for the study may be understood in the future. The framework is based on work conducted by Peter Lynn. A key aim in outlining this framework now, is to offer a standard approach to the presentation of this information that can be used in later waves. The framework may also allow ELSA to be compared more easily to other studies, in time. First of all, we restate some essential definitions that have been covered in the main body of this technical report. All rates are defined for individuals since they are the unit of interest. Only the sub-group of age-eligible individuals from the sampling frame (also called Wave 0) is of interest to ELSA. The sampling frame used for HSE was the small users Postcode Address File (PAF) for England only. This implies the final criteria for inclusion in the sample; that they were residing in a private household in England at the time of Wave 0 fieldwork. Individuals are considered to be eligible for inclusion in the Wave 0 sample if they: • had been selected for HSE 1998, 1999 or 2001 general population samples, • were born on or before 29th Feb 1952 (i.e. 50+ years old). At Wave 1 individuals were eligible for inclusion in the sample if they: • had been selected for HSE 1998, 1999 or 2001 general population samples, • were born on or before 29th Feb 1952 (i.e. 50+ years old), • were still alive and residing in a private household in England at the time of Wave 1
fieldwork. Finally, a reminder about the data collection events (DCE) that have been conducted up to this point: • Wave 0 – main interview39 and nurse visit, • Wave 1 – main interview. Fitting the calculated response rates into the wider framework The fieldwork response rate presented in Chapter 5 is equivalent to rate RR1
a shown below.
The study response rate presented in Chapter 6 does not have an exact equivalent in the framework but is closed to rate RR1| 0 below.
The Wave 0 response rate presented in Chapter 6 is equivalent to rate RR0 below. The estimate of the representativeness of the sample responding at Wave 1 as discussed
in Chapter 6 is equivalent to rate RR1 below.
39 Self-completion booklets have been treated as a module within the main interview rather than a separate DCE.

National Centre for Social Research
71
Wave 1 unconditional response rates Wave 1 unconditional response rate for whole sample
Respond at Wave 1 RR1
=
Eligible sample members at Wave 1 Wave 1 unconditional response rate for sub-sample with agreement to be recontacted (sub-sample a)
Respond at Wave 1 RR1
a =
Eligible sample members at Wave 1 who agreed to recontact Wave 1 conditional response rates Wave 1 response rate conditional on response to Wave 0 main interview
Respond at Wave 1 (if also respond at Wave 0) RR1| 0
=
Eligible sample members at Wave 1 (if also respond at Wave 0) Other response rates of interest Wave 0 unconditional response rate for whole sample
Respond at Wave 0 RR0
=
Eligible sample members at Wave 0 Longitudinal response rate (Wave 0 & 1 all DCE - main interview & nurse visit) for whole sample
Respond at waves 0 & 1 RR0N,1
=
Eligible sample members who were eligible for all DCE at waves 0 & 1
Longitudinal response rate (Wave 0 & 1 - main interviews only) for whole sample
Responded at Wave 0 main interview & Wave 1 RR0,1
=
Eligible sample members who were eligible for all main interviews at waves 0 & 1

National Centre for Social Research
72
Appendix I Population characteristics The table below gives the population control totals used in the calibration weighting.
Apx. Table I.1 Population distribution for 2001
Age band Male Female Male
% Female
% Total
% 50-54 1666074 1698611 22.5 19.8 21.1 55-59 1369926 1399697 18.5 16.3 17.3 60-64 1166536 1211398 15.8 14.1 14.9 65-69 1026327 1111463 13.9 13.0 13.4 70-74 875567 1046909 11.8 12.2 12.0 75-79 671119 925655 9.1 10.8 10.0 80-84 391349 643858 5.3 7.5 6.5 85-89 175347 370086 2.4 4.3 3.4 90+ 57392 161634 0.8 1.9 1.4 Total 7399637 8569311 100 100 100

National Centre for Social Research
73
Appendix J Weighting – non-response modelling The analysis was conducted on the households that responded to ELSA Wave 1, households that did not respond to ELSA Wave 1 and households that were excluded from Wave 1 because the age-eligible residents had not agreed to be re-contacted. All of these households were classified as non-respondents.
Apx. Table J.1 Characteristics of respondents and non-respondents
(core sample members only)
HSE predictor variables Response %
Non-response %
Age of oldest person in household at Wave 1 50-54 15.7 18.8 55-59 17.1 16.2 60-64 13.6 13.3 65-69 14.6 11.6 70-74 13.0 11.1 75-79 11.0 11.3 80-84 9.0 8.8 85-89 4.2 5.8 90+ 1.7 3.0 Size of household 1 person in HSE household 32.9 31.3 2 persons in HSE household 45.5 44.4 More than 2 persons 21.5 24.3 Whether anyone in household had a long standing illness
No member of household with illness 27.1 32.2 At least one member with illness 72.9 67.8 Regional Health Authority Northern and Yorkshire 14.7 13.0 North West 12.6 13.4 Trent 11.5 10.5 West Midlands 10.8 11.4 Anglia & Oxford 10.8 10.3 North Thames 12.1 14.0 South Thames 12.9 12.9 South and West 14.6 14.7 Social class of Head of Household Professional 6.3 5.0 Managerial/technical 29.2 25.3 Skilled non-manual 15.8 15.6 Skilled manual 26.0 27.3 Semi-skilled manual 15.0 15.5 Unskilled manual 5.7 6.9 Others 2.0 4.3 Year of HSE interview 1998 42.4 36.0 1999 18.9 21.0 2001 38.7 43.0 Base = 12,501
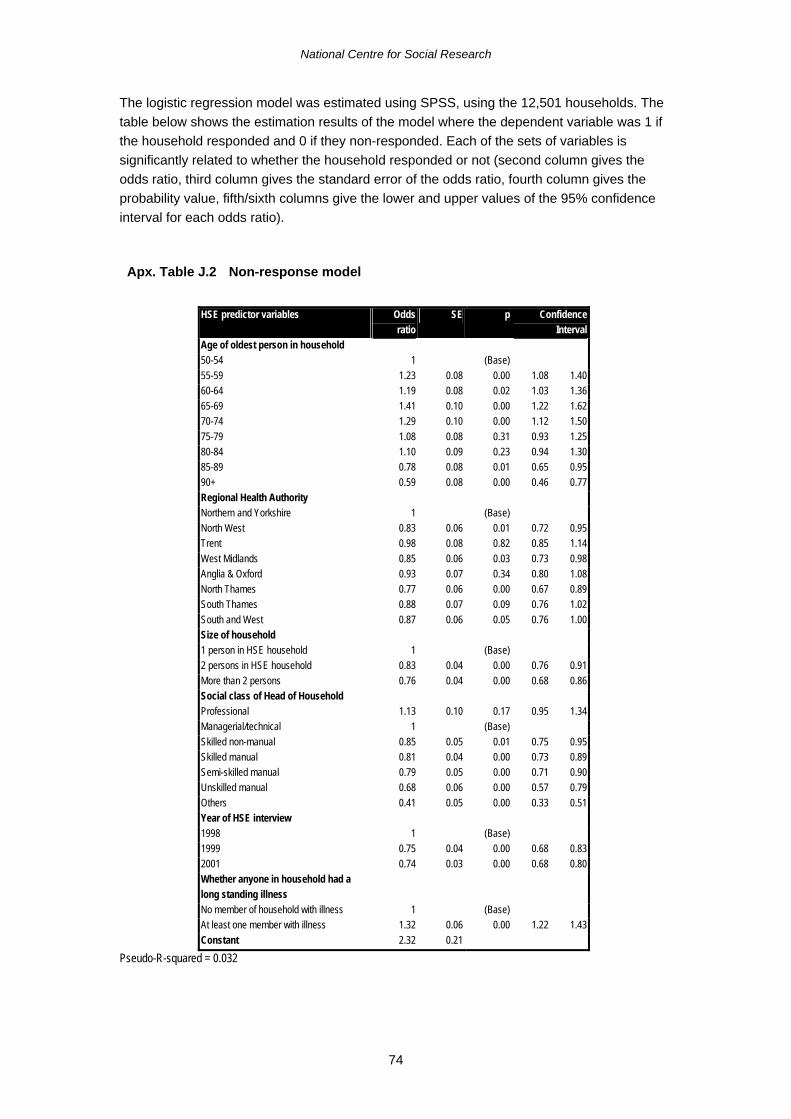
National Centre for Social Research
74
The logistic regression model was estimated using SPSS, using the 12,501 households. The table below shows the estimation results of the model where the dependent variable was 1 if the household responded and 0 if they non-responded. Each of the sets of variables is significantly related to whether the household responded or not (second column gives the odds ratio, third column gives the standard error of the odds ratio, fourth column gives the probability value, fifth/sixth columns give the lower and upper values of the 95% confidence interval for each odds ratio).
Apx. Table J.2 Non-response model
HSE predictor variables Odds
ratio SE p Confidence
Interval Age of oldest person in household 50-54 1 (Base) 55-59 1.23 0.08 0.00 1.08 1.40 60-64 1.19 0.08 0.02 1.03 1.36 65-69 1.41 0.10 0.00 1.22 1.62 70-74 1.29 0.10 0.00 1.12 1.50 75-79 1.08 0.08 0.31 0.93 1.25 80-84 1.10 0.09 0.23 0.94 1.30 85-89 0.78 0.08 0.01 0.65 0.95 90+ 0.59 0.08 0.00 0.46 0.77 Regional Health Authority Northern and Yorkshire 1 (Base) North West 0.83 0.06 0.01 0.72 0.95 Trent 0.98 0.08 0.82 0.85 1.14 West Midlands 0.85 0.06 0.03 0.73 0.98 Anglia & Oxford 0.93 0.07 0.34 0.80 1.08 North Thames 0.77 0.06 0.00 0.67 0.89 South Thames 0.88 0.07 0.09 0.76 1.02 South and West 0.87 0.06 0.05 0.76 1.00 Size of household 1 person in HSE household 1 (Base) 2 persons in HSE household 0.83 0.04 0.00 0.76 0.91 More than 2 persons 0.76 0.04 0.00 0.68 0.86 Social class of Head of Household Professional 1.13 0.10 0.17 0.95 1.34 Managerial/technical 1 (Base) Skilled non-manual 0.85 0.05 0.01 0.75 0.95 Skilled manual 0.81 0.04 0.00 0.73 0.89 Semi-skilled manual 0.79 0.05 0.00 0.71 0.90 Unskilled manual 0.68 0.06 0.00 0.57 0.79 Others 0.41 0.05 0.00 0.33 0.51 Year of HSE interview 1998 1 (Base) 1999 0.75 0.04 0.00 0.68 0.83 2001 0.74 0.03 0.00 0.68 0.80 Whether anyone in household had a long standing illness
No member of household with illness 1 (Base) At least one member with illness 1.32 0.06 0.00 1.22 1.43 Constant 2.32 0.21
Pseudo-R-squared = 0.032