
The Grain Size Effect on Scour Around Cylinder Due to Tsunami Runup

Eastern Health
Health Sciences Centre Flood Plain Study
HEALTH SCIENCES CENTRE FLOOD PLAIN STUDY
REPORT
Prepared for: Joe Dunford Regional Director – Infrastructure Support Eastern Health St. Clare’s Mercy Hospital Suite M134, Morrissey Wing 154 LeMarchant Road St. John’s, NL A1C 5B8 Prepared by: AMEC Americas Limited 29-31 Pippy Place Suite 2002 P.O. Box 9600 St. John’s, NL A1A 3C1 Date: August 6, 2014 AMEC Ref. No.: 174811-0000-CD10-RPT-0001


Eastern Health
Health Sciences Centre Flood Plain Study
AMEC Ref. No. 174811-0000-CD10-RPT-0001 2014.08.06 Page i
Table of Contents 1.0 INTRODUCTION ................................................................................................... 1
1.1 STUDY SCOPE ................................................................................................................2 2.0 BACKGROUND INFORMATION .......................................................................... 3
2.1 MAPS AND DRAWINGS .....................................................................................................3
2.2 PREVIOUS STUDIES .........................................................................................................5
2.3 GOVERNMENT POLICIES ..................................................................................................5
2.4 CRITICAL STRUCTURE ELEVATIONS ..................................................................................6 3.0 ANALYSIS ............................................................................................................ 7
3.1 FLOOD PLAIN ..................................................................................................................7
3.2 WAVE SETUP AND RUNUP ANALYSIS .................................................................................7
3.3 STRUCTURAL FLOOD CONTROL OPTIONS ..........................................................................7
3.3.1 Flood - Control Reservoir .......................................................................................7
3.3.2 Diversion ................................................................................................................8
3.3.3 Channel modification .............................................................................................8
3.3.4 Levee .....................................................................................................................8
4.0 CONCLUSION ...................................................................................................... 9 5.0 RECOMMENDATIONS ....................................................................................... 10
APPENDIX A – DRAWINGS APPENDIX B – RENNIES RIVER CATCHMENT STORMWATER MANAGEMENT PLAN APPENDIX C – CORRESPONDANCE APPENDIX D – GOVERNMENT POLICIES APPENDIX E – WAVE ANALYSIS APPENDIX F – COST ESTIMATE

Eastern Health Health Sciences Centre
Flood Plain Study
AMEC Ref. No. 174811-0000-CD10-RPT-0001 2014.08.06 Page 1
1.0 INTRODUCTION
The Health Sciences Centre is located on Clinch Crescent (off of Prince Phillip Drive) in St. John’s NL and is located immediately adjacent to Leary’s Brook. Leary’s Brook, which is located within the Rennies River watershed, is immediately upstream of Long Pond. The area along Leary’s Brook adjacent to the Health Sciences Centre is prone to flooding and has flooded several times in the past. Over the last number of years there have been flooding events which have covered Prince Phillip Drive (in the area between the Health Sciences Centre and the CBC building) and have caused road closures of both Prince Phillip Drive and Clinch Crescent west. The general topography of the Health Sciences Centre site is sloped in a west to east direction towards Leary’s Brook, with the portions of the Health Sciences Centre consisting of the ICU and CICU and the Agnes Cowan Hostel set at the lowest elevations. The Utility Annex is set at a slightly higher elevation and the underground utility tunnel (running between the Utility Annex and the HSC) and the associated utility tunnel access set at the lowest elevation of the various structures.
Figure 1 – Health Sciences Centre Site
Given the history of flooding in the vicinity, Eastern Health requested AMEC conduct a flood plain assessment to identify risks and future flooding issues.

Eastern Health Health Sciences Centre
Flood Plain Study
AMEC Ref. No. 174811-0000-CD10-RPT-0001 2014.08.06 Page 2
1.1 STUDY SCOPE
The scope outlined in the proposal for this project was twofold. The first part of this project involved developing a concept design and cost estimate for an emergency access to the HSC site from Larkhall Street, where the second part of the project involved performing a floodplain study which is the subject of this report. The scope items specifically covered in this report are as follows: 1. Review of available documents including site civil drawings, aerial photos, and available
flood plain analysis data provided by the City of St. John’s to determine current conditions at the site.
2. Review flood plain data and conduct a desktop assessment to determine possible risk points in the present flood plain. Determine options for improving the protection measures along with associated costs and recommend preferred alternative.
3. Prepare a draft concept design report outlining the findings of the analysis conducted along with recommended solutions.
After discussions with Eastern Health regarding the potential impact of wind on flood water levels it was agreed that a wave setup and runup analysis would be added to the scope of this project.

Eastern Health Health Sciences Centre
Flood Plain Study
AMEC Ref. No. 174811-0000-CD10-RPT-0001 2014.08.06 Page 3
2.0 BACKGROUND INFORMATION
2.1 MAPS AND DRAWINGS
The following is a list of maps and drawings provided to AMEC for the purposes of this study. All of the following maps and drawings, with the exception of the first, were provided by the City of St. John’s, where the first was provided by Eastern Health. 1. Document Type: Electronic .dwg (CAD) file
Title: Proposed Site Development Plan – Health Sciences Centre Extension Janeway Children’s Health and Rehabilitation Centre. Drawing Number: W-C_1.1 R2 Date: October 9, 1997 (rev 2) Brief Description: proposed site plan of entire Health Sciences Centre for Janeway extension.
2. Document Type: Electronic .jpg file
Name: 300 Kenmount Rd. Floodplain From: City of St. John’s Date: document creation date unknown (provided via. Email Nov 4, 2013). Brief Description: aerial photo of Health Sciences Centre with an unlabelled blue line representing flood plain.
3. Document Type: Electronic .pdf file
Title: 220-212 Date: 1983 Brief Description: 1:500 City of St. John’s map with 100 year and 1993 100 year flood plain indicated
4. Document Type: Electronic .pdf file
Title: 221-212 Date: 1983 Brief Description: 1:500 City of St. John’s map with 100 year and 1993 100 year flood plain indicated
5. Document Type: Electronic .pdf file
Title: 220-213 Date: 1983 Brief Description: 1:500 City of St. John’s map with 100 year and 1993 100 year flood plain indicated
6. Document Type: Electronic .pdf file
Title: 221-213 Date: 1983 Brief Description: 1:500 City of St. John’s map with 100 year and 1993 100 year flood plain indicated

Eastern Health Health Sciences Centre
Flood Plain Study
AMEC Ref. No. 174811-0000-CD10-RPT-0001 2014.08.06 Page 4
7. Document Type: Electronic .pdf file Title: 222-213 Date: 1983 Brief Description: 1:500 City of St. John’s map with 100 year and 1993 100 year flood plain indicated
8. Document Type: Electronic .dwg (CAD) file
Name: 3235270 Date: unknown Brief Description: CAD map of City of St. John’s (area south of Health Sciences Centre)
9. Document Type: Electronic .dwg (CAD) file
Name: Kav & Assoc 3235271 Date: unknown Brief Description: CAD map of City of St. John’s (includes area southwest of Health Sciences Centre)
10. Document Type: Electronic .dwg (CAD) file
Name: Kav & Assoc 3245270 Date: unknown Brief Description: CAD map of City of St. John’s (includes area to south east of Health Sciences Centre)
11. Document Type: Electronic .dwg (CAD) file
Name: Kav & Assoc 3245271 Date: unknown Brief Description: CAD map of City of St. John’s (includes Health Sciences Centre and University)
12. Document Type: Electronic .dwg (CAD) file
Name: cont3245270 Date: unknown Brief Description: CAD file containing contours for area east of University
13. Document Type: Electronic .dwg (CAD) file
Name: cont3245271 Date: unknown Brief Description: CAD file containing contours for north east end of Health Sciences Centre
14. Document Type: Electronic .dwg (CAD) file
Name: cont3235270 Date: unknown Brief Description: CAD file containing contours for area south of Health Sciences Centre

Eastern Health Health Sciences Centre
Flood Plain Study
AMEC Ref. No. 174811-0000-CD10-RPT-0001 2014.08.06 Page 5
15. Document Type: Electronic .dwg (CAD) file Name: cont3235271 Date: unknown Brief Description: CAD file containing contours for area west of Health Sciences Centre
16. Document Type: .shp
Name: New_Floodplain_-_Health_Sciences.shp Date: unknown Brief Description: shp file containing extents of 1:100 flood plain
2.2 PREVIOUS STUDIES
The City of St. John’s employed CBCL to develop the Rennies River Catchment Stormwater Management Plan (RRCSMP). This Plan involved reviewing previous studies, developing a calibrated hydraulic model of the Rennies river watershed allowing for effects of future development and climate change and developing flood plain mapping and preliminary designs and estimates for flood control. A copy of the report is located in Appendix B.
2.3 GOVERNMENT POLICIES
The following Government of Newfoundland and Labrador documents provide guidance regarding development within and adjacent to floodplains and flood risk areas: 1. Newfoundland and Labrador Provincial Land Use Policy Flood Risk Areas (LUPFRA),
which is published by the Fire and Emergency Services Agency. 2. Policy for Flood Plain Management (PFPM), which is published by the Department of
Environment and Conservation.
Copies of each policy are located in Appendix D. These policies define the floodplain, floodway fringe and climate change flood zone and indicate which types of developments are allowed within each area with the expressed goal, among others, of reducing property damages and increasing public safety. The LUPFRA indicates that structures such as hospitals are not permitted within the floodway fringe and defines the floodway fringe as the “flood risk area, where the risk of flooding is lower, on average once in one hundred years”, the PFPM uses a similar definition of floodway fringe. The PFPM indicates that structures such as hospitals are not permitted with the climate change flood zone. Where the climate change zone is defined as an extension of the floodway fringe due to latest forecasted effects of climate change.

Eastern Health Health Sciences Centre
Flood Plain Study
AMEC Ref. No. 174811-0000-CD10-RPT-0001 2014.08.06 Page 6
2.4 CRITICAL STRUCTURE ELEVATIONS
In order to assess the impact of flood events on the HSC it was necessary to establish the finished floor elevations for critical structures, such as the lowest floor elevations for the HSC, Agnes Cowan Hostel and Utility Annex (Memorial University). The finished floor elevations for each of these structures are: 1. Agnes Cowan Hostel = 58.12m 2. HSC (lowest floor) = 58.20m 3. Utility Annex = 58.22m In addition there is a utility tunnel that runs between the Utility Annex and the HSC. This tunnel provides all of the steam and hot water used in the HSC complex. The tunnel has surface access and ventilation located at the midpoint. The surface elevation at this point is estimated to be approximately 57.15m. These various elevations were obtained from existing record drawings and survey data (in the case of the utility annex). Refer to Figure A1 in appendix A for approximate location of utility tunnel and utility tunnel access.

Eastern Health Health Sciences Centre
Flood Plain Study
AMEC Ref. No. 174811-0000-CD10-RPT-0001 2014.08.06 Page 7
3.0 ANALYSIS
3.1 FLOOD PLAIN
Floodplain mapping and floodwater elevations provided by the City were used to establish the extents of the flooding, and to assess the flood risks associated with the 1:100 Annual Exceedance Probability (AEP) event. Both the flood plain mapping and corresponding floodwater elevations were established and provided by the City using the hydraulic model developed by for the RRCSMP. The flood plain extents and floodwater elevations illustrated in Figures A1 and A2 (located in Appendix A) reflect the 1:100 AEP and account for future developments and forecasted climate change effects (refer to RRCSMP located in Appendix B for further details). The 1:100 AEP elevations were given for three different points adjacent to the HSC and are as follows: 1. PT1 – 56.95m (corresponds to section C on Figure A2 located in Appendix A) 2. PT2 – 57.40m (corresponds to section B on Figure A2 located in Appendix A) 3. PT3 – 57.56m (corresponds to section A on Figure A2 located in Appendix A)
For the purposes of this study the highest elevation (PT3) was used as the 1:100 AEP flood water level in this report.
3.2 WAVE SETUP AND RUNUP ANALYSIS
An analysis was undertaken to determine the maximum inundation levels due to wind induced setup and wave runup on the large flooded area adjacent to the HSC for the 1:100 AEP. The wave induced setup was found to be insignificant while the combined maximum wind and wave induced setup was found to be 0.32m (refer to report located in Appendix E for report).
3.3 STRUCTURAL FLOOD CONTROL OPTIONS
Structural measures refer to flood control facilities that consist of engineering structures or modifications as opposed to non-structural measures which modify the damage potential for permanent facilities such as flood proofing, flood warning and land-use controls. Examples of Structural modifications include: 1. Flood – Control Reservoir 2. Diversion 3. Channel Modifications 4. Levee
3.3.1 Flood - Control Reservoir
Flood-Control Reservoirs are used to store flood waters for a specified period of time and release them after the flood event, reducing the magnitude of the peak discharge and consequently peak stage (downstream of reservoir) for any given return event. Among the many requirements that are necessary for a flood-control reservoir to be suitable for flood control is that there be sufficient area available to locate a flood-control reservoir. As there is no available area upstream of the

Eastern Health Health Sciences Centre
Flood Plain Study
AMEC Ref. No. 174811-0000-CD10-RPT-0001 2014.08.06 Page 8
Health Sciences Centre to allow for the construction of a Flood-Control Reservoir, this option was given no further consideration.
3.3.2 Diversion
Diversions are used to bypass flood flows around areas vulnerable to flooding, thus reducing the magnitude of the peak discharge and consequent stage at the vulnerable area for any given return event. Among the many requirements that are necessary for a diversion to be suitable for flood control is that there be sufficient area for both the diversion channel and diversion inlet works. As there is no available area for the construction of diversion works this option was given no further consideration.
3.3.3 Channel modification
Channel modifications are used to improve the conveyance capacity of a stream channel, thus reducing the peak stage at the area of concern, for any given event. This option would present several different obstacles to implementation. Channel modifications to Leary’s Brook would take the form of stream dredging and widening. Modifications such as these would result in major impacts to the aquatic and riparian zones of the brook and would require various permits from several different provincial and federal departments. Additionally the RRCSMP Report indicates that the bridge at Clinch Crescent East acts as a flow restriction and does not have the capacity to pass the 1:100 AEP flow and has a dominant role in generating the peak water levels observed between the HSC and Prince Philip Drive. Therefore channel modifications alone would have little to no effect on the 1:100 AEP water levels between the HSC and Prince Philip Drive, without replacing the bridge at Clinch Crescent East. In any event it is expected that channel modifications would encounter such significant objections, from authorities, due to the environmental effects and damages to fish habitats, as to be deemed impractical and was given no further consideration.
3.3.4 Levee
Levees are essentially berms or earth dams used to confine flood water to a smaller area than would otherwise be flooded without their presence. This option is the only practical option among the structural options discussed and was also the flood control approach recommended in the Rennies River Catchment Stormwater Management Plan for the area along Leary’s Brook in front of the HSC.

Eastern Health Health Sciences Centre
Flood Plain Study
AMEC Ref. No. 174811-0000-CD10-RPT-0001 2014.08.06 Page 9
4.0 CONCLUSION
Comparing the 1:100 AEP flood elevations, discussed in section 3.1 with the critical structure elevations, discussed in section 2.4 it is evident that the finished floor elevations of each structure is higher than the 1:100 AEP flood elevations, with the exception of the utility tunnel access (refer to figures A1 and A2 located in Appendix A for location of 1:100 AEP flood elevations relative to the HSC and the Agnes Cowan Hostel). Given that the 1:100 AEP flood elevations were lower than the floor elevations of the critical structures examined it is not immediately apparent that it is necessary to provide a Levee, however, due to the large flooded area created adjacent to the HSC in a 1:100 AEP flood, it was considered prudent to consider the effects of wind and wave action on the water surface of the flooded area and the corresponding inundation that would be observed. Therefore a wind and wave analysis was conducted, as discussed in section 3.2, to determine the increase in water elevation due to wave setup and runup. This analysis yielded a total maximum wind and wave induced runup that when added to the 1:100 AEP flood elevations give a maximum water level of 57.88m. This gives an inherent freeboard ranging between 0.24m and 0.34m from the maximum water level and the critical structure elevations, with the exception of the utility tunnel access. Regardless of the inherent freeboard that currently exists it is recommended that the approach promulgated by the US FEMA (Federal Emergency Management Agency), regarding freeboard for levees, be followed. FEMA suggest that the top of levees should be set as the greater of either 1.) Flood level plus the computed wind and wave setup or 2.) Flood level plus 3 feet (900mm). Following the later criteria the top of levee should be set at 58.46m. Figure A3 and A4 located in Appendix A illustrates the location of the proposed levee along with several sections. Strictly speaking this levee would not confine flood waters and would primarily provide protection to the HSC and the Agnes Cowan Hostel from inundation resulting from wave action due to wave setup and runup, and would act as a breakwater rather than a levee. As current topography of the HSC site slopes towards Leary’s brook a berm could actually create flooding issues, as the runoff from the HSC site would be retained by a levee and held immediately adjacent to the HSC. Therefore it is recommended that culverts be placed at intervals along the length of the berm to allow runoff from the HSC site to continue towards Leary’s Brook (Figure A3 and A4 located in Appendix A illustrates the proposed berm location along with several berm sections). As mentioned the 1:100 AEP flood elevation is above the estimated utility tunnel access elevation and therefore the potential to flood the tunnel exists. It should also be noted that this berm would require the placement of fill in the floodway fringe which will impact the 1:100 AEP flood levels.

Eastern Health Health Sciences Centre
Flood Plain Study
AMEC Ref. No. 174811-0000-CD10-RPT-0001 2014.08.06 Page 10
5.0 RECOMMENDATIONS
The following paragraphs summarize the recommendations: 1. The proposed berm as discussed in the previous section should be constructed of
imported select fill and finished with topsoil and hydroseeded. Several culverts are also included to allow for drainage (as discussed in Section 4.0). In addition a paved access road, to allow emergency vehicle access to the east side of the HSC, is included. The estimated cost of the berm and road work is $283,400. An item by item breakdown of the estimate is located in Appendix F. As the construction of a berm in the floodway fringe would impact the observed 1:100 AEP flood elevations, an evaluation, to determine those impacts, should be conducted during the detailed design stage.
2. This study did not include examining storm drains and sanitary sewers that service the
hospital. It is recommended that impact of the 1:100 AEP flood level with respect to these services be examined.
3. It is also recommended that the potential impacts of flooding the utility tunnel between the
utility annex and the HSC be examined more closely. If flooding of the utility tunnel is found to pose significant risks then flood proofing measures for the tunnel/tunnel access should be considered.
4. As discussed, in section 3.3.3, the bridge at Clinch Crescent East plays a dominant role
in generating the 1:100 AEP flood levels observed in front of the HSC. It is recommended that hydraulic modeling be conducted to determine the potential reductions in the 1:100 AEP flood levels that could be realized by replacing the Clinch Crescent East Bridge.

Eastern Health Health Sciences Centre
Flood Plain Study
AMEC Ref. No. 174811-0000-CD10-RPT-0001 2014.08.06
APPENDIX A
DRAWINGS

148
154
166
180
184
210
157
175
179
187
191
203
207
213
225
40
42
44
46
48
41
43
102
104
91
99
101
103
105
107
279
281
283
285
287
289
291
293
295
297
299
301
10
19
21
23
25
27
29
31
33
37
39
6
20
20
21
22 23
24
24A
25
25A
26
26A
27
28
29
30 31
153
155
157
159
161
163
165
167
169
82
84
86
88
90
92
94
9698
104
106
108
110
112
114
91
93
95
9799
101103
15
17
132
134
136
138
140
142
144
146
148
150
152
154
156
158
160
162
164
166
168
151
9
11
13
18
20
15
17
14
16
18
20
22
24
1
2
2A 3
3A
4
4A
5
6
7
8
9
1011
12
1314
30
31
32
330
275277
30
32
34
36
38
40
42
39
41
43
45
47
49
51
53
2
4
6
8
10
12
14
20
1
3
5
79
11
13
15
17
19
21
21 1/2
23
25
2729
4
6
8
10
12
14
16
18
20
22
24
3
5
9
11
13
15
1
2
3
45
67
8
9
10
1112
13 13A14
14A15A15 16
17
18
19
2021
22
2324 25
2627
28
29
30
1
3
5
7
9
11
13
15
300
17
5
118
120
122
124
126
128
130
95
14
16
18
20
15
17
257
259
261
263
265
267
269
257
4
6
8
10
12
14A
16
18
20
22
24
26
28
30
32
34
36
38
3
57
9
11
13
15
17
19
21
23
25
27
29
31
2
4
6
8
10
12
14
16
18
20
22
24
26
28
30
32
34
36
7
21
25
27
29
31
33
35
37
18
4
6
8
10
12
14
16
18
20
3
5
7
11
13
28
30
32
50
52
54
56
58
60
62
64
66
68
70
72
76
78
80
82
84
86
88
90
92
94
96
98
100
45
47
49
51
53
55
57
59
61
63
65
67
69
71
73
75
77
79
HEALTHSCIENCECENTRE
PRINCE PHILIP DRIVE
CLINCH CRESCENT58
60
5657
56
56
57
56
56
5656
58
57
57
56
57
A
A
B
B
C
C
POND
UNIVERSITY AVENUE
WARNERS ROAD
MOSDELL ROAD
CLINCH CRESCENT
ARCTIC AVENUE
POINT 1E 324,404.4N 5,270,334.0
POINT 2E 324,301.0N 5,270,207.8
POINT 3E 324,136.4N 5,270,138.6
EXTENT OF 1:100 FLOOD
APPROX. LOCATIONOF TUNNEL ACCESS
UTILITY TUNNEL
PROJECT : DRAWN BY : SUBJECT : DATE : SCALE :
\\Hfx-
fs1\p0
0174
811\D
wg\C
IV\F
loodp
lain S
tudy\S
ITE
- Floo
dplai
n - 11
x17.d
wgJu
l 18,2
014-
11:25
am va
ughn
.huntl
ey
HEALTH SCIENCES CENTREST. JOHN'S, NL
FLOOD PLAIN STUDY100 YEAR STORM BOUNDARIES
AND PROFILE LOCATIONS
FIGURE :
2014/07/181 : 5000V.A.H. A1AMEC Americas Limited
NOTES:
1. 100 YEAR FLOOD AS IDENTIFIED ON PLANS ISBASED ONNEW_FLOODPLAIN_HEALTH_SCIENCES.SHPOBTAINED FROM THE CITY OF ST. JOHN'S.
2. 100 YEAR FLOOD ELEVATIONS IDENTIFIED ONPROFILES ARE BASED ON ELEVATIONS PROVIDEDBY THE CITY OF ST. JOHN'S.
3. GRADE INDICATED ON PROFILES BASED ON CADDRAWINGS CONT3235270, CONT3235271,CONT3245270 AND CONT3245271 OBTAINED FROMTHE CITY OF ST. JOHN'S.

ELEV
ATIO
N
54
56
58
60
54
56
58
60
0+000
58.07
0+020
57.33
0+040
57.09
0+060
56.97
0+080
56.37
0+100
56.45
0+12055
.400+140
55.42
0+160
56.21
0+180
57.04
0+200
57.05
0+220
57.07
0+240
57.07
0+260
57.05
0+280
57.21
0+300
57.51
0+320
57.71
0+340
ELEV
ATIO
N
54
56
58
60
54
56
58
60
0+000
57.78
0+020
57.21
0+040
56.11
0+060
56.95
0+080
56.04
0+100
56.01
0+120
56.00
0+140
55.67
0+160
55.59
0+180
56.25
0+200
56.96
0+220
57.00
0+240
57.00
0+260
56.88
0+28056
.810+300
56.82
0+320
56.77
0+340
PRIN
CE P
HILIP
DRI
VE
LEAR
Y'S
BROO
K
LEAR
Y'S
BROO
K
HEAL
THSC
IENC
ECE
NTRE
GRADE (SEE NOTE 3)
GRADE (SEE NOTE 3)
SECTION 'B'
SECTION 'C'
PRIN
CE P
HILIP
DRI
VE
EX. E
LEV.
EX. E
LEV.
100 YEAR FLOOD 57.40m(SEE NOTE 2)
F.F.E.=58.20m
100 YEAR FLOOD 56.95m(SEE NOTE 2)
ELEV
ATIO
N
54
56
58
60
62
54
56
58
60
62
0+000
59.30
0+020
59.00
0+040
59.00
0+060
57.05
0+080
57.07
0+100
57.05
0+120
56.00
0+140
56.13
0+160
56.37
0+180
56.61
0+200
56.84
0+220
57.99
0+240
58.16
0+260
58.92
0+280
59.95
0+300
60.35
0+320
61.09
0+340
PRIN
CE P
HILIP
DRI
VE
LEAR
Y'S
BROO
K
GRADE (SEE NOTE 3)
AGNE
SCO
WAN
HOST
EL
EX. E
LEV.
SECTION 'A'
100 YEAR FLOOD 57.56m(SEE NOTE 2)
F.F.E.=58.12m
P:\D
wg\C
IV\F
loodp
lain S
tudy\F
IGUR
E-A2
- 11
x17.d
wgJu
l 15,2
014-
2:09p
m va
ughn
.huntl
ey
HEALTH SCIENCES CENTREST. JOHN'S, NL
FLOOD PLAIN STUDY100 YEAR STORM
SECTIONS A, B and C
PROJECT : DRAWN BY : SUBJECT : DATE : SCALE : FIGURE :
2014/07/18HOR. 1 : 2000VER. 1 : 200V.A.H. A2
AMEC Americas Limited
NOTES:
1. 100 YEAR FLOOD AS IDENTIFIED ON PLANS ISBASED ONNEW_FLOODPLAIN_HEALTH_SCIENCES.SHPOBTAINED FROM THE CITY OF ST. JOHN'S.
2. 100 YEAR FLOOD ELEVATIONS IDENTIFIED ONPROFILES ARE BASED ON ELEVATIONS PROVIDEDBY THE CITY OF ST. JOHN'S.
3. GRADE INDICATED ON PROFILES BASED ON CADDRAWINGS CONT3235270, CONT3235271,CONT3245270 AND CONT3245271 OBTAINED FROMTHE CITY OF ST. JOHN'S.


Eastern Health Health Sciences Centre
Flood Plain Study
AMEC Ref. No. 174811-0000-CD10-RPT-0001 2014.08.06
APPENDIX B
RENNIES RIVER CATCHMENT STORMWATER PLAN

123097.00 ● Final Report ● April 15, 2014
Rennies River CatchmentStormwater Management Plan
Final Report
Prepared by: Prepared for:

Final Alexander Wilson 04/15/2014 Greg Shepaprd
Draft Final Alexander Wilson 01/29/2014 Greg Sheppard
Draft Alexander Wilson 11/04/2013 Greg Sheppard
Issue or Revision Reviewed By: Date Issued By:
This document was prepared for the party indicated herein. The material
and information in the document reflects CBCL Limited’s opinion and best
judgment based on the information available at the time of preparation. Any
use of this document or reliance on its content by third parties is the
responsibility of the third party. CBCL Limited accepts no responsibility for
any damages suffered as a result of third party use of this document.
123097.00

COVER LETTER/WK ED: 4/15/2014 10:28:00 AM/PD: 4/15/2014 10:28:00 AM
187 Kenmount Road
St. John’s, Newfoundland
Canada A1B 3P9
Telephone: 709 364 8623
Fax: 709 364 8627
E-mail: [email protected]
www.cbcl.ca
April 15, 2014 City of St. John’s PO Box 908 10 New Gower Street St. John’s, NL A1C 5M2 Attention: Mr. Dave Wadden, M.Eng. P.Eng. RE: Rennies River Catchment Stormwater Management Plan CBCL Project No. 123097 Dear Mr. Wadden: Please find enclosed six copies of the final report for the above noted study as well as a compact disk containing a pdf copy of the report. Due to the model file sizes, the remaining report deliverables will follow on a USB flash drive. Further, as we have yet to present the final report, a copy of the final report presentation will follow at a later date. We have enjoyed working on this challenging assignment and have appreciated the feedback provided by the City throughout the project. We look forward to continuing to build on our working relationship with the City on future projects. Please contact me with any questions related to this final study report. Sincerely, CBCL LIMITED Consulting Engineers Greg Sheppard, P.Eng. Project Manager Direct: 709-364-8623, Ext. 288 E-mail: [email protected]

CBCL Limited Contents i
Contents
Executive Summary ............................................................................................................................ vi
CHAPTER 1 Introduction ................................................................................................................ 1
1.1 Study Scope ......................................................................................................................... 1
CHAPTER 2 Background Information .............................................................................................. 2
2.1 Historical Flooding .............................................................................................................. 2
2.2 Previous Studies .................................................................................................................. 3
2.2.1 Ken Brook and Leary’s Brook Floodplain Delineation Study ................................. 3
2.2.2 Quidi Vidi Lake Tributary Flood Plain Delineation ................................................. 3
CHAPTER 3 Data Collection and Analysis ........................................................................................ 5
3.1 Data Collection .................................................................................................................... 5
3.1.1 Calibration Data ..................................................................................................... 5
3.1.2 Detailed Topographic Data .................................................................................... 7
3.1.3 Hydraulic Structure Details .................................................................................... 7
3.2 Data Analysis ....................................................................................................................... 7
3.2.1 Land Use Mapping ................................................................................................. 7
3.2.2 Watershed Delineation and Watershed Properties .............................................. 9
CHAPTER 4 Update of IDF Curves and Design Hyetographs .......................................................... 10
4.1 IDF Curves ......................................................................................................................... 10
4.1.1 Existing Data ........................................................................................................ 10
4.1.2 Additional Data .................................................................................................... 10
4.1.3 Update ................................................................................................................. 11
4.1.4 Results .................................................................................................................. 11
4.2 Design Hyetographs .......................................................................................................... 13
4.2.1 Updated IDFs ....................................................................................................... 13
4.2.2 Climate Change Projections ................................................................................. 15
CHAPTER 5 Statistical Analysis ..................................................................................................... 17
CHAPTER 6 Hydrologic Modeling ................................................................................................. 19
6.1 Model Development ......................................................................................................... 19
6.2 Model Calibration ............................................................................................................. 20
6.3 Hyetograph Selection ........................................................................................................ 21
6.4 Simulated Flood Flows ...................................................................................................... 22
CHAPTER 7 Hydraulic Modeling ................................................................................................... 24

CBCL Limited Contents ii
7.1 Model Development ......................................................................................................... 24
7.1.1 Model Input ......................................................................................................... 24
7.1.2 Structures ............................................................................................................. 25
7.1.3 Manning’s Roughness Coefficient ....................................................................... 27
7.2 Model Calibration ............................................................................................................. 28
7.3 Simulated Flood Flows ...................................................................................................... 29
CHAPTER 8 Sensitivity Analysis .................................................................................................... 30
8.1 Hydrologic Model Sensitivity ............................................................................................ 30
8.2 Hydraulic Model Sensitivity .............................................................................................. 34
CHAPTER 9 Floodplain and Flood Hazard Mapping ....................................................................... 37
CHAPTER 10 Preliminary Design .................................................................................................... 38
10.1 Flood Control .................................................................................................................... 38
10.2 Erosion Control ................................................................................................................. 63
CHAPTER 11 Regulatory Requirements .......................................................................................... 68
11.1 Department of Environment and Conservation ............................................................... 68
11.2 Department of Fisheries and Oceans ............................................................................... 68
CHAPTER 12 Conclusions And Recommendations .......................................................................... 69
12.1 Conclusions ....................................................................................................................... 69
12.2 Recommendations ............................................................................................................ 69
Appendices
A IDF Curves for St. John’s Airport Gauge
B Annual Maxima Data for Windsor Lake Gauge
C Distribution Plots and Screening Tests for Winsor Lake Gauge
D Design Hyetographs based on Updated IDFs
E Dr. Joel Finnis’ Report
F Design Hyetographs based on Climate Change Projections
G Single Station Frequency Analysis Results
H Hydraulic Structure Data Sheets
I Calibrated Floodplain Mapping
J Floodplain Mapping
K Floodplain Mapping with Improvements

CBCL Limited Contents iii
L Flood Hazard Mapping
M Opinions of Probable Costs
N Cellular Confinement System Product Literature

CBCL Limited Contents iii
List of Tables
Number Title
3‐1 Watershed Characteristics
4‐1 Updated IDF Rainfall Intensities
4‐2 1:20 AEP Rainfall Hyetographs – Updated IDFs and City Shape
4‐3 1:100 AEP Rainfall Hyetographs – Updated IDFs and City Shape
4‐4 Return Period Values for 24–Hour Precipitation (Mm) Based on Analysis by Dr. Joel Finnis
4‐5 1:20 AEP Rainfall Hyetographs – Climate Change and City’s Hyetograph Shape
4‐6 1:100 AEP Rainfall Hyetographs – Climate Change and City’s Hyetograph Shape
5‐1 Single Station Frequency Analysis Results
6‐1 Impervious Area Changes for Future Development
6‐2 1:20 and 1:100 AEP Flow Estimates for Existing and Future Development Conditions
7‐1 Hydraulic Structures Located on Main River Reaches
7‐2 Literature Values for Manning’s n
7‐3 Selected Calibration Event
7‐4 Flood Flows
8‐1 Variation in Peak Flows as a Result of Adjusting Hydrologic and Hydraulic Parameters
8‐2 Variation in Peak Water Levels as a Result of Adjusting Hydraulic Parameters
10‐1 Flood Protection Improvement Options
10‐2 Calculation of Rip Rap Sizes for Various Flow Velocities

CBCL Limited Contents iv
List of Figures
Number Title
3‐1 Flow and Water Level Gauge Stations
3‐2 Land Use Mapping
4‐1 IDF Curves
4‐2 1:20 & 1:100 AEP Hyetographs – Updated IDFs and Alternating Block Method
4‐3 1:20 & 1:100 AEP Hyetographs – Climate Change and Alternating Block Method
5‐1 Leary’s Brook at Prince Philip Drive Frequency Analysis
6‐1 Hydrologic Model Calibrations
6‐2 Hyetographs for the Alternating Block Method and the City’s Design Manual
6‐3 Hydrographs for the Alternating Block Method and the City’s Design Manual
7‐1 Hydraulic Structure Locations
8‐1 Depression Storage Sensitivity Analysis
8‐2 Average Capillary Suction Sensitivity Analysis
8‐3 Initial Moisture Deficit Sensitivity Analysis
8‐4 Percent Impervious Area Sensitivity Analysis
8‐5 Subbasin Width Sensitivity Analysis
8‐6 Manning’s Roughness Value Sensitivity Analysis
8‐7 Saturated Hydraulic Conductivity Sensitivity Analysis
8‐8 Peak Flow Rate Sensitivity Analysis
8‐9 Manning’s Roughness Value Sensitivity Analysis
10‐1 Flood Control Improvements Location Plan
10‐2 Location 3 – Long Pond
10‐3 Location 3 – Long Pond – Section
10‐4 Location 1 – Option A – Portugal Cove Road

CBCL Limited Contents v
10‐5 Location 1 – Option A – Portugal Cove Road – Section
10‐6 Location 1 – Option B – Portugal Cove Road
10‐7 Location 1 – Option C – Portugal Cove Road
10‐8 Upstream of Portugal Cove Bridge – Street View – BEFORE IMPROVEMENTS
10‐9 Upstream of Portugal Cove Bridge – Street View – AFTER IMPROVEMENTS
10‐10 Upstream of Portugal Cove Bridge – Trail View – BEFORE IMPROVEMENTS
10‐11 Upstream of Portugal Cove Bridge – Trail View – AFTER IMPROVEMENTS
10‐12 Location 2 – Upstream of Carpasian Road
10‐13 Location 2 – Upstream of Carpasian Road – Section
10‐14 Location 4 – Clinch Crescent
10‐15 Location 5 – Wicklow Street
10‐16 Location 6 – Avalon Mall Culvert
10‐17 Location 7 – O’Leary Avenue Bridge
10‐18 Location 8 – Mews Place Culvert
10‐19 Erosion Control Improvements – Location 1
10‐20 Erosion Control Improvements – Locations 2‐3
10‐21 Erosion Control Improvements – Location 4

CBCL Limited Executive Summary vi
EXECUTIVE SUMMARY
The Rennies River watershed has an area of approximately 32 km2 and contains several major water
courses, including Yellow Marsh Stream, Ken Brook, Leary’s Brook and Rennies River. Runoff from this
catchment ultimately discharges to Quidi Vidi Lake. During significant rainfall events, flooding has
occurred at locations along Ken Brook, Leary’s Brook and Rennies River. Flooding has, at a minimum,
been inconvenient for the residents of the City of St. John’s and, at other times, has resulted in major
public and private property damage. Consequently, the City has identified a need for an overall plan to
address flooding issues in the Rennies River catchment. One of the key components of this plan is a
prioritized list of flood protection infrastructure improvements.
The detailed scope of work for this study is as follows:
Carry out field surveys to obtain structure data;
Update intensity‐duration‐frequency curves to include most recent rainfall data and estimate
hyetographs to reflect changing climate conditions;
Determine 1:20 and 1:100 annual exceedance probability flood flows by using statistical
analysis;
Assemble hydrologic and hydraulic models of the study areas;
Calibrate the hydrologic and hydraulic models using available data;
Prepare hydrologic and hydraulic models of the study areas to reflect potential future land uses;
Complete sensitivity analysis on the hydrologic and hydraulic models;
Prepare floodplain and flood hazard maps for the 1:20 and 1:100 AEP events for existing
development conditions;
Prepare floodplain and flood hazard maps for the 1:20 and 1:100 AEP event for future
development conditions;
Develop preliminary designs for methods of flood control;
Identify areas with erosion problems and develop remedial plans; and
Prepare preliminary cost opinions and designs for the optimum flood and erosion control
methods selected.
Several flood protection approaches were evaluated using the hydrologic and hydraulic models
developed for this study, and the most optimum flood protection measures have been recommended
for the City’s consideration. In terms of overall impact on the study area, the most significant

CBCL Limited Executive Summary vii
recommended flood protection improvement is a weir proposed for the east end of Long Pond. The
construction of a weir at this location will result in reduced flooding downstream of Long Pond.
The flood control improvements recommended for downstream of Long Pond have been designed to
function with the weir at Long Pond in place. Consequently, the weir at Long Pond must be constructed
before the downstream improvements can be implemented. Given the extents of the flooding
experienced at locations downstream of Long Pond, these areas are considered by the City to be high
priority areas. Therefore, it is recommended that the weir at Long Pond be given first priority, and the
two problem areas located downstream of Long Pond be given second priority. It is recommended that
the remaining flood improvement recommendations be implemented in order from downstream to
upstream.
The following table summarizes the recommended flood improvement measures. Only one of the
options presented for location 1 needs to be implemented. The final decision regarding which of the
location 1 options to implement will be made by the Department of Planning, Development and
Engineering’s senior management in consultation with Council.
Erosion control improvements along Rennies River and Leary’s Brook can be accomplished using a
cellular confinement system as described in the report. It is estimated that approximately 4000 m2 of
the river banks need to be rehabilitated. Based on using a cellular confinement system, the cost opinion
to do this work is $567,000. All cost opinions presented in the report include engineering, construction
and HST.
CBCL recommends that the City move forward with the design and implementation of the proposed
flood and erosion control improvements. Further, CBCL recommends that the Provincial Department of
Environment and Conservation and the Department of Fisheries and Oceans be consulted during the
design of the proposed infrastructure improvements.
Priority Description of Location Cost Opinion
1 Location 3: Weir at outlet of Long Pond $1,979,000
2 Location 1, Option A: Kings Bridge Road to Portugal Cove Road & Upstream of Portugal Cove Road – Berms & Walls only
$1,173,000
Location 1, Option B: Kings Bridge Road to Portugal Cove Road & Upstream of Portugal Cove Road – New Channel and bridge
$3,891,000
Location 1, Option C: Kings Bridge Road to Portugal Cove Road & Upstream of Portugal Cove Road – Raised parking lot
$1,379,000
2 Location 2: Upstream of Carpasian Road Bridge $27,000
3 Location 4: Clinch Crescent East to Clinch Crescent West
$342,000
4 Location 5: Wicklow Street to Thorburn Road $294,000
5 Location 7: O'Leary Avenue Bridge $847,000
6 Location 8: Downstream of Mews Place $38,000

CBCL Limited Introduction 1
CHAPTER 1 INTRODUCTION
The Rennies River watershed has an area of approximately 32 km2 and contains several major water
courses, including Yellow Marsh Stream, Ken Brook, Leary’s Brook and Rennies River. Runoff from
this catchment ultimately discharges to Quidi Vidi Lake. During significant rainfall events, flooding
has occurred at locations along Ken Brook, Leary’s Brook and Rennies River. Flooding has, at a
minimum, been inconvenient for the residents of the City of St. John’s (City) and, at other times, has
resulted in major public and private property damage. Consequently, the City has identified a need
for an overall plan to address flooding issues in the Rennies River catchment. One of the key
components of this plan is a prioritized list of flood protection infrastructure improvements.
In October 2012, the City issued a Request for Proposals (RFP) for a stormwater management study
for the Rennies River drainage catchment. CBCL Limited (CBCL) was awarded this study in
November 2012. Our findings are presented in this report.
1.1 Study Scope The scope of work includes the following tasks:
Carry out field surveys to obtain structure data;
Update intensity‐duration‐frequency (IDF) curves to include most recent rainfall data and
estimate hyetographs to reflect changing climate conditions;
Determine 1:20 and 1:100 annual exceedance probability (AEP) flood flows by using
statistical analysis;
Assemble hydrologic and hydraulic models of the study areas using XPSWMM;
Calibrate the hydrologic and hydraulic models using available data;
Prepare hydrologic and hydraulic models of the study areas to reflect potential future land
uses;
Complete sensitivity analysis on the hydrologic and hydraulic models;
Prepare floodplain and flood hazard maps for the 1:20 and 1:100 AEP events for existing
development conditions;
Prepare floodplain and flood hazard maps for the 1:20 and 1:100 AEP event for future
development conditions;
Develop preliminary designs for methods of flood control;
Identify areas with erosion problems and develop remedial plans; and
Prepare preliminary cost opinions and designs for the optimum flood and erosion control
methods selected.

CBCL Limited Background Information 2
CHAPTER 2 BACKGROUND INFORMATION
2.1 Historical Flooding A search of online news articles and the provincial government website yielded a list of past flood
events in the Rennies River catchment caused by river flooding. These events are summarized
below:
April 11, 1986: Rainfall of 110 mm caused flooding along Leary’s Brook and Rennies River.
The Avalon Mall parking lot flooded, and there was an estimated 30 cm of water covering
Prince Philip Drive between the entrance to the Health Sciences Centre and the CBC
building. The water level in Rennies River reportedly rose 1.8 m above the normal water
level, destroying approximately 100 m of walking trail and causing severe flooding at Pringle
Place.
September 19‐20, 2001: Post‐tropical storm Gabrielle deposited 175 mm of rain in the city
of St. John’s, much of which fell within 6 hours or less, according to Environment Canada
(EC). Flooding caused road closures on Kenmount Road, The Boulevard, Portugal Cove
Road, Prince Philip Parkway and Clinch Crescent West. Carnell Drive was flooded, as was
the Avalon Mall parking lot. As well, forty‐five stores located in the Avalon Mall sustained
flood damage.
November 16, 2004: Rainfall caused minor flooding in St. John’s. For example, water built
up on Prince Philip Drive near the west entrance to the Health Sciences Centre, at Clinch
Crescent West.
April 11‐12, 2005: Rainfall of 70 mm caused flooding along Leary’s Brook, both upstream
and downstream of the Avalon Mall, the Clinch Crescent West entrance to the Health
Sciences to be temporarily closed, and the normal water level of Long Pond to rise by
between 1 and 2 m.
November 29, 2008: This storm dropped 100 mm of rain on the Northeast Avalon, most of
which fell in a 3 hour period, according to a CBC News report. The storm caused Rennies
River to overtop its banks near the entrance to Quidi Vidi, flooding the King George V Soccer
Pitch, causing an estimated $500,000 in damages to the artificial turf. Since the incident, a
berm has been constructed between Rennies River and the field, near the shoreline of Quidi
Vidi Lake.

CBCL Limited Background Information 3
September 20‐24, 2010: Rainfall associated with Hurricane Igor resulted in flooding at
several locations along Rennies River and Leary’s Brook, including Fieldian Grounds, Pringle
Place, Vaughan Place and the Prince Phillip Parkway in the vicinity of the CBC Building.
2.2 Previous Studies A literature review of previous flood studies was conducted to assess the underlying mechanisms of
flooding, as well as to identify any areas which experience frequent flooding. In 2002, H.T. Kendall
and Associates Ltd. completed a flood study titled Ken Brook and Leary’s Brook Floodplain
Delineation Study, and in 2006 Kendall Engineering Ltd. completed a floodplain mapping study of
Rennies River, Virginia River and Quidi Vidi River, titled Quidi Vidi Lake Tributary Flood Plain
Delineation. The findings of these two studies are summarized in the following sections.
2.2.1 Ken Brook and Leary’s Brook Floodplain Delineation Study
In October 2002, H.T. Kendall and Associates Ltd. completed a floodplain mapping study for the City
that examined the extent of flooding, identified flood hazard areas and proposed flood mitigation
strategies for Ken Brook and Leary’s Brook to the entrance to Long Pond. The study included
estimating the 1:100 AEP flows using HEC‐HMS and statistical techniques and delineating the
resulting floodlines by transposing the water surface elevations determined from the HEC‐RAS
model on to City mapping.
The results indicated that flooding is common along Ken Brook, especially in the vicinity of
undersized culverts located on private properties. It was also noted that the culverts located at
Clinch Crescent West and Pippy Place, as well as bridges located at Thorburn Road, Oxen Pond Foot
Bridge, Wicklow Street and Clinch Crescent East do not have capacity to pass the 1:100 AEP flow. In
addition, flood mitigating measures were advised in the river banks downstream of the Pippy Place
culverts, behind the Seaboard Building, downstream of the O’Leary Avenue Bridge, upstream and
downstream of the Wicklow Street Bridge, along Prince Philip Drive and upstream of the Clinch
Crescent East Bridge.
2.2.2 Quidi Vidi Lake Tributary Flood Plain Delineation
Kendall Engineering Ltd. completed the Quidi Vidi Lake Tributary Flood Plain Delineation study in
August 2006. The study used HEC‐HMS to estimate flood flows along the rivers, then modelled river
cross sections in HEC‐RAS to determine the extent of flooding. The hydraulic model for Rennies
River extended 1,300 m from the entrance to Quidi Vidi Lake and included 42 cross sections and five
river crossings, namely: Carnell footbridge, Carnell Bridge, footbridge at Loblaws, Kings Bridge Road
Bridge, and Portugal Cove Road Bridge.
The study found that two large areas are prone to flooding during the 1:100 AEP flood; Portugal
Cove Road Bridge and the floodplain immediately upstream and downstream, as well as the
floodplain from Kings Bridge Road Bridge to Quidi Vidi Lake. To mitigate flooding near the Portugal
Cove Road Bridge, the study recommends alterations to the bridge, which include removing
sediment beneath the bridge, removing concrete obstructions in the downstream channel and
raising the north bank of Rennies River for approximately 150 m upstream of the bridge. However,

CBCL Limited Background Information 4
even with these modifications, a large portion of the soccer pitch at Fieldian Grounds and the
Riverdale Tennis Club grounds would still be flooded. To minimize the extend of flooding between
Kings Bridge Road Bridge and Quidi Vidi Lake, the report suggests constructing berms or levees along
the north bank of Rennies River from Kings Bridge Road Bridge to Carnell Bridge and raising the
footbridge at Loblaws. However, these alterations will not prevent all the flooding problems; a large
portion of the Loblaws parking lot as well as sections of Carnell Drive and Lake Avenue will still be
within the flood limits.

CBCL Limited Data Collection and Analysis 5
CHAPTER 3 DATA COLLECTION AND ANALYSIS
3.1 Data Collection Several sources of data were required to accurately assemble the hydrologic and hydraulic models.
Items included in the data collection process are as follows:
Aerial photography of the study area provided by the City;
LiDAR data of the study area provided by the City;
Zoning and property mapping provided by the City;
Future development data provided by the City;
Bridge construction drawings provided by the City;
Construction drawings of flood control structure for Quidi Vidi Lake provided by the City;
Watershed delineations provided by the City;
Water levels measurement provided by the City;
Flow gauging data provided by Environment Canada (EC);
Precipitation data provided by EC; and
Hydraulic structure details obtained from field investigation.
3.1.1 Calibration Data
Meteorological data and hydrologic data, including flows and water levels, were obtained for use in
this study.
There is one long‐term flow gauge in operation on Leary’s Brook. The gauge is located upstream of
Wicklow Street and is operated by the Water Survey of Canada under the name Leary’s Brook at
Prince Philip Drive (EC #02ZM02). The flow gauge has a contributing drainage area of approximately
17.8 km2 and has been in operation since 1985. There is no flow gauge located within the lower
reaches of the Rennies River. However, three water level monitoring gauges are in operation within
the Rennies River study area including: Long Pond Bridge, Kings Bridge Road, and Prince Philip Drive
at Rennies River. Figure 3‐1 shows the location of these gauging stations.

CBCL Limited Data Collection and Analysis 6
FIGURE 3‐1 FLOW AND WATER LEVEL GAUGE STATIONS

CBCL Limited Data Collection and Analysis 7
The use of the above data in the model calibration is discussed further in Chapter 6.
3.1.2 Detailed Topographic Data
To generate the topographic information for the model, LiDAR point data (with a 1‐m grid
resolution) provided by the City was used to develop a topographic grid system. LiDAR mapping of
the study area was produced at 1‐m resolution.
3.1.3 Hydraulic Structure Details
Photos, measurements and notes from field investigations of the hydraulic structures were
collected. Thirty structures in total were investigated and assessed for hydraulic capacity. The
hydraulic structure capacity assessment is discussed further in Chapter 6.
Bridge data was collected for the eleven bridge crossings within the study area for the hydraulic
model. These represent critical points of energy losses and have a dominant role in generating peak
water levels. Bridge opening geometry and bridge deck elevations were compiled from construction
drawings and field measurements.
3.2 Data Analysis
3.2.1 Land Use Mapping
Land use mapping of the study area was developed using the aerial photography, zoning and
property mapping and is presented in Figure 3‐2. The land use mapping was used to estimate
roughness coefficients for the sub‐watersheds (this hydrologic parameter affects the time of
concentration or lag time. As shown in Figure 3‐2, land uses were divided into the following
categories:
Medium Density Residential;
Low Density Residential;
Commercial;
Water; and
Vegetation.

CBCL Limited Data Collection and Analysis 8
FIGURE 3‐2 LAND USE MAPPING

CBCL Limited Data Collection and Analysis 9
3.2.2 Watershed Delineation and Watershed Properties
Watershed delineations provided by the City were reviewed and refined using the LiDAR data to
delineate the sub‐watersheds along the Rennies River catchment. Maps of the watershed
delineations are presented in Figure 3‐1.
Watershed characteristics were estimated for each sub‐watershed and are presented in Table 3‐1.
The watershed characteristics were estimated using the LiDAR data, aerial photography, land use
mapping, and the City’s Subdivision Design Manual.
TABLE 3‐1 WATERSHED CHARACTERISTICS
Name Area (ha)
Subbasin Slope (%)
Percent Impervious Area (%)
Manning's Roughness Values
Depression Storage (mm)
Average Capillary Suction (mm)
Saturated Hydraulic
Conductivity (mm/h)
Initial Moisture Deficit Width
(m) Imperv. Area
Perv. Area
Imperv. Area
Perv. Area
Sub‐Watershed1 179.69 595.83 3.1 9.4 0.02 0.5 1 2.5 200 0.001 0.3
Sub‐Watershed2 183.28 477.92 4.8 20.6 0.02 0.5 1 2.5 200 0.001 0.3
Sub‐Watershed3 285.18 476.69 3.8 4.3 0.02 0.5 1 2.5 200 0.001 0.3
Sub‐Watershed4 195.89 566.11 5.2 23.6 0.02 0.5 1 2.5 200 0.001 0.3
Sub‐Watershed5 845.24 1086.96 2.5 9.8 0.02 0.5 1 2.5 200 0.001 0.3
Sub‐Watershed6 284.48 560.43 4.9 39 0.02 0.5 1 2.5 200 0.001 0.3
Sub‐Watershed7 488.66 779.78 6.8 12.7 0.02 0.5 1 2.5 200 0.001 0.3
Sub‐Watershed8 96.15 316.31 8.8 31 0.02 0.5 1 2.5 200 0.001 0.3
Sub‐Watershed9 336.99 469.90 4.7 43.1 0.02 0.5 1 2.5 200 0.001 0.3
Sub‐Watershed10 288.66 702.95 7.6 37.2 0.02 0.5 1 2.5 200 0.001 0.3

CBCL Limited Update of IDF Curves and Design Hyetographs 10
CHAPTER 4 UPDATE OF IDF CURVES AND DESIGN
HYETOGRAPHS
4.1 IDF Curves IDF curves describe rainfall patterns for a particular geographical area. They are created by
performing statistical analysis on rainfall data recorded by a rain gauge. The result is a set of curves
representing rainfall intensities for a range of storm durations for various return periods, typically
the 1:2, 1:5, 1:10, 1:25, 1:50 and 1:100 AEP.
For this study, CBCL updated IDF curves for the rain gauge located at the St. John’s International
Airport in order to account for the significance of recent extreme rainfall events.
4.1.1 Existing Data
EC maintains rain gauges throughout Newfoundland and Labrador and, traditionally, has been
responsible for creating IDF curves from the recorded data. The rain gauge nearest to the study
area is located at the St. John’s International Airport (EC #8403506) at an elevation of 131 m. A
tipping bucket rain gauge was used to recorded data at 5‐minute intervals until the end of 1996. In
1997, the tipping bucket was replaced with a Fisher and Porter rain gauge which archives data every
six hours. The IDF curves for the Airport gauge were last updated by EC in 1996 and are found in
Appendix A.
4.1.2 Additional Data
EC continues to record rainfall amounts at the St. John’s Airport rain gauge; however, intensities are
not currently being recorded.
The City owns and operates three rain gauges, located at Ruby Line, Blackler Avenue and Windsor
Lake. The Windsor Lake gauge is located approximately 1.6 km southwest of the previously
operated St. John’s Airport gauge. It observes rainfall over the Windsor Lake and Broad Cove River
watershed, as well as parts of Outer Cove Brook, Stick Pond Brook, Coaker’s Meadow Brook, Virginia
River and Rennies River. The Windsor Lake gauge is a Met One tipping bucket gauge, installed at an
elevation of 159 m. It was installed in December of 1998 and records data at 1‐minute intervals.
The close proximity of the two gauges gives an initial indication that the two data sets can be

CBCL Limited Update of IDF Curves and Design Hyetographs 11
combined. The report titled Rainfall Distribution in the City of St. John’s: Temporal Distribution,
Spatial Variation, Frequency Analysis, and Tropical Storm Gabrielle examined the appropriateness of
combining the two data sets by comparing overlapping data recorded between 1999 and 2001 at
the two gauges. This study determined a correlation coefficient of 0.9 for the daily rainfall
comparison, implying a strong relationship and suggesting that the observed rainfall at both
locations is uniform.
4.1.3 Update
Data from the Windsor Lake gauge was obtained from the City for 2001‐2012 in 5‐minute intervals.
Annual maximums for 5, 10, 15, and 30‐minute and 1, 2, 6, 12 and 24‐hour intervals were extracted
and combined with those data sets for the St. John’s Airport gauge. Summaries of the annual
maximum data for these durations are presented in Appendix B.
The largest 6, 12, and 24‐hour rainfall maximums on record occurred in 2001 during Tropical Storm
Gabrielle. The IDF update completed by the City in 2002 omitted this storm from the data series
since at the time it was considered an outlier when compared to the remaining data set. Since
2002, there have been two additional rainfall events with recorded precipitation amounts that are
larger than the remaining data sets. These events occurred in 2007 (Tropical Storm Chantal) and
2010 (Hurricane Igor). However, the data series indicates that Tropical Storm Gabrielle is the largest
precipitation event recorded at the Windsor Lake gauge and could still be considered an outlier.
Through discussions with City officials, CBCL learned that the recorded rainfall during Hurricane Igor
was likely underestimated at all of the City’s gauges. The City indicated that flows recorded at
hydrometric stations throughout the City were higher during Hurricane Igor than Tropical Storm
Gabrielle. The actual 24‐hour rainfall is estimated to be between 180 and 200 mm rather than the
recorded 113.8 mm. This variation in actual and recorded precipitation can be attributed to the high
winds experienced during the storm blowing rain out of the collection device. Considering this
underestimation of the Hurricane Igor rainfall amount, we decided to retain Tropical Storm Gabrielle
record for the statistical analysis, as omitting it would likely underestimate the return period rainfall
amounts.
Statistical analyses were performed on each of the eight data sets to update the IDF curves. Several
distributions were examined including the Lognormal, 3‐Parameter Lognormal (3PLN), Log Pearson
Type III and the Gumbel distributions. Each distribution was examined based on visual goodness‐of‐
fit and several statistical tests. The 3PLN distribution was chosen for the IDF update. Distribution
plots and screening tests are contained in Appendix C.
4.1.4 Results
The updated IDF curves for the 1:2, 1:5, 1:10, 1:20, 1:50 and 1:100 AEP are presented in Figure 4‐1.
The intensities estimated for each return period and storm duration are presented in Table 4‐1.

CBCL Limited Update of IDF Curves and Design Hyetographs 12
FIGURE 4‐1 IDF CURVES
TABLE 4‐1 UPDATED IDF RAINFALL INTENSITIES
Duration (min)
Intensity (mm/hr)
2yr L95% U95% 5yr L95% U95% 10yr L95% U95% 20yr L95% U95% 25yr L95% U95% 50yr L 95% U95% 100yr L 95% U95%
5 55.44 50.12 60.76 74.28 68.96 79.60 86.16 80.84 91.48 97.08 91.76 102.40 100.56 95.24 105.88 110.88 105.56 116.20 121.20 115.88 126.52
10 43.68 39.99 47.32 56.52 52.87 60.20 64.20 60.29 67.63 70.20 66.77 74.11 72.60 68.69 76.03 78.00 74.45 81.79 83.40 79.85 87.19
15 36.92 32.90 40.91 48.40 44.43 52.45 55.20 51.07 59.09 60.80 56.95 64.97 62.80 58.75 66.77 68.00 63.99 72.01 72.80 68.91 76.93
30 26.60 23.43 29.77 35.20 32.03 38.37 40.80 37.63 43.97 45.80 42.63 48.97 47.40 44.23 50.57 52.20 49.03 55.37 56.80 53.63 59.97
60 18.90 17.07 20.73 25.30 23.47 27.13 29.30 27.47 31.13 33.10 31.27 34.93 34.30 32.47 36.13 37.90 36.07 39.73 41.50 39.67 43.33
120 12.75 11.11 14.39 17.60 15.96 19.24 20.90 19.26 22.54 24.20 22.56 25.84 25.25 23.61 26.89 28.50 26.86 30.14 31.85 30.21 33.49
360 7.20 6.08 8.32 9.65 8.53 10.77 11.47 10.35 12.58 13.32 12.20 14.43 13.93 12.82 15.05 15.90 14.78 17.02 18.00 16.88 19.12
720 4.53 3.75 5.30 6.12 5.35 6.89 7.32 6.55 8.09 8.58 7.81 9.35 9.00 8.23 9.77 10.33 9.56 11.10 11.75 10.98 12.52
1440 2.68 2.28 3.07 3.57 3.18 3.97 4.25 3.85 4.65 4.96 4.56 5.35 5.21 4.81 5.60 5.96 5.56 6.35 6.75 6.35 7.15

CBCL Limited Update of IDF Curves and Design Hyetographs 13
4.2 Design Hyetographs Rainfall hyetographs show how the total depth (or intensity) of rainfall in a storm is distributed
among time increments. Synthetic hyetographs, which are systematic, reproducible methods for
varying rainfall over a period of time, are used as input in hydrologic modeling. The City has
published a set of synthetic rainfall distributions, or design hyetographs, that are contained in the
Subdivision Design Manual. The shape of the City’s design hyetographs is based on historical rainfall
data.
For this study, CBCL developed design hyetographs based on the updated IDFs described above, and
climate change projections prepared by Dr. Joel Finnis, Professor, Department of Geography,
Memorial University of Newfoundland. Further, the design hyetographs were produced using the
shape of the City’s design hyetographs contained in the Subdivision Design Manual, and the
alternating block method. Using two different techniques to develop design hyetographs allowed
for a more rigorous examination of peak flows. A discussion of the flows modeled using the various
design hyetographs and the ultimate selection of design flows is presented in Chapter 6.
In summary, four sets of design hyetographs were developed using the following combinations:
Updated IDFs and the City’s hyetograph shape;
Updated IDFs and the alternating block method;
Climate change projections and the City’s hyetograph shape; and
Climate change projections and the alternating block method.
4.2.1 Updated IDFs
The 1:20 and 1:100 AEP design hyetographs based on the City’s shape are presented in Tables 4‐2
and 4‐3.
TABLE 4‐2 1:20 AEP RAINFALL HYETOGRAPHS – UPDATED IDFS AND CITY’S HYETOGRAPH SHAPE
% Time 1:20 AEP Cumulative Rainfall (mm)
0.5 Hour 1 Hour 2 Hour 6 Hour 12 Hour 24 Hour
0.00% 0.0 0.0 0.0 0.0 0.0 0.0
8.33% 1.6 2.3 3.3 5.4 1.0 8.0
16.67% 3.9 5.6 8.2 13.6 2.1 20.2
25.00% 6.9 10.0 14.6 24.0 7.2 35.8
33.33% 10.8 15.6 22.9 37.8 18.5 56.3
41.67% 15.5 22.4 32.8 54.1 39.1 80.5
50.00% 19.1 27.6 40.4 66.7 64.9 99.3
58.33% 20.3 29.4 43.0 70.9 83.4 105.6
66.67% 21.3 30.7 44.9 74.1 93.7 110.4
75.00% 22.0 31.8 46.5 76.7 98.9 114.3
83.33% 22.5 32.6 47.6 78.5 100.9 117.0
91.67% 22.8 32.9 48.1 79.4 102.0 118.3
100.00% 22.9 33.1 48.4 79.9 103.0 119.0
CBCL Limited Update of IDF Curves and Design Hyetographs 14
TABLE 4‐3 1:100 AEP RAINFALL HYETOGRAPHS – UPDATED IDFS AND CITY’S HYETOGRAPH SHAPE
% Time 1:100 AEP Cumulative Rainfall (mm)
0.5 Hour 1 Hour 2 Hour 6 Hour 12 Hour 24 Hour
0.00% 0.0 0.0 0.0 0.0 0.0 0.0
8.33% 1.9 2.8 4.3 7.3 1.4 10.9
16.67% 4.9 7.0 10.9 18.4 2.9 27.5
25.00% 8.5 12.5 19.2 32.4 9.9 48.7
33.33% 13.4 19.6 30.1 51.1 25.3 76.6
41.67% 19.2 28.0 43.1 73.1 53.5 109.6
50.00% 23.7 34.6 53.2 90.1 88.8 135.1
58.33% 25.2 36.9 56.6 95.9 114.2 143.7
66.67% 26.4 38.5 59.1 100.2 128.3 150.3
75.00% 27.3 39.9 61.2 103.7 135.4 155.6
83.33% 27.9 40.8 62.6 106.2 138.1 159.3
91.67% 28.2 41.2 63.3 107.4 139.6 161.0
100.00% 28.4 41.5 63.7 108.0 141.0 162.0
The complete set of updated design hyetographs (i.e. 1:2, 1:5, 1:10, 1:20, 1:25, 1:50 1:100 AEP) with
the upper and lower confidence intervals are presented in Appendix D.
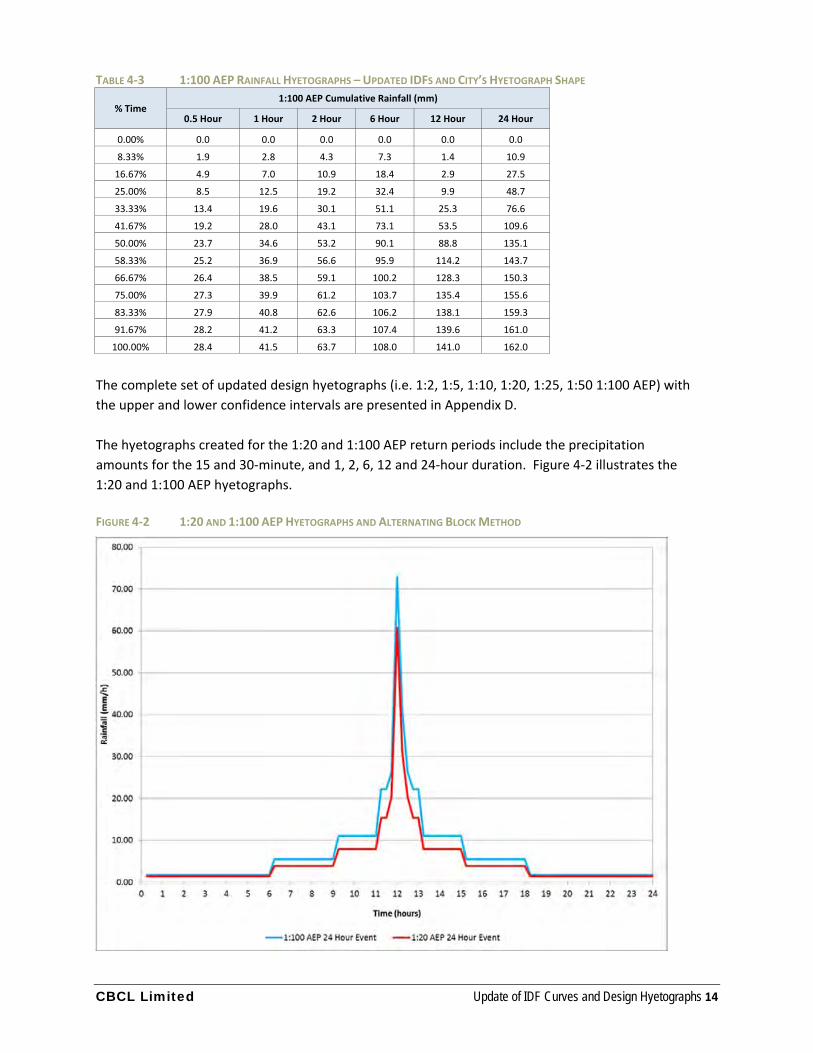
The hyetographs created for the 1:20 and 1:100 AEP return periods include the precipitation
amounts for the 15 and 30‐minute, and 1, 2, 6, 12 and 24‐hour duration. Figure 4‐2 illustrates the
1:20 and 1:100 AEP hyetographs.
FIGURE 4‐2 1:20 AND 1:100 AEP HYETOGRAPHS AND ALTERNATING BLOCK METHOD

CBCL Limited Update of IDF Curves and Design Hyetographs 15
4.2.2 Climate Change Projections
A report by Dr. Joel Finnis describing the climate change projections is included in Appendix E. The
projections developed for the 2062 period are presented in Table 4‐4.
TABLE 4‐4 RETURN PERIOD VALUES FOR 24‐HOUR PRECIPITATION (MM) BASED ON ANALYSIS BY DR. JOEL FINNIS
Return Period (yr) Extreme 24 hour Precipitation Amounts (mm) Ratio to Updated IDF
2 71.4 1.11
5 98.3 1.15
10 116.3 1.14
20 133.5 1.12
25 139.0 1.11
50 155.9 1.09
100 172.7 1.07
Design hyetographs based on the City’s shape are presented in Tables 4‐5 and 4‐6.
TABLE 4‐5 1:20 AEP RAINFALL HYETOGRAPHS – CLIMATE CHANGE AND CITY’S HYETOGRAPH SHAPE
% Time 1:20 AEP Cumulative Rainfall (mm)
0.5 Hour 1 Hour 2 Hour 6 Hour 12 Hour 24 Hour
0.00% 0.0 0.0 0.0 0.0 0.0 0.0
8.33% 2.0 2.7 3.5 5.8 1.1 9.0
16.67% 5.2 6.7 8.9 14.5 2.3 22.7
25.00% 9.1 12.0 15.8 25.6 7.8 40.2
33.33% 14.2 18.7 24.7 40.3 20.0 63.1
41.67% 20.3 26.8 35.4 57.7 42.2 90.3
50.00% 25.1 33.1 43.6 71.1 70.0 111.4
58.33% 26.7 35.2 46.4 75.6 90.0 118.5
66.67% 28.0 36.8 48.5 79.0 101.1 123.9
75.00% 29.0 38.1 50.2 81.8 106.7 128.3
83.33% 29.6 39.0 51.4 83.8 108.8 131.3
91.67% 29.9 39.4 52.0 84.7 110.0 132.7
100.00% 30.1 39.7 52.3 85.2 111.1 133.5
TABLE 4‐6 1:100 AEP RAINFALL HYETOGRAPHS – CLIMATE CHANGE AND CITY’S HYETOGRAPH SHAPE
% Time 1:100 AEP Cumulative Rainfall (mm)
0.5 Hour 1 Hour 2 Hour 6 Hour 12 Hour 24 Hour
0.00% 0.0 0.0 0.0 0.0 0.0 0.0
8.33% 2.5 3.4 4.5 7.4 1.5 11.6
16.67% 6.4 8.4 11.2 18.4 2.9 29.3
25.00% 11.3 15.0 19.9 32.5 10.1 51.9
33.33% 17.7 23.5 31.2 51.1 25.8 81.6
41.67% 25.3 33.6 44.6 73.2 54.4 116.8
50.00% 31.3 41.4 55.0 90.2 90.3 144.1
58.33% 33.3 44.1 58.5 96.0 116.2 153.2
66.67% 34.8 46.0 61.1 100.2 130.5 160.3
75.00% 36.0 47.7 63.3 103.8 137.7 165.9
83.33% 36.8 48.9 64.8 106.3 140.5 169.8
91.67% 37.3 49.3 65.5 107.5 142.0 171.7
100.00% 37.5 49.7 65.9 108.1 143.4 172.7

CBCL Limited Update of IDF Curves and Design Hyetographs 16
The complete set of updated design hyetographs (i.e. 1:2, 1:5, 1:10, 1:20, 1:25, 1:50 1:100 AEP) with
the upper and lower confidence intervals are presented in Appendix F.
The hyetographs created for the 1:20 and 1:100 AEP return periods include the precipitation
amounts for the 15 and 30‐minute, and 1, 2, 6, 12 and 24‐hour duration. Figure 4‐3 illustrates the
1:20 and 1:100 AEP hyetographs.
FIGURE 4‐3 1:20 AND 1:100 AEP HYETOGRAPHS – CLIMATE CHANGE AND ALTERNATING BLOCK METHOD

CBCL Limited Statistical Analysis 17
CHAPTER 5 STATISTICAL ANALYSIS
In accordance with the RFP, the 1:20 and 1:100 AEP flood flows at the EC gauge on Leary’s Brook
were estimated by performing a flood frequency analysis. Although there is no defined length of
record that should be used to estimate flood flows, the Regional Flood Frequency Analysis for the
Island of Newfoundland suggests a period of record exceeding 18 years to sufficiently estimate the
1:100 AEP flood. There are 26 years of annual instantaneous maximum data recorded at the Leary’s
Brook gauge. As such, this gauge can be used to estimate a 1:100 AEP flow, but the estimate should
be used with caution.
The annual peak instantaneous flow series for the gauge is provided in Appendix G. At the time of
this study only data from 1987 to 2010 was available on EC’s website for the gauge. Therefore, EC
was contacted to obtain the peak instantaneous flows for 2011 and 2012. These two data points are
included with the data series; however, EC noted that the 2011 and 2012 data is preliminary only
and subject to change. In addition, the data series for Leary’s Brook gauge had one missing data
point for 1991. The peak flow was estimated prior to conducting frequency analysis by estimating a
peaking factor for the gauge. The peaking factor is calculated by dividing the peak instantaneous
flow by the maximum daily flow for each annual pair and averaging the results. To estimate the
absent peak instantaneous flow, the peaking factor is multiplied by the daily maximum value for
that year. This estimated value is also included with the data series contained in Appendix G.
Prior to conducting the frequency analysis, several statistical screening tests were performed on the
data. These tests include the following:
Randomness: variations in the data set are a result of natural causes (i.e. the flow is not
regulated)
Independence: each recorded flow is independent of the other
Stationarity: the data series does not display trend with respect to time
Homogeneity: all the data points are derived from a single population
Plots of the distributions for the flow gauge data and the associated screening tests are included in
Appendix G. The results indicate that the data is random, does not display dependence, does not
display trend and does not display a significant difference in location.

CBCL Limited Statistical Analysis 18
Several statistical distributions were examined, including Gumbel, Generalized Extreme Value (GEV),
Lognormal, 3‐Parameter Lognormal and Log Pearson Type III. The most appropriate distribution was
selected based on visual goodness‐of‐fit and statistical test. Figure 5‐1 illustrates the selected
distribution, along with the 95% confidence interval. The resulting AEP flow estimates are listed in
Table 5‐1.
FIGURE 5‐1 LEARY’S BROOK AT PRINCE PHILIP DRIVE–FREQUENCY ANALYSIS
TABLE 5‐1 SINGLE STATION FREQUENCY ANALYSIS RESULTS
Station Name Distribution 1:20 AEP flood flow
(m3/s)
1:100 AEP flood flow (m
3/s)
Leary’s Brook at Prince Philip Drive 3PLN 41.8 61.9

CBCL Limited Hydrologic Modeling 19
CHAPTER 6 HYDROLOGIC MODELING
The 1:20 and 1:100 AEP flood flows for Rennies River were estimated using deterministic (modeling)
approaches. The deterministic approach involved creating a hydrologic model of the watercourse to
determine flood flows.
The modeling software XPSWMM, Version 13 (with Service Pack 1 installed), was used to create a
hydrologic model of the study area. XPSWMM is a comprehensive software package used for
dynamic modeling of stormwater, sanitary and river systems. The program was created by XP
Software and uses a modified EPA SWMM engine for the runoff hydrograph simulation method. It
uses the capabilities of SWMM and combines it with a user‐friendly interface and the ability to link
the 1D SWMM model to a 2D overland flow model. It simulates natural rainfall‐runoff processes of
the watershed systems, using climate data as dynamic inputs.
6.1 Model Development All sub‐watersheds in the study area were modelled with the characteristics shown in Table 3‐1. The
Green‐Ampt Infiltration method was used for infiltration calculations. Rainfall hyetographs used for
runoff calculations included the 1:20 and 1:100 AEP precipitation amounts. Peak flows were
determined for existing and future development, and will serve as inputs to the hydraulic model to
determine flood lines. For future flow calculation, the percent impervious area parameter was
changed in the calibrated model to reflect future development. It was assumed 80%
imperviousness for future phases based on the City’s Subdivision Design Manual. Table 6‐1 shows
the impervious area changes for the sub‐watersheds with future development.
TABLE 6‐1 IMPERVIOUS AREA CHANGES FOR FUTURE DEVELOPMENT
Name Watershed
Area (ha)
Future Impervious
Area (ha)
Percent Impervious Area (%)
Existing Future
Sub‐Watershed1 179.69 99.45 9.4 53.7
Sub‐Watershed2 183.28 65.39 20.6 49.1
Sub‐Watershed3 285.18 42.03 4.3 16.1
Sub‐Watershed4 195.89 28.58 23.6 35.3

CBCL Limited Hydrologic Modeling 20
It should be noted that while the RFP requires that three development scenarios be addressed –
existing, future and ultimate – only the existing and future scenarios are discussed in this report.
The reason for this deviation from the RFP is that with the adoption of the City’s Stormwater
Detention Policy, there will be a net‐zero‐increase in stormwater runoff rendering the future and
ultimate development scenarios to be identical.
6.2 Model Calibration Calibration of the Rennies River catchment XPSWMM model was undertaken through a comparison
of simulated hydrographs and observed hydrographs at the location of the Leary’s Brook at Prince
Philip Drive gauge.
A rainfall‐runoff event from September 20‐24, 2010 (during Hurricane Igor) was selected for
calibration. Hourly flow data was obtained from the Water Survey of Canada for the above‐noted
gauge locations. Five‐minute interval rainfall data was also obtained at the Windsor Lake rain gauge
for this time period from the City.
Model parameters were adjusted until a reasonable calibration was achieved. Illustrated in
Figure 6‐1 is the result from the model calibration. As shown, the XPSWMM model provides a
reasonably accurate estimation of flows.
FIGURE 6‐1 HYDROLOGIC MODEL CALIBRATION

CBCL Limited Hydrologic Modeling 21
Since no flow data is available to calibrate the lower reach of Rennies River (sub‐watersheds 7‐10)
for Hurricane Igor, model parameters were determined by extrapolating the watershed parameters
from the upstream areas to obtain the 1:20 and 1:100 AEP flows for these sub‐watersheds.
6.3 Hyetograph Selection Rainfall hyetographs and the resulting flows for both the alternating block method and the City
Design Manual shapes were compared to identify the most suitable approach. These are shown
below.
FIGURE 6‐2 HYETOGRAPHS FOR THE ALTERNATING BLOCK METHOD AND THE CITY’S DESIGN MANUAL
As seen on Figure 6‐2, the peak intensity of the alternating block method is almost 6 times the peak
intensity of the City Design Manual method, even though the total volumes for the two methods are
the same. The City’s Subdivision Design Manual method works in 2‐hours increments, whereas the
alternating block method uses a time span of only 5 minutes at the peak intensity. Therefore, if the
time of concentration (or lag time) of the watershed is less than 2 hours, there will be a difference in
the flow calculation. Since this is indeed the case, it is normal to see a difference in flow calculation
results. The more accurate method is the one that allows the watershed to see a peak intensity that
corresponds to the same or a smaller duration than that of its time of concentration (or lag time).
‐ Alternating Block Method
‐ City’s Design Manual

CBCL Limited Hydrologic Modeling 22
The smaller duration storms (6‐hour and 12‐hour durations) of the City’s Subdivision Design Manual
method have correspondingly smaller increments, which help define the peak rainfall intensities
better. However, the volume of rainfall is now smaller, which affects the flow buildup and results in
smaller peaks.
FIGURE 6‐3 HYDROGRAPHS FOR THE ALTERNATING BLOCK METHOD AND THE CITY’S DESIGN MANUAL
The hydrographs in Figure 6‐3 show this phenomenon. In addition, the figure shows that the total
volume of runoff looks equivalent for both methods.
The alternating block method was therefore used for floodplain delineation as well as for evaluating
the efficiency of various flood mitigation measures.
6.4 Simulated Flood Flows The benefit of estimating flood flows using a deterministic method is that site‐specific watershed
characteristics are used to predict flood flows. As well, observed and planned changes within the
basin can be simulated to determine impacts on flood flows.
Using information from the City’s zoning maps, hydrologic parameters were altered in the models to
reflect future development conditions. The 1:20 and 1:100 AEP hyetographs (described above) were
simulated and the peak flood flows at the outlets were extracted.
‐ Alternating Block Method
‐ City’s Design Manual

CBCL Limited Hydrologic Modeling 23
The uncalibrated 1:20 and 1:100 AEP flow estimates at the outlets of Rennies River, for existing and
future development conditions, are presented in Table 6‐2. Existing flows were modeled using the
hyetographs based on the updated IDFs and the alternating block method; whereas future flows
were modeled using the hyetographs based on the climate change projections and the alternating
block method.
TABLE 6‐2 1:20 AND 1:100 AEP FLOW ESTIMATES FOR EXISTING AND FUTURE DEVELOPMENT CONDITIONS
Location 1:20 AEP Event Peak Flow (m
3/s) 1:100 AEP Event Peak Flow (m
3/s)
Existing Flow Future Flow Existing Flow Future Flow
Great Eastern Ave. at Ken Brook 6.1 15.1 8.2 20.3
Lady Smith Dr. at Ken Brook 15.5 29.7 20.8 39.9
NL Power Yard at Yellow Marsh Brook 20.4 39.7 27.5 53.4
Pippy Place at Leary’s Brook 31.9 53.8 42.9 72.4
O'Leary Ave. at Leary’s Brook 50.3 72.2 67.8 97.3
Wicklow St. at Leary’s Brook 68.1 90.1 91.9 121.4
Allandale Rd. at Rennies River 85.0 106.9 114.6 144.1
Prince Philip Dr. at Rennies River 92.6 114.6 124.7 154.2
Portugal Cove Rd. at Rennies River 111.0 133.0 149.8 179.3
Carnell Dr. at Rennies River 132.6 154.6 178.7 208.2
The flows presented in Table 6‐2 for Rennies River (last four rows of the table) were adjusted during
the hydraulic model calibration. These adjusted flows, which are presented in Chapter 7, were used
in the creation of floodplain mapping and to develop the preliminary flood and erosion control
designs.
CBCL Limited Hydraulic Modeling 24
CHAPTER 7 HYDRAULIC MODELING
The purpose of the hydraulic analysis is to translate the 1:20 and 1:100 AEP flood flows, estimated
during the hydrologic analysis, into floodplain mapping.
Hydraulic modeling was carried out using 2D XPSWMM model. The 2D module available for
XPSWMM allows the user to utilize the 1D river modeling capability of the XPSWMM software with
a 2D TUFLOW‐based overland flow model. GIS data can be used to input a variety of information
into the model including topography, land cover categories, model boundaries, and node and
channel networks.
It was found that for conditions where the flows were contained within a well‐defined channel, 1D
hydrodynamic modelling is an effective method of representing flood characteristics. However,
when flows become more complex 2D hydrodynamic modelling provides a more complete
indication of flooding extents and other characteristics. 2D modeling has the advantage that it can
resolve various surface water paths, with varying velocities, including splitting of flows, circulation
and rejoining of various flow branches, which is typical in floodplains of urban areas.
7.1 Model Development
7.1.1 Model Input
The approach adopted in this study is to model hydraulic structures as a 1D network nested within
the 2D domain representing the floodplain. The first modelling step is to divide the catchment into
a network of small cells, which form a grid. A 5‐m grid was chosen considering the size of the
channel and computational time required to run the model. The 5‐m grid may appear to be
“coarse” considering that the City provided 1‐m LiDAR data to use in developing the models. To
identify any potential shortcomings or advantages of using a coarse grid, CBCL carried out a
comparative analysis between using a 5‐m grid and 2‐m grid. The analysis revealed that the 5‐m
grid produced acceptable results.

CBCL Limited Hydraulic Modeling 25
The second modelling step is to develop a ground model using the LiDAR data by transferring
elevations to the centre of each cell. The extents of the 2D domain were defined based on the
general land topography which included the low‐lying floodplain areas that are likely to be flooded.
Hydraulic structures including culverts and bridges were then input into the model as a 1D network.
The inverts, dimensions and channel cross sections for these structures were surveyed between
April and August 2013 and used to define the hydraulic geometry of the 1D network. The channel
roughness or bed resistance values were assigned based on the current land use.
An important aspect of the model is to define 1D/2D linkages using lines where there is flow
interchange between 1D and 2D components of the model. These lines are located at the inlet and
outlet of these structures to define where flow will interact between the 1D hydraulic structures and
the 2D floodplain. The model upstream boundary was represented as flow boundary and the
downstream as head boundary. The software version used in this study only allows for a maximum
of 29,999 grid cells. There were seven models developed to cover the whole study area.
7.1.2 Structures
Structures located along the river reach were entered in the hydraulic model. These structures are
listed in the following table. The additional data required to effectively model the structures were
collected during the field investigations. Hydraulic structure data sheets including photos and a
description of each structure are provided in Appendix H. Structure Locations are showed in Figure
7‐1 and listed in Table 7‐1.

CBCL Limited Hydraulic Modeling 26
FIGURE 7‐1 HYDRAULIC STRUCTURE LOCATIONS

CBCL Limited Hydraulic Modeling 27
TABLE 7‐1 HYDRAULIC STRUCTURES LOCATED ON MAIN RIVER REACHES
Reach ID Structure Hydraulic Structure Data Sheet
Ken Brook
1 Culvert at Great Eastern Ave. Culvert No. 1
2 Culvert Next to Tim Horton’s Culvert No. 2
3 Culvert at NL Power Access Culvert No. 3
4 Culvert at Lady Smith Dr. Culvert No. 4
5 Culvert at Wing ‘n it Culvert No. 5
6 Bridge at Private Driveway Bridge No. 1
7 Culvert at Keith Gordon Car Sales Culvert No. 6
8 Culvert at Discount Rentals Culvert No. 7
9 Culvert at Kelsey Dr. Culvert No. 8
10 Bridge at Private Driveway Bridge No. 2
11 Culvert at Personal Yard Culvert No. 9
12 Culvert at New Gushue Highway Ramp 1 Culvert No. 10
13 Culvert at New Gushue Highway Ramp 2 Culvert No. 11
14 Culvert at Existing Gushue Highway Ramp Culvert No. 13
Leary’s Brook
15 Culvert at Mews Place Culvert No. 17
16 Culvert at Pippy Place Culvert No. 18
17 Bridge at O'Leary Ave. Bridge No. 3
18 Bridge at Wicklow St. Bridge No. 4
19 Bridge at Clinch Crescent (W) Bridge No. 5
20 Bridge at Clinch Crescent (E) Bridge No. 6
21 Culvert1 at Avalon Mall No Survey
22 Culvert2 at Avalon Mall No Survey
23 Bridge at Thorburn Rd. No Survey
Yellow Marsh Brook
24 Culvert at North on Kelsey Dr. Culvert No. 12
25 Culvert at Gushue Highway Crossing (S) Culvert No. 14
26 Culvert at Gushue Highway Crossing (N) Culvert No. 15
27 Culvert at NL Power Yard Culvert No. 16
Rennies River
28 Bridge at Allandale Rd. Bridge No. 7
29 Bridge at Prince Philip Dr. Bridge No. 8
30 Bridge at Elizabeth Ave. Bridge No. 9
31 Bridge at Carpasian Rd. Bridge No. 10
32 Bridge at Portugal Cove Rd. Bridge No. 11
33 Bridge at Kings Bridge Rd. Bridge No. 12
34 Bridge at Carnell Dr. Bridge No. 13
7.1.3 Manning’s Roughness Coefficient
Perhaps the most sensitive parameter input in the hydraulic model is the Manning’s n. During the
field investigations, photos and notes were taken to aid the modeller in selecting appropriate
Manning’s n. Literature values for Manning’s n for channels and flood plains are listed in Table 7‐21.
1 Chow, V.T. 1959. Open Channel Hydraulics. McGraw‐Hill, New York.

CBCL Limited Hydraulic Modeling 28
TABLE 7‐2 LITERATURE VALUES FOR MANNING’S N
Natural Streams Minimum Normal Maximum
Clean, straight, full stage, no rifts or deep pools 0.025 0.030 0.035
Same as above but more stones and weeds 0.030 0.035 0.040
Clean, winding, some pools and shoals 0.033 0.040 0.045
Same as above but some weeds and stones 0.035 0.045 0.050
Sluggish reaches, weedy, deep pools 0.050 0.070 0.080 Very weedy reaches, deep pools, or floodways with heavy stands of timber and underbrush 0.075 0.100 0.150
Floodplains Minimum Normal Maximum
Short grass 0.025 0.030 0.035
Tall grass 0.030 0.035 0.050
Scattered brush, heavy weeds 0.035 0.050 0.070
Light brush and trees, in summer 0.040 0.060 0.080
Medium to dense brush, in summer 0.070 0.100 0.160
7.2 Model Calibration The development of hydraulic models across a large floodplain requires a rigorous calibration
process to ensure the hydraulic model accurately reproduces the observed flooding behaviour. This
process generally incorporates comparisons between observed flood levels and areas of inundation.
The focus of the floodplain 2D model calibration is the general flood behaviour during large flood
events. Hence, the selection of calibration events reflects large flood events with adequate
available observed flood data suitable for model calibration. A review of the available data on
historical floods in the Rennies River catchment identified Hurricane Igor flood event suitable for the
model calibration. Table 7‐3 outlines the details of the selected calibration event.
TABLE 7‐3 SELECTED CALIBRATION EVENT
Event General Description Available Observed Data
September, 2010
‐ Significant flood event causing widespread inundation of the Rennies River floodplain between Portugal Cove Road and Kings Bridge Road, Allandale Road and Prince Philip Drive, and CBC Parking Lot.
‐ Peak flow of the Leary’s Brook at Prince Philip Drive gauge (02ZM020): 62.5 m
3/s
‐ Flood Levels: Long Pond Bridge
‐ Stream flow Data: The Leary’s Brook at Prince Philip Drive gauge (02ZM020)
‐ Observed flood extent by photos
The model calibration was assessed through the comparison of observed and modelled flood levels,
and flood extents. Model refinements to the Manning’s n and river bed terrain were undertaken to
force the simulated water levels to match the measured water levels to an acceptable difference.
All adjustments fall within the limits of the literature values for Manning’s n.
For the Rennies River at Long Pond Bridge, the observed flood level was 55.4 m and the modelled
flood level was 55.6 m. The difference may be explained by errors in the measurement of the
observed flood levels (e.g. not at flood peak) and/or errors in the specification of the model inflows
from ungauged sub‐catchment. The flood level difference is 0.2 m, which is reasonable. Such a
comparison indicates that the hydraulic model is able to reflect the local hydraulic conditions.

CBCL Limited Hydraulic Modeling 29
The calibrated flood inundation maps for Hurricane Igor are shown in Appendix I. The City reviewed
the floodplain maps to ensure consistency with their experience of the flood event.
7.3 Simulated Flood Flows Flood flows for the 1:20 and 1:100 AEP events based on the calibrated hydrologic and hydraulic
models at various locations along the river reach are presented in Table 7‐4.
TABLE 7‐4 FLOOD FLOWS
Location 1:20 AEP Event Peak Flow (m
3/s) 1:100 AEP Event Peak Flow (m
3/s)
Existing Flow Future Flow Existing Flow Future Flow
Great Eastern Ave. at Ken Brook 4.2 6.1 5.8 8.2
Lady Smith Dr. at Ken Brook 10.6 15.5 14.5 20.8
NL Power Yard at Yellow Marsh Brook 14.1 20.4 19.3 27.5
Pippy Place at Leary’s Brook 21.9 31.9 29.9 42.9
O'Leary Ave. at Leary’s Brook 34.6 50.3 47.3 67.8
Wicklow St. at Leary’s Brook 47.3 68.1 64.4 91.9
Allandale Rd. at Rennies River 38.7 46.4 59.7 65.7
Prince Philip Dr. at Rennies River 41.3 49.3 62.6 69.9
Portugal Cove Rd. at Rennies River 52.5 65.8 78.2 88.0
Carnell Dr. at Rennies River 58.4 73.1 87.9 97.9
The table shows a gradual increase in flows up to the Wicklow Street area, and then a clear drop,
before rising steadily again up to the Carnell Drive area. This is related to the fact that the
Environment Canada flow gauge is located by Wicklow Street. The calculated flows are calibrated
on the gauged flows up to Wicklow Street. Downstream, the hydraulic model is used to estimate
flows, and it takes into account the flow restrictions in the system, particularly at Long Pond, which
has the ability to store a large portion of the peak flows, thereby reducing the peak flows notably.
The water levels resulting from the various flood flow scenarios were used in the creation of the
floodplain maps presented in Chapter 9.

CBCL Limited Sensitivity Analysis 30
CHAPTER 8 SENSITIVITY ANALYSIS
Sensitivity analyses were conducted on selected model parameters to assess the impact of changing
these parameters on model results.
8.1 Hydrologic Model Sensitivity The hydrologic parameters selected for sensitivity analysis include depression storage, average
capillary suction, initial moisture deficit, saturated hydraulic conductivity, subbasin width, percent
impervious area and Manning’s roughness values. The 1:100 AEP event for the existing
development conditions was selected as a benchmark to evaluate the sensitivity of the flow to the
variation of each parameter. Sensitivity analysis for the parameters was limited to ± 5% and 10%.
The results indicate that the hydrologic model is most sensitive to changing the percent impervious
area. Decreasing the percent impervious area by 10% decreased peak flow at the outlet of sub‐
watershed 1 by 5.31% (over the base case). A close second were the Manning’s n values and the
Subbasin Width parameters, impacting the flows by 3.83% for a parameter change of 10%. Average
capillary suction, initial moisture deficit and saturated hydraulic conductivity had the least effect on
flow values. A decrease in these parameters of 10% increased the peak flow by only 0.04%. Graphs
of the hydrologic model sensitivity analysis are presented in Figures 8‐1 to 8‐7. Table 8‐1 shows the
percent change in peak flows.

CBCL Limited Sensitivity Analysis 31
FIGURE 8‐1 DEPRESSION STORAGE SENSITIVITY ANALYSIS
FIGURE 8‐2 AVERAGE CAPILLARY SUCTION SENSITIVITY ANALYSIS

CBCL Limited Sensitivity Analysis 32
FIGURE 8‐3 INITIAL MOISTURE DEFICIT SENSITIVITY ANALYSIS
FIGURE 8‐4 PERCENT IMPERVIOUS AREA SENSITIVITY ANALYSIS

CBCL Limited Sensitivity Analysis 33
FIGURE 8‐5 SUBBASIN WIDTH SENSITIVITY ANALYSIS
FIGURE 8‐6 MANNING’S ROUGHNESS VALUE SENSITIVITY ANALYSIS

CBCL Limited Sensitivity Analysis 34
FIGURE 8‐7 SATURATED HYDRAULIC CONDUCTIVITY SENSITIVITY ANALYSIS
TABLE 8‐1 VARIATIONS IN PEAK FLOWS AS A RESULT OF ADJUSTING HYDROLOGIC AND HYDRAULIC PARAMETERS
Variation
Average Capillary Suction
Initial Moisture Deficit
Saturated HydraulicConductivity
SubbasinWidth
Percent ImperviousArea
Manning's Roughness Values
Depression Storage
10% ‐0.04% ‐0.04% ‐0.04% 3.96% 5.15% ‐3.83% ‐0.12%
5% ‐0.01% ‐0.01% ‐0.01% 2.01% 2.59% ‐1.98% ‐0.06%
0% 0% 0% 0% 0% 0% 0% 0%
‐5% 0.01% 0.01% 0.01% ‐2.08 ‐2.63% 2.12% 0.06%
‐10% 0.04% 0.04% 0.04% ‐4.23% ‐5.31% 4.39% 0.12%
8.2 Hydraulic Model Sensitivity A range of sensitivity tests were performed to ascertain how uncertainty in the model parameters
impacts the robustness of the model output. The key parameters considered were 2D roughness
coefficients and peak discharge rates. The 1:100 AEP event for the existing development conditions
was selected as a benchmark. The robustness of the model output was assessed in terms of the
change in water level at the upstream of Kings Bridge Road. Sensitivity analysis for the parameters
was limited to ± 5% and ±10%. Results of model sensitivity to changes in selected parameters are
presented in Table 8.2.
It can be seen that generally, the variations of Manning’s n roughness and peak flow rate yield
sensible and uniform variations in water levels. The results indicate that the hydraulic model is
more sensitive to changes in the peak flow rates. Decreasing the peak flow rates by 10% decreased

CBCL Limited Sensitivity Analysis 35
peak water level at the upstream of Kings Bridge Road by 1.64%. The Manning’s n values impacting
the flows by 0.62% for a parameter change of 10%.
TABLE 8.2 VARIATIONS IN PEAK WATER LEVEL AS A RESULT OF ADJUSTING HYDRAULIC PARAMETERS
Variation Water Level (m) Water Level Variation
Manning's n Peak Flow Rate Manning's n Peak Flow Rate
10% 14.63 14.69 0.46% 0.86%
5% 14.60 14.63 0.21% 0.44%
0% 14.57 14.57 0% 0%
‐5% 14.53 14.50 ‐0.25% ‐0.48%
‐10% 14.48 14.33 ‐0.62% ‐1.64%
FIGURE 8‐8 PEAK FLOW RATE SENSITIVITY ANALYSIS

CBCL Limited Sensitivity Analysis 36
FIGURE 8‐9: MANNING’S ROUGHNESS VALUE SENSITIVITY ANALYSIS

CBCL Limited Floodplain and Flood Hazard Mapping 37
CHAPTER 9 FLOODPLAIN AND FLOOD HAZARD MAPPING
Appendix J contains the floodplain mapping for the 1:20 and 1:100 AEP flood events for the existing
and future development conditions.
The existing conditions mapping is based on the following:
Existing land development conditions; and
Flows developed using the updated IDFs and alternating block method.
The future conditions mapping is based on the following:
Future land development conditions;
Flows developed using the climate change projections and alternating block method; and
City’s Stormwater Detention Policy is in place.
Floodplain mapping for the future 1:100 AEP flood with the proposed flood control improvements is
contained in Appendix K. The proposed improvements are discussed in Chapter 10. For the
mapping, we have assumed that Option A at Location 1, which is discussed in Chapter 10, will be
implemented.
Appendix L contains the flood hazard mapping for the 1:20 and 1:100 AEP flood events for the
existing and future development conditions and for the future 1:100 AEP flood with the proposed
flood control improvements.

CBCL Limited Preliminary Design 38
CHAPTER 10 PRELIMINARY DESIGN
10.1 Flood Control Locations along Rennies River with known flooding problems include:
Rear yards of properties located on Winter Avenue and Empire Avenue upstream from the
Kings Bridge Road Bridge;
Fieldian Grounds;
Portugal Cove Road north of the Portugal Cove Road Bridge;
Properties located on the south side of Pringle Place just upstream from the Portugal Cove
Road Bridge;
Properties located on the south side of Vaughan Place just upstream from the Carpasian
Road Bridge;
Prince Philip Drive east of the Prince Philip Drive Bridge;
Prince Philip Drive and the CBC Building parking lot between Clinch Crescent East and Clinch
Crescent West;
Wicklow Street Bridge to Thorburn Road;
Below O’Leary Avenue Bridge to the Avalon Mall Parking Lot culvert, and
Local culverts on Ken Brook where the brook runs parallel to Kenmount Road.
For this study, we have considered the following typical flood control approaches:
Conveyance capacity upgrades:
‐ Culvert/bridge upgrades
‐ Berms
‐ Channel widening and deepening
Storage to reduce flows:
‐ Increase Storage in existing water bodies
‐ Stormwater detention facilities
Infiltration to reduce runoff:
‐ Disconnection of roof downspouts
‐ Perforated pipes installed in clearstone bedding
‐ Rain gardens

CBCL Limited Preliminary Design 39
These options have been investigated to assess their potential for flood mitigation. In general, all
are feasible, with the exception of channel widening and deepening, which would not likely be
acceptable to Department of Fisheries and Oceans (DFO). Dredging activities, if carried out along
the entire river width, will harm fish habitat. The established natural balance of naturally graded
rock and gravel will be removed by the dredging and is unlikely to be replaced with a similar mix. In
addition, the natural low flow pool and riffle system, critical for fish survival during summer low
flows, is also unlikely to be replaced.
Flood control approaches that involve infiltrating runoff to reduce peak flows face the challenges of
low permeability soils and difficulty of implementation in urbanised areas. Nevertheless, infiltration
measures can be implemented over the long term and even in low permeability soil conditions will
provide a clear runoff reduction impact.
The immediate options envisaged to tackle the 1:100 AEP flood risks therefore include conveyance
capacity upgrades as well as storage to reduce flows. Each part of the study area faces some
challenges, but also offers opportunities with regards to the efficiency of each option considered.
Each part of the study area will therefore have a customised best‐fit recommendation for the flood
mitigation measure recommended. In order to follow this approach, each type of option was
evaluated using the hydrologic and hydraulic models. Further, the flood protection analysis was
carried out based on the assumption that the City’s Stormwater Detention Policy is implemented for
any additional development in the Rennies River watershed. The locations of the proposed flood
control measures are shown on Figure 10‐1 and described below.
Location 3 – Outlet of Long Pond
In terms of overall impact on the study area, the most significant flood protection improvement is
the weir located at the east end of Long Pond, which is noted as location 3 on Figure 10‐1.
Constructing a weir at this location will result in water being temporarily stored in Long Pond during
a storm event and released at a lower flow rate than the flow rate would be without the weir in
place. Due to the increased storage capacity, the level of Long Pond would increase for a short
period of time during a storm and return to its normal level a short time after the end of a storm.
The overall increase in the storage capacity of Long Pond with the weir in place is in the order of
160,000 m3. The normal water level of Long Pond is approximately 53 m and will increase to
approximately 55.7 m during the future 1:100 AEP flood event with the weir in place.
The major benefit of the weir is that the peak flows downstream of Long Pond will be reduced,
resulting in reduced costs associated with the implementation of flood control options at locations
downstream. For example, berms or walls proposed at locations downstream of Long Pond will not
be as high with the weir in place because the peak flows will be reduced. In order to realize these
benefits, the weir must be constructed before the other downstream improvements. A preliminary
design of the weir is presented on Figures 10‐2 and 10‐3. Note that an opening in the weir will
provide for the passage of fish.

CBCL Limited Preliminary Design 40
Location 1 – Kings Bridge Road to Portugal Cove Road & Upstream of Portugal Cove Road Bridge
Three options for flood control are presented for the river section between Kings Bridge Road and
Portugal Cove Road and immediately upstream from the Portugal Cove Road Bridge. This area is
noted as location 1 on Figure 10‐1. Along this river section, flooding has historically occurred at
some of the rear yards along Winter Avenue and Empire Avenue, at Fieldian Grounds, and at some
of the properties located on the south side of Pringle Place. Refer to Map 1 contained in Appendix I
for the approximate extents of the flooding experienced during Hurricane Igor.
The options for flood control between Kings Bridge Road and Portugal Cove Road include:
Option 1A – Construct berms and walls only along the river section
This option involves constructing flood protection walls and earth berms such that flood water
would be entirely contained within the river channel during a storm event. It does not include
replacing the existing Portugal Cove Road Bridge. It should be note that the earth berms proposed
for the rear yards along Empire Avenue and the southeastern boundary of Fieldian Grounds may
conflict with private property. Further, the construction of berms in these areas would result in a
loss of mature trees located along the river banks, and temporary ponding on the property side of
the berms during significant rainfall events.
Option 1B – Realign the river to flow across Fieldian Grounds and construct berms and walls
For this option, a new bridge would be required at Portugal Cove Road and the river would be
realigned to flow through an existing property on Portugal Cove Road and through the tennis courts
and soccer fields. For this option to proceed, consideration would have to be given to relocating the
sports field, which is beyond the scope of this project. Also, the earth berms proposed for the rear
yards along Empire Avenue may conflict with private property. In addition, the construction of
berms in this area would result in a loss of mature trees located along the river banks, and
temporary ponding on the property side of the berms during significant rainfall events.
Option 1C – Raise the Riverdale Tennis Club parking lot and construct walls
For this option, the parking lot would be raised; however, some portion of Fieldian Grounds would
flood during storm events. The advantage of this option is that berms would not need to be
constructed on the existing fields. Again, the berms proposed for the rear yards along Empire
Avenue may conflict with private property. Further, the construction of berms in this area would
result in a loss of mature trees located along the river banks, and temporary ponding on the
property side of the berms during significant rainfall events.
Conceptual drawings of Options 1A, 1B and 1C are presented in Figures 10‐4 to 10‐7. The final
decision regarding which of the above options to implement will be made by the Department of
Planning, Development and Engineering’s senior management in consultation with Council.
For the river section above Portugal Cove Road, the existing trail on the north side of the river will
have to be raised in order to accommodate the flood protection wall; otherwise, property at the
rear of the yards along Pringle Place would be required to allow for the construction of a wider earth
berm. Photo renderings of the proposed wall are shown in Figures 10‐8 to 10‐11.

CBCL Limited Preliminary Design 41
There is also significant erosion along the river banks throughout location 1. These areas are
identified in section 10.2 and recommendations regarding remedial measures are presented. The
increase in velocities in these areas with the flood control measures in place is not significant. The
recommended erosion control measures will be adequate with or without the implementation of
the flood control improvements.
Location 2 – Upstream of Capasian Road
An earth berm is recommended for the north side of the river section above Carpasian Road, which
is noted as location 2 on Figure 10‐1. The preliminary design is shown on Figures 10‐12 and 10‐13.
Location 4 – Clinch Crescent East to Clinch Crescent West
Earth berms and a concrete wall are recommended for the river section from Clinch Crescent East to
Clinch Crescent West. Only the improvements associated with the south side of this location are
included in the cost opinion because the north side would be the responsibility of the Provincial
Government. The preliminary design for this location is shown on Figure 10‐14.
Location 5 – Wicklow Street to Thorburn Road
Earth berms and a concrete wall are recommended for the river section from Wicklow Street to
Thorburn Road. The preliminary design for this location requires that the height of the headwall and
wing walls of the existing bridge be increased by approximately 0.8 m. The berms proposed for the
area located on the east side of Baird Place may conflict with private properties, and the
construction of berms in this area would result in the loss of mature trees. The preliminary design is
shown on Figure 10‐15.
Location 6 – Upstream from Avalon Mall Culverts
At this location, it is recommended that the concrete headwall be raised. The total length is
approximately 100 m. As this work would be the responsibility of the Avalon Mall, a cost opinion
has not been included with this report. The preliminary design is shown on Figure 10‐16.
Location 7 – O’Leary Avenue Bridge
It is recommended that the O’Leary Avenue Bridge be replaced to accommodate future flood flows.
The cost opinion for this replacement includes pre‐cast structural culvert sections similar to those
used for the Pippy Place Culvert replacement. In addition, an earth berm is required for the left
bank of the downstream side of the bridge. The preliminary design is shown on Figure 10‐17.
Location 8 – Downstream of Mews Place Culvert
An earth berm is recommended for the right bank of the downstream side of the Mews Place
Culvert. The location of the earth berm is shown on Figure 10‐18.
Ken Brook
During the 1:100 AEP event under future conditions, there is localized flooding at private culverts
located on Ken Brook; however, Kenmount Road does not flood. In most cases, the hydraulic

CBCL Limited Preliminary Design 42
opening required to upgrade these culverts would result in the raising of private parking lots. Even
then, there are some instances where cover for the culverts would not be adequate.
As noted, the construction of the weir at Long Pond will result in reduced flooding downstream of
Long Pond. The flood control improvements located downstream of Long Pond at locations 2 and 3
have been designed to function with the weir at Long Pond in place. Consequently, the weir at Long
Pond must be constructed before the downstream improvements can be constructed.
Given the extents of the flooding experienced at locations 2 and 3, these areas are considered by
the City to high priority areas. Therefore, it is recommended that the weir at Long Pond be given
first priority, and locations 2 and 3 be given second priority. It is recommended that the remaining
flood improvement recommendations be implemented in order from downstream to upstream.
The recommended flood control measures are summarized in Table 10‐1. Cost opinions include
engineering, contingency and HST. Detailed breakdowns of the cost opinions are included in
Appendix M.

1
2
3
4
5
6
7
8
FIGURE 10-1FLOOD CONTROL IMPROVEMENTS
LOCATION PLAN

FIGURE 10-2LOCATION 3LONG POND

LOCATION 3LONG PONDFIGURE 10-3

FIGURE 10-4LOCATION 1 - OPTION APORTUGAL COVE ROAD

LOCATION 1 - OPTION APORTUGAL COVE ROADFIGURE 10-5

FIGURE 10-6LOCATION 1 - OPTION BPORTUGAL COVE ROAD

FIGURE 10-7LOCATION 1 - OPTION CPORTUGAL COVE ROAD

CBCL Limited Preliminary Design 50
This Page Left Intentionally Blank

CBCL Limited Preliminary Design 51
FIGURE 10‐8 UPSTREAM OF PORTUGAL COVE ROAD BRIDGE – STREET VIEW – BEFORE IMPROVEMENTS

CBCL Limited Preliminary Design 52
FIGURE 10‐9 UPSTREAM OF PORTUGAL COVE ROAD BRIDGE – STREET VIEW – AFTER IMPROVEMENTS

CBCL Limited Preliminary Design 53
FIGURE 10‐10 UPSTREAM OF PORTUGAL COVE ROAD BRIDGE – TRAIL VIEW – BEFORE IMPROVEMENTS

CBCL Limited Preliminary Design 54
FIGURE 10‐11 UPSTREAM OF PORTUGAL COVE ROAD BRIDGE – TRAIL VIEW – AFTER IMPROVEMENTS

FIGURE 10-12LOCATION 2
UPSTREAM OF CARPASIAN RD

LOCATION 2UPSTREAM OF CARPASIAN RDFIGURE 10-13

FIGURE 10-14LOCATION 4
CLINCH CRESCENT

FIGURE 10-15LOCATION 5
WICKLOW STREET

FIGURE 10-16LOCATION 6
AVALON MALL CULVERT

FIGURE 10-17LOCATION 7
O'LEARY AVENUE BRIDGE

FIGURE 10-18LOCATION 8
MEWS PLACE CULVERT

CBCL Limited Preliminary Design 62
TABLE 10‐1 FLOOD PROTECTION IMPROVEMENT OPTIONS
Notes:
1. For Priority 2, only one option will be implemented (i.e. one of 1A, 1B or 1C).
2. Right/Left banks are noted as looking downstream.
Priority Location Number Description of Location Description of Improvement Cost Opinion
1 3 Outlet of Long Pond 25m concrete weir and fish passage $1,979,000
2 1A Kings Bridge Road to Portugal Cove Road & Upstream of Portugal Cove Road
700m earth berm (avg. height = 1m); 340m segmental concrete block wall (avg. height = 1m); 130m cast‐in‐place concrete wall (avg. height = 0.4m)
$1,173,000
1B Kings Bridge Road to Portugal Cove Road & Upstream of Portugal Cove Road
300m earth berm (avg. height = 1m); 420m new channel (width = 12m); 110m segmental concrete block wall (avg. height = 1m); remove and replace bridge, remove house at 1 Portugal Cove Road
$3,891,000
1C Kings Bridge Road to Portugal Cove Road & Upstream of Portugal Cove Road
460m earth berm (avg. height = 1m); 230m segmental concrete block wall (avg. height = 1m); 130m cast‐in‐place concrete wall (avg. height = 0.4m); remove and replace tennis club building; raise parking lot and building pad
$1,379,000
2 2 Upstream of Carpasian Road Bridge 150m earth berm at left bank (avg. height = 0.5m) $27,000
3 4 Clinch Crescent East to Clinch Crescent West
360m earth berm (avg. height = 1m); 120m cast‐in‐place wall (avg. height = 0.4m)
$342,000
4 5 Wicklow Street to Thorburn Road 580m earth berm (avg. height = 1m); 120m cast‐in‐place wall (avg. height = 0.8m)
$294,000
5 7 O'Leary Avenue Bridge 70m earth berm at left bank; remove and replace bridge $847,000
6 8 Downstream of Mews Place 140m earth berm at right bank (avg. height = 1.6m) $38,000

CBCL Limited Preliminary Design 63
10.2 Erosion Control Erosion control is a necessary part of the channel improvements needed to safely convey the
future flows. The following areas, shown on Figures 10‐19 to 10‐21, have been identified as
being particularly vulnerable:
1. The river section between Kings Bridge Road and Portugal Cove Road;
2. The river section between the inlet of the Avalon Mall Culvert and O’Leary Avenue;
3. The river section between O’Leary Avenue and Pippy Place; and
4. The river section upstream of Pippy Place.
The model results under the 1:100 AEP future flood condition with and without the
recommended flood protection measures in place revealed that no new areas of erosion in
addition to those listed above will be created through the implementation of the flood
protection improvements.
The model results under the 1:100 AEP future flood condition with the recommended flood
improvements in place indicate that the velocities in the bend outer banks in the section
between O’Leary Avenue and Pippy Place can reach 5 to 8 m/s. Similarly, the model results
indicate that the bend outer banks in the channel downstream of Portugal Cove Road could
experience velocities in the order of 4 to 6 m/s.
Velocities in the order of 4‐8 m/s are considered high and can only be protected with very large
rip‐rap sizes. Indeed, Table 10‐2 below shows the rip‐rap size that would be needed to protect
the channel banks. In this calculation, 3 m of water depth, and a radius of bend centreline to
width ratio of 3:1 is used.
TABLE 10‐2 CALCULATION OF RIP‐RAP SIZES FOR VARIOUS FLOW VELOCITIES
Water Velocity: V = 4 m/s V = 5 m/s V = 6 m/s V = 7 m/s V = 8 m/s
Percent Passing Sieve Size (mm)
Sieve Size (mm)
Sieve Size (mm)
Sieve Size (mm)
Sieve Size (mm)
10 500 870 1370 2010 2810
30 990 1730 2740 4020 5620
60 1490 2600 4110 6040 8430
100 1990 3470 5470 8050 11230
Based on this calculation, it is not recommended to use rip‐rap for bank protection. Other
systems such as high‐performance cellular confinement systems may be better suited to this
application. Other advantages of such systems include very low thickness which encroaches less
on the river, as well as improved aesthetic appeal in residential areas. Product literature for one
type of cellular confinement system is contained in Appendix N. This system can be used to
protect embankments that experience velocities of up to 9 m/s and on embankments with a
maximum slope of 1:1.

CBCL Limited Preliminary Design 64
It is estimated that approximately 4000 m2 of the river banks need to be rehabilitated. Based on
using a cellular confinement system, the cost opinion to do this work is $567,000, including
engineering, contingency and HST. The detailed breakdown of the cost opinion is included in
Appendix M.
Sediment depositions have accumulated at several bridges and culverts along Rennies River,
including the following locations:
Portugal Cove Road Bridge;
Clinch Crescent East Bridge; and
Wicklow Street Bridge.
The accumulation of rock and gravel at bridges and culverts can significantly reduce hydraulic
capacities. Accordingly, this material should be removed periodically. The City has removed
rock and gravel deposits at bridges and culverts in the past.

FIGURE 10-19
1
EROSION CONTROL IMPROVEMENTSLOCATION 1

3
FIGURE 10-20EROSION CONTROL IMPROVEMENTS
LOCATIONS 2-3
2

FIGURE 10-21EROSION CONTROL IMPROVEMENTS
LOCATION 4
3
4

CBCL Limited Regulatory Requirements 68
CHAPTER 11 REGULATORY REQUIREMENTS
CBCL contacted the provincial Department of Environment and Conservation (DOEC) and DFO to
establish each agency’s regulatory requirements with respect to the proposed infrastructure
improvements.
11.1 Department of Environment and Conservation A Water Management Specialist with DOEC advised CBCL that DOEC does not review stormwater
work unless it is incidental to water and/or sewer works (for example, a combined sanitary and
storm sewer), or involves an outfall (for example, a storm sewer pipe discharging to a river). As
such, DOEC considers stormwater management to fall under the jurisdiction of individual
municipalities. While the province is in the process of creating a stormwater management policy
directive, it is intended for the benefit of rural communities; major municipalities are expected to
continue to oversee their own stormwater management activities.
In general, DOEC requires an Application for Permit to Alter a Body of Water and corresponding
schedules to be submitted for approval. These documents are found on DOEC’s webpage at
http://www.env.gov.nl.ca/env/waterres/regulations/appforms/index.html. For the proposed
detention facilities and outlet control structures, Schedules A and H are required along with the
application.
11.2 Department of Fisheries and Oceans When we contacted DFO to solicit their input on the proposed infrastructure improvements, they
asked to see the report before providing any comments. We recommend that a copy of the final
report be provided to DFO for their review.

CBCL Limited Conclusions and Recommendations 69
CHAPTER 12 CONCLUSIONS AND RECOMMENDATIONS
12.1 Conclusions 1. Flood protection infrastructure improvements are recommended for the following
locations. The weir at the outlet of Long Pond must be implemented before the other
recommended improvements for downstream locations. Only one of the options
presented for location 1 needs to be implemented.
2. Erosion control improvements can be accomplished using a cellular confinement
system. It is estimated that approximately 4000 m2 of the river banks need to be
rehabilitated. Based on using a cellular confinement system, the cost opinion to do this
work is $567,000.
3. DOEC requires that the Application for Permit to Alter a Body of Water and
corresponding schedules A and H be submitted for review and approval.
12.2 Recommendations 1. CBCL recommends that the City move forward with the design and implementation of
the proposed flood and erosion control improvements. Further discussion regarding the
preferred option for location 1 is required before moving ahead with the design.
2. CBCL recommends that DOEC and DFO be consulted during the design of the proposed
infrastructure improvements.
Priority Description of Location Cost Opinion
1 Location 3: Weir at outlet of Long Pond $1,979,000
2 Location 1, Option A: Kings Bridge Road to Portugal Cove Road & Upstream of Portugal Cove Road – Berms & Walls only
$1,173,000
Location 1, Option B: Kings Bridge Road to Portugal Cove Road & Upstream of Portugal Cove Road – New Channel and bridge
$3,891,000
Location 1 Option C: Kings Bridge Road to Portugal Cove Road & Upstream of Portugal Cove Road – Raised parking lot
$1,379,000
2 Location 2: Upstream of Carpasian Road Bridge $27,000
3 Location 4: Clinch Crescent East to Clinch Crescent West
$342,000
4 Location 5: Wicklow Street to Thorburn Road $294,000
5 Location 7: O'Leary Avenue Bridge $847,000
6 Location 8: Downstream of Mews Place $38,000

Eastern Health Health Sciences Centre
Flood Plain Study
AMEC Ref. No. 174811-0000-CD10-RPT-0001 2014.08.06
APPENDIX C
CORRESPONDENCE

1
White, Tyler
Subject: FW: 174811 - HSC floodplain (AutoCAD Dwg)
From: Dave Wadden [mailto:[email protected]]
Sent: April-29-14 7:46 AM To: Reid, Lance
Subject: Fw: 174811 - HSC floodplain (AutoCAD Dwg)
Lance: Here are the elevations from our Consultant for the floodplain mapping: - Point 1 – 56.95 m - Point 2 – 57.40 m - Point 3 – 57.56 m Dave Wadden, M.Eng., P.Eng. Manager, Development - Engineering Planning, Development & Engineering City of St. John's Phone: (709)-576-8260 Fax: (709)-576-8625 e-mail: [email protected] "This information is provided as a convenience to you only and is without warranty, guarantee or responsibility of any kind, either expressed or implied. The City does not guarantee that the information that is provided is current or accurate. You should verify that the information is accurate before acting on it." ----- Forwarded by Dave Wadden/CSJ on 2014/04/29 07:45 AM ----- From: Dave Wadden/CSJ To: "Reid, Lance" <[email protected]> Date: 2014/04/28 11:02 AM Subject: RE: 174811 - HSC floodplain (AutoCAD Dwg)
I've sent the request to the consultant that created the floodplain and I'm awaiting their response. Dave Wadden, M.Eng., P.Eng. Manager, Development - Engineering Planning, Development & Engineering City of St. John's Phone: (709)-576-8260 Fax: (709)-576-8625 e-mail: [email protected] "This information is provided as a convenience to you only and is without warranty, guarantee or responsibility of any kind, either expressed or implied. The City does not guarantee that the information that is provided is current or accurate. You should verify that the information is accurate before acting on it." From: "Reid, Lance" <[email protected]> To: "[email protected]" <[email protected]> Cc: "White, Tyler" <[email protected]> Date: 2014/04/28 10:49 AM Subject: RE: 174811 - HSC floodplain (AutoCAD Dwg)

2
Good morning Dave, When do you expect to have an opportunity to provide the requested information? Regards, Lance Reid, P. Eng. Project Director Power and Process Division - Atlantic Region AMEC Americas Limited Office (709) 724-3553 Cell: (902) 223-6077 From: White, Tyler Sent: April-15-14 2:40 PM
To: [email protected] Cc: Reid, Lance
Subject: 174811 - HSC floodplain (AutoCAD Dwg) Dave, As discussed earlier – attached is an AutoCAD file with three points where we would like to have the 1:100 year flood elevation. Regards, Tyler White, P.Eng. Municipal Engineer AMEC Power & Process Americas 130 Eileen Stubbs Avenue, Suite 201 Dartmouth, Nova Scotia, Canada B3B 2C4 Tel (902) 420 8941 Fax (902) 420 8949 [email protected] amec.com
The information contained in this e-mail is intended only for the individual or entity to whom it is addressed. Its contents (including any attachments) may contain confidential and/or privileged information. If you are not an intended recipient you must not use, disclose, disseminate, copy or print its contents. If you receive this e-mail in error, please notify the sender by reply e-mail and delete and destroy the message.

Eastern Health Health Sciences Centre
Flood Plain Study
AMEC Ref. No. 174811-0000-CD10-RPT-0001 2014.08.06
APPENDIX D
GOVERNMENT POLICIES

Policy for Flood Plain Management
POLICY DIRECTIVE
Division: Water Resources Management P.D. W.R. 96-1
Prepared By: Amir Ali Khan, P. Eng Issue Date: May 13, 1996
Approved By: Haseen Khan Director Re-Issue Date: March 19, 2014
Approved By: Martin Goebel ADM Review Date:
Authorized By: Jamie Chippett DM Superseded:
Joan Shea Minister Cancelled:
Subject:
Flood Plain Management
1.0 INTRODUCTION
Land use within flood plains involves trade offs between flood risk and development. Flood risk takes the form of danger to
health and safety, financial costs associated with property damage and degradation of water resources and the
environment. Some factors associated with flood risk such as flow velocity, upstream inundation, erosion potential or
environmental impacts may be severe. Consequently, new land development should therefore be restricted or prohibited.
However, where conditions are not as severe, some types of development and land use may occur safely provided certain
terms and conditions apply.
2.0 OBJECTIVES
• to prevent loss of human life and avoid personal hardships,
• to minimize flood damage to properties, infrastructure and the environment,
• to restrict activities which would degrade water resources,
• to maintain the natural capability of waterways to convey flood flows,
• to minimize disruption of transportation, social and business activity, and,
• to minimize costs to the taxpayers of Newfoundland and Labrador.
The unwise development of land in flood plains has historically taken place in many areas of the province probably due to a
natural tendency for settlers to utilize land that is near bodies of water. Unfortunately, the potential for flooding is often
recognized only after it is too late. The basic operating premise of this policy is that these problems will not materialize if
development takes place in a manner that does not place it at any risk of flooding.
The policy will address Crown land, developed land and undeveloped land. Where lands that are subject to periodic
flooding are still directly owned by the Crown, those lands will not be transferred to private developers or municipalities.
However, where land is already alienated, it is necessary to determine the risk of flooding and to discourage potential
development by planning, zoning regulations and by removing any economic advantages or subsidies that would otherwise
encourage such development. Finally, where development has already taken place or cannot be avoided, policy is intended
to minimize potential flood damage by ensuring that flood proofing measures are implemented and that the development
does not further exacerbate the flooding problem by impeding flows or by unduly constricting the flow channel. The policy
also takes climate change into consideration.
3.0 BACKGROUND
Canada - Newfoundland Flood Damage Reduction Program
Page 1 of 6Policy for Flood Plain Management | Environment and Conservation
17/06/2014http://www.env.gov.nl.ca/env/waterres/regulations/policies/flood_plain.html

Under the Canada - Newfoundland Flood Damage Reduction Program, both governments agreed that public funds would
not be used or provided for development projects in flood risk areas. To identify these areas, hydrotechnical studies were
carried out for 37 communities in the province. Without exception, the main recommendation in each study was that the
implementation of proper flood plain management policies would minimize flood risk.
4.0 LEGISLATION
Water Resources Act, SNL 2002 cW-4.01, ("the Act") sections 30, 32, 33, 34, 35, 48, 64 and 90, the Lands Act SNL1991
CHAPTER 36 Section 7.
5.0 DEFINITIONS
Body of
Water
(Statutory definition from the Act) "body of water" means a surface or subterranean source of fresh or salt
water within the jurisdiction of the province, whether that source usually contains liquid or frozen water or
not, and includes water above the bed of the sea that is within the jurisdiction of the province, a river,
stream, brook, creek, watercourse, lake, pond, spring, lagoon, ravine, gully, canal, wetland and other
flowing or standing water and the land usually or at any time occupied by that body of water;
Flood Plain
An area adjacent to a lake, river, seashore etc. which is inundated or covered with water on average at
least once in 100 years. Note that a flood plain is considered to be an integral part of a body of water as
defined above because it includes "the land usually or at a time occupied by that body of water" and
"whether that source usually contains water or not".
Designated
Area
A specific flood plain in a community for which a hydrotechnical study has determined the extent of flooding
and for which flood risk maps are available. The designation is in accordance with the Canada -
Newfoundland Flood Damage Reduction Program Agreements.
FloodwayThe portion of a flood plain where the most frequent flooding occurs and where the flow of water is fastest.
This area is determined on the basis of the 1 in 20 year (1:20) return period flood.
Floodway
Fringe
The portion of a flood plain where less frequent flooding occurs and where the flow of water is considered
to be tranquil. This area is where flooding occurs up to 1 in 100 years (1:100) on average.
Climate
Change Flood
Zone
Based on extension of the floodway fringe, this is the area which is likely to be impacted due to the latest
forecasted affects of climate change.
Other Flood
Risk Area
An area where flooding is known or has some probability to occur due to unique or unusual circumstances
such as areas subject to shoreline recession, areas downstream of dams or areas adjacent to
watercourses potentially prone to ice jams.
Flood Control
Area
An area that is subject to periodic flooding which has been designated (by the Department) a control area
in order to reduce the risks to public health and safety and property damages. This area shall normally be
treated as a floodway zone (1:20), unless otherwise determined by the Department.
Buffer Zone
A zone of land that is in its natural state and that is intended to separate developed areas from bodies of
water to provide basic protection of water resources. This zone may coincide with a Crown land reservation
of a shoreline as prescribed by Section 7(1) of the Lands Act. In the absence of specific setback
requirements (depending on the activity) the buffer is taken to be 15 metres measured from the high water
mark which in turn is understood to be the 1 in 100 year (1:100) high water mark or the Climate Change
Flood Zone, where they have been identified.
Coastal AreaThe interface or transition area where the land meets the sea/ocean or large inland lakes. The coastal area
can be flooded due to storm surges, high tidesor waves, erosion, rising sea level,or reclaimed land.
6.0 POLICIES
6.01 Development Requires Written Approval
Page 2 of 6Policy for Flood Plain Management | Environment and Conservation
17/06/2014http://www.env.gov.nl.ca/env/waterres/regulations/policies/flood_plain.html

Development in a designated flood risk area, development in a flood plain and development in a climate change flood zone
shall be subject to the prior written approval of the Minister of Environment and Conservation (the “Minister”) in accordance
with the Act.
6.02 Project Categories
In general it is the policy of the Department of Environment and Conservation (“the Department”) that flood plains and the
buffer zone be preserved and left in their natural state. Recognizing that this is an ideal that would hinder significant
benefits that could be derived from certain development in a flood plain and outweigh all risk of loss, damage or peril, this
policy for flood plain management views any application to avail of land in flood risk areas in decreasing order of
preference. These preferences are referred to hereafter as project categories.
1. Temporary alterations in a buffer zone, a climate change flood zone, a designated floodway fringe, a flood plain, a
designated floodway, and lastly, the body of water itself.
2. Non-structural uses such as open space recreation, pasture, and wildlife habitat enhancement.
3. Structures related to use of water resources such as wharves, slipways, boathouses, pumping stations, storm or
sewerage discharges.
4. Minor structural or other projects where only soil disturbance is involved such as constructed trails, pipelines,
transmissions lines, roads, etc., assuming there will be no change in the grade of the land.
5. Other structures not used primarily for residential, commercial, industrial or institutional purposes where there
will be a change in grade but not a building.
6. Industrial uses related to the marine shipping or fishing industries.
7. Other industrial and commercial development.
8. Institutional developments such as hospitals, senior citizens homes, homes for special care or schools where
flooding could pose a significant threat should evacuation become necessary.
9. Residential and other institutional development.
6.03 Hydraulic Structures
A special class of structures which includes most hydraulic structures such as dams, bridges, causeways, dykes, canals
etc., are by their own needs and characteristics constructed in buffer zones and flood plains and consequently, no
preference can be assigned. However, such structures are the subject of the Act and every effort must be made to ensure
that such structures do not adversely affect the capability of the body of water to convey flow. In the case of dams, new
areas of flooding and the impact of that flooding must be fully assessed by the proponent.
6.04 Project Classifications
Table 1 below indicates whether not project categories are permitted in each of the defined flood plains.
Category All Flood Plains
Where Flood Plains are Designated
Floodway
(1:20 year Zone)
Floodway Fringe
(1:100 year Zone)
Climate Change
Flood Zone
Temporary
alterationsPermitted Permitted Permitted Permitted
Non-
structural
uses
Permitted Permitted Permitted Permitted
Structures
related to
use of
water
resources
Permitted Permitted Permitted Permitted
Page 3 of 6Policy for Flood Plain Management | Environment and Conservation
17/06/2014http://www.env.gov.nl.ca/env/waterres/regulations/policies/flood_plain.html

Minor
structural
or other
projects
Permitted Permitted
with conditions*
Permitted
with conditions*
Permitted
with conditions*
Other
structures
not used
primarily
for
residential
Permitted
with conditions*
Permitted
with conditions*
Permitted
with conditions*
Permitted
with conditions*
Industrial
Uses
related to
shipping
(marine
only)
Permitted
with conditions*
Permitted
with conditions*
Permitted
with conditions*
Permitted
with conditions*
Other
industrial
and
commercial
Not PermittedPermitted
with conditions**
Permitted
with conditions*
Permitted
with conditions*
Institutional Not Permitted Not Permitted Not Permitted Not Permitted
Residential
and other
institutional
Not Permitted Not PermittedPermitted
with conditions*
Permitted
with conditions*
Hydraulic
StructuresPermitted Permitted Permitted Permitted
* - See Section 6.05 for special terms and conditions related to necessary flood proofing measures.
** - See Section 6.06 for special terms and conditions related to necessary flood proofing measures.
Note: All permits contain standard terms and conditions.
6.05 Projects Permitted Where Flood Plains Are Designated
In Table 1 where projects may be permitted with conditions, the following conditions will apply:
i. the ground floor elevation of the structure is higher than the 1:100 year flood level and the climate change flood
zone (where designated), and,
ii. the structure will not interfere with the flow of water or displace water such that it creates a worse flooding situation
for other properties, and,
iii. the structure and the associated utilities must be designed and constructed in accordance with the approved flood
proofing guidelines of the Department and entrances and exits from the building can be safely used without
hindrance in the event of a flood, and,
iv. the proposed use of the facility and site will not involve any storage of pollutants such as fuels, chemicals,
pesticides etc., and,
v. additional conditions which may be appropriate for specific projects and included in a permit issued under Section
48 of the Act.
6.06 Projects Permitted in Coastal Floodway Where Flood Plains Are Designated
In order to accommodate tourism activities in coastal areas, such as eateries, attractions, tourist information booths, tour
headquarters etc., in Table 1 if the floodway (1:20 year zone) flooding in a coastal community is primarily due to backwater
Page 4 of 6Policy for Flood Plain Management | Environment and Conservation
17/06/2014http://www.env.gov.nl.ca/env/waterres/regulations/policies/flood_plain.html

effects of the ocean and extreme high tides and consequently the flow velocities in the floodway are low, the following
conditions will apply:
i. only a tourism related structure and the associated utilities are permitted. The tourism related structures and the
associated utilities does not include accommodations such as motels or hotels, and,
ii. the tourism related structure and the associated utilities would not be eligible for flood disaster compensation, and,
iii. the ground floor elevation of the structure is higher than the 1:100 year flood level and the climate change flood
zone (where designated), and,
iv. the structure will not interfere with the flow of water or displace water such that it creates a worse flooding situation
for other properties, and,
v. the structure and the associated utilities must be designed and constructed in accordance with the approved flood
proofing guidelines of the Department and entrances and exits from the building can be safely used without
hindrance in the event of a flood, and,
vi. the proposed use of the facility and site will not involve any storage of pollutants such as fuels, chemicals,
pesticides etc., and,
vii. additional conditions which may be appropriate for specific projects and included in a permit issued under Section
48 of the Act.
6.07 Additions and Modifications to Existing Development
Additions, modifications, enhancements and improvements to existing structures where there is an increase in the floor
area within the flood plain, will be assessed for suitability in the same way as the project category as a whole.
6.08 Use of Flood Risk Mapping in Municipal Plans
Where flood risk mapping has been prepared for a community (or any city, town or area) the information in the flood risk
maps must be incorporated in the Municipal Plan (if one exists) and the flood risk areas must be zoned so as to permit only
those project categories specified by this policy. In the absence of official flood risk mapping, communities will be
encouraged to determine flood risk areas in accordance with this Department's standard hydrotechnical methods for
delineating flood risk zones and to zone those lands in accordance with this policy. Failing this, communities will be
encouraged to at least make provisions in planning documents for minimum setbacks from watercourses to provide some
margin of safety and to recognize potential flood susceptibility.
6.09 Eligibility for Flood Disaster Assistance
Any vulnerable development placed in a flood plain or designated flood risk area after the designation and not in
conformance with this policy or without approval as required by this policy, would not be eligible for flood disaster
compensation if such a program of compensation were to become available through government. This policy provision
does not apply to any development lawfully established in a flood plain prior to designation.
6.10 Use of Flood Disaster Compensation
In the event that compensation by government is awarded to flood victims, it will be the policy of this Department to
encourage victims to apply the compensation towards relocating rather than replacing or repairing damaged property in
situ. If it is deemed acceptable by this Department to repair or replace damaged property in flood risk areas, then it will be
required that the compensation be used firstly for appropriate flood proofing measures.
6.11 Flood Insurance
Persons living or carrying out business in flood risk areas may not be able to purchase flood insurance and if available it
may be very expensive. It is therefore recommended that those who are located in flood risk areas carry out flood proofing
measures and have an emergency plan available.
6.12 Flood Control Projects
Page 5 of 6Policy for Flood Plain Management | Environment and Conservation
17/06/2014http://www.env.gov.nl.ca/env/waterres/regulations/policies/flood_plain.html

Proposals for flood control measures such as construction of dykes, river diversions, retaining walls or flood control dams
will only be considered where the alternative with the highest benefit/cost ratio is recommended. Alternatives considered
may also include possible compensation for flood victims or the cost of relocating the inhabitants of the flood risk areas or
maintaining the status quo.
After flood controls have been implemented, flood risk designations shall remain in effect until such time as new
hydrotechnical studies have been undertaken and new flood risk areas delineated (in accordance with the Departments
standards).
6.13 Role of Water Resources Management Division
The Water Resources Management Division of this Department will continue as the lead agency with respect to flood plain
management. This role will include but is not limited to:
i. Evaluating all applications for approval under section 48 of the Act and making the appropriate recommendations in
accordance with this policy.
ii. Carrying out hydrotechnical studies, flood risk analyses and mapping to the extent possible with limited funds
provided.
iii. Continuing to monitor areas of flood risk such as Badger, Deer Lake and Steady Brook to provide flood warning and
flood status reports.
iv. Providing to the public information, data, maps, guidelines for flood proofing and other materials that will be useful in
reducing flood damage.
v. Providing technical expertise and assisting Fire and Emergency Services – Newfoundland and Labrador in the
event of a flood emergency.
vi. Continue with the ability to forecast flooding using computer models and real time data.
6.14 Offences
A municipal authority or person that unlawfully alters a body of water by carrying out any development in a designated flood
risk area or a flood plain without written approval from the Minister, thereby violates section 48 of the Act and commits an
offence contrary to section 90 of the Act.
Last Updated: June 12, 2014
This page and all contents are copyright, Government of Newfoundland and Labrador, all rights reserved.
Page 6 of 6Policy for Flood Plain Management | Environment and Conservation
17/06/2014http://www.env.gov.nl.ca/env/waterres/regulations/policies/flood_plain.html

1
NEWFOUNDLAND AND LABRADOR PROVINCIAL LAND USE POLICYFLOOD RISK AREAS
Floods can cause substantial damage to property and threaten human life. After a flood,Government is often faced with providing emergency assistance, clean-up, remediation and, insome cases, compensation to affected residents and businesses. Government has also financiallyassisted towns in constructing engineered flood defences to protect areas exposed to flooding. The Province of Newfoundland and Labrador, through this provincial land use policy, is workingto reduce damage to property caused by flooding, to protect public safety, and to reduce therequirements for flood defences and flood damage remediation.
Newfoundland and Labrador, in conjunction with the federal government, has formallyidentified and mapped areas across the province that are subject to flooding. These flood riskareas affect portions of 32 municipalities; 4 local service districts; 6 unincorporatedcommunities; and an uninhabited area on the Trans Canada Highway. Other places across theprovince have also experienced localized flooding but the affected areas have not been formallymapped.
This provincial land use policy directs new buildings and land uses to areas that are not ata high risk of flooding. In lower risk areas, development needs to be of a design and with anappropriate level of protection to ensure that the risk of damage from flooding is minimized. Any development within a flood risk area should not impede water flows or exacerbate flood riskelsewhere.
1. The Province of Newfoundland and Labrador discourages the construction of new buildingsand structures in areas at risk of flooding. All development in Newfoundland and Labradormust conform to the provisions of this Provincial Land Use Policy. It is the primeresponsibility of the property owner to avoid development in areas of flood risk and, ininstances where development already exists or is permitted, to undertake appropriate floodproofing. Municipal Councils and all other agencies with development control authority areresponsible for strictly controlling development in line with this Provincial Land Use Policyand for ensuring that all owners and users of property are aware of the risks of developingin an area that is subject to flooding.
2. In this Provincial Land Use Policy,(a) flood proofing means structural and/or non-structural measures incorporated in the
design of a building or structure which reduce or eliminate the risk of flood damageby ensuring that the ground floor elevation is higher than the projected flood leveland that the building can be exited without hindrance in the event of a flood.
(b) floodway means the inner portion of a flood risk area where the risk of flood is
GOAL: To protect public safety and property from the risk of flooding and to reducethe requirement for flood defences and flood damage remediation.

2
greatest, on average once in twenty years, and where the flood depths and watervelocities are greatest.
(c) floodway fringe means the outer portion of a flood risk area, between the floodwayand the outer boundary of the flood risk area, where the risk of flooding is lower, onaverage once in one hundred years, and flood waters are shallower and slower.
(d) plan means a municipal plan, regional plan, protected road zoning plan, local areaplan or protected area plan prepared under the Urban and Rural Planning Act.
(e) regulations means regulations made under the Urban and Rural Planning Act.
3. The flood risk areas mapped under the Canada-Newfoundland Flood Damage ReductionProgram are listed in Schedule A. (a) Within a floodway,
(i) new development is restricted to non-building uses such as roads andassociated structures, agriculture, open space and recreation, servicecorridors and to minor structures related to utilities and marine activities;
(ii) the placement of imported fill is prohibited unless it is specifically requiredas a flood proofing measure or for public infrastructure provided thatappropriate studies are carried out and show that these structures will notbe damaged by flooding, impede water flows or contribute to an increasein flood risk.
(b) Within a floodway fringe:(i) new buildings and structures, provided they are floodproofed, may be
permitted, except for(1) residential institutions such as hospitals, senior citizen homes, homes
for special care and any other use where flooding could pose asignificant threat to the safety of residents if evacuation becomesnecessary,
(2) police stations, fire stations and other facilities that may provideemergency services during a flood including government offices,
(3) schools, and(4) uses associated with the storage, warehousing or the production of
hazardous materials including gas stations.(ii) the placement of imported fill shall be limited to that required for
floodproofing, flood risk management or for public infrastructure providedthat appropriate studies are carried out and show that these structures willnot be damaged by flooding, impede water flows or contribute to anincrease in flood risk.
4. Crown Land shall not be released for any development involving building in either the floodway or floodway fringe.
5. Within the floodway, existing buildings or structures damaged beyond economic repair shallnot be replaced unless:
(a) the replacement building or structure has no greater floor area than the originalbuilding or structure at or below the defined flood proofing elevation;

3
(b) the replacement building or structure is flood proofed; and(c) the replacement building or structure does not impede water flows or contribute to
an increase in flood risk.
6. Within the floodway, existing uses, such as residential, commercial, industrial andinstitutional buildings, are encouraged to undertake flood proofing measures to reduce therisk of flood damage or relocate.
7. Any expansion of existing buildings and structures must be balanced against the risks tohuman safety and property and the possibility of exacerbating upstream and downstreamflooding. Any expansion of existing buildings and structures in the floodway must notincrease the area of the structure at or below the defined flood proof elevation.
8. Plans and regulations must identify flood risk areas mapped under the Canada-Newfoundland Flood Damage Reduction Program, as listed in Schedule A, and containpolicy statements and regulations consistent with this Provincial Land Use Policy.
9. There are areas in Newfoundland and Labrador that are known to be subject to localizedflooding but have not been mapped under the Canada-Newfoundland Flood DamageReduction Program. Development vulnerable to flood damage, such as houses, businessesand institutions, is discouraged in these areas. Plans and regulations must identify anylocally know flood risk areas and contain policy statements and regulations consistent withthis Provincial Land Use Policy.
10. For those areas without a plan and/or regulations in which flood risk areas have been mappedunder the Canada-Newfoundland Flood Damage Reduction Program, all applications fordevelopment within the floodway and floodway fringe shall be referred to the Minister ofMunicipal and Provincial Affairs in accordance with section 47 of the Urban and RuralPlanning Act, 2000. The Minister shall determine the outcome of the application afterevaluating it against this Provincial Land Use Policy and the risks to public safety andproperty. Any such development must not contribute to upstream or downstream floodingor result in a change to flood water flow patterns.
11. Development in the floodway, floodway fringe and in a 15 metre buffer around these zonesas well as any area known to be subject to flooding must obtain prior written approval of theMinister of Environment and Conservation in accordance with section 48 of the WaterResources Act.

Eastern Health Health Sciences Centre
Flood Plain Study
AMEC Ref. No. 174811-0000-CD10-RPT-0001 2014.08.06
APPENDIX E
WAVE ANALYSIS

DRAFT
Wind and Wave Setup and Runup during a 100-year flood event near the
Health Sciences Centre in St. John’s, Newfoundland
Prepared for:
AMEC Power & Process 130 Eileen Stubbs Avenue, Suite 201
Dartmouth, Nova Scotia
B3B 2C4
Ph: (902) 420-8941
Fax: (902) 420-8949
Prepared by:
AMEC Earth & Environmental 50 Troop Avenue, Unit 300
Dartmouth, Nova Scotia
B3B 1Z1
Ph: (902) 468-2848
Fax: (902) 468-1314
July 2014

1
1.0 WAVE SETUP AND RUNUP ANALYSIS
The aim of the following analysis is to estimate the wave setup and runup associated with the
worst-case scenario during a 100-year flood event in the vicinity of the Health Sciences Centre
(HSC) in St. John’s, Newfoundland. The floodplain extent used for wave generation and
propagation is based on a separate analysis of the 100-year flood event that characterized the
resulting flood plain, depicted in AMEC figures A1 and A2.
The present analysis is based on a fully-developed wave condition, generated using the SWAN
(Simulating Waves in the Nearshore) model (Holthuijsen et al., 2000, The SWAN team, 2014).
SWAN utilizes a finite difference scheme to compute random, short-crested, wind-generated
waves and allows for spectral wave input at specified boundaries. The action density spectrum
(equal to the energy spectrum divided by the relative frequency) is used since it is a quantity that
is conserved in the presence of currents. In the current implementation, SWAN incorporates
physical processes such as wave propagation, white-capping, shoaling, wave breaking, bottom
friction, wave set-up and wave-wave interactions in its computations. SWAN computes the wave
field and other wave parameters over a specified range of geographical space, time, wave
frequencies and directions. The model inputs include the gridded bathymetry, stillwater level,
and the prescribed winds associated with a 100-year storm event. The water depth throughout the
pond was derived (Figure 1) based on an interpretation of the elevation profiles (A, B and C) in
figures A1 and A2. The maximum water depth is assumed to be 2 m, and the idealized
bathymetry was constructed with the assumption that this depth would occupy a conservatively
large portion of the pond.
Over 60 years, the highest sustained wind speed recorded at St. John’s airport was 38 m/s in
February 1959. However these winds were from the Northwest, away from the Health Sciences
Centre. The strongest winds recorded toward the HSC were southwesterly winds of 33 m/s in
January 1977. Considering the observation record of St. John’s airport covers 60 years, a
representative 100 year wind toward the HSC was estimated at 35 m/s.
Figure 1 Idealized bathymetry for the pond formed during a 100-year flood event in the vicinity of
the Health Sciences Centre in St. John’s, NL, based on AMEC Drawings 174811-601 and 174811-
602.

Wave Runup Analysis for Health Sciences Centre in St. John’s, NL
2
The same model domain and wind condition was additionally prescribed in the Delft3D-FLOW
model (Deltares, Delft University of Technology), and the model was allowed to reach a steady
adjustment to the wind field in order to estimate the wind-induced setup of the water surface
(Figure 3).
The maximum southeasterly winds, oriented directly toward the HSC, produce a wave condition
characterized by a maximum significant wave height of 0.4 m (Figure 2), peak wave period of
1.5 s and mean wavelength of 2 m. The computed wave-induced setup was insignificant (<0.01
m), while the wind-induced setup was 0.03 m.
Figure 2 Significant wave height distribution in the pond formed during a 100-year flood event,
based on assumed winds of 35 m/s from the southeast direction.
Figure 3 Wind setup in the pond formed during a 100-year flood event, based on assumed winds of
35 m/s from the southeast direction.

Wave Runup Analysis for Health Sciences Centre in St. John’s, NL
3
For the purpose of estimating the highest wave runup levels on the northwest side of the pond, it
is necessary to consider the wave runup in addition to the wind-induced setup. The wave runup
was estimated from an empirical relation describing the maximum runup for irregular waves on
an impermeable beach (USACE EM, 2008):
������ = 2.32 ∗ ��.
��%�� = 1.86 ∗ ��. �
where:
Rmax =maximum wave runup (m)
R2% =wave runup (m) exceeded by only 2% of waves
Ho=Significant wave height (m)
ξ0=Surf similarity parameter (dimensionless)
The surf similarity parameter is calculated using the following equation (USACE EM, 2008):
�� = ���� ���� ���/�
where:
ξ0=Surf similarity parameter (dimensionless)
Ho=Significant wave height (m)
L=Wavelength (m)
Tanβ = Beach slope (Rise (m)/run (m))
The beach slope estimated at approximately 0.1 based on Section B in drawing 174811-602.
The results from the wave and flow model computations are summarized in Table 1.1. Based on
the assumption that maximum wind setup and wave runup occur at the same time, the total
inundation levels due to combined wind setup and wave runup are estimated to reach a
maximum of 0.32 m above the 100-year flood still water level, although a relatively small
percentage of the waves is expected to create this level of runup. Most of the individual waves
would create inundation levels of less than 0.28 m above the 100-year flood still water level.

Wave Runup Analysis for Health Sciences Centre in St. John’s, NL
4
Table 1.1 Model results for a worst-case scenario during a 100-year storm event
Parameter Value
Significant wave height 0.4 m
Peak Wave Period 1.5 s
Mean wave length 2 m
Wave-induced setup <0.01 m
Wave runup (top 2% of waves) 0.25 m
Wave runup (maximum) 0.29 m
Wind-induced setup 0.03 m
Total wind and wave-induced runup (top
2% of waves) 0.28 m
Total wind and wave-induced runup
(maximum) 0.32 m
2.0 REFERENCES
The SWAN team, SWAN user manual, TU Delft, The Netherlands, 2014.
Holthuijsen, L.H., Booij, N., Ris, R.C., Haagsma, IJ.G., Kieftenburg, A.T.M.M., Kriezi, E.E.,
2000. SWAN user manual, TU Delft, The Netherlands.
United States Army Corps of Engineers, 2008. Engineering Publication EM 1110-2-1100

Eastern Health Health Sciences Centre
Flood Plain Study
AMEC Ref. No. 174811-0000-CD10-RPT-0001 2014.08.06
APPENDIX F
COST ESTIMATE

174811 - Health Sciences Centre
HSC Berm
Construction Estimate
Description Quantity Unit price Amount
Mobilization and Demobilization (L.S.) - $20,000.00 $20,000.00
Erosion and Sediment Control (L.S.) - $5,000.00 $5,000.00
Clearing and Grubbing (/m2) 3,458 $5.00 $17,290.00
Topsoil Stripping and Stockpiling (/m2) 3,458 $2.00 $6,916.00
Supply Topsoil (/m2) 354 $2.00 $708.00
Common Excavation and Removal (/m3) 900 $25.00 $22,500.00
Select/Structural Fill (/m3) 4510 $25.00 $112,750.00
Pedistrian Gates (ea.) 4 $1,500.00 $6,000.00
Culvert (ea.) 6 $2,000.00 $12,000.00
Asphalt (50mm asp. Plus 300mm gravel base) (/m2) 860 $80.00 $68,800.00
Spreading Topsoil (/m2) 3,812 $2.00 $7,624.00
Hydroseeding (/m2) 3,812 $1.00 $3,812.00
Total $283,400.00
AMEC Americas Limited August 6, 2014