Health risk in informal milk value chain: Needs of a people-centric collective and integrated...
25
Health risk in informal milk value chain: Needs of a people-centric collective and integrated approach to address it Ram Pratim Deka, Johanna Lindahl and Delia Grace 12 th annual conference of the Indian Association of Veterinary Public Health Specialists (IAVPHS) Bengaluru, India, 11 February 2015
Transcript of Health risk in informal milk value chain: Needs of a people-centric collective and integrated...

Health risk in informal milk value chain: Needs of a people-centric collective and integrated approach to address it
Ram Pratim Deka, Johanna Lindahl and Delia Grace
12th annual conference of the Indian Association of Veterinary Public Health Specialists (IAVPHS)
Bengaluru, India, 11 February 2015

Background
• 78-80% milk in India is marketed by informal sector (97% in Assam)
• Milk vendors are considered as bad element of milk business
• Hygiene and quality of milk marketed by them is not satisfactory
• Several Govt. agencies are responsible for dairy sector
• None is responsible to correct the wrong doing of market actors
•Poor coordination & cooperation among the agencies
•Mistrust between the govt. agencies & informal market actors

High risk factor (in Assam’s context)
•Adulteration with water – 20%
•Total bacterial count (log)- 6.1
•Total coliform count (log)- 4.1
•Sample do not have acceptable coliform count- 50%
•Antibiotic reside- 85% samples (Neo-Streptomycin)
•Aflatoxin- 4% samples
• Sero-positive for brucellosis: 13-65% samples
Source Source: Ssno
Source: Comprehensive dairy sector study in Assam by ILRI, 2007, and Impact assessment study by SLU students, 2014

Commonly found pathogens in milk
• Salmonella
• E. coli
• Staphylococcus
• Streptococcus aureus
• Mycobacterium
• Brucella

Critical control point in milk pathway
Source: Comprehensive dairy sector study in Assam by ILRI, 2007

35 40 45 50 55 60
Farmer
Trader
Co-op
Transporter
Consumer
Milk-handling hygiene (%)
Mean hygiene scores of different actors (n=75)
Source: Comprehensive dairy sector study in Assam by ILRI, 2007
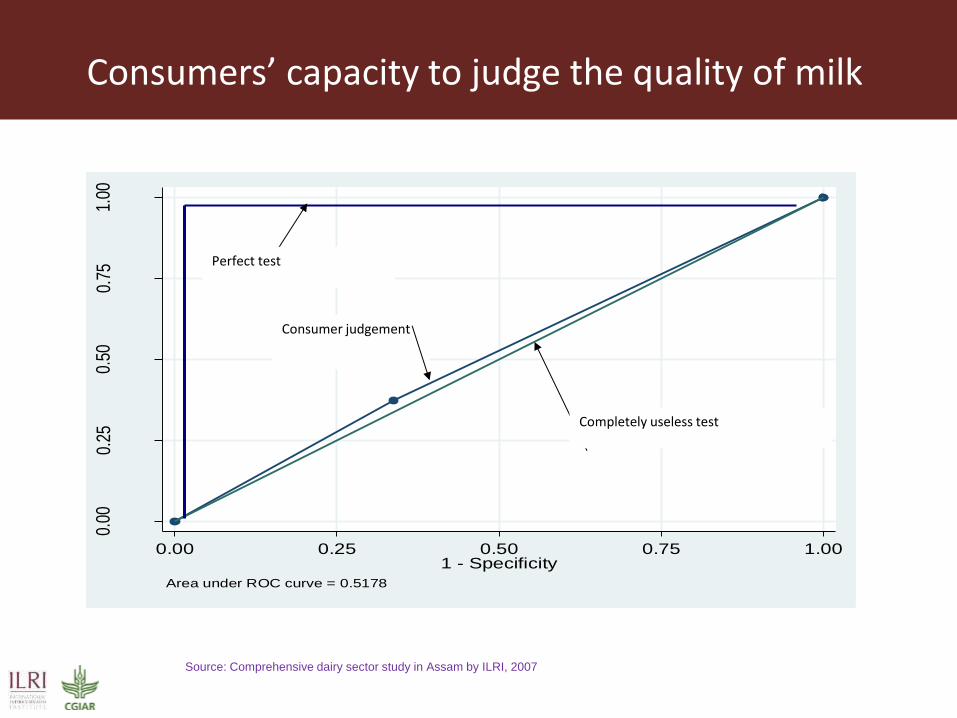
0.00
0.25
0.50
0.75
1.00
Sen
sitiv
ity
0.00 0.25 0.50 0.75 1.001 - Specificity
Area under ROC curve = 0.5178
Perfect test
Consumer judgement
Completely useless test
Consumers’ capacity to judge the quality of milk
Source: Comprehensive dairy sector study in Assam by ILRI, 2007

The questions lies....
• Are we not responsible for 80% milk consumers who are consuming milk supplied by informal sector?
• Do we have strategy to improve the hygiene and quality of milk marketed by informal market actors?
• Would it be possible to transform whole informal to formal within a few years?
• If not......

Piloted a collective integrated approach
Brought all relevant agencies together to constitute a common platform - JCMC
• Dairy Development Department
• Animal Health and Veterinary Department
• Department of Health Services
• Municipal Corporation
• Assam Agricultural University
• ILRI

What we did
• Dovetailed individual departmental initiative towards the common
cause
• Developed friendly relation with market actors
• Assessed their knowledge, attitude & practices
• Developed customised training manuals after training needs assessment
• Implemented training & monitoring program throughout the pathway
• Designed consumers’ awareness program
• Designed an incentive plan
Progress
• A baseline survey was conducted covering producers , traders, sweet makers and consumers in 2009
• 263 milk traders trained & monitored in 2010-11
• 356 milk producers trained & monitored
• The same baseline survey was repeated in 2012 to see the difference before and after and with and without

Added water in milk
2009 2012
Producers 0-66% 0-28 %
Traders 2-55% 0-31 %

Conférence internationale Africa 2013 sur l’Ecosanté
Can diseases be transmitted from dung?
13
Believe diseases can be transmitted
from dung
Producers
2009 2.7% (11/404)
2012 37.2% (60/161)***
Trained (2012) 69.8% (37/53)***
Untrained (2012) 21.3% (23/108)
Traders
2009 1.1% (2/175)
2012 47.1% (106/225)***
Trained (2012) 63.9% (78/122)***
Untrained (2012) 27.2% (28/103) Comparison between 2009 and 2012 survey
Comparison between trained and untrained 2012
Comparison between 2009 and untrained 2012

Conférence internationale Africa 2013 sur l’Ecosanté
Can diseases be transmitted by milk?
14
Believe diseases can be transmitted
from milk
Producers
2009 13.0% (52/401)
2012 35.4% (57/161)***
Trained (2012) 64.2% (34/53)***
Untrained (2012) 21.3% (23/108)
Traders
2009 9.1% (16/175)
2012 41.5% (93/224)***
Trained (2012) 64.8% (79/122)***
Untrained (2012) 13.7% (14/102) Comparison between 2009 and 2012 survey
Comparison between trained and untrained 2012
Comparison between 2009 and untrained 2012

Conférence internationale Africa 2013 sur l’Ecosanté
Is the milk completely safe after boiling?
15
Believe milk is completely safe after
boiling
Producers
2009 96.0% (380/396)
2012 93.1% (148/159)
Trained (2012) 86.8% (46/53)*
Untrained (2012) 96.2% (102/106)
Traders
2009 89.1% (156/175)
2012 93.8% (212/226)
Trained (2012) 91.8% (112/122)
Untrained (2012) 96.2% (100/104)*
Comparison between 2009 and 2012 survey
Comparison between trained and untrained 2012
Comparison between 2009 and untrained 2012

Conférence internationale Africa 2013 sur l’Ecosanté
Which diseases can be transmitted?
Tuberculosis
Food poisoning/
gastrointestinal
disease
General disease
symptoms (fever,
cough, cold) Worms
Producers
2009 3.5% (14/405) 18.3% (74/405) 0.3% (1/405) 4.7% (19/405)
2012 8.7% (14/161)** 36.0% (58/161)*** 11.2% (18/161)*** 9.3% (15/161)*
Trained (2012) 18.9% (10/53)*** 64,2% (34/53) *** 20.8% (11/53)** 9.4% (5/53)
Untrained (2012) 3.7% (4/108) 22.2% (24/108) 6.5% (7/108)*** 9.3% (10/108)
Traders
2009 4.0% (7/175) 9.7% (17/175) 0% (0/175) 2.9% (5/175)
2012 13.7% (31/226)*** 42.9% (97/226)*** 11.5% (26/226)*** 4.0% (9/226)
Trained (2012) 23.8% (29/122)*** 61.5% (75/122)*** 20.5% (25/122)*** 6.6% (8/122)*
Untrained (2012) 1.9% (2/104) 21.2% (22/104)** 1.0% (1/104) 1.0% (1/104)
16 Comparison between 2009 and 2012 survey
Comparison between trained and untrained 2012
Comparison between 2009 and untrained 2012

What do you use most often to wash your hands?
• Producers
• Untrained- 53% answered soap
• Trained – 92% answered soap (p<0.001)
• Traders
• Untrained- 74% answered soap
• Trained – 92% answered soap (p<0.001

Some specks of dirt in the milk are not harmful • Producers
• Untrained – 58% agree
• Trained – 77% agree (p=0.046)
• Traders
• Untrained – 37.5% agree
• Trained – 28% agree
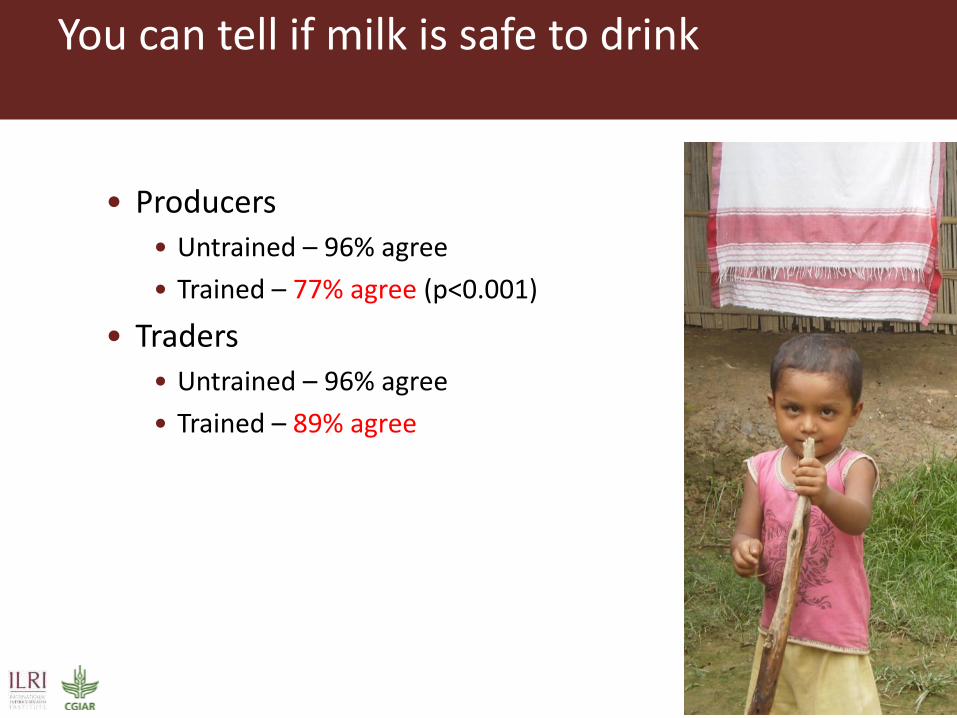
You can tell if milk is safe to drink
• Producers
• Untrained – 96% agree
• Trained – 77% agree (p<0.001)
• Traders
• Untrained – 96% agree
• Trained – 89% agree

It is good for the cow if you add water to the milk
• Producers
• Untrained – 76% agree
• Trained – 64% agree (p=0.052)
• Traders
• Untrained – 72% agree
• Trained – 53% agree (p<0.001)

In practice
• Producers
• No difference in the number of milk containers were free from dirt (92% were not)
• No difference in if milk was free from dirt (2.5% were not)
• 79% of trained producers had clean clothes, compared to 68% of untrained (p<0.001)
• Traders
• No difference in if milk was free from dirt (3.5% were not)
• 82% of trained traders had clean clothes, compared to 50% of untrained (p<0.001)

With training Without training
Mean STD Mean STD
1. Total milk procured per day (liter) 146.79 266.50 86.03 181.19
2. Total milk sold per day (liter) 151.56 266.43 90.15 186.74
3. Cost of milk procured per day (RS) 4129.70 8085.92 2236.20 5530.79
4. Cost of operations per day (RS) 260.47 325.29 153.68 139.81
5. Total costs/day (3+4) (RS) 4390.17 8375.34 2389.88 5661.26
Cost/liter milk sold (RS) 28.97 11.50 26.51 13.77
Comparison of training effects on milk trading indicators, exposed and control

Benefits realised by producers
• Prevalence of sub clinical mastitis come down among the cows of trained farmers.
• Productivity of milk in dairy cows of trained farmers increased by 11.7%

Conclusion
People centric collective and integrated initiative was useful for changing knowledge, attitude & practices
Strength
• Collaborative effort worked effectively
• Friendly approach was useful for building trust
• Training & monitoring programmed was delivered in true spirit
Weakness
• Some external factors were beyond the control of the project that influenced the outcome
• Tangible incentives, consumers’ awareness & BDS programme could not be implemented

Thank You