
Health Outcomes of Western NC Compared to Eastern NC Relating to Race & Ethnicity Casey Mullen ...
47
Health Outcomes of Western NC Compared to Eastern NC Relating to Race & Ethnicity Casey Mullen Kirsten Dickson Amanda Marshall
-
Upload
clyde-mcdonald -
Category
Documents
-
view
213 -
download
0
Transcript of Health Outcomes of Western NC Compared to Eastern NC Relating to Race & Ethnicity Casey Mullen ...
Health Outcomes of Western NC Compared to Eastern NC Relating to Race & Ethnicity
Casey Mullen Kirsten Dickson Amanda Marshall
Who? What? Where?
A comparative display of statistics on health outcomes by race and/or ethnicity for Eastern NC as compared with Western NC
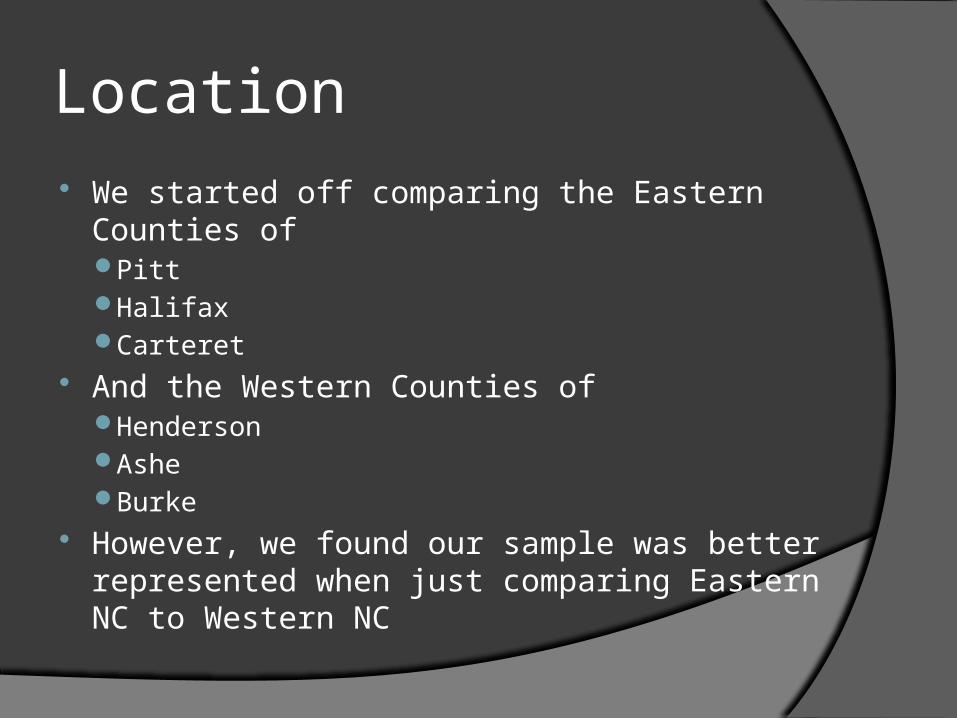
Location We started off comparing the Eastern Counties of
PittHalifaxCarteret
And the Western Counties ofHendersonAsheBurke
However, we found our sample was better represented when just comparing Eastern NC to Western NC
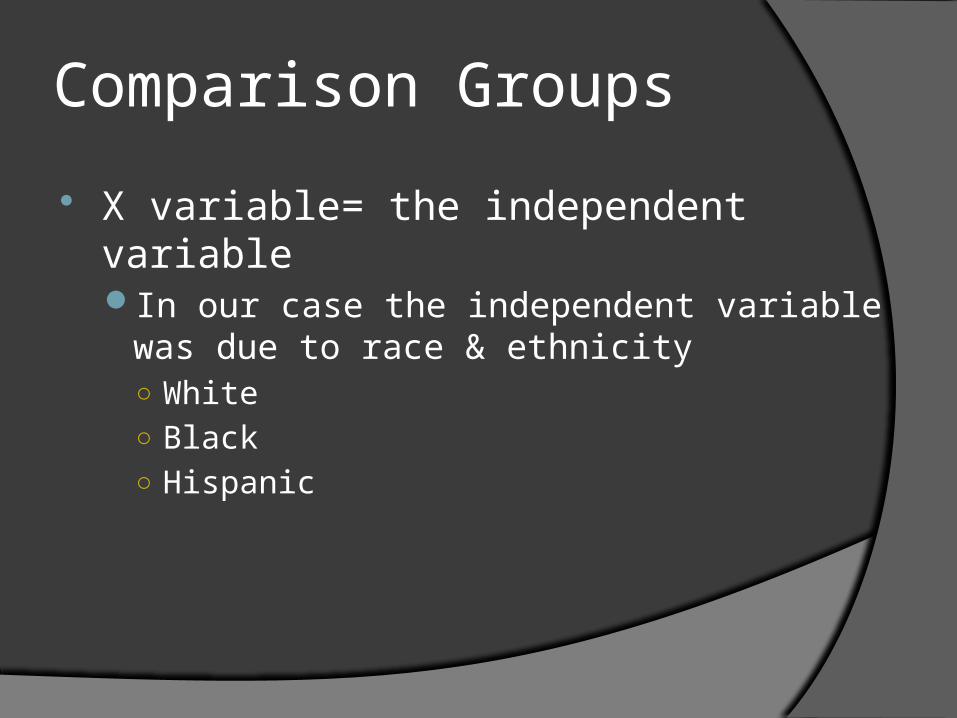
Comparison Groups
X variable= the independent variableIn our case the independent variable was due to
race & ethnicity○ White○ Black○ Hispanic
Measures
Y variable= dependent variableHad to do with the annual mortality rate from
the health outcomes of 2010 due to…○ Heart disease○ All types of cancers○ COPD○ Stroke
What Does This Mean?
TheoryThe specific population of mortality from
each disease (D.V.) depends on the race and ethnicity (I.V.) of those diagnosed with these diseases and upon which region they live in (East vs. West) in North Carolina

Understanding the Slope Correlation
Two random variables are positively correlated if high values of one are likely to be associated with high values of the other (upward slope to the right corner of the graph)
They are negatively correlated if high values of one are likely to be associated with low values of the other (downward slope to the right)
If there is no correlation then the two variables simply do not affect one another and share no relation (straight line on the graph)
So, how well can we predict one from the other?

What Does This Mean?
Therefore, if one race has a positive correlation with a particular mortality rate, then that race is more strongly associated with dying from that disease or vice versa
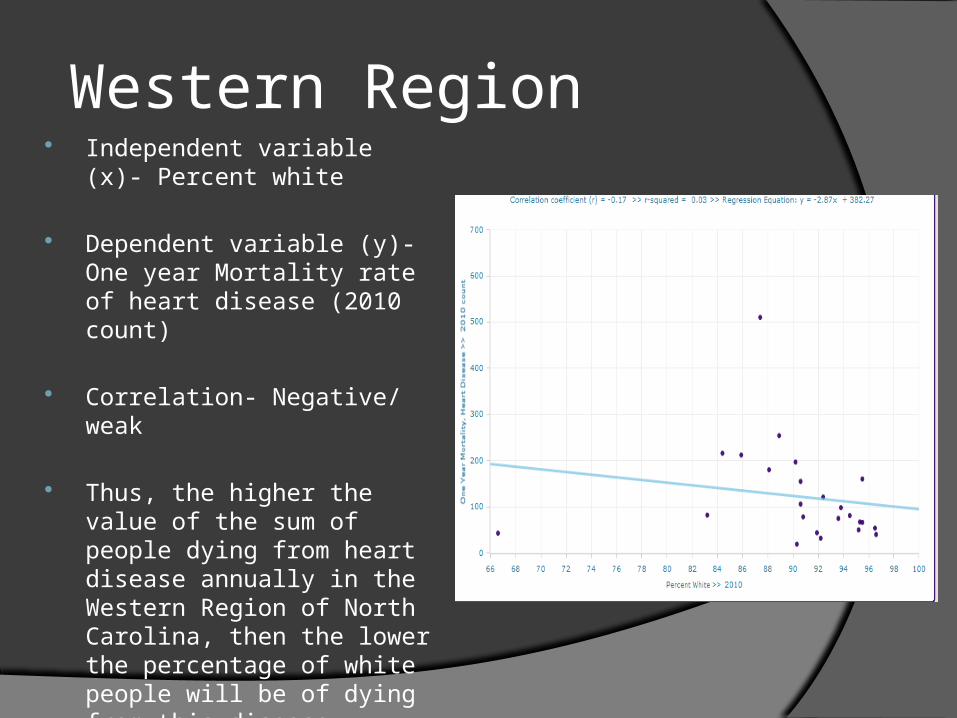
Western Region Independent variable (x)-
Percent white
Dependent variable (y)- One year Mortality rate of heart disease (2010 count)
Correlation- Negative/ weak
Thus, the higher the value of the sum of people dying from heart disease annually in the Western Region of North Carolina, then the lower the percentage of white people will be of dying from this disease (versus their black and Hispanic counterparts)
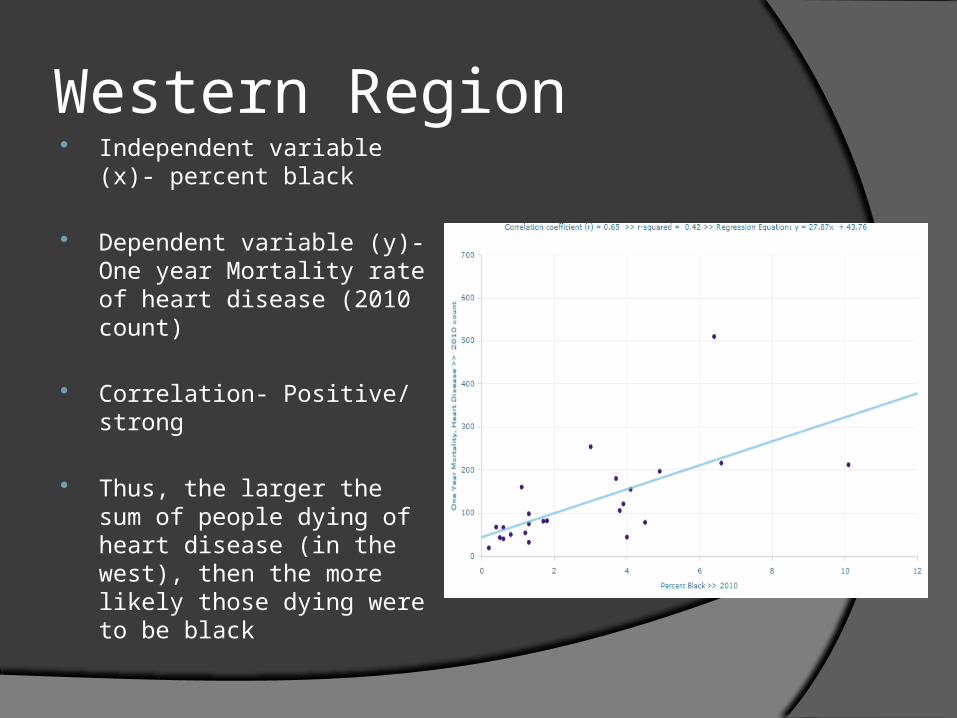
Western Region Independent variable (x)-
percent black
Dependent variable (y)- One year Mortality rate of heart disease (2010 count)
Correlation- Positive/ strong
Thus, the larger the sum of people dying of heart disease (in the west), then the more likely those dying were to be black
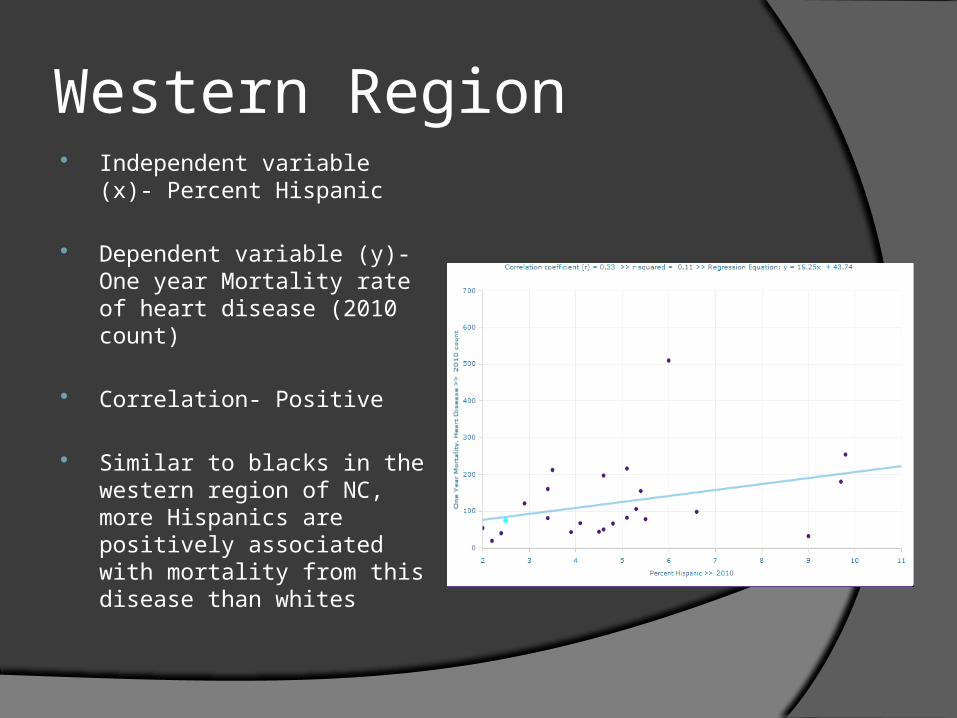
Western Region Independent variable (x)-
Percent Hispanic
Dependent variable (y)- One year Mortality rate of heart disease (2010 count)
Correlation- Positive
Similar to blacks in the western region of NC, more Hispanics are positively associated with mortality from this disease than whites
Summary
Blacks and Hispanics are more strongly associated with death due to heart disease than whites in the Western Region of North Carolina

Eastern Region Independent variable (x)- Percent
white
Dependent variable (y)- One year Mortality rate of heart disease
Correlation- Negative (almost flat as if no correlation were present)
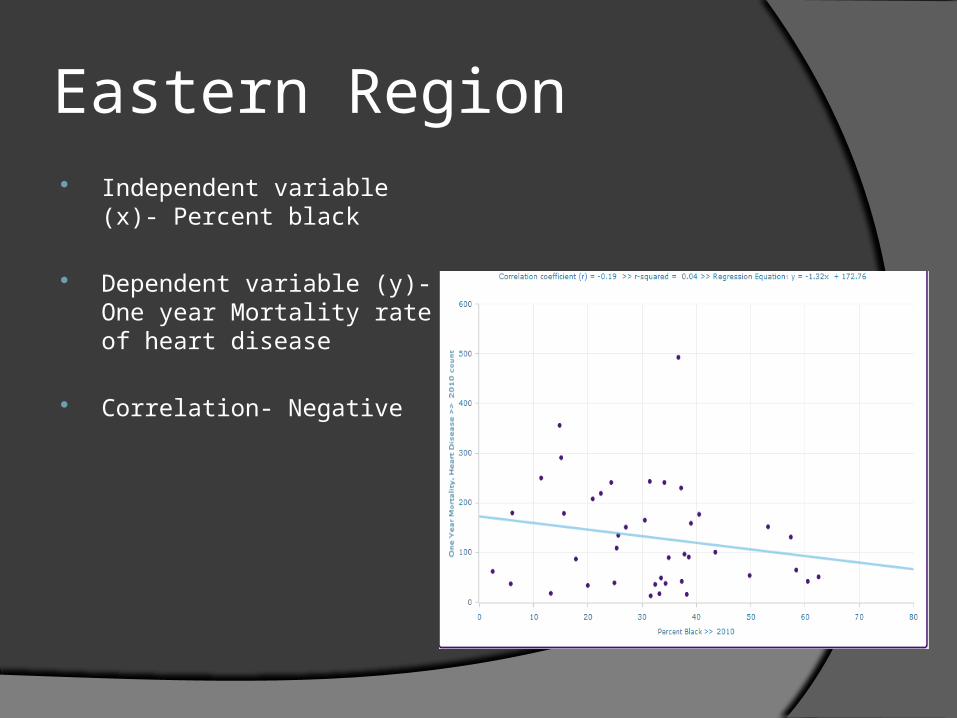
Eastern Region Independent variable (x)-
Percent black
Dependent variable (y)- One year Mortality rate of heart disease
Correlation- Negative
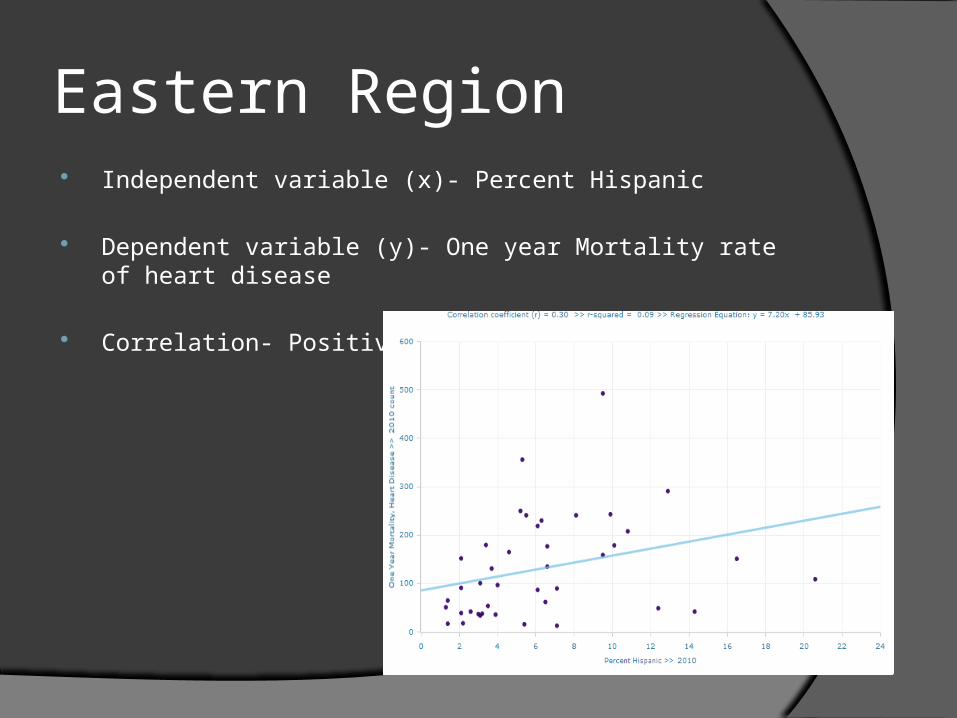
Eastern Region Independent variable (x)- Percent Hispanic
Dependent variable (y)- One year Mortality rate of heart disease
Correlation- Positive
In Sum
Whites and blacks are less associated with death due to heart disease than Hispanics are in the Eastern portion of North Carolina

Western Region I.V.- White
D.V.- One year mortality, all cancers
Correlation- Negative
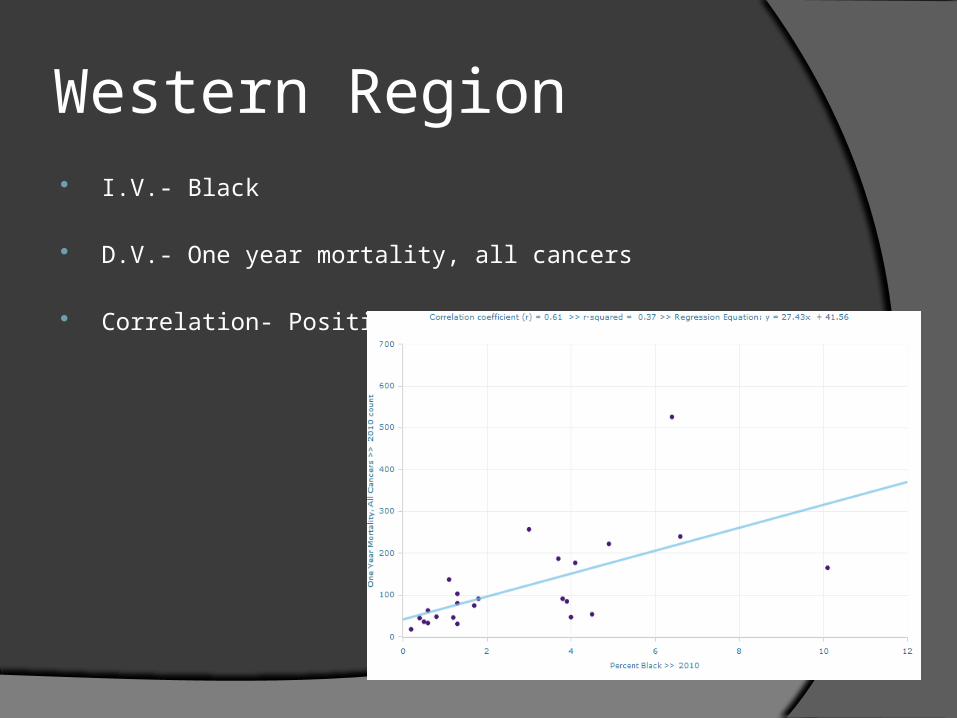
Western Region I.V.- Black
D.V.- One year mortality, all cancers
Correlation- Positive
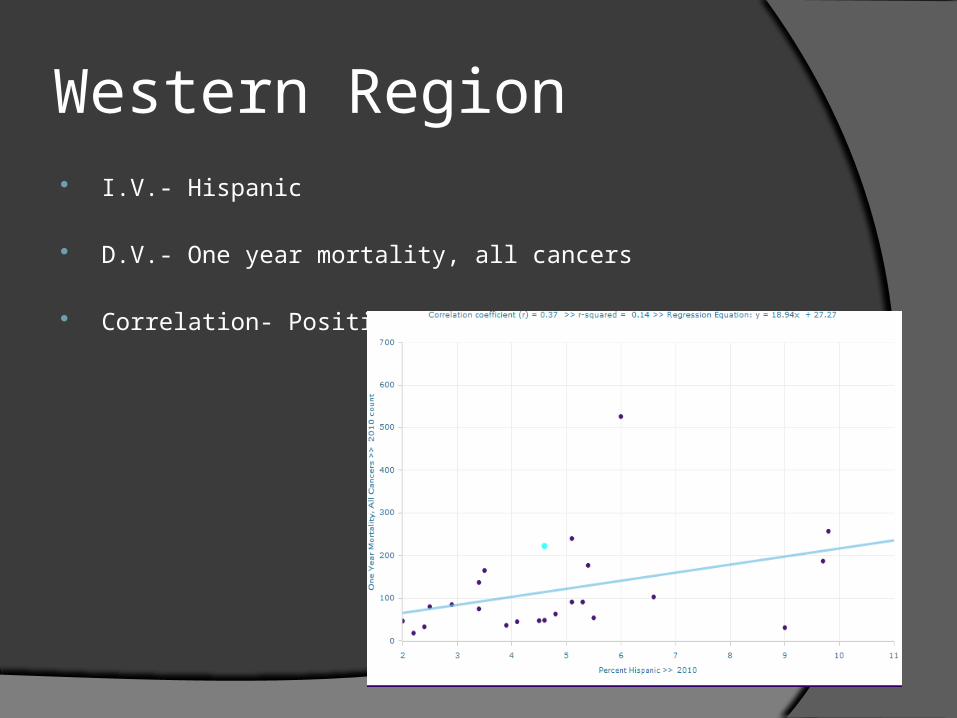
Western Region I.V.- Hispanic
D.V.- One year mortality, all cancers
Correlation- Positive
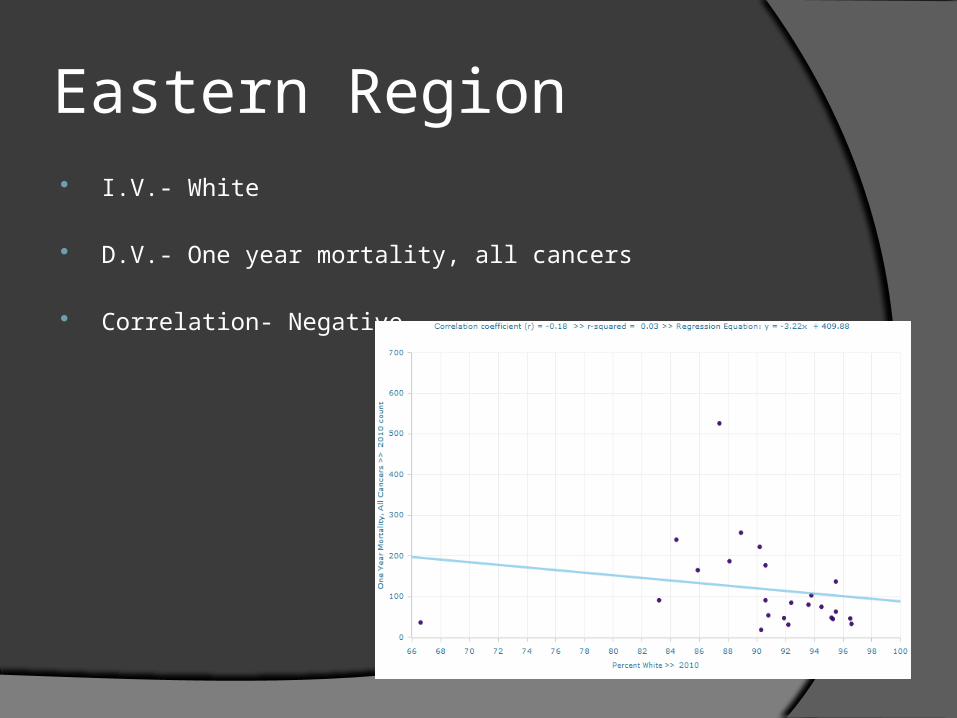
Eastern Region I.V.- White
D.V.- One year mortality, all cancers
Correlation- Negative
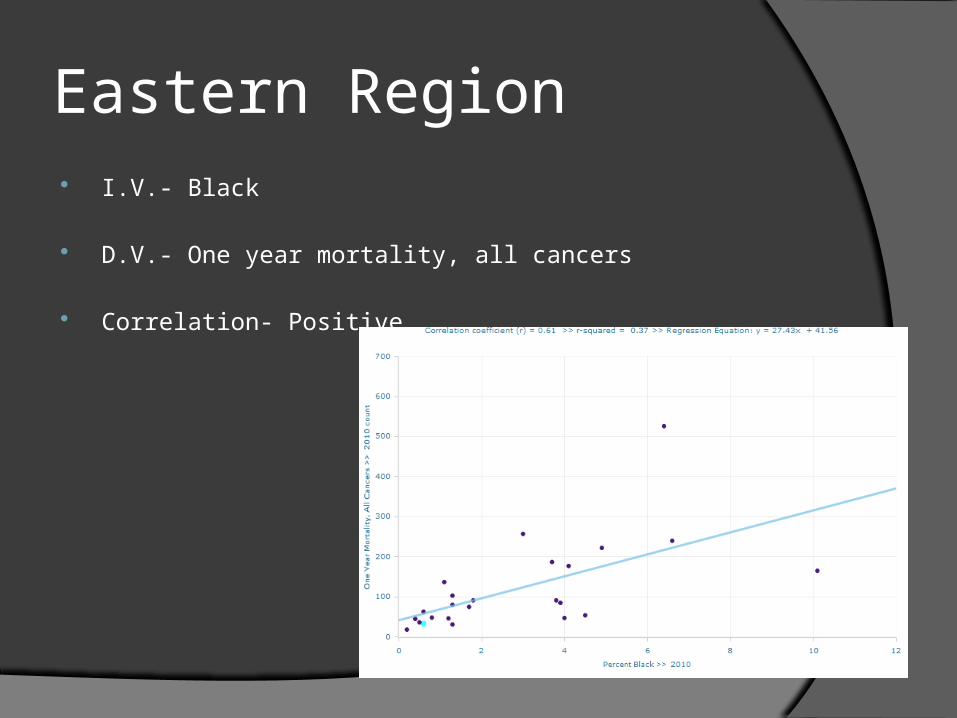
Eastern Region I.V.- Black
D.V.- One year mortality, all cancers
Correlation- Positive
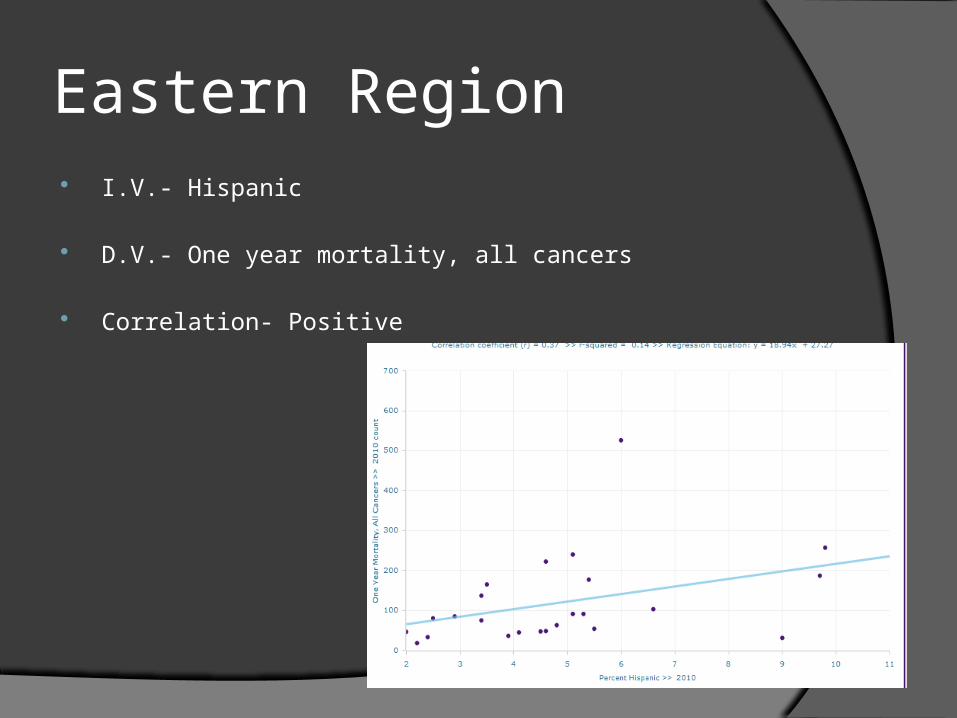
Eastern Region I.V.- Hispanic
D.V.- One year mortality, all cancers
Correlation- Positive
Summary
Whites are more weakly assoc. with death due to cancers in the West and the East than blacks and Hispanics
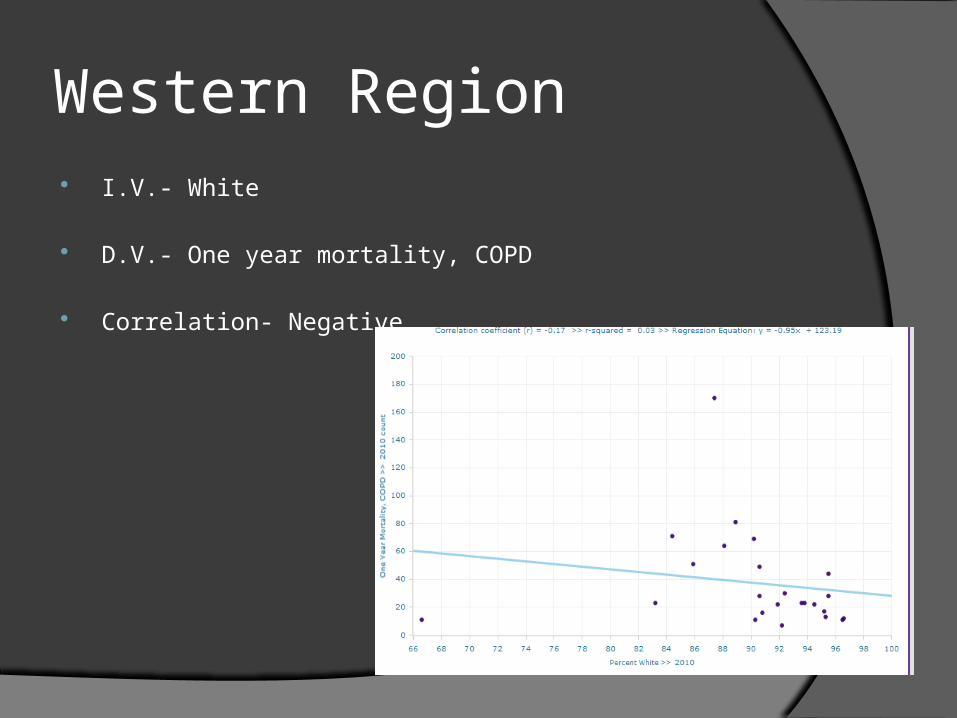
Western Region I.V.- White
D.V.- One year mortality, COPD
Correlation- Negative
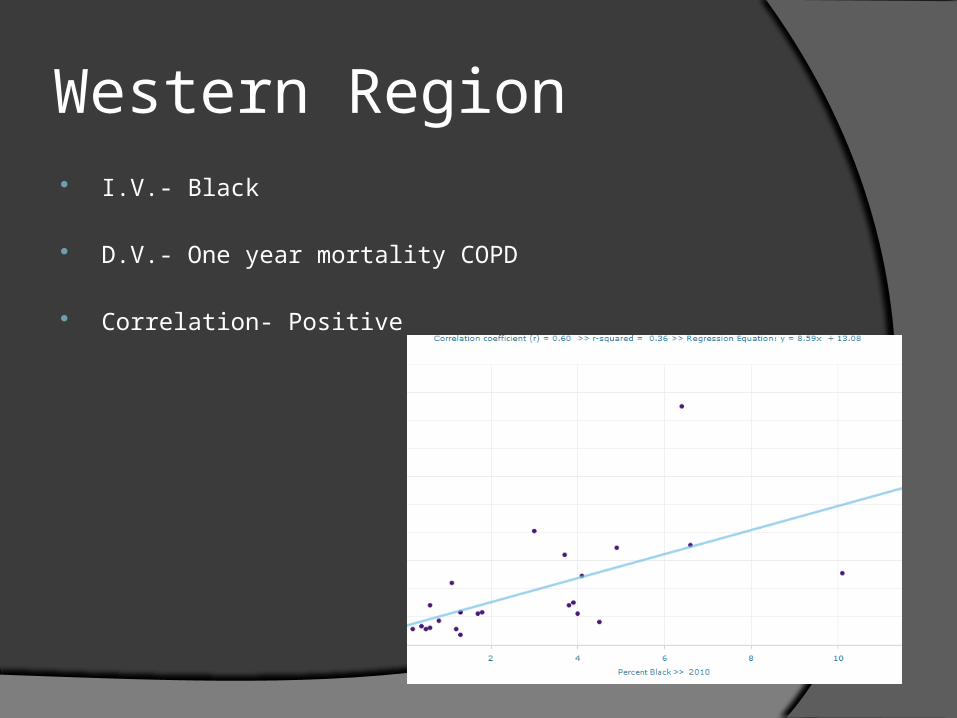
Western Region I.V.- Black
D.V.- One year mortality COPD
Correlation- Positive
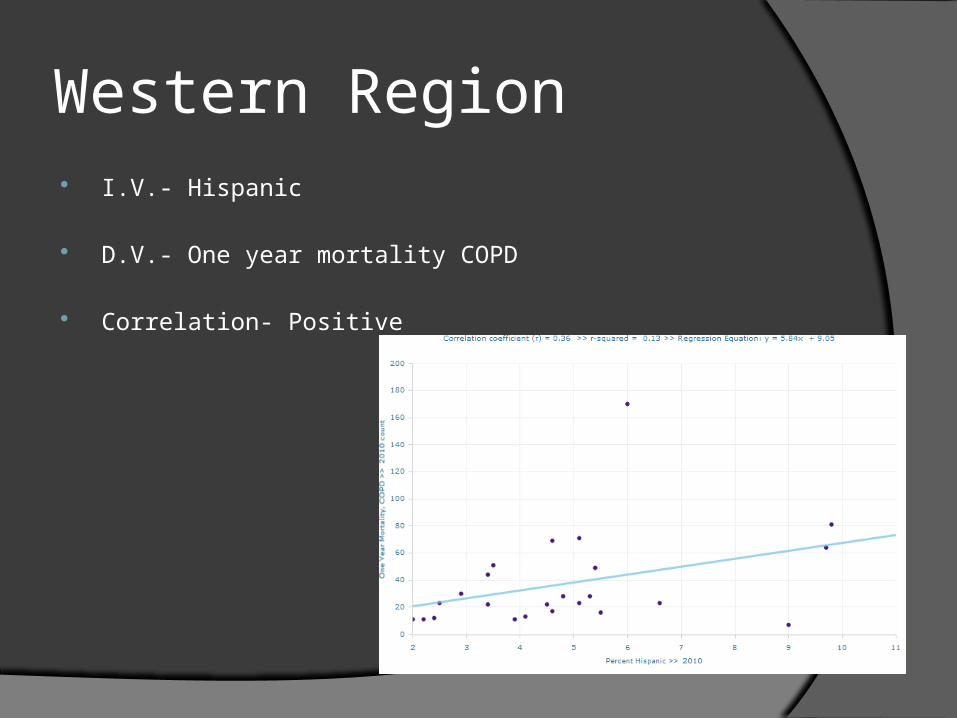
Western Region I.V.- Hispanic
D.V.- One year mortality COPD
Correlation- Positive

Summary
Whites are less associated with death due to COPD in the Western Region of NC than blacks and Hispanics
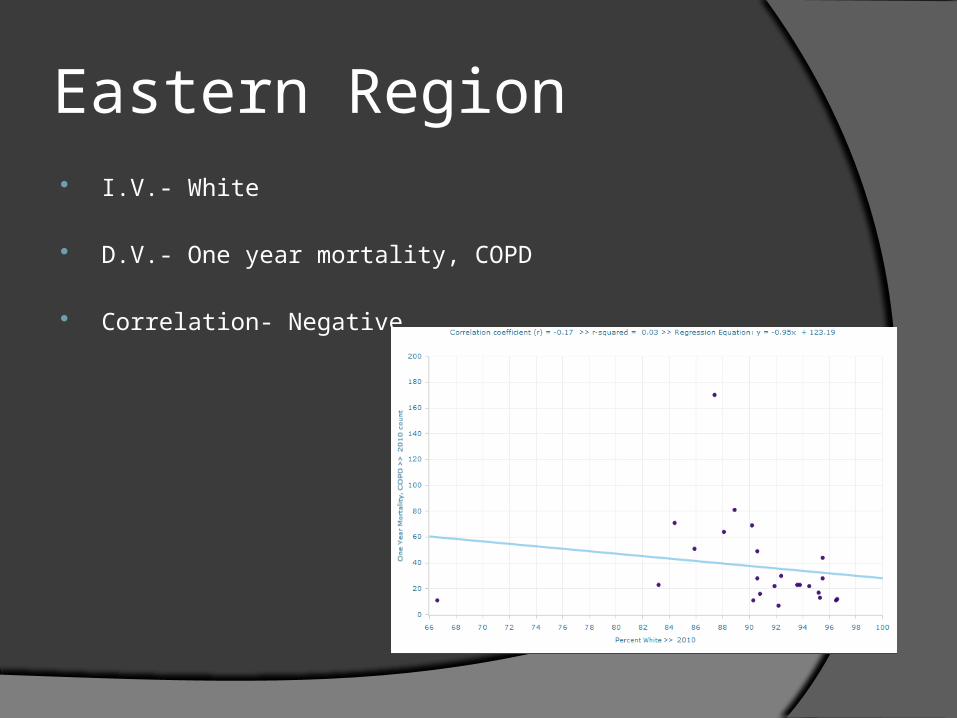
Eastern Region I.V.- White
D.V.- One year mortality, COPD
Correlation- Negative
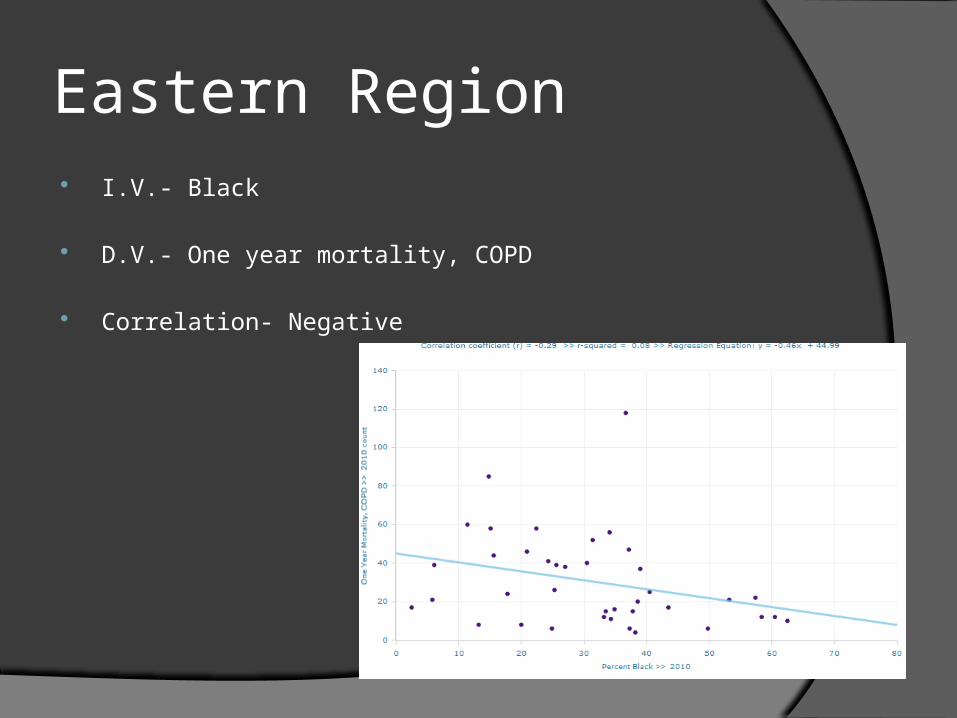
Eastern Region I.V.- Black
D.V.- One year mortality, COPD
Correlation- Negative
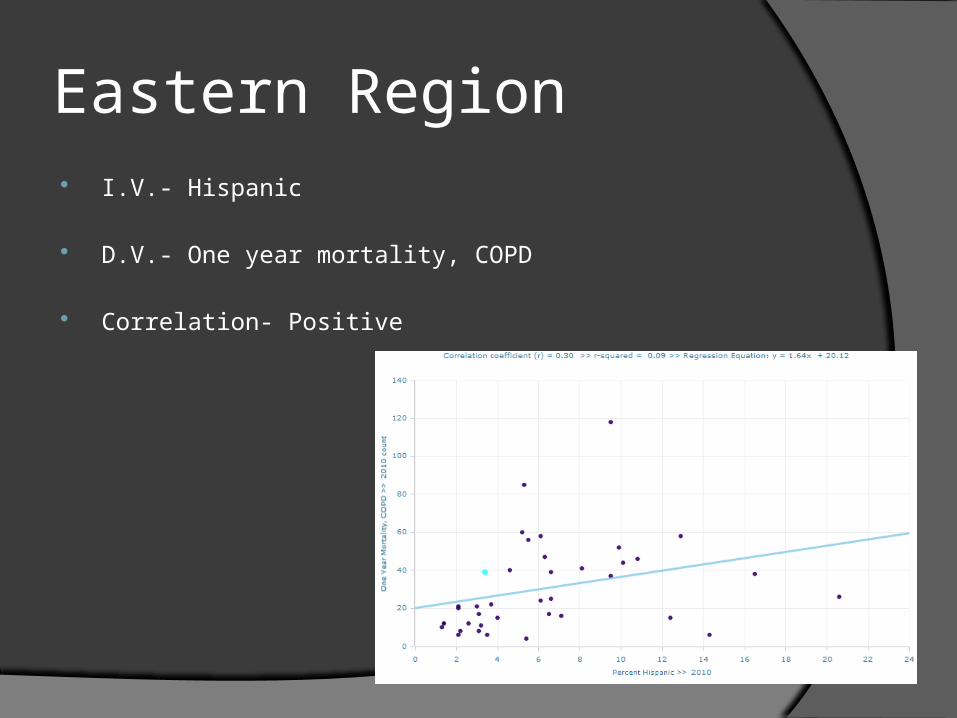
Eastern Region I.V.- Hispanic
D.V.- One year mortality, COPD
Correlation- Positive
Summary
Hispanics are more strongly associated with death due to COPD than whites and blacks in the East part of NC
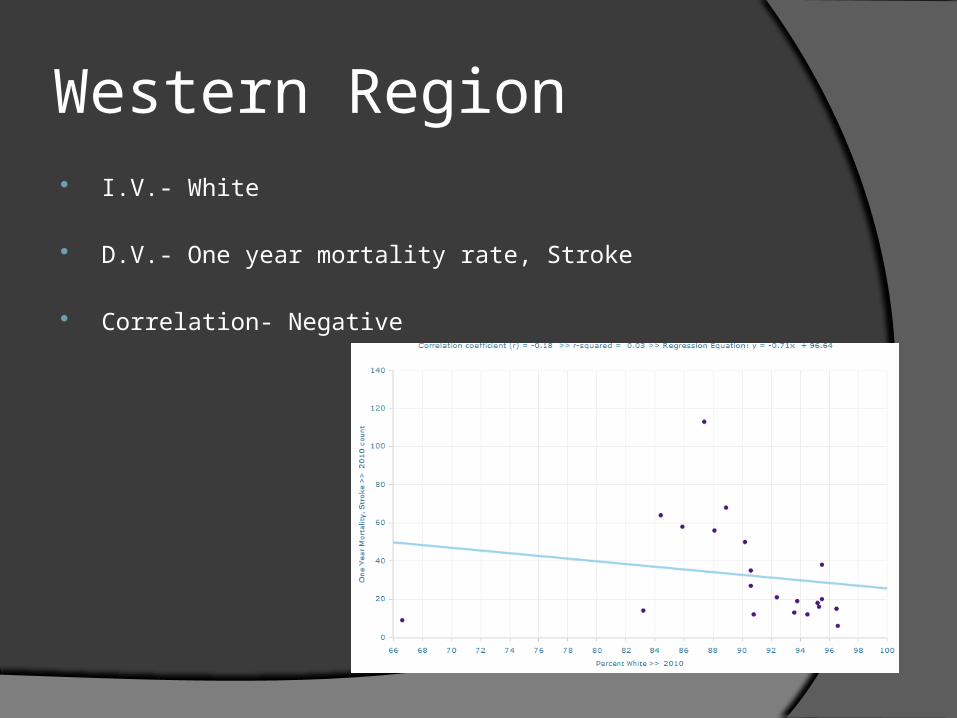
Western Region I.V.- White
D.V.- One year mortality rate, Stroke
Correlation- Negative
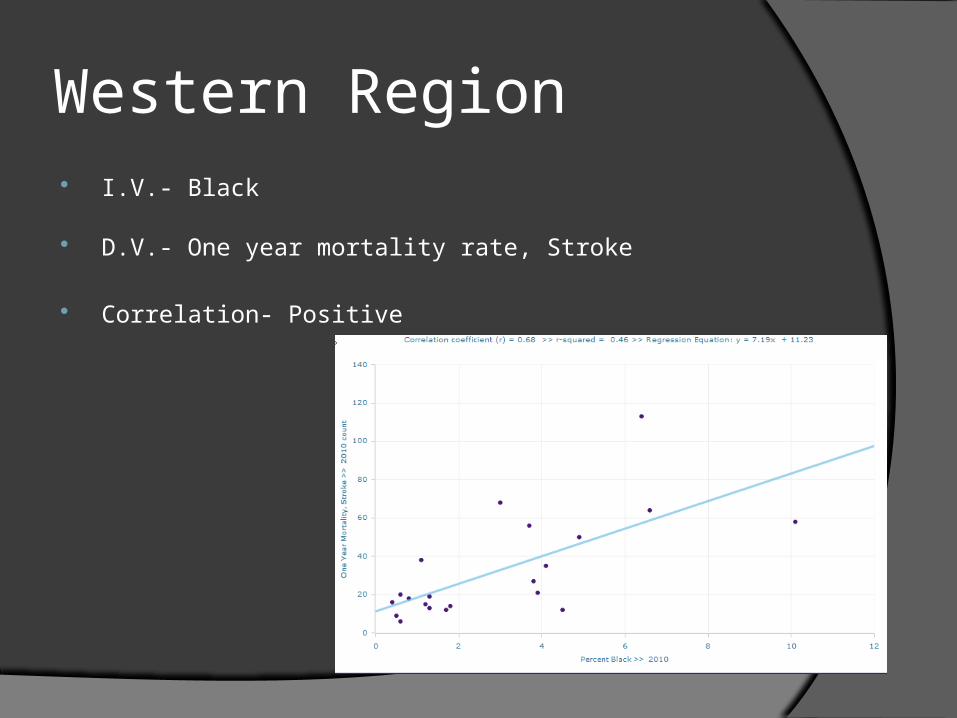
Western Region I.V.- Black
D.V.- One year mortality rate, Stroke
Correlation- Positive
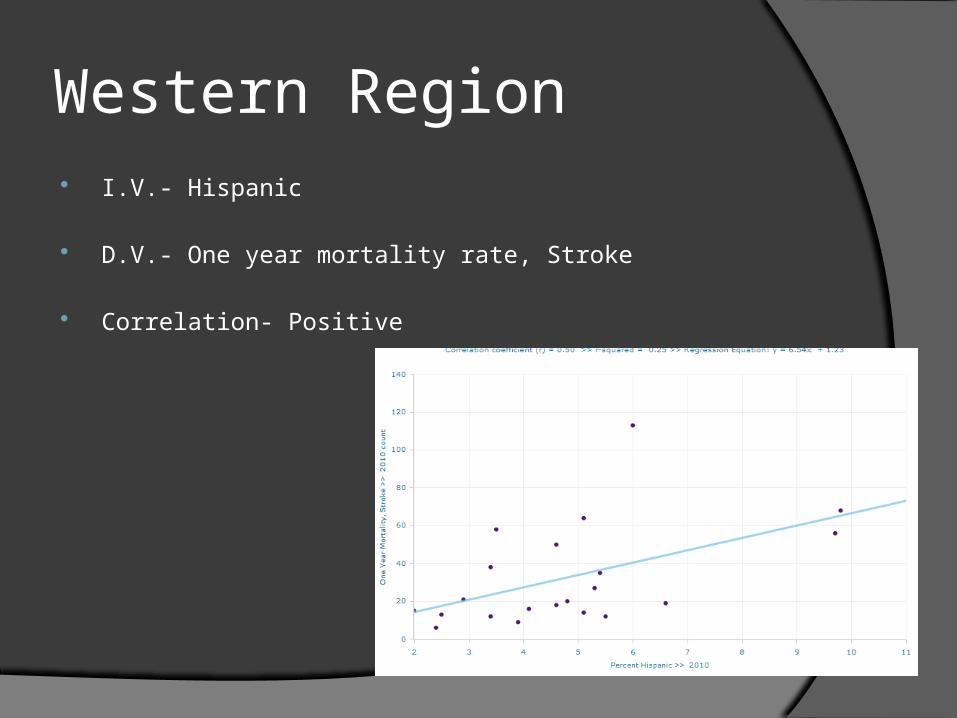
Western Region I.V.- Hispanic
D.V.- One year mortality rate, Stroke
Correlation- Positive
Summary
Hispanics and blacks from the Western portion of NC are more highly associated with mortality from stroke than whites are

Eastern Region I.V.- White
D.V.- One year mortality rate, Stroke
Correlation- None
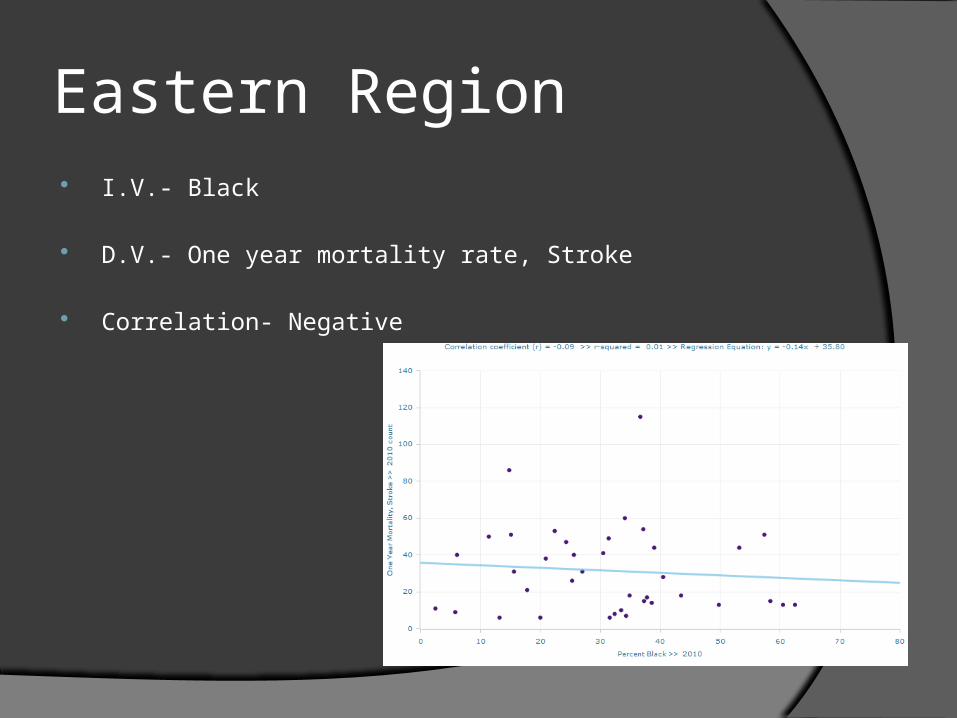
Eastern Region I.V.- Black
D.V.- One year mortality rate, Stroke
Correlation- Negative

Eastern Region I.V.- Hispanic
D.V.- One year mortality rate, Stroke
Correlation- Positive
In Sum
Whites show no correlation is evident between their race and its effects on the mortality rate of stroke in the East
Blacks show a weak correlation
While Hispanics show a strong correlation
Overview of SES Both African Americans and Hispanics, as a whole,
have lower income, lower educational level, and higher unemployment rates than Whites
Both minority groups also have higher percentages of people who don’t have current health insurance, couldn’t see a doctor due to cost, or who had no personal doctor when compared to their white counterparts
These things contribute to higher rates of health problems

Blacks & Hispanics
Less likely than whites to get the recommended level of physical activity or to engage in any leisure time activity
Less likely to consume recommended amount of fruits and vegetables each day

Hispanics
Top 3 causes of deathCancerMotor vehicle injuriesHeart disease
Hispanics Continued
Higher percentages reported of fair or poor health when compared to whites or blacks
Less likely to report diabetes, high blood pressure, or asthma than whites or blacks
In reality, Hispanics are worse off than whites, but better off than blacks

Blacks
Top 4 diseases among African AmericansHeart DiseaseCancerStrokeDiabetes
Higher rates of obesity when compared to whites

Blacks Continued
Heart DiseaseAfrican Americans are 30% more likely to die
from heart disease than whites
CancerSubstantially higher rates of prostate cancer
compared to whites
Higher rates of colon/rectum and cervical cancer
Steps should be considered in developing policies to eliminate racial and ethnic disparities:[
Consistent racial and ethnic data collection by health care providers
Effective evaluation of disparities-reduction programs
Minimum standards for culturally and linguistically competent health services
Greater minority representation within the health care workforce
Establishment or enhancement of government offices of minority health
Expanded access to services for all ethnic and racial groups
Involvement of all health system representatives in minority health improvement efforts

How can we generate these changes? Interpreter services
Recruitment
Specialized Training
Use of Community Health Workers
Culturally competent health promotion
Including family and/or community members
Immersion into another culture
Administrative and Organizational accommodations