

Health Inequalities in Hertfordshire · • Health inequalities occur between different sections of...
12
Transcript of Health Inequalities in Hertfordshire · • Health inequalities occur between different sections of...
www.hertfordshire.gov.uk
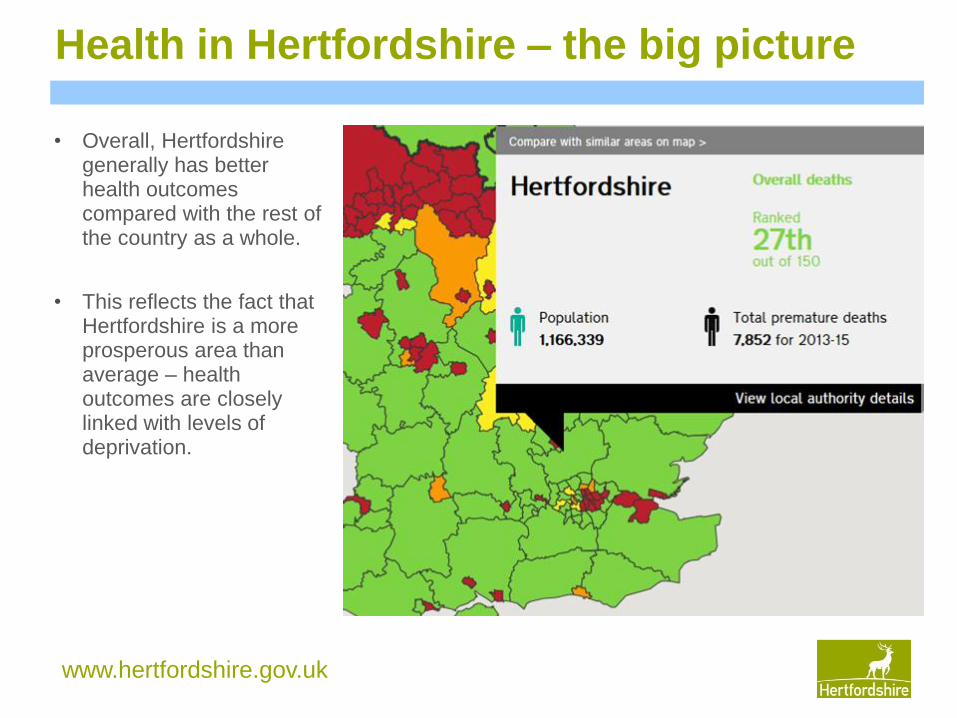
• Overall, Hertfordshire generally has better health outcomes compared with the rest of the country as a whole.
• This reflects the fact that Hertfordshire is a more prosperous area than average – health outcomes are closely linked with levels of deprivation.
Health in Hertfordshire – the big picture
www.hertfordshire.gov.uk
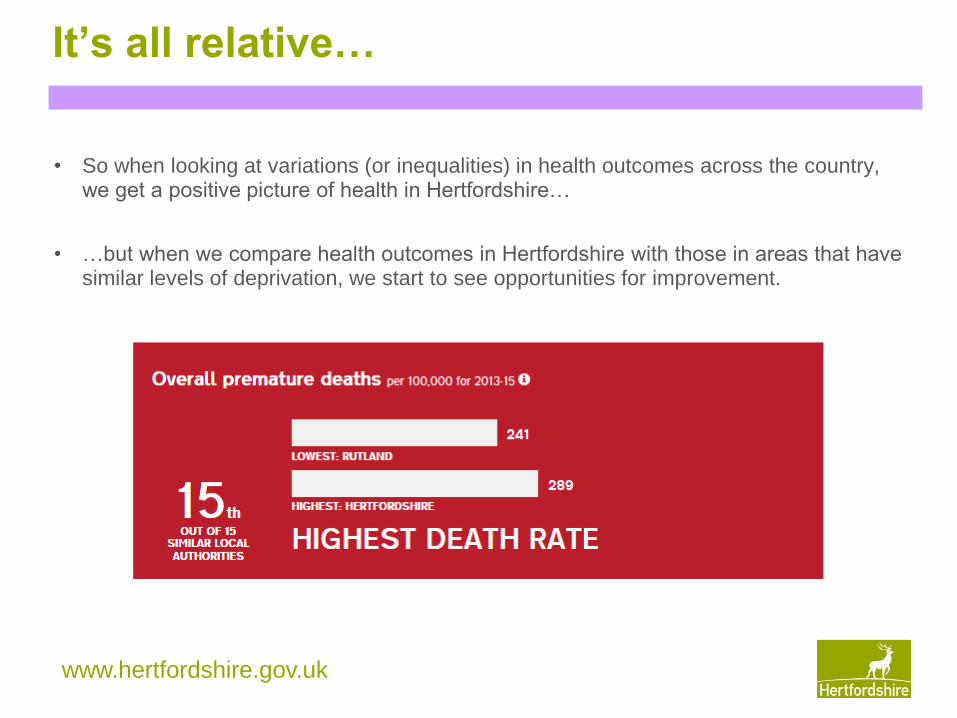
It’s all relative…
• So when looking at variations (or inequalities) in health outcomes across the country, we get a positive picture of health in Hertfordshire…
• …but when we compare health outcomes in Hertfordshire with those in areas that have similar levels of deprivation, we start to see opportunities for improvement.
www.hertfordshire.gov.uk
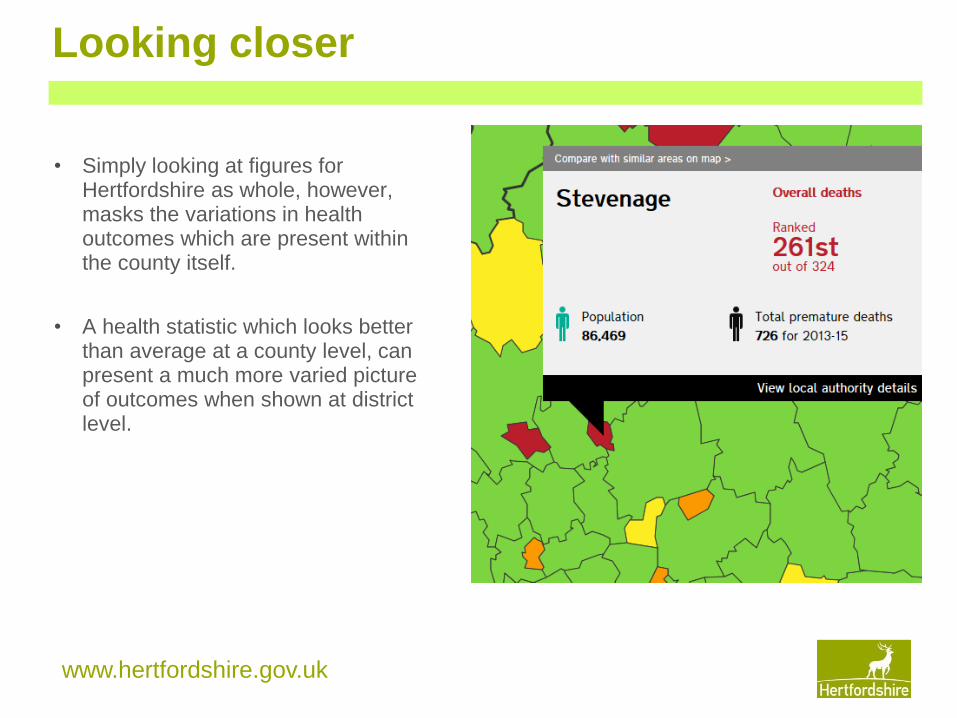
Looking closer
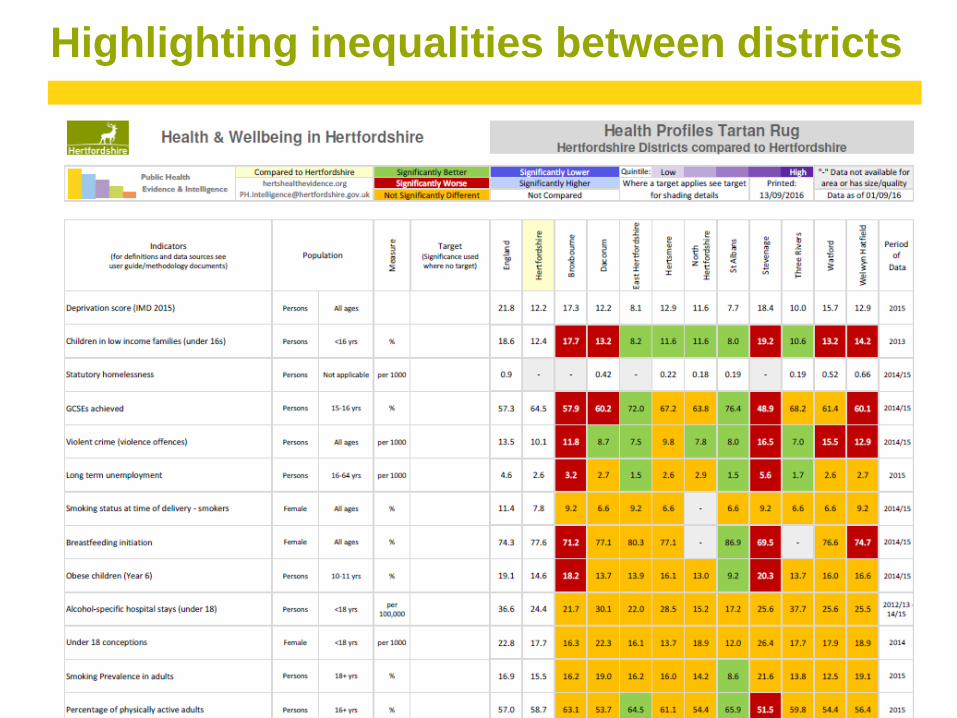
• Simply looking at figures for Hertfordshire as whole, however, masks the variations in health outcomes which are present within the county itself.
• A health statistic which looks better than average at a county level, can present a much more varied picture of outcomes when shown at district level.
www.hertfordshire.gov.uk
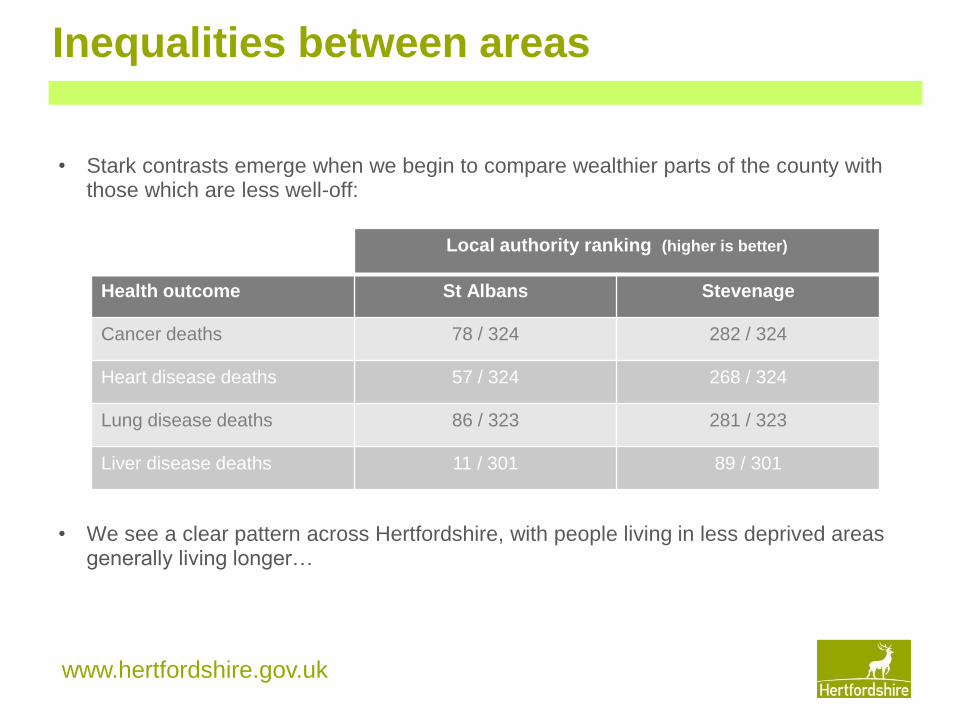
Inequalities between areas
• Stark contrasts emerge when we begin to compare wealthier parts of the county with those which are less well-off:
Local authority ranking (higher is better)
Health outcome St Albans Stevenage
Cancer deaths 78 / 324 282 / 324
Heart disease deaths 57 / 324 268 / 324
Lung disease deaths 86 / 323 281 / 323
Liver disease deaths 11 / 301 89 / 301
• We see a clear pattern across Hertfordshire, with people living in less deprived areas generally living longer…
www.hertfordshire.gov.uk
• Stark contrasts emerge when we begin to compare wealthier parts of the county with those which are less well off:
www.hertfordshire.gov.uk
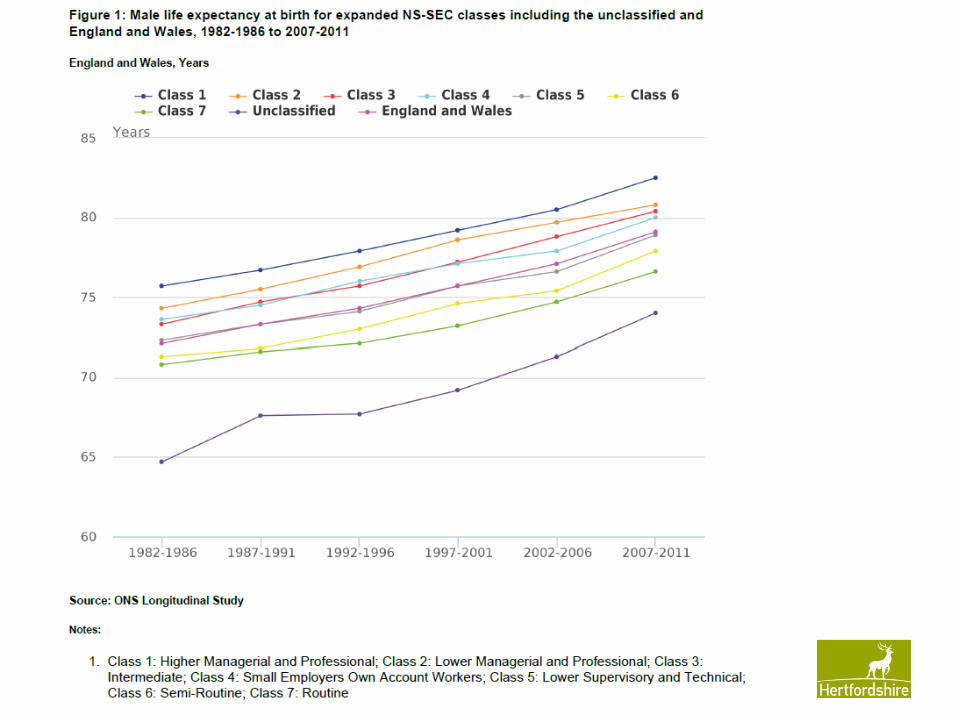
Inequalities between social classes
• Health inequalities occur between different sections of the population, as well between different geographical areas.
• Across the country, we see a health gradient across the class spectrum, with those who are better off generally experiencing better health and the poorest in society experiencing the worst health outcomes…
www.hertfordshire.gov.uk
www.hertfordshire.gov.uk
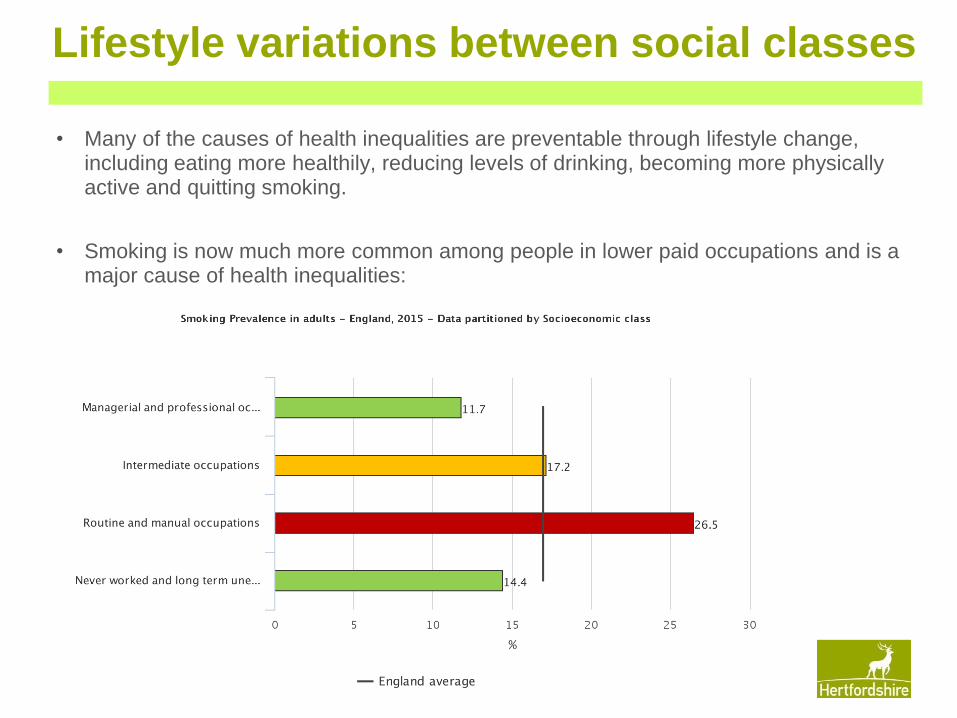
Lifestyle variations between social classes
• Many of the causes of health inequalities are preventable through lifestyle change, including eating more healthily, reducing levels of drinking, becoming more physically active and quitting smoking.
• Smoking is now much more common among people in lower paid occupations and is a major cause of health inequalities:
www.hertfordshire.gov.uk
Inequalities between other groups
• As well as inequalities based primarily on wealth and social status, we see variations in health outcomes based on a range of other characteristics, e.g.
– male life expectancy is consistently lower than female life expectancy
– levels of physical activity and smoking vary significantly across ethnic groups
– the level of overweight and obesity is significantly higher among people living with a disability compared with those who don’t have a disability
• When variations become compounded by deprivation-based inequalities between geographical areas, the differences in outcomes are even more stark; e.g.
– male life expectancy in the Stevenage ward of Woodfield is 75.9 years
– female life expectancy in the St Albans ward of Harpenden South is 88.6 years
www.hertfordshire.gov.uk
Highlighting inequalities between districts