Health in Rural Missouri, 2013-2015 Biennial...
124
in Rural Missouri ealth Missouri Department of Health and Senior Services Office of Primary Care and Rural Health Biennial Report
-
Upload
hoangthuan -
Category
Documents
-
view
213 -
download
1
Transcript of Health in Rural Missouri, 2013-2015 Biennial...

in Rural Missouri
ealth
Missouri Department of Health and Senior ServicesOffice of Primary Care and Rural Health
Biennial Report


3health.mo.gov Health in Rural Missouri
Health in Rural Missouri is produced by the Office of Primary Care and Rural Health, Department of Health and Senior Services.
Authors: Melissa Van Dyne, Manager State Office of Rural HealthLisa Branson, Health Program Representative State Office of Rural HealthBen Harvey, Chief Office of Primary Care and Rural HealthAmy Kelsey, Manager Office of Oral HealthAndrew Hunter, Chief Bureau of Health Care Analysis and Data Dissemination Becca Mickels, Research Analyst IV Bureau of Health Care Analysis and Data DisseminationWhitney Coffey, Research Analyst III Bureau of Health Care Analysis and Data DisseminationDavid Kelly, Research Analyst I Bureau of Health Care Analysis and Data DisseminationEvan Mobley, Research Analyst II Bureau of Vital StatisticsShumei Yun, State Chronic Disease Epidemiologist Office of EpidemiologyArthur Pashi, Research Analyst IV Office of Epidemiology
TABLE OF CONTENTSExecutive Summary 4
Introduction 6
Defining Rural Missouri 7
Demographic and Socioeconomic Indicators 8
Health Status 22
Maternal, Infant and Child Health 80
Health Behaviors and Risk Factors 90
Health Care Resources 95
Recommendations 99
State Office of Rural Health Activities 100
Glossary 104
Appendix A 109
Appendix B 111
Appendix C 116
Health in Rural Missouri

4health.mo.gov Health in Rural Missouri
The Missouri Office of Rural Health (Office) was established by the 1990 General Assembly (192.604, RSMo) to “assume a leadership role in working or contracting with state and federal agencies, universities, private interest groups, communities, foundations and local health centers to develop rural health initiatives and maximize the use of existing resources…” Located within the Missouri Department of Health and Senior Services’ Office of Primary Care and Rural Health, the Office reports on current activities and makes recommendations to the Missouri Governor and General Assembly every two years. This report also provides an analysis of the current health of rural Missourians to support those activities and recommendations.
Of the over 6,000,000 residents of Missouri, 2.23 million, or 37 percent, are considered rural.1 Since 2003, rural areas overall have experienced a 5.9 percent increase in residents; however, this increase is very uneven. Over this time period, 14 rural counties in northern Missouri had population losses of greater than 5 percent, while some rural counties adjacent to urban counties experienced population increases greater than 10 percent.
In terms of socioeconomics, rural Missourians are at a significant disadvantage compared to their urban counterparts when considering income and education. Missouri’s rural poverty rate (18.4 percent) is 27.8 percent higher than its urban poverty rate (14.4 percent). Fourteen Missouri counties are considered to be persistently poor, 13 of those counties being rural, according to the U.S. Department of Agriculture’s Economic Research Service’s definition. U.S. Census Bureau data indicate that rural Missourians are also approximately half as likely to hold a college degree as urban Missourians (16 percent for rural versus 32 percent for urban).
An analysis of standard markers of health status, reveals that rural Missourians are overall less healthy than their urban counterparts and more likely to die at an earlier age. The 2004-2012 average life expectancy for rural areas was 76.8 years compared to 77.8 years for urban areas. The rural death rate for all causes during 2013 was 854.0 deaths per 100,000 residents, while in urban areas this rate was more than 10 percent lower, at 773.6 deaths per 100,000. Additionally, for all of the 10 leading causes of death, rural rates are higher than urban
EXECUTIVE SUMMARY1
1All data contained in this executive summary are cited in the body of the report.
rates. Emergency room (ER) visit rates were also statistically significantly higher for rural residents than urban residents. The rural ER visit rate is 396.4 per 1,000 residents, which is 7.7 percent higher than the urban rate of 368. In contrast, the 2012-2013 Health in Rural Missouri Biennial Report found that urban residents tend to have significantly higher inpatient hospitalization rates.
Maternal, infant and child health indicators can also be used to measure the health status of a community as seen in this report. The rural teenage pregnancy rate of 43.9 per 1,000 female residents ages 15-19 is statistically significantly higher than the urban teenage pregnancy rate of 40.2. Higher rates of rural mothers reported that they smoked during pregnancy than urban mothers.
Rural Missourians continue to demonstrate increased levels of health risk factors which affect many of the health conditions discussed in this report. Compared to urban residents, rural residents report significantly higher rates of smoking (25.1 percent versus 18.7 percent), lower levels of physical activity (29.5 percent report no leisure-time physical activity versus
5health.mo.gov Health in Rural Missouri
23.0 percent), increased rates of obesity (32.5 percent versus 29.8 percent). Rural residents are less likely to wear their seat belts (70.4 percent estimated to always use their seatbelt compared to 82.9 percent of urban residents), and have lower rates of preventive screenings such as mammograms and colonoscopies.
Health care resources in rural Missouri are limited, even for those who have health insurance, have no financial difficulty, and have access to transportation. Of the 167 licensed hospitals in Missouri, 76 (45 percent) are located in rural areas. Of those 76 hospitals, nearly half (37) are Critical Access Hospitals, which have 25 beds or less and provide a limited scope of service. As regards access to primary health care services, the vast majority of rural counties are designated as Health Professional Shortage Areas (HPSAs). Of the 101 rural counties, 98 are Primary Medical HPSAs, 98 are Primary Care Mental HPSAs and 92 are Dental HPSAs.
Overall, this report highlights significant progress in the improvement of the health of rural Missourians over the past 10 years; however, it continues to highlight the significant inequality between rural and urban Missourians. Rural Missourians as a whole display a lower level of income, education, healthy behaviors and access to health care services, which in turn lead to decreases in health status and life expectancy. The Office continues to recommend a holistic approach to improving and equalizing health in Missouri which addresses socioeconomic factors, health behaviors and access to health care services.

6health.mo.gov Health in Rural Missouri
The Missouri Office of Rural Health (hereinafter referred to as the “Office”) was established by the 1990 General Assembly (192.604, RSMo) to “assume a leadership role in working or contracting with state and federal agencies, universities, private interest groups, communities, foundations and local health centers to develop rural health initiatives and maximize the use of existing resources…” Located within the Department of Health and Senior Services, Office of Primary Care and Rural Health (OPCRH), the Office reports on current activities and makes recommendations to the Missouri Governor and General Assembly every two years.
In order to contextualize the activities and recommendations of the Office, this report includes an analysis of the health of rural Missourians, as well as a Missouri definition of “rural.” The report covers five specific areas:
• DemographicandSocioeconomic Indicators
• HealthStatus
• Maternal,InfantandChildHealth
• HealthBehaviors/RiskFactors
• HealthCareResources
Throughout the report a dichotomy between rural and urban is utilized. This serves two
INTRODUCTION
purposes. First, it allows for a natural, readily understandable comparison to better highlight and understand health in rural Missouri. Second, it presents compelling evidence that geographic location in Missouri has a significant bearing on health.
It should be noted that the health of both rural and urban Missourians, in general, have improved, and is improving, when compared to any point in the past. However, significant inequity in health between rural and urban Missourians persists with evidence of little change over time.

7health.mo.gov Health in Rural Missouri
The U.S. Census Bureau and various federal agencies use different definitions of rural. Each definition emphasizes different criteria, such as commuting patterns, population size and population density. As a result, different definitions generate different numbers of rural residents. This report defines urban counties as those with a 2013 population density of greater than 150 persons per square mile, plus any county that contains at least part of the central city of a Census-defined Metropolitan Statistical Area (MSA). Using this definition,14 Missouri counties are urban.2 The remaining 101 counties in Missouri are rural.
The following map illustrates the rural and urban counties in Missouri.
DEFINING RURAL MISSOURI
2014-2015 Health in Rural Missouri Biennial ReportRural/Urban County Classification
2St. Louis City is an independent city which functions as its own county. It is therefore included as one of the 14 urban counties.
Developed by the Bureau of Health Care Analysis and Data Dissemination using 2013 population estimates from the National Center for Health Statistics
8health.mo.gov Health in Rural Missouri
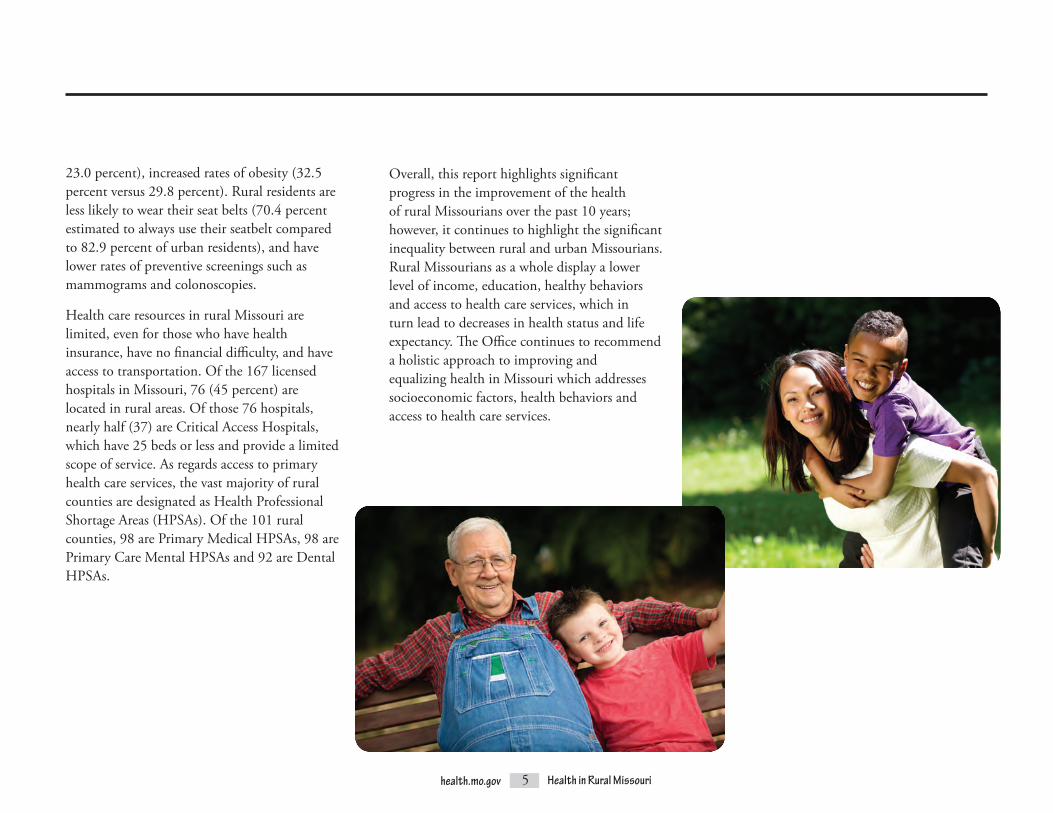
The U.S. Census Bureau estimates the 2013 Missouri resident population to be 6,044,171. Most of Missouri’s population resides in counties designated by this report as urban. The resident population for these counties is estimated to be 3.82 million. Only 2.23 million people, or 36.9 percent of the state’s total population, live in counties designated as rural. The 2013 Missouri population estimate represents a 5.9 percent increase over the 2003 estimate. In comparison, the U.S. population growth between 2003 and 2013 was larger at 9.0 percent.
Within Missouri, population growth during these years was not evenly distributed between rural and urban areas. The rural population increased by 5.5 percent between 2003 and 2013, while the urban population increased by 6.1 percent during this time period. Furthermore, the 5.5 percent rural growth was not distributed equally across all rural counties. Some rural counties experienced population increases of greater than 10 percent. These counties are distributed across the state, but most could be described as adjacent to urban counties or part of the suburban fringe. Exceptions to this characterization are Camden and Taney counties (both popular retirement areas) and Pulaski County, where the Fort Leonard Wood military base plays a large role in the county’s population fluctuations.
On the other hand, a large number of rural counties experienced a population decrease. Of the 101 rural Missouri counties, 40 (39.6 percent) lost population between 2003 and 2013. (In contrast, only 2 of the 14 urban counties, St. Louis City and St. Louis County, experienced population losses during the same time period.) Statewide, 14 counties lost at least 5 percent of their population. All of these 14 counties are rural, with 11 located north of the Missouri River. Atchison and Holt, two small rural counties in the extreme northwest corner of the state, sustained population losses of more than 10 percent.
3All Missouri population figures included in this report were obtained from: National Center for Health Statistics. Vintage 2013 Postcensal Estimates of the Resident Population of the United States (April 1, 2010, July 1, 2010-July 1, 2013), by Year, County, Single-year of Age (0, 1, 2, .., 85 Years and Over), Bridged Race, Hispanic Origin, and Sex. Prepared under a collaborative arrangement with the U.S. Census Bureau. Available from http://www.cdc.gov/NCHS/nvss/bridged_race.htm as of June 30, 2015, following release by the U.S. Census Bureau of the Unabridged Vintage 2013 Postcensal Estimates by 5-Year Age Group on June 26, 2014. Accessed July 22, 2015.4All U.S. population figures included in this report were obtained from: U.S. Census Bureau. Historical Data. Population Estimates. Accessed July 22, 2015, from http://www.census.gov/popest/data/historical/index.html.
DEMOGRAPHIC AND SOCIOECONOMIC INDICATORS
Population3,4
Population ChangeMissouri, 2003-2013
Developed by the Bureau of Health Care Analysis and Data Dissemination using population estimates from the National Center for Health Statistics

9health.mo.gov Health in Rural Missouri
Natural increase is commonly used to track population trends. This value is calculated by subtracting the number of deaths in a geography from the number of births. If a location has more births than deaths, it will have a positive natural increase, which indicates population growth. Conversely, if a geography has more deaths than births, it will have a negative natural increase (natural decrease), which indicates population loss. The overall Missouri natural increase during the 2011-2013
Natural Increasetime period was 58,075. Over 84 percent of this natural increase occurred in urban counties, and all urban counties experienced a natural increase. However, during this same time period, 44 rural counties experienced a natural decrease.
An alternative way of analyzing natural increase is to calculate the ratio between births and deaths. A ratio above 1.00 indicates that more births than deaths occurred. The Missouri
urban birth-death ratio for 2011-2013 was 1.50 compared to only 1.13 for rural counties. If this pattern continues, rural areas will need large positive migration totals in order to keep pace with the growth in urban areas.
Natural Increase, 2011-2013
Source: Missouri Vital Statistics
Births Deaths Natural Increase
Number of Births for Every 1 Death
Missouri 226,713 168,638 58,075 1.34Rural Missouri 80,225 71,113 9,142 1.13Urban Missouri 146,458 97,521 48,937 1.50

10health.mo.gov Health in Rural Missouri
The 2013 population pyramid for Missouri’s rural and urban areas illustrates the distribution of residents by gender and age group. The overall Missouri population contains slightly more females than males (51.0 percent versus 49.0 percent, respectively). The rural population is evenly divided between the two genders, but females outnumber males in urban areas, making up 51.5 versus 48.5 percent of residents, respectively. The Missouri population pyramid also reveals that older age groups comprise a larger percentage of the population in rural areas compared to urban areas.
In both rural and urban areas, males tend to outnumber females in the younger age groups. (The male-female ratio in the “Under 15” category is 1.05 for rural residents and 1.04 for urban residents.) In rural areas, male-female ratios are highest among the 15-19 and 20-24 age groups at 1.10 and 1.11, respectively. Research in Missouri’s neighboring states of Kansas and Nebraska discovered similar trends in rural areas, finding that “the proportion of young men increased by an average of nearly 40 percent as people went from their teens to their 20s.” This was particularly true in extremely rural communities with less than 800 residents. Possible reasons for this gender disparity may involve females leaving rural areas to pursue
higher education in urban centers or fewer job opportunities in rural communities for women.5 The overall rural male-female ratios for Missouri young adults are not as extreme as those cited in the Kansas and Nebraska study, and after age 25, the Missouri male-female ratio in rural areas narrows considerably.
In rural parts of the state, females outnumber males in all of the oldest age groups, beginning at age 55. In urban areas, females begin to
Gender and Age
5Reed, L. (May 15, 2014). Young Men Increasingly Outnumber Young Women in Rural Great Plains. University of Nebraska – Lincoln News Releases. Accessed September 1, 2015, from http://newsroom.unl.edu/releases/2014/05/15/Young+men+increasingly+outnumber+young+women+in+rural+Great+Plains.
Developed by the Bureau of Health Care Analysis and Data Dissemination using 2013 population estimates from the National Center for Health Statistics
outnumber males much earlier, beginning at age 20. This earlier gender shift in urban populations may be due to an influx of rural females seeking higher education and job opportunities, as previously discussed. The female-male ratio increases dramatically with age. In urban areas, the female-male ratio for the 85 and over age group is 2.10, meaning that there are more than two females for every one male. The rural ratio of 1.93 is only slightly lower.
Gender and Age Distribution of Rural and Urban ResidentsMissouri, 2013

11health.mo.gov Health in Rural Missouri
The urban counties of Missouri are more racially and ethnically diverse than the rural counties. One-quarter (25 percent) of urban county residents are members of minority populations; in contrast, less than one out of every ten rural residents (only 8 percent) is a member of a minority population.
Black/Non-Hispanicscomprisethelargestminority group in both rural and urban areas ofMissouri.However,inurbanareasBlack/Non-Hispanics represent 17 percent of the total population, while only 4 percent of the rural populationisBlack/Non-Hispanic.ThelargestruralclustersofBlack/Non-Hispanicresidentsare found in the Bootheel area of southeast Missouri. In three Bootheel counties (Pemiscot, MississippiandNewMadrid),Black/Non-Hispanics make up more than 15 percent of the total population (27.2 percent, 24.8 percent and 16.3 percent, respectively).
The percentage of Missouri’s population that is Hispanic is relatively small, especially when compared to the overall U.S., where nearly 17 percent of the population is estimated to be Hispanic. Hispanics compose 3 percent of Missouri’s rural population and 4 percent of Missouri’s urban population. However, Hispanics are more evenly dispersed across all countiesthanBlack/Non-Hispanics.While31of Missouri’s 115 counties have fewer than 100 Black/Non-Hispanicresidents,only15countieshave fewer than 100 Hispanic residents. The largest rural Hispanic populations are geographically dispersed. The three counties with the highest Hispanic percentages are spread across the Northeast (Sullivan County, 18.2 percent), Southwest (McDonald County, 11.5 percent) and Central (Pulaski County, 10.4 percent) Behavioral Risk Factor Surveillance System (BRFSS) regions.7
Racial/Ethnic Diversity6
6Throughout this section, the term “Hispanic” is used for brevity, but residents who identify as “Latino” are also included in this ethnic category. 7See the Glossary for a description of the BRFSS and a map of the BRFSS regions, which are referenced frequently in this report.

12health.mo.gov Health in Rural Missouri
Population by Race/EthnicityMissouri, 2013
Source: National Center for Health Statistics Rural Urban
All other Non-Hispanic racial groups (which include American Indians, Asians, Native Alaskans and Native Hawaiians, among others) together represent 1 percent of Missouri’s rural population and 3 percent of Missouri’s urban population.
Some of the challenges related to Missouri’s racial and ethnic diversity are particularly apparent in rural areas of the state. As an example, roughly 1 percent of Missouri residents are estimated to have limited English proficiency. While several of the highest rates are found in metropolitan counties, rural areas of the state are impacted by this issue as well. Fifteen rural counties have limited English proficiency rates that are higher than the state average. In Sullivan County, which has the highest rate of any county in the state, over 6 percent of the population is not proficient in English.8 Language and other differences may impact the ability of rural communities to provide appropriate health care and other services to all residents.
8University of Wisconsin Population Health Institute and the Robert Wood Johnson Foundation. (2015). Missouri: % Not Proficient in English. County Health Rankings and Roadmaps. Accessed September 1, 2015, from http://www.countyhealthrankings.org/app/#!/missouri/2015/measure/additional/59/data.

13health.mo.gov Health in Rural Missouri
Socioeconomic factors, such as poverty and unemployment, are directly and indirectly linked to the health of individuals, communities and regions.9,10,11 Low income and poverty limit a person’s ability to pay for a variety of goods and services related to health, such as doctor visits, healthy foods and medications.
Per capita income (or income per person) can be used to measure relative wealth. The 2013 average per capita income of Missouri’s rural counties ($33,936) is 23.8 percent less than that of urban counties ($44,563).12 This income disparity has decreased since 2010, when the average per capita income of rural residents was 26.6 percent less than that of their urban counterparts.13
9Murray, S. (March 28, 2006). Poverty and Health. Canadian Medical Association Journal, 174(7), 923. Accessed September 2, 2015, from http://www.ncbi.nlm.nih.gov/pmc/articles/PMC1405857/.doi:10.1503/cmaj.06023510Rice, S. (August 29, 2006). Poverty and Poor Health Are Intertwined, Experts Say. CNN Health. Accessed September 2, 2015, from http://articles.cnn.com/2006-08-29/health/poverty.health_1_health-insurance-poverty-health-care?_s=PM:HEALTH. 11Strully, K.W. (May 2009). Job Loss and Health in the U.S. Labor Market. Demography 46(2), 221-246. Accessed September 2, 2015, from http://www.ncbi.nlm.nih.gov/pmc/articles/PMC2831278/. 12U.S. Department of Commerce, Bureau of Economic Analysis. (Last updated November 20, 2014). CA1 Personal Income Summary: Personal Income, Population, Per Capita Income. Interactive Data. Accessed September 2, 2015, from http://www.bea.gov/itable/. Per capita personal income was computed using Census Bureau midyear population estimates. Estimates reflect county population estimates available as of March 2014. All dollar estimates are in current dollars (not adjusted for inflation).13Missouri Department of Economic Development, Missouri Economic and Research Information Center (MERIC). 2010 County Per Capita Personal Income. Accessed September 2, 2015, from http://www.missourieconomy.org/indicators/wages/pci10county.stm.
Income and Poverty

14health.mo.gov Health in Rural Missouri
14U.S. Census Bureau. Small Area Income and Poverty Estimates (SAIPE). Accessed September 3, 2015, from http://www.census.gov/did/www/saipe/index.html. All poverty rates in this section were obtained from SAIPE. 15U.S. Department of Agriculture, Economic Research Service. (Last updated May 18, 2015). Geography of Poverty. Rural Poverty & Well-being. Accessed October 6, 2015, from http://www.ers.usda.gov/topics/rural-economy-population/rural-poverty-well-being/geography-of-poverty.aspx.
Poverty rates in rural Missouri are considerably higher than in urban Missouri, and the disparity between the two areas is growing. According to the U.S. Census Bureau, 18.4 percent of rural Missourians lived in poverty in 2013, a slight increase from the 2011 rural poverty rate of 18.0. Missouri’s urban rate, on the other hand, decreased slightly, from 14.5 in 2011 to 14.4 in 2013. As a result, the 2013 rural rate is 27.8 percent higher than the 2013 urban rate.14
Three counties have 2013 poverty rates that exceed 30 percent. In other words, more than three out of every 10 residents in these counties live below the poverty level. All three of these counties, which are Mississippi (36.3 percent), Shannon (31.5 percent) and Pemiscot (31.4 percent), are rural and are located within the Southeast BRFSS Region. In contrast, only two urban counties have poverty rates exceeding even 20 percent: St. Louis City (27.2 percent) and Greene County (20.2 percent). Many of the counties with high rates are considered to
be persistently poor. The U.S. Department of Agriculture’s Economic Research Service defines “counties as being persistently poor if 20 percent or more of their populations were living in poverty over the last 30 years …” Fourteen Missouri counties are considered to be persistently poor under this definition. Only one of these counties is urban (St. Louis City); 12 of these counties are located in the Southeast BRFSS Region.15
Poverty rates for residents under the age of 18 are even higher than the rates for the general population. Statewide, nearly one-quarter (22.2 percent) of youth live in poverty. The rural-urban disparity is also higher for youth than for the general population. While 2013 general poverty rates are 27.8 percent higher for rural residents than urban residents, the rural youth rate of 26.9 percent is 37.9 percent higher than the urban youth rate of 19.5 percent. (This is an increase from the 32.2 percent disparity between the 2011 rates.)

15health.mo.gov Health in Rural Missouri
Some individual rural county rates are dramatically higher than the overall rural rate – more than half of the youth living in Mississippi and Shannon counties fall below the poverty level. The 2013 youth poverty rates in those counties are 51.6 percent and 50.1 percent, respectively. St. Louis City has the highest urban youth poverty rate at 43.1 percent. These 3 counties as well as 27 others in Missouri have experienced persistent child poverty over the past 30 years. The list of counties with persistent child poverty includes 18 of the 25 counties in the Southeast BRFSS Region. “Persistent poverty among children is of particular concern as the cumulative effect of being poor may lead to especially negative outcomes and limited opportunities that carry through to adulthood.”16
16U.S. Department of Agriculture, Economic Research Service. (Last updated May 18, 2015). Child Poverty. Rural Poverty & Well-being. Accessed October 6, 2015, from http://www.ers.usda.gov/topics/rural-economy-population/rural-poverty-well-being/child-poverty.aspx#pcpov.
Residents in PovertyMissouri, 2013
Source: U.S. Census Bureau, Small Area Income and Poverty Estimates (SAIPE)
Persistent PovertyMissouri, 1980-2011
Source: U.S. Department of Agriculture, Economic Research Service
16health.mo.gov Health in Rural Missouri
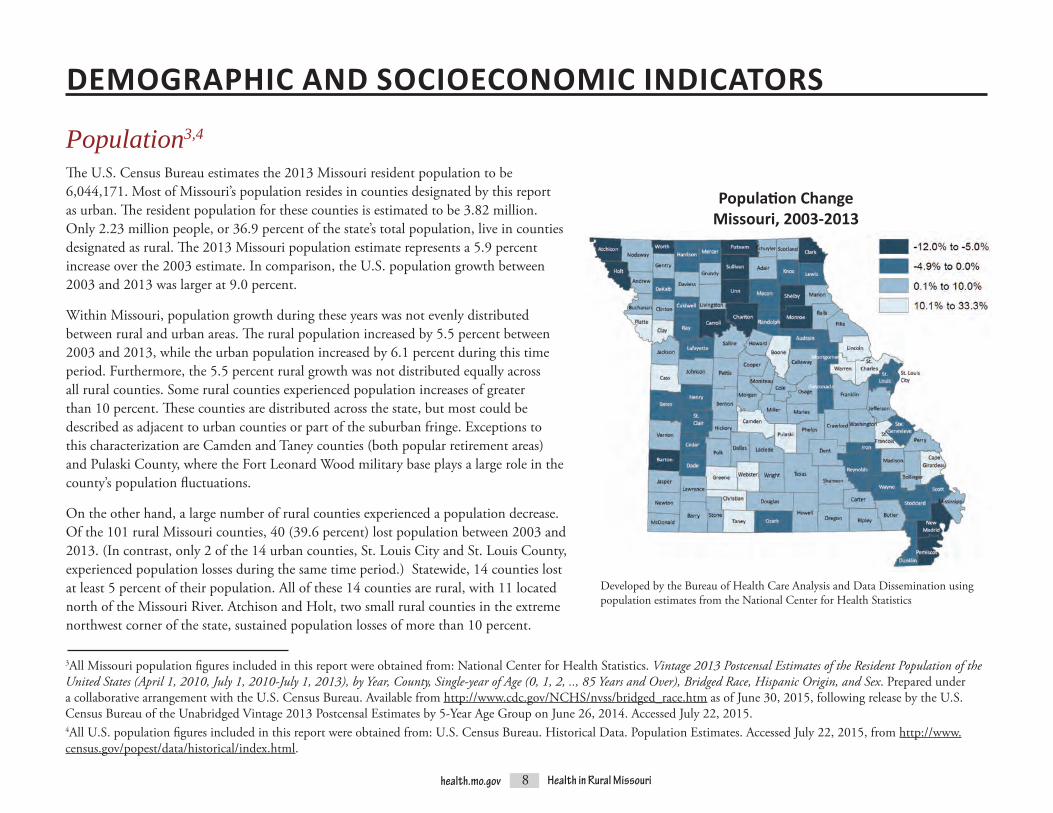
Most Americans under the age of 65 obtain health insurance through an employer.17 Thus, unemployment can severely limit a person’s access to preventive care.18 The Missouri unemployment rate decreased in recent years, from 6.6 percent of the labor force in May 2013 to 5.7 percent in May 2015.19 This decrease was shared nearly equally by both rural and urban residents. The rural rate dropped from 7.1 percent in May 2013 to 6.1 percent in May 2015; the urban rate dropped from 6.4 percent to 5.5 percent. However, the disparity between rural and urban counties persisted over that time period. In both years, the May unemployment rate for rural residents was 10.9 percent higher than the urban rate.20
17Smith, J.C., and Medalia, C., U.S. Census Bureau. (September 2014). Health Insurance Coverage in the United States: 2013. Current Population Reports P60-250. Washington, D.C.: U.S. Government Printing Office. Accessed September 3, 2015, from https://www.census.gov/content/dam/Census/library/publications/2014/demo/p60-250.pdf. 18HealthyPeople.gov. (Last updated October 5, 2015). Access to Health Services Overview. Accessed October 5, 2015, from http://www.healthypeople.gov/2020/topics-objectives/topic/Access-to-Health-Services.19Unemployment rates for May 2013 were revised following the publication of the 2012-2013 Health in Rural Missouri Biennial Report. 20Missouri Department of Economic Development, Missouri Economic Research and Information Center (MERIC). Local Area Unemployment Statistics. Accessed September 2, 2015, from https://www.missourieconomy.org/indicators/laus/index.stm. Unemployment rates are reported per 100 residents in the labor force. The unemployment rates discussed in this section are not seasonally adjusted.
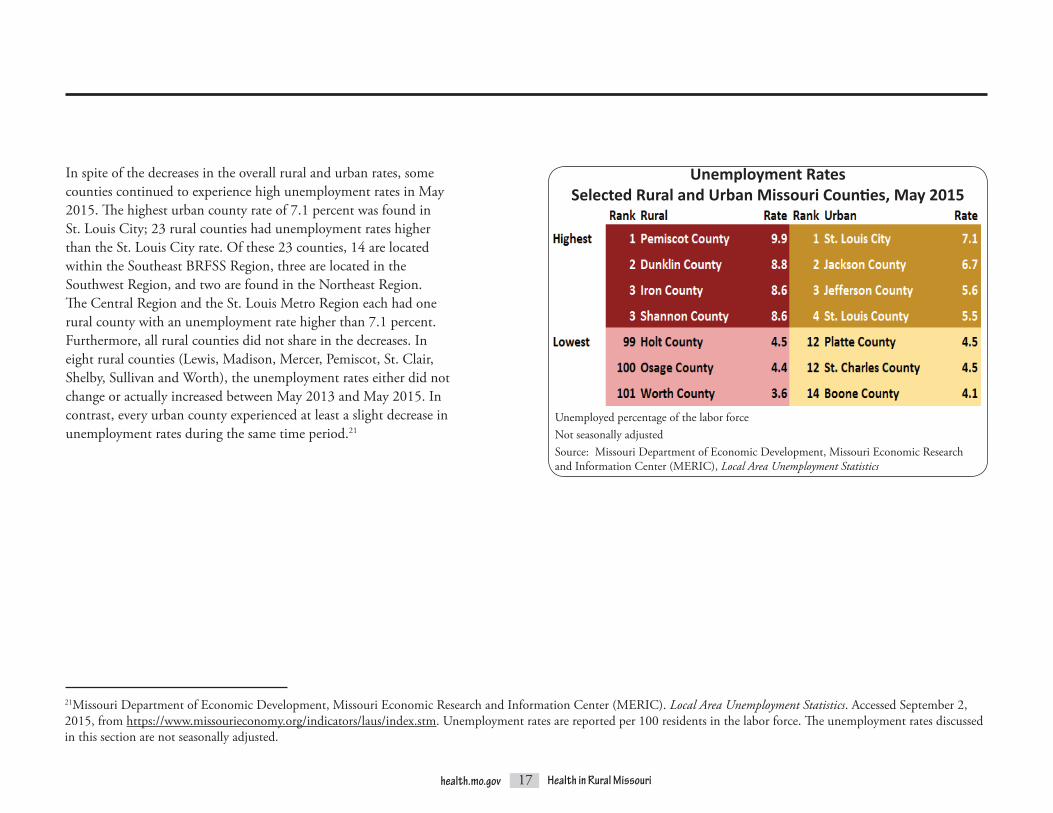
Unemployed percentage of the labor forceNot seasonally adjustedSource: Missouri Department of Economic Development, Missouri Economic Research and Information Center (MERIC), Local Area Unemployment Statistics
Unemployment RatesMissouri
Unemployment
17health.mo.gov Health in Rural Missouri
In spite of the decreases in the overall rural and urban rates, some counties continued to experience high unemployment rates in May 2015. The highest urban county rate of 7.1 percent was found in St. Louis City; 23 rural counties had unemployment rates higher than the St. Louis City rate. Of these 23 counties, 14 are located within the Southeast BRFSS Region, three are located in the Southwest Region, and two are found in the Northeast Region. The Central Region and the St. Louis Metro Region each had one rural county with an unemployment rate higher than 7.1 percent. Furthermore, all rural counties did not share in the decreases. In eight rural counties (Lewis, Madison, Mercer, Pemiscot, St. Clair, Shelby, Sullivan and Worth), the unemployment rates either did not change or actually increased between May 2013 and May 2015. In contrast, every urban county experienced at least a slight decrease in unemployment rates during the same time period.21
21Missouri Department of Economic Development, Missouri Economic Research and Information Center (MERIC). Local Area Unemployment Statistics. Accessed September 2, 2015, from https://www.missourieconomy.org/indicators/laus/index.stm. Unemployment rates are reported per 100 residents in the labor force. The unemployment rates discussed in this section are not seasonally adjusted.
Unemployed percentage of the labor forceNot seasonally adjustedSource: Missouri Department of Economic Development, Missouri Economic Research and Information Center (MERIC), Local Area Unemployment Statistics
Unemployment RatesSelected Rural and Urban Missouri Counties, May 2015
18health.mo.gov Health in Rural Missouri
Lack of Health InsuranceHealth insurance status is strongly influenced by socioeconomic factors, especially employment status. Residents lacking health insurance are less likely to receive preventive health care, such as screenings for certain conditions, and are more likely to delay or go without necessary treatments.22 They also have higher death rates from many chronic diseases.23
In 2013, prior to the implementation of most of the major health insurance coverage provisions of the Affordable Care Act (ACA),
22HealthyPeople.gov. (Last updated October 5, 2015). Access to Health Services Overview. Accessed October 5, 2015, from http://www.healthypeople.gov/2020/topics-objectives/topic/Access-to-Health-Services. 23Brooks, E.L., Preis, S.R., Hwang, S., Murabito, J.M., Benjamin, E.J., Kelly-Hayes, M., … and Levy, D. (August 2010). Health Insurance and Cardiovascular Disease Risk Factors. American Journal of Medicine 123(8), 741-747. Accessed September 3, 2015, from http://www.ncbi.nlm.nih.gov/pmc/articles/PMC2913281/. 24U.S. Census Bureau. Small Area Health Insurance Estimates (SAHIE). Accessed September 3, 2015, from http://www.census.gov/did/www/sahie/index.html. 25U.S. Census Bureau. Small Area Health Insurance Estimates (SAHIE). Accessed September 3, 2015, from http://www.census.gov/did/www/sahie/index.html.
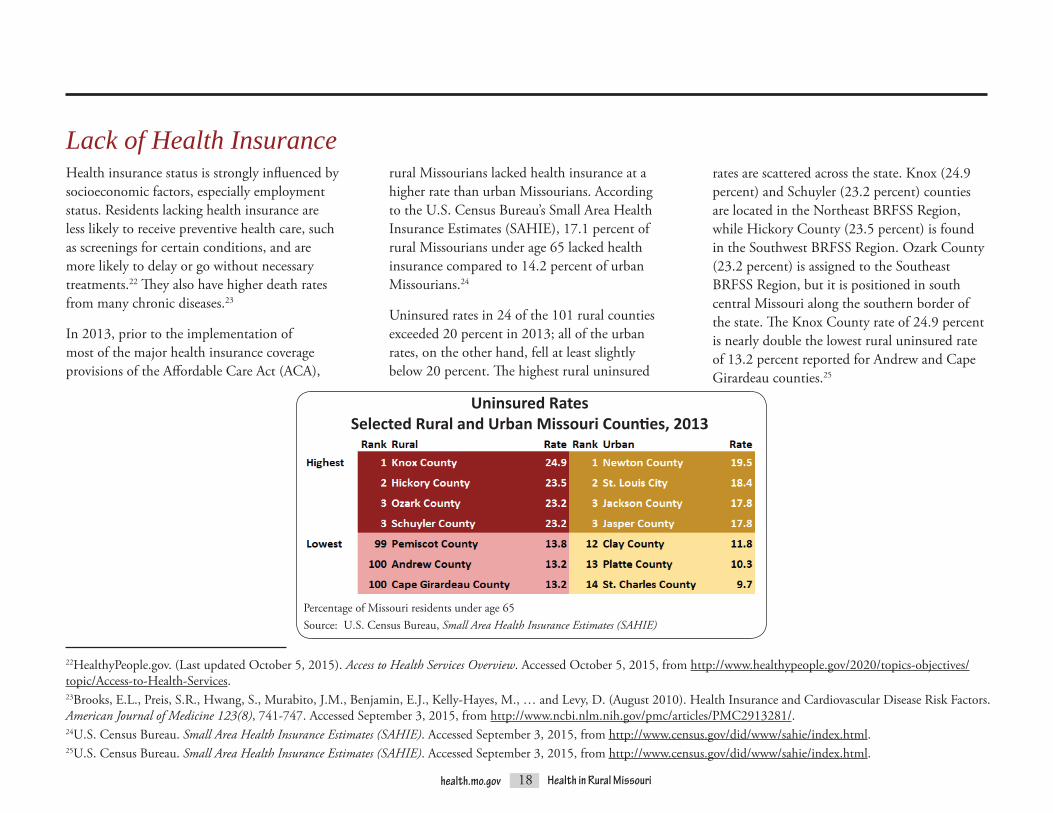
rural Missourians lacked health insurance at a higher rate than urban Missourians. According to the U.S. Census Bureau’s Small Area Health Insurance Estimates (SAHIE), 17.1 percent of rural Missourians under age 65 lacked health insurance compared to 14.2 percent of urban Missourians.24
Uninsured rates in 24 of the 101 rural counties exceeded 20 percent in 2013; all of the urban rates, on the other hand, fell at least slightly below 20 percent. The highest rural uninsured
Percentage of Missouri residents under age 65Source: U.S. Census Bureau, Small Area Health Insurance Estimates (SAHIE)
Uninsured RatesSelected Rural and Urban Missouri Counties, 2013
rates are scattered across the state. Knox (24.9 percent) and Schuyler (23.2 percent) counties are located in the Northeast BRFSS Region, while Hickory County (23.5 percent) is found in the Southwest BRFSS Region. Ozark County (23.2 percent) is assigned to the Southeast BRFSS Region, but it is positioned in south central Missouri along the southern border of the state. The Knox County rate of 24.9 percent is nearly double the lowest rural uninsured rate of 13.2 percent reported for Andrew and Cape Girardeau counties.25

19health.mo.gov Health in Rural Missouri
Lack of education is associated with poorer health status. Research shows that persons with lower levels of education experience higher “mortality, smoking, drug abuse,” accident and certain disease rates, even after controlling for other social and economic factors.26 Rural Missouri residents ages 25 years and over have lower levels of education, on average, than urban Missourians. According to the U.S. Census Bureau’s American Community Survey, the percentage of rural Missourians with at least a bachelor’s (four-year) degree is half that of urban Missourians (16 percent of rural residents versus 32 percent of urban residents). Rural Missourians are also more likely to lack even a high school diploma or equivalent credential than urban Missourians; 16 percent of rural Missourians have not completed high school compared to only 10 percent of urban Missourians.27
26Baker, D.P., Leon, L., Smith Greenaway, E.G., Collins, J., and Movit, M. (June 2011). The Education Effect on Population Health: A Reassessment. Population and Development Review 37(2), 307-332. Accessed September 3, 2015, from http://www.ncbi.nlm.nih.gov/pmc/articles/PMC3188849/. 27U.S. Census Bureau. Table B15002. 2009-2013 American Community Survey 5-Year Estimates. Accessed September 3, 2015, from American FactFinder at http://factfinder2.census.gov.
*Residents ages 25 years and overCollege degree indicates that at least a bachelor’s (four-year) degree has been obtained. Source: U.S. Census Bureau, American Community Survey
Rural Urban
Education Levels*Missouri, 2009-2013
Lack of Education

20health.mo.gov Health in Rural Missouri
Crime“Crime victimization is associated with myriad physical and psychological health problems, resulting in widespread treatment needs and substantial costs to both the victim and society.”28 Research into the economic impact of crime suggests that a single crime costs thousands of dollars to the victim and society, with costs increasing for more violent crimes. For example, each aggravated assault occurring in the U.S. in 2008 was estimated to result in tangible costs (such as victims’ medical expenses and lost wages and criminal justice system expenses) of $19,472. Such figures also include estimates of costs related to the perpetrators of crimes, which involve opportunity costs for both the criminal and society when crime is pursued rather than more productive activities, as well as service costs for incarcerated prisoners.29 For example, treating persons with mental disorders within the criminal justice system is expensive. According to a 2013 study of adults with either schizophrenia or bipolar disorder who were receiving services from the Connecticut Department of Mental Health and Addiction Services, individuals who were involved with the criminal justice system had treatment costs that were nearly twice as high as those of individuals without any justice system involvement.30
28Hanson, R.F., Sawyer, G.K., Begle, A.M., and Hubel, G.S. (April 2010). The Impact of Crime Victimization on Quality of Life. Journal of Traumatic Stress 23(2), 189-197. Accessed September 3, 2015, from http://www.ncbi.nlm.nih.gov/pmc/articles/PMC2910433/. 29McCollister, K.E., French, M.T., and Fang, H. (April 2010). The Cost of Crime to Society: New Crime-Specific Estimates for Policy and Program Evaluation. Drug and Alcohol Dependence 108(1-2), 98-109. Accessed September 3, 2015, from http://www.ncbi.nlm.nih.gov/pmc/articles/PMC2835847/. 30Swanson, J.W., Frisman, L.K., Robertson, A.G., Lin, H.J., Trestman, R.L., Shelton, D.A., … and Swartz, M.S. (July 2013). Costs of Criminal Justice Involvement Among Persons with Serious Mental Illness in Connecticut. Psychiatric Services 64(7), 630-637. Accessed August 17, 2015, from http://www.ncbi.nlm.nih.gov/pubmed/23494058.
21health.mo.gov Health in Rural Missouri
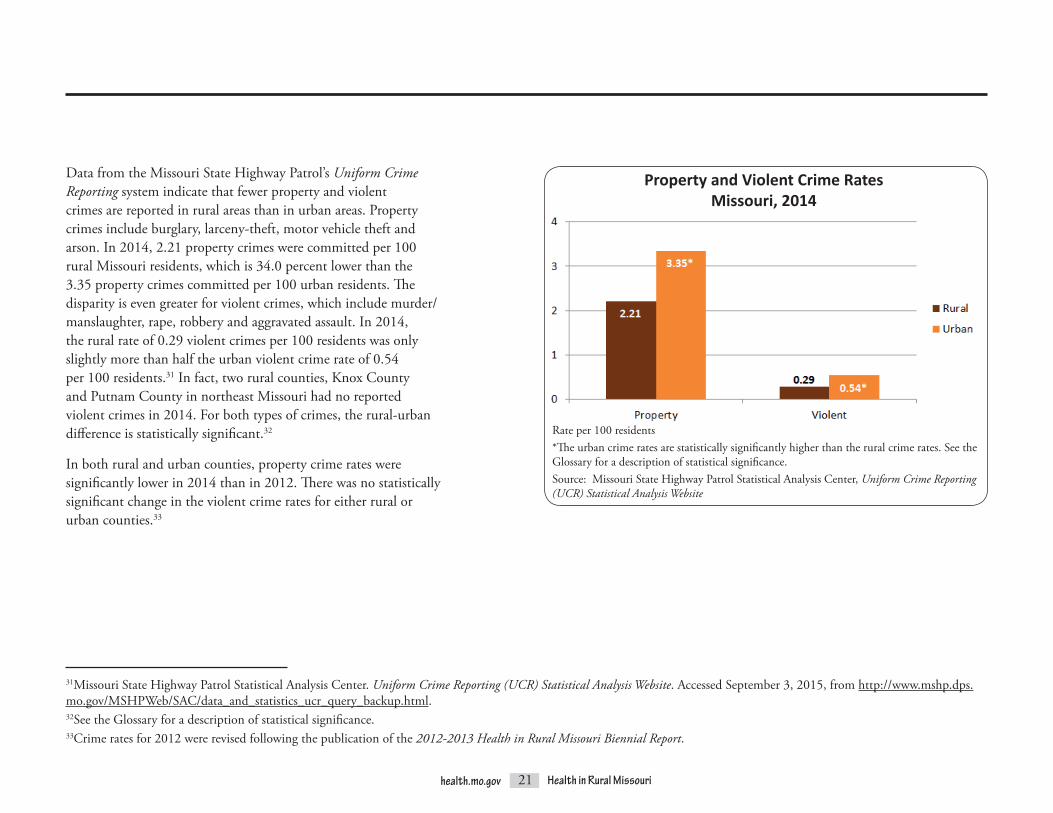
Data from the Missouri State Highway Patrol’s Uniform Crime Reporting system indicate that fewer property and violent crimes are reported in rural areas than in urban areas. Property crimes include burglary, larceny-theft, motor vehicle theft and arson. In 2014, 2.21 property crimes were committed per 100 rural Missouri residents, which is 34.0 percent lower than the 3.35 property crimes committed per 100 urban residents. The disparityisevengreaterforviolentcrimes,whichincludemurder/manslaughter, rape, robbery and aggravated assault. In 2014, the rural rate of 0.29 violent crimes per 100 residents was only slightly more than half the urban violent crime rate of 0.54 per 100 residents.31 In fact, two rural counties, Knox County and Putnam County in northeast Missouri had no reported violent crimes in 2014. For both types of crimes, the rural-urban difference is statistically significant.32
In both rural and urban counties, property crime rates were significantly lower in 2014 than in 2012. There was no statistically significant change in the violent crime rates for either rural or urban counties.33
31Missouri State Highway Patrol Statistical Analysis Center. Uniform Crime Reporting (UCR) Statistical Analysis Website. Accessed September 3, 2015, from http://www.mshp.dps.mo.gov/MSHPWeb/SAC/data_and_statistics_ucr_query_backup.html. 32See the Glossary for a description of statistical significance.33Crime rates for 2012 were revised following the publication of the 2012-2013 Health in Rural Missouri Biennial Report.
Rate per 100 residents*The urban crime rates are statistically significantly higher than the rural crime rates. See the Glossary for a description of statistical significance.Source: Missouri State Highway Patrol Statistical Analysis Center, Uniform Crime Reporting (UCR) Statistical Analysis Website
Property and Violent Crime RatesMissouri, 2014

22health.mo.gov Health in Rural Missouri
HEALTH STATUS
The 2004-2012 life expectancy at birth for Missouri residents is estimated to be 77.2 years. Residents of urban counties enjoy a significantly longer life expectancy (77.8 years) than rural residents (76.8 years). The three individual counties with the highest life expectancy rates are all urban. In fact, 5 of the top 10 counties in terms of longest life expectancy are urban, and 8 of the 14 urban counties have life expectancy rates that are higher than the state average. Conversely, of the 15 counties with life expectancy rates below 75 years, 14 are rural.
Life Expectancy34
34Life expectancy rates were calculated by the Bureau of Health Care Analysis and Data Dissemination using 2004-2012 birth and death figures from the Bureau of Vital Statistics and 2008 population estimates from the National Center for Health Statistics.
Nodaway County, located in extreme northwest Missouri, enjoys the highest rural life expectancy rate of 79.4 years, which is well above the state rate of 77.2. All of its contiguous counties (Andrew, Atchison, Gentry, Holt and Worth) have life expectancy rates of at least 77.8 years. Pemiscot County, in the opposite corner of the state, has the lowest life expectancy rate of 71.7 years, followed by Dunklin County (72.0 years) and Carter County (72.3 years). Although
Life Expectancy at BirthMissouri, 2004-2012
Years of Life Expectancy at BirthMissouri, 2004-2012
Carter County is not contiguous to Pemiscot and Dunklin, which are adjacent counties in the actual Bootheel portion of the state, all three are located within the same general vicinity of the Southeast BRFSS Region. In general, when moving diagonally across the state from southeast to northwest, life expectancy in rural counties tends to increase, with a difference of 7.5 years between the most extreme rates.
Source: Bureau of Health Care Analysis and Data Dissemination
Source: Bureau of Health Care Analysis and Data Dissemination
Note: On the bar charts in this chapter, asterisks indicate if either the rural or urban rate is statistically significantly high compared to the other geography. See the Glossary for a description of statistical significance.
23health.mo.gov Health in Rural Missouri
Deaths and Emergency Room VisitsAnother way to measure the disparity in health status between rural and urban Missourians is to compare rates for some of the state’s leading causes of deaths and emergency room (ER) visits.35
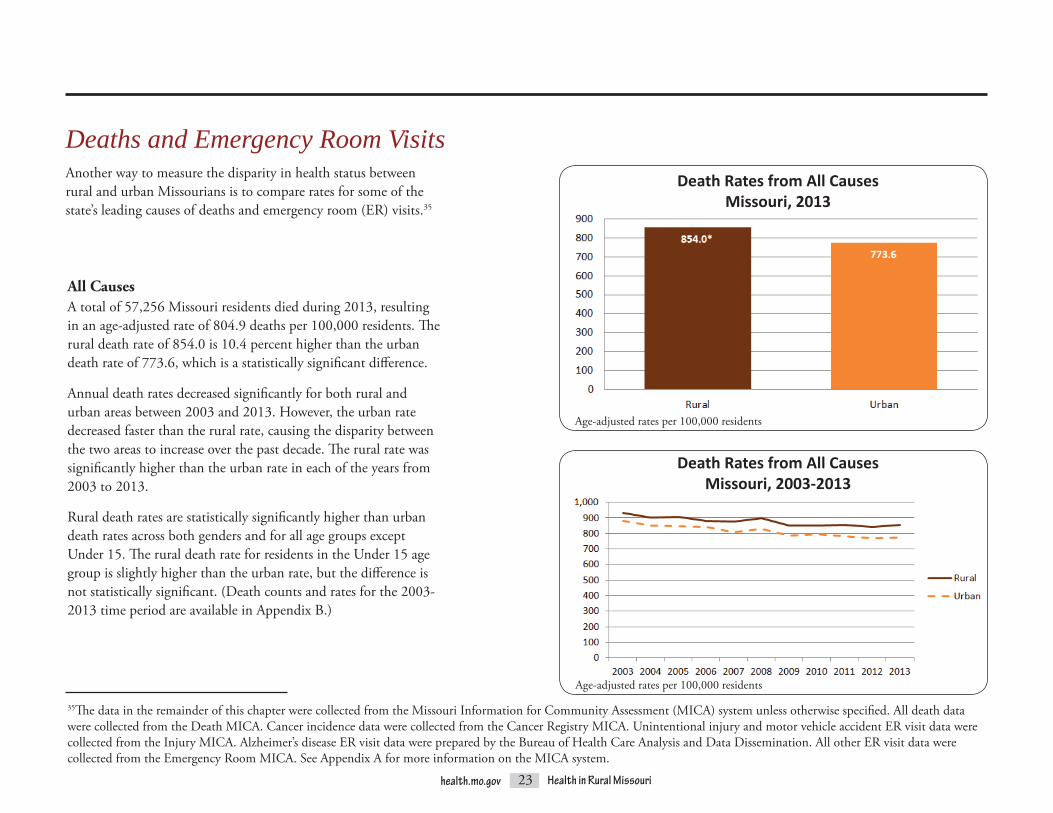
All CausesA total of 57,256 Missouri residents died during 2013, resulting in an age-adjusted rate of 804.9 deaths per 100,000 residents. The rural death rate of 854.0 is 10.4 percent higher than the urban death rate of 773.6, which is a statistically significant difference.
Annual death rates decreased significantly for both rural and urban areas between 2003 and 2013. However, the urban rate decreased faster than the rural rate, causing the disparity between the two areas to increase over the past decade. The rural rate was significantly higher than the urban rate in each of the years from 2003 to 2013.
Rural death rates are statistically significantly higher than urban death rates across both genders and for all age groups except Under 15. The rural death rate for residents in the Under 15 age group is slightly higher than the urban rate, but the difference is not statistically significant. (Death counts and rates for the 2003-2013 time period are available in Appendix B.)
35The data in the remainder of this chapter were collected from the Missouri Information for Community Assessment (MICA) system unless otherwise specified. All death data were collected from the Death MICA. Cancer incidence data were collected from the Cancer Registry MICA. Unintentional injury and motor vehicle accident ER visit data were collected from the Injury MICA. Alzheimer’s disease ER visit data were prepared by the Bureau of Health Care Analysis and Data Dissemination. All other ER visit data were collected from the Emergency Room MICA. See Appendix A for more information on the MICA system.
Death Rates from All CausesMissouri, 2013
Age-adjusted rates per 100,000 residents
Age-adjusted rates per 100,000 residents
Death Rates from All CausesMissouri, 2003-2013

24health.mo.gov Health in Rural Missouri
The three counties with the highest rural death rates are located in the Southeast BRFSS Region. The counties with the lowest rates are located in the Central and Northeast BRFSS regions.
Death Rates from All CausesSelected Rural and Urban Missouri Counties, 2003-201336
36See the Glossary description of unstable rates for an explanation of the use of multi-year death and ER visit rates.
Most of the counties with significantly high death rates compared to the state are located in the southern half of Missouri. In fact, 38 rural counties south of the Missouri River have significantly high rates compared to only 6 rural counties north of the Missouri River. Furthermore, in the south there are several large clusters of rural counties with significantly high rates, while the north contains only one small cluster, which is found in a row of three counties north and east of Kansas City.
Based on age-adjusted rates per 100,000 residentsStatistical significance compared to the state using 95 percent confidence intervals
Deaths from All CausesMissouri, 2003-2013
Age-adjusted rates per 100,000 residents

25health.mo.gov Health in Rural Missouri
In 2013, ER visit rates were also statistically significantly higher for rural residents than urban residents.37 The rural ER visit rate is 396.4 per 1,000 residents, which is 7.7 percent higher than the urban rate of 368.1. In contrast, the 2012-2013 Health in Rural Missouri Biennial Report found that urban residents tend to have significantly higher inpatient hospitalization rates.38 (ER visit counts and rates for the 2009-2013 time period are available in Appendix C.)
37Patients who seek treatment in the ER and are directly admitted into the hospital are counted in inpatient hospitalization statistics, not ER statistics.38Missouri Department of Health and Senior Services, Office of Primary Care and Rural Health. (2013). 2012-2013 Health in Rural Missouri Biennial Report. Accessed August 18, 2015, from http://health.mo.gov/living/families/ruralhealth/pdf/biennial2013.pdf.
Emergency Room Visit Rates for All DiagnosesMissouri, 2013
Age-adjusted rates per 1,000 residents

26health.mo.gov Health in Rural Missouri
Emergency Room Visit Rates for All DiagnosesMissouri, 2003-2013
Emergency Room Visits for All DiagnosesMissouri, 2009-2013
Based on age-adjusted rates per 1,000 residentsStatistical significance compared to the state using 95 percent confidence intervals
Unlike death rates, ER visit rates increased significantly between 2003 and 2013. In the early years of this time period, a gap of roughly 10 percent existed between the rural and urban rates. This disparity shrank between 2007 and 2010 but began to grow again in 2011.
Age-adjusted rates per 1,000 residents
Most of the rural counties in the northeast and northwest corners of the state have significantly low rates compared to the state. Although the majority of counties in the southeast and southwest corners have significantly high rates, there are also pockets of counties in those areas that have significantly low ER visit rates.
The significance map of ER visit rates for all diagnoses differs somewhat from the significance map of deaths from all causes. On both maps, the majority of the counties with significantly higher rates are located in the southern part of the state, particularly in the southeast and southwest corners. However, the ER visit map reveals a secondary cluster of significantly high rates in the north central and west central parts of the state that does not appear on the death map.
27health.mo.gov Health in Rural Missouri
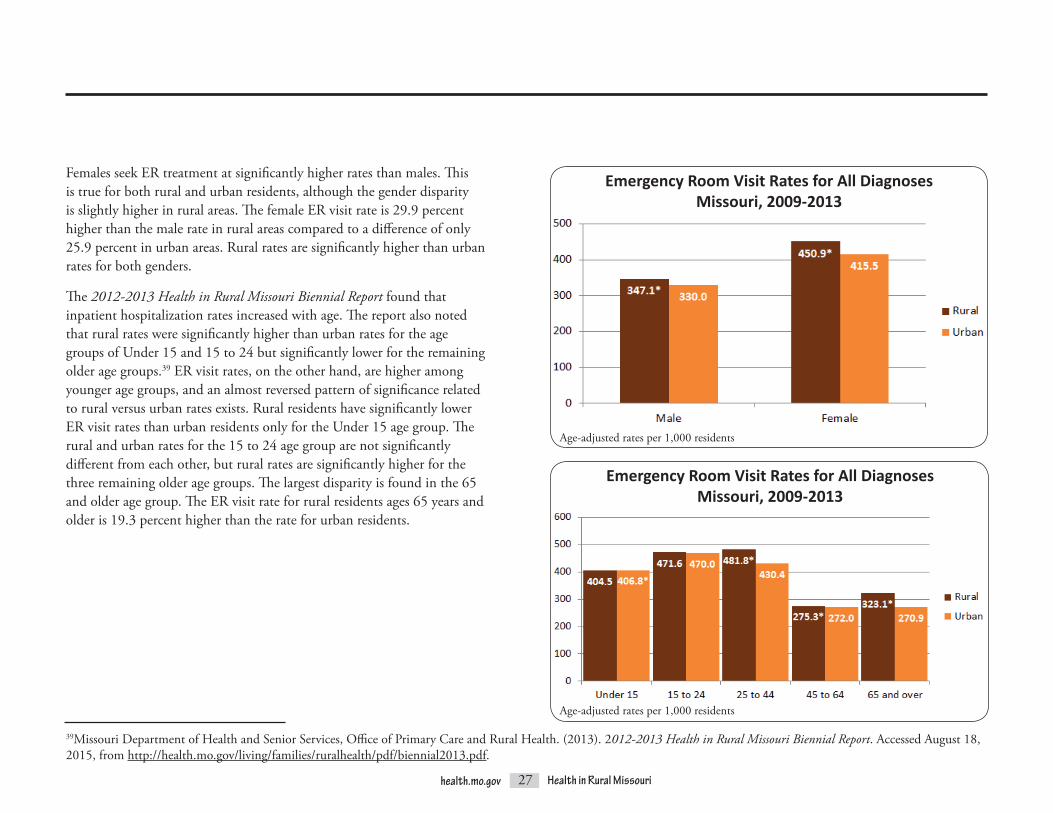
Females seek ER treatment at significantly higher rates than males. This is true for both rural and urban residents, although the gender disparity is slightly higher in rural areas. The female ER visit rate is 29.9 percent higher than the male rate in rural areas compared to a difference of only 25.9 percent in urban areas. Rural rates are significantly higher than urban rates for both genders.
The 2012-2013 Health in Rural Missouri Biennial Report found that inpatient hospitalization rates increased with age. The report also noted that rural rates were significantly higher than urban rates for the age groups of Under 15 and 15 to 24 but significantly lower for the remaining older age groups.39 ER visit rates, on the other hand, are higher among younger age groups, and an almost reversed pattern of significance related to rural versus urban rates exists. Rural residents have significantly lower ER visit rates than urban residents only for the Under 15 age group. The rural and urban rates for the 15 to 24 age group are not significantly different from each other, but rural rates are significantly higher for the three remaining older age groups. The largest disparity is found in the 65 and older age group. The ER visit rate for rural residents ages 65 years and older is 19.3 percent higher than the rate for urban residents.
Emergency Room Visit Rates for All DiagnosesMissouri, 2009-2013
Age-adjusted rates per 1,000 residents
39Missouri Department of Health and Senior Services, Office of Primary Care and Rural Health. (2013). 2012-2013 Health in Rural Missouri Biennial Report. Accessed August 18, 2015, from http://health.mo.gov/living/families/ruralhealth/pdf/biennial2013.pdf.
Emergency Room Visit Rates for All DiagnosesMissouri, 2009-2013
Age-adjusted rates per 1,000 residents
28health.mo.gov Health in Rural Missouri
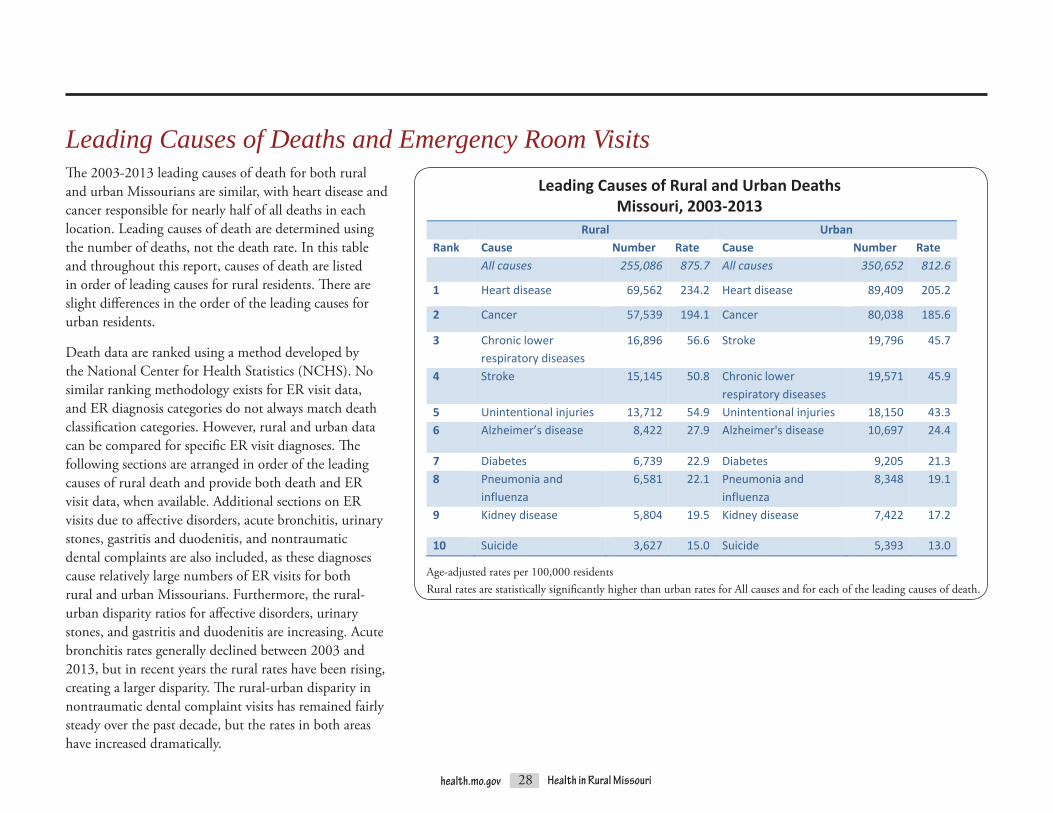
Leading Causes of Deaths and Emergency Room VisitsThe 2003-2013 leading causes of death for both rural and urban Missourians are similar, with heart disease and cancer responsible for nearly half of all deaths in each location. Leading causes of death are determined using the number of deaths, not the death rate. In this table and throughout this report, causes of death are listed in order of leading causes for rural residents. There are slight differences in the order of the leading causes for urban residents.
Death data are ranked using a method developed by the National Center for Health Statistics (NCHS). No similar ranking methodology exists for ER visit data, and ER diagnosis categories do not always match death classification categories. However, rural and urban data can be compared for specific ER visit diagnoses. The following sections are arranged in order of the leading causes of rural death and provide both death and ER visit data, when available. Additional sections on ER visits due to affective disorders, acute bronchitis, urinary stones, gastritis and duodenitis, and nontraumatic dental complaints are also included, as these diagnoses cause relatively large numbers of ER visits for both rural and urban Missourians. Furthermore, the rural-urban disparity ratios for affective disorders, urinary stones, and gastritis and duodenitis are increasing. Acute bronchitis rates generally declined between 2003 and 2013, but in recent years the rural rates have been rising, creating a larger disparity. The rural-urban disparity in nontraumatic dental complaint visits has remained fairly steady over the past decade, but the rates in both areas have increased dramatically.
Age-adjusted rates per 100,000 residentsRural rates are statistically significantly higher than urban rates for All causes and for each of the leading causes of death.
health.mo.gov 37 Health in Rural Missouri
Leading Causes of Death and Emergency Room Visits The 2003‐2013 leading causes of death for both rural and urban Missourians are similar, with heart disease and cancer responsible for nearly half of all deaths in each location. Leading causes of death are determined using the number of deaths, not the death rate. In this table and throughout this report, causes of death are listed in order of leading causes for rural residents. There are slight differences in the order of the leading causes for urban residents.
Leading Causes of Rural and Urban Deaths Missouri, 2003‐2013
Rural Urban Rank Cause Number Rate Cause Number Rate All causes 255,086 875.7 All causes 350,652 812.6
1 Heart disease 69,562 234.2 Heart disease 89,409 205.2
2 Cancer 57,539 194.1 Cancer 80,038 185.6
3 Chronic lower respiratory diseases
16,896 56.6 Stroke 19,796 45.7
4 Stroke 15,145 50.8 Chronic lower respiratory diseases
19,571 45.9
5 Unintentional injuries 13,712 54.9 Unintentional injuries 18,150 43.36 Alzheimer’s disease 8,422 27.9 Alzheimer's disease 10,697 24.4
7 Diabetes 6,739 22.9 Diabetes 9,205 21.38 Pneumonia and
influenza 6,581 22.1 Pneumonia and
influenza 8,348 19.1
9 Kidney disease 5,804 19.5 Kidney disease 7,422 17.2
10 Suicide 3,627 15.0 Suicide 5,393 13.0 Age‐adjusted rates per 100,000 residents Rural rates are statistically significantly higher than urban rates for All causes and for each of the leading causes of death.
Leading Causes of Rural and Urban DeathsMissouri, 2003-2013

29health.mo.gov Health in Rural Missouri
Heart DiseaseHeart disease includes a large class of conditions affecting the cardiovascular system and is a major cause of death, hospitalization and ER visits. In fact, it is the number one cause of death for both rural and urban Missourians. The 2003-2013 heart disease death rate of 234.2 per 100,000 rural residents is 14.1 percent higher than the 205.2 rate for urban residents, which is a statistically significant difference.
Over the past decade, heart disease death rates significantly decreased for both rural and urban areas, but the gap between the rural and urban rates grew dramatically. Between 2003 and 2007, the rural rate stayed between 10.0 and 12.0 percent higher than the urban rate. The disparity increased between 2008 and 2012, with the rural rate ranging from 12.1 percent to 18.4 percent higher than the urban rate. A large increase in the rural-urban disparity occurred in 2013, when the rural rate was 23.6 percent higher than the urban rate. Age-adjusted rates per 100,000 residents
Age-adjusted rates per 100,000 residents
Death Rates from Heart DiseaseMissouri, 2003-2013
Death Rates from Heart DiseaseMissouri, 2003-2013
...it is the number one cause of death for both rural and urban Missourians.

30health.mo.gov Health in Rural Missouri
Most counties with heart disease death rates that are significantly different from the overall Missouri rate are located in clusters. Five clusters of significantly high rates are located south of the Missouri River; only two clusters of significantly high rates are found along or north of the river. Clusters of significantly low rates tend to be located around urban areas.
Based on age-adjusted rates per 100,000 residentsStatistical significance compared to the state using 95 percent confidence intervals
Deaths from Heart DiseaseMissouri, 2003-2013
Death Rates from Heart DiseaseSelected Rural and Urban Missouri Counties, 2003-2013
The three highest rural heart disease death rates are found in the Southeast BRFSS Region. The three counties with the lowest rural rates are located in northern counties along the Iowa border.
Age-adjusted rates per 100,000

31health.mo.gov Health in Rural Missouri
The 2009-2013 rural ER visit rate for heart disease is 15.7 per 1,000 residents, which is 12.9 percent higher than the urban rate of 13.9. The difference between the rural and urban rates is statistically significant.
Age-adjusted rates per 1,000 residents
Emergency Room Visit Rates for Heart DiseaseMissouri, 2003-2013
Age-adjusted rates per 1,000 residents
Emergency Room Visit Rates for Heart DiseaseMissouri, 2009-2013
In contrast to the significant declines in heart disease death rates, heart disease ER visit rates significantly increased for both rural and urban residents between 2003 and 2013. The difference between the rural and urban rates remained fairly stable over time. The rural rate was significantly higher than the urban rate in each of these years.

32health.mo.gov Health in Rural Missouri
CancerThe second leading cause of death for both rural and urban Missourians is cancer, which primarily affects older residents. The rural cancer death rate of 194.1 per 100,000 residents is significantly higher than the urban rate of 185.6. Both the rural and the urban rates exceed the Healthy People 2020 target rate of 161.4.40,41,42
The counties with the three highest rural cancer death rates are located in the Southeast BRFSS Region. The three lowest rural rates are found in the Northeast, Central and Northwest BRFSS regions.
40See the Glossary for a description of Healthy People 2020.41HealthyPeople.gov. (Last updated October 9, 2015). Cancer Objectives. Accessed October 13, 2015, from http://www.healthypeople.gov/2020/topics-objectives/topic/cancer/objectives. 42Healthy People 2020 revised this target rate after the publication of the 2012-2013 Health in Rural Missouri Biennial Report.
Age-adjusted rates per 100,000 residents
Death Rates from CancerSelected Rural and Urban Missouri Counties, 2003-2013
Death Rates from CancerMissouri, 2003-2013
Age-adjusted rates per 100,000 residents

33health.mo.gov Health in Rural Missouri
Cancer death rates in both rural and urban areas of Missouri decreased significantly from 2003 to 2013, by 8.3 and 13.0 percent, respectively. The rural rate remained higher than the urban rate throughout this time period, and the rural-urban disparity increased over these years, with the relatively small gap between the rates more than doubling.
While rural males have a significantly higher death rate than urban males, there is no statistically significant difference between the rural and urban female rates. In both rural and urban counties, male cancer death rates are significantly higher than female rates.
Age-adjusted rates per 100,000 residents
Death Rates from CancerMissouri, 2003-2013
Death Rates from CancerMissouri, 2003-2013
Age-adjusted rates per 100,000 residents
34health.mo.gov Health in Rural Missouri
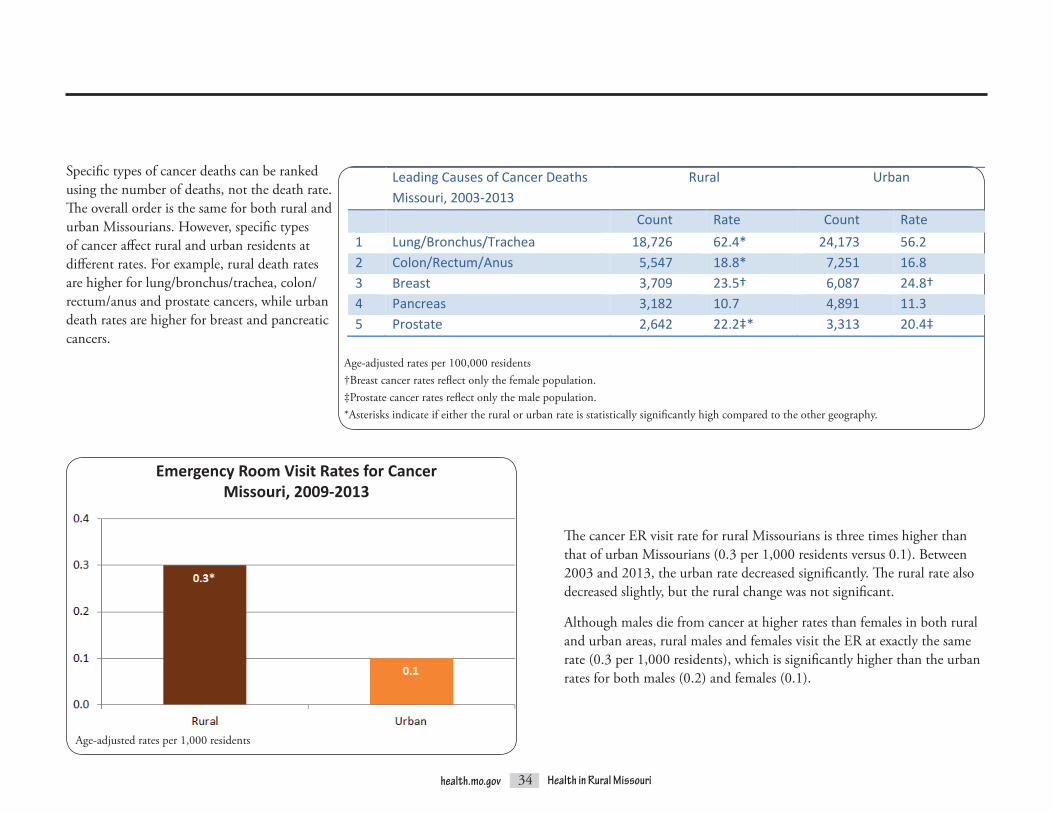
Specific types of cancer deaths can be ranked using the number of deaths, not the death rate. The overall order is the same for both rural and urban Missourians. However, specific types of cancer affect rural and urban residents at different rates. For example, rural death rates arehigherforlung/bronchus/trachea,colon/rectum/anusandprostatecancers,whileurbandeath rates are higher for breast and pancreatic cancers.
Age-adjusted rates per 100,000 residents†Breast cancer rates reflect only the female population. ‡Prostate cancer rates reflect only the male population.*Asterisks indicate if either the rural or urban rate is statistically significantly high compared to the other geography.
The cancer ER visit rate for rural Missourians is three times higher than that of urban Missourians (0.3 per 1,000 residents versus 0.1). Between 2003 and 2013, the urban rate decreased significantly. The rural rate also decreased slightly, but the rural change was not significant.
Although males die from cancer at higher rates than females in both rural and urban areas, rural males and females visit the ER at exactly the same rate (0.3 per 1,000 residents), which is significantly higher than the urban rates for both males (0.2) and females (0.1).
Emergency Room Visit Rates for CancerMissouri, 2009-2013
Age-adjusted rates per 1,000 residents
Leading Causes of Cancer Deaths Missouri, 2003-2013
Rural Urban
Count Rate Count Rate 1 Lung/Bronchus/Trachea 18,726 62.4* 24,173 56.2 2 Colon/Rectum/Anus 5,547 18.8* 7,251 16.8 3 Breast 3,709 23.5† 6,087 24.8† 4 Pancreas 3,182 10.7 4,891 11.3 5 Prostate 2,642 22.2‡* 3,313 20.4‡

35health.mo.gov Health in Rural Missouri
The Missouri Cancer Registry provides data on all newly diagnosed cases of cancer throughout the state. (This is sometimes referred to as incidence data.) During the 2010-2012 time period, the urban rate of cancer incidence was 5.6 percent higher than the rural rate (458.5 new cancer cases per 100,000 urban residents versus 434.1 new cases per 100,000 rural residents). Thus, urban residents are diagnosed with cancer at a higher rate, but rural residents die from this disease at a higher rate. A similar trend was observed in the 2012-2013 Health in Rural Missouri Biennial Report, which noted that urban hospitalization rates for cancer were higher over the 2007-2011 time period, but 2001-2011 mortality rates were higher among rural residents.43
43Missouri Department of Health and Senior Services, Office of Primary Care and Rural Health. (2013). 2012-2013 Health in Rural Missouri Biennial Report. Accessed August 18, 2015, from http://health.mo.gov/living/families/ruralhealth/pdf/biennial2013.pdf.
Cancer Incidence Rates Missouri, 2010-2012
Age-adjusted rates per 100,000 residents
The Missouri Cancer Registry also provides incidence statistics for some of the major types of cancer. Breast and prostate cancer rates are statistically significantly higher in urban areas, while the rural lung cancer rate is significantly higher than the urban rate. There is no statistically significant difference in colon cancer rates.
health.mo.gov 52 Health in Rural Missouri
The Missouri Cancer Registry also provides incidence statistics for some of the major types of cancer. Breast and prostate cancer rates are statistically significantly higher in urban areas, while the rural lung cancer rate is significantly higher than the urban rate. There is no statistically significant difference in colon cancer rates. Most Common Sites
of New Cancer Cases Missouri, 2010‐2012
Rural Urban
Count Rate Count Rate 1 Lung 6,700 78.0* 9,022 73.0 2 Breast 4,703 111.3† 8,838 131.7†* 3 Prostate 4,149 100.0‡ 6,572 111.5‡* 4 Colon 3,679 44.3 5,205 42.3 ALL SITES 35,937 434.1 56,850 458.5* Age‐adjusted rates per 100,000 residents †Breast cancer rates represent only the female popula�on. ‡Prostate cancer rates represent only the male popula�on. *Asterisks indicate if either the rural or urban rate is statistically significantly high compared to the other geography.
Age-adjusted rates per 100,000 residents†Breast cancer rates represent only the female population. ‡Prostate cancer rates represent only the male population.*Asterisks indicate if either the rural or urban rate is statistically significantly high compared to the other geography.

36health.mo.gov Health in Rural Missouri
Chronic lower respiratory diseases (CLRDs) include chronic obstructive pulmonary disease (COPD), emphysema, asthma, bronchiectasis, non-acute bronchitis and other forms of chronic airway obstruction.44 CLRD is the third leading cause of death in rural Missouri and the fourth leading cause in urban Missouri. The 2003-2013 CLRD death rate for rural Missourians (56.6 per 100,000 residents) is 23.3 percent higher than the urban rate of 45.9, a statistically significant difference.
44Missouri Department of Health and Senior Services. Leading Causes of Death Profile – Definitions. Accessed August 6, 2015, from http://www.health.mo.gov/data/mica/CDP_MICA/CofDDefinitionofIndicators.html#I6.
Age-adjusted rates per 100,000 residents
CLRD death rates fluctuated in both rural and urban areas between 2003 and 2013. Rural areas experienced statistically significant increases between 2004 and 2005 and again between 2007 and 2008. The urban rate also increased significantly between 2007 and 2008, but it declined significantly the following year. The rural rate has not significantly declined from year to year and in fact was significantly higher in 2013 than it was in 2003. As a result, the gap between rural and urban areas widened; by 2013, the rural rate was 36.2 percent higher than the urban rate.
Death Rates from Chronic Lower Respiratory DiseasesMissouri, 2003-2013
Death Rates from Chronic Lower Respiratory DiseasesMissouri, 2003-2013
Age-adjusted rates per 100,000 residents
Chronic Lower Respiratory Diseases
37health.mo.gov Health in Rural Missouri
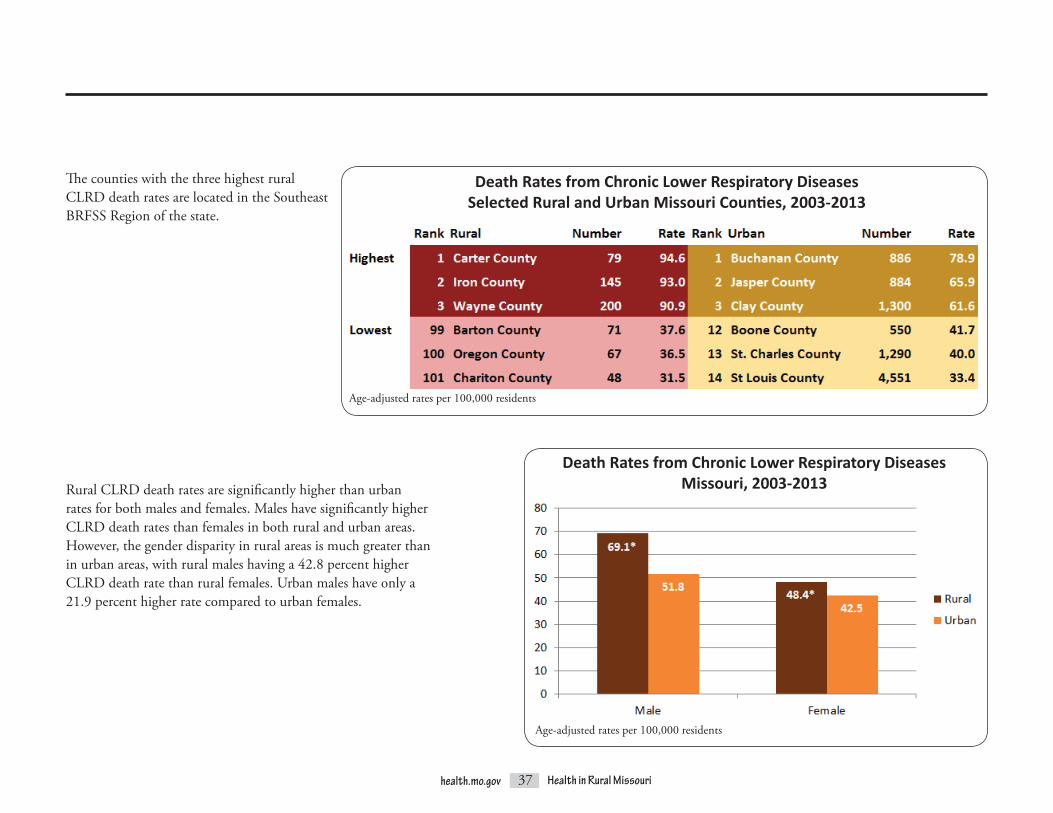
The counties with the three highest rural CLRD death rates are located in the Southeast BRFSS Region of the state.
Rural CLRD death rates are significantly higher than urban rates for both males and females. Males have significantly higher CLRD death rates than females in both rural and urban areas. However, the gender disparity in rural areas is much greater than in urban areas, with rural males having a 42.8 percent higher CLRD death rate than rural females. Urban males have only a 21.9 percent higher rate compared to urban females.
Death Rates from Chronic Lower Respiratory DiseasesSelected Rural and Urban Missouri Counties, 2003-2013
Age-adjusted rates per 100,000 residents
Death Rates from Chronic Lower Respiratory DiseasesMissouri, 2003-2013
Age-adjusted rates per 100,000 residents

38health.mo.gov Health in Rural Missouri
ThemajorityofCLRDERvisitsareduetoCOPD/bronchiectasisandasthma. Significance maps of ER visit rates for these two conditions reveal contrasting patterns of distribution.
In Missouri, 46 of the 101 rural counties and 6 of the 14 urban counties haveCOPD/bronchiectasisERvisitratesthataresignificantlyhigherthanthe overall state rate.
Emergency Room Visit Rates for COPD/BronchiectasisMissouri, 2009-2013
Based on age-adjusted rates per 1,000 residentsStatistical significance compared to the state using 95 percent confidence intervals
In contrast, only 11 counties have asthma ER visit rates that are significantly higher than the state rate, while 91 counties have significantly lower rates. Several of the counties with significantly high rates are metropolitan (St. Louis City, St. Louis County and Jackson County). The largest cluster of significantly high rates is found in southwest Missouri and includes Joplin.
Emergency Room Visit Rates for AsthmaMissouri, 2009-2013
Based on age-adjusted rates per 1,000 residentsStatistical significance compared to the state using 95 percent confidence intervals

39health.mo.gov Health in Rural Missouri
Mirroringtherural-urbandisparityinCLRDdeathrates,theruralCOPD/bronchiectasis ER visit rate is higher than the urban rate at 7.1 ER visits per 1,000 rural residents compared to 4.6 per 1,000 urban residents. This 54.3 percent difference in rates is statistically significant.
Age-adjusted rates per 1,000 residents
Emergency Room Visit Rates for COPD/BronchiectasisMissouri, 2009-2013
Emergency Room Visit Rates for AsthmaMissouri, 2009-2013
Age-adjusted rates per 1,000 residents
ER visit rates for asthma, on the other hand, are 88.2 percent higher among urban residents, a statistically significant disparity.

40health.mo.gov Health in Rural Missouri
COPD/bronchiectasisERvisitratesfluctuatedduringtheyearsbetween2003 and 2013, with both the rural and the urban rates following the same general pattern of increases and decreases over time. However, rates were consistently significantly higher for rural residents during these years. The rural rate was always at least 1.5 times higher than the urban rate.
Emergency Room Visit Rates for COPD/BronchiectasisMissouri, 2003-2013
Age-adjusted rates per 1,000 residents
In sharp contrast, asthma ER visit rates were significantly higher for urban residents during the same time period. Between 2003 and 2013, rates slightly increased for urban residents as they significantly decreased for rural residents, causing the urban-rural disparity to grow. In 2003, the urban-rural disparity ratio was 1.6. By 2013, it had risen to 1.9, meaning that the urban rate was nearly twice the rural rate.
Emergency Room Visit Rates for AsthmaMissouri, 2003-2013
Age-adjusted rates per 1,000 residents

41health.mo.gov Health in Rural Missouri
45Akinbami, L.J., and Liu, X. (June 2011). Chronic Obstructive Pulmonary Disease Among Adults Aged 18 and Over in the United States, 1998–2009. NCHS Data Brief, 63. Hyattsville, MD: National Center for Health Statistics. Accessed August 18, 2015, from http://www.cdc.gov/nchs/data/databriefs/db63.pdf.
COPD/bronchiectasisERvisitratesincreasemarkedly with age. (The same pattern is observed for CLRD deaths.) Asthma ER visit rates, on the other hand, tend to decrease with age.
RuralCOPD/bronchiectasisERvisitratesaresignificantly higher than urban rates for both males and females. While males in both rural and urban areas have significantly higher CLRD death rates than females, rural and urban female residents visit the ER at significantly higher ratesforCOPD/bronchiectasis.TheCentersforDisease Control and Prevention (CDC) reports that COPD prevalence is higher among women than men. “Increased COPD morbidity among women is believed to reflect increased smoking rates among women beginning in the 1940s… Although death rates from COPD remained lower among women overall, death rates did not change for women from 1999 through 2007, while they decreased for men. The narrowing gap in death rates represents a continuing shift in the relative burden of COPD to women.”45
Emergency Room Visit Rates for COPD/BronchiectasisMissouri, 2009-2013
Emergency Room Visit Rates for COPD/Bronchiectasis and AsthmaMissouri, 2009-2013
Age-adjusted rates per 1,000 residents
Age-adjusted rates per 1,000 residents

42health.mo.gov Health in Rural Missouri
46Postma, D.S. (2007). Gender Differences in Asthma Development and Progression [Abstract]. Gender Medicine 4(Suppl B), S133-S146. Accessed August 18, 2015, from http://www.ncbi.nlm.nih.gov/pubmed/18156099. 47Ibid.48Almqvist, C., Worm, M., Leynaert, B., and the Working Group of GA2LEN WP 2.5 ‘Gender.’ (2008). Impact of Gender on Asthma in Childhood and Adolescence: A GA2LEN Review. Allergy 63, 47-57. Accessed August 18, 2015, from http://onlinelibrary.wiley.com/doi/10.1111/j.1398-9995.2007.01524.x/pdf. 49Osman, M. (2003). Therapeutic Implications of Sex Differences in Asthma and Atopy. Archives of Disease in Childhood 88, 587-590. Accessed August 18, 2015, from http://adc.bmj.com/content/88/7/587.full.pdf.
Female residents also have significantly higher ER visit rates for asthma in both rural and urban areas. “Because of the complexity of the disease, no single straightforward mechanism can explain the gender differences found in asthma.”46 Possible contributory factors for females include hormonal changes during and after puberty, greater susceptibility to the effects of cigarette smoking, sociocultural influences, different environmental exposures, and lung development and immune system differences.47,48,49 Urban rates are significantly higher than rural rates for both genders.
Age-adjusted rates per 1,000 residents
Emergency Room Visit Rates for AsthmaMissouri, 2009-2013

43health.mo.gov Health in Rural Missouri
While stroke death rates have fallen since 2003, stroke remains the fourth leading cause of death for Missouri overall and for rural residents. (Stroke is the third leading cause of death for Missouri’s urban residents.) “The burden of cardiovascular disease is disproportionately distributed across the population. There are significant disparities … based on … geographic area” as well as other social, economic and demographic factors.50 In Missouri, the death rate from stroke is higher in rural counties (50.8 per 100,000 rural residents compared to 45.7 for urban residents during the 2003-2013 time period). This rural-urban rate difference is statistically significant. Both the rural and the urban rates exceed the Healthy People 2020 target rate of 34.8.51,52
Stroke
50HealthyPeople.gov. (Last updated August 17, 2015). Heart Disease and Stroke Overview. Accessed August 18, 2015, from http://www.healthypeople.gov/2020/topicsobjectives2020/overview.aspx?topicid=21. 51HealthyPeople.gov. (Last updated October 9, 2015). Heart Disease and Stroke Objectives. Accessed October 13, 2015, from http://www.healthypeople.gov/2020/topics-objectives/topic/heart-disease-and-stroke/objectives. 52Healthy People 2020 revised this target rate after the publication of the 2012-2013 Health in Rural Missouri Biennial Report.
Death Rates from StrokeMissouri, 2003-2013
Age-adjusted rates per 100,000 residents

44health.mo.gov Health in Rural Missouri
Age-adjusted rates per 100,000 residents
Stroke death rates significantly declined between 2003 and 2013 in both rural and urban areas. Although the rural rate remained higher than the urban rate throughout this time period, the disparity between the rural and urban rates varied quite a bit from year to year. The largest disparity occurred in 2005, when the rural rate was 22.5 percent higher than the urban rate. However, by 2011 the rural rate was only 3.0 percent higher.
Death Rates from StrokeMissouri 2003-2013
The counties with the three highest rural stroke death rates are found in the Northeast, Southeast and Southwest BRFSS regions. The counties with the three lowest rural rates are located in the Northeast (Monroe and Putnam counties) and Central (Osage County) BRFSS regions.
Death Rates from StrokeSelected Rural and Urban Missouri Counties, 2003-2013
Age-adjusted rates per 100,000 residents

45health.mo.gov Health in Rural Missouri
The 2012-2013 Health in Rural Missouri Biennial Report noted that although the rural stroke death rate is significantly higher than the urban stroke death rate, urban residents are hospitalized for stroke at a significantly higher rate than rural residents (30.3 versus 28.4 per 10,000 residents for 2007-2011).53 ER visit rates, on the other hand, are significantly higher for rural residents. The rural rate of 1.1 per 1,000 residents is more than double the urban rate of 0.5.
Between 2003 and 2013, rural stroke ER visit rates ranged from a low of 1.0 to a high of 1.2, while urban rates ranged from a low of 0.5 to a high of 0.6. Although the changes over time were not significant, the rural rates trended slightly upward while the urban rates trended slightly downward. As a result, the rural-urban disparity ratio increased.
53Missouri Department of Health and Senior Services, Office of Primary Care and Rural Health. (2013). 2012-2013 Health in Rural Missouri Biennial Report. Accessed August 18, 2015, from http://health.mo.gov/living/families/ruralhealth/pdf/biennial2013.pdf.
Age-adjusted rates per 1,000 residents
Emergency Room Visit Rates for StrokeMissouri, 2009-2013

46health.mo.gov Health in Rural Missouri
Unintentional Injuries/Motor Vehicle AccidentsThe fifth leading cause of death for both rural and urban Missourians is unintentional injuries, a category that includes motor vehicle accidents (MVAs), falls, drug overdoses, fires and drownings.54 The rural rate of unintentional injury deaths (54.9 per 100,000 residents for 2003-2013) is statistically significantly higher than the urban rate (43.3). Rural residents have significantly higher unintentional injury death rates for both genders and all age groups except 65 and over; the urban rate is significantly higher than the rural rate for this age group.
Likewise, rural residents visit the ER for unintentional injuries at a significantly higher rate (89.9 versus 77.2 per 1,000 residents). Rural residents have higher unintentional injury ER visit rates for both genders and for all age groups.
54Missouri Department of Health and Senior Services. Leading Causes of Death Profile – Definitions. Accessed July 28, 2015, from http://www.health.mo.gov/data/mica/CDP_MICA/CofDDefinitionofIndicators.html#I7.
47health.mo.gov Health in Rural Missouri
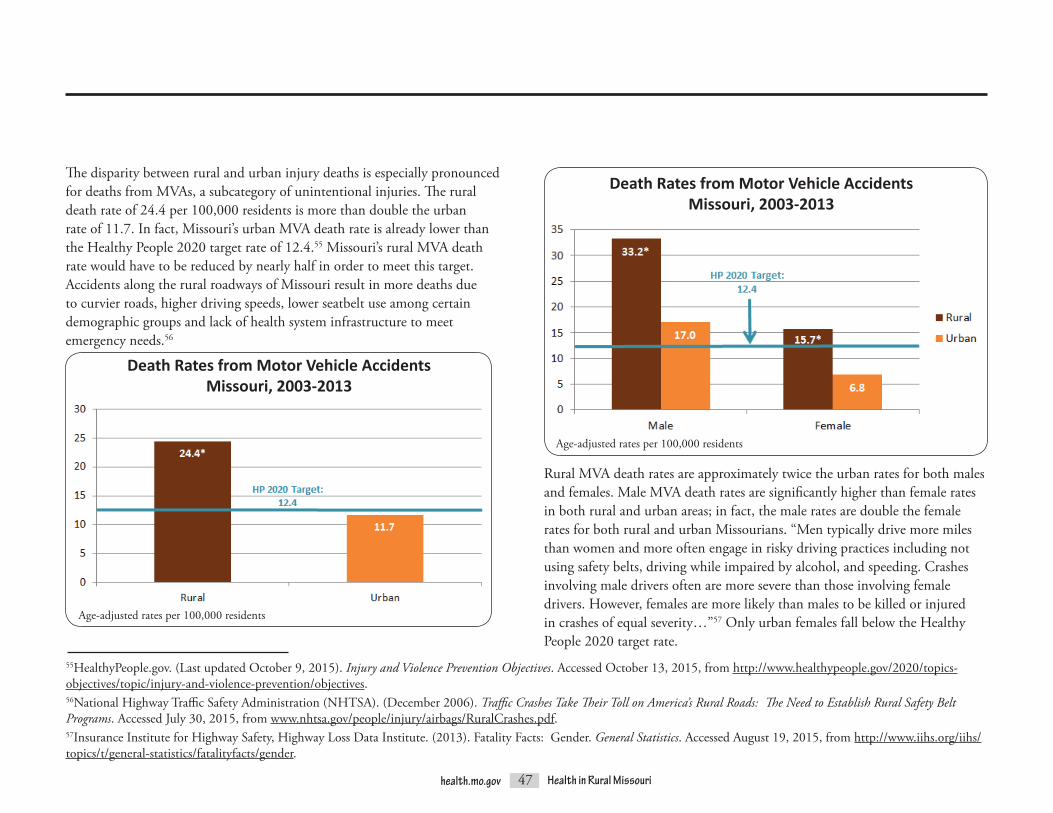
The disparity between rural and urban injury deaths is especially pronounced for deaths from MVAs, a subcategory of unintentional injuries. The rural death rate of 24.4 per 100,000 residents is more than double the urban rate of 11.7. In fact, Missouri’s urban MVA death rate is already lower than the Healthy People 2020 target rate of 12.4.55 Missouri’s rural MVA death rate would have to be reduced by nearly half in order to meet this target. Accidents along the rural roadways of Missouri result in more deaths due to curvier roads, higher driving speeds, lower seatbelt use among certain demographic groups and lack of health system infrastructure to meet emergency needs.56
55HealthyPeople.gov. (Last updated October 9, 2015). Injury and Violence Prevention Objectives. Accessed October 13, 2015, from http://www.healthypeople.gov/2020/topics-objectives/topic/injury-and-violence-prevention/objectives. 56National Highway Traffic Safety Administration (NHTSA). (December 2006). Traffic Crashes Take Their Toll on America’s Rural Roads: The Need to Establish Rural Safety Belt Programs. Accessed July 30, 2015, from www.nhtsa.gov/people/injury/airbags/RuralCrashes.pdf. 57Insurance Institute for Highway Safety, Highway Loss Data Institute. (2013). Fatality Facts: Gender. General Statistics. Accessed August 19, 2015, from http://www.iihs.org/iihs/topics/t/general-statistics/fatalityfacts/gender.
Age-adjusted rates per 100,000 residents
Death Rates from Motor Vehicle AccidentsMissouri, 2003-2013
Rural MVA death rates are approximately twice the urban rates for both males and females. Male MVA death rates are significantly higher than female rates in both rural and urban areas; in fact, the male rates are double the female rates for both rural and urban Missourians. “Men typically drive more miles than women and more often engage in risky driving practices including not using safety belts, driving while impaired by alcohol, and speeding. Crashes involving male drivers often are more severe than those involving female drivers. However, females are more likely than males to be killed or injured in crashes of equal severity…”57 Only urban females fall below the Healthy People 2020 target rate.
Death Rates from Motor Vehicle AccidentsMissouri, 2003-2013
Age-adjusted rates per 100,000 residents

48health.mo.gov Health in Rural Missouri
Rural MVA death rates are also significantly higher – again, more than double the urban rates – across all age groups. The highest rates occur among the 15 to 24 age group in both rural and urban areas. The rural death rate in this age group is more than three times the Healthy People 2020 target rate.
Age-adjusted rates per 100,000 residents
Although MVA death rates declined between 2003 and 2013, MVAs still account for 43 percent of all rural unintentional injury deaths. In contrast, MVA deaths are responsible for less than one-third of all urban unintentional injury deaths.
Types of Unintentional Injury DeathsMissouri, 2003-2013
Death Rates from Motor Vehicle AccidentsMissouri, 2003-2013
Rural Urban

49health.mo.gov Health in Rural Missouri
In fact, MVA death rates are significantly higher than the state rate in nearly 65 percent of Missouri’s rural counties. Only one rural county, Cape Girardeau, has a significantly low MVA death rate compared to the state overall.
The three highest MVA death rates by county are clustered in the south central part of the state. The rates for these three counties are more than double the overall rural rate of 24.4 and are over four times higher than the overall urban rate of 11.7. The lowest rural MVA death rates are dispersed throughout the state.
Age-adjusted rates per 100,000 residents†Unstable rate based on fewer than 20 events
Death Rates from Motor Vehicle AccidentsSelected Rural and Urban Missouri Counties, 2003-2013

50health.mo.gov Health in Rural Missouri
58Missouri Department of Health and Senior Services, Office of Primary Care and Rural Health. (2013). 2012-2013 Health in Rural Missouri Biennial Report. Accessed August 24, 2015, from http://health.mo.gov/living/families/ruralhealth/pdf/biennial2013.pdf.59Ibid.
MVA ER visits are reported in two categories: those that occurred on a trafficway, such as a highway or street, and those that occurred on a non-trafficway, such as a parking lot or driveway. Both categories include persons injured in a motor vehicle accident, regardless of whether they were in a motor vehicle at the time of injury. For the time period from 2009 through 2013, 73.2 percent of rural MVA ER visits and 83.9 percent of urban MVA ER visits were due to injuries that occurred on a trafficway. The remainder of this section focuses only on motor vehicle traffic accidents since they are responsible for the majority of MVA ER visits. The urban ER visit rate of 8.9 per 1,000 residents is significantly higher than the rural ER visit rate of 8.2. This starkly contrasts with the pattern of inpatient hospitalization rates, which are significantly higher for rural residents.58
Emergency Room Visit Rates for Motor Vehicle Traffic AccidentsMissouri, 2009-2013
Age-adjusted rates per 1,000 residentsMotor Vehicle Traffic Accident Emergency Room Visits
by Occupant TypeMissouri, 2009-2013
In both rural and urban areas, over 90 percent of motor vehicle traffic accident ERpatientsareclassifiedascar/truckoccupants.Motorcyclistsarethenextlargest category, followed by pedestrians and then bicyclists. The pattern is similar for inpatient hospitalizations.59
Rural Urban
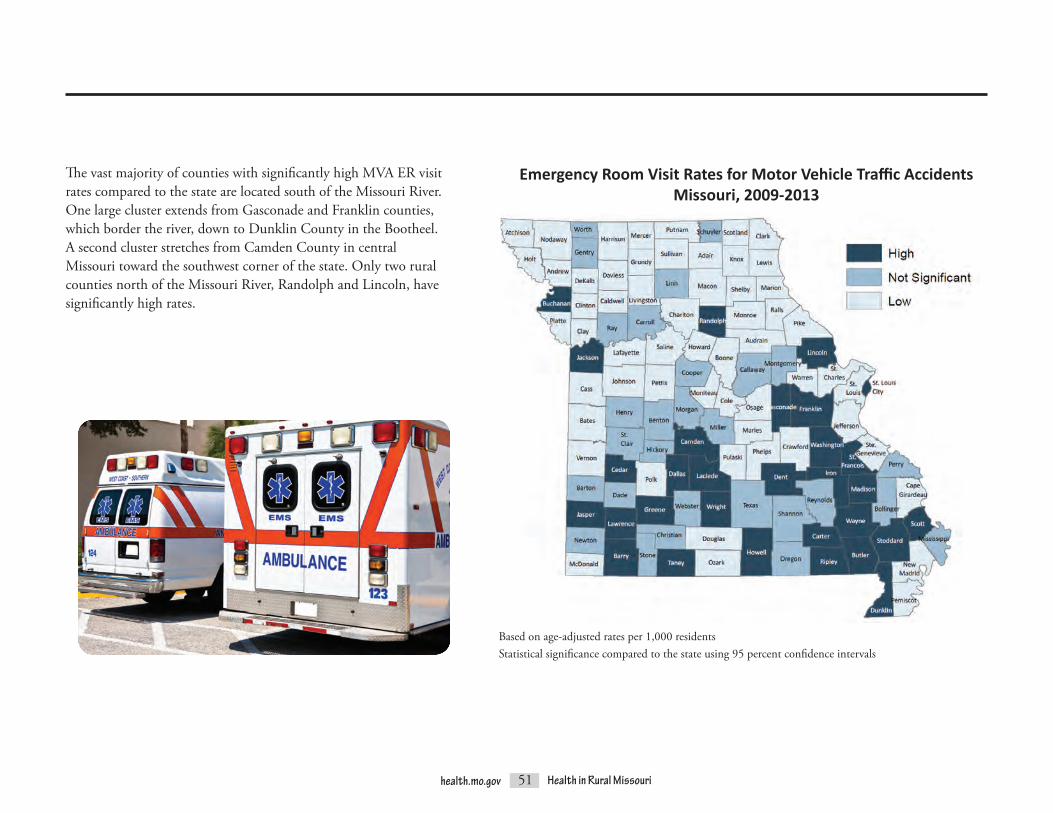
51health.mo.gov Health in Rural Missouri
The vast majority of counties with significantly high MVA ER visit rates compared to the state are located south of the Missouri River. One large cluster extends from Gasconade and Franklin counties, which border the river, down to Dunklin County in the Bootheel. A second cluster stretches from Camden County in central Missouri toward the southwest corner of the state. Only two rural counties north of the Missouri River, Randolph and Lincoln, have significantly high rates.
Based on age-adjusted rates per 1,000 residentsStatistical significance compared to the state using 95 percent confidence intervals
Emergency Room Visit Rates for Motor Vehicle Traffic AccidentsMissouri, 2009-2013

52health.mo.gov Health in Rural Missouri
Urban ER visit rates are significantly higher than rural rates for both genders. Although males have significantly higher MVA death rates, females have significantly higher MVA ER visit rates.
ER visit rates for motor vehicle traffic accidents decreased for both rural and urban Missourians between 2003 and 2013. The rates for both areas remained similar from 2004 through 2007. However, in more recent years rural rates decreased more than urban rates. The 2013 rate of 7.5 for rural counties is 30.0 percent less than the 2003 rate of 10.7. Urban counties experienced a decline of 26.3 percent (from 11.5 to 8.5) over the same time period. Although the decreases in both areas are significant, the urban-rural disparity appears to be growing.
Age-adjusted rates per 1,000 residents
Emergency Room Visit Rates for Motor Vehicle Traffic AccidentsMissouri, 2009-2013
Emergency Room Visit Rates for Motor Vehicle Traffic AccidentsMissouri, 2003-2013
Age-adjusted rates per 1,000 residents

53health.mo.gov Health in Rural Missouri
Alzheimer’s Disease“Alzheimer’s disease is an irreversible, progressive brain disorder that slowly destroys memory and thinking skills and, eventually, the ability to carry out the simplest tasks. In most people with Alzheimer’s, symptoms first appear in their mid-60s. Alzheimer’s disease is the most common cause of dementia among older adults… The time from diagnosis to death varies—as little as 3 or 4 years if the person is older than 80 when diagnosed to as long as 10 or more years if the person is younger.”60 The rural Alzheimer’s disease death rate of 27.9 per 100,000 residents is 14.3 percent higher than the urban rate of 24.4, which is a statistically significant difference.
Although rural and urban death rates from Alzheimer’s disease were similar from 2003 through 2007, the rural rates diverged from the urban rates between 2007 and 2008. The 2013 rural Alzheimer’s disease death rate is 18.0 percent higher than the 2007 rural rate, while the 2013 urban rate is only 0.8 percent higher than the 2007 urban rate.
60National Institute on Aging, Alzheimer’s Disease Education and Referral Center. About Alzheimer’s Disease: Alzheimer’s Basics. Accessed October 5, 2015, from https://www.nia.nih.gov/alzheimers/topics/alzheimers-basics.
Death Rates from Alzheimer’s DiseaseMissouri, 2003-2013
Death Rates from Alzheimer’s DiseaseMissouri, 2003-2013
Age-adjusted rates per 100,000 residents
Age-adjusted rates per 100,000 residents

54health.mo.gov Health in Rural Missouri
The counties with the three highest rural Alzheimer’s disease death rates are all found in the Southeast BRFSS Region. The counties with the lowest rates are not displayed because the rural rates are based on small numbers of deaths and are considered to be unstable.61
Rural death rates from Alzheimer’s disease are significantly higher than urban rates for both males and females. Female death rates are significantly higher than male death rates in both rural and urban areas. The rural female death rate is significantly higher than the rates for both rural and urban males as well as urban females.
The ER visit rate for Alzheimer’s disease is extremely low (less than 0.1 per 1,000 residents) for the overall population. However, the rates rise considerably among older age groups. For Missourians ages 75 years and over, the rates for the rural and urban populations are not statistically significantly different (0.4 per 1,000 rural residents versus 0.3 per 1,000 urban residents). While the Alzheimer’s disease ER visit rates for residents ages 85 years and over are even higher (1.0 per 1,000 rural residents and 0.8 per 1,000 urban residents), this rural-urban difference is also not statistically significant.62
Age-adjusted rates per 100,000 residentsLowest rates not shown due to small rural numbers
Death Rates from Alzheimer’s DiseaseMissouri, 2003-2013
Death Rates from Alzheimer’s DiseaseSelected Rural and Urban Missouri Counties, 2003-2013
61See the Glossary for a discussion of unstable rates.62Alzheimer’s disease ER visit data were obtained from Patient Abstract System files with the assistance of David Litchfield in the Bureau of Health Care Analysis and Data Dissemination.
Age-adjusted rates per 100,000 residents

55health.mo.gov Health in Rural Missouri
DiabetesThe 2014 BRFSS estimates that 11.1 percent of Missouri adults have diabetes.63,64 Diabetes “occurs when the body cannot produce or respond appropriately to insulin.”65 According to the Centers for Disease Control and Prevention (CDC), complications from diabetes are “debilitating, costly and sometimes deadly. Diabetes is a major cause of health complications, such as heart disease, stroke, kidney damage (chronic kidney disease and kidney failure), blindness, amputations of the legs and feet, and gum disease (periodontitis).”66 Research has found that rural diabetics are less likely to receive certain types of care, such as eye and foot examinations and diabetes education.67 This lack of preventive care may be leading to higher death rates among rural Missourians. For the 2003-2013 time period, the rural diabetes death rate of 22.9 per 100,000 residents is significantly higher than the urban rate of 21.3.
63The age-adjusted prevalence estimate is provided in this report. See the Glossary for a discussion of the BRFSS.64Missouri Department of Health and Senior Services, Office of Epidemiology. (August 2015). 2014 Missouri Behavioral Risk Factor Surveillance System Key Findings. Jefferson City, MO: Missouri Department of Health and Senior Services. Accessed August 24, 2015, from http://www.health.mo.gov/data/brfss/2014_BRFSS_Key_Findings_Report.pdf. 65HealthyPeople.gov. (Last updated April 10, 2013). Diabetes Overview. Accessed July 27, 2015, from http://www.healthypeople.gov/2020/topics-objectives/topic/diabetes. 66Centers for Disease Control and Prevention (CDC). (2015). Diabetes Report Card 2014. Atlanta, GA: Centers for Disease Control and Prevention, U.S. Department of Health and Human Services. Accessed July 27, 2015, from http://www.cdc.gov/diabetes/pdfs/library/diabetesreportcard2014.pdf. 67Krishna, S., Gillespie, K.N., and McBride, T.M. (2010). Diabetes Burden and Access to Preventive Care in the Rural United States. Journal of Rural Health 26(1), 3-11. Accessed July 27, 2015, from http://onlinelibrary.wiley.com/doi/10.1111/j.1748-0361.2009.00259.x/abstract;jsessionid=D99AD3AB6618092D6190FE85B5D63290.d03t04.doi:10.1111/j.1748-0361.2009.00259.x.
Death Rates from DiabetesMissouri, 2003-2013
Age-adjusted rates per 100,000 residents

56health.mo.gov Health in Rural Missouri
In general, urban diabetes death rates gradually declined from 2003 through 2013. As a result, the 2013 urban rate is statistically significantly lower than the 2003 urban rate. The rural diabetes death rate, however, fluctuated throughout the same time period. It significantly declined between 2003 and 2009 but then significantly increased between 2009 and 2013. Because of these fluctuations, the 2013 rural rate is not significantly different from the 2003 rate. At several points during the early part of the decade, the rural and urban rates were nearly identical. In more recent years, the rural rate has almost always been higher than the urban rate, and the gap between the two appears to be increasing.
The county with the highest rural diabetes death rate is located in the Northeast BRFSS Region. The rural counties ranked second and third are found in the Central and Southeast BRFSS regions, respectively. The counties with the lowest rates are not displayed because the rural rates are based on small numbers of deaths and are considered to be unstable.68
Age-adjusted rates per 100,000 residentsLowest rates not shown due to small rural numbers
Death Rates from DiabetesSelected Rural and Urban Missouri Counties, 2003-2013
Death Rates from DiabetesMissouri, 2003-2013
Age-adjusted rates per 100,000 residents
68See the Glossary for a discussion of unstable rates.

57health.mo.gov Health in Rural Missouri
Rural residents also visit the ER for diabetes at a higher rate than urban residents (2.0 visits per 1,000 rural residents versus 1.8 visits per 1,000 urban residents). Although these rates are relatively low, the rural rate is significantly higher than the urban rate.
Age-adjusted rates per 1,000 residents
Emergency Room Visit Rates for DiabetesMissouri, 2009-2013
Emergency Room Visit Rates for DiabetesMissouri, 2009-2013
Between 2003 and 2013, diabetes ER visit rates for both rural and urban residents increased significantly. However, in the most recent three years, the rural rate continued to steadily increase while the urban rate appeared to reach a plateau. If this trend continues, the disparity between the rural and urban rates will grow even larger.
Age-adjusted rates per 1,000 residents

58health.mo.gov Health in Rural Missouri
Emergency Room Visit Rates for DiabetesMissouri, 2009-2013
Age-adjusted rates per 1,000 residents
69Missouri Department of Health and Senior Services, Office of Primary Care and Rural Health. (2013). 2012-2013 Health in Rural Missouri Biennial Report. Accessed August 18, 2015, from http://health.mo.gov/living/families/ruralhealth/pdf/biennial2013.pdf.
The rural diabetes ER visit rate for females is significantly higher than the urban female rate; however, there is no significant difference between the rural and urban male rates. Analysis performed for the 2012-2013 Health in Rural Missouri Biennial Report noted that male hospitalization rates for diabetes were significantly higher than female rates in both rural and urban areas.69 However, data for the 2009-2013 time period reveal that rural females have significantly higher ER visit rates than rural males, urban males and urban females.
Diabetes ER visit rates increase with age in both rural and urban areas. Rural ER visit rates are significantly higher than urban rates among residents in the 15 to 24, 25 to 44, and 65 and over age groups. There is no significant difference between the rural and urban rates for residents in the Under 15 and 45 to 64 age groups.

59health.mo.gov Health in Rural Missouri
Death Rates from Pneumonia and InfluenzaMissouri, 2003-2013
Rural residents die of pneumonia and influenza at a significantly higher rate than urban residents. The rates are 22.1 per 100,000 rural residents versus 19.1 per 100,000 urban residents for the 2003-2013 time period. Rural residents may not be as likely to receive the recommended vaccinations that prevent these infectious diseases due to limited access to health care services. For instance, one study found that rural residents are more dependent upon traditional clinic visits in order to receive influenza shots, while urban residents have more opportunities to receive flu shots through other venues.70
Between 2003 and 2013, pneumonia and influenza death rates steadily declined, by 36.1 percent among rural Missourians and 21.6 percent among urbanites. These decreases are statistically significant for both rural and urban residents. However, most of the rate declines occurred prior to 2010. Since then, both the rural and the urban death rates have remained fairly stable except for a slight increase among urban residents between 2012 and 2013 that nearly equalized the rural and urban rates, which were 18.9 and 18.5, respectively.
Pneumonia and Influenza
70Bennett, K.J., Pumkam, C., and Probst, J.C. (August 11, 2011). Rural-Urban Differences in the Location of Influenza Vaccine Administration. Vaccine 29(35), 5970-5977. Accessed July 27, 2015, from http://www.sciencedirect.com/science/article/pii/S0264410X11009029.doi:10.1016/j.vaccine.2011.06.038
Age-adjusted rates per 100,000 residents
Age-adjusted rates per 100,000 residents
Death Rates from Pneumonia and InfluenzaMissouri, 2003-2013

60health.mo.gov Health in Rural Missouri
The counties with the three highest rural pneumonia and influenza death rates are Cedar, Ripley and Texas counties. Cedar County is found in the Southwest BRFSS Region, while Ripley and Texas counties are located in the Southeast BRFSS Region. The counties with the two highest urban death rates from pneumonia and influenza are also located in the Southwest BRFSS Region (Jasper and Newton counties). The three lowest rural rates are found in three different BRFSS regions (the Northwest, Southwest and Southeast regions, respectively).
Rural Missourians visit the ER for pneumonia at a higher rate than urban Missourians (4.1 visits per 1,000 rural residents versus 3.2 visits per 1,000 urban residents). The same is true for influenza (2.1 rural versus 2.0 urban). The rural-urban difference in pneumonia ER visit rates is statistically significant, while the small difference in influenza ER visit rates is not.
Death Rates from Pneumonia and InfluenzaSelected Rural and Urban Missouri Counties, 2003-2013
Age-adjusted rates per 100,000 residents
Emergency Room Visit Rates for Pneumonia and InfluenzaMissouri, 2009-2013
Age-adjusted rates per 1,000 residents
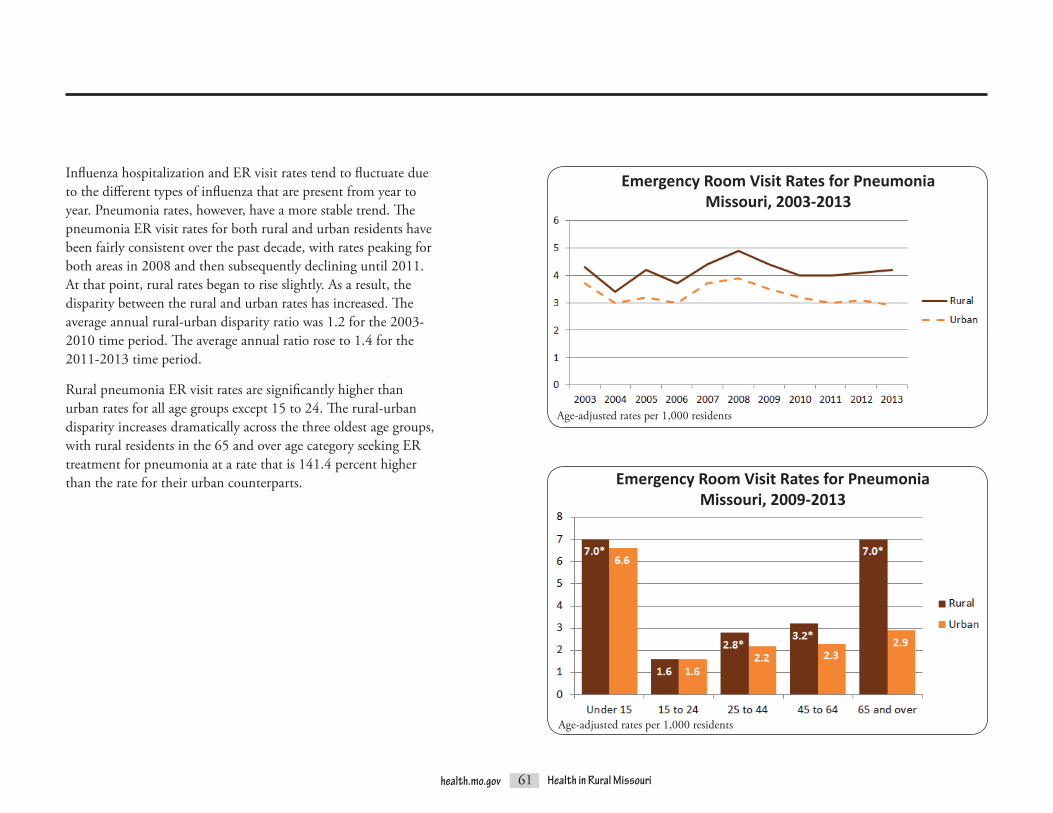
61health.mo.gov Health in Rural Missouri
Influenza hospitalization and ER visit rates tend to fluctuate due to the different types of influenza that are present from year to year. Pneumonia rates, however, have a more stable trend. The pneumonia ER visit rates for both rural and urban residents have been fairly consistent over the past decade, with rates peaking for both areas in 2008 and then subsequently declining until 2011. At that point, rural rates began to rise slightly. As a result, the disparity between the rural and urban rates has increased. The average annual rural-urban disparity ratio was 1.2 for the 2003-2010 time period. The average annual ratio rose to 1.4 for the 2011-2013 time period.
Rural pneumonia ER visit rates are significantly higher than urban rates for all age groups except 15 to 24. The rural-urban disparity increases dramatically across the three oldest age groups, with rural residents in the 65 and over age category seeking ER treatment for pneumonia at a rate that is 141.4 percent higher than the rate for their urban counterparts.
Emergency Room Visit Rates for PneumoniaMissouri, 2003-2013
Age-adjusted rates per 1,000 residents
Emergency Room Visit Rates for Pneumonia Missouri, 2009-2013
Age-adjusted rates per 1,000 residents

62health.mo.gov Health in Rural Missouri
Kidney DiseaseKidney disease, which includes nephritis, nephrosis and nephrotic syndrome, renders the kidneys unable to filter waste from the bloodstream.71,72 Nationally, chronic kidney diseases (CKDs) afflict approximately 11 percent of adults over the age of 20.73 Most kidney disease deaths in Missouri are “attributed to chronic renal failure.”74 During the 2003-2013 time period, the Missouri rural kidney disease death rate was 19.5 per 100,000 residents, which is 13.4 percent higher than the 17.2 rate for urban Missourians. This difference is statistically significant.
71Missouri Department of Health and Senior Services. Leading Causes of Death Profile – Definitions. Accessed August 24, 2015, from http://www.health.mo.gov/data/mica/CDP_MICA/CofDDefinitionofIndicators.html#I11. 72U.S. National Library of Medicine. (Last updated August 12, 2015). Kidney Diseases. MedlinePlus. Accessed August 24, 2015, from https://www.nlm.nih.gov/medlineplus/kidneydiseases.html. 73Fink, H.A., Ishani, A., Taylor, B.C., Greer, N.L., MacDonald, R., Rossini, D., … and Wilt, T.J. (August 2012). Final Evidence Summary: Chronic Kidney Disease (CKD): Screening. U.S. Preventive Services Task Force. Accessed August 24, 2015, from http://www.uspreventiveservicestaskforce.org/Page/Document/final-evidence-summary15/chronic-kidney-disease-ckd-screening. 74Missouri Department of Health and Senior Services. Leading Causes of Death Profile – Definitions. Accessed August 24, 2015, from http://www.health.mo.gov/data/mica/CDP_MICA/CofDDefinitionofIndicators.html#I11.
Death Rates from Kidney DiseaseMissouri, 2003-2013
Age-adjusted rates per 100,000 residents
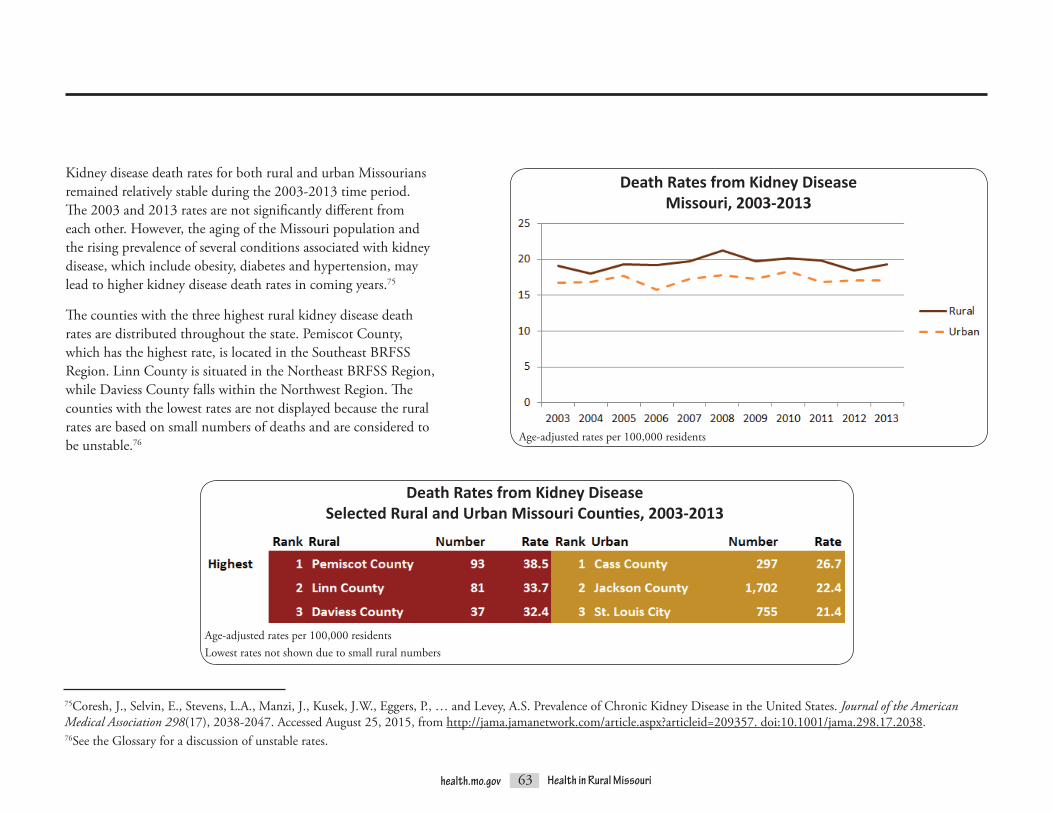
63health.mo.gov Health in Rural Missouri
Kidney disease death rates for both rural and urban Missourians remained relatively stable during the 2003-2013 time period. The 2003 and 2013 rates are not significantly different from each other. However, the aging of the Missouri population and the rising prevalence of several conditions associated with kidney disease, which include obesity, diabetes and hypertension, may lead to higher kidney disease death rates in coming years.75
The counties with the three highest rural kidney disease death rates are distributed throughout the state. Pemiscot County, which has the highest rate, is located in the Southeast BRFSS Region. Linn County is situated in the Northeast BRFSS Region, while Daviess County falls within the Northwest Region. The counties with the lowest rates are not displayed because the rural rates are based on small numbers of deaths and are considered to be unstable.76
75Coresh, J., Selvin, E., Stevens, L.A., Manzi, J., Kusek, J.W., Eggers, P., … and Levey, A.S. Prevalence of Chronic Kidney Disease in the United States. Journal of the American Medical Association 298(17), 2038-2047. Accessed August 25, 2015, from http://jama.jamanetwork.com/article.aspx?articleid=209357.doi:10.1001/jama.298.17.2038.76See the Glossary for a discussion of unstable rates.
Age-adjusted rates per 100,000 residents
Death Rates from Kidney DiseaseMissouri, 2003-2013
Death Rates from Kidney DiseaseSelected Rural and Urban Missouri Counties, 2003-2013
Age-adjusted rates per 100,000 residentsLowest rates not shown due to small rural numbers

64health.mo.gov Health in Rural Missouri
Emergency Room Visit Rates for Kidney Disease Missouri, 2009-2013
Age-adjusted rates per 1,000 residents
The rural and urban ER visit rates for kidney disease are not statistically significantly different, either overall or by gender. However, male rates are significantly higher than female rates for both rural and urban Missourians, mirroring the pattern seen for kidney disease death rates.
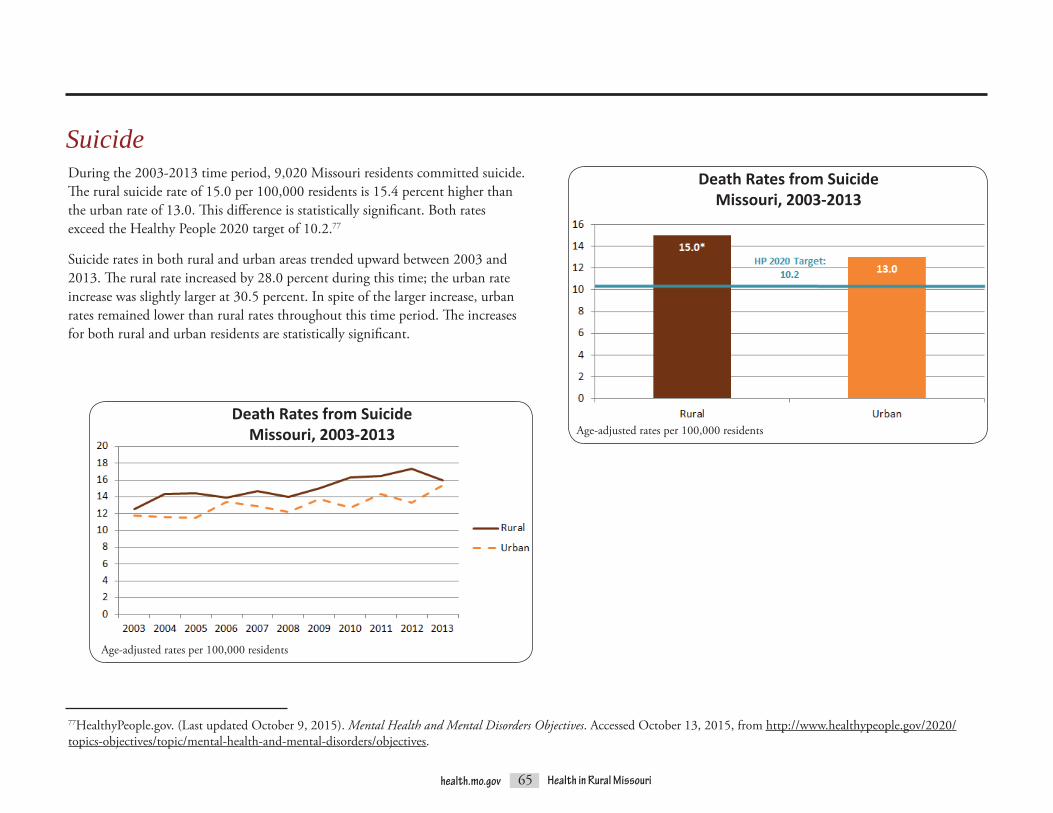
65health.mo.gov Health in Rural Missouri
During the 2003-2013 time period, 9,020 Missouri residents committed suicide. The rural suicide rate of 15.0 per 100,000 residents is 15.4 percent higher than the urban rate of 13.0. This difference is statistically significant. Both rates exceed the Healthy People 2020 target of 10.2.77
Suicide rates in both rural and urban areas trended upward between 2003 and 2013. The rural rate increased by 28.0 percent during this time; the urban rate increase was slightly larger at 30.5 percent. In spite of the larger increase, urban rates remained lower than rural rates throughout this time period. The increases for both rural and urban residents are statistically significant.
77HealthyPeople.gov. (Last updated October 9, 2015). Mental Health and Mental Disorders Objectives. Accessed October 13, 2015, from http://www.healthypeople.gov/2020/topics-objectives/topic/mental-health-and-mental-disorders/objectives.
Death Rates from SuicideMissouri, 2003-2013
Suicide
Death Rates from SuicideMissouri, 2003-2013 Age-adjusted rates per 100,000 residents
Age-adjusted rates per 100,000 residents

66health.mo.gov Health in Rural Missouri
Male suicide rates are significantly higher than female rates in both rural and urban areas of Missouri. Rural males have a significantly higher suicide rate than urban males. There is no statistically significant difference between rural and urban female suicide rates.
Rural suicide rates are higher than urban rates for all age groups except Under 15. Suicide rates for rural and urban residents under the age of 15 are equal. The highest rural suicide rate occurs among residents in the 25 to 44 age group, and this is the only age group for which the rural rate is significantly higher than the urban rate. The highest urban suicide rate occurs among residents ages 45 to 64.
Death Rates from SuicideMissouri, 2003-2013
Death Rates from SuicideMissouri, 2003-2013
Age-adjusted rates per 100,000 residents
Age-adjusted rates per 100,000 residents

67health.mo.gov Health in Rural Missouri
Affective DisordersThe affective, or mood, category of disorders includes a variety of mental illnesses, such as depressive, bipolar and schizoaffective disorders, as well as manic episodes.78 The rural Missouri ER visit rate for affective disorders is 2.5 per 1,000 residents compared to 1.8 for urban residents. This 38.9 percent difference is statistically significant. In contrast, the 2012-2013 Health in Rural Missouri Biennial Report found that affective disorder hospitalization rates were statistically significantly higher in urban areas.79
ER visit rates for affective disorders increased for both rural and urban residents in recent years. While the urban rate nearly doubled between 2003 and 2013, the rural rate grew at an even faster pace, increasing nearly 2.5 times, with much of the fastest growth occurring during more recent years. During the earlier part of the time period, from 2003 through 2009, the rural-urban disparity fluctuated greatly, but the rural rate was never more than 20 percent higher than the urban rate. (In 2006, the rates were equal, meaning there was no disparity. The greatest disparity for those years occurred in 2008, when the rural rate was 18.8 percent higher than the urban rate.) From 2010 through 2013, however, the annual rural rates were consistently at least 40 percent higher than the annual urban rates.
Emergency Room Visit Rates for Affective DisordersMissouri, 2009-2013
78Centers for Medicare and Medicaid Services (CMS). (2014). Affective Disorders. Road to 10: The Small Physician Practice’s Route to ICD-10. Accessed August 27, 2015, from http://www.roadto10.org/category/health-condition-categories/behavioral-health/affective-disorders/. 79Missouri Department of Health and Senior Services, Office of Primary Care and Rural Health. (2013). 2012-2013 Health in Rural Missouri Biennial Report. Accessed August 18, 2015, from http://health.mo.gov/living/families/ruralhealth/pdf/biennial2013.pdf.
Age-adjusted rates per 1,000 residents
Emergency Room Visit Rates for Affective DisordersMissouri, 2003-2013
Age-adjusted rates per 1,000 residents

68health.mo.gov Health in Rural Missouri
The counties with the four highest rural ER visit rates for affective disorders are all located in the Southeast BRFSS Region. The counties with the lowest rates are not displayed because the rural rates are based on small numbers of ER visits and are considered to be unstable.
Emergency Room Visit Rates for Affective DisordersSelected Rural and Urban Missouri Counties, 2009-2013
Rural affective disorder ER visit rates are significantly higher than urban rates for both genders. However, rural females have significantly higher rates than rural males, while there is no significant difference between the urban male and urban female rates. Rural and urban rates are equal for residents under 15 and 65 and over, but rural rates are significantly higher than urban rates for residents between the ages of 15 and 64.
Age-adjusted rates per 1,000 residentsLowest rates not shown due to small rural numbers
Emergency Room Visit Rates for Affective DisordersMissouri, 2009-2013
Age-adjusted rates per 1,000 residents
80Bostwick, J.M., and Pankratz, V.S. (December 2000). Affective Disorders and Suicide Risk: A Reexamination [Abstract]. American Journal of Psychiatry 157(12), 1925-1932. Accessed August 28, 2015, from http://www.ncbi.nlm.nih.gov/pubmed/11097952. 81Rihmer, Z. (2007). Suicide Risk in Mood Disorders. Current Opinion in Psychiatry 20(1), 17-22. Accessed August 28, 2015, from http://www.medscape.com/viewarticle/550672_2. 82Angst, F., Stassen, H.H., Clayton, P.J., and Angst, J. (April 2002). Mortality of Patients with Mood Disorders: Follow-up over 34-38 Years [Abstract]. Journal of Affective Disorders 68(2-3), 167-181. Accessed August 28, 2015, from http://www.ncbi.nlm.nih.gov/pubmed/12063145. 83Pompilo, M., Innamorati, M., Mosticoni, S., Lester, D., Del Casale, A., Ardenghi, G., … and Grispini, A. (2007). Suicide Attempts in Major Affective Disorders. Clinical Neuropsychiatry 4(3), 106-110. Accessed August 28, 2015, from http://www.clinicalneuropsychiatry.org/pdf/pompili2.pdf.
Multiple studies over decades indicate that persons suffering from affective disorders have much higher suicide rates than the general population.80,81,82 “An important feature of suicidal behavior among patients with major affective disorders is the high lethality of the suicide attempts (presumably reflecting both the intent and the method of suicide)…”83 As discussed earlier in the Health Status section of this report, suicide is the tenth leading cause of death in Missouri, with significantly higher rates among rural Missourians compared to urban Missourians.

69health.mo.gov Health in Rural Missouri
Acute BronchitisAcute bronchitis involves severe inflammation of the bronchial tubes, which carry oxygen to the lungs. It is often caused by a viral infection or by inhaling smoke or other irritants. The symptoms of this illness can last two to three weeks, and complications can include pneumonia. Acute bronchitis may be very serious for persons with lung disease.84 However, the death rate for acute bronchitis is very low. Only four Missouri residents died of acute bronchitis in 2013.
The rural ER visit rate for acute bronchitis is 6.4 per 1,000 residents, which is 14.3 percent higher than the urban rate of 5.6. This difference is statistically significant.
84National Cancer Institute. (Last reviewed September 9, 2014). Acute Bronchitis. WebMD. Accessed August 28, 2015, from http://www.webmd.com/lung/tc/acute-bronchitis-topic-overview.
Emergency Room Visit Rates for Acute BronchitisMissouri, 2009-2013
Age-adjusted rates per 1,000 residents

70health.mo.gov Health in Rural Missouri
The BRFSS estimates that statewide smoking rates declined each year between 2011 and 2013.85 (BRFSS trend data for earlier years are no longer comparable due to methodology changes that were implemented beginning with the 2011 survey.86) Although these declines are not statistically significant, they may be partially responsible for the drop in acute bronchitis ER visit rates over the past several years. The rural and urban ER visit rates for acute bronchitis fluctuated between 2003 and 2013, but the 2013 rates are roughly 15 percent lower than the 2003 rates in both areas. However, the rural rate remained higher than the urban rate throughout the 2003-2013 time period. The 2012-2013 Health in Rural Missouri Biennial Report found that rural residents smoke at higher rates than their urban counterparts, which may be one contributing factor to the higher rural ER visit rates for acute bronchitis.87 Furthermore, the downward trend in acute bronchitis ER visit rates may be reversing for rural residents. Rural rates reached a low of 5.8 in 2010 but since that time have increased significantly to 6.4 in 2013. Urban rates remained fairly stable between 2010 and 2012 but then decreased significantly between 2012 and 2013. As a result, the rural rate, which had been only 5.5 percent higher than the urban rate in 2010, is now 36.2 percent higher.
Age-adjusted rates per 1,000 residents
85Centers for Disease Control and Prevention (CDC). (Last updated June 23, 2015). BRFSS Prevalence and Trends Data. Accessed September 9, 2015, from http://www.cdc.gov/brfss/brfssprevalence/index.html. 86Centers for Disease Control and Prevention (CDC). (Last updated February 3, 2015). BRFSS Frequently Asked Questions (FAQs). Accessed September 9, 2015, from http://www.cdc.gov/brfss/about/brfss_faq.htm. 87Missouri Department of Health and Senior Services, Office of Primary Care and Rural Health. (2013). 2012-2013 Health in Rural Missouri Biennial Report. Accessed September 9, 2015, from http://health.mo.gov/living/families/ruralhealth/pdf/biennial2013.pdf.
Emergency Room Visit Rates for Acute BronchitisMissouri, 2003-2013

71health.mo.gov Health in Rural Missouri
Rural acute bronchitis ER visit rates are significantly higher than urban rates forbothmalesandfemales.AswithCOPD/bronchiectasis,asthmaandinfluenza ER visit rates, female rates for acute bronchitis are higher than male rates in both rural and urban areas. (Rural males have significantly higher ER visit rates for pneumonia than rural females, but there is no statistically significant difference between urban males and females.)
ER visit rates for acute bronchitis tend to decrease with age in both rural and urban areas. The rate for rural residents under the age of 15 is statistically significantly higher than the rate for any other age group in either rural or urban areas.
Two of the three highest rural ER visit rates for acute bronchitis are found in the Southeast BRFSS Region, in Dunklin and Cape Girardeau counties. The third, Dent County, is located in the Central Region but borders the Southeast Region. The counties with the three highest urban rates are all located in the Southwest Region. The counties with the three lowest rural rates are all part of the Northeast Region, while the counties with the three lowest urban rates are all part of the St. Louis Metro Region.
Emergency Room Visit Rates for Acute BronchitisMissouri, 2009-2013
Emergency Room Visit Rates for Acute BronchitisSelected Rural and Urban Missouri Counties, 2009-2013
Age-adjusted rates per 1,000 residents
Age-adjusted rates per 1,000 residents

72health.mo.gov Health in Rural Missouri
Urinary StonesUrinary stones are also referred to as calculi of the urinary tract. They may form anywhere in the urinary tract when a person’s urine contains certain substances in greater amounts than the body is able to dilute. Most stones form in the kidneys and are therefore referred to as kidney stones. The substance that most commonly creates urinary stones is calcium. Although urinary stones often cause extreme and sudden pain, they typically cause no lasting damage.88,89 However, “kidney stones increase the risk of developing chronic kidney disease.”90 Kidney disease is the ninth leading cause of death for both rural and urban Missourians.
In Missouri, rural residents visit the ER for urinary stones at significantly higher rates than urban residents (3.9 visits per 1,000 rural residents versus 3.0 visits per 1,000 urban residents, a 30.0 percent difference).
88Preminger, Glenn M. Stones in the Urinary Tract (Urolithiasis). Merck Manuals Consumer Version. Accessed August 28, 2015, from http://www.merckmanuals.com/home/kidney-and-urinary-tract-disorders/stones-in-the-urinary-tract/stones-in-the-urinary-tract. 89Mayo Clinic Staff. (February 26, 2015). Kidney Stones. Mayo Clinic. Accessed August 28, 2015, from http://www.mayoclinic.org/diseases-conditions/kidney-stones/basics/definition/con-20024829. 90National Kidney Foundation. Kidney Stones. National Kidney Foundation. Accessed August 28, 2015, from https://www.kidney.org/atoz/content/kidneystones.
Age-adjusted rates per 1,000 residents
Emergency Room Visit Rates for Urinary StonesMissouri, 2003-2013

73health.mo.gov Health in Rural Missouri
Urinary stone ER visit rates are increasing in both rural and urban areas of Missouri. The disparity between the two areas is also growing. Rural rates increased by 48.1 percent between 2003 and 2013, while urban rates increased by only 16.7 percent. Potential risk factors for kidney stones “include drinking too little water, exercise (too much or too little), obesity, weight loss surgery or eating food with too much salt or sugar. Infections and family history might be important in some people. Eating too much fructose correlates with increasing risk of developing a kidney stone. Fructose can be found in table sugar and high fructose corn syrup… Other diseases such as high blood pressure, diabetes and obesity may increase the risk for kidney stones.”91 As rates for several of these risk factors continue to increase, ER visit rates for urinary stones are likely to increase as well.
Rural urinary stone ER visit rates are significantly higher than urban rates for both genders and all age groups except under 15. (The under 15 rural and urban rates are equal.) Male rates for ER visits related to urinary stones are higher than female rates. Rates peak among residents in the 25 to 44 age group in both rural and urban areas.
91National Kidney Foundation. Kidney Stones. National Kidney Foundation. Accessed August 28, 2015, from https://www.kidney.org/atoz/content/kidneystones.
Emergency Room Visit Rates for Urinary StonesMissouri, 2003-2013
Age-adjusted rates per 1,000 residents
Age-adjusted rates per 1,000 residents
Emergency Room Visit Rates for Urinary StonesMissouri, 2009-2013
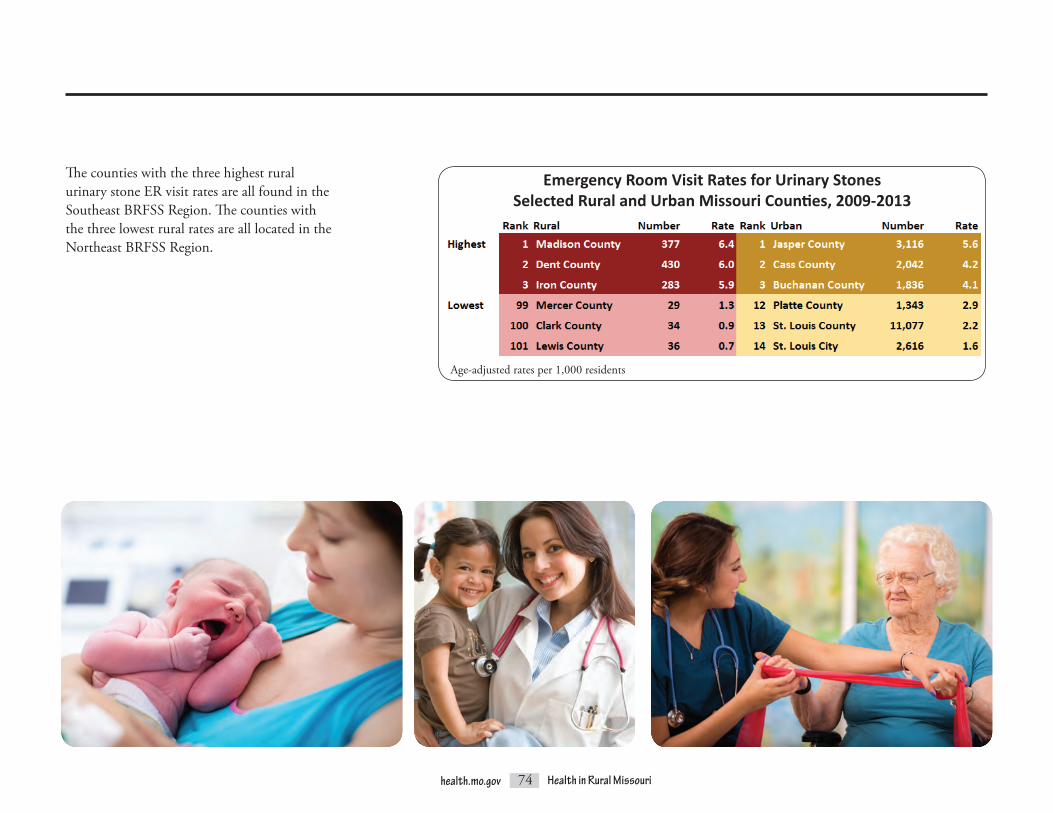
74health.mo.gov Health in Rural Missouri
The counties with the three highest rural urinary stone ER visit rates are all found in the Southeast BRFSS Region. The counties with the three lowest rural rates are all located in the Northeast BRFSS Region.
Emergency Room Visit Rates for Urinary StonesSelected Rural and Urban Missouri Counties, 2009-2013
Age-adjusted rates per 1,000 residents

75health.mo.gov Health in Rural Missouri
Gastritis and DuodenitisGastritis and duodenitis are diseases of the upper gastrointestinal tract. Gastritis involves irritation of the lining of the stomach, while duodenitis involves inflammation of the first part of the small intestine, which is just beneath the stomach. “Both gastritis and duodenitis have the same causes …,” which include bacteria, alcohol use, stress and use of certain medications, among other reasons, and both may be acute or chronic conditions.92 The rural gastritis and duodenitis ER visit rate is 30.8 percent higher than the urban rate (1.7 per 1,000 rural residents versus 1.3 per 1,000 urban residents), a significant disparity.
The rural rate remained significantly higher than the urban rate throughout the 2003-2013 time period. The 2013 urban rate is significantly lower than the 2003 urban rate, but the 2003 and 2013 rural rates are not significantly different from each other. As a result, the disparity between the rural and urban rates increased over these years. In 2003, the rural rate was 1.2 times higher than the urban rate; by 2013, it was 1.4 times higher. Emergency Room Visit Rates for Gastritis and Duodenitis
Missouri, 2003-2013
Emergency Room Visit Rates for Gastritis and DuodenitisMissouri, 2009-2013
Age-adjusted rates per 1,000 residents
Age-adjusted rates per 1,000 residents
92Kivi,R.(July20,2012).Gastritis/Duodenitis.Healthline. Accessed August 28, 2015, from http://www.healthline.com/health/gastritis-duodenitis#Overview1.

76health.mo.gov Health in Rural Missouri
Rural gastritis and duodenitis ER visit rates are significantly higher than urban rates for both gender and all age groups. Rates are higher among females than males in both rural and urban areas. Rates peak for the 15 to 24 age group in both settings. Rural and urban rates decrease substantially for ages 45 and older.
Emergency Room Visit Rates for Gastritis and DuodenitisMissouri, 2009-2013
Age-adjusted rates per 1,000 residents

77health.mo.gov Health in Rural Missouri
ER visits for disorders of the teeth and jaws include complaints such as dental abscesses and toothaches rather than injuries to the mouth and teeth. Therefore, these ER visits are often described as nontraumatic and preventable; dental experts assert that the majority of these complaints could be best addressed in a dental office rather than in a hospital setting. Medical professionals may provide pain relievers and antibiotics but are not generally able to perform necessary extractions or restorations needed to solve underlying dental problems. The rural Missouri ER visit rate for nontraumatic dental complaints is 12.2 per 1,000 residents compared to 9.2 for urban residents. This 32.6% difference is statistically significant.
Emergency Room Visit Rates for Nontraumatic Dental ComplaintsMissouri, 2009-2013
Age-adjusted rates per 1,000 residents
ER visit rates for nontraumatic dental complaints significantly increased for both rural and urban residents in recent years. In both areas, the 2013 rate was approximately 57 percent higher than the 2003 rate.
Emergency Room Visit Rates for Nontraumatic Dental ComplaintsMissouri, 2003-2013
Age-adjusted rates per 1,000 residents
Nontraumatic Dental Complaints

78health.mo.gov Health in Rural Missouri
The counties with the highest rural ER visit rates for nontraumatic dental complaints are Washington, St. Francois and Iron, which are all located between the St. Louis area and the Bootheel. The counties with the lowest rural rates are all found in the Northeast BRFSS Region. The counties with the highest urban rates are all located in the Southwest BRFSS Region. Three of the counties with the lowest urban rates fall into the St. Louis Metro BRFSS Region, while one (Platte County) is included in the Kansas City Metro BRFSS Region.
Nontraumatic dental ER visit rates are significantly higher for rural residents in the 15 to 24 and 25 to 44 age groups than they are for urban residents in those age groups. Rural rates are significantly lower than urban rates for the 45 to 64 and 65 and over age groups. However, visits by residents in the 45 and over age groups make up only 14 percent of total nontraumatic dental ER visits; visits by residents ages 15 to 44 make up 81 percent of these visits. Visits by residents under the age of 15 make up only 4 percent of total nontraumatic dental ER visits. The rural and urban rates for these youngest residents are not significantly different.
The use of ER visits for nontraumatic dental complaints has been a topic of discussion nationally and within Missouri for some time. According to national estimates, an ER visit for a dental complaint costs about $300. When the 289,633 ER visits for nontraumatic dental complaints that occurred between 2009 and 2013 are considered in total, the estimated costs are over $86.9 million, or about $17.4 million per year.
Emergency Room Visit Rates for Nontraumatic Dental ComplaintsSelected Rural and Urban Missouri Counties, 2009-2013
Age-adjusted rates per 1,000 residents
Emergency Room Visit Rates for Nontraumatic Dental ComplaintsMissouri, 2009-2013
Age-adjusted rates per 1,000 residents

79health.mo.gov Health in Rural Missouri
There are many possible explanations for why ER visits for nontraumatic dental complaints are higher among residents of rural areas. Access to a dental office or clinic is an important factor in preventing poor oral health and adequately addressing urgent dental problems. In Missouri, 99 counties plus areas within the City of St. Louis and Kansas City have been designated as Dental Health Professional Shortage Areas (DHPSAs). Only nine rural counties in Missouri are not DHPSAs.93
It is recommended that most individuals should visit a dentist at least once per year. However, only about 62% of Missouri’s adults visited a dentist in the last year, according to the 2012 BRFSS. Annual dental visit rates are lower among adults in the lowest annual income category of less than $15,000 than any other income category; only 37 percent of adults in this income bracket report visiting a dentist within the past year. As stated previously in this report, poverty rates are higher among rural Missourians. Therefore, it is expected that dental visit rates would be lower in rural counties, and this is confirmed by examining trends in annual dental visit rates among adults by geography.94
93Missouri Department of Health and Senior Services, Missouri Oral Health Program. (2014). Oral Health in Missouri 2014: A Burden Report by the Missouri Department of Health and Senior Services. Accessed December 21, 2015, from http://health.mo.gov/living/families/oralhealth/pdf/2014OralHealthReport.pdf. 94Missouri Department of Health and Senior Services, Office of Epidemiology. (2011). Missouri County-Level Study. Dental visit data were provided by special request.

80health.mo.gov Health in Rural Missouri
Maternal, infant and child health indicators can also be used to measure the health status of a community. The health of mothers, infants and children is important because “their well-being determines the health of the next generation and can help predict future public health challenges for families, communities, and the health care system.”95
Note: On the bar charts in this chapter, asterisks indicate if either the rural or urban rate is statistically significantly high compared to the other geography. See the Glossary for a description of statistical significance.
95HealthyPeople.gov. (Last updated September 1, 2015). Maternal, Infant, and Child Health Overview. Accessed September 3, 2015, from http://www.healthypeople.gov/2020/topicsobjectives2020/overview.aspx?topicId=26.
MATERNAL, INFANT AND CHILD HEALTH
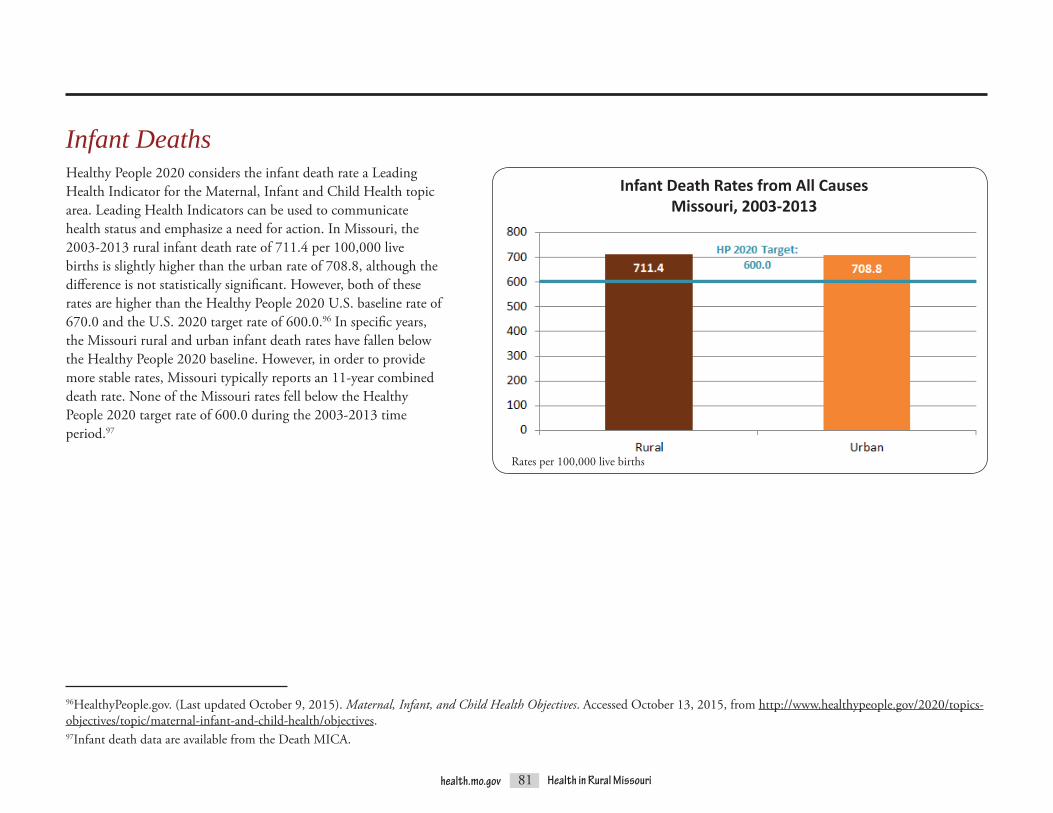
81health.mo.gov Health in Rural Missouri
Infant DeathsHealthy People 2020 considers the infant death rate a Leading Health Indicator for the Maternal, Infant and Child Health topic area. Leading Health Indicators can be used to communicate health status and emphasize a need for action. In Missouri, the 2003-2013 rural infant death rate of 711.4 per 100,000 live births is slightly higher than the urban rate of 708.8, although the difference is not statistically significant. However, both of these rates are higher than the Healthy People 2020 U.S. baseline rate of 670.0 and the U.S. 2020 target rate of 600.0.96 In specific years, the Missouri rural and urban infant death rates have fallen below the Healthy People 2020 baseline. However, in order to provide more stable rates, Missouri typically reports an 11-year combined death rate. None of the Missouri rates fell below the Healthy People 2020 target rate of 600.0 during the 2003-2013 time period.97
96HealthyPeople.gov. (Last updated October 9, 2015). Maternal, Infant, and Child Health Objectives. Accessed October 13, 2015, from http://www.healthypeople.gov/2020/topics-objectives/topic/maternal-infant-and-child-health/objectives. 97Infant death data are available from the Death MICA.
Infant Death Rates from All CausesMissouri, 2003-2013
Rates per 100,000 live births

82health.mo.gov Health in Rural Missouri
Neural Tube DefectsNeural tube defects (NTDs) are birth defects affecting the brain and spinal column. NTDs range widely in severity from mild forms of spina bifida that are not disabling to rare forms like anencephaly, in which a portionofthebrainand/orskullfailstodevelopandtheinfantiseitherstillborn or dies within a few hours of birth.98 The risk of NTDs can be greatly reduced through the use of folic acid prior to pregnancy. The CDC, the March of Dimes and the American Pregnancy Association recommend that all women of childbearing age consume at least 0.4 micrograms of folic acid daily. Women with a previous NTD pregnancy are at much higher risk and require a higher dosage of folic acid (4.0 micrograms).99,100,101
Statewide, NTDs occurred in 253 births during the 2007-2011 time period.102 The rural NTD rate was 7.5 per 10,000 live births. This rate is 29.3 percent higher than the urban rate of 5.8; however, this difference is not statistically significant.
98National Institutes of Health, Eunice Kennedy Shriver National Institute of Child Health and Human Development. (Last updated November 30, 2012). Neural Tube Defects (NTDs): Condition Information. Accessed September 14, 2015, from http://www.nichd.nih.gov/health/topics/ntds/conditioninfo/Pages/default.aspx. 99March of Dimes. (Last reviewed November 2012). Birth Defects: Neural Tube Defects Overview. Accessed September 14, 2015, from http://www.marchofdimes.org/baby/neural-tube-defects.aspx. 100Centers for Disease Control and Prevention (CDC). (Last updated January 5, 2015). Folic Acid and Birth Defects. CDC Features. Accessed September 14, 2015, from http://www.cdc.gov/features/folicacidbenefits/. 101American Pregnancy Association. (Last updated July 2015). Folic Acid. Accessed September 14, 2015, from http://americanpregnancy.org/pregnancy-health/folic-acid/.102Missouri state and county neural tube defect rates are available from the Infant Health Profile.
Neural Tube Defect RatesMissouri, 2007-2011
Rates per 10,000 live births

83health.mo.gov Health in Rural Missouri
Teenage Pregnancy“Teenage pregnancy including birth is a serious public concern in the U.S. and Missouri. Teenage pregnancies are associated with an increased risk of poor social, economic and health outcomes for both the mother and the child.”103 In Missouri, 11.5 percent of rural pregnancies and 9.0 percent of urban pregnancies during the 2009-2013 time period occurred among females less than 20 years of age. The rural teenage pregnancy rate of 43.9 per 1,000 female residents ages 15-19 is statistically significantly higher than the urban teenage pregnancy rate of 40.2.104
103Missouri Department of Health and Senior Services. Affordable Care Act Maternal, Infant and Early Childhood Home Visiting Program Needs Assessment. Accessed September 14, 2015, from http://health.mo.gov/atoz/pdf/hvneedsassessment.pdf. 104Pregnancy and live birth (fertility) rates are available from the Fertility Rate MICA.
Teenage Pregnancy RatesMissouri, 2009-2013
Rates per 1,000 female residents ages 15 - 19

84health.mo.gov Health in Rural Missouri
Many of the highest county teenage pregnancy rates are clustered in the southeast portion of the state. Mississippi County has the highest teenage pregnancy rate at 94.2, meaning that over 9 percent of females between the ages of 15 and 19 become pregnant. Smaller clusters of significantly high rural rates are found in central Missouri, southwest Missouri, north central Missouri and south of the Kansas City area. Most counties, both rural and urban, with significantly low rates are located near urban areas. The largest cluster of significantly low rates is found in central Missouri around Columbia and Jefferson City.
Based on rates per 1,000 female residents ages 15-19Statistical significance compared to the state using 95 percent confidence intervals
Teenage Pregnancy RatesMissouri, 2009-2013

85health.mo.gov Health in Rural Missouri
Smoking during pregnancy is associated with major health risks for both mother and child. Women who smoke during pregnancy experience higher rates of miscarriage and low birth weight and preterm deliveries. Their infants experience higher rates of stillbirth and death during the first 27 days of life. Multiple studies over the past several decades indicate that smoking during pregnancy is also associated with a variety of birth defects, including gastrointestinal system deformities, eye defects, oral clefts and clubfoot.105
The risks associated with smoking during pregnancy can be reduced if the mother quits smoking, particularly in the early stages of pregnancy. A 1990 report by the U.S. Surgeon General found that “women who quit smoking during the first 3-4 months of pregnancy and remain abstinent throughout pregnancy reduce their risk of having a low birth weight baby to that of women who never smoked.”106 More recent research continues to highlight the importance of smoking cessation during pregnancy. For example, a 2007-2008 study of mothers in San Bernardino County, CA, found that, relative to mothers smoking during pregnancy, women who quit smoking during pregnancy reduced their risk of having a low birth weight or preterm birth to nearly the same amount as women who had never smoked at all.107
During the 2009-2013 time period, rural Missouri mothers reported that they smoked during pregnancy in nearly one-quarter (24.5 percent) of rural live births.108 This rural rate is statistically significantly higher than the 14.1 percent rate reported for urban live births over the same timeframe. Between 2003 and 2013, neither the rural nor the urban rate of smoking during pregnancy exhibited any statistically significant change; both rates were remarkably stable during this period.
Smoking During Pregnancy
105Hackshaw, A., Rodeck, C., and Boniface, S. (September-October 2011). Maternal Smoking in Pregnancy and Birth Defects: A Systematic Review Based on 173 687 Malformed Cases and 11.7 Million Controls [Abstract]. Human Reproduction Update 17(5), 589-604. Accessed September 15, 2015, from http://humupd.oxfordjournals.org/content/early/2011/07/09/humupd.dmr022.full. 106Centers for Disease Control and Prevention (CDC). (Last updated March 8, 2011). PNSS Health Indicators. Pediatric and Pregnancy Nutrition Surveillance System. Accessed September 15, 2015, from http://www.cdc.gov/pednss/what_is/pnss_health_indicators.htm#Smoking/Drinking. 107Batech, M., Tonstad, S., Job, J.S., Chinnock, R., Oshiro, B., Allen Merritt, T., … and Singh, P.N. Estimating the Impact of Smoking Cessation During Pregnancy: The San Bernardino County Experience [Abstract]. Journal of Community Health 38(5), 838-846. Accessed September 15, 2015, from http://www.ncbi.nlm.nih.gov/pubmed/23553684. 108Smoking during pregnancy rates are available from the Birth MICA.
Smoking During Pregnancy RatesMissouri, 2009-2013
Rates per 100 live births

86health.mo.gov Health in Rural Missouri
Rural rates of smoking during pregnancy remained significantly higher than urban rates across all age groups. The highest 2009-2013 rate was reported among live births to rural mothers ages 18 to 19; pregnancy smoking was reported in 32.0 percent, or nearly one-third, of live births to mothers in this age group. The highest urban rate of 21.7 percent was reported for live births to mothers in the 20 to 21 age group. In both rural and urban areas, smoking rates decline among live births to mothers ages 25 and older. Rates for live births to mothers ages 15 to 17 years are more similar to those of older mothers than to the older teenage group.
In 55 rural counties – more than half of the counties designated as rural in this report – pregnancy smoking was reported for more than 25 percent of live births during the 2009-2013 time period; 17 of these counties had rates of 30 percent or higher. No urban county experienced a rate this high. The three highest rural rates were found in the adjacent counties of Iron (37.0 percent), Wayne (36.1 percent) and Madison (33.5 percent). Several of the other rural counties with extremely high rates are also located in a contiguous block with these counties. They include Butler and Crawford (tied for the 5th highest rural rate), St. Francois (8th highest) and Dent and Washington (tied for 10th). St. Louis County, with pregnancy smoking reported for only 9.0 percent of live births, has the lowest county rate in Missouri and is the only county with a rate below 10.0 percent.
Smoking During Pregnancy RatesMissouri, 2009-2013
Rates per 100 live births
Rates of Smoking During PregnancySelected Rural and Urban Missouri Counties, 2009-2013
Rates per 100 live births

87health.mo.gov Health in Rural Missouri
One of the goals of Healthy People 2020 is to increase the proportion of infants who are ever breastfed from the U.S. 2007-2009 baseline of 74.0 percent to 81.9 percent, citing breast milk as “the most complete form of nutrition for most infants, with a range of benefits for their health, growth, immunity and development.”109,110 “The American Academy of Pediatrics (AAP) recommends that breastfeeding continue for at least 12 months, and thereafter for as long as mother and baby desire. The World Health Organization recommends continued breastfeeding up to 2 years of age or beyond.”111 Breastfeeding offers benefits to both mother and child even when breastfeeding is not
Breastfeedingcontinued for the recommended length of time. Breastfeeding promotes more rapid recovery for the mother following delivery and may reduce postpartum depression. Breastfeeding also reduces the risk of multiple diseases and health conditions for both mother and infant.112 Early breastfeeding is particularly important because it exposes infants to colostrum, which is the first milk produced by the mother. Colostrum contains nutrients and antibodies that protect the newborn from infections.113
Breastfeeding rates are typically measured using surveys of mothers. For example, the Missouri Pregnancy Risk Assessment
Monitoring System (PRAMS) surveys a random sample of new mothers regarding their health status and behaviors before, during and after pregnancy. Several questions ask mothers about breastfeeding practices. The Missouri Child Health Assessment Survey (MoCHAPS) is a two-year follow-up to the PRAMS survey. It assesses the health status of mothers and their two-year-old toddlers and provides another source of Missouri breastfeeding rates. Both PRAMS and MoCHAPS data are weighted for statewide, rather than local, comparison.114,115
109HealthyPeople.gov. (Last updated September 4, 2015). Maternal, Infant, and Child Health Objectives. Accessed September 4, 2015, from http://www.healthypeople.gov/2020/topics-objectives/topic/maternal-infant-and-child-health/objectives. 110HealthyPeople.gov. (Last updated September 4, 2015). Maternal, Infant, and Child Health Overview. Accessed September 4, 2015, from http://www.healthypeople.gov/2020/topics-objectives/topic/maternal-infant-and-child-health. 111Centers for Disease Control and Prevention (CDC). (Last updated June 16, 2015). Breastfeeding Frequently Asked Questions (FAQs). Accessed September 4, 2015, from http://www.cdc.gov/breastfeeding/faq/index.htm. 112American Academy of Pediatrics. (March 1, 2012). Policy Statement: Breastfeeding and the Use of Human Milk. Pediatrics 129(3), e827-e841. Accessed September 4, 2015, from http://pediatrics.aappublications.org/content/129/3/e827.full. 113Office on Women’s Health. (Last updated July 21, 2014). Breastfeeding: Why Breastfeeding Is Important. Accessed September 4, 2015, from http://www.womenshealth.gov/breastfeeding/breastfeeding-benefits.html. 114Missouri Department of Health and Senior Services, Division of Community and Public Health. Missouri Pregnancy Risk Assessment Monitoring System. Accessed September 4, 2015, from http://www.health.mo.gov/data/prams/. PRAMS data for Missouri are available through the PRAMStat tool at http://www.cdc.gov/prams/pramstat/index.html. 115Missouri Department of Health and Senior Services, Division of Community and Public Health. Missouri Child Health Assessment Program Survey (MoCHAPS). Accessed September 4, 2015, from http://health.mo.gov/data/mochaps/.

88health.mo.gov Health in Rural Missouri
WIC Program Infant Participation RatesMissouri, 2013
WIC Program Infant Ever Breastfed RatesMissouri, 2013
Rates per 100 WIC Program infant participants with known ever breastfed status
Rates per 100 live births
In Missouri, the most robust source of local breastfeeding data is usually the Women, Infants and Children (WIC) Program, “a special supplemental nutrition program which provides services to pregnant women, new mothers, infants and children up to their 5th birthday based on nutritional risk and income eligibility.” One of the primary services provided by WIC is breastfeeding promotion and support.116 More than half of all infants residing in Missouri in 2013 (56.8 percent) received services through WIC. Rural infants participate in WIC at significantly higher rates than urban infants (66.6 percent versus 51.4 percent).117
The breastfeeding data available through the WIC Program do not represent all infants, only those who are both eligible for and participating in the program. At an infant’s initial WIC certification visit, which may occur at any point after birth but prior to the infant’s first birthday, the mother or other caregiver is asked if the infant has ever been breastfed. According to these reports, urban infants enrolled in the WIC Program are breastfed at significantly higher rates than rural infants (69.2 percent of WIC urban infants versus 65.7 percent of rural WIC infants).
116Missouri Department of Health and Senior Services, WIC and Nutrition Services. Welcome to WIC. Accessed September 4, 2015, from http://www.health.mo.gov/living/families/wic/index.php.117WIC data for years 2009 and later are not currently posted on the MICA website but will be added at a later date. However, WIC infant participation and ever breastfed rates for Missouri and its 115 counties are available through the Infant Health Profile at http://www.health.mo.gov/data/CommunityDataProfiles/index.html.

89health.mo.gov Health in Rural Missouri
Both PRAMS and MoCHAPS also report higher prevalence of breastfeeding initiation by mothers in urban counties, which is consistent with the WIC Program ever breastfed rates.118 However, the breastfeeding initiation percentages from PRAMS and MoCHAPS are slightly higher than the ever breastfed percentages from the WIC Program, possibly due to the different populations included in each dataset. (PRAMS and MoCHAPS randomly sample the entire population of new Missouri mothers, which includes mothers of WIC Program infant participants as well as mothers of infants not enrolled in the WIC Program.)
Prevalence of Breastfeeding Initiation by MothersMissouri, 2007-2012
Estimated percentage of mothers
118PRAMS and MoCHAPS breastfeeding rates were calculated for the rural and urban categories used in this report by David McBride and Rebecca Chitima-Matsiga in the Office of Epidemiology.
WIC Program Infant Ever Breastfed RatesMissouri, 2009-2013
Rates per 100 WIC Program infant participants with known ever breastfed status
In Missouri, both the rural and urban WIC Program infant ever breastfed rates rose significantly each year between 2009 and 2012. Between 2012 and 2013, the urban rate continued to rise significantly. The rural rate also rose slightly but not significantly so.

90health.mo.gov Health in Rural Missouri
HEALTH BEHAVIORS AND RISK FACTORS
Several common health behaviors and risk factors affect many of the health conditions discussed in the Health Status section of this report. The Missouri Department of Health and Senior Services, with assistance and support from the CDC, conducts the BRFSS survey to produce estimates of the prevalence of many health behaviors and risk factors related to chronic diseases.119 Annual estimates are prepared for Missouri and for seven regions within Missouri. The Office of Epidemiology within the Missouri Department of Health and Senior Services completed a special analysis in order to provide rates using the rural and urban categories designated in this report.120
Note: On the bar charts in this chapter, asterisks indicate if either the rural or urban rate is statistically significantly high compared to the other geography. See the Glossary for a description of statistical significance.
119See the Glossary for a description of the BRFSS.120Rural and urban estimates were prepared by Shumei Yun and Arthur Pashi in the Office of Epidemiology.

91health.mo.gov Health in Rural Missouri
Fair or Poor General Health StatusBRFSS respondents are asked to evaluate their own health status and rate it as “excellent, very good, good, fair or poor.”121 “Self-assessed health status has been validated as a useful indicator of health for a variety of populations and allows for broad comparisons across different conditions and populations.”122 It is also “a good predictor of future disability, hospitalization and mortality.”123 Based on data collected by the BRFSS, 20.1 percent of rural Missouri adults are estimated to have fair or poor general health status compared to 15.7 percent of urban Missouri adults. This difference is statistically significant.
121Pashi, A., Wilson, J.S., and Yun, S. (March 2015). Missouri Behavioral Risk Factor Surveillance System Annual Data Report. Jefferson City, MO: Missouri Department of Health and Senior Services, Office of Epidemiology. Accessed September 16, 2015, from http://www.health.mo.gov/data/brfss/2013datareport.pdf. 122HealthyPeople.gov. (Last updated September 16, 2015). General Health Status. Accessed September 16, 2015, from http://www.healthypeople.gov/2020/about/foundation-health-measures/General-Health-Status. 123Boardman, M., and Hoff, S. (Last updated June 1, 2012). Self-reported Health Status. In Washington State Department of Health, Health of Washington State. Accessed September 16, 2015, from http://www.doh.wa.gov/Portals/1/Documents/5500/GHS-SRHS2012.pdf.
Estimated percentage of adultsSource: Missouri Behavioral Risk Factor Surveillance System, 2014
Prevalence of Fair or Poor General Health StatusMissouri, 2014

92health.mo.gov Health in Rural Missouri
124Centers for Disease Control and Prevention (CDC). (Last updated April 16, 2015). Winnable Battles. Accessed September 18, 2015, fromhttp://www.cdc.gov/winnablebattles/index.html. 125Centers for Disease Control and Prevention (CDC). (Last updated June 9, 2015). Winnable Battles: Tobacco Use. Accessed September 18, 2015, from http://www.cdc.gov/winnablebattles/tobacco/index.html. 126Centers for Disease Control and Prevention (CDC). (Last updated September 6, 2011). Adult Smoking in the U.S. CDC Vital Signs. Accessed September 18, 2015, from http://www.cdc.gov/vitalsigns/AdultSmoking/index.html. 127HealthyPeople.gov. (Last updated September 18, 2015). Tobacco Use Objectives. Accessed September 18, 2015, from http://www.healthypeople.gov/2020/topics-objectives/topic/tobacco-use/objectives. 128Centers for Disease Control and Prevention (CDC). (Last updated July 16, 2014). Prevalence Data & Data Analysis Tools. Accessed September 18, 2015, from http://www.cdc.gov/brfss/data_tools.htm. The 2014 U.S. estimate is not currently available.
The CDC classifies a reduction in tobacco use as a Winnable Battle. “Winnable Battles are public health priorities with large-scale impact on health and known effective strategies to address them.”124 Tobacco use was selected because it “is a major preventable cause of premature death and disease.”125 The CDC estimates that half of all U.S. adults who continue to smoke will ultimately die from a smoking-related cause.126 Healthy People 2020 has set a goal of reducing the smoking rate to 12.0 percent by the end of the decade.127 The BRFSS survey estimates that 19.0 percent of U.S. adults were currently smoking as of 2013.128 The 2014 Missouri rate is even higher at 20.6 percent; however, smoking rates within Missouri vary across the state. The rural rate of 25.1 percent is significantly higher than the urban rate of 18.7.
Prevalence of Current SmokingMissouri and U.S.
Estimated percentage of adultsSource: Behavioral Risk Factor Surveillance System
Tobacco Use

93health.mo.gov Health in Rural Missouri
Healthy People 2020 states that “good nutrition, physical activity and a healthy body weight are essential parts of a person’s overall health and well-being.”129 According to the BRFSS, rural Missouri residents lag behind their urban counterparts on these three aspects of health. In 2014, 29.5 percent of rural Missourians reported no leisure-time physical activity in the past month. This compares to only 23.0 percent of urban Missourians, a statistically significant difference. As of 2013, a significantly higher percentage of rural Missourians reported eating fewer than five fruits and vegetables per day compared to urban Missourians (88.6 percent of rural residents versus 85.0 of urban residents).130
Physical activity and nutrition as well as genetics, certain medications and other factors play a role in obesity, which is defined as a body mass index (BMI) of 30.0 or greater.131 Obesity is related to an increased risk of heart disease, stroke, diabetes, osteoarthritis, certain types of cancer, some mental illnesses and several other health conditions.132 The 2014 BRFSS obesity estimate for rural Missouri residents is 32.5 percent compared to 29.8 percent for urban residents. This difference is not statistically significant.
Physical Activity, Nutrition and Obesity
129HealthyPeople.gov. (Last updated September 16, 2015). Nutrition, Physical Activity, and Obesity Overview & Impact. Accessed September 16, 2015, from http://www.healthypeople.gov/2020/leading-health-indicators/2020-lhi-topics/Nutrition-Physical-Activity-and-Obesity. 130The BRFSS survey questions regarding consumption of fruits and vegetables were not included in the 2014 survey.131See the Glossary for a more detailed description of body mass index and the survey questions used to derive the physical activity, nutrition and obesity indicators.132Centers for Disease Control and Prevention (CDC). (Last updated June 16, 2015). Adult Obesity Causes and Consequences. Accessed September 16, 2015, from http://www.cdc.gov/obesity/adult/causes.html.
Prevalence of Selected Health Behaviors and Risk FactorsMissouri
Estimated percentage of adultsSource: Missouri Behavioral Risk Factor Surveillance System

94health.mo.gov Health in Rural Missouri
Lack of seatbelt usage is strongly correlated with roadway deaths and serious injuries. The World Health Organization estimates that wearing a seatbelt can reduce the risk of fatality or serious injury for front seat passengers by up to 50 percent and for back seat passengers by nearly 75 percent.133 Although Missouri does have seatbelt laws, the state does not have a primary enforcement law, which means that drivers cannot be pulled over or ticketed solely for failure to wear a seatbelt.134 Studies have shown that primary seatbelt enforcement laws increase seatbelt usage, especially among high-risk drivers.135 BRFSS survey results for 2013 estimated that the prevalence of seatbelt usage among Missouri adults is nearly 9 percentage points lower than the national average, with 78.1 percent of Missouri adults estimated to always wear a seatbelt versus 86.9 percent of U.S. adults.136
Seatbelt usage is even less common among rural Missouri adults. In 2014, only 70.4 percent of rural Missouri adults were estimated to always use a seatbelt when driving or riding in a vehicle. This figure is statistically significantly lower than the urban prevalence estimate of 82.9 percent. Lack of seatbelt usage is likely a contributing factor to the higher rural motor vehicle accident death rates observed in the Health Status section of this report.
Seatbelt Usage
133World Health Organization (WHO). (2013). Global Status Report on Road Safety 2013: Supporting a Decade of Action. Accessed September 16, 2015, from http://www.who.int/violence_injury_prevention/road_safety_status/2013/report/en/. 134Centers for Disease Control and Prevention (CDC). (2014). Prevention Status Reports 2013: Motor Vehicle Injuries – Missouri. Atlanta, GA: U.S. Department of Health and Human Services. Accessed September 16, 2015, from http://www.cdc.gov/psr/motorvehicle/2013/mo-mvi.pdf. 135Dinh-Zarr, T.B., Sleet, D.A., Shults, R.A., Zaza, S., Elder, R.W., Nichols, J.L., … and the Task Force on Community Preventive Services. (2001). Reviews of Evidence Regarding Interventions to Increase the Use of Safety Belts. American Journal of Preventive Medicine 21(4S), 48-65. Accessed September 16, 2015, from http://www.thecommunityguide.org/mvoi/mvoi-AJPM-evrev-seat-belts.pdf. 136Centers for Disease Control and Prevention (CDC). (Last updated June 23, 2015). BRFSS Prevalence and Trends Data. Accessed September 16, 2015, from http://www.cdc.gov/brfss/brfssprevalence/. The 2014 U.S. estimate is not currently available.
Estimated percentage of adultsSource: Behavioral Risk Factor Surveillance System
Prevalence of Seatbelt UsageMissouri and U.S.

95health.mo.gov Health in Rural Missouri
HEALTH CARE RESOURCES
Health care resources are key elements in the maintenance of health and the prevention and treatment of disease. Basic access to primary care physicians and dentists, hospital services and specialty care services improve overall health and contribute significantly to an area’s economic vitality.
Unfortunately, in rural Missouri these resources are limited, even for those who have health insurance, have no financial difficulty and have access to transportation. In terms of Hospital and Specialty Services and Primary Care services, differences between rural and urban are stark.
Hospital and Specialty ServicesAt the time of this report there are 167 licensed hospitals in Missouri. Of those, only 45 percent (76 total) are located in rural counties, leaving 41 rural counties without a hospital. Of the 76 rural hospitals, 37 are Critical Access Hospitals (CAHs), with 25 or less critical access beds. In total, urban areas have 4.8 beds per 1,000 residents and rural areas have 2.5 beds per 1,000 residents.
Additionally, of the 109 licensed Ambulatory Surgical Centers in Missouri, only 23 are located in rural counties.
The lack of hospital and specialty services in rural Missouri greatly contributes to health disparities between Missouri’s rural and urban residents. As mentioned in the Health Status section of this report, rural Missourians have a significantly lower overall rate of hospitalization but a significantly higher overall rate of death compared to urban Missourians. Rural Missourians also have a significantly higher ER visit rate, which may be reflective of a lack of primary and specialty care that would prevent health issues from reaching emergency status. Rural Missourians generally have to travel excessive distances to obtain specialty care, such as cardiology, oncology and nephrology. Given the lower incomes and increased age of rural residents, the lack of local services can mean no access to or less consistent care for vulnerable populations.
Number of Staffed Hospital Beds Per 1,000 Residents
Source: Missouri Department of Health and Senior Services, Bureau of Health Care Analysis and Data Dissemination, 2014 Hospital Utilization Survey

96health.mo.gov Health in Rural Missouri
Primary Medical CarePrimary Medical Care is crucial to the overall health of a population. The regular availability of primary care physicians improves health outcomes and decreases health costs.137
The best way to holistically view access to primary health care services is through federally designated Health Professional Shortage Areas (HPSAs). Through state-collected data and state-created services areas, HPSAs utilize a ratio between a given population and health care providers, set against a standard measure, to determine access to health providers in a given service area.
HPSA designations consider a wide range of factors and include a diverse set of data sources such as Missouri Professional Registration data, Census Bureau data and Geographic Information System data.
There are predominately two types of HPSAs in Missouri: Geographic and Low Income. Geographic HPSAs represent limited access for a whole population in a given area, while Low-Income HPSAs represent limited access for the part of the population below 200% of the Federal Poverty Level in a given area.
Primary Medical HPSAs are defined using a ratio between the general population and the number, in Full-Time Equivalents (FTEs), of licensed primary care physicians (allopathic and osteopathic doctors who specialize in family practice, general practice, pediatrics, internal medicineandobstetrics/gynecology).GenerallyforaGeographicHPSA there is a ratio of least 3,500:1 and for a Low-Income HPSA there is a ratio of at least 3,000:1.
Of the 101 rural counties in Missouri, 98 are considered Primary Medical HPSAs.
137Council on Graduate Medical Education, Twentieth Report, Advancing Primary Care, 2010.
Primary Medical Care Health Professional Shortage Areas - 2013
Maries
Audrain
Lincoln
Mon
tgom
ery
Warren
Callaway
BooneHoward
CooperPettis
Laclede Dent
PhelpsPulaski
CrawfordWashington
Gas
cona
de
Ozark
Douglas
Wright TexasShannon
Reynolds
Iron
Madison
Wayne
Bolli
nger Cape
Girardeau
Perry
Ste.Genevieve
ScottCarter
HowellOregon Ripley Butler
Stoddard Mississippi
NewMadrid
Dunklin
Pem
isco
t
Cole Osage
Moniteau
Morgan
Miller
Camden
AtchisonNodaway
Worth
Gentry
Andrew
Holt
DeKalb
Daviess
CaldwellClintonBuchanan
PlatteClay
Ray Carroll
LafayetteJackson
Cass Johnson
Harrison
BatesHenry Benton
St. Clair
Vernon
Hickory
CedarPolk
Dallas
Barton
Jasper
Newton
Dade
Lawrence
Greene
Christian
BarryMcDonald Taney
Webster
Stone
Mercer
Grundy
Livingston
Chariton
Linn
Sullivan
Putnam Schuyler
Adair
Scotland
Knox
Macon
Clark
Lewis
Marion
MonroeRandolph
Ralls
Saline
Shelby
Pike
St. Charles
Franklin
St. Louis
Jefferson
St. Francois
Census Tracts
Low Income
Geographic
No Designa�on
Primary Medical Care Health ProfessionalShortage Areas - 2013
St. Louis City
HPSA Status
Source: Health Resources and Services Administration’s Shortage Designation Branch

97health.mo.gov Health in Rural Missouri
Primary Care Mental HealthMental and substance-use illnesses are the leading cause of combined death and disability for women of all ages and the second leading cause for men.138 Access to appropriate resources is critical to the proper recovery and treatment of mental health problems and disorders.
In Missouri, Primary Care Mental HPSAs are defined using a ratio between the general population and the number (FTE) of licensed psychiatrists (allopathic and osteopathic). Generally for a Geographic HPSA there is a ratio of a least 30,000:1 and for a Low-Income HPSA there is a ratio of at least 20,000:1.
Nearly all rural counties, 98 in total are considered Mental HPSAs. The majority of these HPSAs are geographic.
Primary Care Mental Health Professional Shortage Areas - 2013
138Institute of Medicine, Improving the Quality of Health Care for Mental and Substance-Use Conditions: Quality Chasm Series (2006).
Maries
Audrain
Lincoln
Mon
tgom
ery
Warren
Callaway
BooneHoward
CooperPettis
Laclede Dent
PhelpsPulaski
CrawfordWashington
Gas
cona
de
Ozark
Douglas
Wright TexasShannon
Reynolds
Iron
Madison
Wayne
Bolli
nger Cape
Girardeau
Perry
Ste.Genevieve
ScottCarter
HowellOregon Ripley Butler
Stoddard Mississippi
NewMadrid
Dunklin
Pem
isco
t
Cole Osage
Moniteau
Morgan
Miller
Camden
AtchisonNodaway
Worth
Gentry
Andrew
Holt
DeKalb
Daviess
CaldwellClintonBuchanan
PlatteClay
Ray Carroll
LafayetteJackson
Cass Johnson
Harrison
BatesHenry Benton
St. Clair
Vernon
Hickory
CedarPolk
Dallas
Barton
Jasper
Newton
Dade
Lawrence
Greene
Christian
BarryMcDonald Taney
Webster
Stone
Mercer
Grundy
Livingston
Chariton
Linn
Sullivan
Putnam Schuyler
Adair
Scotland
Knox
Macon
Clark
Lewis
Marion
MonroeRandolph
Ralls
Saline
Shelby
Pike
St. Charles
Franklin
St. Louis
Jefferson
St. Francois
Census Tracts
Low Income
Geographic
No Designa�on
Primary Care Mental Health ProfessionalShortage Areas - 2013
St. Louis City
HPSA Status
Source: Health Resources and Services Administration’s Shortage Designation Branch

98health.mo.gov Health in Rural Missouri
Maries
Audrain
Lincoln
Mon
tgom
ery
Warren
Callaway
BooneHoward
CooperPettis
Laclede Dent
PhelpsPulaski
CrawfordWashington
Gas
cona
de
Ozark
Douglas
Wright TexasShannon
Reynolds
Iron
Madison
Wayne
Bolli
nger Cape
Girardeau
Perry
Ste.Genevieve
ScottCarter
HowellOregon Ripley Butler
Stoddard Mississippi
NewMadrid
Dunklin
Pem
isco
t
Cole Osage
Moniteau
Morgan
Miller
Camden
AtchisonNodaway
Worth
Gentry
Andrew
Holt
DeKalb
Daviess
CaldwellClintonBuchanan
PlatteClay
Ray Carroll
LafayetteJackson
Cass Johnson
Harrison
BatesHenry Benton
St. Clair
Vernon
Hickory
CedarPolk
Dallas
Barton
Jasper
Newton
Dade
Lawrence
Greene
Christian
BarryMcDonald Taney
Webster
Stone
Mercer
Grundy
Livingston
Chariton
Linn
Sullivan
Putnam Schuyler
Adair
Scotland
Knox
Macon
Clark
Lewis
Marion
MonroeRandolph
Ralls
Saline
Shelby
Pike
St. Charles
Franklin
St. Louis
Jefferson
St. Francois
Census Tracts
Low Income
Geographic
No Designa�on
Dental Health ProfessionalShortage Areas - 2013
St. Louis City
HPSA Status
Dental Health Professional Shortage Areas - 2013
Primary Care DentistsOral health is critical to general health and well-being. All Missourians can have good oral health with basic oral hygiene practices and access to care; unfortunately, access to primary care dentists is severely limited throughout most of rural Missouri.
Dental HPSAs are defined using a ratio between the general population and the number (FTE) of licensed general, or pediatric, Doctors of Dental Surgery (DDS) or Doctors of Dental Medicine (DMD). Generally for a Geographic Dental HPSA there is a ratio of at least 5,000:1 and for a Low-Income HPSA there is a ratio of at least 4,000:1.
Access to dental services is most limited for low-income rural Missourians; however, a large section of rural southeast Missouri displays limited access for the entire population. In total, 92 rural counties are Dental HPSAs.
Source: Health Resources and Services Administration’s Shortage Designation Branch

99health.mo.gov Health in Rural Missouri
As demonstrated throughout this report, rural Missourians face many challenges related to their health. Overcoming the long standing inequality in health between rural and urban Missourians will require a holistic approach; there is no “silver bullet.” In light of this, the Office makes the following recommendations.
State regulations and policies need to continue to consider the varying degrees of difference betweenruralandurbanareas/residents.Differences on the surface are easy to ascertain (rural residents having to drive farther for services, for instance), but some may need serious deliberation and research. In terms of economics, education, natural resources, social services and technology, rural areas present a unique set of challenges. This is especially true as it relates to rural health. Regulations and policies that may be good for hospitals and health care providers in large urban areas, who face many unique challenges of their own, may not be good for small rural hospitals or providers that may have severely limited resources combined
with payer reimbursement issues and serve a small population that is characterized by lack of insurance, lower levels of income and transportation needs.
Access to health care services needs to continue to improve, and at the very least be sustained, throughout rural Missouri. As described in the Health Care Resources section of this report, access to health care services is limited for rural Missourians, even if an individual has health insurance, adequate transportation and other financial resources. Nearly all rural counties are considered Primary Care Health Professional Shortage Areas, with the only non-designated rural counties being adjacent to urban counties. The cost of this lack of care is apparent in the Health Status section of this report. Rural hospitals are especially prone to financial distress due to policies and reimbursement rates, coupled with the high rates of patients that are Medicare/Medicaiddependentanduninsured,which makes it harder for their doors to remain open.
Addressing the access to care problem will require activities at many levels, including educating youth in health professional careers, supporting schools that offer health professional career training, recruiting and retaining practicing health professionals, actively forecasting and projecting the level of professionals required to support rural Missourians, supporting and encouraging professionals to work in defined areas of need, refining care models to allow for access, utilizing technology such as telehealth to bridge the large geographic spread of rural Missouri and improving rural residents’ ability to pay for health care services.
RECOMMENDATIONS

100health.mo.gov Health in Rural Missouri
The program and activity areas of the Office are designed to support the health of rural communities. Although health care providers and health systems are often the primary recipients of the technical assistance or services provided by the Office, all members of the rural community are necessary partners and participants in the overall efforts.
The specific programs and functions are described in detail in this chapter.
A primary function within the Office is to facilitate the collection and dissemination of information to rural areas. The Office completes this function through the following mechanisms:
• TheRuralSpotlightisaquarterlyOffice publication containing health information as it relates to rural Missourians and includes dietary, safety or other focused topics. Electronic copies are available at http://health.mo.gov/living/families/ ruralhealth/spotlight.php.
• TheHealthinMissouriBriefshighlight specific health disparities within the rural areas of Missouri and provide more detailed information on those issues. Those are available at http://health. mo.gov/living/families/ruralhealth/ publications.php.
• IncoordinationwiththeNational Organization of State Offices of Rural Health (NOSORH), the Office utilizes TruServe, a web-based tracking tool created by the University of South Dakota, to track technical assistance and information dissemination activities. During State Fiscal Year 15 (July 1, 2014 - June 30, 2015), the Office assisted with a total of 1,108 technical assistance inquiries, in-depth telephone and email interactions, webinars, teleconferences, face-to-face and other types of technical assistance through mail, website and presentations.
STATE OFFICE OF RURAL HEALTH ACTIVITIES
• TheOfficecontinuestomaintainaweb- based healthcare resource directory, https://ogi.oa.mo.gov/DHSS/ medicalFacility/index.html, which allows searches to find health resources including rural hospitals, rural health clinics and federally qualified health centers. This website provides a one-stop place to search for health care providers in any area of the state of Missouri.

101health.mo.gov Health in Rural Missouri
The Health Resources and Services Administration (HRSA), Federal Office of Rural Health Policy (FORHP) funds the state for the Medicare Rural Hospital Flexibility Grant (FLEX) Program. The purpose is to assist Critical Access Hospitals by providing funding to encourage quality and performance improvement activities including stabilizing rural hospital finance, integrating emergency medical services into their health care systems, incorporating population health and fostering innovative models of health care.
Part of the FLEX Program is the Medicare Beneficiary Quality Improvement Project (MBQIP). The goal of MBQIP is to support Critical Access Hospitals (CAHs) in enhancing quality improvement; the 37 CAHs in Missouri are hospitals that have 25 or fewer beds and are located in rural areas. CAHs are supported in implementing hospital-specific quality improvement initiatives (such as increasing the number of patients who receive treatment for heart attacks within a standard time period), improving and integrating emergency management systems, supporting health system development and community engagement, and in developing and implementing rural health networks.
Specifically through MBQIP, the Office supports CAHs with technical assistance to improve health care outcomes on measures included in Hospital Compare and other national benchmarks. Hospital Compare, created through the Centers for Medicare and Medicaid Services, is a consumer-oriented website that provides information on how well hospitals provide recommended care to their patients. Participating CAHs report on a specific set of annual measures and engage in quality improvement projects to benefit patient care.
The Office also supports CAHs with technical assistance to improve their financial and operational outcomes. Technical assistance is provided by conducting a financial analysis of Missouri CAHs and performing comprehensive financial assessments for CAHs considered to be “distressed” under the analysis, identifying revenue cycle performance improvement initiatives and monitoring improvement efforts.
Medicare Rural Hospital Flexibility Grant Program

102health.mo.gov Health in Rural Missouri
The Small Rural Hospital Improvement Program (SHIP) is a federally funded program in which the Office provides funding to small rural hospitals for a variety of operational improvement projects. To be eligible for funding, a hospital must have 49 staffed beds or less and be located outside a Metropolitan Statistical Area (i.e., in a rural area).
During SHIP Year 2014, $365,040 was distributed among 38 hospitals to pay forcostsrelatedto1)implementationofthePaymentBundling/ProspectivePayment System (PPS), 2) Accountable Care Organization (ACO) modeling or Shared Savings, 3) Care Transitions and 4) Value-Based Purchasing (VBP) for financial improvement. The majority of funds were used for purchases under the PB/PPSimplementation(43percent),CareTransitions(27percent),VBP(17percent) and ACO category (9 percent). The majority of these purchases consist of software, hardware, education and training within those categories.
Small Rural Hospital Improvement Program
103health.mo.gov Health in Rural Missouri
The Office of Primary Care and Rural HealthThe Office is located within the Missouri Department of Health and Senior Services, Office of Primary Care and Rural Health, which includes the State Office of Rural Health, the Primary Care Office and the Missouri Oral Health Program. This organizational structure presents a unique environment in which to engage in close collaboration on a multitude of projects; the efforts of these two partner Offices will be briefly outlined here.
The Primary Care Office (PCO) promotes federal, state, local and private collaboration in expanding comprehensive, community-based primary health care services for medically underserved populations. The PCO monitors and evaluates access to health care services, including designation of Health Professional Shortage Areas. The PCO is also the primary state contact for the National Health Service Corps, J-1 Visa Waiver Program, National Interest Waiver Program and works with local, state and federal partners in the development and expansion of safety-net health care delivery sites.
The PCO implements programs that directly address the shortage of primary health care providers statewide. The Primary Care Resource Initiative for Missouri (PRIMO), the Missouri Professional and Practical Nursing Student
Primary Care Office
Oral Health
Other Internal/External Partners
The Missouri Oral Health Program’s (MOHP) mission is to improve the oral health of Missourians through education, prevention and leadership. One main function within MOHP is the operation of the Preventive Services Program (PSP). The PSP is a community-driven oral health program for children and involves the participation of a variety of community partners such as schools, day care centers, Head Starts and State Schools for the Severely Disabled.
In the 2014-2015 school year, over 83,000 children were served. Each child received oral health education, age-appropriate oral health supplies (which may include toothbrush, toothpaste and floss), a screening by a dental
Internal and External Partners and Networks are critical to the efforts of the Office; without these partners success would be severely compromised. Critical internal DHSS partners include the Bureau of Outpatient Healthcare, Bureau of Health Care Analysis and Data Dissemination, Bureau of Emergency Medical Services, Bureau of Cancer and Chronic Disease Control, Office of Minority Health, Office on Women’s Health and Bureau of Hospital Standards.
Critical external partners include the Missouri Hospital Association, the Missouri Primary Care Association, the Missouri Dental Association, the Missouri Association of Rural Health Clinics, the Missouri Rural Health Association, the Department of Social Services, the Health Resources and Services Administration Office of Rural Health Policy, the Missouri Area Health Education Centers, the University of Missouri and the Rural Recruitment and Retention Network.
Loan (NSL) and State Loan Repayment Program (SLRP) provide either scholarship or loan repayment to primary health care providers in return for the provision of health care services in a defined area of need. Funding is also provided to community organizations to develop healthcare services in areas where services are currently unavailable, to expand existing health care services for disparaged populations and to provide support to Area Health Education Centers for the development of health professional students, especially those individuals from rural, inner city and underserved communities in Missouri.
professional and a referral for additional dental care if issues are identified. The MOHP also provides information for the public about community water fluoridation and collaborates with other programs and organizations that address access to oral health care in women, children and other at-risk populations.

104health.mo.gov Health in Rural Missouri
GLOSSARY
Age-adjusted rates allow fairer comparisons to be made between groups with different age distributions. For example, a county with a higher percentage of elderly residents may have a higher rate of death or ER visits than a county with a younger population, merely because the elderly are more likely to die or visit the ER. (The same distortion can occur when races, genders or time periods with different age structures are compared.) Age adjustment controls for different age structures and makes the rates for different groups more comparable.
A standard population distribution is used to adjust death, hospitalization, ER visit and other types of rates that typically vary with age. Age-adjusted rates are the rates that would have existed if the population under study had the same age distribution as the standard population. Therefore, they are summary measures adjusted for differences in age distributions.
Age-Adjusted RatesThe National Center for Health Statistics recommends that the U.S. 2000 standard population be used to calculate age-adjusted rates. All age-adjusted rates in this report were adjusted using the U.S. 2000 standard population. Users of Missouri Information for Community Assessment (MICA) have the option of selecting age-adjusted rates based on the U.S. 1940, 1970 or 2000 standard populations when generating tables utilizing age adjustment. Age-adjusted rates in the Community Data Profiles use the U.S. 2000 standard population.
If rates from different sources are compared, the same standard population must be used on both sides of the comparison. It is not legitimate to compare adjusted rates which use different standard populations. The use of different standard populations can affect general trends in total mortality and cause of death and differences in mortality by race and gender.
For more information on this topic see: “Effects of Changing from the 1940 to the Year 2000 Standard Population for Age-Adjusted Death Rates in Missouri”: Missouri Monthly Vital Statistics, 33.12 (Feb. 2000).
Age-adjusted rates published elsewhere (e.g., in the annual Missouri Vital Statistics) may be slightly different from those found in the MICAs or Community Data Profiles due to updating of population estimates for years between decennial Censuses.
The constant or “per population” number used for age-adjusted rates may vary depending on the type of event. For example, age-adjusted rates for deaths are reported per 100,000 population. However, age-adjusted rates for hospitalizations and procedures are reported per 10,000 population, while age-adjusted rates for ER visits are reported per 1,000 population.
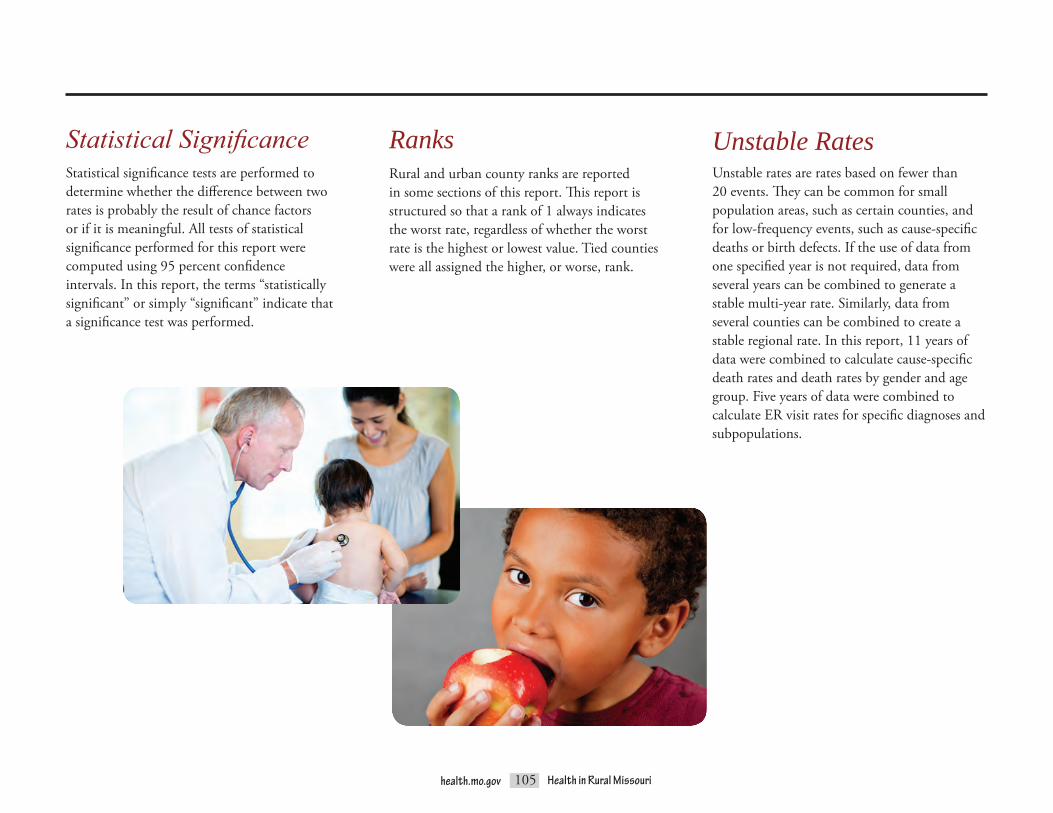
105health.mo.gov Health in Rural Missouri
Statistical significance tests are performed to determine whether the difference between two rates is probably the result of chance factors or if it is meaningful. All tests of statistical significance performed for this report were computed using 95 percent confidence intervals. In this report, the terms “statistically significant” or simply “significant” indicate that a significance test was performed.
Statistical Significance RanksRural and urban county ranks are reported in some sections of this report. This report is structured so that a rank of 1 always indicates the worst rate, regardless of whether the worst rate is the highest or lowest value. Tied counties were all assigned the higher, or worse, rank.
Unstable RatesUnstable rates are rates based on fewer than 20 events. They can be common for small population areas, such as certain counties, and for low-frequency events, such as cause-specific deaths or birth defects. If the use of data from one specified year is not required, data from several years can be combined to generate a stable multi-year rate. Similarly, data from several counties can be combined to create a stable regional rate. In this report, 11 years of data were combined to calculate cause-specific death rates and death rates by gender and age group. Five years of data were combined to calculate ER visit rates for specific diagnoses and subpopulations.

106health.mo.gov Health in Rural Missouri
Behavioral Risk Factor Surveillance System (BRFSS)The Behavioral Risk Factor Surveillance System (BRFSS) is an annual landline and cell telephone survey that collects information on health risk behaviors, preventive health practices and health care access from non-institutionalized adults ages 18 and older. The annual BRFSS sample size of approximately 7,000 produces prevalence estimates at the state and regional levels.
Maries
Audrain
Lincoln
Mon
tgom
ery
Warren
Callaway
BooneHoward
CooperPettis
Laclede Dent
PhelpsPulaski
CrawfordWashington
Gas
cona
de
Ozark
Douglas
Wright TexasShannon
Reynolds
Iron
Madison
Wayne
Bolli
nger Cape
Girardeau
Perry
Ste.Genevieve
ScottCarter
HowellOregon Ripley Butler
Stoddard Mississippi
NewMadrid
Dunklin
Pem
isco
t
Cole Osage
Moniteau
Morgan
Miller
Camden
AtchisonNodaway
Worth
Gentry
Andrew
Holt
DeKalb
Daviess
CaldwellClintonBuchanan
PlatteClay
Ray Carroll
LafayetteJackson
Cass Johnson
Harrison
BatesHenry Benton
St. Clair
Vernon
Hickory
CedarPolk
Dallas
Barton
Jasper
Newton
Dade
Lawrence
Greene
Christian
BarryMcDonald Taney
Webster
Stone
Mercer
Grundy
Livingston
Chariton
Linn
Sullivan
Putnam Schuyler
Adair
Scotland
Knox
Macon
Clark
Lewis
Marion
MonroeRandolph
Ralls
Saline
Shelby
Pike
St. Charles
Franklin
St. Louis
Jefferson
St. Francois
Central Region
Kansas City Metrol Region
Northeast Region
St. Louis Metro Region
BRFSS Regions
St. Louis City
Northwest Region
Southwest Region
Southeast Region
BRFSS Regions
Source: http://www.health.mo.gov/data/brfss/BRFSSRegionsMap.pdf

107health.mo.gov Health in Rural Missouri
Several questions from the BRFSS survey are used to derive prevalence estimates for the indicators included in the Health Behaviors and Risk Factors chapter of this report.
• Fairorpoorgeneralhealthstatus estimates are derived from “Fair” or “Poor” responses to the question: “Would you say that in general your health is excellent, very good, good, fair orpoor?”
• Tobaccouseestimatesarederivedfrom:
o “Yes” responses to “Have you smoked at least 100 cigarettes in your entire life?”and
o “Every day” OR “Some days” responses to “Do you now smoke cigarettes every day, some days or not atall?”
• Noleisure-timephysicalactivity estimates are derived from “No” responses to the question: “During the past month, other than your regular job, did you participate in any physical activities or exercises such as running, calisthenics, golf, gardening or walking forexercise?”
• Atefewerthanfivefruitsandvegetables per day estimates are derived from responses to the following questions:
o “During the past month, how many times per day, week or month did you drink100percentPUREfruitjuices? Do not include fruit-flavored drinks with added sugar or fruit juice you made at home and added sugar to. Only include 100 percent juice.” and
o “During the past month, not counting juice, how many times per day, week ormonthdidyoueatfruit?Count fresh, frozen or canned fruit.” and
o “During the past month, how many times per day, week or month did you eat cooked or canned beans, such as refried, baked, black, garbanzo beans, beans in soup, soybeans, edamame, tofu or lentils. Do not include long green beans.” and
o “During the past month, how many times per day, week or month did you eat dark green vegetables for example broccoli or dark leafy greens including romaine, chard, collard greens or spinach?”and
o “During the past month, how many times per day, week or month did you eat orange-colored vegetables such as sweet potatoes, pumpkin, wintersquashorcarrots?”and
o “Not counting what you just told me about, during the past month, about how many times per day, week or month did you eat OTHER vegetables?Examplesofother vegetables include tomatoes, tomato juice or V-8 juice, corn, eggplant, peas, lettuce, cabbage and white potatoes that are not fried such as baked or mashed potatoes.”
• Seatbeltusageestimatesarederivedfrom “Always” responses to: “How often do you use seatbelts when you drive or ride inacar?”
108health.mo.gov Health in Rural Missouri
Healthy People 2020Healthy People 2020 objectives are health status targets for the entire U.S. Targets are set using baseline U.S. data. Objectives are organized into 42 topic areas, with Leading Health Indicators identified in 12 of these topic areas. Additional information about Healthy People 2020 is available at http://www.healthypeople.gov/2020/default.aspx.
Body mass index (BMI) is a measure of body fat. Persons with BMI values of 30.0 or higher are considered obese.
The Behavioral Risk Factor Surveillance System derives Overweight (25.0 – 29.9 BMI) and Obese(>=30BMI)indicatorsbycalculatingBMI using responses to the following questions:
“Abouthowmuchdoyouweighwithoutshoes?”
“Abouthowtallareyouwithoutshoes?”
Body Mass IndexThis report provides data only for Missouri residents. Missouri residents are persons who resided in Missouri at the time of the event in question (birth, death, hospitalization, ER visit, etc.). Missouri receives vital records and hospital/ERdatafrommostofitsborderstates,and these records are included in the Missouri resident data. For example, a record for a Missouri resident treated in a Kansas hospital would be reported as a Missouri resident hospitalization.
Data in the Missouri Information for Community Assessment (MICA) system and in this report are categorized by resident status. For instance, the record for an Adair County resident who visited the ER in Boone County would be included in the Adair County data.
Resident

109health.mo.gov Health in Rural Missouri
APPENDIX A – USING THE DHSS COMMUNITY DATA PROFILES AND MISSOURI INFORMATION FOR COMMUNITY ASSESSMENT (MICA) WEBSITES
4. The Trend Lines and Comparison Bar Graphs columns provide links to available charts and graphs. Users can create a graph showing a three-year moving average trend line. In addition, users can create a bar chart showing the rates for a specific indicator in selected geographies or compare indicators within a single geography.
The following step-by-step guide offers detailed instructions on accessing health data on the DHSS MICA website.
1. Go to the DHSS MICA website at http:// health.mo.gov/data/mica/MICA/.
2. Choose a topic from the list of MICA datasets.
3. Select a viewing option. Options may includecounty/citytables,mapsorZIP code tables. Each option provides a query screen that allows users to customize the data output.
4. Data for the rural and urban categories used in this report were viewed by selecting
the appropriate counties in Step 5 of the queryscreen.IfCounty/Cityisselected as the row or column variable in Step 1 or Step 2, the “Total for Selection” row or column represents the overall rural or urban data. The table on the next page lists the rural and urban counties as categorized in this report.
For more information on using the Community Data Profiles and MICAs please refer to the User Handbook at http://health.mo.gov/data/mica/MICA/ CHAIPTraining.html or contact the DHSS Bureau of Health Care Analysis and Data Dissemination at 573-751-6272.
Many of the health data included in this report may be accessed on the Missouri Department of Health and Senior Services (DHSS) Community Data Profiles and MICA websites. Users can easily create different types of tables, graphs, charts and maps pertaining to health indicators.
The following step-by-step guide offers detailed instructions on accessing health data on the DHSS Community Data Profiles website.
1. Go to the DHSS Community Data Profiles website http://health.mo.gov/data/ CommunityDataProfiles/index.html.
2. From the topic list, select a Profile. Then use the pull-down menu to choose whether to view data for the state, a county or a city. (Note: The rural and urban categories used in this report are not available for the Community Data Profiles. Data for the state, counties and selected cities can be viewed. Data for BRFSS regions are available for some topics.) Click the Submit button.
3. The requested data table will appear.

110health.mo.gov Health in Rural Missouri
Rural CountiesAdair Daviess McDonald RallsAndrew DeKalb Macon RandolphAtchison Dent Madison RayAudrain Douglas Maries ReynoldsBarry Dunklin Marion RipleyBarton Franklin Mercer St. ClairBates Gasconade Miller St. FrancoisBenton Gentry Mississippi Ste. GenevieveBollinger Grundy Moniteau SalineButler Harrison Monroe SchuylerCaldwell Henry Montgomery ScotlandCallaway Hickory Morgan ScottCamden Holt New Madrid ShannonCape Girardeau Howard Nodaway ShelbyCarroll Howell Oregon StoddardCarter Iron Osage StoneCedar Johnson Ozark SullivanChariton Knox Pemiscot TaneyChristian Laclede Perry TexasClark Lafayette Pettis VernonClinton Lawrence Phelps WarrenCooper Lewis Pike WashingtonCrawford Lincoln Polk WayneDade Linn Pulaski WebsterDallas Livingston Putnam Worth
Wright
BooneBuchananCassClayColeGreenJacksonJasperJeffersonNewtonPlatteSt. CharlesSt. LouisSt. Louis City
Urban Counties
Com
mun
ity D
ataProfi les and MICAs
For more information on using the Community Data Profiles and MICA,
please refer to the User Handbook at http://health.mo.gov/data/mica/MICA/CHAIPTraining.html or
contact the DHSS Bureau of Health Care Analysis and Data Dissemination
at 573.751.6272.

111health.mo.gov Health in Rural Missouri
APPENDIX B – DEATH NUMBERS AND RATES BY CAUSE, GENDER AND AGE GROUPAppendix B – Death Numbers and Rates by Cause, Gender and Age Group
2003-2013 Age-Adjusted Death Rates per 100,000 Residents
Rural Number
Rural Rate
Urban Number
Urban Rate
All causes 255,086 875.7 350,652 812.6 Males 128,389 1,034.3 169,269 968.0 Females 126,697 743.5 181,383 693.5 Under 15 3,261 68.8 5,318 65.4 15 to 24 3,189 94.4 4,900 84.1 25 to 44 10,969 188.4 17,437 156.9 45 to 64 47,590 747.0 68,246 647.4 65 and Over 190,070 4,984.7 254,717 4,904.6 Heart disease 69,562 234.2 89,409 205.2 Males 35,131 284.5 43,780 256.1 Females 34,431 191.4 45,629 167.4 Under 15 66 1.4 106 1.3 15 to 24 91 2.7 143 2.5 25 to 44 1,573 27.0 2,236 20.1 45 to 64 11,835 185.8 15,624 148.2 65 and Over 55,997 1,468.5 71,293 1,372.8 Cancer 57,539 194.1 80,038 185.6 Males 31,215 236.9 40,661 225.8 Females 26,324 162.5 39,377 158.9 Under 15 119 2.5 177 2.2 15 to 24 121 3.6 217 3.7 25 to 44 1,497 25.7 2,308 20.8 45 to 64 15,477 242.9 22,234 210.9 65 and Over 40,323 1,057.5 55,099 1,060.9

112health.mo.gov Health in Rural Missouri
APPENDIX B – DEATH NUMBERS AND RATES BY CAUSE, GENDER AND AGE GROUP
2003-2013 Age-Adjusted Death Rates per 100,000 Residents
Rural Number
Rural Rate
Urban Number
Urban Rate
Chronic lower respiratory diseases (CLRD)
16,896 56.6 19,571 45.9
Males 8,722 69.1 8,728 51.8 Females 8,174 48.4 10,843 42.5 Under 15 13 0.3 @ 37 0.5 15 to 24 5 0.1 @ 28 0.5 25 to 44 156 2.7 179 1.6 45 to 64 2,660 41.8 2,674 25.4 65 and Over 14,062 368.8 16,651 320.6 Stroke 15,145 50.8 19,796 45.7 Males 5,953 49.6 7,564 45.6 Females 9,192 50.8 12,232 44.9 Under 15 23 0.5 42 0.5 15 to 24 20 0.6 21 0.4 25 to 44 225 3.9 343 3.1 45 to 64 1,520 23.9 2,341 22.2 65 and Over 13,357 350.3 17,049 328.3

113health.mo.gov Health in Rural Missouri
APPENDIX B – DEATH NUMBERS AND RATES BY CAUSE, GENDER AND AGE GROUP
2003-2013 Age-Adjusted Death Rates per 100,000 Residents
Rural Number
Rural Rate
Urban Number
Urban Rate
Unintentional injuries 13,712 54.9 18,150 43.3 Males 8,697 73.1 11,100 58.6 Females 5,015 37.4 7,050 29.7 Under 15 700 14.8 774 9.5 15 to 24 1,957 57.9 1,974 33.9 25 to 44 3,464 59.5 4,495 40.4 45 to 64 3,351 52.6 4,602 43.7 65 and Over 4,239 111.2 6,300 121.3 Motor vehicle accidents (subset of Unintentional injuries)
5,925 24.4 4,817 11.7
Males 3,994 33.2 3,355 17.0 Females 1,931 15.7 1,462 6.8 Under 15 262 5.5 173 2.1 15 to 24 1,434 42.4 1,205 20.7 25 to 44 1,646 28.3 1,512 13.6 45 to 64 1,483 23.3 1,183 11.2 65 and Over 1,099 28.8 744 14.3

114health.mo.gov Health in Rural Missouri
APPENDIX B – DEATH NUMBERS AND RATES BY CAUSE, GENDER AND AGE GROUP
2003-2013 Age-Adjusted Death Rates per 100,000 Residents
Rural Number
Rural Rate
Urban Number
Urban Rate
Alzheimer’s disease 8,422 27.9 10,697 24.4 Males 2,594 23.4 3,005 20.0 Females 5,828 30.3 7,692 26.6 Under 15 0 0.0 @ 0 0.0 @ 15 to 24 0 0.0 @ 0 0.0 @ 25 to 44 1 0.0 @ 2 0.0 @ 45 to 64 85 1.3 104 1.0 65 and Over 8,335 218.6 10,591 203.9 Diabetes 6,739 22.9 9,205 21.3 Males 3,325 26.0 4,581 25.4 Females 3,414 20.4 4,624 18.2 Under 15 4 0.1 @ 7 0.1 @ 15 to 24 12 0.4 @ 36 0.6 25 to 44 237 4.1 368 3.3 45 to 64 1,476 23.2 2,369 22.5 65 and Over 5,010 131.4 6,424 123.7 Pneumonia and influenza
6,581 22.1 8,348 19.1
Males 2,944 25.4 3,684 23.0 Females 3,637 20.0 4,664 16.7 Under 15 44 0.9 51 0.6 15 to 24 19 0.6 @ 23 0.4 25 to 44 123 2.1 189 1.7 45 to 64 662 10.4 784 7.4 65 and Over 5,733 150.4 7,299 140.5

115health.mo.gov Health in Rural Missouri
APPENDIX B – DEATH NUMBERS AND RATES BY CAUSE, GENDER AND AGE GROUP
Source: Death MICA
An @ following a rate indicates that the rate is based on fewer than 20 cases and is considered to be unstable.
This table is arranged in order of the leading causes of death for rural residents. There are slight differences in the order of the leading causes of death for urban residents.
2003-2013 Age-Adjusted Death Rates per 100,000 Residents
Rural Number
Rural Rate
Urban Number
Urban Rate
Kidney disease 5,804 19.5 7,422 17.2 Males 2,783 23.4 3,524 21.2 Females 3,021 17.0 3,898 14.6 Under 15 11 0.2 @ 15 0.2 @ 15 to 24 8 0.2 @ 19 0.3 @ 25 to 44 80 1.4 143 1.3 45 to 64 661 10.4 1,086 10.3 65 and Over 5,044 132.3 6,159 118.6 Suicide 3,627 15.0 5,393 13.0 Males 2,976 24.9 4,184 21.3 Females 651 5.5 1,209 5.7 Under 15 28 0.6 51 0.6 15 to 24 430 12.7 677 11.6 25 to 44 1,245 21.4 1,905 17.1 45 to 64 1,266 19.9 1,978 18.8 65 and Over 658 17.3 782 15.1 Source: Death MICA An @ following a rate indicates that the rate is based on fewer than 20 cases and is considered to be unstable. This table is arranged in order of the leading causes of death for rural residents. There are slight differences in the order of the leading causes of death for urban residents.

116health.mo.gov Health in Rural Missouri
Appendix C – Emergency Room (ER) Visit Numbers and Rates by Diagnosis, Gender and Age Group
2009-2013 Age-Adjusted ER Visit Rates per 1,000 Residents
Rural Number
Rural Rate
Urban Number
Urban Rate
All diagnoses 4,268,363 397.8 6,954,290 373.7 Males 1,869,763 347.1 2,993,149 330.0 Females 2,398,570 450.9 3,961,113 415.5 Under 15 872,979 404.5 1,502,388 406.8 15 to 24 720,228 471.6 1,244,284 470.0 25 to 44 1,254,005 481.8 2,162,479 430.4 45 to 64 832,385 275.3 1,371,431 272.0 65 and Over 588,727 323.1 673,637 270.9 Heart disease 185,334 15.7 266,316 13.9 Males 88,400 15.3 118,341 12.9 Females 96,933 16.2 147,974 14.8 Under 15 3,481 1.6 7,388 2.0 15 to 24 13,462 8.8 26,560 10.0 25 to 44 45,846 17.6 88,781 17.7 45 to 64 64,454 21.3 94,358 18.7 65 and Over 58,091 31.9 49,222 19.8 Cancer 3,794 0.3 3,020 0.1 Males 1,982 0.3 1,521 0.2 Females 1,812 0.3 1,499 0.1 Under 15 107 0.0 110 0.0 15 to 24 67 0.0 68 0.0 25 to 44 394 0.2 331 0.1 45 to 64 1,448 0.5 1,396 0.3 65 and Over 1,778 1.0 1,115 0.4
APPENDIX C – EMERGENCY ROOM (ER) VISIT NUMBERS AND RATES BY DIAGNOSIS, GENDER AND AGE GROUP
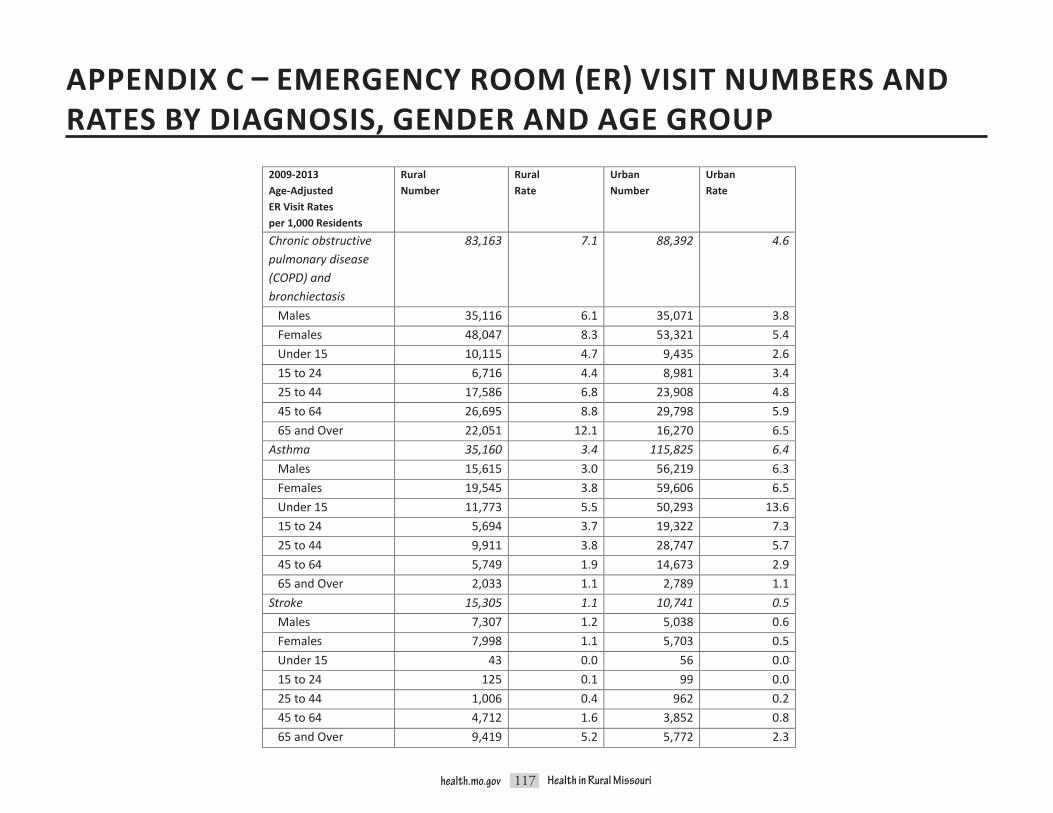
117health.mo.gov Health in Rural Missouri
2009-2013 Age-Adjusted ER Visit Rates per 1,000 Residents
Rural Number
Rural Rate
Urban Number
Urban Rate
Chronic obstructive pulmonary disease (COPD) and bronchiectasis
83,163 7.1 88,392 4.6
Males 35,116 6.1 35,071 3.8 Females 48,047 8.3 53,321 5.4 Under 15 10,115 4.7 9,435 2.6 15 to 24 6,716 4.4 8,981 3.4 25 to 44 17,586 6.8 23,908 4.8 45 to 64 26,695 8.8 29,798 5.9 65 and Over 22,051 12.1 16,270 6.5 Asthma 35,160 3.4 115,825 6.4 Males 15,615 3.0 56,219 6.3 Females 19,545 3.8 59,606 6.5 Under 15 11,773 5.5 50,293 13.6 15 to 24 5,694 3.7 19,322 7.3 25 to 44 9,911 3.8 28,747 5.7 45 to 64 5,749 1.9 14,673 2.9 65 and Over 2,033 1.1 2,789 1.1 Stroke 15,305 1.1 10,741 0.5 Males 7,307 1.2 5,038 0.6 Females 7,998 1.1 5,703 0.5 Under 15 43 0.0 56 0.0 15 to 24 125 0.1 99 0.0 25 to 44 1,006 0.4 962 0.2 45 to 64 4,712 1.6 3,852 0.8 65 and Over 9,419 5.2 5,772 2.3
APPENDIX C – EMERGENCY ROOM (ER) VISIT NUMBERS AND RATES BY DIAGNOSIS, GENDER AND AGE GROUP

118health.mo.gov Health in Rural Missouri
APPENDIX C – EMERGENCY ROOM (ER) VISIT NUMBERS AND RATES BY DIAGNOSIS, GENDER AND AGE GROUP
2009-2013 Age-Adjusted ER Visit Rates per 1,000 Residents
Rural Number
Rural Rate
Urban Number
Urban Rate
Unintentional injuries†
962,288 89.9 1,433,626 77.2
Males 497,351 93.0 727,387 80.5 Females 464,924 86.1 706,231 73.5 Under 15 237,615 110.1 363,863 98.5 15 to 24 176,231 115.4 259,245 97.9 25 to 44 254,276 97.7 388,955 77.4 45 to 64 172,202 57.0 265,828 52.7 65 and Over 121,951 66.9 155,713 62.6 Motor vehicle traffic accidents†
86,622 8.2 167,146 8.9
Males 40,531 7.5 74,719 8.1 Females 46,089 8.9 92,424 9.7 Under 15 7,264 3.4 12,450 3.4 15 to 24 27,824 18.2 49,044 18.5 25 to 44 28,691 11.0 62,710 12.5 45 to 64 17,163 5.7 34,382 6.8 65 and Over 5,679 3.1 8,559 3.4 Alzheimer’s disease‡ Not available Not available Not available Not available Males Not available Not available Not available Not available Females Not available Not available Not available Not available Under 15 Not available Not available Not available Not available 15 to 24 Not available Not available Not available Not available 25 to 44 Not available Not available Not available Not available 45 to 64 Not available Not available Not available Not available 65 and Over Not available Not available Not available Not available

119health.mo.gov Health in Rural Missouri
2009-2013 Age-Adjusted ER Visit Rates per 1,000 Residents
Rural Number
Rural Rate
Urban Number
Urban Rate
Diabetes 22,913 2.0 34,775 1.8 Males 10,750 1.9 16,933 1.8 Females 12,163 2.0 17,842 1.7 Under 15 789 0.4 1,022 0.3 15 to 24 1,860 1.2 2,869 1.1 25 to 44 5,869 2.3 10,161 2.0 45 to 64 8,322 2.8 13,850 2.7 65 and Over 6,072 3.3 6,872 2.8 Pneumonia 47,034 4.1 58,333 3.2 Males 23,599 4.3 28,685 3.2 Females 23,435 4.1 29,648 3.1 Under 15 15,023 7.0 24,448 6.6 15 to 24 2,382 1.6 4,166 1.6 25 to 44 7,284 2.8 11,165 2.2 45 to 64 9,525 3.2 11,405 2.3 65 and Over 12,820 7.0 7,149 2.9 Kidney disease± 3,203 0.2 4,603 0.2 Males 1,771 0.3 3,021 0.3 Females 1,432 0.2 1,582 0.1 Under 15 53 0.0 90 0.0 15 to 24 97 0.1 189 0.1 25 to 44 428 0.2 998 0.2 45 to 64 1,143 0.4 2,471 0.5 65 and Over 1,482 0.8 855 0.3
APPENDIX C – EMERGENCY ROOM (ER) VISIT NUMBERS AND RATES BY DIAGNOSIS, GENDER AND AGE GROUP

120health.mo.gov Health in Rural Missouri
2009-2013 Age-Adjusted ER Visit Rates per 1,000 Residents
Rural Number
Rural Rate
Urban Number
Urban Rate
Affective disorders 25,017 2.5 32,700 1.8 Males 11,951 2.3 16,453 1.8 Females 13,066 2.6 16,247 1.7 Under 15 1,643 0.8 2,813 0.8 15 to 24 6,216 4.1 8,403 3.2 25 to 44 11,045 4.2 12,979 2.6 45 to 64 5,463 1.8 7,574 1.5 65 and Over 650 0.4 931 0.4 Acute bronchitis 67,093 6.4 102,682 5.6 Males 28,817 5.4 42,472 4.7 Females 38,275 7.3 60,210 6.4 Under 15 20,717 9.6 28,341 7.7 15 to 24 8,794 5.8 13,704 5.2 25 to 44 18,702 7.2 32,347 6.4 45 to 64 12,130 4.0 20,474 4.1 65 and Over 6,750 3.7 7,816 3.1 Urinary stones 41,399 3.9 55,678 3.0 Males 24,628 4.5 33,084 3.6 Females 16,771 3.3 22,594 2.4 Under 15 276 0.1 423 0.1 15 to 24 5,326 3.5 6,945 2.6 25 to 44 18,523 7.1 25,296 5.0 45 to 64 13,038 4.3 18,557 3.7 65 and Over 4,236 2.3 4,457 1.8
APPENDIX C – EMERGENCY ROOM (ER) VISIT NUMBERS AND RATES BY DIAGNOSIS, GENDER AND AGE GROUP

121health.mo.gov Health in Rural Missouri
2009-2013 Age-Adjusted ER Visit Rates per 1,000 Residents
Rural Number
Rural Rate
Urban Number
Urban Rate
Gastritis and duodenitis
18,464 1.7 24,587 1.3
Males 7,424 1.4 10,189 1.1 Females 11,040 2.1 14,398 1.5 Under 15 1,889 0.9 2,256 0.6 15 to 24 4,351 2.8 6,244 2.4 25 to 44 6,714 2.6 9,851 2.0 45 to 64 3,769 1.2 4,831 1.0 65 and Over 1,741 1.0 1,405 0.6 Nontraumatic dental complaints
120,117 12.2 169,516 9.2
Males 53,557 10.6 73,294 8.1 Females 66,560 13.9 96,222 10.3 Under 15 4,680 2.2 8,101 2.2 15 to 24 28,668 18.8 37,532 14.2 25 to 44 71,688 27.5 97,467 19.4 45 to 64 13,663 4.5 24,199 4.8 65 and Over 1,416 0.8 2,216 0.9 Sources: †Unintentional injury and Motor vehicle traffic accident ER visit data were obtained from the Injury MICA. ‡Alzheimer’s disease ER visit data were obtained from Patient Abstract System files with the assistance of David Litchfield in the Bureau of Health Care Analysis and Data Dissemination, but the numbers were too small to include in this report. ±Kidney disease numbers were calculated by summing the Nephritis - nephrosis - renal sclerosis, Acute and unspecified renal failure and Chronic renal failure diagnosis categories in the Emergency Room MICA. Rates were calculated by the Bureau of Health Care Analysis and Data Dissemination using these sums and population data from the Population MICA. Data for all other indicators were obtained directly from the Emergency Room MICA. An @ following a rate indicates that the rate is based on fewer than 20 cases and is considered to be unstable. This table is primarily arranged in order of the leading causes of death for rural residents. There are slight differences in the order of the leading causes of death for urban residents. The last four diagnoses are listed in the same order used in the body of the report.
Sources: †Unintentional injury and Motor vehicle traffic accident ER visit data were obtained from the Injury MICA.‡Alzheimer’s disease ER visit data were obtained from Patient Abstract System files with the assistance of David Litchfield in the Bureau of Health Care Analysis and Data Dissemination, but the numbers were too small to include in this report.±Kidney disease numbers were calculated by summing the Nephritis - nephrosis - renal sclerosis, Acute and unspecified renal failure and Chronic renal failure diagnosis categories in the Emergency Room MICA. Rates were calculated by the Bureau of Health Care Analysis and Data Dissemination using these sums and population data from the Population MICA.Data for all other indicators were obtained directly from the Emergency Room MICA.
An @ following a rate indicates that the rate is based on fewer than 20 cases and is considered to be unstable.
This table is primarily arranged in order of the leading causes of death for rural residents. There are slight differences in the order of the leading causes of death for urban residents. The last five diagnoses are listed in the same order used in the body of the report.
APPENDIX C – EMERGENCY ROOM (ER) VISIT NUMBERS AND RATES BY DIAGNOSIS, GENDER AND AGE GROUP

122health.mo.gov Health in Rural Missouri
Missouri Department of Health and Senior ServicesOffice of Primary Care and Rural Health
P. O. Box 570Jefferson City, MO 65102-0570
573.751.6219health.mo.gov
For an electronic copy of the report, visit:http://health.mo.gov/living/families/ruralhealth/publications.php
Oral HealthRural Health
Primary Care
O�ce of PrimaryCare & Rural Health
Missouri
Alternate forms of this publication for persons with disabilities may be obtained by contacting the Missouri Department of Health and Senior Services, Office of Primary Care and Rural Health,
P.O. Box 570, Jefferson City, MO 65102, 573.751.6219.
Hearing- and speech-impaired citizens can dial 711.
ANEQUALOPPORTUNITY/AFFIRMATIVEACTIONEMPLOYERServices provided on a nondiscriminatory basis.