
Health Expenditure Trends in New Zealand 2000-2010 · Health Expenditure Trends in New Zealand...
119
Health Expenditure Trends in New Zealand 2000–2010
-
Upload
truongdang -
Category
Documents
-
view
216 -
download
3
Transcript of Health Expenditure Trends in New Zealand 2000-2010 · Health Expenditure Trends in New Zealand...

Health Expenditure Trends in New Zealand
2000–2010

Citation: Ministry of Health. 2012. Health Expenditure Trends in New Zealand 2000–2010. Wellington: Ministry of Health.
Published in August 2012 by the Ministry of Health
PO Box 5013, Wellington 6145, New Zealand
ISBN 978-0-478-36659-4 (online) HP 5215
This document is available at www.health.govt.nz
Health Expenditure Trends in New Zealand 2000–2010 iii
Foreword This report, Health Expenditure Trends in New Zealand 2000–2010, is the latest in a regular series prepared by the Ministry of Health (the Ministry). The primary purpose of the series is to provide information on expenditure in the New Zealand health and disability sector. This document focuses on expenditure for the two years 2008/09 and 2009/10. This series continues from the 2008 publication and relates to all sources of health funding channelled through the public and private sectors. The report has been prepared for use by interested individuals and agencies to foster informed debate on health funding and expenditure issues. The health system is an important and growing component of the national economy and provides essential services for the people of New Zealand. The information in this report provides a basis for identifying and measuring trends and changes in the patterns of health and disability expenditure in New Zealand. This data is also useful in evaluating policies related to health and disability expenditure levels and patterns, and provides a basis for comparing New Zealand’s expenditure with other nations. As the purpose of this document is to present an estimate of total expenditure on health, it does not include any discussions on health service quality, efficiency or effectiveness. These financial estimates, together with other information supplied by the Ministry and others that do focus on qualitative issues contribute information resources necessary for the public, researchers and policy makers to assess the performance of the health system over time. Readers interested in more qualitative aspects of the New Zealand health system can go to the quality improvement section of the Ministry’s website (see www.health.govt.nz/new-zealand-health-system). This report contains updated expenditure estimates for total current health and disability services1 and health-related functions in New Zealand at the aggregate level, on a per capita basis, by source of funds, by function of care, of provider industry and in nominal and real terms since 1999/00. The estimates include both public and private health expenditure. The public source of funding is predominately administered by the Ministry, primarily consisting of funding for services provided by district health boards (DHBs). Other sources of public funding include social security (Accident Compensation Corporation (ACC)), other central government agencies (for example, Ministry of Justice) and local and regional councils. Private sector sources of health funding include private insurance, household out-of-pocket expenditure and
1 Total current health refers to the sum of activities performed by either institutions or
individuals pursuing, through the application of medical, paramedical and nursing knowledge and technology, core health activities.
Total health refers to the sum of current health activities and health-related activities.
See also Appendix 1: OECD System of Health Accounts.

iv Health Expenditure Trends in New Zealand 2000–2010
non-governmental funding of not-for-profit organisations serving households, such as The Royal New Zealand Plunket Society and the National Heart Foundation of New Zealand. In 2003/04, New Zealand adopted the System of Health Accounts (SHA) developed by the Organisation for Economic Co-operation and Development (OECD) for defining and aggregating total current health and health-related expenditure. This report contains seven years of information using the SHA categories. New Zealand has not yet incorporated expenditure for capital items in the expenditure estimates. Using the SHA means that the New Zealand estimates now and in the future will be more comparable with other countries; however, for earlier years some consistency at a detailed level is lost. To assess the impact due to changing to SHA reporting in 2003/04, and other refinements undertaken in that year, see the Health Expenditure Trends in New Zealand (HET) report for 1994–2004. Please note that some of the data in this report has been collected by means of sample surveys and has consequently been estimated conservatively. Therefore, care should be taken in interpreting changes in individual categories of expenditure from year to year. In addition, future refinements in the accuracy of the estimates can be expected. This document and prior editions in the series can be located on the Ministry’s website at: www.health.govt.nz/publications The Ministry is grateful for the assistance of those who have contributed data and analysis used in preparing this report.
John Hazeldine Manager National Health Board Business Unit

Health Expenditure Trends in New Zealand 2000–2010 v
Acknowledgements The author is indebted to the many individuals and organisations that provided information and gave generously of their time to assist with this study. The people and organisations involved are numerous and are named in Appendix 7: Contributors. The author would like to thank all those people and organisations for their assistance.


Health Expenditure Trends in New Zealand 2000–2010 vii
Contents
Foreword iii
Executive summary xi
1 Introduction 1
1.1 Purpose 1 1.2 Background 1 1.3 Ministry responsibilities and funding levels 2 1.4 Structure of the New Zealand public health and disability sector 3 1.5 Other funders of the New Zealand public health and disability sector 5
2 OECD system of health accounts – definitions and classifications 6
2.1 Health services 6 2.2 Functions of health care 7 2.3 Health-related functions 7 2.4 Providers of health-care services and goods 8 2.5 Sources of funding 8
3 Methods and conventions 9
3.1 Report coverage 9 3.2 Categories of health expenditure 9 3.3 Funding sources 10 3.4 Sources and assumptions for Ministry-funded services 10 3.5 Ministry-funded services, excluding DHBs 10 3.6 DHB-funded services 11 3.7 Crown Health Enterprise/DHB deficit financing 11 3.8 Sources and assumptions related to services funded by other central
government agencies 11 3.9 Sources and assumptions related to services funded by local government 12 3.10 Sources and assumptions related to services funded by the private sector 12 3.11 Real dollar health expenditure 12 3.12 Goods and services tax and overhead charges 13 3.13 Populations 13

viii Health Expenditure Trends in New Zealand 2000–2010
4 Trends in total current health expenditure by funding source 14
4.1 Aggregate health expenditure 14 4.2 Trends in real per capita current expenditure on health 18 4.3 Pattern of health care funding, by source of funds 20 4.4 Trends in uses of aggregate health and health-related funds 21
5 Public sector funding – Ministry of Health 23
5.1 Ministry of Health funding 23 5.2 Ministry of Health funding by major expenditure category 25
6 Other public sector funding 33
6.1 Accident Compensation Corporation 34 6.2 Other government agencies 37 6.3 Regional and local authorities 44 6.4 Trends in the use of other public funding 45
7 Private sector funding 49
7.1 Out-of-pocket expenditure 49 7.2 Health insurance 50 7.3 Voluntary and not-for-profit organisations 54 7.4 Trends in uses of private source funding 55
8 International comparisons 60
8.1 Data comparison issues 60 8.2 Per capita health expenditure in US dollar purchasing power parities 61 8.3 Health expenditure as a percentage of GDP 61 8.4 Publicly funded current health expenditure as a proportion of total health
expenditure 66 8.5 Health expenditure and GDP per capita 69
Appendices Appendix 1: OECD system of health accounts 73 Appendix 2: Nominal and real health expenditure (with ‘non-health’ items
included for prior years) 1999/00–2009/10 81 Appendix 3: Health expenditure trends in New Zealand (with ‘non-health’ items
included for prior years) 82 Appendix 4: Private health insurance trends, 1999/00–2009/10 ($000) 84 Appendix 5: Current expenditure on health by function of care and provider
industry (SHA Standard Table 2) 85 Appendix 6: Current expenditure on health and health-related services by
function of care and funder (SHA Standard Table 5) 91 Appendix 7: Contributors 95

Health Expenditure Trends in New Zealand 2000–2010 ix
References 101
Information sources 101
List of tables Table 4.1: Real current expenditure trends, 1999/00–2009/10 18 Table 4.2: Health expenditure by source of funds (%), 1999/00–2009/10 20 Table 4.3: Destinations of total health funding (including health-related),
2005/06–2009/10 22 Table 5.1: Ministry of Health expenditure, 1999/00–2009/10 24 Table 5.2: Destinations of Ministry funding, 2005/06–2009/10 26 Table 5.3: Destinations of DHB and non-DHB funding, 2005/06–2009/10 29 Table 5.4: Ministry of Health expenditure, by output class, 2007/08–2009/10 32 Table 6.1: ACC current health expenditure ($ million), 2005/06–2009/10 35 Table 6.2: Current health expenditure and health-related expenditure by other central
government agencies, 2005/06–2009/10 42 Table 6.3: Current health and health-related expenditure by local authorities,
2005/06–2009/10 46 Table 6.4: Total other public funding (excluding the Ministry), 2005/06–2009/10 47 Table 7.1: Survey responses for out-of-pocket expenditure, using SHA,
2005/06–2009/10 51 Table 7.2: Destinations of insurance funding on personal health care ($ million),
2003/04–2009/10 52 Table 7.3: Proportion of the New Zealand population covered by medical insurance
(by age group), 2007–2010 53 Table 7.4: Destination of private funding of health services, using SHA,
2005/06–2009/10 56 Table 7.5: Destination of private funding of health services using SHA and funder,
2005/06–2009/10 58 Table 8.1: Per capita current health expenditure (US$ PPP) for OECD countries,
1999–2009 62 Table 8.2: Current health expenditure as a percentage of GDP, 1999–2009 64 Table 8.3: Publicly funded health expenditure as a proportion of total current health
expenditure, 1999–2009 67 Table 8.4: Per capita GDP and per capita current health expenditure (US$ PPP) for
OECD countries, 2006–2009 71 Table A1: Functions of health care 76 Table A2: Health-related functions 78 Table A3: OECD SHA provider industry 79 Table A4: OECD SHA sources of funding 80

x Health Expenditure Trends in New Zealand 2000–2010
List of figures Figure 1: Percentage shares of New Zealand’s total current health funding, 2000 and
2010 xiv Figure 1.1: Structure of the New Zealand health and disability sector, 2010 4 Figure 4.1: Aggregate real ($ million 2009/10) health expenditure, 1925–2010 15 Figure 4.1A: Aggregate real ($ million 2009/10) health expenditure, 1980–2010 16 Figure 4.1B: Aggregate real (per capita 2009/10) health expenditure, 1980–2010 16 Figure 4.2: Publicly and privately funded expenditure shares, 1925–2010 17 Figure 4.2A: Publicly and privately funded expenditure shares, 1980–2010 17 Figure 4.3: Trends in real total current expenditure on health, 1999/00–2009/10
($ million 2009/10) 19 Figure 4.4: Trends in real per capita current expenditure on health, 1999/00–2009/10
($ million 2009/10) 19 Figure 4.5: Percentage shares of New Zealand’s total current health funding, 2000 and
2010 21 Figure 8.1: Relationship between current health expenditure and GDP in OECD
countries, 2008 69

Health Expenditure Trends in New Zealand 2000–2010 xi
Executive summary This report, Health Expenditure Trends in New Zealand 2000–2010, is the latest in a regular series prepared by the Ministry of Health (the Ministry). The primary purpose of the Health Expenditure Trends in New Zealand (HET) series is to provide information on the estimate of current expenditure in the health and disability sector, with a focus on the 2008/09 and 2009/10 estimates. This HET report provides updated estimates for total current health and disability services expenditure in New Zealand, at the aggregate level, on a per capita basis, by source of funds, and in nominal and real terms, since 1999/00. In 2003/04, New Zealand implemented the System of Health Accounts (SHA)2 developed by the Organisation for Economic Co-operation and Development (OECD) for defining and aggregating total current health expenditure and health-related expenditure for reporting to the OECD and HET. The New Zealand estimates now enable better comparisons to be made between OECD countries; however, for years prior to 2003/04, some consistency at a detailed level is lost. Therefore, this report provides consistent information only at a summary level, with SHA details only for the seven-year period 2003/04 to 2009/10. This HET report follows the HET 1998–2008 report. The most significant impact on the estimates due to implementing SHA is the broadening of the definition of ‘health sector’ to include additional disability and support and long-term care services. Prior to 2003/04, HET reports identified the funding transfer from social agencies, largely from the Ministry of Social Development to the Ministry of Health, and primarily in terms of disability support services, but excluded part of these services from the health expenditure. The bulk of health expenditure (mainly disability support services) previously administered by the Ministry of Social Development was transferred to the Ministry of Health between 1993/94 and 1995/96. For historical information covering the period 1995/96 to 2002/03, the estimates have been recalculated to include the previously excluded items. The expanded definition of health functions takes into account recent changes in health care systems, especially the growing importance of services for the elderly (long-term care, including home care). Within the OECD, the most important factor affecting comparability remains the different treatment of long-term nursing care across countries (OECD 2005). New Zealand will continue to refine and improve estimates in this area in future HET editions.
2 See: www.oecd.org/dataoecd/41/4/1841456.pdf

xii Health Expenditure Trends in New Zealand 2000–2010
Implementing the SHA provided an opportunity to review data collection sources, processes and assumptions involved in compiling health expenditure figures. As a result, several refinements have enhanced the accuracy of the estimates starting in 2003/04. To assess the impact due to changing to SHA reporting in 2003/04, and other refinements undertaken in that year, please refer to the HET report for 1994–2004.3 The main focus of this report is on the SHA-based total current health expenditure figures for 2008/09 and 2009/10. Trend information is also provided. Historical and current expenditure comparisons use the most appropriate points in time, given changes in methodologies and assumptions. The health and disability expenditure presented in this report includes goods and services tax (GST) at its prevailing rate, which was then 12.5%. Unless stated otherwise, all expenditure is expressed in nominal dollar values. Chapter 1 provides an overview of New Zealand’s health sector, which establishes the scope of the data in this report. Chapter 2 sets out the approach and definitions used in preparing the report. It contains a brief overview of the SHA classifications, which cover three dimensions: health care by functions of care, providers of health care services and sources of funding. The set of core tables in the SHA addresses three basic questions.
1. What kind of services are performed and what types of goods are purchased?
2. Where does the money go to (provider of health care services and goods)?
3. Where does the money come from (source of funding)? The implementation of SHA introduces the concept and estimates of ‘health-related’ functions that are distinguished from ‘core health’ care functions. Health-related functions can be closely linked to health care in terms of operations, institutions and personnel but are, as far as possible, excluded when measuring activities and expenditure belonging to core health care functions. They are mainly services that have a direct and beneficial impact on collective health and, if reported in historical HET reports, were included as public health services. For 2009/10, the estimate of health-related functions totals nearly $2,997 million. Estimates of current health and health-related expenditure for this report were derived from annual reports and direct survey responses.4 Chapter 3 presents the methods and conventions followed in the report, along with a description of the types of data collected.
3 See: www.health.govt.nz/publications 4 See Appendix 6.3: Current Expenditure on Health and Health-related Services by Function of
Care and Funder (SHA Standard Table 5): 2009/10.

Health Expenditure Trends in New Zealand 2000–2010 xiii
Chapter 4 discusses trends in nominal (actual dollars spent) and real (Consumers Price Index (CPI) adjusted dollars spent) total current expenditure, and nominal and real total per capita current expenditure on health between 2000 and 2010. Summary information on the source and final use of funds is also provided. All indicators report significant increased funding of health services; in total, constant dollar terms (real dollars), on a per capita basis, as a percent of gross domestic product (GDP) and as a percent of government funding. Chapter 4 explains that total current nominal health and disability expenditure rose 6.1% during 2009/10 to $19,870.4 million, compared with $18,729.5 million in 2008/09. Of this total, public funding increased to $16,536.3 million in 2009/10. Real per capita aggregate expenditure increased by 3.1% to $4,549 per person. Total current health expenditure as a percentage of GDP was 10.5% in 2009/10 compared with 10.2% in 2008/09. Chapters 5 to 7 present a more detailed discussion of expenditure by funding source, covering the Ministry and other public and private funding channels for the years under review. Chapter 5 provides detailed information on the Ministry’s funding of health services. Separate profiles have been detailed for non-devolved services funded by the Ministry and devolved services funded through district health boards (DHBs). The Government’s health funding through the Ministry’s Vote Health was the largest contributor to total health and disability funding, at $14,403.9 million in 2009/10, or 72.5% of total funding. The 2009/10 nominal dollar expenditure represented an increase of $1,128.5 million compared with 2008/09 expenditure. In 2009/10, Ministry-funded DHB-devolved services represented $11,582.2 million, of which personal health was the largest component at $11,173.5 million. Chapter 6 discusses other sources of public funding. The Accident Compensation Corporation (ACC) was the second largest public funder of health services at $1,669.8 million in 2009/10, accounting for 8.4% of total current health expenditure. Other central government agencies contributing to direct health and indirect health-related expenditure that are included in this report are the Ministries or Departments of:
• Agriculture and Forestry
• Education
• Research, Science and Technology
• Defence
• Social Development
• Corrections
• Internal Affairs
• Te Puni Kōkiri (Māori Development)
• Pacific Island Affairs.

xiv Health Expenditure Trends in New Zealand 2000–2010
These other central government agency contributions to total current health expenditure totalled $395.3 million in 2009/10. Regional and local councils funded $67.2 million in current health expenditure in 2009/10 and a more significant $1,691.3 million for health-related functions.5 Chapter 7 presents private sources of funding; comprising household out-of-pocket expenditure, health insurance and non-governmental funding of not-for-profit organisations. In total, this expenditure accounted for approximately $3,334.1 million or 16.8% of total current health expenditure in 2009/10. Within the private funding increase, private health insurance expenditure increased by an average annual growth rate of 6.2% since 2003/04, to $974.9 million in 2009/10. During the same period, private household spending grew 2.9% to $2,086.5 million. Expenditure by the not-for-profit sector was estimated at $272.6 million for 2009/10. The following figure presents the major funder groups and their contribution to total current health expenditure in 2000 and 2010.
Figure 1: Percentage shares of New Zealand’s total current health funding, 2000 and 2010
1999/00 2009/10
Publicly funded Privately funded
79.1% 83.2% 20.9% 16.8%
Other government
Local authorities
Ministry of Health
69.6% 72.5% 2.7% 2.0% 0.6% 0.3%
Healthinsurance
Not-for-profit organisations
Privatehousehold
14.6% 10.5% 6.0% 4.9% 0.3% 1.4%
Social securityACC
6.2% 8.4%
Source: Ministry of Health
Chapter 8 discusses New Zealand’s current expenditure on health and disability services in the context of current health expenditure by other member countries of the OECD. The chapter provides comparisons of the level of current health expenditure, the proportion of current health expenditure to GDP and the percentage of publicly funded current health expenditure in OECD countries. One key finding from this analysis was that New Zealand’s proportion of current health expenditure to GDP increased from 8.0% in 1999 to 10.3% in 2009. In comparison, the OECD weighted average increased from 7.9% in 1998 to 9.6% in 2009.
5 Estimates of health and health-related expenditure for this group of agencies were derived
from annual reports and direct survey responses.
Health Expenditure Trends in New Zealand 2000–2010 xv
Appendices 1 to 6 give more in-depth definitions and provide further detailed historical information on expenditure. Appendices 5 and 6 provide standard SHA tables that show who provides and funds various services. Appendix 7 lists the organisations and individuals who provided information for this report. Please note that some of the data in this report has been collected by means of sample surveys and has consequently been estimated conservatively. Care should be taken when interpreting changes in individual categories of expenditure from year to year. In addition, future refinements in the accuracy of the estimates are to be expected. For comparative purposes and trend analysis, the seven-year period 2003/04 to 2009/10 data provides consistent information using the SHA definitions and categories. Strict comparability for earlier years at the detailed level is no longer possible because of changes in scope and category definitions.


Health Expenditure Trends in New Zealand 2000–2010 1
1 Introduction
1.1 Purpose This Health Expenditure Trends (HET) report is the latest in a regular series prepared by the Ministry of Health (the Ministry). The series aims to provide information, including estimates of current expenditure, on the health and disability sector for use by interested agencies, individuals and the OECD. The expenditure estimates include all funding of health services in New Zealand channelled through the public and private sectors.
1.2 Background The Ministry’s role in the funding of health services has remained relatively stable over the past 27 years. The health reforms of the 1980s and 1990s were not of the same magnitude as the changes that occurred during the middle of the 20th century. Prior to World War II, private funding of health care dominated in New Zealand, accounting for around 57% of total funding in 1925. By 1945, however, the public share had grown to 74% of total expenditure and steadily increased to peak at 88% by the early 1980s. Over the past 30 years, the percentage of total current funding from public sources gradually reduced from a high of 88% to within the range of 77% to 83%, which has persisted since 1992. Of this public funding source, the Government’s direct health funding through the Ministry is the largest contributor to the total health and disability funding, at approximately 72.5% in 2009/10 compared with 69.6% in 1999/00. The organisation of publicly funded health and disability support services in New Zealand has undergone a number of changes in the last two decades. These have ranged from a ‘purchaser/provider’ market-oriented model introduced in 1993 to the more community-oriented model that is currently in place. The current system was implemented through the New Zealand Public Health and Disability Act 2000. This allowed for the creation of district health boards (DHBs), a key step in moving to a population-based health system. Figure 1.1, on page 4, shows the current structure of the New Zealand health and disability support sector.

2 Health Expenditure Trends in New Zealand 2000–2010
1.3 Ministry responsibilities and funding levels DHBs are responsible for providing, or funding the provision of, health and disability services in their geographic district. There are 206 DHBs in New Zealand that have existed since 1 January 2001. The activities of the DHBs are guided by two overarching strategies for the health and disability sector: the New Zealand Health Strategy and the New Zealand Disability Strategy. DHBs are supported by the Ministry, which provides national policy advice, regulation, funding and monitors the performance of each DHB.7 The majority of the Ministry’s health services funding is devolved to DHBs, making up 80.4% of Ministry expenditure in 2009/10. This equates to 70.0% of public expenditure and 58.2% of total current health expenditure in 2009/10. The Minister of Health has overall responsibility for the health system. The Minister works through the Ministry to enter into accountability arrangements with DHBs and set health and disability strategies. The Minister also agrees, together with government colleagues, how much public money will be spent on the public health system. The Ministry is responsible for ensuring the health and disability system works for New Zealanders. The Ministry is the government’s primary advisor on health policy and disability support services and is responsible for:
• providing policy advice on improving health outcomes, reducing inequalities and increasing participation
• acting as the Minister’s agent
• monitoring the performance of DHBs and other Crown entities in the health sector
• implementing, administering and enforcing relevant legislation and regulations
• providing health information and processing payments
• facilitating collaboration and coordination within and across sectors
• planning and maintaining service frameworks nationwide
• planning and funding public health services, disability support services and other service areas that are retained centrally.
To this end, the production and distribution of this HET document contributes to informed debate on health funding and expenditure issues.
6 Southland and Otago DHBs merged May 2009, reducing the number of DHBs from the
original 21 DHBs to 20. 7 See: www.health.govt.nz/healthsystem for more details.

Health Expenditure Trends in New Zealand 2000–2010 3
1.4 Structure of the New Zealand public health and disability sector
DHBs are responsible for planning and purchasing health and disability services for their districts and are governed by community boards that consist of a mix of elected and appointed members, with the majority (seven) elected by the community. DHBs are Crown entities whose boards are responsible to the Minister. In recognition of the Crown’s relationship with Māori, each board must have at least two Māori members or a greater number if Māori make up a higher proportion of the DHB’s population. DHBs are also principal providers of secondary and tertiary hospital care. DHBs are responsible for both funding health care services to a geographically defined population and providing acute hospital services. They are responsible for improving, promoting and protecting the health and independence of their populations. Each DHB must assess the health and disability support needs of the people of its region and manage its resources appropriately. Central government provides broad guidelines on what services the DHBs must provide. National priorities in health have been identified in the New Zealand Health Strategy. In addition, the Minister’s priorities and health targets are reflected in DHB plans and accountability arrangements. DHBs enter into service agreements with a range of providers, including public hospitals, not-for-profit health agencies, iwi groups and private organisations to meet the health needs of their geographic populations.

4 Health Expenditure Trends in New Zealand 2000–2010
Figure 1.1: Structure of the New Zealand health and disability sector, 2010
Minister of Health
ACC levies and premiums Tax payments
Ministerial Advisory
Committee
Formal accountability Funding
Central Government
Annual Purchase Agreement Reporting
Ministry of Health • Advise on policy • Provide health information and process payments • Facilitate collaboration and co - ordination
Acting on behalf of the Minister to: • implement , administer and enforce legislation and
regulations • plan and fund some services • plan and maintain nationwide service frameworks • monitor
Contracts
Accident Compensation
Corporation (ACC)
Reporting for monitoring
Service agreements for some services
Reporting for monitoring
Negotiation of accountability
20 District Health Boards
Service agreements
Reporting for monitoring
Private and NGO providers
• Pharmacists, laboratories, radiology clinics
• PHOs, GPs , midwives, independent nursing practices
• Voluntary providers • Community trusts • Private hospitals • M āori and Pacific providers • Disability support services
Reporting for monitoring
Service agreements
District Health Board provider arms
Predominantly hospital services, and some community services,
public health services, and assessment, treatment and
rehabilitation services
Some fees/ co - payments
Services
Private health
insurance Services
New Zealand population and business enterprises
New Zealand health and disability support services

Health Expenditure Trends in New Zealand 2000–2010 5
1.5 Other funders of the New Zealand public health and disability sector
In addition to the Ministry, a significant amount of public funding on health services comes from the Accident Compensation Corporation (ACC). ACC is a statutory insurance organisation owned by the state that provides compulsory, comprehensive, no-fault insurance cover for accident-related injuries to all New Zealanders. The OECD defines ACC as ‘social security’. In 2008/09, funding from ACC accounted for approximately 9.7% ($1,820.2 million) of total current health expenditure. This decreased to 8.4% ($1,669.8 million) in 2009/10. In addition, relatively small amounts of personal health are funded by the Department of Corrections in relation to prisoners, the New Zealand Defence Force in relation to active duty military personnel and war pensioners. Other central government agencies fund prevention, public health, health administration and health-related services (see Chapter 6.2: Other government agencies). The private funding of the health sector includes private insurance, household out-of-pocket spending and non-government funding of not-for-profit organisations. The expenditure estimates for private funding are largely based on surveys and sampling techniques. Consequently, this information is less consistent and reliable. Given this qualification, however, indications are that the private funding of health services has remained relatively stable over the past decade at approximately 20% of the total funding.

6 Health Expenditure Trends in New Zealand 2000–2010
2 OECD system of health accounts – definitions and classifications
Below are brief definitions of the OECD System of Health Accounts (SHA) for the expenditure reported since 2003/04. A more detailed discussion of the definitions of OECD health services and health-related categories (OECD 2000) is provided in Appendix 1.
2.1 Health services At a fundamental level, expenditure on health care and health-related services included in HET reports conforms to the definition developed for the World Health Organization (WHO) (Abel-Smith 1963). In defining health services, Abel-Smith states that:
The purpose of health services is to promote health; to prevent, diagnose and treat diseases, whether acute or chronic, whether physical or mental in origin and to rehabilitate people incapacitated by disease or injury.
This general statement does not define which services are, or should be, included or excluded from SHA as ‘total health expenditure’ or ‘health-related memorandum items’. Departing from the conventions of earlier HET reports, data starting in 2003/04 includes previously defined ‘non-health’ items transferred from social agencies to the Ministry. These services are now considered an integral part of health by the Ministry and the OECD. Brief descriptions of the main service categories are given below. The SHA cover three dimensions: health care by functions of care, providers of health care goods and services, and sources of health funding. The provision of health care and its funding is a complex, multi-dimensional process. The set of core tables in the SHA addresses three basic questions.
• What kinds of services are performed and what types of goods are purchased (functions of health care)?
• Where does the money go to (providers of health care services and goods)?
• Where does the money come from (source of funding)?

Health Expenditure Trends in New Zealand 2000–2010 7
2.2 Functions of health care The broad underlying concept of health care is consistent with historical HET reports. Activities of health care comprise the sum of activities performed either by institutions or individuals pursuing, through the application of medical, paramedical and nursing knowledge and technology, the goals of:
• promoting health and preventing disease
• curing illness and reducing premature mortality
• caring for persons affected by chronic illness who require nursing care
• caring for persons with health-related impairment, disability and handicaps who require nursing care
• assisting patients to die with dignity
• providing and administering public health
• providing and administering health programmes, health insurance and other funding arrangements.
(OECD 2000, p 42) ‘Health care’ includes personal health care services provided directly to individual persons, and collective health care services, covering the traditional tasks of public health such as health promotion and disease prevention, including setting and enforcing standards, and health administration and health insurance.
2.3 Health-related functions The OECD health-related functions are distinguished from the core health care functions. They are closely linked to health care in terms of operations, institutions and personnel but are, as far as possible, excluded when measuring activities and expenditure belonging to core health care functions. These are services that have a direct and beneficial impact on collective health and, when reported historically, were included in the HET reports as public health services. The HET and OECD SHA categories include separate reporting for the following health-related functions:
• education and training of health personnel
• research and development in health
• food, hygiene and drinking water control
• environmental health.

8 Health Expenditure Trends in New Zealand 2000–2010
The expenditure estimates are conservative because they do not fully include the administration and provision of social services and the provision of health-related cash benefits to private households. Furthermore, no provision has been made at this time for capital formation of health provider institutions (HC.R.1), administration and provision of social services in kind to assist living with disease and impairment (HC.R.6), and administration and provision of health-related cash benefits (HC.R.7).8 These are refinements that may be included in subsequent years and could be material.
2.4 Providers of health-care services and goods The SHA include a dimension for the provider sector: ‘Where does the money go?’ or ‘Who provides the services?’ This is a new element of expenditure reporting for New Zealand. The classifications used are based on draft common industrial classifications of North American Free Trade Organization (NAFTA) countries and the North American Industrial Classification System (NAICS 1998). These detailed classifications are condensed into the following groups: hospitals, nursing, residential care facilities, ambulatory care, retail and other providers, administration and other.
2.5 Sources of funding The HET report contains a breakdown of expenditure on health by funder type as follows:
• government-provided health care, which is further segregated by government agency – the Ministry (including DHBs), ACC, other central government, and regional and local government
• out-of-pocket expenditure by private households
• private insurance
• not-for-profit organisations. This classification system corresponds to payer information contained in historical HET reports. The summary funder groups that remain intact are total public and total private funding.
8 Codes come from the SHA functions (see Appendix 1.2: OECD System of Health Accounts:
Health-related functions).

Health Expenditure Trends in New Zealand 2000–2010 9
3 Methods and conventions
3.1 Report coverage This chapter introduces the methods and conventions used in collating SHA expenditure and describe the types of data collected. As already noted, the analysis in this report is based on the OECD SHA, which defines what categories of expenditure should be included or excluded when comparing current health and health-related expenditure internationally. This report provides information and comments on health and disability expenditure within the OECD definition of ‘health services’. Appendices 5 and 6 cover two key OECD SHA tables: expenditure by function of care and provider industry and total current expenditure on health, including health-related functions by funder category. There are three tables under each of these appendices, one for each year 2007/08 to 2009/10.
3.2 Categories of health expenditure Trend information covering the full 10-year period is aggregated by public and private funding of health, including values preceding SHA implementation in 2003/04. Information for the seven-year period from 2003/04 to 2009/10 is based on summary SHA information for the following categories.
3.2.1 Personal health
• Inpatient care – curative and rehabilitative, and long-term nursing care.
• Services of day care – curative, rehabilitative and long-term nursing care.
• Outpatient care – curative, rehabilitative, basic medical and diagnostic services, dental care, all other specialised care and all other outpatient care.
• Home care – curative, rehabilitative and long-term nursing care.
• Ancillary services to health care.
• Medical goods dispensed to outpatients – pharmaceuticals and other medical non-durables, and therapeutic appliances and other medical durables.
The above services are the components of personal health care. In addition, trend information is provided for two other components of current health expenditure and health-related functions.

10 Health Expenditure Trends in New Zealand 2000–2010
3.2.2 Collective health
• Prevention and public health services.
• Health administration and health insurance.
3.2.3 Health-related
• Education and training of health personnel.
• Research and development in health.
• Food, hygiene and drinking water control.
• Environmental health. New Zealand does not report on two health-related functions: capital formation of health care provider institutions and the administration and provision of health-related cash benefits. Caution should be exercised when interpreting the disaggregated information, because New Zealand has only recently implemented SHA reporting and refinements are expected.
3.3 Funding sources Public sector health funding includes the government’s direct health expenditure through the Ministry (including DHBs), as well as other central government funding, including ACC, other government agencies (Agriculture and Forestry; Defence; Education; Internal Affairs; Corrections; Te Puni Kōkiri (Ministry of Māori Development); Pacific Island Affairs; Research, Science and Technology; and Social Development), and local authorities (regional, district and city councils). Private sector funding for health and health-related activities comes from out-of-pocket expenditure by private households, expenditure by health insurance companies on behalf of their policyholders and health-related expenditure by not-for-profit organisations met by funds from non-governmental sources.
3.4 Sources and assumptions for Ministry-funded services
Current Ministry expenditure is sourced and valued from internal financial records, segregated by services, and it relates to services purchased directly by the Ministry or via devolved purchasing through the DHBs. The Ministry head office departmental expenditure represents a third category of Ministry health funding.
3.5 Ministry-funded services, excluding DHBs The Ministry non-departmental expenditure for services purchased from non-DHB providers has been profiled according to SHA function codes in consultation with Ministry Corporate Finance. An apportionment was also performed for the SHA provider industry.

Health Expenditure Trends in New Zealand 2000–2010 11
3.6 DHB-funded services The DHB-funded services are profiled directly from the DHB funder arm year-end financial templates as provided to the Ministry by DHBs. Expenditure within the funder arm represents the purchase of services from all providers, including the purchase of services from the respective DHBs’ own provider arms and other DHBs. Revenues from other third-party purchasers, including other central or local government agencies, are not included in the funder arm, so there is no double counting of current health expenditure within DHB providers. The financial templates are at line-item level and thus match with SHA service function and SHA provider industry coding.
3.7 Crown Health Enterprise/DHB deficit financing
Deficits of DHBs, previously known as Crown Health Enterprises (CHEs) and Hospital and Health Services (HHS), have been included in HET reports since 1997/98 as part of publicly funded health expenditure. The operating deficits incurred by DHBs and CHEs reflect the difference between operating income and operating expenses. These deficits were incorporated into the government accounts funded by the Ministry. Since 2003/04, the deficits have been added to the DHB funder arm expenditure. The inclusion of this deficit funding is necessary to provide an accurate picture of the expenditure on current health and health-related expenditure in New Zealand in a given year. This is because these are publicly owned entities and the government is ultimately responsible for their financing. Publicly funded health expenditure, including DHB deficit financing, amounted to 83.2% of total expenditure in 2009/10.
3.8 Sources and assumptions related to services funded by other central government agencies
Starting in 2003/04, the primary source for estimating other central government health expenditure changed from an annual survey conducted by the Ministry to the agencies’ respective annual reports. This information is augmented by survey or direct responses when necessary. Additional information on the individual agencies is provided in Chapter 6.2: Other government agencies. These estimates are conservative in that they tend not to include an administrative component.

12 Health Expenditure Trends in New Zealand 2000–2010
3.9 Sources and assumptions related to services funded by local government
Starting in 2003/04, the primary source for estimating local government health expenditure has been their annual reports. Changing source data for local governments is similar to the change for central government agency estimates and, likewise, this information is augmented by survey or direct responses when necessary. Additional information pertaining to local government expenditure is provided in Chapter 6.3: Regional and local authorities.
3.10 Sources and assumptions related to services funded by the private sector
Private sources of funding consist of out-of-pocket expenses, health insurance and not-for-profit organisations. The estimate for 2009/10 out-of-pocket expenditure is based on the Household Economic Survey (HES) for 2009/10.9 This survey has consistently been the source of data for the estimate of out-of-pocket expenditure. Estimates of health insurers’ total current expenditure on health care is based on data provided by the Health Funds Association of New Zealand Inc (HFANZ). This source also remains unchanged; however, from 2004/05, the estimates have been based on aggregate information,10 whereas previous years’ estimates were based on a direct survey. Estimates for the not-for-profit sector are based on an expanding sample of organisations’ annual reports. Additional information pertaining to private sector expenditure is provided in Chapter 7: Private Sector Funding.
3.11 Real dollar health expenditure New Zealand has no index specific to health expenditure that can be used to remove the effect of price inflation from nominal expenditure on health and disability support services. As with previous reports in this series, the Consumers Price Index (CPI) has been used to inflate nominal dollars to 2010 real dollar value. The CPI series used is given as part of Appendix 2. The series is based on the Statistics New Zealand long-term linked series for ‘all groups’. Annual changes are based on the change from the previous June quarter.
9 The Household Enterprise Survey (HES) is a Statistics New Zealand survey that was
conducted annually until 1998 but now takes the form of a tri-annual survey. 10 Health insurance statistics, July 2010 (HFANZ 2010).

Health Expenditure Trends in New Zealand 2000–2010 13
3.12 Goods and services tax and overhead charges The health and disability expenditure presented in this HET report includes goods and services tax (GST) at its prevailing rate, which was then 12.5%. Starting in 2005/06, central governmental financial reporting is GST exclusive. To retain consistency with prior years and report the full cost to consumers of health expenditure, a factor has been added when necessary for inclusion of this cost.
3.13 Populations The population data in this report is based on the definition of population commonly used by Statistics New Zealand. The estimated resident population is based on the census usual resident population count, with adjustments for residents missed or counted more than once by the census (net census undercount), and for residents temporarily overseas on census night.11
11 See: www.stats.govt.nz

14 Health Expenditure Trends in New Zealand 2000–2010
4 Trends in total current health expenditure by funding source
This chapter examines trends in New Zealand current health expenditure aggregated by public and private sources. This funding split has been consistent over the 10-year period and was not affected by the introduction of SHA definitions. The components of both public and private expenditure for 2005/06 to 2009/10 are examined in detail in the next three chapters and address trends for this five-year period.
4.1 Aggregate health expenditure Long-term trends (1925–2010) in health expenditure in New Zealand are shown below in relation to funding source (Figure 4.1) and public and private shares (Figure 4.2). The estimates for the years from 1995/96 to 2009/10 include previously excluded non-health items, primarily disability support services. Total current health care expenditure in New Zealand has risen from around $7 million in 1925 to around $19.9 billion12 in 2010 in nominal terms.13 In real terms, total current health expenditure rose during this period at an annual average rate of 5.1% (see Figure 4.1). Publicly funded expenditure grew at an annual average rate of 6.0%, and privately funded expenditure, starting from a higher base, grew at the slower rate of 3.7% per year during this period. Figure 4.2 shows that prior to World War II, private funding of health care dominated in New Zealand and accounted for around 57% of total funding in 1925. By 1945, however, the public share had grown to 74% of total expenditure and steadily increased to peak at 88% by the early 1980s, then gradually reduced to the range of 77% to 83% seen more recently.
12 This figure does not include OECD health-related expenditure. 13 See Appendix 6.3: Current Expenditure on Health and Health-related Services, by Function
of Care and Funder (SHA Standard Table 5): 2009/10.

Health Expenditure Trends in New Zealand 2000–2010 15
Public funding has remained stable within this narrow range since 1992 (see Figures 4.1A and 4.2A). The actual average growth rate of 5.1% exceeded the population growth rate of 1.3%. The impact on a per capita basis reflects the same expenditure pattern as for the entire population, but at a slightly lower rate of growth. Figure 4.1B presents the same information as Figure 4.1A but on a per capita basis. Since 1999/00, total real expenditure on health care has grown at an average annual compound rate of 5.0% per year. Public and private funding of health has grown by 5.5% and 2.9% respectively. Between 1999/00 and 2009/10, publicly funded real expenditure on health care increased by $6,903 million (89.7% of the total increase). Over the same period, privately funded real expenditure rose by $787 million (10.2% of the total increase).
Figure 4.1: Aggregate real ($ million 2009/10) health expenditure, 1925–2010
0
5,000
10,000
15,000
20,000
25,000
1925 1930 1935 1940 1945 1950 1955 1960 1965 1970 1975 1980 1985 1990 1995 2000 2005 2010
$ million
Total health
Publicly funded
Privately funded
Source: Ministry of Health

16 Health Expenditure Trends in New Zealand 2000–2010
Figure 4.1A: Aggregate real ($ million 2009/10) health expenditure, 1980–2010
0
5,000
10,000
15,000
20,000
25,000
1980 1982 1984 1986 1988 1990 1992 1994 1996 1998 2000 2002 2004 2006 2008 2010
$ million
Total health
Publicly funded
Privately funded
Source: Ministry of Health
Figure 4.1B: Aggregate real (per capita 2009/10) health expenditure, 1980–2010
0
1,000
2,000
3,000
4,000
5,000
1979/80 1984/85 1989/90 1994/95 1999/00 2004/05 2009/10
$ per capita
Total health
Publicly funded
Privately funded
Source: Ministry of Health

Health Expenditure Trends in New Zealand 2000–2010 17
Figure 4.2: Publicly and privately funded expenditure shares, 1925–2010
0%
20%
40%
60%
80%
100%
1925 1930 1935 1940 1945 1950 1955 1960 1965 1970 1975 1980 1985 1990 1995 2000 2005 2010
Publicly funded
Privately funded
Percentage
Source: Ministry of Health
Figure 4.2A: Publicly and privately funded expenditure shares, 1980–2010
0%
10%
20%
30%
40%
50%
60%
70%
80%
90%
100%
1980 1982 1984 1986 1988 1990 1992 1994 1996 1998 2000 2002 2004 2006 2008 2010
Publicly funded
Privately funded
Percentage
Source: Ministry of Health
18 Health Expenditure Trends in New Zealand 2000–2010
4.2 Trends in real per capita current expenditure on health
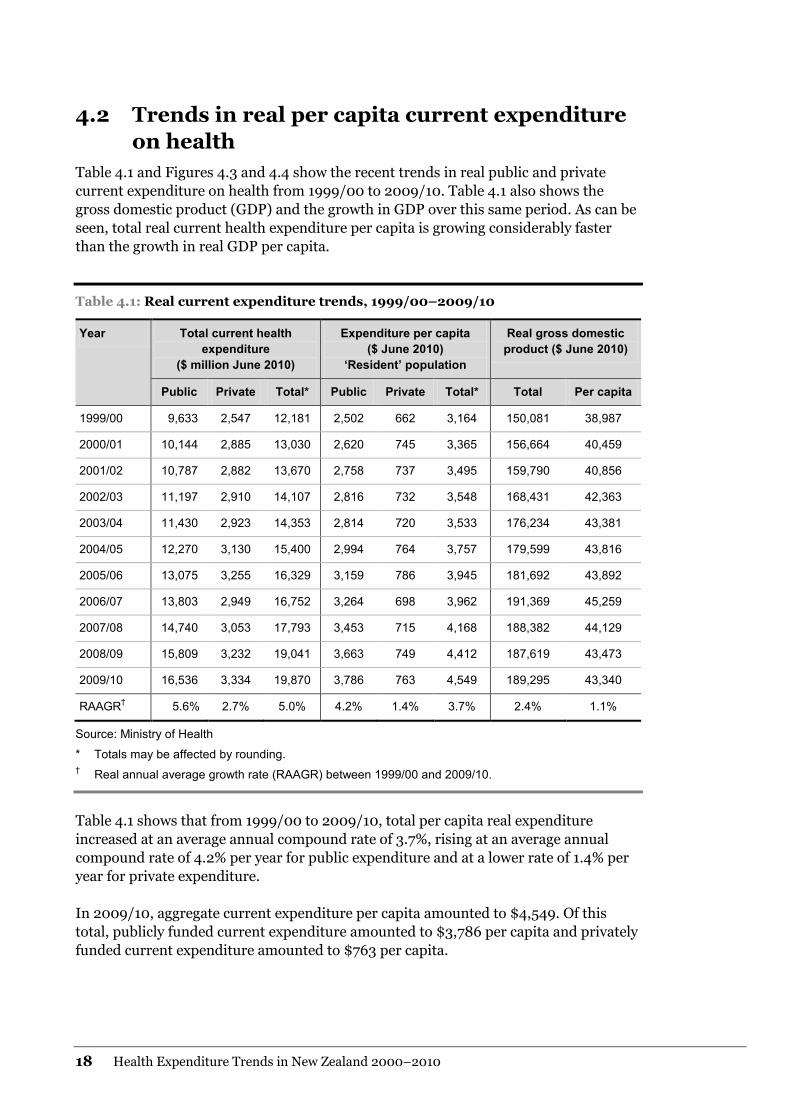
Table 4.1 and Figures 4.3 and 4.4 show the recent trends in real public and private current expenditure on health from 1999/00 to 2009/10. Table 4.1 also shows the gross domestic product (GDP) and the growth in GDP over this same period. As can be seen, total real current health expenditure per capita is growing considerably faster than the growth in real GDP per capita.
Table 4.1: Real current expenditure trends, 1999/00–2009/10
Year Total current health expenditure
($ million June 2010)
Expenditure per capita ($ June 2010)
‘Resident’ population
Real gross domestic product ($ June 2010)
Public Private Total* Public Private Total* Total Per capita
1999/00 9,633 2,547 12,181 2,502 662 3,164 150,081 38,987
2000/01 10,144 2,885 13,030 2,620 745 3,365 156,664 40,459
2001/02 10,787 2,882 13,670 2,758 737 3,495 159,790 40,856
2002/03 11,197 2,910 14,107 2,816 732 3,548 168,431 42,363
2003/04 11,430 2,923 14,353 2,814 720 3,533 176,234 43,381
2004/05 12,270 3,130 15,400 2,994 764 3,757 179,599 43,816
2005/06 13,075 3,255 16,329 3,159 786 3,945 181,692 43,892
2006/07 13,803 2,949 16,752 3,264 698 3,962 191,369 45,259
2007/08 14,740 3,053 17,793 3,453 715 4,168 188,382 44,129
2008/09 15,809 3,232 19,041 3,663 749 4,412 187,619 43,473
2009/10 16,536 3,334 19,870 3,786 763 4,549 189,295 43,340
RAAGR† 5.6% 2.7% 5.0% 4.2% 1.4% 3.7% 2.4% 1.1%
Source: Ministry of Health
* Totals may be affected by rounding. † Real annual average growth rate (RAAGR) between 1999/00 and 2009/10.
Table 4.1 shows that from 1999/00 to 2009/10, total per capita real expenditure increased at an average annual compound rate of 3.7%, rising at an average annual compound rate of 4.2% per year for public expenditure and at a lower rate of 1.4% per year for private expenditure. In 2009/10, aggregate current expenditure per capita amounted to $4,549. Of this total, publicly funded current expenditure amounted to $3,786 per capita and privately funded current expenditure amounted to $763 per capita.

Health Expenditure Trends in New Zealand 2000–2010 19
Figure 4.3: Trends in real total current expenditure on health, 1999/00–2009/10 ($ million 2009/10)
0
5,000
10,000
15,000
20,000
25,000
1999/00 2000/01 2001/02 2002/03 2003/04 2004/05 2005/06 2006/07 2007/08 2008/09 2009/10
Source: Ministry of Health
Figure 4.4: Trends in real per capita current expenditure on health, 1999/00–2009/10 ($ million 2009/10)
0
500
1,000
1,500
2,000
2,500
3,000
3,500
4,000
4,500
5,000
1999/00 2000/01 2001/02 2002/03 2003/04 2004/05 2005/06 2006/07 2007/08 2008/09 2009/10
Source: Ministry of Health

20 Health Expenditure Trends in New Zealand 2000–2010
4.3 Pattern of health care funding, by source of funds Table 4.2 shows the trend by source of funds for the period 1999/00 to 2009/10. Figure 4.5 compares 1999/00 and 2009/10 in terms of their breakdown of funding by source.
Table 4.2: Health expenditure by source of funds (%), 1999/00–2009/10
Ministry of Health
Deficit funding*
ACC† – social security
Other government agencies
Local authority
Total public funding
Private household
Health insurance
Not-for-profit organisations
Total private funding
Total
1999/00 69.5 0.1 6.2 2.7 0.6 79.1 14.6 6.0 0.3 20.9 100.0
2000/01 66.9 0.7 6.8 2.7 0.6 77.9 16.0 5.9 0.3 22.1 100.0
2001/02 66.3 2.2 7.2 2.7 0.6 78.9 15.3 5.5 0.3 21.1 100.0
2002/03 66.3 1.8 7.9 2.7 0.6 79.4 14.9 5.5 0.3 20.6 100.0
2003/04 69.7 0.0 7.7 1.7 0.5 79.6 14.1 5.5 0.8 20.4 100.0
2004/05 69.4 0.0 8.1 1.6 0.5 79.7 14.1 5.2 1.1 20.3 100.0
2005/06 69.3 0.0 8.5 1.7 0.6 80.1 13.8 5.1 1.0 19.9 100.0
2006/07 70.5 0.0 9.2 2.0 0.7 82.4 11.5 5.1 1.0 20.2 100.0
2007/08 70.6 0.0 9.5 2.2 0.5 82.8 11.2 5.0 0.9 17.2 100.0
2008/09 70.9 0.0 9.7 2.1 0.3 83.0 10.6 5.0 1.4 17.0 100.0
2009/10 72.5 0.0 8.4 2.0 0.3 83.2 10.5 4.9 1.4 16.8 100.0
Source: Ministry of Health
* Starting in 2003/04, the DHB operating deficits are reflected in the Ministry figures.
† Prior to 2003/04, ACC was classified as ‘other government agencies’. Data series have been restated back to 2000 to reflect this reclassification.

Health Expenditure Trends in New Zealand 2000–2010 21
Private funding as a percentage of total funding has remained between 16.8% and 22.1% from 1999/00 to 2009/10. Note, however, that 1997/98 was the last year the Household Economic Survey (HES) was conducted annually. The HES is now conducted every three years: 2001, 2004, 2007 and 2010. Estimates rather than survey results were used for out-of-pocket expenditure for the between years.
Figure 4.5: Percentage shares of New Zealand’s total current health funding, 2000 and 2010
1999/00 2009/10
Publicly funded Privately funded
79.1% 83.2% 20.9% 16.8%
Other government
Local authorities
Ministry of Health
69.6% 72.5% 2.7% 2.0% 0.6% 0.3%
Healthinsurance
Not-for-profit organisations
Privatehousehold
14.6% 10.5% 6.0% 4.9% 0.3% 1.4%
Social securityACC
6.2% 8.4%
Source: Ministry of Health
4.4 Trends in uses of aggregate health and health-related funds
The trends in total current expenditure for SHA health and health-related functions are shown in Table 4.3. These values have been estimated and reported in accordance with SHA definitions. Overall, current health expenditure has increased on average by 8.1% per year for the five-year period 2005/06 to 2009/10. Total personal medical services and goods have increased on average by 8.0% and are the major contributors to total expenditure. Within personal health services, outpatient care, (curative, rehabilitative and long-term nursing care) has grown at a higher rate than inpatient care. The health function with the highest rate of growth is therapeutic appliances and other medical durables at 12.2%; medical goods dispensed to outpatients have the lowest increase at 6.4%. Expenditure on health-related functions is growing at a slower rate of 5.9%. Environmental health has consistently been the largest contributor in dollar values to this category but shows a growth rate of 3.4%.

22 Health Expenditure Trends in New Zealand 2000–2010
Table 4.3: Destinations of total health funding (including health-related), 2005/06–2009/10
Health care services and goods by function ICHA-HC code14
2005/06 (000s)
2006/07 (000s)
2007/08 (000s)
2008/09 (000s)
2009/10 (000s)
Increase 2007/08 to 2008/09 (000s)
Increase 2008/09 to 2009/10 (000s)
Average annual
growth rate
Services of curative and rehabilitative care HC.1, HC.2 8,470,949 9,003,829 10,079,750 10,914,353 11,562,550 834,603 648,197 8.2%
Services of long-term nursing care HC.3 2,150,625 2,305,806 2,551,131 2,677,403 2,892,551 126,272 215,148 8.9%
Ancillary services to health care HC.4 769,867 770,079 856,449 997,264 1,030,295 140,815 33,031 8.0%
Medical goods dispensed to outpatients HC.5 1,892,740 1,852,378 1,910,666 2,056,431 2,208,906 145,765 152,475 6.4%
Pharmaceuticals and other medical non-durables HC.5.1 1,680,189 1,616,144 1,663,215 1,787,748 1,876,617 124,533 88,869 5.6%
Therapeutic appliances and other medical durables
HC.5.2 212,551 236,234 247,451 268,683 332,289 21,232 63,606 12.2%
Total personal medical services and goods HC.1–HC.5 13,284,181 13,932,092 15,397,996 16,645,451 17,694,302 1,247,455 1,048,851 8.0%
Prevention and public health services HC.6 947,426 996,901 1,075,798 1,294,101 1,387,903 218,303 93,802 9.9%
Health administration and health insurance HC.7 626,815 619,085 703,505 789,938 788,191 86,433 (1,747) 7.3%
Total current expenditure on health 14,858,422 15,548,078 17,177,299 18,729,490 19,870,396 1,552,191 1,140,906 8.1%
Memorandum items: further health-related functions
Education and training of health personnel HC.R.2 577,111 624,911 670,691 724,267 747,567 53,576 23,300 7.0%
Research and development in health HC.R.3 207,766 234,133 238,344 254,979 255,475 16,636 496 6.2%
Food, hygiene and drinking water control HC.R.4 249,417 254,526 364,004 368,015 368,171 4,011 156 11.1%
Environmental health HC.R.5 1,294,647 1,353,949 1,409,588 1,363,483 1,444,295 (46,105) 80,812 3.4%
Administration and provision of social services in kind to assist living with disease and impairment
HC.R.6 70,171 100,577 144,236 224,936 181,052 80,700 (43,884) 24.5%
Total health-related expenditures 2,399,112 2,568,096 2,826,863 2,935,680 2,996,560 108,818 60,880 5.9%
Total health and health-related expenditures 17,257,534 18,116,174 20,004,162 21,665,170 22,866,956 1,661,009 1,201,786 7.8%
14 ICHA-HC code: International Classification for Health Accounts – Health Care functions.

Health Expenditure Trends in New Zealand 2000–2010 23
5 Public sector funding – Ministry of Health
Public sector funding is the major source of health funding in New Zealand. In 2009/10, this amounted to $16,536 million or 83.2% of the total health expenditure. Within this source, the government’s direct health funding through the Ministry is the largest contributor at $14,404 million, or 72.5% of the total health expenditure. ACC and other government agencies, including regional and local governments, provide an additional $2,132 million or 10.7% of current health expenditure. Other government agencies also provide a significant amount of funding for health-related services (Appendix 6.3). Funding of health-related services represents an additional $2,997 million, of which $2,613 million is publicly funded. This chapter discusses the trends in Ministry funding. Expenditure trends by the other government agencies are discussed in Chapter 6: Other Public Sector Funding.
5.1 Ministry of Health funding Health expenditure estimates for 2009/10 reflect total current expenditure on health and health-related services, conforming to SHA conventions. The vast majority of the Ministry expenditure relates to bulk funds devolved to DHBs for purchasing health services at a local level. For historical information covering the period 1997/98 to 2002/03, the total estimates have been recalculated to include the previously excluded non-health items, primarily disability support services. Unlike HET reports prior to 2003/04, annual expenditure is no longer analysed both inclusive and exclusive of these non-health items. The difference between the two categories amounted to $563 million in 2002/03. These disability support services are now considered a core health service. Expenditure growth by the Ministry has accelerated in recent years. To show the movements in the Ministry’s current expenditure, Table 5.1 gives details in aggregate and per capita expenditure (both nominal and real dollars) and as a percentage of both GDP and government expenses for the period 1999/00 to 2009/10. The Ministry’s current funding of health services has increased by over 1.9% of GDP and has increased as a proportion of total central government funding by 3.1%. Table 5.1 shows that the total Ministry expenditure over the 10 years ended June 2010 grew to $14,404 million. This figure translates to an average annual compound rate of growth of 7.4% for this period.

24 Health Expenditure Trends in New Zealand 2000–2010
Table 5.1: Ministry of Health expenditure, 1999/00–2009/10
1999/00 2000/01 2001/02 2002/03 2003/04 2004/05 2005/06 2006/07 2007/08 2008/09 2009/10
Total ($ million nominal) 6,550 7,030 7,662 7,990 8,507 9,362 10,303 10,959 12,124 13,275 14,404
Total real (June 2010)* 8,479 8,819 9,356 9,618 10,000 10,695 11,323 11,807 12,558 13,497 14,404
Per capita – resident population basis
Per capita ($ nominal) 1,702 1,815 1,959 2,010 2,094 2,284 2,489 2,592 2,840 3,076 3,298
Per capita real (June 2010) 2,203 2,278 2,392 2,419 2,461 2,609 2,735 2,792 2,942 3,127 3,298
GDP ($ million nominal) 115,941 124,875 130,856 139,925 149,935 157,210 165,325 177,613 181,868 184,546 189,295
GDP real (June 2010) 150,081 156,664 159,790 168,431 176,234 179,599 181,692 191,369 188,382 187,619 189,295
Per capita real GDP (June 2010) 38,987 40,459 40,856 42,363 43,381 43,816 43,892 45,259 44,129 43,473 43,340
Total as % of GDP 5.65% 5.63% 5.86% 5.71% 5.67% 5.95% 6.23% 6.17% 6.67% 7.19% 7.61%
Total as % of government outlays 16.86% 17.03% 17.94% 17.01% 18.17% 18.00% 18.57% 18.04% 18.91% 18.44% 20.00%
Sources: Ministry of Health, Statistics New Zealand, the Treasury15
* Real dollars are expressed in June 2010 currency.
15 The source of total government outlays has changed from Statistics New Zealand to the Financial Statements of the Government of New Zealand from the year
ended 30 June 2006.

Health Expenditure Trends in New Zealand 2000–2010 25
The following trends are illustrated by Table 5.1.
• Nominal Ministry current expenditure grew steadily throughout the review period. Expenditure in 2009/10 was 119.9% higher than in 1999/00.
• Reflecting the trend in total Ministry current expenditure, nominal per capita spending increased throughout the period. Estimated 2009/10 nominal per capita spending was 93.8% higher than in 1999/00 (up on average 6.9% per year).
• Total real current expenditure growth averaged 5.5% per year since 1999/00.
• Real per capita growth averaged 4.1% per year from 1999/00.
• During this 10-year period, the Ministry’s current funding as a percentage of GDP was at its lowest at 5.6% in 2000/01. It has steadily increased to 7.6% in 2009/10.
• The Ministry’s current funding as a percentage of total government expenditure was 16.9% in 1999/00. It has increased steadily to 20% of government current expenses in 2009/10.
5.2 Ministry of Health funding by major expenditure category
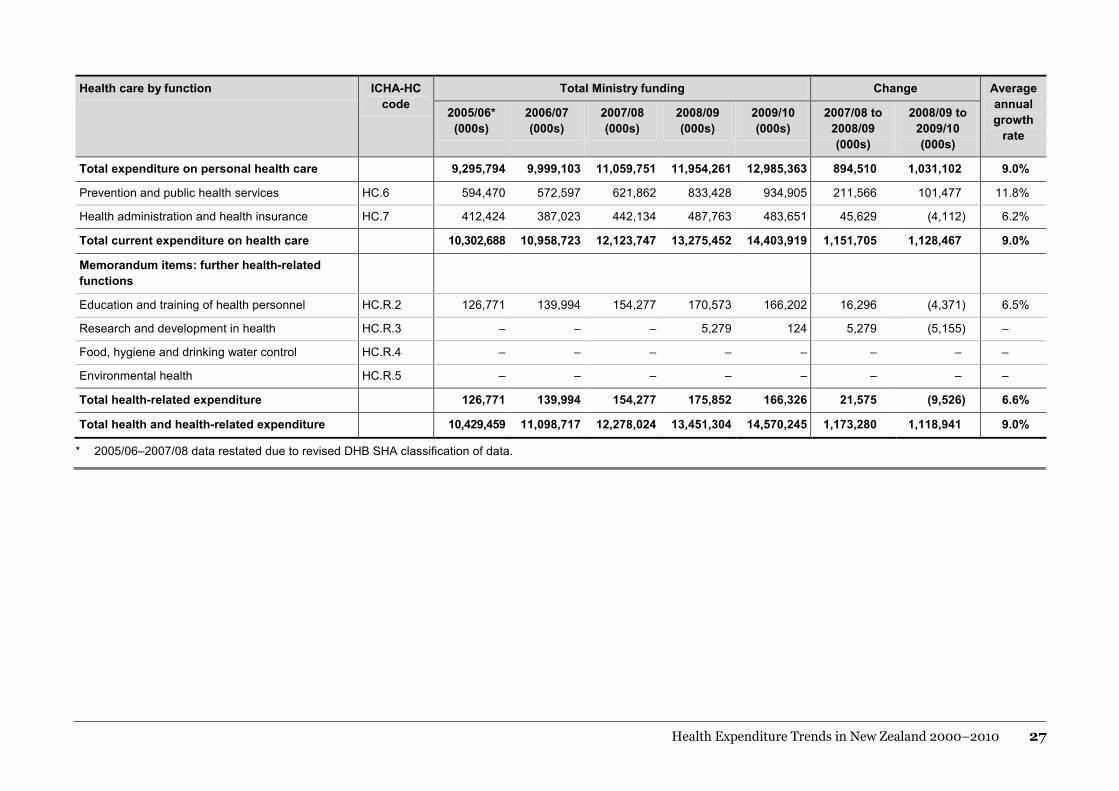
The change in Ministry funding from 2005/06 to 2009/10 in accordance with SHA is presented in Table 5.2. Further detail dividing the total funding into subsets of funding by DHBs or other provider groups is given in Table 5.3. Expenditure is detailed for health and health-related functions. 5.2.1 Personal health
Funding for health services provided to individuals for the purpose of improving or protecting their health is identified as personal health expenditure. In 2008/09, the Ministry’s share of personal health expenditure totalled $11,954.3 million or 71.8% of total personal health expenditure. This increased in 2009/10 to $12,985.4 million or 73.4%. Total current expenditure has increased on average by 9.0% per year, and personal health care (the largest component) has also grown by 9.0%. Care provided in an institutional setting, both inpatient and day care, is growing at a lower rate than outpatient, home care and community-based services (ancillary services and medical goods dispensed to outpatients). Outpatient curative and rehabilitative care have seen the largest increase at an average of 11.7%. This is the SHA function that includes the additional funding for primary health initiatives. In dollar terms, this function has increased by approximately $1,193.6 million in the five-year period from 2005/06.

26 Health Expenditure Trends in New Zealand 2000–2010
Table 5.2: Destinations of Ministry funding, 2005/06–2009/10
Health care by function ICHA-HC code
Total Ministry funding Change Average annual growth
rate
2005/06* (000s)
2006/07 (000s)
2007/08 (000s)
2008/09 (000s)
2009/10 (000s)
2007/08 to 2008/09 (000s)
2008/09 to 2009/10 (000s)
Inpatient care
Curative and rehabilitative care HC.1.1; 2.1 3,068,165 3,229 ,519 3,575,724 3,851,422 4,474,162 275,698 622,740 10.0%
Long-term nursing care HC.3.1 1,019,181 1,050,072 1,137,838 1,193,689 1,276,510 55,851 82,821 7.4%
Services of day-care
Curative and rehabilitative care HC.1.2; 2.2 116,621 125,920 132,367 129,654 137,249 (2,713) 7,595 7.1%
Long-term nursing care HC.3.2 89,380 100,314 104,449 108,211 113,290 3,762 5,079 9.5%
Outpatient care
Outpatient curative and rehabilitative care HC.1.3; 2.3 2,194,430 2,612,773 2,937,176 3,382,672 3,388,025 445,496 5,353 11.7%
Basic medical and diagnostic services HC.1.3.1 1,699,679 2,030,137 2,209,421 2,517,809 2,440,660 308,388 (77,149) 9.1%
Outpatient dental care HC.1.3.2 128,899 136,291 161,965 177,111 200,167 15,146 23,056 10.0%
All other specialised health care HC.1.3.3 – – – – – – – –
All other outpatient care HC.1.3.9 63,355 104,444 201,791 285,520 275,302 83,729 (10,218) 40.6%
Outpatient rehabilitative care HC.2.3 302,497 341,901 363,999 402,232 471,896 38,233 69,664 11.3%
Home care
Curative and rehabilitative care HC.1.4; 2.4 329,484 340,588 422,766 318,104 342,654 (104,662) 24,550 4.3%
Long-term nursing care HC.3.3 866,130 956,549 1,101,701 1,145,917 1,259,428 44,216 113,511 10.6%
Ancillary services to health care HC.4 512,402 495,080 527,706 582,293 617,655 54,587 35,362 4.8%
Medical goods dispensed to outpatients HC.5 1,100,001 1,088,288 1,120,024 1,242,299 1,376,390 122,275 134,091 9.2%
Pharmaceutical and other medical non-durables HC.5.1 1,033,562 1,021,988 1,052,616 1,166,274 1,229,983 113,658 63,709 8.2%
Therapeutic appliances and other medical durables HC.5.2 66,439 66,300 67,408 76,025 146,407 8,617 70,382 24.1%
Health Expenditure Trends in New Zealand 2000–2010 27
Health care by function ICHA-HC code
Total Ministry funding Change Average annual growth
rate
2005/06* (000s)
2006/07 (000s)
2007/08 (000s)
2008/09 (000s)
2009/10 (000s)
2007/08 to 2008/09 (000s)
2008/09 to 2009/10 (000s)
Total expenditure on personal health care 9,295,794 9,999,103 11,059,751 11,954,261 12,985,363 894,510 1,031,102 9.0%
Prevention and public health services HC.6 594,470 572,597 621,862 833,428 934,905 211,566 101,477 11.8%
Health administration and health insurance HC.7 412,424 387,023 442,134 487,763 483,651 45,629 (4,112) 6.2%
Total current expenditure on health care 10,302,688 10,958,723 12,123,747 13,275,452 14,403,919 1,151,705 1,128,467 9.0%
Memorandum items: further health-related functions
Education and training of health personnel HC.R.2 126,771 139,994 154,277 170,573 166,202 16,296 (4,371) 6.5%
Research and development in health HC.R.3 – – – 5,279 124 5,279 (5,155) –
Food, hygiene and drinking water control HC.R.4 – – – – – – – –
Environmental health HC.R.5 – – – – – – – –
Total health-related expenditure 126,771 139,994 154,277 175,852 166,326 21,575 (9,526) 6.6%
Total health and health-related expenditure 10,429,459 11,098,717 12,278,024 13,451,304 14,570,245 1,173,280 1,118,941 9.0%
* 2005/06–2007/08 data restated due to revised DHB SHA classification of data.

28 Health Expenditure Trends in New Zealand 2000–2010
5.2.2 Public health
Public health funding, (also known as collective health) is for services relating to the whole population or population groups. This broad focus distinguishes public health funding from funding for individual personal health services. Public health services are primarily concerned with health protection, improvement and/or promotion. With the change to OECD SHA definitions and reporting in 2003/04, certain services historically reported as public health are now reported as administration or included in the health-related areas. Specific objectives of public health service delivery include:
• ensuring that health and disability services meet population needs, and that health gains are maximised and provided efficiently
• improving regulatory frameworks so that they better protect the health and safety of New Zealanders while minimising industry compliance costs
• improving the health status of at-risk groups, especially Māori, by increased responsiveness to their needs.
Within public health services, functions of prevention and public health have grown considerably, by an average of 11.8% per annum, while administrative and insurance costs have grown at a much lower rate, by an average of 6.2% per annum.

Health Expenditure Trends in New Zealand 2000–2010 29
Table 5.3: Destinations of DHB and non-DHB funding, 2005/06–2009/10
Health care by function ICHA-HC code
Ministry direct funding DHB devolved funding
2005/06 (000s)
2006/07 (000s)
2007/08 (000s)
2008/09 (000s)
2009/10 (000s)
2005/06 (000s)
2006/07 (000s)
2007/08 (000s)
2008/09 (000s)
2009/10 (000s)
Inpatient care
Curative and rehabilitative care HC.1.1; 2.1 196,383 186,471 218,209 203,676 369,619 2,871,782 3,043,048 3,357,515 3,647,746 4,104,543
Long-term nursing care HC.3.1 107,592 109,200 107,357 109,100 128,774 911,589 940,872 1,030,481 1,084,589 1,147,736
Services of day care
Curative and rehabilitative care HC.1.2; 2.2 – – – – – 116,621 125,920 132,367 129,654 137,249
Long-term nursing care HC.3.2 36,566 42,925 40,107 44,119 43,958 52,814 57,389 64,342 64,092 69,332
Outpatient care
Outpatient curative and rehabilitative care HC.1.3; 2.3 65,104 153,966 314,820 459,201 347,242 2,129,326 2,458,807 2,622,356 2,923,471 3,040,783
Basic medical and diagnostic services HC.1.3.1 14,338 60,786 130,234 185,647 152,102 1,685,341 1,969,351 2,079,187 2,332,162 2,288,558
Outpatient dental care HC.1.3.2 354 258 4,757 6,648 13,041 128,545 136,033 157,208 170,463 187,126
All other specialised health care HC.1.3.3 – – – – – – – – – –
All other outpatient care HC.1.3.9 17,629 54,852 146,260 231,979 132,115 45,726 49,592 55,531 53,541 143,187
All other outpatient care HC.2.3 32,783 38,070 33,569 34,927 49,984 269,714 303,831 330,430 367,305 421,912
Home care
Curative and rehabilitative care HC.1.4; 2.4 16,800 16,959 18,302 7,607 1,140 312,684 323,629 404,464 310,497 341,514
Long-term nursing care HC.3.3 506,966 548,327 629,975 620,592 700,856 359,164 408,222 471,726 525,325 558,572
Ancillary services to health care HC.4 167,891 123,969 144,018 166,506 190,785 344,511 371,111 383,688 415,787 426,870
Medical goods dispensed to outpatients HC.5 97,388 78,501 15,055 13,925 29,473 1,002,613 1,009,787 1,104,969 1,228,374 1,346,917
Pharmaceutical and other medical non-durables HC.5.1 97,388 78,501 15,055 13,925 29,473 936,174 943,487 1,037,561 1,152,349 1,200,510
Therapeutic appliances and other medical durables HC.5.2 – – – – – 66,439 66,300 67,408 76,025 146,407
Total expenditure on personal health care 1,194,690 1,260,318 1,487,843 1,624,726 1,811,847 8,101,104 8,738,785 9,571,908 10,329,535 11,173,516
Prevention and public health services HC.6 443,438 432,628 453,959 567,743 649,188 151,032 139,969 167,903 265,685 285,717
Health administration and health insurance HC.7 338,760 293,646 338,289 371,783 360,674 73,664 93,377 103,845 115,980 122,977

30 Health Expenditure Trends in New Zealand 2000–2010
Health care by function ICHA-HC code
Ministry direct funding DHB devolved funding
2005/06 (000s)
2006/07 (000s)
2007/08 (000s)
2008/09 (000s)
2009/10 (000s)
2005/06 (000s)
2006/07 (000s)
2007/08 (000s)
2008/09 (000s)
2009/10 (000s)
Total current expenditure on health care 1,976,888 1,986,592 2,280,091 2,564,252 2,821,709 8,325,800 8,972,131 9,843,656 10,711,200 11,582,210
Memorandum items: further health-related functions
Education and training of health personnel HC.R.2 120,227 130,043 146,226 160,358 159,580 6,544 9,951 8,051 10,215 6,622
Research and development in health HC.R.3 – – – 5,279 124 – – – – –
Food, hygiene and drinking water control HC.R.4 – – – – – – – – – –
Environmental health HC.R.5 – – – – – – – – – –
Total health-related expenditure 120,227 130,043 146,226 165,637 159,704 6,544 9,951 8,051 10,215 6,622
Total health and health-related expenditure 2,097,115 2,116,635 2,426,317 2,729,889 2,981,413 8,332,344 8,982,082 9,851,707 10,721,415 11,588,832
Note: 2005/06–2007/08 data restated due to revised DHB SHA classification of data.
Health Expenditure Trends in New Zealand 2000–2010 31
5.2.3 DHB and non-DHB expenditure
DHB expenditure as a percentage of Ministry funding increased from 79.2% in 2003/04 to 80.4% in 2009/10. This represents a funding shift and devolution of additional responsibilities to DHBs for the funding of health services. Over the five-year period 2005/06 to 2009/10, DHB expenditure increased by $3,256.4 million or 39.1%, while non-DHB funding increased by $884.2 million or 42.2%. The most significant items of non-DHB funding fall within long-term nursing care provided to individuals in their homes or the community; these consist largely of disability support services and prevention and public health services.
5.2.4 Ministry of Health
The Ministry of Health is the Government’s primary agent in the health and disability system of New Zealand, having overall responsibility for the management and development of that system. The Ministry also acts as the Minister of Health’s principal advisor on health policy and is the main funder and regulator of health and disability services. It provides an important leadership role and is the primary means of driving performance improvements within the system. The following core functions of the Ministry are incurred in the administration of, but not provision of, health services as defined by the SHA conventions:
• improve, promote and protect the health of New Zealanders
• advise the Minister on strategy, policy and system performance, including advice on improving health outcomes, reducing disparities, ensuring fairness and increasing participation
• act on behalf of the Minister to monitor and improve the performance of the health sector Crown agencies and DHBs, which are responsible for the health of their local communities
• administer legislation and regulations on behalf of the Crown, and meet legislative requirements
• fund and purchase health support services on behalf of the Crown, including the maintenance of service agreements, particularly for public health, disability support services and other services funded by the Ministry
• service Minister’s offices and ministerial advisory committees. Table 5.4 provides a breakdown of funding by output class for the Ministry in 2007/08, 2008/09 and 2009/10. Output class definitions were changed in the year to 30 June 2008 to reflect the above outputs, meaning that some comparability to prior years has been lost.

32 Health Expenditure Trends in New Zealand 2000–2010
Table 5.4 reflects the Ministry’s ‘head office’ costs incurred in the administration of, but not provision of, health services. Information services are the largest output class, accounting for $76.0 million or 31.4% in 2009/10 ($69.0 million in 2008/09). Information services include the cost of administering the Sector Services (formerly HealthPAC) system, a claims payment facility. Strategy, policy and systems performance is the second largest cost incurred at $54.0 million or 22.3%.
Table 5.4: Ministry of Health expenditure, by output class, 2007/08–2009/10
Output class* 2007/08 2008/09 2009/10
$ million % of total $ million % of total $ million % of total
Health and disability policy advice
32.5 13.7% 30.7 13.0% 8.7 3.6%
Performance management 14.1 6.0% 9.1 3.8% 19.9 8.2%
Ministerial support services 24.3 10.3% 15.6 6.6% 38.8 16.0%
Information services 75.1 31.8% 69.0 29.1% 76.0 31.4%
Administration of legislation and regulations
36.0 15.2% 37.3 15.7% 29.4 12.2%
Strategy, policy and systems performance
34.5 14.6% 53.7 22.7% 54.0 22.3%
Payment services 19.9 8.4% 21.7 9.2% 15.0 6.2%
Total† 236.5 100.0% 237.2 100.0% 241.7 100.0%
Source: Ministry of Health
* Output class definitions changed at 1 July 2007.
† Totals may be affected by rounding.

Health Expenditure Trends in New Zealand 2000–2010 33
6 Other public sector funding As discussed in Chapter 5, the main contribution to the public sector funding of health, comes from the government through the Ministry of Health. In addition, the Accident Compensation Corporation (ACC) contributes a significant amount to public sector health expenditure. ACC is a statutory insurance organisation, owned by the state, which provides compulsory, comprehensive no-fault insurance cover for accident-related injuries to all New Zealanders. Other central government agencies and local authorities also incur expenditure that directly or indirectly affects the health status of New Zealand residents. In 2009/10, funding from ACC, at $1,669.8 million, accounted for 8.4% of total current health expenditure. This is a reduction from the $1,820.2 million or 9.7% of total current health expenditure funded by ACC in 2008/09. Other central government agencies provided an additional $395.3 million or 2.0%. Regional and local authorities contributed an additional $67.2 million. Total other public funding for health services in 2009/10 (excluding the Ministry) amounted to $2,132.4 million. Other central government agencies (excluding the Ministry and ACC) also contributed $664.3 million to SHA health-related services. Regional and local authorities contributed $67.2 million or 0.3% of total current health expenditure, plus $1,691.3 million to health-related expenditure. In this chapter, trends in expenditure by ACC, other government agencies and local authorities are discussed in more detail. Previous editions of HET combined ACC with other central government agencies. ACC is now reported separately, with the prior years restated in this edition for comparison purposes. The Department of Corrections funds personal health in relation to prisoners, the New Zealand Defence Force provides funding for active military duty and Work and Income funds personal health for war veterans. Estimates of current health and health-related expenditure by other central government agencies for the period 2005/06 to 2009/10 are shown in Table 6.2. Table 6.3 provides information on local government funding and Table 6.4 presents information from all public funds except for the Ministry.

34 Health Expenditure Trends in New Zealand 2000–2010
6.1 Accident Compensation Corporation The ACC compensation scheme is a 24-hour per day, seven-day per week, no-fault scheme that provides treatment, rehabilitation and compensation for New Zealand citizens, residents and temporary visitors to New Zealand who suffer personal injury through accident while in New Zealand. In return, people who have cover under ACC legislation may not sue for personal injury, other than for exemplary damages. OECD SHA defines ACC as ‘social security’, being a social insurance scheme covering the community as a whole or large section of the community, which is imposed and controlled by government units. Table 6.1 presents ACC’s total current health expenditure from 2005/06 to 2009/10.

Health Expenditure Trends in New Zealand 2000–2010 35
Table 6.1: ACC current health expenditure ($ million), 2005/06–2009/10
Health care by function ICHA-HC code
2005/06 (000s)
2006/07 (000s)
2007/08 (000s)
2008/09 (000s)
2009/10 (000s)
Change 2007/08 to
2008/09 (000s)
Change 2008/09 to
2009/10 (000s)
Average annual
growth rate
Inpatient care
Curative and rehabilitative care HC.1.1; 2.1 77,784 100,648 112,336 134,652 123,513 22,316 (11,139) 13.0%
Long-term nursing care HC.3.1 3 – – – – – – N/A
Services of day care
Curative and rehabilitative care HC.1.2; 2.2 166,728 191,035 219,245 262,427 255,203 43,182 (7,224) 13.3%
Long-term nursing care HC.3.2 – – – – – – – N/A
Outpatient care
Outpatient curative and rehabilitative care HC.1.3; 2.3 405,083 467,569 520,389 528,608 453,224 8,219 (75,384) 5.8%
Basic medical and diagnostic services HC.1.3.1 319,808 362,884 401,824 407,412 348,371 5,588 (59,041) 5.0%
Outpatient dental care HC.1.3.2 27,312 30,795 27,960 31,231 28,724 3,271 (2,507) 10.9%
All other specialised health care HC.1.3.3 22,080 30,815 33,298 24,328 16,296 (8,970) (8,032) (0.8)%
All other outpatient care HC.1.3.9 – – – – – – – N/A
Outpatient rehabilitative care HC.2.3 35,883 43,075 57,307 65,637 59,833 8330 (5,804) 7.7%
Home care
Curative and rehabilitative care HC.1.4; 2.4 135,452 160,872 194,318 229,167 212,579 34,849 (16,588) 11.9%
Long-term nursing care HC.3.3 – – – – – – – N/A
Ancillary services to health care HC.4 158,754 173,729 221,341 241,259 222,078 19,918 (19,181) 13.90%
Medical goods dispensed to outpatients HC.5 99,915 116,782 117,869 125,684 116,605 7,815 (9,079) 5.5%
Pharmaceutical and other medical non-durables
HC.5.1 6,383 5,717 5,208 5,064 4,677 (144) (387) (9.3)%
Therapeutic appliances and other medical durables
HC.5.2 93,532 111,065 112,661 120,620 111,928 7,959 (8,692) 6.5%

36 Health Expenditure Trends in New Zealand 2000–2010
Health care by function ICHA-HC code
2005/06 (000s)
2006/07 (000s)
2007/08 (000s)
2008/09 (000s)
2009/10 (000s)
Change 2007/08 to
2008/09 (000s)
Change 2008/09 to
2009/10 (000s)
Average annual
growth rate
Total expenditure on personal health care 1,043,719 1,210,635 1,385,498 1,521,797 1,383,202 136,299 (138,595) 9.5%
Prevention and public health services HC.6 46,536 45,008 44,798 68,590 56,014 23,792 (12,576) 6.9%
Health administration and health insurance HC.7 170,022 180,399 204,501 229,831 230,623 25,330 792 8.4%
Total current expenditure on health care 1,260,277 1,436,042 1,634,797 1,820,218 1,669,839 185,421 (150,379) 9.2%
Memorandum items: further health-related functions
Education and training of health personnel HC.R.2 – – – – – – – N/A
Research and development in health HC.R.3 – – – – – – – N/A
Food, hygiene and drinking water control HC.R.4 – – – – – – – N/A
Environmental health HC.R.5 – – – – – – – N/A
Administration and provision of social services in kind to assist living with disease and impairment
HC.R.6 70,171 84,856 108,670 132,232 91,408 23,562 (40,824) 8.9%
Total health-related expenditure 70,171 84,856 108,670 132,232 91,408 23,562 (40,824) 8.9%
Total health and health-related expenditure 1,330,448 1,520,898 1,743,467 1,952,450 1,761,247 208,983 (191,203) 9.1%
Source: ACC surveys and annual reports
Notes:
1 Values include a factor for GST at 12.5%.
2 These figures include an estimate for accident prevention and administration and exclude public health acute services now included in the DHB funder arm expenditure.

Health Expenditure Trends in New Zealand 2000–2010 37
ACC is the Crown entity responsible for administering the Accident Compensation Scheme. Responsibilities include:
• preventing injury
• collecting accident levies
• determining whether claims for injury are covered by the scheme and providing entitlements to people who are eligible
• paying compensation
• buying health and disability support services to treat, care for and rehabilitate injured people
• advising the government. ACC is funded principally by levies collected from a range of sources, including employers, self-employed people, employees and motor vehicle licensing. ACC also receives direct government funding to cover people who are not earning an income. ACC is not funded from the Ministry; however, ACC does provide funding to the Ministry for acute accident services. This funding is reported in the funder arm of the DHBs. ACC health expenditure information used in the HET reports is obtained by direct response from ACC. In addition, starting in 2003/04, the estimate for ACC current expenditure was increased to include components for accident prevention and ACC administration. These functions are estimated at $56.0 million and $230.6 million respectively for 2009/10. In a broader context, all ACC income-related expenditure could be included in health or health-related categories; however, this approach has not been taken for estimates based on SHA definitions at this time. Various WHO and OECD documents address how countries could classify various income-related benefits (sickness, accident, age-related, other social benefits). These services are likewise not included in these estimates as of 2009/10.
6.2 Other government agencies Other central government agencies contributing to direct health and indirect health-related expenditure included in this report are the ministries or departments of Agriculture and Forestry (MAF); Education; Internal Affairs; Research, Science and Technology; Defence; Social Development; Corrections; Te Puni Kōkiri; and Pacific Island Affairs. Estimates of current health and health-related expenditure for this group of agencies were derived from annual reports and by direct surveys.

38 Health Expenditure Trends in New Zealand 2000–2010
6.2.1 Biosecurity
Vote Biosecurity brings together the biosecurity activities of the ministries or departments of Agriculture and Forestry (MAF), Health, Fisheries and Conservation. Expenditure by the Ministry of Health is discussed in Chapter 5: Public Sector Funding – Ministry of Health. Total current health expenditure incurred by Fisheries and Conservation appears to relate more directly to biodiversity than to public health. This expenditure has been excluded from this HET report. Since 2003/04, current expenditure by MAF has been sourced from their annual reports. One strategic area that receives a large proportion of MAF’s expenditure is vector control. Key responsibilities for this service include:
• developing and implementing strategies for managing risks posed by pests, weeds and diseases to the economy, biological diversity and people’s health
• monitoring the effectiveness of policy and legislative frameworks for managing the risks posed by pests, weeds and diseases to the economy, biological diversity and people’s health.
Current health expenditure incurred by MAF for biosecurity in 2009/10 totalled $189.0 million, compared with $202.6 million in 2008/09, and covers the cost of the following services and activities.
• Border inspection and quarantine services control quarantine risks at the border and undertake post-entry quarantine in line with the provisions of the Biosecurity Act 1993. Health activities include border clearance procedures for aircraft and vessels (including for passengers), investigating suspected illegal imports and identifying intercepted organisms. In 2009/10, MAF expenditure in this area came to $66.7 million.
• Pest and disease surveillance services maintain the health of domestic animal and plant populations, report internationally on the health status of domestic animals and plants and detect unwanted organisms. Pest and disease emergency response services maintain a capability (personnel and diagnostic capacity) to respond to the introduction of unwanted organisms that are harmful to animals and plants. In 2009/10, MAF’s combined expenditure on these services was $89.1 million.
• Control of tuberculosis vectors covers the government contribution to implementing the bovine tuberculosis national pest management strategy. The objective of the strategy is to reduce the number of bovine tuberculosis-infected cattle and deer herds. This objective is jointly funded by government and industry. MAF expenditure in 2009/10 totalled $33.2 million.

Health Expenditure Trends in New Zealand 2000–2010 39
6.2.2 The New Zealand Food Safety Authority (NZFSA)
NZFSA was established as a standalone Government department 1 July 2007, with the main aims being to:
• provide a coherent and seamless food regulatory regime
• reduce the incidence of domestic food-borne illness
• retain and develop policy and technical expertise in food safety
• create a centre for excellence in risk-management-based food safety administration
• provide advice and acknowledge the whole-of-government interest in food administration.
Expenditure on food safety amounted to $100.3 million in 2009/10 compared with $107.3 million in 2008/09. The most significant spending was on regulatory programmes and regulatory standards, at $55.2 million and $28.9 million respectively. Other expenditure included food safety policy advice, response to food safety emergencies, consultation and food safety information. These activities are reported as a health-related service under food, hygiene and drinking-water control in SHA.
6.2.3 Education
Ministry of Education spending on current health-related activities includes the cost of providing tertiary training and education for doctors, nurses, dentists, dieticians, physiotherapists, clinical psychologists, audiologists, pharmacists, midwives and occupational and speech therapists. Starting in 2003/04, the estimates represent a significant change in the magnitude of the expenditure on educating health professionals and clinical research. The change involves a move to estimate the full cost of tertiary education not limited to the costs incurred by the Ministry of Education. The source for these estimates has changed to the Tertiary Education Statistics on the Ministry of Education website16 and the annual reports from four leading tertiary institutions:17 Massey University, Auckland University of Technology (AUT), The University of Auckland and University of Otago. An adjustment for GST has been included (12.5%). The estimate is conservative as only the University of Otago provided a separate cost for their medical programme; these costs are significantly higher per pupil than those incurred for other programmes. For all other tertiary institutions, an unweighted cost per pupil was used. The total estimates for 2009/10 are $580.2 million for educating health professionals and $136.9 million for clinical research undertaken by tertiary institutions, compared with $552.6 million and $130.4 million respectively for 2008/09. An estimate for the non-government portion of this funding is attributed to out-of-pocket private funding. In accordance with SHA definitions and classifications, this function is a health-related expenditure. 16 See: www.educationcounts.govt.nz/statistics/tertiary_education 17 Prior estimates were sourced from the annual survey and included Ministry of Education
bulk subsidies only.

40 Health Expenditure Trends in New Zealand 2000–2010
6.2.4 Research, Science and Technology
In July 1997, part of the public investment in health research was transferred from the Ministry of Health to the Ministry of Research, Science and Technology (MoRST). Health research is now included in the priority setting and management process applied to other public-good science and technology investments. In 2009/10, expenditure on health research was $82.3 million, compared with $83.9 million in 2008/09.
The 2009/10 estimate is sourced from the MoRST annual report. To conform to SHA definitions and classifications, research is now reported as a health-related service and not a core health service.
6.2.5 Defence
The Ministry of Defence provides funding for health care services to army, navy and air force personnel. The estimate of current health expenditure includes the cost of medical and dental treatments carried out within the Defence service branches, as well as payments for services obtained from external professionals and organisations. The estimate excludes expenditure relating to medical examinations. The estimated expenditure on health care for 2009/10 is $36.5 million, compared with $37.7 million in 2008/09. The estimate for 2009/10 was sourced by direct response.
Vote Veterans’ Affairs was transferred to the New Zealand Defence Force (NZFD) in the early part of 2008/09. The estimated total expenditure in 2009/10 is $22.5 million, compared with $21.6 million in 2008/09. Since 2008/09, the source for these estimates has been from the direct survey response. The expenditure has been distributed across SHA health functions of outpatient and home care for acute, rehabilitative and long-term care services.
6.2.6 Social Development
The bulk of health expenditure (mainly disability support services) previously administered by the Ministry of Social Development was transferred to the Ministry of Health between 1993/94 and 1995/96. Work and Income, however, retains a significant disability funding capacity.
The Ministry of Social Development also administers the Community Services Card programme. Expenditure in 2009/10 for administering this programme amounted to $8.0 million, compared with $8.2 million in 2009/08. In accordance with SHA definitions, this activity is considered part of government administration of health services and is therefore part of core health expenditure. Funding for youth suicide prevention has been transferred to the Ministry of Health.
6.2.7 Corrections
The Department of Corrections incurs costs relating to the provision of health care services for prison inmates and those held in judicial custody. The total estimated cost of $49.0 million for 2009/10 covers expenditure on general medical treatment $29.5 million, and psychiatric treatment $19.2 million. This represents an increase of $4.4 million or 10.0%, compared with the 2008/09 expenditure of $44.3 million.
Health Expenditure Trends in New Zealand 2000–2010 41
The current health expenditure estimates are consistently sourced by direct response. Starting in 2003/04, the expenditure has been distributed across SHA health functions of outpatient and home care for acute, rehabilitative and long-term-care services. There has been no change in methodology for this estimate.
6.2.8 Internal Affairs
The New Zealand Lottery Grants Board, which is administered by The Department of Internal Affairs, funded health and health-related projects amounting to $54.1 million during 2009/10. The data source for these estimates is the New Zealand Lotteries Commission 2009/10 Lottery Grants record. Included in the above estimate are direct grants made to individuals with disabilities to purchase disability support equipment, not funded by other sources, to increase and maintain their participation, fulfilment, enjoyment and achievement in the community. These grants totalled $4.4 million in 2009/10. Additional lottery grants totalling $5.7 million were distributed to fund health research and are attributed to a health-related function. Grants to seniors are no longer separately identifiable and are not included in these estimates.
6.2.9 Te Puni Kōkiri (Māori Development)
Health expenditure under Te Puni Kōkiri contributes to policy advice to the Government’s objective of reducing inequalities between Māori and non-Māori in the delivery of health and disability services. The policy advice has focused on three main areas:
• how to make progress towards reducing inequalities in health status between Māori and non-Māori
• how to improve Māori health outcomes by increasing Māori participation in the purchase and provision of health services
• the development of new Māori health initiatives for the wellbeing of Māori, including the development of strategies to increase Māori access to health services and the adoption of healthy lifestyle choices.
6.2.10 Pacific Island Affairs
During 2007/08, the Ministry of Pacific Island Affairs incurred health expenditure of $0.2 million for the provision of health policy advice. This service has been attributed to the SHA function: health administration, health expenditure. Starting in 2003/04, this information has been sourced from the Ministry of Pacific Island Affairs’ annual report, whereas earlier estimates came from direct survey responses.

42 Health Expenditure Trends in New Zealand 2000–2010
Table 6.2: Current health expenditure and health-related expenditure by other central government agencies, 2005/06–2009/10
Health care by function ICHA-HC code
2005/06 (000s)
2006/07 (000s)
2007/08 (000s)
2008/09 (000s)
2009/10 (000s)
Change 2007/08 to
2008/09 (000s)
Change 2008/09 to
2009/10 (000s)
Average annual
growth rate
Inpatient care
Curative and rehabilitative care HC.1.1; 2.1 1,875 2,213 2,465 2,512 2, 650 47 138 11.3%
Long-term nursing care HC.3.1 411 475 950 1,107 1,318 157 211 36.2%
Services of day care
Curative and rehabilitative care HC.1.2; 2.2 1,875 2,185 2,398 2,600 2,691 202 91 12.0%
Long-term nursing care HC.3.2 411 475 528 528 596 - 68 13.9%
Outpatient care
Outpatient curative and rehabilitative care HC.1.3; 2.3 28,623 32,626 37,253 38,674 39,639 1,421 965 10.0%
Basic medical and diagnostic services HC.1.3.1 4,093 4,293 4,733 4,915 5,203 182 288 5.1%
Outpatient dental care HC.1.3.2 3,126 3,653 4,249 4,426 4,168 177 (258) 11.7%
All other specialised health care HC.1.3.3 3,140 3,336 3,696 3,739 4,070 43 331 28.5%
All other outpatient care HC.1.3.9 14,611 17,075 19,794 20,544 21,030 750 486 7.3%
Outpatient rehabilitative care HC.2.3 3,653 4,269 4,781 5,050 5,168 269 118 26.9%
Home care
Curative and rehabilitative care HC.1.4; 2.4 19,480 20,926 22,231 25,114 28,548 2,883 3,434 22.5%
Long-term nursing care HC.3.3 14,272 15,130 17,198 17,726 19,130 528 1,404 26.4%
Ancillary services to health care HC.4 1,281 2,015 3,443 4,314 4,433 871 119 27.3%
Medical goods dispensed to outpatients HC.5 10,205 11,968 18,246 19,411 18,910 1,165 (501) 17.8%
Pharmaceutical and other medical non-durables
HC.5.1 1,864 2,079 2,269 2,133 2,224 (136) 91 11.7%
Therapeutic appliances and other medical durables
HC.5.2 8,341 9,889 15,977 17,278 16,686 1,301 (592) 19.3%

Health Expenditure Trends in New Zealand 2000–2010 43
Health care by function ICHA-HC code
2005/06 (000s)
2006/07 (000s)
2007/08 (000s)
2008/09 (000s)
2009/10 (000s)
Change 2007/08 to
2008/09 (000s)
Change 2008/09 to
2009/10 (000s)
Average annual
growth rate
Total expenditure on personal health care 78,433 88,013 104,712 111,986 117,915 7,274 5,929 16.0%
Prevention and public health services HC.6 166,938 215,127 267,759 276,233 266,764 8,474 (9,469) 11.8%
Health administration and health insurance HC.7 6,297 6,813 6,578 10,269 10,667 3,691 398 12.5%
Total current expenditure on health care 251,668 309,953 379,049 398,488 395,346 19,439 (3,142) 12.7%
Memorandum items: further health-related functions
Education and training of health personnel HC.R.2 216,163 232,591 232,591 276,340 290,163 43,749 13,823 8.2%
Research and development in health HC.R.3 177,941 202,918 206,484 219,038 225,197 12,554 6,159 7.2%
Food, hygiene and drinking water control HC.R.4 86,152 91,214 100,602 107,278 100,333 6,676 (6,945) 4.0%
Environmental health HC.R.5 17,162 17,344 18,717 19,919 20,819 1,202 900 5.0%
Administration and provision of social services in kind to assist living with disease and impairment
HC.R.6 – 11,421 22,735 19,654 27,739 (3,081) 8,085 13.8%
Total health-related expenditure 497,418 555,488 581,129 642,229 664,251 61,100 22,022 7.1%
Total health and health-related expenditure 749,086 865,441 960,178 1,040,717 1,059,597 80,539 18,880 8.9%

44 Health Expenditure Trends in New Zealand 2000–2010
6.2.11 Other central government expenditure trends
In 2009/10, total current health expenditure by all the other central government agencies, excluding the Ministry of Health and ACC, totalled $395.3 million, compared with $398.5 million in 2008/09, a decrease of approximately $3.1 million or 0.8%. As presented in Table 6.2, prevention and public health services expenditure represents the majority of current health expenditure by other central government agencies at $266.8 million or 67.5% of the total health expenditure. This pattern is heavily influenced by MAF. For the five-year period, the SHA functions reflect a fairly consistent increase of approximately 12.7% across all functions.
6.3 Regional and local authorities Prior to 2003/04, estimates for local government were based on the Ministry sample survey, with the results extrapolated to calculate an estimate for the total population of New Zealand. Starting in 2003/04, expenditure has been estimated by compiling information from local government annual reports. Regional governments, which are largely responsible for environmental services and in some cases water and sewage, had been excluded from the sample prior to 2003/04. Consequently the expenditure estimates for local government services were significantly undervalued for the periods before 2003/04. As has been consistently stated from the inception of HET reporting in the early 1980s, health-related expenditure had been significantly under-reported. This was due to the application of the narrow WHO definition of public health prior to 2003/04. Examples of services previously excluded are: control of foul water, drainage, sewerage collection and treatment, rubbish collection and disposal, overflow prevention, stagnation of flood water and water purification. The estimate now includes these and other services. Specific services not included by the SHA definitions are civil defence and road safety. Consequently the original definitions have not been retained and internal consistency has been lost. The estimates have, however, gained greater international comparability and are now more accurate and complete. The estimates since 2003/04 have been sourced from annual reports, augmented by survey responses where appropriate and necessary. An estimate for GST has been included by increasing the values by 12.5%. Significant activities, such as sewage systems and rubbish collection and disposal, are easily identified in annual reports. Other activities that are more on a line-item level are not consistently identified in regional or local government annual reports. Examples of this latter group include swimming pool testing and treatment, and road-cleaning costs. These less-material services are included in the overall estimates, using the survey results if they did not appear to be duplicative. The estimates are conservative as most annual reports do not include an allocation of support and administration costs to services. In addition, if there was doubt as to whether a service should be included in the estimate, it was excluded. Appendix 7 contains a complete list of the regional and local authorities included in the 2009/10 sample.

Health Expenditure Trends in New Zealand 2000–2010 45
One local authority operated a medical centre during this period under review. Waimate District Council operated Waimate Medical Centre Ltd as a Council Controlled Trading Organisation to May 2009, when the incumbent doctor purchased the practice. The Council’s involvement in the Waimate Medical Centre Ltd resulted from the request of the community of Waimate to preserve the Waimate Medical Centre and flows directly from the statutory directive that local government provides for the social, cultural, economic and environmental wellbeing of its community in a sustainable manner. This activity supports the following Community Outcomes as described in the second volume of the LTCCP 2006-16.
• The health needs of the district are adequately provided for.
• The governance provided by the local authority meets the needs of its citizens.
• The wellbeing of all ages is achieved.
• The security and safety of the community and its citizens meets their need.
• The community is positive about its continued wellbeing.
• Increases in quality of life, wellbeing and prosperity are shared and accessed by all citizens.
6.3.1 Regional and local authorities expenditure trends
As Table 6.3 shows, total current health and health-related expenditure by regional and local authorities increased from $1,523.7 million in 2005/06 to $1,758.6 million in 2009/10. However, only a relatively small portion of this expenditure is health expenditure: prevention and public health services amounted to $67.2 million in 2009/10.
6.4 Trends in the use of other public funding Table 6.4 presents the trends in other public funding: ACC, other central agencies and regional and local authorities, excluding the Ministry. Other public funding for current health expenditure in 2009/10 is estimated at $2,132.4 million, a decrease of $142.2 million or 6.3% from 2008/09. The five-year period reflects an average annual increase of 9.4% per annum on health expenditure, with the largest dollar value increases in outpatient curative and rehabilitative care of $176.3 million. The expenditure pattern of other public funding is heavily influenced by ACC purchasing.
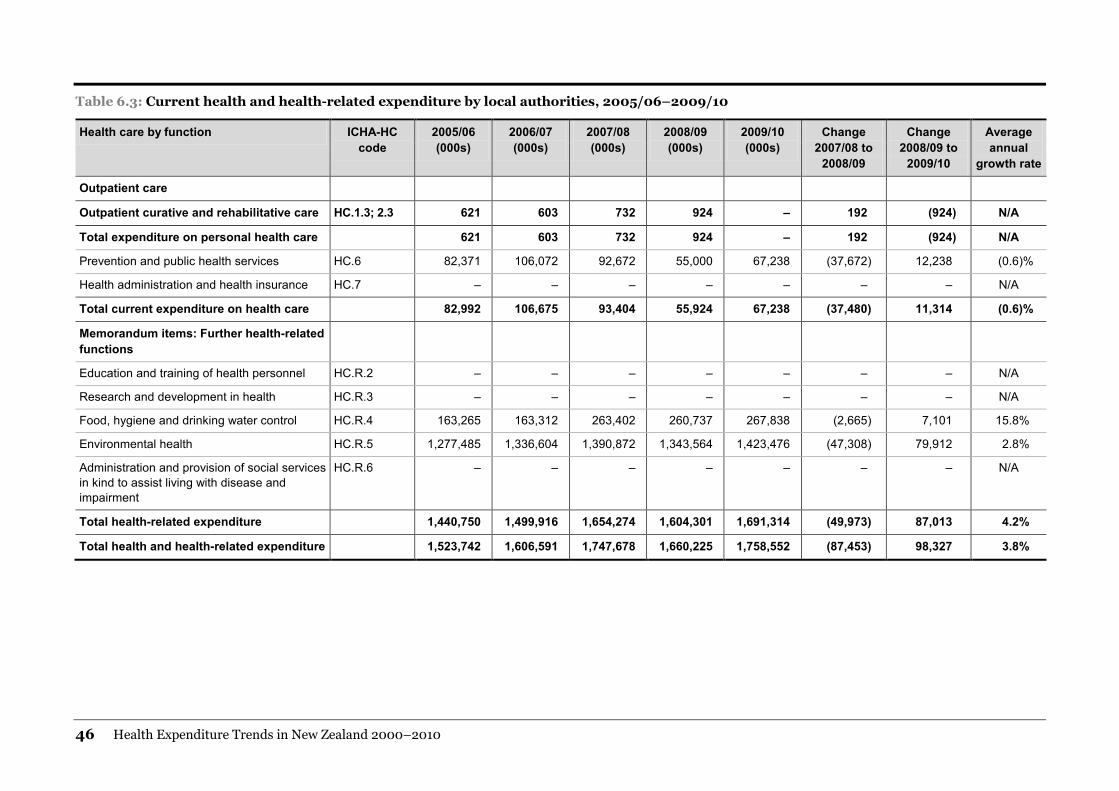
46 Health Expenditure Trends in New Zealand 2000–2010
Table 6.3: Current health and health-related expenditure by local authorities, 2005/06–2009/10
Health care by function ICHA-HC code
2005/06 (000s)
2006/07 (000s)
2007/08 (000s)
2008/09 (000s)
2009/10 (000s)
Change 2007/08 to
2008/09
Change 2008/09 to
2009/10
Average annual
growth rate
Outpatient care
Outpatient curative and rehabilitative care HC.1.3; 2.3 621 603 732 924 – 192 (924) N/A
Total expenditure on personal health care 621 603 732 924 – 192 (924) N/A
Prevention and public health services HC.6 82,371 106,072 92,672 55,000 67,238 (37,672) 12,238 (0.6)%
Health administration and health insurance HC.7 – – – – – – – N/A
Total current expenditure on health care 82,992 106,675 93,404 55,924 67,238 (37,480) 11,314 (0.6)%
Memorandum items: Further health-related functions
Education and training of health personnel HC.R.2 – – – – – – – N/A
Research and development in health HC.R.3 – – – – – – – N/A
Food, hygiene and drinking water control HC.R.4 163,265 163,312 263,402 260,737 267,838 (2,665) 7,101 15.8%
Environmental health HC.R.5 1,277,485 1,336,604 1,390,872 1,343,564 1,423,476 (47,308) 79,912 2.8%
Administration and provision of social services in kind to assist living with disease and impairment
HC.R.6 – – – – – – – N/A
Total health-related expenditure 1,440,750 1,499,916 1,654,274 1,604,301 1,691,314 (49,973) 87,013 4.2%
Total health and health-related expenditure 1,523,742 1,606,591 1,747,678 1,660,225 1,758,552 (87,453) 98,327 3.8%

Health Expenditure Trends in New Zealand 2000–2010 47
Table 6.4: Total other public funding (excluding the Ministry), 2005/06–2009/10
Health care by function ICHA-HC code
2005/06 (000s)
2006/07 (000s)
2007/08 (000s)
2008/09 (000s)
2009/10 (000s)
Change 2007/08 to
2008/09
Change 2008/09 to
2009/10
Average annual
growth rate
Inpatient care
Curative and rehabilitative care HC.1.1; 2.1 79,659 102,862 114,800 137,164 126,163 22,364 (11,001) 12.9%
Long-term nursing care HC.3.1 414 475 950 1,107 1,318 157 211 36.3%
Services of day care
Curative and rehabilitative care HC.1.2; 2.2 168,603 193,221 221,643 265,027 257,894 43,384 (7,133) 13.3%
Long-term nursing care HC.3.2 411 475 528 528 596 - 68 13.9%
Outpatient care
Outpatient curative and rehabilitative care HC.1.3; 2.3 433,706 500,195 557,641 568,204 492,865 10,563 (75,339) 6.1%
Basic medical and diagnostic services HC.1.3.1 323,901 367,178 406,558 413,250 353,575 6,692 (59,675) 5.0%
Outpatient dental care HC.1.3.2 30,438 34,448 32,209 35,657 32,892 3,448 (2,765) 10.9%
All other specialised health care HC.1.3.3 25,220 34,151 36,993 28,066 20,367 (8,927) (7,699) 1.5%
All other outpatient care HC.1.3.9 14,611 17,075 19,794 20,544 21,030 750 486 7.3%
Outpatient rehabilitative care HC.2.3 39,536 47,343 62,087 70,687 65,001 8,600 (5,686) 14.8%
Home care
Curative and rehabilitative care HC.1.4; 2.4 154,932 181,797 216,549 254,280 241,127 37,731 (13,153) 12.6%
Long-term nursing care HC.3.3 14,272 15,130 17,198 17,727 19,130 529 1,403 26.4%
Ancillary services to health care HC.4 160,035 175,744 224,784 245,573 226,511 20,789 (19,062) 14.1%
Medical goods dispensed to outpatients HC.5 110,120 128,749 136,116 145,096 135,515 8,980 (9,581) 6.6%
Pharmaceutical and other medical non-durables
HC.5.1 8,247 7,795 7,477 7,197 6,901 (280) (296) (5.1)%
Therapeutic appliances and other medical durables
HC.5.2 101,873 120,954 128,639 137,899 128,614 9,260 (9,285) 7.6%

48 Health Expenditure Trends in New Zealand 2000–2010
Health care by function ICHA-HC code
2005/06 (000s)
2006/07 (000s)
2007/08 (000s)
2008/09 (000s)
2009/10 (000s)
Change 2007/08 to
2008/09
Change 2008/09 to
2009/10
Average annual
growth rate
Total expenditure on personal health care 1,122,152 1,298,648 1,490,209 1,634,706 1,501,119 144,497 (133,587) 10.0%
Prevention and public health services HC.6 295,845 366,207 405,229 399,823 390,016 (5,406) (9,807) 8.5%
Health administration and health insurance HC.7 176,318 187,212 211,078 240,100 241,290 29,022 1,190 8.5%
Total current expenditure on health care 1,594,315 1,852,067 2,106,516 2,274,629 2,132,425 168,113 (142,204) 9.4%
Memorandum items: further health-related functions
Education and training of health personnel HC.R.2 216,163 232,591 232,591 276,340 290,163 43,749 13,823 8.2%
Research and development in health HC.R.3 177,941 202,918 206,484 219,038 225,197 12,554 6,159 7.2%
Food, hygiene and drinking water control HC.R.4 249,417 254,526 364,004 368,015 368,171 4,011 156 11.1%
Environmental health HC.R.5 1,294,647 1,353,949 1,409,588 1,363,483 1,444,295 (46,105) 80,812 3.4%
Administration and provision of social services in kind to assist living with disease and impairment
HC.R.6 70,171 96,277 131,404 151,886 119,148 20,482 (32,738) 13.4%
Total health-related expenditure 2,008,339 2,140,261 2,344,071 2,378,762 2,446,974 34,691 68,212 5.4%
Total health and health-related expenditure 3,602,654 3,992,328 4,450,587 4,653,391 4,579,399 202,804 (73,992) 7.1%

Health Expenditure Trends in New Zealand 2000–2010 49
7 Private sector funding Private sector funding sources were the major contributors to total current health funding in the early years of the New Zealand health services. However, since the end of World War II, public sector funding has dominated. Private sources of funding consist of out-of-pocket, health insurance and not-for-profit organisations. Together, they accounted for approximately 16.8% of total current health expenditure in 2009/10, compared with 20.9% in 1999/00 – considerably higher than the low of 12% in 1979/80 (see Figures 4.2 and 4.2A). Out-of-pocket expenditure by private households is the largest component of private sector funding, contributing approximately 10.5% to total current health expenditure in 2009/10, while health insurance and not-for-profit organisations contributed 4.9% and 1.4% respectively. A minimal estimate has been included for privately funded long-term nursing care. This estimate is likely to be understated and is subject to refinement.
7.1 Out-of-pocket expenditure Data on out-of-pocket expenditure for 2009/10 is based on the 2010 Household Economic Survey (HES) produced by Statistics New Zealand.18 Surveys were conducted for 2000/01, 2003/04, 2006/07 and 2009/10. The figures for 2005/06, 2007/08 and 2008/09 were estimated based on the Consumers Price Index (CPI). Household consumption expenditure covers expenditure by resident households, whether this occurs in New Zealand or overseas. Resident households include individuals living in private dwellings or in non-private dwellings, such as boarding houses, rest homes and prisons.19 Out-of-pocket HES data is collected in three ways:
• a 12-month recall (for single payments of $200 or more); $100 for medical services
• latest payment (for regular commitments such as electricity, telephone, rates, rent)
• 14-day diary keeping.
18 The HES was an annual survey until 1998. 19 See: www.stats.govt.nz

50 Health Expenditure Trends in New Zealand 2000–2010
It is believed that the HES underestimates expenditure in a number of areas, such as contributions to health insurance. This is because payments are often deducted at source from salaries and are sometimes overlooked in the survey data collection.20 Health insurance premiums are recorded under private health insurance, while out-of-pocket co-payments to health insurance claims are recorded under the appropriate health care by function code in current expenditure on health care. Consequently the HES produces conservative estimates. Use of this survey as a data source for out-of-pocket expenses remains unchanged. Table 7.1 presents the trends for out-of-pocket expenditure for 2005/06 to 2009/10 by health care function. During this period, total out-of-pocket expenditure on total health and health-related services increased on average by 2.5% per annum. All other specialised health care increased more significantly by 12.9%. For 2009/10, the major components of out-of-pocket expenditure on total health and health-related services were outpatient care (37.5%) and pharmaceuticals (27.1%); most of these services were provided by the private sector. 7.1.1 Out-of-pocket expenditure trends
The trends in total out-of-pocket expenditure from 1999/00 to 2009/10 are reported in Appendix 3.1. Total out-of-pocket expenditure on health increased from $1,375.2 million in 1999/00 to $2,086.5 million in 2009/10. In nominal terms, the rate of this increase was approximately 4.3% per year (2.0% in real terms). The actual growth rate in the actual survey years from 2000/01 to 2009/10 was used to project the expenditure for the non-survey years: 2005/06, 2007/08 and 2008/09. In 2009/10, the total out-of-pocket funder category also included $290.2 million for the cost of educating health professionals not covered by the government subsidy. This is a health-related function.
7.2 Health insurance Estimates of health insurers’ total current expenditure on health care during the review year are based on data provided by the executive director of the Health Funds Association of New Zealand Inc (HFANZ). The 2009/10 estimates show that current health expenditure by the insurance industry has increased from $560.9 million in 1999/00 to $974.9 million in 2009/10. During 2009/10, health insurance accounted for 4.9% of all current spending on health, compared with 6.0% in 1999/00. Table 7.2 provides the 2003/04–2009/10 estimated destinations of insurance funding on personal health care based on aggregate information from the HFANZ statistics.
20 See: www.stats.govt.nz

Health Expenditure Trends in New Zealand 2000–2010 51
Table 7.1: Survey responses for out-of-pocket expenditure, using SHA, 2005/06–2009/10
Health care by function ICHA-HC code
Out of pocket Change 2007/08 to
2008/09 (000s)
Change 2008/09 to
2009/10 (000s)
Average annual
growth rate 2005/06 (000s)
2006/07 (000s)
2007/08 (000s)
2008/09 (000s)
2009/10 (000s)
Inpatient care
Curative and rehabilitative care HC.1.1; 2.1 330,650 333,620 342,054 351,475 361,056 9,421 9,581 2.4%
Long-term nursing care HC.3.1 94,379 102,314 104,901 105,895 109,476 994 3,581 3.9%
Services of day care
Curative and rehabilitative care HC.1.2; 2.2 30,787 31,063 31,849 32,726 33,618 877 892 1.4%
Long-term nursing care HC.3.2 – – – – – – – –
Outpatient care
Outpatient curative and rehabilitative care HC.1.3; 2.3 919,249 698,386 820,901 849,971 897,625 29,070 47,654 2.2%
Basic medical and diagnostic services HC.1.3.1 76,967 77,658 79,621 81,814 84,044 2,193 2,230 3.7%
Outpatient dental care HC.1.3.2 457,706 349,541 358,377 374,708 399,800 16,331 25,092 (0.3)%
All other specialised health care HC.1.3.3 194,555 151,637 260,331 267,501 284,400 7,170 16,899 12.9%
All other outpatient care HC.1.3.9 190,021 119,550 122,572 125,948 129,381 3,376 3,433 (3.9)%
Home care
Curative and rehabilitative care HC.1.4; 2.4 – – – – – – – –
Long-term nursing care HC.3.3 – – – – – – – –
Ancillary services to health care HC.4 36,261 25,941 26,597 34,917 43,900 8,320 8,983 7.9%
Medical goods dispensed to outpatients HC.5 644,849 589,505 604,407 615,075 640,800 10,668 25,725 1.7%
Pharmaceutical and other medical non-durables
HC.5.1 610,886 551,936 565,888 575,365 598,930 9,477 23,565 1.4%
Therapeutic appliances and other medical durables
HC.5.2 33,963 37,569 38,519 39,710 41,870 1,191 2,160 6.0%

52 Health Expenditure Trends in New Zealand 2000–2010
Health care by function ICHA-HC code
Out of pocket Change 2007/08 to
2008/09 (000s)
Change 2008/09 to
2009/10 (000s)
Average annual
growth rate 2005/06 (000s)
2006/07 (000s)
2007/08 (000s)
2008/09 (000s)
2009/10 (000s)
Total expenditure on personal health care 2,056,175 1,780,829 1,930,709 1,990,059 2,086,475 59,350 96,416 2.0%
Health administration and health insurance HC.7 – – – – – – – –
Total current expenditure on health care 2,056,175 1,780,829 1,930,709 1,990,059 2,086,475 59,350 96,416 2.0%
Memorandum items: further health-related functions
Education and training of health personnel HC.R.2 234,177 251,974 283,471 276,341 290,163 (7,130) 13,822 6.4%
Total health-related expenditure 234,177 251,974 283,471 276,341 290,163 (7,130) 13,822 6.4%
Total health and health-related expenditure 2,290,352 2,032,803 2,214,180 2,266,400 2,376,638 52,220 110,238 2.5%
Source: Statistics New Zealand, Household Economic Survey 2010.
Table 7.2: Destinations of insurance funding on personal health care ($ million), 2003/04–2009/10
2003/04* 2004/05* 2005/06* 2006/07 2007/08 2008/09 2009/10 Change 2008/09–2009/10
Average annual growth rate
Public institutions 0.673 0.622 0.600 0.750 0.815 0.878 0.921 0.043 20.5%
Private institutions 454.240 485.765 548.839 546.363 593.924 639.794 670.912 31.118 6.9%
Community care 216.725 209.299 212.636 246.837 268.324 289.048 303.106 14.058 2.9%
Total 671.638 695.686 762.075 793.950 863.063 929.720 974.939 45.218 5.4%
Source: Health Insurance Association – Health Insurance Statistics July 2010.
* 2003/04–2005/06 data restated for an estimate of health administration.

Health Expenditure Trends in New Zealand 2000–2010 53
7.2.1 Expenditure trends
Aggregate health insurance expenditure grew from $671.6 million in 2003/04 to $974.9 million in 2009/10. The average annual compound growth in insurance expenditure during the period was 6.4% (3.6% in real terms). A breakdown by category of trends in health insurance expenditure since 1999/00 is provided in Appendix 4. The trend over the 10-year period to 2009/00 reflects an increase in ‘major medical’ insurance but a decline in comprehensive medical policies. This is in line with the Ministry’s capitated primary practice services funding (subsidised GP visits for registered patients). Table 7.3 gives details of insurance coverage by age group across the population for 2007 to 2010. There has been no material change in age distribution over this period.
Table 7.3: Proportion of the New Zealand population covered by medical insurance (by age group), 2007–2010
Age 2007 2008 2009 2010 Change 2009 to
2010
Percent % 2009 to
2010
Average annual
growth rate
0–4 62,125 64,930 64,376 67,415 3,039 4.7% 3.4%
5–9 82,324 82,143 82,308 82,040 (268) (0.3)% (0.1)%
10–14 94,185 92,991 91,624 89,852 (1,772) (1.9)% (1.5)%
15–19 99,202 99,887 99,613 97,826 (1,787) (1.8)% 1.0%
20–24 69,965 73,244 74,905 75,339 434 0.6% 2.9%
25–29 63,991 66,059 66,311 68,063 1,752 2.6% 2.2%
30–34 85,042 83,258 81,189 80,846 (343) (0.4)% (2.1)%
35–39 111,288 111,180 110,029 108,429 (1,600) (1.5)% (0.2)%
40–44 122,011 120,618 119,690 118,563 (1,127) (0.9)% (1.1)%
45–49 129,583 130,872 130,819 128,671 (2,148) (1.6)% 0.4%
50–54 121,532 122,037 122,816 122,613 (203) (0.2)% 0.3%
55–59 116,679 114,785 114,484 112,497 (1,987) (1.7)% (1.2)%
60–64 87,677 93,999 97,548 98,765 1,217 1.2% 5.0%
65–69 55,125 56,178 58,362 58,394 32 0.1% 4.0%
70–74 30,571 31,440 32,812 33,837 1,025 3.1% 3.6%
75–79 22,152 21,988 22,032 21,712 (320) (1.5)% (0.2)%
80–84 15,095 15,369 15,501 15,433 (68) (0.4)% 1.8%
85–89 6,063 6,438 6,784 7,026 242 3.6% 6.2%
90+ 1,878 1,989 2,046 2,256 210 10.3% 8.4%
Unknown 48 31 31 31 – (0.0)% (8.3)%
Total 1,376,536 1,389,436 1,393,280 1,389,608 (3,672) (0.3)% 0.6%
Source: Health Funds Association, Health Insurance Statistics July 2010

54 Health Expenditure Trends in New Zealand 2000–2010
7.3 Voluntary and not-for-profit organisations In order to estimate the voluntary and not-for-profit contribution to health funding, a large sample of these organisations was compiled with data sourced from annual reports.21 (See Appendix 7 for a list of the organisations.) The not-for-profit estimate represents funding from non-governmental sources, primarily contributions, donations, corporate grants and earnings on investments.22 The sample of not-for-profit organisations is increasing as additional entities providing health and health-related services are located. An estimate for GST has been included by increasing the values by 12.5%. The majority of this estimate has been attributed to SHA health expenditure as the main contributions of not-for-profit organisations are in primary health care, disability support and public health promotion and protection functions. Some organisations also contribute to health research, a health-related activity; this has been recognised on an organisational basis. For example, a portion of the Cancer Society’s total funding has been apportioned to research. This estimate remains conservative as it still reflects only a sample of the sector, with the full extent of this sector remaining unknown. The sample may be missing some key organisations that provide significant levels of service. For example, it is likely that patient transportation, especially fixed-wing and rotary-flight air transportation, is underestimated. Also, significant contributions for hospice services are also likely to be missing. In addition, where there has been doubt as to whether a revenue source should be included in the estimates, such sources have been excluded. Major not-for-profit organisations include the Cancer Society of New Zealand, The Royal New Zealand Plunket Society, the National Heart Foundation of New Zealand, CCS Disability Action (formerly Crippled Children’s Society), Presbyterian Support New Zealand, Arthritis New Zealand, Barnardos New Zealand, Asthma and Respiratory Foundation of New Zealand and many others that provide voluntary health or health-related services.
7.3.1 Expenditure trends
Estimates for the not-for-profit sector have increased from $32.0 million in 1999/00 to $272.6 million in 2009/10. The values reported for periods prior to 2003/04 are significantly underestimated as they were based on a very small sample without an extrapolation to a national level. Each year, additional organisations are located and the sample grows. Therefore, the year-on-year change reflects both organisations being added to the sample and the change in funding by previously identified organisations.
21 Sourced from the Charities Commission website:
www.register.charities.govt.nz/CharitiesRegister/Search.aspx 22 Many of these organisations received income from the Ministry of Health, DHBs and other
central or local government sources. To avoid double counting, revenues from these sources are not included.

Health Expenditure Trends in New Zealand 2000–2010 55
7.4 Trends in uses of private source funding The estimates for total private source funding by SHA from 2005/06 to 2009/10 are shown in Table 7.4. Details for 2009/10 by individual funder group are presented in Table 7.5. Over the five-year period, the total private funding of health care and health-related services has grown by 4.7% on average per annum. Although this reflects significant growth, it is less than the total public funding growth rate of 8.3%. Within private funding, the growth on personal health care is slightly lower than the total at 4.1%, although this figure is skewed by the expansion of not-for-profit organisations in the sample and their significant contribution to prevention and public health functions. The not-for-profit estimate increased significantly from 2007/08 to 2009/10 as additional entities providing health and health-related services were located. This estimate remains conservative as it reflects only a sample of the sector, with the full extent of the sector still unknown. Insurance expenditure increase is attributable to both an increase in the number of claims and an increase in the cost of treatment.23 Out-of-pocket expenditure by private households is the largest component of private sector funding, contributing on average 65.0% of total private health funding with compound nominal dollar growth of 2.9% over this five-year period.
23 HFANZ, health insurance statistics, July 2010 (HFANZ 2010).
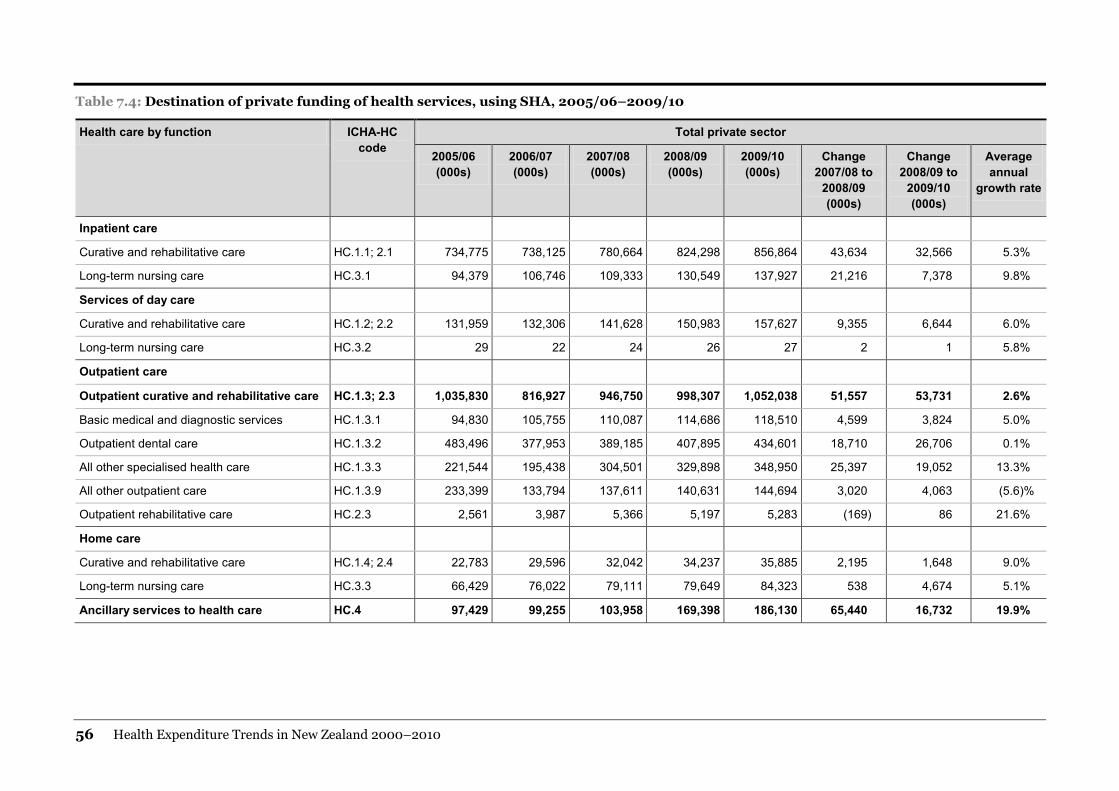
56 Health Expenditure Trends in New Zealand 2000–2010
Table 7.4: Destination of private funding of health services, using SHA, 2005/06–2009/10
Health care by function ICHA-HC code
Total private sector
2005/06 (000s)
2006/07 (000s)
2007/08 (000s)
2008/09 (000s)
2009/10 (000s)
Change 2007/08 to
2008/09 (000s)
Change 2008/09 to
2009/10 (000s)
Average annual
growth rate
Inpatient care
Curative and rehabilitative care HC.1.1; 2.1 734,775 738,125 780,664 824,298 856,864 43,634 32,566 5.3%
Long-term nursing care HC.3.1 94,379 106,746 109,333 130,549 137,927 21,216 7,378 9.8%
Services of day care
Curative and rehabilitative care HC.1.2; 2.2 131,959 132,306 141,628 150,983 157,627 9,355 6,644 6.0%
Long-term nursing care HC.3.2 29 22 24 26 27 2 1 5.8%
Outpatient care
Outpatient curative and rehabilitative care HC.1.3; 2.3 1,035,830 816,927 946,750 998,307 1,052,038 51,557 53,731 2.6%
Basic medical and diagnostic services HC.1.3.1 94,830 105,755 110,087 114,686 118,510 4,599 3,824 5.0%
Outpatient dental care HC.1.3.2 483,496 377,953 389,185 407,895 434,601 18,710 26,706 0.1%
All other specialised health care HC.1.3.3 221,544 195,438 304,501 329,898 348,950 25,397 19,052 13.3%
All other outpatient care HC.1.3.9 233,399 133,794 137,611 140,631 144,694 3,020 4,063 (5.6)%
Outpatient rehabilitative care HC.2.3 2,561 3,987 5,366 5,197 5,283 (169) 86 21.6%
Home care
Curative and rehabilitative care HC.1.4; 2.4 22,783 29,596 32,042 34,237 35,885 2,195 1,648 9.0%
Long-term nursing care HC.3.3 66,429 76,022 79,111 79,649 84,323 538 4,674 5.1%
Ancillary services to health care HC.4 97,429 99,255 103,958 169,398 186,130 65,440 16,732 19.9%
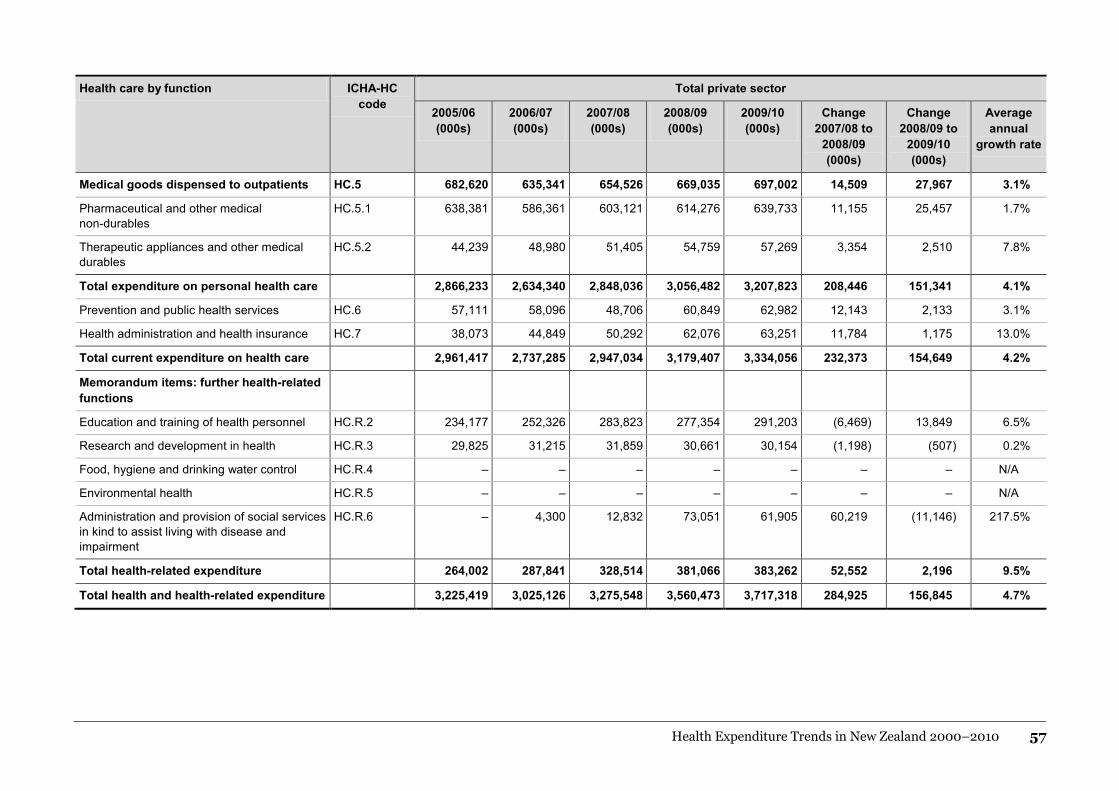
Health Expenditure Trends in New Zealand 2000–2010 57
Health care by function ICHA-HC code
Total private sector
2005/06 (000s)
2006/07 (000s)
2007/08 (000s)
2008/09 (000s)
2009/10 (000s)
Change 2007/08 to
2008/09 (000s)
Change 2008/09 to
2009/10 (000s)
Average annual
growth rate
Medical goods dispensed to outpatients HC.5 682,620 635,341 654,526 669,035 697,002 14,509 27,967 3.1%
Pharmaceutical and other medical non-durables
HC.5.1 638,381 586,361 603,121 614,276 639,733 11,155 25,457 1.7%
Therapeutic appliances and other medical durables
HC.5.2 44,239 48,980 51,405 54,759 57,269 3,354 2,510 7.8%
Total expenditure on personal health care 2,866,233 2,634,340 2,848,036 3,056,482 3,207,823 208,446 151,341 4.1%
Prevention and public health services HC.6 57,111 58,096 48,706 60,849 62,982 12,143 2,133 3.1%
Health administration and health insurance HC.7 38,073 44,849 50,292 62,076 63,251 11,784 1,175 13.0%
Total current expenditure on health care 2,961,417 2,737,285 2,947,034 3,179,407 3,334,056 232,373 154,649 4.2%
Memorandum items: further health-related functions
Education and training of health personnel HC.R.2 234,177 252,326 283,823 277,354 291,203 (6,469) 13,849 6.5%
Research and development in health HC.R.3 29,825 31,215 31,859 30,661 30,154 (1,198) (507) 0.2%
Food, hygiene and drinking water control HC.R.4 – – – – – – – N/A
Environmental health HC.R.5 – – – – – – – N/A
Administration and provision of social services in kind to assist living with disease and impairment
HC.R.6 – 4,300 12,832 73,051 61,905 60,219 (11,146) 217.5%
Total health-related expenditure 264,002 287,841 328,514 381,066 383,262 52,552 2,196 9.5%
Total health and health-related expenditure 3,225,419 3,025,126 3,275,548 3,560,473 3,717,318 284,925 156,845 4.7%

58 Health Expenditure Trends in New Zealand 2000–2010
Table 7.5: Destination of private funding of health services using SHA and funder, 2005/06–2009/10
Health care by function ICHA-HC code
Not-for-profit Insurance Out-of-pocket
2005/06 (000s)
2006/07 (000s)
2007/08 (000s)
2008/09 (000s)
2009/10 (000s)
2005/06 (000s)
2006/07 (000s)
2007/08 (000s)
2008/09 (000s)
2009/10 (000s)
2005/06 (000s)
2006/07 (000s)
2007/08 (000s)
2008/09 (000s)
2009/10 (000s)
Inpatient care
Curative and rehabilitative care HC.1.1; 2.1 – – – 339 343 404,125 404,505 438,610 472,484 495,465 330,650 333,620 342,054 351,475 361,056
Long-term nursing care HC.3.1 – 4,432 4432 24,654 28,451 – – – – – 94,379 102,314 104,901 105,895 109,476
Services of day care
Curative and rehabilitative care HC.1.2; 2.2 – – – – – 101,172 101,243 109,779 118,257 124,009 30,787 31,063 31,849 32,726 33,618
Long-term nursing care HC.3.2 – – – – – 29 22 24 26 27 – – – – –
Outpatient care
Outpatient curative and rehabilitative care
HC.1.3; 2.3 33,133 21,306 20,416 34,760 35,313 83,448 97,235 105,433 113,576 119,100 919,249 698,386 820,901 849,971 897,625
Basic medical and diagnostic services
HC.1.3.1 – – – 53 51 17,863 28,097 30,466 32,819 34,415 76,967 77,658 79,621 81,814 84,044
Outpatient dental care HC.1.3.2 – – – – – 25,790 28,412 30,808 33,187 34,801 457,706 349,541 358,377 374,708 399,800
All other specialised health care
HC.1.3.3 – 14,859 12,788 28,591 29,100 26,989 28,942 31,382 33,806 35,450 194,555 151,637 260,331 267,501 284,400
All other outpatient care HC.1.3.9 33,133 4,817 4,817 3,672 3,766 10,245 9,427 10,222 11,011 11,547 190,021 119,550 122,572 125,948 129,381
Outpatient rehabilitative care HC.1.3.9 – 1,630 2,811 2,444 2,396 2,561 2,357 2,555 2,753 2,887 – – – – –
Home care
Curative and rehabilitative care HC.1.4; 2.4 – 585 585 350 350 22,783 29,011 31,457 33,887 35,535 – – – – –
Long-term nursing care HC.3.3 43,675 47,033 47,678 45,788 48,816 22,754 28,989 31,433 33,861 35,507 – – – – –
Ancillary services to health care
HC.4 9,251 21,021 20,659 73,400 78,178 51,917 52,293 56,702 61,081 64,052 36,261 25,941 26,597 34,917 43,900
Medical goods dispensed to outpatients
HC.5 – 3,947 4,699 5,032 4,894 37,771 41,889 45,420 48,928 51,308 644,849 589,505 604,407 615,075 640,800
Pharmaceutical and other medical non-durables
HC.5.1 – 1,112 1,112 – – 27,495 33,313 36,121 38,911 40,803 610,886 551,936 565,888 575,365 598,930
Therapeutic appliances and other medical durables
HC.5.2 – 2,835 3,587 5,032 4,894 10,276 8,576 9,299 10,017 10,505 33,963 37,569 38,519 39,710 41,870

Health Expenditure Trends in New Zealand 2000–2010 59
Health care by function ICHA-HC code
Not-for-profit Insurance Out-of-pocket
2005/06 (000s)
2006/07 (000s)
2007/08 (000s)
2008/09 (000s)
2009/10 (000s)
2005/06 (000s)
2006/07 (000s)
2007/08 (000s)
2008/09 (000s)
2009/10 (000s)
2005/06 (000s)
2006/07 (000s)
2007/08 (000s)
2008/09 (000s)
2009/10 (000s)
Total expenditure on personal health care
86,059 98,324 98,469 184,323 196,345 723,999 755,187 818,858 882,100 925,003 2,056,175 1,780,829 1,930,709 1,990,059 2,086,476
Prevention and public health services
HC.6 57,111 58,096 48,706 60,849 62,982 – – – – – – – – – –
Health administration and health insurance
HC.7 – 6,087 6,087 14,456 13,315 38,073 38,762 44,205 47,620 49,936 – – – – –
Total current expenditure on health care
143,170 162,507 153,262 259,628 272,642 762,072 793,949 863,063 929,720 974,939 2,056,175 1,780,829 1,930,709 1,990,059 2,086,475
Memorandum items: further health-related functions
Education and training of health personnel
HC.R.2 – 352 352 1,013 1,040 – – – – – 234,177 251,974 283,471 276,341 290,163
Research and development in health
HC.R.3 29,825 31,215 31,859 30,661 30,154 – – – – – – – – – –
Food, hygiene and drinking water control
HC.R.4 – – – – – – – – – – – – – – –
Environmental health HC.R.5 – – – – – – – – – – – – – – –
Administration and provision of social services in kind to assist living with disease and impairment
HC.R.6 – 4,300 12,832 73,051 61,905 – – – – – – – – – –
Total health-related expenditure
29,825 35,867 45,043 104,725 93,099 – – – – – 234,177 251,974 283,471 276,341 290,163
Total health and health-related expenditure
172,995 198,374 198,305 364,353 365,741 762,072 793,949 863,063 929,720 974,939 2,290,352 2,032,803 2,214,180 2,266,400 2,376,638

60 Health Expenditure Trends in New Zealand 2000–2010
8 International comparisons This chapter compares New Zealand’s expenditure on total current health and disability services with total current health expenditure by other member countries of the OECD: as a percentage of GDP, per capita spend and the percentage of publicly funded total current health.
8.1 Data comparison issues Health expenditure is determined by a mix of social, political and economic factors, which means that no single figure represents the ‘right’ amount to spend on health. Therefore, care should be exercised when comparing data on international health expenditure, as these comparisons do not indicate whether:
• a country should spend more or less on health
• the mix of health care services is appropriate or directly comparable
• the production of health care services is technically efficient
• quality of care, equity and access considerations are appropriate
• the right quantity of health care reaches the right consumers. Technical issues also mean that this data should be interpreted cautiously. The most important limitation is the lack of consistent and reliable time-series information on health expenditure for some countries. These are some of the factors contributing to such technical limitations.
• There are differences in the definitions of the variables included in the various categories of health expenditure, leaving open the possibility of differing interpretations between countries, especially in relation to long-term nursing.
• Countries do not have formal requirements for reporting health expenditure.
• It is difficult to measure and control social, medical, cultural, demographic and economic differences between countries.
• There are problems measuring health outcomes. In this HET report, all tables reflect data from 1999/00 to 2008/09, or the most recent year with complete data for OECD countries. The following comparisons of health expenditure in OECD countries should be viewed with these limitations in mind. Two modifications have been made to the historical OECD data. The first modification is to remove the capital component from total health expenditure for those countries reporting capital expenditure. This results in greater comparability with New Zealand. The second modification is to recalibrate the values reported for New Zealand to include previously excluded non-health expenditure, primarily disability support services directly funded by the Ministry. These modifications have been made for all the following OECD data.

Health Expenditure Trends in New Zealand 2000–2010 61
8.2 Per capita health expenditure in US dollar purchasing power parities
The concept of purchasing power parities (PPPs) provides a mechanism for comparing the health spending of different countries on a common basis. PPPs are the rates of currency conversion that equalise the purchasing power of different currencies. Table 8.1 presents this information. In 2009, the United States had the highest per capita health expenditure of the OECD countries, followed by Switzerland, Norway and then Luxembourg. Of the 29 countries reporting in 2009, New Zealand ranked 18th, after Italy and before Spain, and 21st of the 33 OECD countries reporting in 2008. The complete listing of countries can be found in Table 8.1. For the 10-year period ending 2009, New Zealand’s rate of growth increased to 6.3% and is comparable to the OECD 10-year average of 6.8%.
8.3 Health expenditure as a percentage of GDP Table 8.2 presents information by country for the period 1999 to 2009 for the percentage of GDP spent on health. New Zealand spent 10.3% of GDP on health in 2009 compared with 9.6% in 2008, higher than the weighted OECD average of 9.8% and 8.9% for 2009 and 2008 respectively (not all countries have reported for 2009). The actual weighted average for 2009 is subject to change once all countries provide information. Table 8.2 shows that New Zealand’s health expenditure as a percentage of GDP was the 9th highest of the 33 OECD member countries reporting in 2008 and 10th of the 29 reporting for 2009. The rise in health spending share of GDP was particularly marked in countries hit hard by the global recession. In 2009, the United States had the highest proportion of current health expenditure to GDP at 16.6%, while Mexico, at 6.1%, had the lowest proportion. For New Zealand, the proportion of current health expenditure to GDP increased from 8.0% in 1999 to 10.3% in 2009. In comparison, the OECD weighted average over the same period increased from 7.9% to 9.8%. New Zealand’s rate of growth over the 10-year period was 2.6% compared with the OECD average annual 10-year growth rate of 2.2%. Current health expenditure as a proportion of GDP is often used in international comparisons. However, given that expenditure contains price and volume components, high ratios of health expenditure to GDP could reflect a higher price rather than a higher volume of health care services, so this measure should be used with caution. Partly for this reason, there is no ‘right’ or ‘wrong’ proportion of a country’s GDP to be spent on health, and it should be considered together with per capita health spending (see Table 8.1: Per capita current health expenditure (US$ PPP) for OECD countries, 1999-2009). Countries having a high health spend to GDP ratio might have relatively low health expenditure per capita, while the converse may also apply.

62 Health Expenditure Trends in New Zealand 2000–2010
Table 8.1: Per capita current health expenditure (US$ PPP) for OECD countries, 1999–2009
Country 1999 2000 2001 2002 2003 2004 2005 2006 2007 2008 2009 Rank 2008 Rank 2009
Australia 1975 2135 2249 2407 2539 2722 2812 2976 3168 3266 DNR 15th DNR
Austria 2568 2701 2753 2912 3048 3224 3281 3447 3588 3903 4045 5th 9th
Belgium 1841 2010 2134 2292 3034 3164 2972 3121 3304 3714 3946 10th 10th
Canada 2319 2414 2614 2747 2911 3065 3274 3482 3663 3823 4139 9th 28th
Chile 581 615 656 671 773 788 828 843 931 1069 1146 31st 27th
Czech Republic 894 932 1040 1138 1286 1341 1422 1509 1606 1793 2041 25th 22nd
Denmark 2299 2396 2555 2751 2780 2990 3099 3407 3611 3889 4185 7th 6th
Estonia 501 511 514 568 664 754 826 950 1097 1275 1337 29th 26th
Finland 1666 1774 1882 2042 2145 2345 2471 2621 2761 3000 3053 17th 16th
France 2344 2492 2665 2863 2912 3034 3212 3392 3575 3703 3872 11th 11th
Germany 2477 2564 2683 2816 2979 3050 3236 3439 3597 3824 4072 8th 8th
Greece§ 1402 1382 1655 1856 1931 1998 2261 2505 2623 DNR DNR DNR DNR
Hungary 774 820 932 1064 1240 1257 1368 1438 1384 1457 1476 28th 25th
Iceland* 2603 2673 2780 3078 3194 3334 3304 3193 3320 3571 3538 13th 14th
Ireland 1488 1653 1917 2170 2377 2595 2818 3080 3311 3617 3609 12th 12th
Israel 1533 1696 1803 1803 1688 1775 1769 1835 1951 2076 2103 24th 21st
Italy 1798 1968 2127 2141 2172 2277 2406 2603 2652 2937 3020 18th 17th
Japan 1753 1898 2001 2077 2171 2293 2434 2560 2707 2832 DNR 20th DNR
Korea 656 782 912 955 987 1075 1221 1387 1549 1632 1784 27th 24th
Luxembourg 2373 2706 2902 3195 3349 3753 3724 3973 4105 4037 4808 4th 4th
Mexico* 470 508 552 580 629 688 731 776 842 892 918 32nd 29th
Netherlands 2076 2224 2439 2701 2847 3017 3171 3318 3615 3891 4585 6th 5th
New Zealand 1522 1607 1708 1841 1847
New Zealand restated*† 1622 1689 1787 1889 1893 2044 2197 2467 2525 2784 2983 21st 18th
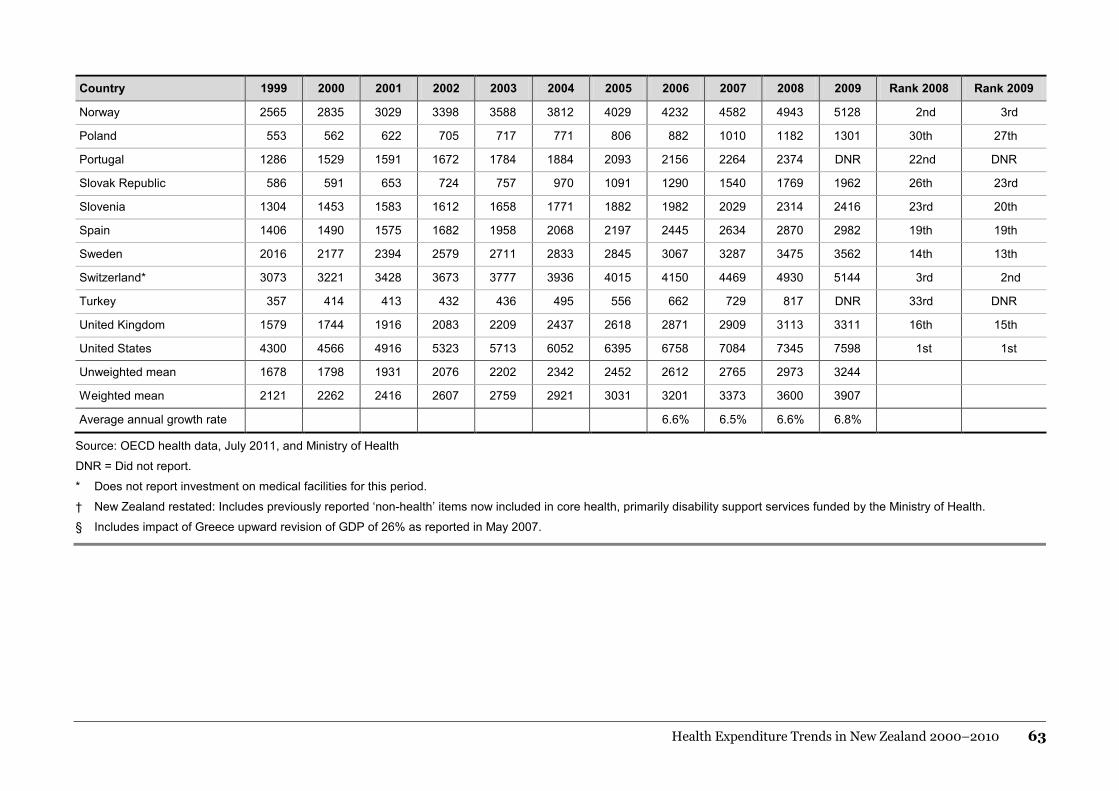
Health Expenditure Trends in New Zealand 2000–2010 63
Country 1999 2000 2001 2002 2003 2004 2005 2006 2007 2008 2009 Rank 2008 Rank 2009
Norway 2565 2835 3029 3398 3588 3812 4029 4232 4582 4943 5128 2nd 3rd
Poland 553 562 622 705 717 771 806 882 1010 1182 1301 30th 27th
Portugal 1286 1529 1591 1672 1784 1884 2093 2156 2264 2374 DNR 22nd DNR
Slovak Republic 586 591 653 724 757 970 1091 1290 1540 1769 1962 26th 23rd
Slovenia 1304 1453 1583 1612 1658 1771 1882 1982 2029 2314 2416 23rd 20th
Spain 1406 1490 1575 1682 1958 2068 2197 2445 2634 2870 2982 19th 19th
Sweden 2016 2177 2394 2579 2711 2833 2845 3067 3287 3475 3562 14th 13th
Switzerland* 3073 3221 3428 3673 3777 3936 4015 4150 4469 4930 5144 3rd 2nd
Turkey 357 414 413 432 436 495 556 662 729 817 DNR 33rd DNR
United Kingdom 1579 1744 1916 2083 2209 2437 2618 2871 2909 3113 3311 16th 15th
United States 4300 4566 4916 5323 5713 6052 6395 6758 7084 7345 7598 1st 1st
Unweighted mean 1678 1798 1931 2076 2202 2342 2452 2612 2765 2973 3244
Weighted mean 2121 2262 2416 2607 2759 2921 3031 3201 3373 3600 3907
Average annual growth rate 6.6% 6.5% 6.6% 6.8%
Source: OECD health data, July 2011, and Ministry of Health
DNR = Did not report.
* Does not report investment on medical facilities for this period.
† New Zealand restated: Includes previously reported ‘non-health’ items now included in core health, primarily disability support services funded by the Ministry of Health.
§ Includes impact of Greece upward revision of GDP of 26% as reported in May 2007.

64 Health Expenditure Trends in New Zealand 2000–2010
Table 8.2: Current health expenditure as a percentage of GDP, 1999–2009
Country 1999 2000 2001 2002 2003 2004 2005 2006 2007 2008 2009 Rank 2008 Rank 2009
Australia 7.3% 7.6% 7.6% 7.9% 7.9% 8.1% 8.0% 8.0% 8.0% 8.3% DNR 19th DNR
Austria 9.5% 9.4% 9.6% 9.6% 9.8% 9.9% 9.8% 9.7% 9.7% 9.8% 10.4% 7th 9th
Belgium 8.1% 8.1% 8.3% 8.5% 10.0% 10.2% 10.1% 9.6% 9.7% 10.1% 10.9% 5th 7th
Canada 8.5% 8.5% 8.9% 9.2% 9.3% 9.3% 9.3% 9.5% 9.6% 9.8% 10.8% 8th 8th
Chile DNR DNR DNR DNR 7.4% 7.0% 6.8% 6.5% 6.7% 7.3% 8.1% 25th 21st
Czech Republic 6.2% 6.2% 6.4% 6.7% 7.1% 6.9% 7.0% 6.8% 6.5% 6.9% 8.0% 27th 22nd
Denmark 8.5% 8.3% 8.7% 8.9% 9.1% 9.3% 9.3% 9.5% 9.6% 9.8% 11.1% 6th 6th
Estonia 5.7% 5.2% 4.8% 4.7% 5.0% 5.1% 5.0% 5.0% 5.2% 5.9% 6.7% 31st 27th
Finland 7.1% 6.9% 7.1% 7.4% 7.8% 7.9% 8.1% 7.9% 7.6% 7.9% 8.7% 21st 19th
France 9.9% 9.8% 10.0% 10.3% 10.6% 10.7% 10.8% 10.7% 10.7% 10.8% 11.5% 2nd 2nd
Germany 9.9% 9.9% 10.0% 10.2% 10.4% 10.2% 10.3% 10.2% 10.1% 10.3% 11.2% 4th 4th
Greece † 8.2% 7.5% 8.3% 8.6% 8.5% 8.3% 9.2% 9.2% 9.3% DNR DNR DNR DNR
Hungary 6.9% 6.8% 6.9% 7.2% 8.0% 7.7% 8.1% 7.8% 7.2% 7.0% 7.3% 26th 25th
Iceland 9.1% 9.3% 9.1% 9.9% 10.4% 9.9% 9.4% 9.1% 9.1% 9.1% 9.7% 11th 11th
Ireland 5.7% 5.7% 6.3% 6.5% 6.9% 7.1% 7.3% 7.2% 7.3% 8.4% 9.1% 16th 17th
Israel 7.2% 7.2% 7.7% 7.7% 7.6% 7.5% 7.6% 7.4% 7.3% 7.5% 7.7% 24th 24th
Italy 7.4% 7.7% 7.8% 8.0% 8.0% 8.3% 8.5% 8.6% 8.3% 8.7% 9.1% 15th 12th
Japan 7.2% 7.4% 7.6% 7.7% 7.9% 7.9% 8.0% 8.0% 8.1% 8.4% DNR 17th DNR
Korea 4.0% 4.2% 4.8% 4.6% 4.9% 5.0% 5.4% 5.7% 5.9% 6.1% 6.6% 30th 28th
Luxembourg 5.8% 6.2% 6.8% 7.0% 7.1% 7.5% 7.1% 6.7% 6.5% 6.1% 7.8% 29th 23rd
Mexico 5.0% 4.9% 5.4% 5.5% 5.7% 5.9% 5.6% 5.5% 5.6% 5.7% 6.1% 32nd 29th
Netherlands 7.7% 7.6% 7.9% 8.5% 9.0% 9.1% 9.0% 8.9% 8.9% 9.0% 11.2% 12th 5th
New Zealand 7.6% 7.7% 7.8% 8.2% 8.0%
New Zealand restated* 8.0% 8.0% 8.1% 8.4% 8.2% 8.3% 8.7% 9.1% 8.8% 9.6% 10.3% 9th 10th

Health Expenditure Trends in New Zealand 2000–2010 65
Country 1999 2000 2001 2002 2003 2004 2005 2006 2007 2008 2009 Rank 2008 Rank 2009
Norway 8.6% 7.8% 8.2% 9.2% 9.4% 9.0% 8.5% 8.1% 8.3% 8.2% 9.2% 20th 15th
Poland 5.5% 5.3% 5.7% 6.1% 6.0% 5.9% 5.9% 5.9% 6.0% 6.5% 6.9% 28th 26th
Portugal 7.7% 8.6% 8.6% 8.8% 9.2% 9.5% 9.8% 9.4% 9.4% 9.5% DNR 10th DNR
Slovak Republic 5.6% 5.4% 5.4% 5.6% 5.6% 6.6% 6.7% 7.0% 7.4% 7.6% 8.6% 23rd 20th
Slovenia DNR DNR DNR 8.2% 8.1% 8.0% 8.0% 7.8% 7.4% 7.9% 8.7% 22nd 18th
Spain 7.1% 7.0% 7.0% 7.0% 7.9% 8.0% 8.0% 8.1% 8.2% 8.7% 9.2% 15th 14th
Sweden 7.8% 7.8% 8.5% 8.8% 8.9% 8.7% 8.7% 8.6% 8.5% 8.8% 9.6% 13th 12th
Switzerland 10.2% 10.2% 10.6% 10.9% 11.3% 11.3% 11.2% 10.8% 10.6% 10.7% 11.4% 3rd 3rd
Turkey 4.6% 4.7% 5.0% 5.2% 5.2% 5.1% 5.1% 5.4% 5.5% 5.5% DNR 33rd DNR
United Kingdom 6.5% 6.7% 6.9% 7.2% 7.4% 7.7% 7.9% 8.1% 8.0% 8.3% 9.3% 18th 13th
United States 12.9% 13.0% 13.7% 14.5% 15.0% 15.0% 15.0% 15.1% 15.3% 15.6% 16.6% 1st 1st
Unweighted mean 7.5% 7.5% 7.7% 8.0% 8.2% 8.3% 8.3% 8.3% 8.2% 8.5% 9.1%
Weighted mean 7.9% 7.9% 8.2% 8.5% 8.7% 8.7% 8.8% 8.7% 8.7% 8.9% 9.8%
Average annual growth rate 0.8% 0.7% 0.9% 1.7%
Source: OECD health data July 2011, and Ministry of Health
DNR = Did not report.
* New Zealand restated: Includes previously reported ‘non-health’ items now included in core health, primarily disability support services funded by the Ministry of Health.
† Includes impact of Greece upward revision of GDP of 26% in May 2007.

66 Health Expenditure Trends in New Zealand 2000–2010
8.4 Publicly funded current health expenditure as a proportion of total health expenditure
Table 8.3 shows the trends in publicly funded current health expenditure as a proportion of total current health expenditure. As shown in Table 8.3, current public health expenditure in the OECD accounts for 70.6% of total health expenditure. Over the 10-year period under review, the Czech Republic, Denmark and Luxemburg had the highest public expenditure as a proportion of total current health expenditure (84–90%). The Netherlands had the highest public expenditure as a proportion of total current health expenditure (84.7%) in 2009, while Chile and Mexico had the lowest, at 45.5% and 46.0% respectively. New Zealand was ranked 8th, with public funding accounting for 80.5% of total health spending, out of the 28 countries reporting to date with 2009 information. During the 1960s, there was a shift among OECD countries towards more public funding of health care. This pattern stabilised during the late 1970s and early 1980s and has reversed slightly in more recent years. Since 1992, New Zealand has remained within the narrow range of 77% to 80% and continues within this range in 2009/10.

Health Expenditure Trends in New Zealand 2000–2010 67
Table 8.3: Publicly funded health expenditure as a proportion of total current health expenditure, 1999–2009
Country 1999 2000 2001 2002 2003 2004 2005 2006 2007 2008 2009 Rank 2008 Rank 2009
Australia 69.7 68.4 67.8 68.5 68.0 68.3 68.3 68.2 69.2 69.0 DNR 26th DNR
Austria 77.2 77.3 76.7 76.5 76.2 76.4 77.1 77.2 77.5 78.6 79.1 11th 9th
Belgium 74.6 74.6 75.4 73.8 74.8 76.0 72.9 73.7 73.5 75.0 75.1 17th 15th
Canada 69.8 70.0 69.7 69.3 69.9 69.8 69.8 69.7 69.9 69.8 69.8 25th 20th
Chile DNR DNR DNR DNR 38.1 39.1 39.0 40.7 41.5 42.8 45.5 33rd 28th
Czech Republic 90.0 89.8 89.4 90.0 89.4 88.8 86.8 86.3 84.7 82.1 83.4 6th 5th
Denmark 83.2 83.1 83.4 83.8 83.9 83.5 83.7 83.9 83.8 84.0 84.5 1st 2nd
Estonia 77.0 77.0 78.4 76.6 76.8 75.4 76.6 73.2 76.0 78.4 78.2 13th 11th
Finland 71.2 71.0 71.6 72.1 74.3 74.7 75.1 74.4 74.3 74.3 74.3 18th 16th
France 78.9 78.9 78.9 79.2 79.2 79.1 79.1 79.0 78.5 77.9 78.1 14th 12th
Germany 80.3 80.1 79.9 79.6 78.8 77.1 77.1 76.9 77.2 77.0 77.3 15th 13th
Greece† 54.8 61.6 63.2 60.5 61.7 60.9 61.7 63.7 61.9 DNR DNR DNR DNR
Hungary 71.2 69.6 68.2 69.6 72.3 71.9 71.8 72.0 70.0 70.7 69.6 23rd 21st
Iceland 81.1 80.6 80.5 81.4 81.7 81.2 81.4 82.0 82.5 82.6 82.0 3rd 6th
Ireland 75.5 75.4 76.7 76.7 76.1 76.6 76.3 76.5 76.5 76.6 75.7 16th 14th
Israel 65.0 63.1 62.7 64.0 62.5 61.8 59.9 59.9 59.0 58.9 58.8 29th 25th
Italy 71.7 73.4 75.9 75.7 75.7 77.0 77.7 78.2 78.0 78.5 78.5 12th 10th
Japan 79.9 80.0 80.7 80.7 79.8 80.3 81.1 79.1 81.6 80.5 DNR 9th DNR
Korea 48.3 46.7 56.6 55.5 54.5 54.7 55.0 57.1 57.2 58.0 59.5 30th 24th
Luxembourg 89.7 82.0 82.7 83.0 82.9 83.3 83.2 82.8 82.6 82.4 DNR 4th DNR
Mexico 46.8 45.2 43.8 42.7 42.9 44.2 42.9 43.2 44.0 45.3 46.0 32nd 27th
Netherlands 65.8 66.4 65.8 65.5 66.5 65.6 65.8 82.4 82.0 82.1 84.7 7th 1st
New Zealand 77.5 78.0 76.4 77.9 78.3
New Zealand restated* 79.0 79.1 77.9 78.9 79.4 76.9 78.9 79.1 79.8 80.3 80.5 10th 8th

68 Health Expenditure Trends in New Zealand 2000–2010
Country 1999 2000 2001 2002 2003 2004 2005 2006 2007 2008 2009 Rank 2008 Rank 2009
Norway 81.6 81.7 82.8 82.9 83.2 83.0 83.1 83.3 83.7 84.0 84.0 2nd 4th
Poland 70.1 68.9 71.0 70.4 69.2 67.7 68.7 69.2 70.6 72.2 72.3 22nd 18th
Portugal 66.5 68.8 68.8 70.0 69.1 68.7 68.9 66.9 66.6 65.6 DNR 27th DNR
Slovak Republic 89.4 89.2 89.1 89.0 87.8 77.6 75.3 70.0 69.3 70.5 69.2 24th 22nd
Slovenia DNR DNR DNR 73.4 72.7 73.0 72.5 72.6 71.4 72.6 71.9 20th 19th
Spain 71.8 71.4 71.0 71.0 69.8 69.9 70.0 70.8 71.2 72.2 73.2 21st 17th
Sweden 85.9 85.5 81.5 81.9 82.3 81.9 81.5 81.5 81.6 81.6 81.4 8th 7th
Switzerland 55.1 55.4 56.9 57.7 58.3 58.4 59.5 59.1 59.1 59.5 59.7 28th 23rd
Turkey 60.0 61.7 67.3 70.0 71.2 71.7 67.7 68.9 68.8 72.7 DNR 19th DNR
United Kingdom 80.6 79.1 80.0 79.8 80.0 81.4 81.9 81.3 81.3 82.4 84.2 5th 3rd
United States 44.1 44.0 45.0 44.9 44.7 45.2 45.2 46.1 46.5 47.4 49.0 31st 26th
Weighted mean 74.1 73.7 74.1 74.2 71.8 71.3 71.2 70.4 70.5 71.2 70.6
Source: OECD health data July 2011, and Ministry of Health
Public expenditure percentages reported by OECD are stated in US$PPP.
* New Zealand restated: Includes previously reported ‘non-health’ items now included in core health, primarily disability support services funded by the Ministry of Health.
† Includes impact of Greece upward revision of GDP of 26% as reported in May 2007.

Health Expenditure Trends in New Zealand 2000–2010 69
8.5 Health expenditure and GDP per capita Figure 8.1 and Table 8.4 show the positive relationship between health expenditure and GDP for 33 OECD countries. There is a well-established relationship between GDP per capita and health expenditure per capita: the higher a country’s GDP per capita, the greater its health expenditure per capita is likely to be compared with other countries. Figure 8.1 presents data for all countries in 2008.
Figure 8.1: Relationship between current health expenditure and GDP in OECD countries, 2008
Current health expenditure (US$PPP per capita, 2008)
Norway
Iceland
Switzerland
BelgiumGermany
FranceCanada Netherlands
United KingdomFinlandSpain
Luxembourg
SloveniaIsrael
New Zealand
Czech RepublicKorea
Slovak Republic
HungaryEstonia
PolandChileMexico
Ireland
Turkey
Portugal
Austria
Japan
Denmark
AustraliaSweden
United States
Italy
0
1000
2000
3000
4000
5000
6000
7000
8000
0 10,000 20,000 30,000 40,000 50,000 60,000 70,000 80,000 90,000 100,000
%GDP (US$PPP per capita, 2008)
Source: OECD health data July 2011 and Ministry of Health
As Figure 8.1 shows, New Zealand expenditure on health care is higher than OECD countries with a similar level of GDP. There is no agreed optimal level of health care spending relative to GDP.

70 Health Expenditure Trends in New Zealand 2000–2010
Reasons for differences in international health spending and performance are outlined below.
• Some differences result from health service cost (and price) variations. Richer countries pay a higher price per unit of medical care consumed, given the higher labour costs and higher prices for services.
• The intensity of treatment differs between countries.
• The rates at which various invasive procedures are performed differ widely between countries.
• The rapid and extensive introduction of new medical technologies in the United States in particular explains a significant part of the difference in growth of expenditure outlays between the United States and elsewhere.
• As major determinants of health expenditure, demographic characteristics also vary significantly between countries. Some countries have high life expectancies and relatively old populations and therefore need to spend more on older people, whose health care costs are the highest per capita. (The converse is true of countries with younger populations.)
• Cultural and religious factors result in differences not only in the perception of morbidity but also in the choice of therapeutic responses.
• Variations in welfare philosophies and private insurance coverage affect public provision and the level of health care assistance provided in different countries.
• Differences between countries in the origin of funding can also significantly affect the demand for health care and expenditure.
• The incidence of litigation against health providers varies between countries. In countries with a higher incidence (as in the United States in particular), providers of health care are more likely to take out expensive insurance cover and complete higher levels of diagnostic testing to reduce this litigation risk.
• The Global Financial Crisis in 2007/08 and the resulting global recession has increased the portion of health spend to GDP in most OECD countries.
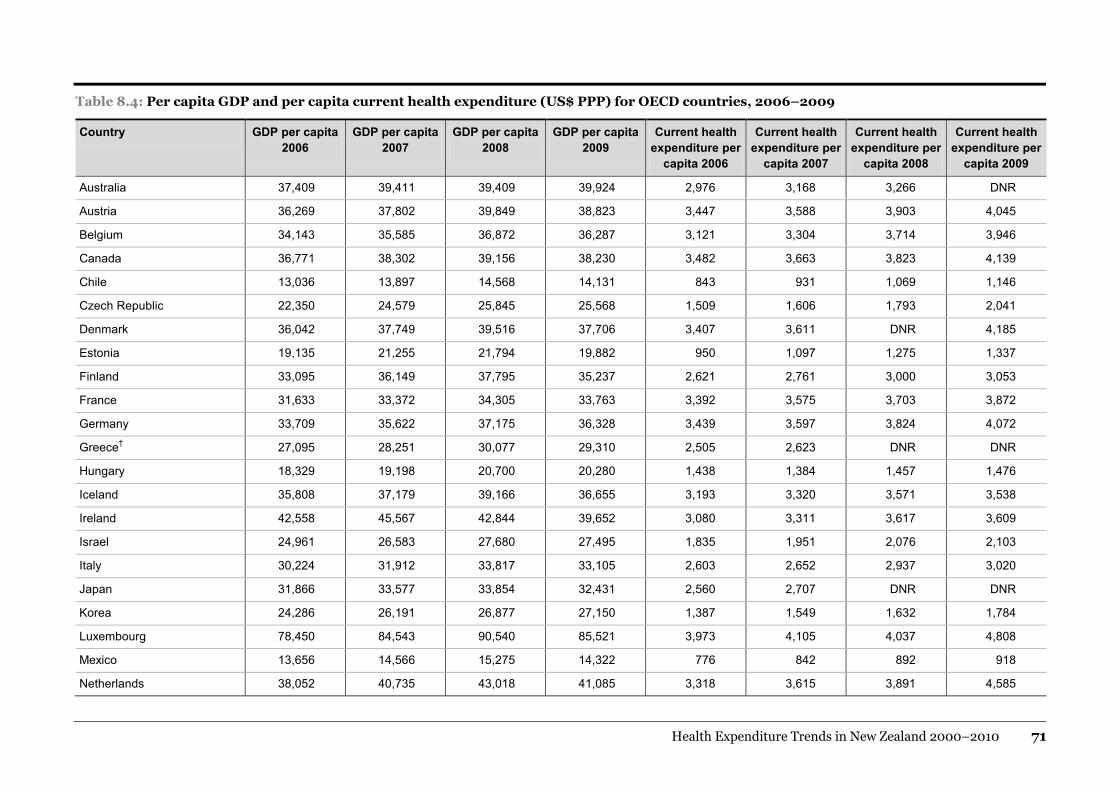
Health Expenditure Trends in New Zealand 2000–2010 71
Table 8.4: Per capita GDP and per capita current health expenditure (US$ PPP) for OECD countries, 2006–2009
Country GDP per capita 2006
GDP per capita 2007
GDP per capita 2008
GDP per capita 2009
Current health expenditure per
capita 2006
Current health expenditure per
capita 2007
Current health expenditure per
capita 2008
Current health expenditure per
capita 2009
Australia 37,409 39,411 39,409 39,924 2,976 3,168 3,266 DNR
Austria 36,269 37,802 39,849 38,823 3,447 3,588 3,903 4,045
Belgium 34,143 35,585 36,872 36,287 3,121 3,304 3,714 3,946
Canada 36,771 38,302 39,156 38,230 3,482 3,663 3,823 4,139
Chile 13,036 13,897 14,568 14,131 843 931 1,069 1,146
Czech Republic 22,350 24,579 25,845 25,568 1,509 1,606 1,793 2,041
Denmark 36,042 37,749 39,516 37,706 3,407 3,611 DNR 4,185
Estonia 19,135 21,255 21,794 19,882 950 1,097 1,275 1,337
Finland 33,095 36,149 37,795 35,237 2,621 2,761 3,000 3,053
France 31,633 33,372 34,305 33,763 3,392 3,575 3,703 3,872
Germany 33,709 35,622 37,175 36,328 3,439 3,597 3,824 4,072
Greece† 27,095 28,251 30,077 29,310 2,505 2,623 DNR DNR
Hungary 18,329 19,198 20,700 20,280 1,438 1,384 1,457 1,476
Iceland 35,808 37,179 39,166 36,655 3,193 3,320 3,571 3,538
Ireland 42,558 45,567 42,844 39,652 3,080 3,311 3,617 3,609
Israel 24,961 26,583 27,680 27,495 1,835 1,951 2,076 2,103
Italy 30,224 31,912 33,817 33,105 2,603 2,652 2,937 3,020
Japan 31,866 33,577 33,854 32,431 2,560 2,707 DNR DNR
Korea 24,286 26,191 26,877 27,150 1,387 1,549 1,632 1,784
Luxembourg 78,450 84,543 90,540 85,521 3,973 4,105 4,037 4,808
Mexico 13,656 14,566 15,275 14,322 776 842 892 918
Netherlands 38,052 40,735 43,018 41,085 3,318 3,615 3,891 4,585

72 Health Expenditure Trends in New Zealand 2000–2010
Country GDP per capita 2006
GDP per capita 2007
GDP per capita 2008
GDP per capita 2009
Current health expenditure per
capita 2006
Current health expenditure per
capita 2007
Current health expenditure per
capita 2008
Current health expenditure per
capita 2009
New Zealand* 27,093 28,653 29,138 28,985 2,467 2,525 2,784 2,983
Norway 53,292 55,005 60,632 55,730 4,232 4,582 4,943 5,128
Poland 15,067 16,762 18,062 18,929 882 1,010 1,182 1,301
Portugal 22,870 24,206 24,953 25,070 2,156 DNR DNR DNR
Slovak Republic 18,397 20,912 23,236 22,868 1,290 1,540 1,769 1,962
Slovenia 25,463 27,347 29,340 27,829 1,982 2,029 2,314 2,416
Spain 30,348 32,252 33,173 32,254 2,445 2,634 2,870 2,982
Sweden 35,682 38,486 39,488 37,155 3,067 3,287 3,475 3,562
Switzerland 39,502 43,138 45,893 45,150 4,150 4,469 4,930 5,144
Turkey 12,260 13,216 14,848 14,106 662 729 817 DNR
United Kingdom* 35,463 36,232 37,352 35,656 2,871 2,909 3,113 3,311
United States 44,688 46,434 47,002 45,797 6,758 7,084 7,345 7,598
Source: OECD health data July 2011 and Ministry of Health
DNR = Did not report.
* Does not report investment on medical facilities for this period.
† Includes impact of Greece upward revision of GDP of 26% in May 2007.

Health Expenditure Trends in New Zealand 2000–2010 73
Appendix 1: OECD system of health accounts
A1.1 Functions of health care Health care refers to the sum of activities performed either by institutions or individuals pursuing, through the application of medical, paramedical and nursing knowledge and technology, the goals of:
• promoting health and preventing disease
• curing illness and reducing premature mortality
• caring for persons affected by chronic illness who require nursing care
• caring for persons with health-related impairment, disability and handicaps who require nursing care
• assisting patients to die with dignity
• providing and administering public health
• providing and administering health programmes, health insurance and other funding arrangements.
Health care can be divided into personal health care services provided directly to individual persons and collective health care services covering the traditional tasks of public health such as health promotion and disease prevention, including setting and enforcing standards, and health administration and health insurance. Within the System of Health Accounts (SHA), personal health care services are defined as:
1 curative care
2 rehabilitative care
3 services of a (long-term) nursing type care
4 ancillary services to health care
5 medical goods dispensed to outpatients, which include self-medication and other goods consumed by households with or without a prescription from medical or paramedical professionals.
Much of personal health care (functions 1–5 above) is two-dimensional, combining the ‘basic function of service’ (curative, rehabilitative and long-term) with the ‘mode of production’ or settings of care (inpatient, day care, outpatient or home-based care).

74 Health Expenditure Trends in New Zealand 2000–2010
Basic function of care
Definitions of the components of the basic function of care have been developed by the Australian Health Data Committee and the United States Joint Commission on Accreditation of Healthcare Organisations (OECD 2000).
Curative
An episode of curative care has the purpose of relieving symptoms of illness or injury, reducing the severity of an illness or injury, or protecting against exacerbation and/or complication of an illness or injury that threatens life or normal function.
Rehabilitative
An episode of rehabilitative care has the purpose of improving the functional level of the individual, when the limitations either are due to a recurrent event of illness or injury or are of a recurrent nature. Rehabilitative care is generally less intensive than curative care but more intensive than long-term care. It requires frequent and recurrent patient assessment and progresses in accordance with a treatment plan for a limited period.
Long-term
Long-term care is not episodic. It consists of ongoing care of individuals who need assistance on a continuing basis due to chronic impairments and a reduced degree of independence, including activities of daily living. Long-term care is typically a mix of clinical and social services. Only clinical care expenditure is included as health expenditure.
Mode of production
SHA functions of care are further stratified into modes of care based on the essential differences in the technical and managerial organisations of care. The fundamental differences relate to the substantially different information systems, including the administrative paperwork and statistics that are in place within these types of organisations.
Inpatient
This is care provided to patients who are formally admitted to an institution for treatment and stay for a minimum of one night. Accommodation in institutions providing social services where health care is an important but not predominant component of care should not be included as a health function.
Day care
This is care delivered to patients who are formally admitted to an institution and the intention is to discharge the patient on the same day. These patients are usually admitted and discharged after staying between three and eight hours.

Health Expenditure Trends in New Zealand 2000–2010 75
Outpatient
This care is delivered to patients who are not formally admitted and do not stay overnight. The boundary is wider than for institutional care and covers services provided at physicians’ offices and ambulatory care centres.
Home-based care
This is care delivered to an individual in their own home. The New Zealand interpretation is that an individual’s home is not limited to a private residence.
Other personal health functions
Ancillary
This covers a variety of services, mainly performed by paramedical or medical technical personnel, including diagnostic imaging, laboratory work and patient transport. These services can be provided either with or without referral and direct supervision by a medical doctor.
Medical goods dispensed to outpatients
These services involve goods bought by a private household at their own initiative for the purpose of home care and cover items purchased with and without prescription.
Other health functions
Health functions undertaken for the public, as opposed to the individual, are described below.
Prevention and public health
Public health services are primarily preventative in nature and comprise a wide range of services with intended benefits for the public, or groups within the public, rather than the individual. Examples include epidemiological surveillance, disease prevention and the promotion of good health. Health and safety is not covered under prevention and public health. Examples of functions specifically excluded are occupational health services relating to improving the working environment, such as ergonomics, environmental protection and accident prevention; road safety; product safety monitoring; and civil defence (OECD 2000). Some safety services are covered later at A1.2 Health-related functions.
Administration and health insurance
This service includes the planning, management, regulation and collection of funds and handling claims of the health delivery system. It includes both public governmental agencies and the private insurance sector.

76 Health Expenditure Trends in New Zealand 2000–2010
Table A1: Functions of health care
HC.1 Services of curative care
HC.1.1 Inpatient curative care
HC.1.2 Day cases of curative care
HC.1.3 Outpatient curative care
HC.1.3.1 Basic medical and diagnostic services
HC.1.3.2 Outpatient dental care
HC.1.3.3 All other specialised health care
HC.1.3.9 All other outpatient curative care
HC.1.4 Services of curative home care
HC.2 Services of rehabilitative care
HC.2.1 Inpatient rehabilitative care
HC.2.2 Day cases of rehabilitative care
HC.2.3 Outpatient rehabilitative care
HC.2.4 Services of rehabilitative home care
HC.3 Services of long-term nursing care
HC.3.1 Inpatient long-term nursing care
HC.3.2 Day cases of long-term nursing care
HC.3.3 Long-term nursing care; home care
HC.4 Ancillary services to health care
HC.4.1 Clinical laboratory
HC.4.2 Diagnostic imaging
HC.4.3 Patient transport and emergency rescue
HC.4.9 All other miscellaneous ancillary services
HC.5 Medical goods dispensed to outpatients
HC.5.1 Pharmaceuticals and other medical non-durables
HC.5.1.1 Prescribed medicines
HC.5.1.2 Over-the-counter medicines
HC.5.1.3 Other medical non-durables
HC.5.2 Therapeutic appliances and other medical durables
HC.5.2.1 Glasses and other vision products
HC.5.2.2 Orthopaedic appliances and other prosthetics
HC.5.2.3 Hearing aids
HC.5.2.4 Medico-technical devices, including wheelchairs
HC.5.2.9 All other miscellaneous medical durables

Health Expenditure Trends in New Zealand 2000–2010 77
HC.6 Prevention and public health services
HC.6.1 Maternal and child health; family planning and counselling
HC.6.2 School health services
HC.6.3 Prevention of communicable diseases
HC.6.4 Prevention of non-communicable diseases
HC.6.5 Occupational health care
HC.6.9 All other miscellaneous public health services
HC.7 Health administration and health insurance
HC.7.1 General government administration of health
HC.7.1.1 General government administration of health (except social security)
HC.7.1.2 Administration, operation and support activities of social security funds
HC.7.2 Health administration and health insurance: private
HC.7.2.1 Health administration and health insurance: social insurance
HC.7.2.2 Health administration and health insurance: other private
A1.2 Health-related functions The OECD health-related functions are distinguished from the core health care functions. They are closely linked to health care in terms of operations, institutions and personnel but are, as far as possible, excluded when measuring activities and expenditure belonging to core health care functions. For the most part, these are services that have a direct and beneficial impact on public health.
Capital formation
This health-related function encompasses gross capital formation of domestic health care provider institutions (not all facilities), such as hospitals and nursing homes. New Zealand has not conducted an estimate of capital costs.
Education and training
This health-related function covers the education and training of health professionals. The expenditure should include administration, inspection and support services but should distinguish between training and health service provision.
Research and development
This health-related function covers many programmes directed towards the protection and improvement of human health, including good hygiene, biochemical engineering, medical information, rationalisation of treatment and pharmacology as well as research relating to epidemiology, prevention of industrial diseases and drug addiction (OECD 2000, p 125). Government involvement in health research and development is often classified as a health function and is split between health administration and research and development.

78 Health Expenditure Trends in New Zealand 2000–2010
Food, hygiene and drinking water
This health-related function comprises a variety of activities of public health concern. The boundaries as applied in New Zealand between health-related expenditure and non-health-related expenditure draw the distinction between supply and safety. For example, provision of the water supply is not included, but water testing and treatment to ensure safety for human consumption are included in this health-related function. The same boundary applies to other testing and treatment services.
Environmental health
This health-related function includes a number of activities, including monitoring the environment and environmental control, when the specific focus of the service is a public health concern. Examples of these types of services are waste management, waste water and pollution abatement.
Administration and provision of social services in kind to assist living with disease and impairment
This health-related function consists of non-medical social services in kind provided to people with health problems, functional impairments or limitations, where the primary goal is the social or vocational rehabilitation or integration of the individual. At the current time, New Zealand has not conducted an estimate for this function.
Administration and provision of health-related cash benefits
This health-related function consists of non-medical social services in kind provided to people with health problems, functional impairments or limitations, where the primary goal is the social or vocational rehabilitation or integration of the individual. At the current time, New Zealand has not calculated an estimate for this function.
Table A2: Health-related functions
HC.R.1 Capital formation of health care provider institutions
HC.R.2 Education and training of health personnel
HC.R.3 Research and development in health
HC.R.4 Food, hygiene and drinking water control
HC.R.5 Environmental health
HC.R.6 Administration and provision of social services in kind to assist living with disease and impairment
HC.R.7 Administration and provision of health-related cash benefits

Health Expenditure Trends in New Zealand 2000–2010 79
A1.3 Provider industry The SHA includes a dimension for the provider sector ‘Where does the money go?’ or ‘Who provides the services?’ The classifications used are based on the North American Industrial Classification System, a draft common industrial classification of NAFTA countries (NAICS 1998).
Table A3: OECD SHA provider industry
HP.1 Hospitals
HP.1.1 General hospitals
HP.1.2 Mental health and substance abuse hospitals
HP.1.3 Speciality (other than mental health and substance abuse) hospitals
HP.2 Nursing and residential care facilities
HP.2.1 Nursing care facilities
HP.2.2 Residential mental retardation, mental health and substance abuse facilities
HP.2.3 Community care facilities for the elderly
HP.2.9 All other residential care facilities
HP.3 Providers of ambulatory health care
HP.3.1 Offices of physicians
HP.3.2 Offices of dentists
HP.3.3 Offices of other health practitioners
HP.3.4 Outpatient care centres
HP.3.5 Medical and diagnostic laboratories
HP.3.6 Providers of home health care services
HP.3.9 Other providers of ambulatory health care
HP.4 Retail sales and other providers of medical goods
HP.4.1 Dispensing chemists
HP.4.2 Retail sales and other suppliers of optical glasses and other vision products
HP.4.3 Retail sales and other suppliers of hearing aids
HP.4.4 Retail sales and other suppliers of medical appliances (not glasses and hearing aids)
HP.4.9 All other miscellaneous sales and other suppliers of pharmaceuticals and medical goods

80 Health Expenditure Trends in New Zealand 2000–2010
HP.5 Provision and administration of public health programmes
HP.6 Health administration and insurance
HP.6.1 Government administration of health
HP.6.2 Social security funds
HP.6.3 Other social insurance
HP.6.4 Other (private) insurance
HP.6.9 All other providers of health administration
HP.7 Other industries (rest of the economy)
HP.7.1 Establishments as providers of occupational health care services
HP.7.2 Private households as providers of home care
HP.7.9 All other industries as secondary producers of health care
HP.9 Rest of the world
A1.4 Sources of funding This system provides a breakdown of expenditure on health into a range of third-party payment arrangements plus direct payments by households or other direct funders, for example, government-provided health care.
Table A4: OECD SHA sources of funding24
HF.1 General government
HF.1.1 General government excluding social security funds
HF.1.1.1 Central government
HF.1.1.2 State/provincial government
HF.1.1.3 Local/municipal government
HF.1.2 Social security funds
HF.2 Private sector
HF.2.1 Private social insurance
HF.2.2 Private insurance (other than social insurance)
HF.2.3 Private households
HF.2.4 Non-profit institutions serving households (other than social insurance)
HF.2.5 Corporations (other than health insurance)
HF.3 Rest of the world
24 These sources of funding are directly comparable with New Zealand historical funder groups.

Health Expenditure Trends in New Zealand 2000–2010 81
Appendix 2: Nominal and real health expenditure (with ‘non-health’ items included for prior years) 1999/00–2009/10 1999/00 2000/01 2001/02 2002/03 2003/04 2004/05 2005/06 2006/07 2007/08 2008/09 2009/10
Nominal expenditure ($ million)
Public 7,442 8,086 8,834 9,302 9,724 10,741 11,897 12,811 14,230 15,550 16,536
Private 1,968 2,300 2,361 2,418 2,487 2,740 2,961 2,737 2,947 3,179 3,334
Total 9,410 10,386 11,194 11,719 12,212 13,480 14,858 15,548 17,177 18,729 19,870
Percentage change 5.60% 10.37% 7.79% 4.69% 4.20% 10.39% 10.22% 4.64% 10.48% 9.04% 6.09%
Real expenditure (2008 $ million)
Public 9,633 10,144 10,787 11,197 11,430 12,270 13,075 13,803 14,740 15,809 16,536
Private 2,547 2,885 2,882 2,910 2,923 3,130 3,255 2,949 3,053 3,232 3,334
Total 12,181 13,030 13,670 14,107 14,353 15,400 16,329 16,752 17,793 19,041 19,870
Percentage change 3.49% 6.97% 4.91% 3.20% 1.75% 7.29% 6.03% 2.59% 6.21% 7.02% 4.35%
Real per capita expenditure (2008 $ million) – resident population
Public 2,502 2,620 2,758 2,816 2,814 2,994 3,159 3,264 3,453 3,663 3,786
Percentage change 3.05% 4.69% 5.28% 2.10% (0.09)% 6.40% 5.51% 3.35% 5.77% 6.09% 3.36%
Private 662 745 737 732 720 764 786 698 715 749 763
Percentage change 2.38% 12.60% (1.10)% (0.68)% (1.69)% 6.1% 2.97% (11.28)% 2.52% 4.74% 1.92%
Total 3,164 3,365 3,495 3,548 3,533 3,757 3,945 3,962 4,168 4,412 4,549
Percentage change 2.91% 6.34% 3.87% 1.51% (0.42)% 6.34% 4.99% 0.44% 5.20% 5.86% 3.11%
Source: Ministry of Health Notes: 1 Totals may be affected by rounding. 2 GST inclusive. 3 CPI for June 2010. 4 Nominal dollars are actual dollars spent. Real dollars have been adjusted to 2010 dollar value by CPI. 5 2003/04 to 2005/06 public expenditure data restated for DHB and ACC revised coding to SHA.

82 Health Expenditure Trends in New Zealand 2000–2010
Appendix 3: Health expenditure trends in New Zealand (with ‘non-health’ items included for prior years)
3.1 Nominal dollars, 1999/00–2009/10 Sources of funds
1999/00 2000/01 2001/02 2002/03 2003/04 2004/05 2005/06 2006/07 2007/08 2008/09 2009/10
($000) % of total
($000) % of total
($000) % of total
($000) % of total
($000) % of total
($000) % of total
($000) % of total
($000) % of total
($000) % of total
($000) % of total
($000) % of total
Ministry of Health
6,543,778 69.5 6,952,914 66.9 7,418,078 66.3 7,773,876 66.3 8,507,429 69.7 9,361,675 69.4 10,302,689 69.3 10,958,724 70.5 12,123,747 70.6 13,275,453 70.9 14,403,918 2.5
Deficit financing
6,413 0.1 76,837 0.7 244,125 2.2 216,337 1.8 – – – – – – – – – – – – – –
ACC – social security
581,078 6.2 709,561 6.8 801,330 7.2 924,253 7.9 945,608 7.7 1,095,557 8.1 1,260,278 8.5 1,436,042 9.2 1,634,796 9.5 1,820,216 9.7 1,669,838 8.4
Other government agencies
250,230 2.7 282,226 2.7 302,011 2.7 313,386 2.7 208,084 1.7 221,730 1.6 251,667 1.7 309,954 2.0 379,049 2.2 398,489 2.1 395,346 2.0
Local authorities
60,374 0.6 64,243 0.6 68,381 0.6 73,792 0.6 63,242 0.5 61,882 0.5 82,371 0.6 106,072 0.7 92,672 0.5 55,923 0.3 67,238 0.3
Public total 7,441,873 79.1 8,085,781 77.9 8,833,925 78.9 9,301,644 79.4 9,724,363 79.6 10,740,844 79.7 11,897,005 80.1 12,810,792 82.4 14,230,264 82.8 15,550,082 83.0 16,536,341 83.2
Out-of-pocket 1,375,165 14.6 1,656,853 16.0 1,714,843 15.3 1,740,565 14.9 1,722,649 14.1 1,896,704 14.1 2,056,173 13.8 1,780,830 11.5 1,930,708 11.2 1,990,059 10.6 2,086,476 10.5
Health insurance
560,857 6.0 610,198 5.9 612,315 5.5 640,632 5.5 671,638 5.5 695,686 5.2 762,074 5.1 793,949 5.1 863,063 5.0 929,720 5.0 974,938 4.9
Not-for-profit organisations
31,952 0.3 32,943 0.3 33,355 0.3 36,591 0.3 92,911 0.8 147,111 1.1 143,169 1.0 162,506 1.0 153,263 0.9 259,629 1.4 272,642 1.4
Private total 1,967,974 20.9 2,299,994 22.1 2,360,513 21.1 2,417,788 20.6 2,487,198 20.4 2,739,501 20.3 2,961,416 19.9 2,737,285 17.6 2,947,034 17.2 3,179,408 17.0 3,334,056 16.8
Total from all sources
9,409,847 100.0 10,385,775 100.0 11,194,438 100.0 11,719,432 100.0 12,211,561 100.0 13,480,346 100.0 14,858,422 100.0 15,548,077 100.0 17,177,299 100.0 18,729,490 100.0 19,870,398 100.0
% of GDP 8.1% 8.3% 8.6% 8.4% 8.1% 8.6% 9.0% 8.8% 9.4% 10.1% 10.5%
Source: Ministry of Health Notes: 1 Totals may be affected by rounding. 2 GST inclusive. 3 Nominal dollars are actual dollars spent. 4 2003/04 to 2005/06 public expenditure data restated for DHB and ACC revised coding to SHA.

Health Expenditure Trends in New Zealand 2000–2010 83
3.2 Real dollars, 1999/00–2009/10
Sources of funds
1999/00 2000/01 2001/02 2002/03 2003/04 2004/05 2005/06 2006/07 2007/08 2008/09 2009/10
($000) % of total
($000) % of total
($000) % of total
($000) % of total
($000) % of total
($000) % of total
($000) % of total
($000) % of total
($000) % of total
($000) % of total
($000) % of total
Ministry of Health 8,470,686 69.5 8,722,891 66.9 9,058,297 66.3 9,357,601 66.3 9,999,641 69.7 10,694,887 69.4 11,322,655 69.3 11,807,488 70.5 12,557,962 70.6 13,496,505 70.9 14,403,918 72.5
Deficit financing 8,301 0.1 96,397 0.7 298,104 2.2 260,410 1.8 – – – – – – – – – – – – – –
ACC – social security
752,185 6.2 890,191 6.8 978,513 7.2 1,112,546 7.9 1,111,469 7.7 1,251,577 8.1 1,385,045 8.5 1,547,265 9.2 1,693,347 9.5 1,850,525 9.7 1,669,838 8.4
Other government agencies
323,914 2.7 354,071 2.7 368,789 2.7 377,230 2.7 244,582 1.7 253,307 1.6 276,582 1.7 333,960 2.0 392,625 2.2 405,125 2.1 395,346 2.0
Local authorities 78,152 0.6 80,597 0.6 83,501 0.6 88,825 0.6 74,335 0.5 70,694 0.5 90,526 0.6 114,288 0.7 95,992 0.5 56,855 0.3 67,238 0.3
Public total 9,633,237 79.1 10,144,148 77.9 10,787,204 78.9 11,196,612 79.4 11,430,027 79.6 12,270,466 79.7 13,074,809 80.1 13,803,001 82.4 14,739,925 82.8 15,809,010 83.0 16,536,341 83.2
Out-of-pocket 1,780,102 14.6 2,078,632 16.0 2,094,014 15.3 2,095,160 14.9 2,024,803 14.1 2,166,817 14.1 2,259,735 13.8 1,918,757 11.5 1,999,856 11.2 2,023,196 10.6 2,086,476 10.5
Health insurance 726,009 6.0 765,534 5.9 747,705 5.5 771,144 5.5 789,445 5.5 794,760 5.2 837,519 5.1 855,441 5.1 893,974 5.0 945,201 5.0 974,938 4.9
Not-for-profit organisations
41,361 0.3 41,329 0.3 40,730 0.3 44,045 0.3 109,207 0.8 168,062 1.1 157,343 1.0 175,093 1.0 158,753 0.9 263,952 1.4 272,642 1.4
Private total 2,547,472 20.9 2,885,495 22.1 2,882,449 21.1 2,910,349 20.6 2,923,455 20.4 3,129,638 20.3 3,254,597 19.9 2,949,290 17.6 3,052,583 17.2 3,232,349 17.0 3,334,056 16.8
Total from all sources
12,180,709 100.0 13,029,642 100.0 13,669,653 100.0 14,106,961 100.0 14,353,482 100.0 15,400,104 100.0 16,329,405 100.0 16,752,291 100.0 17,792,508 100.0 19,041,359 100.0 19,870,398 100.0
Source: Ministry of Health
Notes: 1 Totals may be affected by rounding. 2 GST inclusive. 3 CPI for June 2010. 4 Real dollars have been adjusted to 2008 dollar value by CPI. 5 2003/04 to 2005/06 public expenditure data restated for DHB and ACC revised coding to SHA.

84 Health Expenditure Trends in New Zealand 2000–2010
Appendix 4: Private health insurance trends, 1999/00–2009/10 ($000) 1999/00 2000/01 2001/02 2002/03 2003/04 2004/05 2005/06 2006/07 2007/08 2008/09 2009/10
Institutional care
Public 643 227 415 714 673 622 600 750 815 878 921
Private 339,616 371,350 385,552 418,270 454,240 485,765 548,839 546,363 593,924 639,794 670,912
Subtotal – institutional care 340,259 371,577 385,967 418,984 454,913 486,387 549,438 547,112 594,739 640,673 671,833
Community care
General practitioners and maternity 69,025 70,880 66,074 63,349 54,732 44,883 36,230 57,424 62,423 67,244 70,514
Specialist services and referral services 88,971 108,322 106,651 109,367 116,371 122,814 137,028 138,966 151,063 162,730 170,645
Dental services 21,164 18,277 16,541 16,389 14,472 12,259 10,436 15,425 16,767 18,062 18,941
Medicaments 41,424 41,142 37,082 32,543 31,151 29,343 28,941 35,022 38,071 41,012 43,006
Subtotal – community care 220,584 238,621 226,348 221,648 216,725 209,299 212,636 246,837 268,324 289,048 303,106
Total 560,842 610,198 612,315 640,632 671,638 695,686 762,074 793,949 863,063 929,720 974,938
Source: Ministry of Health and HFANZ
Notes: 1 Totals may be affected by rounding. 2 2003/04–2005/06 data has been restated for an estimate of health administration.

Health Expenditure Trends in New Zealand 2000–2010 85
Appendix 5: Current expenditure on health by function of care and provider industry (SHA Standard Table 2)
5.1 2007/08 Health care by function Function
and industry codes
Hos
pita
ls
Nur
sing
and
re
side
ntia
l car
e fa
cilit
ies
Prov
ider
s of
am
bula
tory
hea
lth
care
Offi
ces
of
phys
icia
ns
Offi
ces
of d
entis
ts
Offi
ces
of o
ther
he
alth
pra
ctiti
oner
s
Out
patie
nt c
are
cent
res
Med
ical
and
di
agno
stic
la
bora
torie
s
Prov
ider
s of
hom
e he
alth
car
e se
rvic
es
All
othe
r pro
vide
rs
of a
mbu
lato
ry
heal
th c
are
Ret
ail s
ale
and
othe
r pro
vide
rs o
f m
edic
al g
oods
Dis
pens
ing
chem
ists
All
othe
r sal
es o
f m
edic
al g
oods
Prov
isio
n an
d ad
min
istr
atio
n of
pu
blic
hea
lth
prog
ram
mes
Gen
eral
hea
lth
adm
inis
trat
ion
and
insu
ranc
e
Gov
ernm
ent
adm
inis
trat
ion
of
heal
th
Soci
al s
ecur
ity
fund
s
Oth
er (p
rivat
e)
insu
ranc
e
All
othe
r hea
lth
adm
inis
trat
ion
All
othe
r ind
ustr
ies Totals
HP.1 HP.2 HP.3 HP.3.1 HP.3.2 HP.3.3 HP.3.4 HP.3.5 HP.3.6 HP.3.9 HP.4 HP.4.1 HP 4.2–4.9
HP.5 HP.6 HP.6.1 HP.6.2 HP.6.4 HP.6.9 HP.7
Inpatient care
Curative and rehabilitative care
HC.1.1; 2.1
4,086,550 257,244 127,394 127,394 – – – – – – – – – – – – – – – – 4,471,188
Long-term nursing care HC.3.1 99,581 1,148,539 – – – – – – – – – – – – – – – – – – 1,248,120
Services of day care
Curative and rehabilitative care
HC.1.2; 2.2
410,550 47,913 37,175 31,849 – – 5,326 – – – – – – – – – – – – – 495,638
Long-term nursing care HC.3.2 41,450 63,551 – – – – – – – – – – – – – – – – – –– 105,001
Outpatient care
Outpatient curative and rehabilitative care
HC.1.3; 2.3
1,545,562 74,001 2,820,065 877,042 569,635 609,823 694,541 1,004 19 68,001 1,940 – 1,940 – – – – – – 4,441,568
Basic medical and diagnostic services
HC.1.3.1 1,222,737 21,943 1,481,385 678,637 – 191,563 582,990 – – 28,195 – – – – – – – – – – 2,726,065
Outpatient dental care HC.1.3.2 14,899 – 568,460 – 568,460 – – – – – – – – – – – – – – – 583,359
All other specialised health care
HC.1.3.3 1,848 370 339,093 80,360 185 227,856 185 – – 30,507 185 – 185 – – – – – – – 341,496
All other outpatient care HC.1.3.9 37,663 15,862 304,681 72,501 990 123,606 100,126 – 19 7,439 990 – 990 – – – – – – – 359,196
Outpatient rehabilitative care
HC.2.3 268,415 35,826 126,446 45,544 – 66,798 11,240 1,004 – 1,860 765 – 765 – – – – – – – 431,452

86 Health Expenditure Trends in New Zealand 2000–2010
Health care by function Function and
industry codes
Hos
pita
ls
Nur
sing
and
re
side
ntia
l car
e fa
cilit
ies
Prov
ider
s of
am
bula
tory
hea
lth
care
Offi
ces
of
phys
icia
ns
Offi
ces
of d
entis
ts
Offi
ces
of o
ther
he
alth
pra
ctiti
oner
s
Out
patie
nt c
are
cent
res
Med
ical
and
di
agno
stic
la
bora
torie
s
Prov
ider
s of
hom
e he
alth
car
e se
rvic
es
All
othe
r pro
vide
rs
of a
mbu
lato
ry
heal
th c
are
Ret
ail s
ale
and
othe
r pro
vide
rs o
f m
edic
al g
oods
Dis
pens
ing
chem
ists
All
othe
r sal
es o
f m
edic
al g
oods
Prov
isio
n an
d ad
min
istr
atio
n of
pu
blic
hea
lth
prog
ram
mes
Gen
eral
hea
lth
adm
inis
trat
ion
and
insu
ranc
e
Gov
ernm
ent
adm
inis
trat
ion
of
heal
th
Soci
al s
ecur
ity
fund
s
Oth
er (p
rivat
e)
insu
ranc
e
All
othe
r hea
lth
adm
inis
trat
ion
All
othe
r ind
ustr
ies Totals
HP.1 HP.2 HP.3 HP.3.1 HP.3.2 HP.3.3 HP.3.4 HP.3.5 HP.3.6 HP.3.9 HP.4 HP.4.1 HP 4.2–4.9
HP.5 HP.6 HP.6.1 HP.6.2 HP.6.4 HP.6.9 HP.7
Home care
Curative and rehabilitative care
HC.1.4; 2.4
166,541 4,748 445,120 14,409 – 15,253 189,342 – 226,116 – – – – – – – – – – 54,948 671,357
Long-term nursing care HC.3.3 73,372 93,823 1,030,815 50,235 – 15,253 13,311 – 892,305 59,711 – – – – – – – – – – 1,198,010
Ancillary services to health care
HC.4 23,150 – 790,817 – – – – 502,292 129,831 158,694 – – – 9,999 – – – – – 32,483 856,449
Medical goods dispensed to outpatients
HC.5 – – – – – – – – – – 1,910,666 1,426,954 483,712 – – – – – – – 1,910,666
Pharmaceutical and other medical non-durables
HC.5.1 – – – – – – – – – – 1,663,215 1,426,954 236,261 – – – – – – – 1,663,215
Therapeutic appliances and other medical durables
HC.5.2 – – – – – – – – – – 247,451 – 247,451 – – – – – – – 247,451
Total expenditure on personal health care
6,446,756 1,689,819 5,251,386 1,100,929 569,635 640,329 902,520 503,296 1,248,271 286,406 1,912,606 1,426,954 485,652 9,999 – – – – – 87,431 15,397,997
Prevention and public health services
HC.6 9,974 60 233,634 51,249 – 50,321 126,555 – – 5,509 – – – 638,979 40,806 40,806 – – – 152,345 1,075,798
Health administration and health insurance
HC.7 – – – – – – – – – – – – – – 697,418 448,712 204,501 44,205 – 6,087 703,505
Total current expenditure on health care
6,456,730 1,689,879 5,485,020 1,152,178 569,635 690,650 1,029,075 503,296 1,248,271 291,915 1,912,606 1,426,954 485,652 648,978 738,224 489,518 204,501 44,205 – 245,863 17,177,300
Notes: 1 Public expenditure data restated for DHB and ACC revised coding to SHA. 2 Insurance data restated for an estimate of health administration.

Health Expenditure Trends in New Zealand 2000–2010 87
5.2 2008/09 Health care by function Function
and industry codes
Hos
pita
ls
Nur
sing
and
re
side
ntia
l car
e fa
cilit
ies
Prov
ider
s of
am
bula
tory
hea
lth
care
Offi
ces
of
phys
icia
ns
Offi
ces
of d
entis
ts
Offi
ces
of o
ther
he
alth
pra
ctiti
oner
s
Out
patie
nt c
are
cent
res
Med
ical
and
di
agno
stic
la
bora
torie
s
Prov
ider
s of
hom
e he
alth
car
e se
rvic
es
All
othe
r pro
vide
rs
of a
mbu
lato
ry
heal
th c
are
Ret
ail s
ale
and
othe
r pro
vide
rs o
f m
edic
al g
oods
Dis
pens
ing
chem
ists
All
othe
r sal
es o
f m
edic
al g
oods
Prov
isio
n an
d ad
min
istr
atio
n of
pu
blic
hea
lth
prog
ram
mes
Gen
eral
hea
lth
adm
inis
trat
ion
and
insu
ranc
e
Gov
ernm
ent
adm
inis
trat
ion
of
heal
th
Soci
al s
ecur
ity
fund
s
Oth
er (p
rivat
e)
insu
ranc
e
All
othe
r hea
lth
adm
inis
trat
ion
All
othe
r ind
ustr
ies Totals
HP.1 HP.2 HP.3 HP.3.1 HP.3.2 HP.3.3 HP.3.4 HP.3.5 HP.3.6 HP.3.9 HP.4 HP.4.1 HP 4.2–4.9
HP.5 HP.6 HP.6.1 HP.6.2 HP.6.4 HP.6.9 HP.7
Inpatient care
Curative and rehabilitative care
HC.1.1; 2.1
4,400,438 274,825 137,622 137,622 – – – – – – – – – – – – – – – – 4,812,885
Long-term nursing care HC.3.1 100,983 1,224,363 – – – – – – – – – – – – – – – – – – 1,325,346
Services of day care
Curative and rehabilitative care
HC.1.2; 2.2
460,055 47,240 38,369 32,726 – – 5,643 – – – – – – – – – – – – – 545,664
Long-term nursing care HC.3.2 40,996 67,770 – – – – – – – – – – – – – – – – – – 108,766
Outpatient care
Outpatient curative and rehabilitative care
HC.1.3; 2.3
1,754,206 80,227 3,113,941 976,256 605,827 687,947 768,343 1,060 21 74,487 808 – 808 – – – – – – – 4,949,182
Basic medical and diagnostic services
HC.1.3.1 1,400,690 25,514 1,619,541 733,282 – 245,569 609,083 – – 31,607 – – – – – – – – – – 3,045,745
Outpatient dental care HC.1.3.2 16,050 – 604,613 –– 604,613 – – – – – – – – – – – – – – – 620,663
All other specialised health care
HC.1.3.3 1,869 374 355,721 82,562 187 239,735 374 – – 32,863 – – – – – – – – – – 357,964
All other outpatient care HC.1.3.9 37,043 15,440 394,212 111,424 1,027 127,023 146,703 –– 21 8,014 – – – – – – – – – – 446,695
Outpatient rehabilitative care
HC.2.3 298,554 38,899 139,854 48,988 – 75,620 12,183 1,060 – 2,003 808 – 808 – – – – – – – 478,115
Home care –
Curative and rehabilitative care
HC.1.4; 2.4
27,019 7,794 501,752 15,522 – 16,431 218,185 – 251,614 – – – – – – – – – – 70,055 606,620
Long-term nursing care HC.3.3 79,571 95,323 1,068,396 54,421 – 16,431 12,238 – 922,331 62,975 – – – – – – – – – – 1,243,290
Ancillary services to health care
HC.4 34,309 – 921,210 – – – – 537,502 149,806 233,902 – – – – – – – – – 41,744 997,263
Medical goods dispensed to outpatients
HC.5 – – – – – – – – – – 2,056,431 1,536,562 519,869 – – – – – – – 2,056,431
Pharmaceutical and other medical non-durables
HC.5.1 – – – – – – – – – – 1,787,748 1,536,562 251,186 – – – – – – – 1,787,748
Therapeutic appliances and other medical durables
HC.5.2 – – – – – – – – – – 268,683 – 268,683 – – – – – – – 268,683

88 Health Expenditure Trends in New Zealand 2000–2010
Health care by function Function and
industry codes
Hos
pita
ls
Nur
sing
and
re
side
ntia
l car
e fa
cilit
ies
Prov
ider
s of
am
bula
tory
hea
lth
care
Offi
ces
of
phys
icia
ns
Offi
ces
of d
entis
ts
Offi
ces
of o
ther
he
alth
pra
ctiti
oner
s
Out
patie
nt c
are
cent
res
Med
ical
and
di
agno
stic
la
bora
torie
s
Prov
ider
s of
hom
e he
alth
car
e se
rvic
es
All
othe
r pro
vide
rs
of a
mbu
lato
ry
heal
th c
are
Ret
ail s
ale
and
othe
r pro
vide
rs o
f m
edic
al g
oods
Dis
pens
ing
chem
ists
All
othe
r sal
es o
f m
edic
al g
oods
Prov
isio
n an
d ad
min
istr
atio
n of
pu
blic
hea
lth
prog
ram
mes
Gen
eral
hea
lth
adm
inis
trat
ion
and
insu
ranc
e
Gov
ernm
ent
adm
inis
trat
ion
of
heal
th
Soci
al s
ecur
ity
fund
s
Oth
er (p
rivat
e)
insu
ranc
e
All
othe
r hea
lth
adm
inis
trat
ion
All
othe
r ind
ustr
ies Totals
HP.1 HP.2 HP.3 HP.3.1 HP.3.2 HP.3.3 HP.3.4 HP.3.5 HP.3.6 HP.3.9 HP.4 HP.4.1 HP 4.2–4.9
HP.5 HP.6 HP.6.1 HP.6.2 HP.6.4 HP.6.9 HP.7
Total expenditure on personal health care
6,897,577 1,797,542 5,781,290 1,216,547 605,827 720,809 1,004,409 538,562 1,323,772 371,364 2,057,239 1,536,562 520,677 – – – – – – 111,799 16,645,447
Prevention and public health services
HC.6 32,424 – 395,070 77,093 – 109,246 194,651 – – 14,080 – – – 686,358 46,263 46,263 – – – 133,986 1,294,101
Health administration and health insurance
HC.7 – – – – – – – – – – – – – – 775,483 498,032 229,831 47,620 – 14,456 789,939
Total current expenditure on health care
6,930,001 1,797,542 6,176,360 1,293,640 605,827 830,055 1,199,060 538,562 1,323,772 385,444 2,057,239 1,536,562 520,677 686,358 821,746 544,295 229,831 47,620 – 260,241 18,729,487
Notes: 1 Public expenditure data restated for DHB and ACC revised coding to SHA. 2 Insurance data restated for an estimate of Health administration.

Health Expenditure Trends in New Zealand 2000–2010 89
5.3 2009/10 Health care by function Function
and industry codes
Hos
pita
ls
Nur
sing
and
re
side
ntia
l car
e fa
cilit
ies
Prov
ider
s of
am
bula
tory
hea
lth
care
Offi
ces
of
phys
icia
ns
Offi
ces
of d
entis
ts
Offi
ces
of o
ther
he
alth
pra
ctiti
oner
s
Out
patie
nt c
are
cent
res
Med
ical
and
di
agno
stic
la
bora
torie
s
Prov
ider
s of
hom
e he
alth
car
e se
rvic
es
All
othe
r pro
vide
rs
of a
mbu
lato
ry
heal
th c
are
Ret
ail s
ale
and
othe
r pro
vide
rs o
f m
edic
al g
oods
Dis
pens
ing
chem
ists
All
othe
r sal
es o
f m
edic
al g
oods
Prov
isio
n an
d ad
min
istr
atio
n of
pu
blic
hea
lth
prog
ram
mes
Gen
eral
hea
lth
adm
inis
trat
ion
and
insu
ranc
e
Gov
ernm
ent
adm
inis
trat
ion
of
heal
th
Soci
al s
ecur
ity
fund
s
Oth
er (p
rivat
e)
insu
ranc
e
All
othe
r hea
lth
adm
inis
trat
ion
All
othe
r ind
ustr
ies Totals
HP.1 HP.2 HP.3 HP.3.1 HP.3.2 HP.3.3 HP.3.4 HP.3.5 HP.3.6 HP.3.9 HP.4 HP.4.1 HP 4.2–4.9
HP.5 HP.6 HP.6.1 HP.6.2 HP.6.4 HP.6.9 HP.7
Inpatient care
Curative and rehabilitative care
HC.1.1; 2.1
5,033,113 284,512 139,563 139,563 – – – – – – – – – – – – – – – – 5,457,188
Long-term nursing care HC.3.1 120,850 1,294,906 – – – – – – – – – – – – – – – – – – 1,415,756
Services of day care
Curative and rehabilitative care
HC.1.2; 2.2
463,008 50,068 39,693 33,618 – – 6,075 – – – – – – – – – – – – – 552,769
Long-term nursing care HC.3.2 44,106 69,808 – – – – – – – – – – – – – – – – – – 113,914
Outpatient care
Outpatient curative and rehabilitative care
HC.1.3; 2.3
1,766,822 85,404 3,079,875 1,034,379 652,084 597,003 727,732 1,085 23 67,569 827 – 827 – – – – – – – 4,932,928
Basic medical and diagnostic services
HC.1.3.1 1,349,305 27,328 1,536,114 689,511 – 149,281 674,719 – – 22,603 – – – – – – – – – – 2,912,747
Outpatient dental care HC.1.3.2 16,830 – 650,829 – 650,829 – – – – – – – – – – – – – – – 667,659
All other specialised health care
HC.1.3.3 2,035 407 366,875 84,859 204 246,944 407 – – 34,461 – – – – – – – – – – 369,317
All other outpatient care HC.1.3.9 38,752 16,222 386,051 208,118 1,051 130,483 37,972 – 23 8,404 – – – – – – – – – – 441,025
Outpatient rehabilitative care
HC.2.3 359,900 41,447 140,006 51,891 – 70,295 14,634 1,085 – 2,101 827 – 827 – – – – – – – 542,180
Home care
Curative and rehabilitative care
HC.1.4; 2.4
23,126 7,418 512,605 16,276 – 17,231 248,728 – 230,370 – – – – – – – – – – 76,517 619,666
Long-term nursing care HC.3.3 84,806 101,741 1,176,334 57,723 – 17,231 14,874 – 1,003,734 82,772 – – – – – – – – – – 1,362,881
Ancillary services to health care
HC.4 33,016 – 947,452 – – – – 545,805 169,600 232,047 – – – – – – – – – 49,826 1,030,294
Medical goods dispensed to outpatients
HC.5 – – – – – – – – – – 2,208,906 1,613,188 595,718 – – – – – – – 2,208,906
Pharmaceutical and other medical non-durables
HC.5.1 – – – – – – – – – – 1,876,617 1,613,188 263,429 – – – – – – – 1,876,617
Therapeutic appliances and other medical durables
HC.5.2 – – – – – – – – – – 332,289 – 332,289 – – – – – – – 332,289

90 Health Expenditure Trends in New Zealand 2000–2010
Health care by function Function and
industry codes
Hos
pita
ls
Nur
sing
and
re
side
ntia
l car
e fa
cilit
ies
Prov
ider
s of
am
bula
tory
hea
lth
care
Offi
ces
of
phys
icia
ns
Offi
ces
of d
entis
ts
Offi
ces
of o
ther
he
alth
pra
ctiti
oner
s
Out
patie
nt c
are
cent
res
Med
ical
and
di
agno
stic
la
bora
torie
s
Prov
ider
s of
hom
e he
alth
car
e se
rvic
es
All
othe
r pro
vide
rs
of a
mbu
lato
ry
heal
th c
are
Ret
ail s
ale
and
othe
r pro
vide
rs o
f m
edic
al g
oods
Dis
pens
ing
chem
ists
All
othe
r sal
es o
f m
edic
al g
oods
Prov
isio
n an
d ad
min
istr
atio
n of
pu
blic
hea
lth
prog
ram
mes
Gen
eral
hea
lth
adm
inis
trat
ion
and
insu
ranc
e
Gov
ernm
ent
adm
inis
trat
ion
of
heal
th
Soci
al s
ecur
ity
fund
s
Oth
er (p
rivat
e)
insu
ranc
e
All
othe
r hea
lth
adm
inis
trat
ion
All
othe
r ind
ustr
ies Totals
HP.1 HP.2 HP.3 HP.3.1 HP.3.2 HP.3.3 HP.3.4 HP.3.5 HP.3.6 HP.3.9 HP.4 HP.4.1 HP 4.2–4.9
HP.5 HP.6 HP.6.1 HP.6.2 HP.6.4 HP.6.9 HP.7
Total expenditure on personal health care
7,568,847 1,893,857 5,895,522 1,281,559 652,084 631,465 997,409 546,890 1,403,727 382,388 2,209,733 1,613,188 596,545 – – – – – – 126,343 17,694,302
Prevention and public health services
HC.6 22,128 – 452,611 70,110 0 110,547 257,968 – – 13,987 – – – 719,816 46,145 46,145 – – – 147,202 1,387,903
Health administration and health insurance
HC.7 – – – – – – – – – – – – – – 774,877 494,318 230,623 49,936 – 13,315 788,192
Total current expenditure on health care
7,590,975 1,893,857 6,348,133 1,351,669 652,084 742,012 1,255,377 546,890 1,403,727 396,375 2,209,733 1,613,188 596,545 719,816 821,022 540,463 230,623 49,936 – 286,861 19,870,397
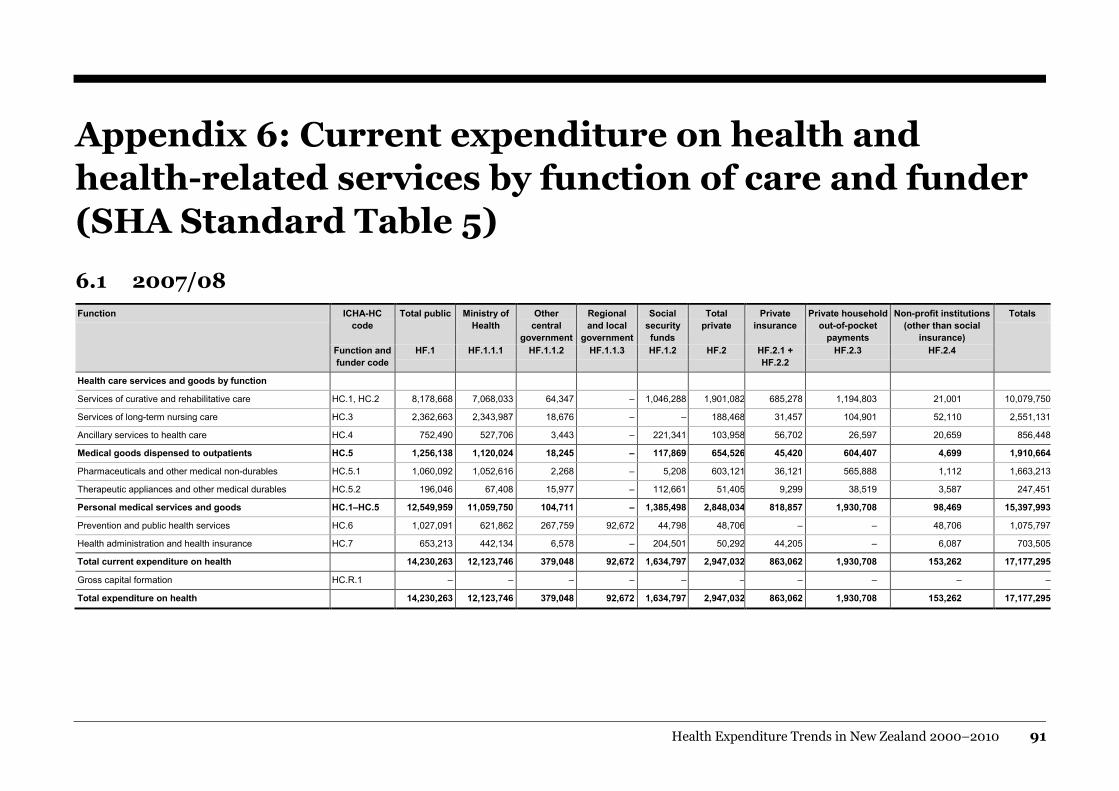
Health Expenditure Trends in New Zealand 2000–2010 91
Appendix 6: Current expenditure on health and health-related services by function of care and funder (SHA Standard Table 5)
6.1 2007/08 Function ICHA-HC
code Total public Ministry of
Health Other
central government
Regional and local
government
Social security funds
Total private
Private insurance
Private household out-of-pocket
payments
Non-profit institutions (other than social
insurance)
Totals
Function and funder code
HF.1 HF.1.1.1 HF.1.1.2 HF.1.1.3 HF.1.2 HF.2 HF.2.1 + HF.2.2
HF.2.3 HF.2.4
Health care services and goods by function
Services of curative and rehabilitative care HC.1, HC.2 8,178,668 7,068,033 64,347 – 1,046,288 1,901,082 685,278 1,194,803 21,001 10,079,750
Services of long-term nursing care HC.3 2,362,663 2,343,987 18,676 – – 188,468 31,457 104,901 52,110 2,551,131
Ancillary services to health care HC.4 752,490 527,706 3,443 – 221,341 103,958 56,702 26,597 20,659 856,448
Medical goods dispensed to outpatients HC.5 1,256,138 1,120,024 18,245 – 117,869 654,526 45,420 604,407 4,699 1,910,664
Pharmaceuticals and other medical non-durables HC.5.1 1,060,092 1,052,616 2,268 – 5,208 603,121 36,121 565,888 1,112 1,663,213
Therapeutic appliances and other medical durables HC.5.2 196,046 67,408 15,977 – 112,661 51,405 9,299 38,519 3,587 247,451
Personal medical services and goods HC.1–HC.5 12,549,959 11,059,750 104,711 – 1,385,498 2,848,034 818,857 1,930,708 98,469 15,397,993
Prevention and public health services HC.6 1,027,091 621,862 267,759 92,672 44,798 48,706 – – 48,706 1,075,797
Health administration and health insurance HC.7 653,213 442,134 6,578 – 204,501 50,292 44,205 – 6,087 703,505
Total current expenditure on health 14,230,263 12,123,746 379,048 92,672 1,634,797 2,947,032 863,062 1,930,708 153,262 17,177,295
Gross capital formation HC.R.1 – – – – – – – – – –
Total expenditure on health 14,230,263 12,123,746 379,048 92,672 1,634,797 2,947,032 863,062 1,930,708 153,262 17,177,295

92 Health Expenditure Trends in New Zealand 2000–2010
Function ICHA-HC code
Total public Ministry of Health
Other central
government
Regional and local
government
Social security funds
Total private
Private insurance
Private household out-of-pocket
payments
Non-profit institutions (other than social
insurance)
Totals
Function and funder code
HF.1 HF.1.1.1 HF.1.1.2 HF.1.1.3 HF.1.2 HF.2 HF.2.1 + HF.2.2
HF.2.3 HF.2.4
Memorandum items: further health-related functions
Education and training of health personnel HC.R.2 386,868 154,277 232,591 – – 283,823 – 83,471 352 670,691
Research and development in health HC.R.3 206,485 1 206,484 – – 31,859 – – 31,859 238,344
Food, hygiene and drinking water control HC.R.4 364,004 – 100,602 263,402 – – – – – 364,004
Environmental health HC.R.5 1,409,589 – 18,717 1,390,872 – – – – – 1,409,589
Administration and provision of social services in kind to assist living with disease and impairment
HC.R.6 131,405 – 22,735 – 108,670 12,832 – – 12,832 144,237
Administration and provision of health-related cash benefits HC.R.7 – – – – – – – – – –
Total health-related expenditure 2,498,351 154,278 581,129 1,654,274 108,670 328,514 – 283,471 45,043 2,826,865
Total health and health-related expenditure 16,728,614 12,278,024 960,177 1,746,946 1,743,467 3,275,546 863,062 2,214,179 198,305 20,004,160

Health Expenditure Trends in New Zealand 2000–2010 93
6.2 2008/09 Function ICHA-HC
code Total public Ministry of
Health Other
central government
Regional and local
government
Social security funds
Total private
Private insurance
Private household out-of-pocket
payments
Non-profit institutions (other than social
insurance)
Totals
Function and funder code
HF.1 HF.1.1.1 HF.1.1.2 HF.1.1.3 HF.1.2 HF.2 HF.2.1 + HF.2.2
HF.2.3 HF.2.4
Health care services and goods by function
Services of curative and rehabilitative care HC.1, HC.2 8,906,528 7,681,852 68,899 924 1,154,853 2,007,826 738,204 1,234,172 35,450 10,914,354
Services of long-term nursing care HC.3 2,467,179 2,447,817 19,362 – – 210,224 33,887 105,895 70,442 2,677,403
Ancillary services to health care HC.4 827,866 582,293 4,314 – 241,259 169,398 61,081 34,917 73,400 997,264
Medical goods dispensed to outpatients HC.5 1,387,394 1,242,299 19,411 – 125,684 669,035 48,928 615,075 5,032 2,056,429
Pharmaceuticals and other medical non-durables HC.5.1 1,173,471 1,166,274 2,133 – 5,064 614,276 38,911 575,365 – 1,787,747
Therapeutic appliances and other medical durables HC.5.2 213,923 76,025 17,278 – 120,620 54,759 10,017 39,710 5,032 268,682
Personal medical services and goods HC.1–HC.5 13,588,967 11,954,261 111,986 924 1,521,796 3,056,483 882,100 1,990,059 184,324 16,645,450
Prevention and public health services HC.6 1,233,251 833,428 276,233 55,000 68,590 60,849 – – 60,849 1,294,100
Health administration and health insurance HC.7 727,863 487,763 10,269 – 229,831 62,076 47,620 – 14,456 789,939
Total current expenditure on health 15,550,081 13,275,452 398,488 55,924 1,820,217 3,179,408 929,720 1,990,059 259,629 18,729,489
Gross capital formation HC.R.1 – – – – – – – – – –
Total expenditure on health 15,550,081 13,275,452 398,488 55,924 1,820,217 3,179,408 929,720 1,990,059 259,629 18,729,489
Memorandum items: further health-related functions –
Education and training of health personnel HC.R.2 446,913 170,573 276,340 – – 277,354 – 276,341 1,013 724,267
Research and development in health HC.R.3 224,317 5,279 219,038 – – 30,661 – – 30,661 254,978
Food, hygiene and drinking water control HC.R.4 368,015 – 107,278 260,737 – – – – – 368,015
Environmental health HC.R.5 1,363,483 – 19,919 1,343,564 – – – – – 1,363,483
Administration and provision of social services in kind to assist living with disease and impairment
HC.R.6 151,886 – 19,654 – 132,232 73,051 – – 73,051 224,937
Administration and provision of health-related cash benefits HC.R.7 – – – – – – – – – –
Total health-related expenditure 2,554,614 175,852 642,229 1,604,301 132,232 381,066 – 276,341 104,725 2,935,680
Total health and health-related expenditure 18,104,695 13,451,304 1,040,717 1,660,225 1,952,449 3,560,474 929,720 2,266,400 364,354 21,665,169

94 Health Expenditure Trends in New Zealand 2000–2010
6.3 2009/10 Function ICHA-HC
code Total public Ministry of
Health Other
central government
Regional and local
government
Social security funds
Total private
Private insurance
Private household out-of-pocket
payments
Non-profit institutions (other than social
insurance)
Totals
Function and funder code
HF.1 HF.1.1.1 HF.1.1.2 HF.1.1.3 HF.1.2 HF.2 HF.2.1 + HF.2.2
HF.2.3 HF.2.4
Health care services and goods by function
Services of curative and rehabilitative care HC.1, HC.2 9,460,137 8,342,089 73,529 – 1,044,519 2,102,414 774,108 1,292,300 36,006 11,562,551
Services of long-term nursing care HC.3 2,670,273 2,649,229 21,044 – – 222,279 35,535 109,476 77,268 2,892,552
Ancillary services to health care HC.4 844,166 617,655 4,433 – 222,078 186,130 64,052 43,900 78,178 1,030,296
Medical goods dispensed to outpatients HC.5 1,511,904 1,376,390 18,910 – 116,604 697,002 51,308 640,800 4,894 2,208,906
Pharmaceuticals and other medical non-durables HC.5.1 1,236,884 1,229,983 2,224 – 4,677 639,733 40,803 598,930 – 1,876,617
Therapeutic appliances and other medical durables HC.5.2 275,021 146,407 16,686 – 111,928 57,268 10,504 41,870 4,894 332,289
Personal medical services and goods HC.1–HC.5 14,486,480 12,985,363 117,916 – 1,383,201 3,207,825 925,003 2,086,476 196,346 17,694,305
Prevention and public health services HC.6 1,324,921 934,905 266,764 67,238 56,014 62,982 – – 62,982 1,387,903
Health administration and health insurance HC.7 724,941 483,651 10,667 – 230,623 63,250 49,935 – 13,315 788,191
Total current expenditure on health 16,536,342 14,403,919 395,347 67,238 1,669,838 3,334,057 974,938 2,086,476 272,643 19,870,399
Gross capital formation HC.R.1 – – – – – – – – – –
Total expenditure on health 16,536,342 14,403,919 395,347 67,238 1,669,838 3,334,057 974,938 2,086,476 272,643 19,870,399
Memorandum items: further health-related functions –
Education and training of health personnel HC.R.2 456,365 166,202 290,163 – – 291,202 – 290,162 1,040 747,567
Research and development in health HC.R.3 225,321 124 225,197 – – 30,154 – – 30,154 255,475
Food, hygiene and drinking water control HC.R.4 368,171 – 100,333 267,838 – – – – – 368,171
Environmental health HC.R.5 1,444,295 – 20,819 1,423,476 – – – – – 1,444,295
Administration and provision of social services in kind to assist living with disease and impairment
HC.R.6 119,148 – 27,739 – 91,409 61,905 – – 61,905 181,053
Administration and provision of health-related cash benefits HC.R.7 – – – – – – – – – –
Total health-related expenditure 2,613,300 166,326 664,251 1,691,314 91,409 383,261 – 290,162 93,099 2,996,561
Total health and health-related expenditure 19,149,642 14,570,245 1,059,598 1,758,552 1,761,247 3,717,318 974,938 2,376,638 365,742 22,866,960

Health Expenditure Trends in New Zealand 2000–2010 95
Appendix 7: Contributors The following organisations contributed information used in the compilation of Health Expenditure Trends in New Zealand 1999–2010.
Annual reports of other central government agencies
Organisation Supplemental information from survey
Accident Compensation Corporation Yes
Auckland University of Technology No
Department of Corrections Yes
Department of Labour N/A
Massey University No
Ministry of Agriculture and Forestry No
Ministry of Education No
Ministry of Health N/A
Ministry of Pacific Island Affairs No
Ministry of Research, Science and Technology No
Ministry of Social Development No
New Zealand Defence Force Yes
New Zealand Lottery Grants Board Yes
The University of Auckland No
University of Otago No

96 Health Expenditure Trends in New Zealand 2000–2010
Health insurance industry The Health Funds Association of New Zealand Inc (HFANZ) Statistics July 2010 are aggregated to produce estimates of total expenditure by the health insurance industry. The following health insurers are member organisations of the HFANZ.
HFANZ members in 2009/10
Accuro Health Insurance Manchester Unity Friendly Society
American International Assurance (AIA New Zealand) Police Health Plan Ltd
EBS Health Care Southern Cross Healthcare
Health Service Welfare Society Sovereign Assurance Company Ltd
IAG New Zealand Limited Tower Limited
ING Life (NZ) Limited Union Medical Benefits Society Ltd
IOOF Friendly Society
Annual reports for regional and local government authorities
Organisation Supplemental information from survey
Ashburton District Council No
Auckland City Council Estimated due to amalgamation to Super City
Auckland Regional Council Estimated due to amalgamation to Super City
Buller District Council No
Central Hawke’s Bay District Council No
Central Otago District Council No
Chatham Islands Council No
Christchurch City Council Yes – street cleaning
Clutha District Council No
Dunedin City Council Yes – health inspectors, street cleaning, public conveniences and pool treatment
Environment Bay of Plenty No
Environment Canterbury No
Environment Waikato Regional Council No
Far North District Council No
Franklin District Council No
Gisborne District Council No
Gore District Council No
Greater Wellington Regional Council No
Grey District Council No

Health Expenditure Trends in New Zealand 2000–2010 97
Organisation Supplemental information from survey
Hamilton City Council Yes – street cleaning and pool treatment
Hastings District Council No
Hauraki District Council No
Hawke’s Bay Regional Council No
Horizons Regional Council No
Hurunui District Council No
Hutt City Council Yes – street cleaning and public conveniences
Kaikoura District Council No
Kaipara District Council No
Kapiti Coast District Council No
Kawerau District Council No
Mackenzie District Council No
Manawatu District Council No
Manukau City Council Estimated due to amalgamation to Super City
Marlborough District Council No
Masterton District Council No
Matamata–Piako District Council No
Napier City Council Yes – street cleaning and pool treatment
Nelson City Council Yes – street cleaning
New Plymouth District Council Yes – street cleaning and pool treatment
North Shore City Council Estimated due to amalgamation to Super City
Northland Regional Council No
Otago Regional Council No
Palmerston North City Council Yes – street cleaning and pool treatment
Papakura District Council Estimated due to amalgamation to Super City
Porirua City Council Yes – street cleaning, public conveniences and sewage
Rangitikei District Council No
Rodney District Council Estimated due to amalgamation to Super City
Rotorua District Council Yes – street cleaning
Ruapehu District Council No
South Waikato District Council No
South Wairarapa District Council No
Southland District Council No
Stratford District Council No
Taranaki Regional Council No
Tararua District Council No
Tasman District Council Yes – public conveniences

98 Health Expenditure Trends in New Zealand 2000–2010
Organisation Supplemental information from survey
Taupo District Council Yes – street cleaning
Tauranga City Council No
Thames–Coromandel District Council No
Timaru District Council Yes – street cleaning
Upper Hutt District Council No
Waikato District Council No
Waimakariri District Council Yes – street cleaning and public conveniences
Waimate District Council No
Waipa District Council No
Wairoa District Council No
Waitakere City Council Estimated due to amalgamation to Super City
Waitaki District Council No
Waitomo District Council No
Water Care Services Limited No
Wellington City Council No
Western Bay of Plenty District Council No
Westland District Council No
Whakatane District Council No
Whanganui District Council No
Whangarei District Council Yes – environmental health and safety, health inspectors

Health Expenditure Trends in New Zealand 2000–2010 99
Annual reports for not-for-profit organisations
Key organisations Annual reports
Alcohol & Drug Services 2010 multiple branches
Alzheimers New Zealand 2008 multiple branches
Alzheimers Society 2010 multiple branches
Ambulance – Wellington Free 2010 report
Ambulance – St Johns St John’s Ambulance 2010 report
Ambulance and other patient transport St John’s Ambulance 2010 report
Amputee Society 2010 multiple branches
Arthritis New Zealand 2010 report
Asthma & Respiratory Foundation of New Zealand 2010 multiple branches
Barnardos New Zealand 2010 report
The Brain Injury Association of New Zealand 2010 multiple branches
Brain Research (Australasian) Inc 2010 report
Cancer Society of New Zealand 2010 multiple branches
CanTeen 2010 report
CCS Disability Action 2010 report
Cerebral Palsy Society of New Zealand 2010 report
Child Cancer Foundation 2010 report
Deaf Association of New Zealand 2010 multiple branches
Deaf-blind New Zealand Incorporated 2010 report
Diabetes New Zealand 2010 multiple branches
Disabled Persons Association (DPA New Zealand) 2010 multiple branches
Downtown Community Ministry 2010 report
Epilepsy Association of New Zealand Inc 2010 report
Epilepsy Foundation of New Zealand 2010 report
Family Planning 2010 report
Hearing Association New Zealand 2010 multiple branches
Heart Children New Zealand 2010 report
Heart Foundation 2010 report
Hospice – Bay of Islands 2010 report
Hospice – Bay of Plenty 2010 report
Hospice – New Zealand Inc 2010 report
Hospice – North Haven 2010 report
Hospice – South Canterbury 2010 report
Hospice – Taranaki 2010 report
Hospice – Waipuna 2010 report

100 Health Expenditure Trends in New Zealand 2000–2010
Key organisations Annual reports
The Laura Fergusson Trust for Disabled Persons 2010 report
Lion Foundation Grants awarded 2010
Mary Potter Hospice 2010 report
Medic Alert Foundation New Zealand Inc 2010 report
Multiple Sclerosis Society of New Zealand 2010 multiple branches
Muscular Dystrophy Association of New Zealand 2010 multiple branches
New Zealand Breastfeeding Authority 2010 report
New Zealand Family Planning Association 2010 report
Ozanam House 2010 report
Parkinsonism Society of New Zealand 2010 multiple branches
Presbyterian Support New Zealand 2010 multiple branches
Royal New Zealand Foundation of the Blind 2010 report
Royal New Zealand Plunket Society 2010 report
Sisters of Mercy Ministries New Zealand 2010 report
Spinal Cord Society New Zealand 2010 multiple branches
Stroke Foundation of New Zealand 2010 multiple branches

Health Expenditure Trends in New Zealand 2000–2010 101
References Abel-Smith B. 1963. Paying for Health Services: A study of the costs and sources of finance in six countries. Geneva: World Health Organization.
NAICS. 1998.
OECD. 2000. A System of Health Accounts. Paris: Organisation for Economic Co-operation and Development.
OECD. 2005. Draft Guidelines for Improving Long-Term Care Expenditure in OECD Health Data 2006/07. Paris: Organisation for Economic Co-operation and Development.
Statistics New Zealand. 2010. Household Economic Survey for 2009/10. Wellington: Statistics New Zealand.
Information sources
OECD
OECD. 1998. Meeting of National Health Accounts Experts, Principles of Health Accounting for International Data Collections, 22–25 September.
OECD. 2001. The State of Implementation of the OECD Manual A System of Health Accounts (SHA) in OECD member countries.
OECD. 2004. OECD Health Data.
OECD. 2004. SHA-Based National Health Accounts in Thirteen Countries: A comparative analysis. Working paper No 12.
OECD. 2005. Dataset Gross Domestic Product, New Zealand. Data extracted 21 June 2007.
OECD. 2006. Summary Record of the 8th Meeting of Health Accounts Experts, 5–6 October.
OECD. 2006. Summary Record of the Meeting of OECD Health Data National Correspondents, 4–5 October 2006.
OECD. 2007. Health Update, No 3.
OECD. 2007. OECD Health Data, July 2009.
OECD. 2007. Purchasing Power Parities (PPS). URL: www.oecd.org/std/ppp/
OECD. 2007. Trends in Severe Disability Among Elderly People: Assessing the evidence in 12 OECD countries and the future implications. Working paper No 26.
OECD. 2008. OECD Health Data, July 2010.
OECD. 2009. OECD Health Data, July 2011.

102 Health Expenditure Trends in New Zealand 2000–2010
Ministry of Health
Ministry of Health. 2006. Ministry of Health Annual Report for the Year Ended 30 June 2006.
Ministry of Health. 2007. Ministry of Health Annual Report for the Year Ended 30 June 2007.
Ministry of Health. 2008. Ministry of Health Annual Report for the Year Ended 30 June 2008.
Ministry of Health. 2009. Ministry of Health Annual Report for the Year Ended 30 June 2009.
Ministry of Health. 2010. Ministry of Health Annual Report for the Year Ended 30 June 2010.
Statistics New Zealand
Statistics New Zealand. 1998. Stats Survey Reference Reports; Consumer Expenditure Statistics, Part 3.
Statistics New Zealand. 2006. Household Economic Survey: Recommendation on structure and content.
Statistics New Zealand. 2009/10. Household Economic Survey Expenditure Diary.
Statistics New Zealand. 2009/10. Household Economic Survey Expenditure Questionnaire.
Statistics New Zealand. 2009/10. Preliminary Views on the Household Economic Survey.
Statistics New Zealand. 2010 Gross Domestic Product: March 2010 Quarter: Expenditure on gross domestic product, actual current prices.
Statistics New Zealand. 2010. Household Economic Survey for 2009/10.
Statistics New Zealand. 2011. Background on Economic Survey.
World Health Organization
World Health Organization. 2002. National Health Accounts: Concepts, data sources and methodology.
World Health Organization. 2003. Guide to Producing National Health Accounts.
World Health Organization. 2006. Working Together for Health: The World Health Report 2006.

Health Expenditure Trends in New Zealand 2000–2010 103
Other
HFANZ. 2010. Health Insurance Statistics July 2010. Wellington: Health Funds Association of New Zealand.
Ministry of Education. 2005. Profile and Trends. Wellington: Ministry of Education.
Philanthropy New Zealand. 2007. Giving New Zealand Philanthropic Funding 2006. Prepared by BERL.
Southern Cross Medical Care Society. 2010. The Southern Cross Medical Care Society 2010 Annual Report. Auckland: The Southern Cross Medical Care Society.
The Treasury. 2010. Total Financial Statements of the Government of New Zealand, for the Year Ended 30 June 2010. Wellington: The Treasury.