Health-economic evaluation of home … evaluation of home telemonitoring for COPD ... used to answer...
14
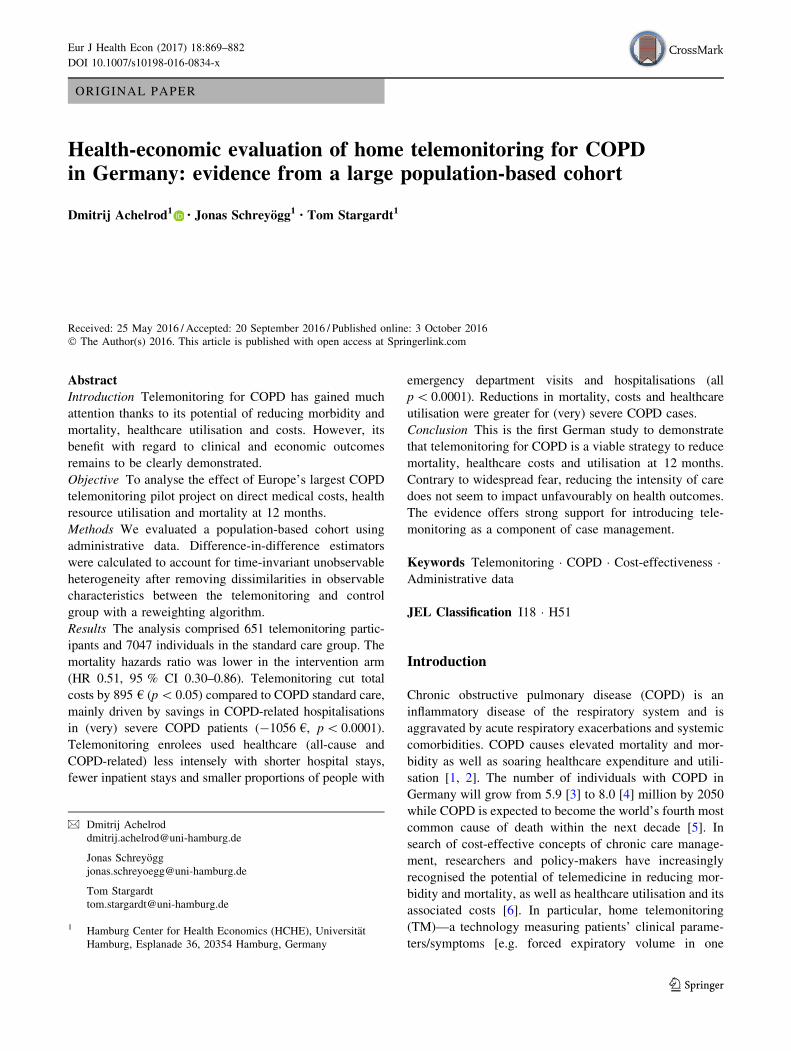
ORIGINAL PAPER Health-economic evaluation of home telemonitoring for COPD in Germany: evidence from a large population-based cohort Dmitrij Achelrod 1 • Jonas Schreyo ¨gg 1 • Tom Stargardt 1 Received: 25 May 2016 / Accepted: 20 September 2016 / Published online: 3 October 2016 Ó The Author(s) 2016. This article is published with open access at Springerlink.com Abstract Introduction Telemonitoring for COPD has gained much attention thanks to its potential of reducing morbidity and mortality, healthcare utilisation and costs. However, its benefit with regard to clinical and economic outcomes remains to be clearly demonstrated. Objective To analyse the effect of Europe’s largest COPD telemonitoring pilot project on direct medical costs, health resource utilisation and mortality at 12 months. Methods We evaluated a population-based cohort using administrative data. Difference-in-difference estimators were calculated to account for time-invariant unobservable heterogeneity after removing dissimilarities in observable characteristics between the telemonitoring and control group with a reweighting algorithm. Results The analysis comprised 651 telemonitoring partic- ipants and 7047 individuals in the standard care group. The mortality hazards ratio was lower in the intervention arm (HR 0.51, 95 % CI 0.30–0.86). Telemonitoring cut total costs by 895 € (p \ 0.05) compared to COPD standard care, mainly driven by savings in COPD-related hospitalisations in (very) severe COPD patients (-1056 €, p \ 0.0001). Telemonitoring enrolees used healthcare (all-cause and COPD-related) less intensely with shorter hospital stays, fewer inpatient stays and smaller proportions of people with emergency department visits and hospitalisations (all p \ 0.0001). Reductions in mortality, costs and healthcare utilisation were greater for (very) severe COPD cases. Conclusion This is the first German study to demonstrate that telemonitoring for COPD is a viable strategy to reduce mortality, healthcare costs and utilisation at 12 months. Contrary to widespread fear, reducing the intensity of care does not seem to impact unfavourably on health outcomes. The evidence offers strong support for introducing tele- monitoring as a component of case management. Keywords Telemonitoring Á COPD Á Cost-effectiveness Á Administrative data JEL Classification I18 Á H51 Introduction Chronic obstructive pulmonary disease (COPD) is an inflammatory disease of the respiratory system and is aggravated by acute respiratory exacerbations and systemic comorbidities. COPD causes elevated mortality and mor- bidity as well as soaring healthcare expenditure and utili- sation [1, 2]. The number of individuals with COPD in Germany will grow from 5.9 [3] to 8.0 [4] million by 2050 while COPD is expected to become the world’s fourth most common cause of death within the next decade [5]. In search of cost-effective concepts of chronic care manage- ment, researchers and policy-makers have increasingly recognised the potential of telemedicine in reducing mor- bidity and mortality, as well as healthcare utilisation and its associated costs [6]. In particular, home telemonitoring (TM)—a technology measuring patients’ clinical parame- ters/symptoms [e.g. forced expiratory volume in one & Dmitrij Achelrod [email protected] Jonas Schreyo ¨gg [email protected] Tom Stargardt [email protected] 1 Hamburg Center for Health Economics (HCHE), Universita ¨t Hamburg, Esplanade 36, 20354 Hamburg, Germany 123 Eur J Health Econ (2017) 18:869–882 DOI 10.1007/s10198-016-0834-x
Transcript of Health-economic evaluation of home … evaluation of home telemonitoring for COPD ... used to answer...
ORIGINAL PAPER
Health-economic evaluation of home telemonitoring for COPDin Germany: evidence from a large population-based cohort
Dmitrij Achelrod1• Jonas Schreyogg1
• Tom Stargardt1
Received: 25 May 2016 / Accepted: 20 September 2016 / Published online: 3 October 2016
� The Author(s) 2016. This article is published with open access at Springerlink.com
Abstract
Introduction Telemonitoring for COPD has gained much
attention thanks to its potential of reducing morbidity and
mortality, healthcare utilisation and costs. However, its
benefit with regard to clinical and economic outcomes
remains to be clearly demonstrated.
Objective To analyse the effect of Europe’s largest COPD
telemonitoring pilot project on direct medical costs, health
resource utilisation and mortality at 12 months.
Methods We evaluated a population-based cohort using
administrative data. Difference-in-difference estimators
were calculated to account for time-invariant unobservable
heterogeneity after removing dissimilarities in observable
characteristics between the telemonitoring and control
group with a reweighting algorithm.
Results The analysis comprised 651 telemonitoring partic-
ipants and 7047 individuals in the standard care group. The
mortality hazards ratio was lower in the intervention arm
(HR 0.51, 95 % CI 0.30–0.86). Telemonitoring cut total
costs by 895 € (p\ 0.05) compared to COPD standard care,
mainly driven by savings in COPD-related hospitalisations
in (very) severe COPD patients (-1056 €, p\ 0.0001).
Telemonitoring enrolees used healthcare (all-cause and
COPD-related) less intensely with shorter hospital stays,
fewer inpatient stays and smaller proportions of people with
emergency department visits and hospitalisations (all
p\ 0.0001). Reductions in mortality, costs and healthcare
utilisation were greater for (very) severe COPD cases.
Conclusion This is the first German study to demonstrate
that telemonitoring for COPD is a viable strategy to reduce
mortality, healthcare costs and utilisation at 12 months.
Contrary to widespread fear, reducing the intensity of care
does not seem to impact unfavourably on health outcomes.
The evidence offers strong support for introducing tele-
monitoring as a component of case management.
Keywords Telemonitoring � COPD � Cost-effectiveness �Administrative data
JEL Classification I18 � H51
Introduction
Chronic obstructive pulmonary disease (COPD) is an
inflammatory disease of the respiratory system and is
aggravated by acute respiratory exacerbations and systemic
comorbidities. COPD causes elevated mortality and mor-
bidity as well as soaring healthcare expenditure and utili-
sation [1, 2]. The number of individuals with COPD in
Germany will grow from 5.9 [3] to 8.0 [4] million by 2050
while COPD is expected to become the world’s fourth most
common cause of death within the next decade [5]. In
search of cost-effective concepts of chronic care manage-
ment, researchers and policy-makers have increasingly
recognised the potential of telemedicine in reducing mor-
bidity and mortality, as well as healthcare utilisation and its
associated costs [6]. In particular, home telemonitoring
(TM)—a technology measuring patients’ clinical parame-
ters/symptoms [e.g. forced expiratory volume in one
& Dmitrij Achelrod
Jonas Schreyogg
Tom Stargardt
1 Hamburg Center for Health Economics (HCHE), Universitat
Hamburg, Esplanade 36, 20354 Hamburg, Germany
123
Eur J Health Econ (2017) 18:869–882
DOI 10.1007/s10198-016-0834-x

second (FEV1), oxygen saturation, sputum] at home and
allowing communication between healthcare professionals
and patients over distance—has gained much attention.
Practitioners expect that telemonitoring can anticipate
unscheduled, COPD-related physician/emergency depart-
ment (ED) visits and hospitalisations by detecting anoma-
lies in patients’ vital signs sufficiently early.
However, despite a growing body of evidence for TM in
the management of COPD and other chronic diseases, such
as congestive heart failure (CHF), the benefit of telemon-
itoring with regard to clinical and economic outcomes
remains to be clearly demonstrated [6, 7]. Meta-analyses
indicate that telemonitoring reduces the odds ratio of all-
cause hospitalisation and ED visits by up to 54 % [8–10]
and 73 % [8, 10], respectively, but has no impact on hos-
pital length of stay, disease-specific quality of life (QoL) or
mortality [8–11]. Most studies did not differentiate
between COPD-related and all-cause healthcare use, leav-
ing space for speculation about the effect on respiratory-
related resource utilisation. Similarly, the evidence on cost-
effectiveness is very meagre and inconclusive [9]. Recent
cost-utility analyses from the UK found that telemonitoring
was very unlikely to be cost-effective, with an incremental
cost-effectiveness ratio (ICER) ranging between
*120,000 € [12] and *178,000 € per quality-adjusted life
year (QALY) gained [13]. In contrast, a modelling study in
the German context found telemonitoring to be cost-ef-
fective (ICER 15,400 €) [14].These findings need to be interpreted with caution
though, and their applicability to the German context
cannot be warranted because of the complete absence of
German studies. The few telemonitoring interventions
evaluated were highly heterogeneous, employing manifold
technologies that ranged between simplistic telephone
calls, patient education, virtual video-consultations, semi-
automated transmission of vital parameters or a combina-
tion thereof [8]. The breadth and frequency of parameter
measurements as well as availability and qualification of
support staff diverged across studies. Short follow-up
periods (range 2–12 months, mode 6 months) precluded
statements about long-term effectiveness [9] and studies
were typically under-powered [7] due to small sample sizes
(range 18 [10] to 256 [11], median 70 [11]). Moreover,
most studies were controlled trials and thus conducted in a
well-ordered clinical environment that might lack compa-
rability to routine care settings.
Given the dearth of much-needed evidence, the aim of this
study is to analyse the effect of Germany’s largest COPD
telemonitoring pilot project on direct medical costs, health
resource utilisation and mortality. The intervention consisted
of a telemonitoring set for transmitting vital parameters,
clinical support and patient education. We estimate incre-
mental costs and effectiveness by comparing a COPD
telemonitoring and aCOPD standard care cohort over a period
of 1 year. In doing so, we address the limitations of existing
studies in numerous ways. First, to the best knowledge of the
authors, this is so far the largest evaluation of COPD tele-
monitoring in Europe. A follow-up period of 1 year in con-
junctionwith a sample size that exceeds the mean sample size
of conducted RCTs by a factor of ten enables measuring mid-
term outcomes reliably. Second, we investigate the incre-
mental causal effect of telemonitoring in pragmatic, routine
clinical settings by using a combination of entropy balancing
and difference-in-difference estimators. By isolating COPD-
related from all-cause outcomes, we can make precise
judgements about the effectiveness of telemonitoring on res-
piratory-related outcomes. Finally, we consider incremental
costs in addition to effectiveness of the intervention, and we
are the first to conduct an evaluation of telemonitoring for
COPD in Germany.
Methods
Study design and study sample
Costs from the sickness fund perspective and effectiveness
of telemonitoring were evaluated in an observational, ret-
rospective, population-based cohort study design. We
compared outcomes of patients receiving telemonitoring in
addition to standard care with those of a cohort only
receiving standard care over a period of 12 months. The
analysis was based on administrative data from AOK
Bayern (4.4 million insurances in 2014) which is Ger-
many’s fourth largest sickness fund. The dataset contained
longitudinal patient-level information on socio-demo-
graphic status, medical diagnoses, direct medical costs, as
well as on healthcare utilisation between 2009 and 2014.
Patients ([18 years of age) with COPD were required
(a) to have had an in- or outpatient ICD-GM-10 (J44)
diagnosis in the dataset of the sickness fund and (b) to
having been hospitalised with a COPD or COPD-related
diagnosis (ICD J41–J44) within 24 months before the
index date (variable date for telemonitoring group; 1 Jan-
uary 2013 for control group). The patient cohort was sub-
sequently divided into an intervention group, i.e. patients
that voluntarily enrolled in the telemonitoring programme
for the first time between November 2012 and December
2013, and a control group, i.e. patients that had never been
members of the telemonitoring programme at any point in
time between 2009 and 2014. For telemonitoring enrolees,
outcomes were measured for 12 months starting from their
individual telemonitoring enrolment (index date between
November 2012 and December 2013), while for the control
group, outcomes were assessed in the 12-month period
starting from their common index date (1 January 2013).
870 D. Achelrod et al.
123

In order to allow for risk adjustment, we stipulated a
period of 2 years prior to the index date (variable date for
telemonitoring group; 1 January 2013 for control group) as
the basis for determining patient-level risk profiles.
Applying equally to the telemonitoring and control group,
individuals were excluded from this study if they (1)
switched between the telemonitoring and control group, (2)
had not been constantly enrolled at the sickness fund dur-
ing the 2-year risk adjustment, or (3) the 1-year observation
period. Patients who died during the observation period
were not excluded. Individuals were excluded if they were
suffering from predefined diseases [malignant neoplasms
(ICD C00–C97), moderate/severe intellectual disabilities
(ICD F71–F74, F78), Parkinson’s (ICD G20–G23) and
Alzheimer’s disease (ICD G30–G32)] or currently under-
going certain therapies (chemo/radiation therapy, dialysis,
long-term ventilation) that could impede an active partic-
ipation in the telemonitoring service and substantially
undermine the programme’s effect. Likewise, individuals
were disqualified if they were taking part in any other
telemonitoring/integrated care programme [except for the
COPD disease management programme (DMP)] or were
not deemed suitable by the telemonitoring provider SHL
Telemedizin (e.g. due to difficulties in dealing with tech-
nology or language barriers).
Telemonitoring intervention
Patients received up to two monitoring devices [spirometer
for mild to severe (FEV1 C35 %) patients and spirome-
ter ? pulse oximeter for very severe (FEV1 \35 %)
patients] that measured vital parameters at least twice a
week. Patients were free to choose the time and day of vital
parameter measurement, but were called by the surveil-
lance centre if they transferred fewer than two measure-
ments per week. In addition, a telemonitoring console was
used to answer a disease-specific [COPD assessment test
(CAT)] and general well-being questionnaire (three ques-
tions) at least twice a week. Vital parameters and ques-
tionnaire data was automatically transmitted to an
electronic patient record that was operated by the 24-h-
available SHL surveillance centre. Moreover, users
received phone calls at jointly agreed frequencies (usually
every 2–3 weeks) to receive education on improved diet,
exercise and lifestyle as well as support for smoking ces-
sation. Patients were invited to contact the surveillance
centre at any time should further questions occur. Based on
the transmitted questionnaires and on the spirometer/pulse
oximeter data, an algorithm calculated the probability of
exacerbation. At enrolment, the SHL surveillance team
defined measures to be taken in case of worsening health
on the basis of the patient’s physician data. In the case of a
high exacerbation probability, the medical staff called the
patient in order to adjust emergency medication or take any
other measures predefined by the physician.
Study outcomes
The selection of the study outcomes was based on the most
commonly used outcomes in the literature [8] and can be
subdivided into (1) direct medical costs, (2) mortality and
(3) healthcare resource utilisation. All outcomes represent
the average values over the 12-month follow-up period and
24-month baseline period, respectively. COPD-related
costs and healthcare utilisation were identified through the
J44 diagnosis.
Direct medical costs
Direct medical costs for inpatient and outpatient treatment,
pharmaceuticals, as well as rehabilitation, were calculated
from the sickness fund’s perspective. Hospital admissions
were truncated at 50,000 € per episode (first percentile) in
order to limit a potential distortion by extreme outliers. From
the sickness fund’s perspective, telemonitoring costs were
irrelevant since programme costs were reimbursed in a profit-
sharing agreement. All costs were reported in 2013 Euros.
Mortality
All-cause mortality was reported as the average yearly
proportion of deceased individuals and hazards ratio (HR).
Years of life lost (YLL) due to premature mortality were
calculated by subtracting the age of death from the age- and
gender-adjusted individual life expectancy [15]. We also
calculated an incremental cost-effectiveness ratio (ICER) for
avoiding one YLL through the use of telemonitoring. In
addition, we extrapolated our mortality rates and total
number of YLL to the German COPD population that would
be eligible for telemonitoring (based on AOK’s eligibility
criteria) in order to estimate national cost implications.
Healthcare resource utilisation
We compared the number of hospitalisations and outpatient
physician visits (COPD-related, all-cause, ED), the (aver-
age) length of stay (COPD-related, all-cause), the propor-
tion of hospitalised patients (all-cause, due to COPD,
emergency department) and the number of pharmaceutical
prescriptions between the two groups.
Statistical analysis
In order to reduce confounding due to unbalanced baseline
characteristics between the telemonitoring and control
group, a two-step risk-adjustment was applied: (1) entropy
Health-economic evaluation of home telemonitoring for COPD in Germany… 871
123

balancing and (2) difference-in-difference (DiD) estima-
tion. In a first step, we ran a reweighting algorithm (entropy
balancing) in order to remove imbalances in the mean and
variance of a set of pre-specified, observed covariates (e.g.
age, sex, comorbidity; see ‘‘Risk adjustment’’ section).
Entropy balancing directly recalibrates the weight of each
control individual to maximise comparability to the treat-
ment group, but at the same time it keeps the newly
computed weights as close as possible to the base weights
to reduce loss of information and model dependency [16].
In comparison to propensity score matching, entropy bal-
ancing achieves significantly higher covariate balance,
does not discard individuals and obviates the need for
manual propensity score model specification and balance
checking [16]. Although balance diagnostics is not com-
mon after entropy balancing, significance tests [16] and
standardised mean differences [17] were used to compare
the balance of baseline characteristics before and after
weighting.
In a second step, differences in outcomes between the
telemonitoring and control group due to unobserved factors
(e.g. undiagnosed health conditions) were minimised with
the DiD estimation. The gist of DiD is to compare the
difference in outcomes after (follow-up period) and before
(baseline period) the intervention (telemonitoring) in the
intervention group to the same difference for the control
group. Outcomes in the baseline period were measured
2 years prior to the respective index date. In order to avoid
biased standard errors due to serial correlation, the time
series dimension of the 2-year baseline period was
removed by averaging the values over 2 years and hence
creating one single value per outcome measure for the
baseline period [18]. The parallel trend assumption was
checked by plotting relevant outcomes over time. Out-
comes were calculated monthly (quarterly in the case of
outpatient data, due to German reporting standards) for
2 years (baseline period) in order to verify the parallel
trend over 24 data points. Finally, using the entropy
weights computed in the first step, a weighted OLS
regression (DiD estimator) was run with the change in
costs/health outcomes as the dependent variable. In addi-
tion, the set of conditioning variables selected in the first
weighting step (see ‘‘Risk adjustment’’ section) were used
as independent variables in the weighted OLS regression in
order to reduce the standard error of the treatment estimate.
Because those independent variables have already been
used in the entropy balancing, they have no further effect
on the DiD estimator.
Risk-adjustment
We used a set of variables that are considered to possess a
high prognostic potential for the outcomes (cost, mortality
and healthcare utilisation). Evidence suggests that gender,
age [2, 19], comorbidities [2, 20] and pharmacy-based
metrics (PBM) [21] are robust predictors of healthcare
costs, mortality and resource utilisation in COPD [22].
Since comorbidities might not always be recorded through
the ICD catalogue but are still treated with drugs, pre-
scription claims data (PBM) [21] provide valuable infor-
mation on the patient’s health status. Consequently, in the
entropy weighting procedure, the covariates were socio-
demographic variables (sex, age, and insurance status as a
proxy for socio-economic status), generic comorbidity
measurement instruments (29 of the total 31 Elixhauser
comorbidity groups [20, 23] and 32 of the total 32 PBM
groups [21]), as well as COPD-specific comorbidity mea-
surement variables. Redundant Elixhauser and PBM
groups (e.g. COPD) or those that fulfilled our exclusion
criteria (e.g. metastatic cancer) were discarded. The
COPD-specific group comprises indicators for COPD
severity (lung function) as measured by forced expiratory
volume (FEV1) [ICD10 GM diagnoses of J44.x0 (=FEV1
\35 % & very severe), J44.x1 (=50 %[FEV1 C 35 %
& severe), J44.x2 (=70 %[ FEV1 C 50 % & moderate)
or J44.x3 (=FEV1 C70 % & mild)], reported tobacco
addiction (ICD F17, yes/no) and membership in a COPD
disease management programme (yes/no). For each patient,
an ICD diagnosis was included in their risk adjustment
profile if it was determined at least once in inpatient set-
tings or at least twice within 180 consecutive days in
outpatient settings. All abovementioned covariates were
determined in the 2-year risk-adjustment period (variable
date for telemonitoring members and 1 January 2013 for
control individuals).
Subgroup analysis
In order to detect differential treatment effects of tele-
monitoring for different COPD severities, we performed a
separate subgroup analysis on mild to moderate COPD
(FEV1 C50 %) and on severe to very severe COPD (FEV1
\50 %), respectively. If COPD stages of different severity
existed, we chose the most severe diagnosis for the
respective patient. Moreover, to analyse the effect of
enrolment in a disease management programme (DMP)
whilst using telemonitoring, we conducted a further sub-
group analysis by DMP membership status. Because the
sample composition changes in subgroup analysis, we
computed new entropy weights for each subgroup.
Sensitivity analysis
We analysed how results changed in response to (1)
exclusion of deceased individuals, (2) to truncation of high-
cost cases and (3) to an intention-to-treat (ITT) analysis.
872 D. Achelrod et al.
123
Owing to the fact that the last months of life often incur
exceptionally high costs and healthcare utilisation, we
excluded individuals who died during the intervention
period and thus could have potentially distorted the effect
of telemonitoring (1). In a further sensitivity analysis, we
mitigated the effect of high-cost individuals by truncating
the total annual costs at 50,000 € (2). Costs above this
threshold are usually extreme outliers that are not repre-
sentative of the entire population and might undermine true
treatment effects. Finally, instead of applying an as-treated
methodology, we used an intention-to-treat framework that
entails the analysis of all participants regardless of their
non-adherence to the assigned telemonitoring treatment
protocol (3). ITT is useful in estimating the effectiveness of
administering a technology in the wider community in light
of inevitable treatment non-adherence [24]. Hence, we still
measured outcomes at 12 months starting from telemoni-
toring enrolment, but we did not exclude individuals that
dropped out from the telemonitoring programme during the
12-month intervention period.
Results
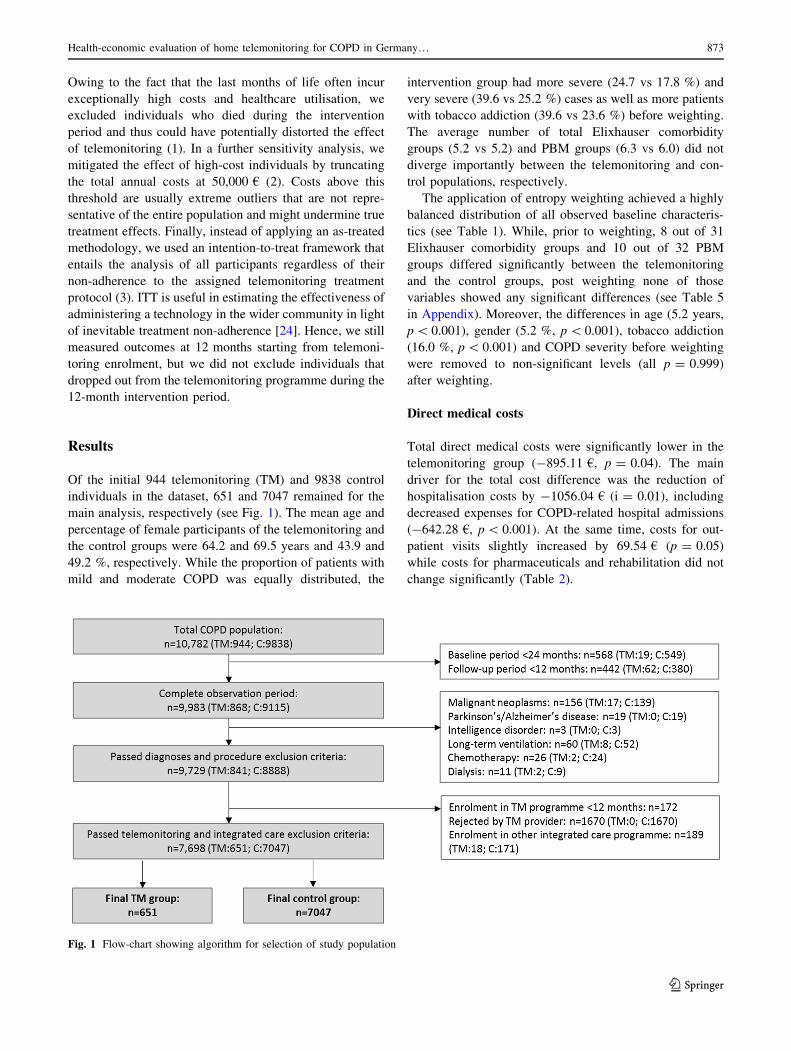
Of the initial 944 telemonitoring (TM) and 9838 control
individuals in the dataset, 651 and 7047 remained for the
main analysis, respectively (see Fig. 1). The mean age and
percentage of female participants of the telemonitoring and
the control groups were 64.2 and 69.5 years and 43.9 and
49.2 %, respectively. While the proportion of patients with
mild and moderate COPD was equally distributed, the
intervention group had more severe (24.7 vs 17.8 %) and
very severe (39.6 vs 25.2 %) cases as well as more patients
with tobacco addiction (39.6 vs 23.6 %) before weighting.
The average number of total Elixhauser comorbidity
groups (5.2 vs 5.2) and PBM groups (6.3 vs 6.0) did not
diverge importantly between the telemonitoring and con-
trol populations, respectively.
The application of entropy weighting achieved a highly
balanced distribution of all observed baseline characteris-
tics (see Table 1). While, prior to weighting, 8 out of 31
Elixhauser comorbidity groups and 10 out of 32 PBM
groups differed significantly between the telemonitoring
and the control groups, post weighting none of those
variables showed any significant differences (see Table 5
in Appendix). Moreover, the differences in age (5.2 years,
p\ 0.001), gender (5.2 %, p\ 0.001), tobacco addiction
(16.0 %, p\ 0.001) and COPD severity before weighting
were removed to non-significant levels (all p = 0.999)
after weighting.
Direct medical costs
Total direct medical costs were significantly lower in the
telemonitoring group (-895.11 €, p = 0.04). The main
driver for the total cost difference was the reduction of
hospitalisation costs by -1056.04 € (i = 0.01), including
decreased expenses for COPD-related hospital admissions
(-642.28 €, p\ 0.001). At the same time, costs for out-
patient visits slightly increased by 69.54 € (p = 0.05)
while costs for pharmaceuticals and rehabilitation did not
change significantly (Table 2).
Fig. 1 Flow-chart showing algorithm for selection of study population
Health-economic evaluation of home telemonitoring for COPD in Germany… 873
123

Mortality and ICER
During the 12-month evaluation period, a lower percentage
of individuals died in the intervention group than in the
control group (3.23 vs 6.22 %, p\ 0.0001), translating
into a mortality hazards ratio (HR) of 0.51 (95 % CI
0.30–0.86). Since cost savings were achieved, on average,
the telemonitoring programme can be considered a domi-
nant technology (i.e. ICER: not applicable).
Although this calculation represents a rough, probably
upwards-biased approximation because the morbidity profile
of those insured by AOK Bayern may not be representative
for Germany, given that AOK Bayern considered 0.25 % of
those it insured eligible for telemonitoring, 198.500 COPD
individuals nationwide could be considered suitable for
telemonitoring (0.245 % of 81.0 million). Thus, a national
rollout of telemonitoring would avoid approximately 5941
deaths and 108,689 YLL per year. Given that telemonitoring
reduces costs at the same time (-895.11 € per patient), cost
savings of 177.7 € million could be achieved.
Healthcare utilisation
Generally, healthcare utilisation in the telemonitoring
group decreased in the inpatient sector and increased in the
outpatient sector. Over the 12-month period, the proportion
of patients hospitalised due to all causes (-15.16 %,
p\ 0.0001), due to COPD (-20.27 %, p\ 0.0001) and
COPD-related ED (-17.00 %, p\ 0.0001) was consis-
tently lower in telemonitoring patients, leading to fewer
all-cause (-0.21, p\ 0.0001), COPD-related (-0.18,
p\ 0.0001) and COPD-related ED admissions (-0.14,
p\ 0.0001). On average, people in the intervention group
spent 3.1 (p\ 0.0001) and 2.07 (p\ 0.001) fewer days in
hospital due to all causes and COPD, respectively, than the
control group. The average length of stay (ALOS)
declined, too. The decrease in inpatient care seems to have
been compensated by more frequent outpatient visits (all-
cause: 1.27, p\ 0.0001; COPD-related: 0.86, p\ 0.0001)
and a more intense prescription of pharmaceuticals (1.67,
p\ 0.01).
Table 1 Baseline characteristics of the telemonitoring (TM) and control group prior to and post entropy balancing (EB)
Variables TM Control D-statistica p valueb
Before EB After EB Before EB After EB Before EB After EB
Sample size (N) 651 7047 – – – –
Mean age (years) 64.24 69.47 64.24 48.55 0.00 \0.05 1
Female 43.93 49.17 43.93 10.51 0.00 \0.001 1
FEV1 values
FEV1 C70 % 6.91 7.25 6.91 1.32 0.00 0.81 1
70 %[FEV1 C 50 % 17.20 17.28 17.20 0.21 0.00 1 1
50 %[FEV1 C 35 % 24.73 17.75 24.73 17.12 0.00 \0.001 1
FEV1\ 35 % 39.63 25.20 39.63 31.19 0.00 \0.001 1
FEV unknown 11.52 32.51 11.52 52.35 0.00 \0.001 1
Tobacco addiction 39.63 23.64 39.63 34.90 0.00 \0.001 1
Insurance status 0.00 0.00
Mandatory 29.03 21.77 29.03 16.74 0.00 \0.001 1
Pensionary 64.98 71.69 64.98 14.46 0.00 \0.001 1
Voluntary 5.99 6.54 5.99 2.27 0.00 0,68 1
DMP COPD enrolment 62.21 37.16 62.21 51.74 0.00 \0.001 1
Elixhauser comorbidities (see Appendix)
Before EB 8 of 31 significantly different at p\ 0.05
After EB 0 of 31 significantly different at p\ 0.05
Pharmacy-based classes (see Appendix)
Before EB 10 of 32 significantly different at p\ 0.05
After EB 0 of 32 significantly different at p\ 0.05
All values in % unless indicated otherwise
EB entropy balancinga D-statistic represents the standardised mean differenceb p value: Fisher’s exact test for dichotomous and t-test for continuous variables
874 D. Achelrod et al.
123

Subgroup analysis
Dividing the cohort into mild/moderate COPD (FEV1
C50 %) and into severe/very severe COPD (FEV1\50 %)
shows that total cost savings were larger in the less sick
subgroup (mild/moderate: -1205.13 €, p = 0.110; severe/
very severe: -518.51 €, p = 0.410) but differences from
the control groups were not significant in both cases due to
smaller sample size (see Table 3). While the biggest sav-
ings in the mild/moderate subgroup were achieved in all-
cause hospitalisation costs (-1467.91 €, p = 0.035)
through fewer all-cause hospital days (-4.3, p\ 0.01),
costs and days for COPD-related hospitalisations did not
change (-23.16 €, p = 0.937; -0.34, p = 0.576). In
contrast, in the severe subgroup, telemonitoring reduced
COPD-related inpatient costs (-635.74, p = 0.018), days
(-2.2, p\ 0.0001) and ALOS (-1.81, p\ 0.0001) but did
not affect all-cause admission costs (-607.03 €,p = 0.290) and days (-2.0, p = 0.065). In both subgroups,
the number of all-cause and COPD-related physician con-
tacts significantly increased (see Table 3). Differences in
mortality with a HR of 0.50 (95 % CI 0.27–0.91) were
stronger in the sicker subgroup [-3.65 % (3.82 vs 7.47 %),
p\ 0.0001] than in the milder COPD group [-2.81 %
(1.91 vs 4.72 %), p = 0.021]. The HR did not reach sta-
tistical significance in the mild/moderate population (HR
0.40, 95 % CI 0.11–1.54).
The second subgroup analysis revealed that DMP
membership did not prominently affect the magnitude or
direction of the effect of telemonitoring on costs and
other outcomes. Cost-savings for all-cause (DMP:
-1051 €; non-DMP: -913 €) and COPD-related hospital
admissions (DMP: -649 €; non-DMP: -652 €) was
similar in both groups, although statistical significance for
all-cause admissions was only reached in the DMP group.
No clinically important differences were observed for
indicators of healthcare utilisation between the DMP and
non-DMP populations. Mortality HRs were still in favour
of the telemonitoring interventions in both DMP groups
(DMP: HR 0.40, 95 % CI 0.18–0.86; non-DMP: HR 0.67,
95 % CI 0.32–1.40) but was not significant in the non-
DMP arm.
Table 2 Outcomes for the
telemonitoring (TM) and
control group in the baseline
(2 years) and follow-up period
(1 year) with the respective
difference-in-difference
estimator and its standard error
(SE)
TM (651) Control (7047) DiD estimation
Baseline Follow-up Baseline Follow-up ATTa SE
Total costs (in €) 6799 8314 6961 9371 -895* 445
Inpatient treatment 3393 4296 3768 5727 -1056** 410
Thereof due to COPD 1431 1298 1478 1987 -642*** 191
Outpatient treatment 1114 1288 994 1098 70* 35
Pharmaceuticals 2120 2496 2044 2328 92 94
Rehabilitation 171 234 155 218 0 42
Indicators for healthcare utilisation
Average length of hospital stay 6.05 4.89 5.87 6.14 -1.44*** 0.34
Thereof due to COPD 4.77 2.75 4.41 4.14 -1.76*** 0.29
Inpatient bed days 9.87 9.97 11.28 14.47 -3.10*** 0.82
Thereof due to COPD 4.74 3.39 4.77 5.48 -2.07*** 0.40
Inpatient stays 1.09 1.06 1.15 1.34 -0.21*** 0.06
Thereof due to COPD 0.51 0.36 0.49 0.52 -0.18*** 0.04
Thereof ED visits due to COPD 0.31 0.21 0.28 0.33 -0.14*** 0.03
Proportion hospitalized (in %) 93.86 50.23 87.32 58.85 -15.16*** 2.36
Thereof due to COPD 74.81 22.27 64.40 32.13 -20.27*** 2.53
Thereof in ED due to COPD 49.16 14.29 40.47 22.60 -17.00*** 2.47
Physician visits 15.17 16.98 13.38 13.91 1.27*** 0.26
Thereof due to COPD 6.09 8.08 5.29 6.42 0.86*** 0.13
Prescriptions 36.72 41.49 34.93 38.04 1.67** 0.61
Indicators for mortality
All-cause mortality (in %) n.a.b 3.23 n.a.b 6.22 -2.99*** n.a.
*\ 0.05; **\ 0.01; ***\ 0.0001a Average treatment effect for the treated represents excess resource utilisation attributable to DMPb Baseline values are not applicable because individuals were only eligible if alive at index date
Health-economic evaluation of home telemonitoring for COPD in Germany… 875
123

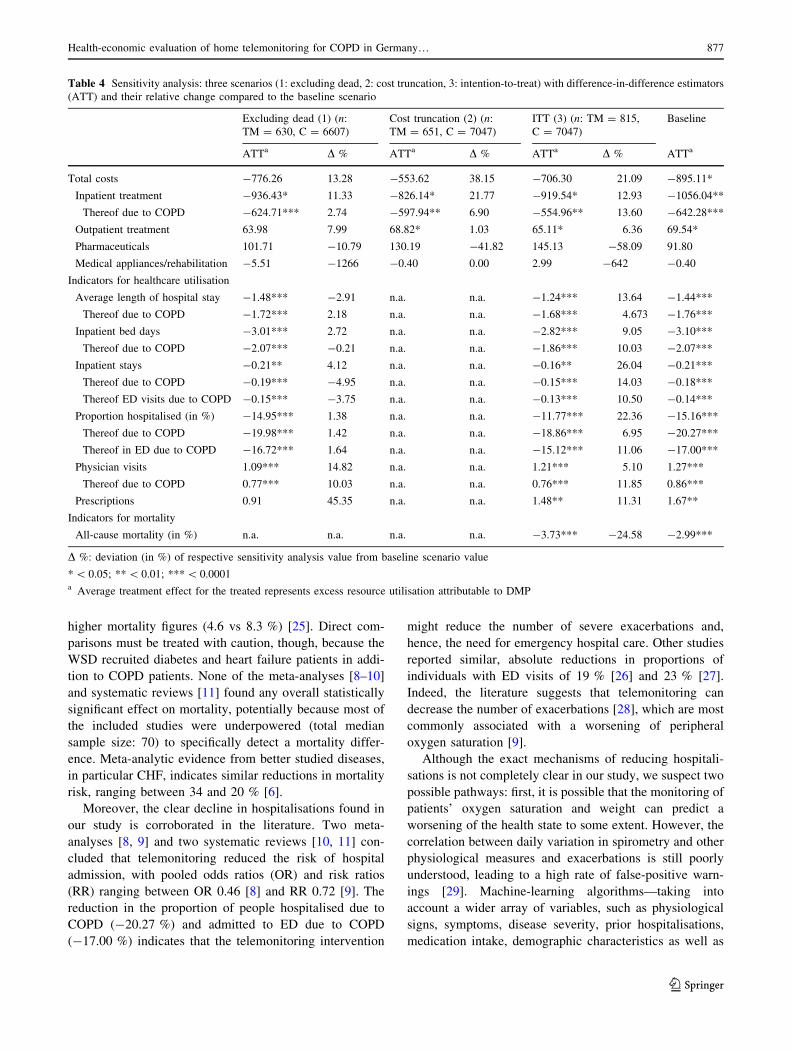
Sensitivity analysis
In all three sensitivity analysis scenarios [(1) excluding
dead individuals, (2) truncation, (3) ITT], telemonitoring
was 13.28–38.15 % less effective in reducing total costs
than in the baseline scenario (see Table 4) and the differ-
ences lost statistical significance [(1) -776.26 €,p = 0.074; (2) -553.62 €, p = 0.132; (3) -706.30 €,p = 0.089]. However, the reductions in all-cause [(1:
excluding dead): -936.43 €, p = 0.019; (2: truncation):
-826.14 €, p = 0.020; (3: ITT): -919.54 €, p = 0.014]
and COPD-related inpatient costs [(1: excluding dead):
-624.71 €, p = 0.001; (2: truncation): -597.94 €,p = 0.001; (3: ITT): -554.96 €, p = 0.003] remained
significant and stable in all scenarios. Relative changes to
baseline in all-cause and COPD-related costs ranged from
11.33 to 21.77 % and from 2.74 to 13.60 %, respectively.
For scenarios (1: excluding dead) and (3: ITT), direction,
magnitude and significance of differences in healthcare
utilisation continued to be very similar to the baseline
scenario. The mortality hazards ratio further declined in
favour of telemonitoring in the (3) ITT analysis (HR 0.40,
95 % CI 0.24–0.67).
Discussion
We demonstrated in this observational, population-based
cohort study that our 12-month telemonitoring intervention
for COPD entails a strong reduction in mortality (HR 0.51,
95 % CI 0.30–0.86), in total yearly costs by -895.11 €,driven by substantial savings in hospitalisation costs
(-1056.04 €), and in inpatient healthcare utilisation. Costs
(69.54 €) and number of outpatient visits (1.27) slightly
increased, though. In terms of ICER, telemonitoring is a
dominant technology compared to standard care.
The most striking finding in this study is the marked
positive impact telemonitoring had on mortality at
12 months (3.23 vs 6.22 %, p\ 0.0001; HR 0.51, 95 % CI
0.30–0.86). The largest RCT in telemonitoring, the Whole
System Demonstrator (WSD) project, found a very similar
mortality HR of 0.59 (95 % CI 0.43–0.80) with somewhat
Table 3 Difference-in-difference estimators (ATT) and their respective standard errors (SE) for two subgroup analyses: (1) COPD severity
[mild to moderate (FEV1 C 50 %) and severe to very severe (FEV1\ 50 %)], and (2) DMP COPD enrolment status
(1) Analysis by COPD severity (2) Analysis by DMP enrolment
Mild to moderate (FEV1
C 50 %) (n: TM = 157,
C = 1729)
Severe to very severe
(FEV1\ 50 %)
(n: TM = 419, C = 3027)
DMP enrolment (n:
TM = 405, C = 2619)
No DMP enrolment (n:
TM = 246, C = 4428)
ATTa SE ATTa SE ATTa SE ATTa SE
Total costs -1205 748 -519 625 -886 552 -662 726
Inpatient treatment -1468* 698 -607 573 -1051* 527 -913 643
Thereof due to COPD -23 292 -636* 269 -649* 266 -652** 226
Outpatient treatment 160* 69 37 47 64 38 83 68
Pharmaceuticals 24 78 84 161 141 112 98 131
Rehabilitation 79 99 -32 50 -40 48 69 79
Indicators for healthcare utilisation
Average length of hospital stay -1.59* 0.68 -1.23** 0.46 -1.79*** 0.45 -1.09* 0.55
Thereof due to COPD -0.71 0.56 -1.81*** 0.36 -2.03*** 0.38 -1.44** 0.45
Inpatient bed days -4.30** 1.44 -2.03 1.10 -3.00** 1.09 -2.90* 1.28
Thereof due to COPD -0.34 0.60 -2.22*** 0.55 -2.40*** 0.53 -1.65** 0.58
Inpatient stays -0.30** 0.11 -0.11 0.09 -0.19* 0.09 -0.26** 0.10
Thereof due to COPD -0.06 0.06 -0.17** 0.05 -0.20*** 0.05 -0.17** 0.05
Thereof ED visits due to COPD -0.09* 0.04 -0.13** 0.04 -0.14*** 0.04 -0.17*** 0.04
Proportion hospitalised (in %) -9.58* 4.83 -12.84*** 3.00 -16.65*** 3.13 -14.99*** 3.62
Thereof due to COPD -11.81* 5.29 -19.80*** 3.25 -21.51*** 3.38 -20.18*** 3.86
Thereof in ED due to COPD -10.71* 4.87 -17.40*** 3.22 -17.57*** 3.35 -18.08*** 3.62
Physician visits 1.55** 0.55 1.10*** 0.32 1.21*** 0.34 1.35*** 0.41
Thereof due to COPD 0.82*** 0.25 0.89*** 0.17 0.78*** 0.18 0.85*** 0.19
Prescriptions 2.67* 1.14 1.31 0.79 1.03 0.78 2.75** 0.97
Indicators for mortality
All-cause mortality (in %) -2.81* n.a. -3.65*** n.a. -3.26*** n.a. -2.31 n.a.
876 D. Achelrod et al.
123
higher mortality figures (4.6 vs 8.3 %) [25]. Direct com-
parisons must be treated with caution, though, because the
WSD recruited diabetes and heart failure patients in addi-
tion to COPD patients. None of the meta-analyses [8–10]
and systematic reviews [11] found any overall statistically
significant effect on mortality, potentially because most of
the included studies were underpowered (total median
sample size: 70) to specifically detect a mortality differ-
ence. Meta-analytic evidence from better studied diseases,
in particular CHF, indicates similar reductions in mortality
risk, ranging between 34 and 20 % [6].
Moreover, the clear decline in hospitalisations found in
our study is corroborated in the literature. Two meta-
analyses [8, 9] and two systematic reviews [10, 11] con-
cluded that telemonitoring reduced the risk of hospital
admission, with pooled odds ratios (OR) and risk ratios
(RR) ranging between OR 0.46 [8] and RR 0.72 [9]. The
reduction in the proportion of people hospitalised due to
COPD (-20.27 %) and admitted to ED due to COPD
(-17.00 %) indicates that the telemonitoring intervention
might reduce the number of severe exacerbations and,
hence, the need for emergency hospital care. Other studies
reported similar, absolute reductions in proportions of
individuals with ED visits of 19 % [26] and 23 % [27].
Indeed, the literature suggests that telemonitoring can
decrease the number of exacerbations [28], which are most
commonly associated with a worsening of peripheral
oxygen saturation [9].
Although the exact mechanisms of reducing hospitali-
sations is not completely clear in our study, we suspect two
possible pathways: first, it is possible that the monitoring of
patients’ oxygen saturation and weight can predict a
worsening of the health state to some extent. However, the
correlation between daily variation in spirometry and other
physiological measures and exacerbations is still poorly
understood, leading to a high rate of false-positive warn-
ings [29]. Machine-learning algorithms—taking into
account a wider array of variables, such as physiological
signs, symptoms, disease severity, prior hospitalisations,
medication intake, demographic characteristics as well as
Table 4 Sensitivity analysis: three scenarios (1: excluding dead, 2: cost truncation, 3: intention-to-treat) with difference-in-difference estimators
(ATT) and their relative change compared to the baseline scenario
Excluding dead (1) (n:
TM = 630, C = 6607)
Cost truncation (2) (n:
TM = 651, C = 7047)
ITT (3) (n: TM = 815,
C = 7047)
Baseline
ATTa D % ATTa D % ATTa D % ATTa
Total costs -776.26 13.28 -553.62 38.15 -706.30 21.09 -895.11*
Inpatient treatment -936.43* 11.33 -826.14* 21.77 -919.54* 12.93 -1056.04**
Thereof due to COPD -624.71*** 2.74 -597.94** 6.90 -554.96** 13.60 -642.28***
Outpatient treatment 63.98 7.99 68.82* 1.03 65.11* 6.36 69.54*
Pharmaceuticals 101.71 -10.79 130.19 -41.82 145.13 -58.09 91.80
Medical appliances/rehabilitation -5.51 -1266 -0.40 0.00 2.99 -642 -0.40
Indicators for healthcare utilisation
Average length of hospital stay -1.48*** -2.91 n.a. n.a. -1.24*** 13.64 -1.44***
Thereof due to COPD -1.72*** 2.18 n.a. n.a. -1.68*** 4.673 -1.76***
Inpatient bed days -3.01*** 2.72 n.a. n.a. -2.82*** 9.05 -3.10***
Thereof due to COPD -2.07*** -0.21 n.a. n.a. -1.86*** 10.03 -2.07***
Inpatient stays -0.21** 4.12 n.a. n.a. -0.16** 26.04 -0.21***
Thereof due to COPD -0.19*** -4.95 n.a. n.a. -0.15*** 14.03 -0.18***
Thereof ED visits due to COPD -0.15*** -3.75 n.a. n.a. -0.13*** 10.50 -0.14***
Proportion hospitalised (in %) -14.95*** 1.38 n.a. n.a. -11.77*** 22.36 -15.16***
Thereof due to COPD -19.98*** 1.42 n.a. n.a. -18.86*** 6.95 -20.27***
Thereof in ED due to COPD -16.72*** 1.64 n.a. n.a. -15.12*** 11.06 -17.00***
Physician visits 1.09*** 14.82 n.a. n.a. 1.21*** 5.10 1.27***
Thereof due to COPD 0.77*** 10.03 n.a. n.a. 0.76*** 11.85 0.86***
Prescriptions 0.91 45.35 n.a. n.a. 1.48** 11.31 1.67**
Indicators for mortality
All-cause mortality (in %) n.a. n.a. n.a. n.a. -3.73*** -24.58 -2.99***
D %: deviation (in %) of respective sensitivity analysis value from baseline scenario value
*\ 0.05; **\ 0.01; ***\ 0.0001a Average treatment effect for the treated represents excess resource utilisation attributable to DMP
Health-economic evaluation of home telemonitoring for COPD in Germany… 877
123

indicators for depression, anxiety or social isolation—
could boost telemonitoring’s predictive power in detecting
exacerbations [29]. Second, patients in our programme
received support and education on correct disease man-
agement, potentially allowing them to spot a COPD-related
worsening of their health in a more timely manner. It is
possible that patients learned to better adhere to their
medication regimen and, if they perceived the need, to
initiate pharmacological therapy with b2-adrenergic ago-
nists or corticosteroids. A tendency for increased spending
on medication (?92 €) as well as evidence on the positive
effect of self-management on medication intake in COPD
[30] support our hypothesis. Early patient recognition of
exacerbations and prompt treatment initiation are associ-
ated with reduced risk of hospitalisation and faster exac-
erbation recovery [31]. Both reduced risk of hospitalisation
and faster exacerbation recovery were also found in our
study, manifesting themselves in a reduced proportion of
patients with hospitalisations (-15.16 %) and a shorter
length of hospital stay (-1.44 days) in the intervention
group. This finding might suggest that individuals using
telemonitoring are hospitalised with less severe exacerba-
tions, potentially because they were recognised and treated
earlier.
Given the reductions in frequency and duration of hos-
pitalisations, which constituted 51 and 61 % of the total
costs in the follow-up period of intervention and control
group, respectively, overall costs were considerably lower
in the telemonitoring arm (-895.11 €). Savings in all-
cause and COPD-related hospital costs were insensitive to
model specifications and analysis methodologies. The
decrement in inpatient care seems to have been compen-
sated by higher use of outpatient services (69.54 €). Directcomparisons with other cost studies can hardly be drawn as
the telemonitoring technology itself as well as health sys-
tem-specific reimbursement may largely vary. Still, most
studies with a cost-assessment reported savings between 12
and 17 % in the telemonitoring group [32], which is similar
to the reduction of 11 % in the follow-up period of our
cohort.
Although irrelevant in this specific profit-sharing
agreement between the sickness fund and telemonitoring
provider, we underestimated the true costs of telemoni-
toring because we did not possess any information on the
costs of the programme (including investments and oper-
ating costs for software, hardware, personnel, administra-
tion). Consequently, it might take a few years until cost-
savings from less intense healthcare use compensate for the
technology investment. Given yearly telemonitoring fees of
677 € found in a Danish study [33], the sickness fund
would still save 218 € (=895–677) while still reducing
mortality. Even at a yearly telemonitoring service cost of
1000 € and a resulting increase in expenditure of 105 €
(=895–1000), the ICER would be highly cost-effective
with 191 € per life-year gained.
The subgroup analysis revealed that patients with (very)
severe COPD experienced greater reductions in mortality
as well as in cost, number and duration of COPD-related
hospitalisations than individuals with mild/moderate
COPD. This indicates, again, that telemonitoring may
effectively decrease the number of exacerbations that
require inpatient treatment. Because high-risk patients are
usually hospitalised more frequently, they have a greater
baseline potential for cutting hospitalisations and costs. A
high-quality RCT corroborated our findings, showing that
telemonitoring was less effective in curbing hospitalisation
rates for mild cases than for severe ones [34]. Similarly, a
study on telemonitoring in asthma found no improvements
in health outcomes in individuals with mild disease, but
showed a reduced risk of admission to hospital for high-
risk patients [35]. While savings in all-cause hospitalisa-
tions were considerable in the mild/moderate group
(-1468 €, p\ 0.05), the cost reduction in COPD-related
cost was not significant. Potential reasons for a lack of
statistically and clinically significant changes could be the
small sample size (TM; n = 157) as well as the fact that
COPD-related hospital costs constitute only roughly 28 %
of total inpatient costs in our mild/moderate sample. In line
with our data, the literature indicates that comorbidities,
such as ischemic heart failure or diabetes, are more
important drivers of hospitalisation costs in these patients
[36]. A positive spill-over effect of TM on the management
of concurrent diseases might be possible.
Another important finding of the subgroup analysis is
that telemonitoring continues to be cost-saving for COPD-
related hospitalisations, reduces healthcare utilisation and
still displays a trend for reduced mortality, even when
isolating its effect from additional interventions in usual
care, such as disease management programmes (DMPs).
The lack of statistical significance in some outcomes is
most likely due to decreased sample size, as controlling for
DMP participation in the baseline scenario still delivered
significant results. In most published studies, it was
impossible to disentangle the effect of telemonitoring from
usual care because the intervention group received
enhanced clinical care that could affect outcomes on its
own. For instance, care enhanced through the German
DMPs for COPD have been found to improve clinical
outcomes [37]. A recent randomised controlled trial (RCT)
in the UK, however, disentangled the effects of telemoni-
toring from the effect of the remaining elements of
healthcare service and concluded that telemonitoring was
not effective in reducing rates of/time to admission, neither
QoL [34]. The reasons for these diverging findings could
be rooted in differences in telemonitoring interventions
employed, as well as in the provision of standard care.
878 D. Achelrod et al.
123

Limitations
Our results should be interpreted in light of certain data-
related and methodological limitations. First, our admin-
istrative data provide only limited information on the
clinical progression of disease and on smoking status,
which are both predictors of health and cost outcomes
[1, 2]. Although COPD severity can be approximated in
our data by the fourth and fifth digits of the ICD code
(J44.XX), clinicians often do not precisely specify these
digits in everyday practice. Nor does our data indicate
whether telemonitoring simply shifts the burden and costs
of care away from the inpatient sector towards the patients
themselves or towards their family members and care-
givers. Moreover, we had no information on causes of
death which would have allowed disentangling the effect of
DMP on all-cause and COPD-specific mortality. Similarly,
we did not possess life-tables for COPD populations to
calculate the number of life-years gained. By using life-
tables from the general population, we might overestimate
the number of life-years gained for the telemonitoring
group. Overestimation is also a potential issue in the
budget impact analysis, because the AOK Bayern insured
population might be sicker than the average German pop-
ulation, hence inflating the percentage of patients eligible
for the TM. In addition, we might have underestimated the
number of outpatient physician visits in both groups due to
German medical coding modalities and reporting stan-
dards. The last data-related limitation is the fact that we
had no data to adjust for potentially diverging treatment
intensity in the TM group. Despite regularly scheduled
remote health examinations, some patients might have
participated with a higher adherence to the programme than
others. Second, the inferences from the entropy balancing
in this non-randomised study rely on the assumption that
all relevant patient-related covariates have been included
and that no unobserved confounders exist (‘unconfound-
edness assumption’) [38]. This assumption is not empiri-
cally testable because it is impossible to measure hidden
confounders. For instance, COPD patients participating in
the telemonitoring programme might be more motivated to
address their disease, have a healthier lifestyle or more
social support than those who did not enrol. In particular,
the final inclusion of the patients into the TM programme
was within the discretion of the TM provider, introducing a
potential source of selection bias. However, we minimised
the impact of potential hidden confounders by constructing
a DiD estimation framework, which even accounts for
unobserved differences. Moreover, we conducted an
extensive sensitivity analysis to verify the robustness of our
results.
Conclusion
This is the first German study to demonstrate that tele-
monitoring for COPD is a viable technology that reduces
mortality, healthcare costs and utilisation at 12 months.
Contrary to widespread fear, lowering the intensity of
care does not seem to impact unfavourably on health
outcomes. Subgroups with severe COPD benefit more
from the technology than patients with lighter forms of
the disease. It remains to be seen, however, whether these
positive results are constant over a longer observation
period. Future improvements in predicting exacerbations
through more powerful algorithms and the use of wear-
able and mobile devices will underpin the case for a
system-wide implementation of telemonitoring for COPD.
It should be stressed, however, that telemonitoring alone
will not suffice in providing high-quality treatment for
COPD patients. Instead, telemonitoring should be intro-
duced as a supporting component of integrated case
management, which approaches COPD and its comor-
bidities holistically.
Acknowledgments We would like to thank AOK Bayern and SHL
Telemedizin for providing access and support in obtaining the data.
Compliance with ethical standards
Funding TS and JS have received funding from AOK Bayern, a
sickness fund, and SHL Telemedizin, a provider of telemonitoring
services. The sponsors had no role in study design, analyses or
interpretation of results.
Conflict of interest JS and TS have received funding for conducting
the formal programme evaluation that this manuscript is based upon
from AOK Bayern, a sickness fund, and SHL Telemedizin, a com-
pany offering telemonitoring services.
Open Access This article is distributed under the terms of the
Creative Commons Attribution 4.0 International License (http://crea
tivecommons.org/licenses/by/4.0/), which permits unrestricted use,
distribution, and reproduction in any medium, provided you give
appropriate credit to the original author(s) and the source, provide a
link to the Creative Commons license, and indicate if changes were
made.
Appendix
See Table 5.
Health-economic evaluation of home telemonitoring for COPD in Germany… 879
123

Table 5 Elixhauser comorbidity groups, pharmacy-based metrics and other (disease-specific) variables before and after entropy balancing with
balance statistics
TM (in %) Control (in %) p valuea D-statisticb
Pre Post Pre Post Pre Post
Elixhauser comorbidity groups
(1) Congestive heart failure 31.49 36.17 31.49 \0.05 1 0.10 0.00
(2) Cardiac arrhythmias 19.97 25.43 19.97 \0.01 1 0.13 0.00
(3) Valvular disease 9.83 11.18 9.83 0.3272 1 0.04 0.00
(4) Pulmonary circulation disorders 9.22 10.00 9.22 0.5837 1 0.03 0.00
(5) Peripheral vascular disorders 22.43 21.58 22.43 0.6191 1 0.02 0.00
(6) Hypertension uncomplicated 72.20 74.37 72.20 0.2239 1 0.05 0.00
(7) Hypertension complicated 17.97 22.08 17.97 \0.05 1 0.10 0.00
(8) Paralysis 2.76 2.95 2.76 0.9034 1 0.01 0.00
(9) Other neurological disorders 3.99 3.89 3.99 0.833 1 0.01 0.00
(10) Chronic pulmonary disease 99.69 92.17 99.69 \0.001 1 0.39 0.00
(11) Diabetes uncomplicated 31.18 33.09 31.18 0.3377 1 0.04 0.00
(12) Diabetes complicated 13.21 14.52 13.21 0.382 1 0.04 0.00
(13) Hypothyroidism 18.43 17.17 18.43 0.4165 1 0.03 0.00
(14) Renal failure 13.06 19.74 13.06 \0.001 1 0.18 0.00
(15) Liver disease 21.51 18.93 21.51 0.1182 1 0.06 0.00
(16) Peptic ulcer disease excluding bleeding 2.46 2.26 2.46 0.6811 1 0.01 0.00
(17) AIDS/HIV 0.15 0.06 0.15 0.3572 1 0.03 0.00
(18) Lymphoma 0.00 0.00 0.00 – 1 – –
(19) Metastatic cancer 0.00 0.00 0.00 – – – –
(20) Solid tumor without metastasis 0.15 0.06 0.15 0.3572 1 0.03 0.00
(21) Rheumatoid arthritis 7.83 6.87 7.83 0.3347 1 0.04 0.00
(22) Coagulopathy 1.69 1.43 1.69 0.6059 1 0.02 0.00
(23) Obesity 31.80 24.98 31.80 \0.001 1 0.15 0.00
(24) Weight loss 4.76 4.19 4.76 0.4762 1 0.03 0.00
(25) Fluid and electrolyte disorders 27.80 30.41 27.80 0.1807 1 0.06 0.00
(26) Blood loss anemia 0.77 0.68 0.77 0.8021 1 0.01 0.00
(27) Deficiency anemias 4.45 5.12 4.45 0.5135 1 0.03 0.00
(28) Alcohol abuse 11.67 7.92 11.67 \0.01 1 0.13 0.00
(29) Drug abuse 3.38 2.27 3.38 0.0794 1 0.07 0.00
(30) Psychoses 2.30 2.23 2.30 0.8895 1 0.01 0.00
(31) Depression 34.41 28.93 34.41 \0.01 1 0.12 0.00
Pharmacy-based groups
(1) Antiplatelet 7.83 8.36 7.83 0.7106 1 0.02 0.00
(2) Anticoagulant 10.91 14.69 10.91 \0.01 1 0.11 0.00
(3) Epilepsy 10.29 9.21 10.29 0.3593 1 0.04 0.00
(4) Hypertension 18.59 19.74 18.59 0.5029 1 0.03 0.00
(5) HIV 0.15 0.10 0.15 0.507 1 0.02 0.00
(6) Tuberculosis 0.31 0.30 0.31 1 1 0.00 0.00
(7) Rheumatic conditions 64.06 46.20 64.06 \0.001 1 0.36 0.00
(8) Hyperlipidemia 34.56 32.60 34.56 0.3156 1 0.04 0.00
(9) Malignancies 0.31 0.27 0.31 0.6965 1 0.01 0.00
(10) Parkinson’s disease 2.00 2.51 2.00 0.5088 1 0.03 0.00
(11) Renal disease 0.61 0.92 0.61 0.6609 1 0.04 0.00
(12) End stage renal disease (ESRD) 0.31 0.44 0.31 1 1 0.02 0.00
(13) Anti-arrhythmic 2.00 6.29 2.00 \0.001 1 0.22 0.00
880 D. Achelrod et al.
123

References
1. Decramer, M., Janssens, W., Miravitlles, M.: Chronic obstructive
pulmonary disease. Lancet 379, 1341–1351 (2012)
2. Menn, P., Heinrich, J., Huber, R.M., Jorres, R.A., John, J., Kar-
rasch, S., Peters, A., Schulz, H., Holle, R.: KORA Study Group:
direct medical costs of COPD—an excess cost approach based on
two population-based studies. Respir. Med. 106, 540–548 (2012)
3. Geldmacher, H., Biller, H., Herbst, A., Urbanski, K., Allison, M.,
Buist, A.S., Hohlfeld, J.M., Welte, T.: The prevalence of chronic
obstructive pulmonary disease (COPD) in Germany. Results of
the BOLD study. Dtsch. Med. Wochenschr. 133, 2609–2614
(2008)
4. Pritzkuleit, R., Beske, F., Katalinic, A.: Disease numbers in
pneumology—a projection to 2060. Pneumologie 64, 535–540(2010)
5. Mathers, C.D., Loncar, D.: Projections of global mortality and
burden of disease from 2002 to 2030. PLoS Med. 3, e442
(2006)
6. Achelrod, D.: Policy expectations and reality of telemedicine—a
critical analysis of health care outcomes, costs and acceptance for
congestive heart failure. J. Telemed. Telecare 20, 192–200 (2014)7. Bolton, C.E., Waters, C.S., Peirce, S., Elwyn, G.: EPSRC and
MRC Grand Challenge Team: insufficient evidence of benefit: a
systematic review of home telemonitoring for COPD. J. Eval.
Clin. Pract. 17, 1216–1222 (2011)
Table 5 continued
TM (in %) Control (in %) p valuea D-statisticb
Pre Post Pre Post Pre Post
(14) Ischemic heart disease/angina 7.07 9.47 7.07 \0.05 1 0.09 0.00
(15) Congestive heart failure 66.67 70.71 66.67 \0.05 1 0.09 0.00
(16) Diabetes 20.74 21.14 20.74 0.841 1 0.01 0.00
(17) Glaucoma 3.53 4.56 3.53 0.2746 1 0.05 0.00
(18) Liver failure 0.31 0.71 0.31 0.3184 1 0.06 0.00
(19) Acid peptic disease 62.67 56.62 62.67 \0.01 1 0.12 0.00
(20) Transplantation 0.92 0.75 0.92 0.635 1 0.02 0.00
(21) Respiratory illness, asthma 98.62 83.77 98.62 \0.001 1 0.54 0.00
(22) Thyroid disorders 22.12 19.98 22.12 0.2017 1 0.05 0.00
(23) Gout 15.51 16.62 15.51 0.5081 1 0.03 0.00
(24) Inflammatory bowel disease, chronic 1.23 0.70 1.23 0.1453 1 0.05 0.00
(25) Pain and inflammation 61.14 55.54 61.14 \0.01 1 0.11 0.00
(26) Pain 19.66 17.95 19.66 0.2872 1 0.04 0.00
(27) Depression 30.72 24.66 30.72 \0.001 1 0.14 0.00
(28) Psychotic illness 6.61 5.35 6.61 0.1762 1 0.05 0.00
(29) Bipolar disorders 0.31 0.21 0.31 0.6501 1 0.02 0.00
(30) Anxiety and tension 11.67 11.31 11.67 0.796 1 0.01 0.00
(31) Hepatitis 0.00 0.09 0.00 1 1 0.04 0.00
(32) Ischemic heart disease 51.15 54.99 51.15 0.0641 1 0.08 0.00
Other matching variables
Female (in %) 43.93 49.17 43.93 \0.05 1 0.11 0.00
Age 64.24 69.47 64.24 \0.001 1 0.49 0.00
Tobacco addiction 39.63 23.64 39.63 \0.001 1 0.35 0.00
FEV1 values
FEV1 C 70 % 6.91 7.25 6.91 0.8125 1 0.01 0.00
70 %[FEV1 C 50 % 17.20 17.28 17.20 1 1 0.00 0.00
50 %[FEV1 C 35 % 24.73 17.75 24.73 \0.001 1 0.17 0.00
FEV1\ 35 % 39.63 25.20 39.63 \0.001 1 0.31 0.00
FEV unknown 11.52 32.51 11.52 \0.001 1 0.52 0.00
DMP enrolment 62.21 37.16 62.21 \0.001 1 0.52 0.00
Insurance status
Mandatory 29.03 21.77 29.03 \0.001 1 0.17 0.00
Pensionary 64.98 71.69 64.98 \0.001 1 0.14 0.00
Voluntary 5.99 6.54 5.99 0.6774 1 0.02 0.00
Health-economic evaluation of home telemonitoring for COPD in Germany… 881
123

8. McLean, S., Nurmatov, U., Liu, J.L.Y., Pagliari, C., Car, J.,
Sheikh, A.: Telehealthcare for chronic obstructive pulmonary
disease: Cochrane review and meta-analysis. Br. J. Gen. Pract.
62, e739–e749 (2012)
9. Cruz, J., Brooks, D., Marques, A.: Home telemonitoring effec-
tiveness in COPD: a systematic review. Int. J. Clin. Pract. 68,369–378 (2014)
10. Polisena, J., Tran, K., Cimon, K., Hutton, B., McGill, S., Palmer,
K., Scott, R.E.: Home telehealth for chronic obstructive pul-
monary disease: a systematic review and meta-analysis.
J. Telemed. Telecare 16, 120–127 (2010)
11. Pedone, C., Lelli, D.: Systematic review of telemonitoring in
COPD: an update. Pneumonol. Alergol. Pol. 83, 476–484 (2015)
12. Henderson, C., Knapp, M., Fernandez, J.-L., Beecham, J., Hirani,
S.P., Cartwright, M., Rixon, L., Beynon, M., Rogers, A., Bower,
P., Doll, H., Fitzpatrick, R., Steventon, A., Bardsley, M., Hendy,
J., Newman, S.P.: Whole system demonstrator evaluation team:
cost effectiveness of telehealth for patients with long-term con-
ditions (Whole Systems Demonstrator telehealth questionnaire
study): nested economic evaluation in a pragmatic, cluster ran-
domised controlled trial. BMJ 346, f1035 (2013)
13. Stoddart, A., van der Pol, M., Pinnock, H., Hanley, J.,
McCloughan, L., Todd, A., Krishan, A., McKinstry, B.: Tele-
monitoring for chronic obstructive pulmonary disease: a cost and
cost-utility analysis of a randomised controlled trial. J. Telemed.
Telecare 21, 108–118 (2015)
14. Hofer, F., Achelrod, D., Stargardt, T.: Cost-utility analysis of
telemonitoring interventions for patients with chronic obstructive
pulmonary disease (COPD) in Germany. Appl. Health Econ.
Health Policy (2016). doi:10.1007/s40258-016-0267-9
15. Federal Statistical Office: Population and employment—life
table Germany 2009/11. Federal Statistical Office, Wiesbaden
(2013)
16. Hainmueller, J.: Entropy balancing for causal effects: a multi-
variate reweighting method to produce balanced samples in
observational studies. Polit. Anal. 20, 25–46 (2012)
17. Austin, P.C.: Balance diagnostics for comparing the distribution
of baseline covariates between treatment groups in propensity-
score matched samples. Stat. Med. 28, 3083–3107 (2009)
18. Bertrand, M., Duflo, E., Mullainathan, S.: How much should we
trust differences-in-differences estimates? Q. J. Econ. 119,249–275 (2004)
19. Ringbaek, T., Seersholm, N., Viskum, K.: Standardised mortality
rates in females and males with COPD and asthma. Eur. Respir. J.
25, 891–895 (2005)
20. Elixhauser, A., Steiner, C., Harris, D.R., Coffey, R.M.: Comor-
bidity measures for use with administrative data. Med. Care 36,8–27 (1998)
21. Kuo, R.N., Dong, Y.-H., Liu, J.-P., Chang, C.-H., Shau, W.-Y.,
Lai, M.-S.: Predicting healthcare utilization using a pharmacy-
based metric with the WHO’s anatomic therapeutic chemical
algorithm. Med. Care 49, 1031–1039 (2011)
22. Austin, P.C., Stanbrook, M.B., Anderson, G.M., Newman, A.,
Gershon, A.S.: Comparative ability of comorbidity classification
methods for administrative data to predict outcomes in patients
with chronic obstructive pulmonary disease. Ann. Epidemiol. 22,881–887 (2012)
23. Quan, H., Sundararajan, V., Halfon, P., Fong, A., Burnand, B.,
Luthi, J.-C., Saunders, L.D., Beck, C.A., Feasby, T.E., Ghali,
W.A.: Coding algorithms for defining comorbidities in ICD-9-
CM and ICD-10 administrative data. Med. Care 43, 1130–1139(2005)
24. Ten Have, T.R., Normand, S.L.T., Marcus, S.M., Brown, C.H.,
Lavori, P., Duan, N.: Intent-to-treat vs. non-intent-to-treat anal-
yses under treatment non-adherence in mental health randomized
trials. Psychiatr. Ann. 38, 772–783 (2008)
25. Steventon, A., Bardsley, M., Billings, J., Dixon, J., Doll, H.,
Hirani, S., Cartwright, M., Rixon, L., Knapp, M., Henderson, C.,
Rogers, A., Fitzpatrick, R., Hendy, J., Newman, S.: Whole system
demonstrator evaluation team: effect of telehealth on use of
secondary care and mortality: findings from the Whole System
Demonstrator cluster randomised trial. BMJ 344, e3874 (2012)
26. De Toledo, P., Jimenez, S., del Pozo, F., Roca, J., Alonso, A.,
Hernandez, C.: Telemedicine experience for chronic care in
COPD. IEEE Trans. Inf Technol. Biomed. 10, 567–573 (2006)
27. Bourbeau, J., Julien, M., Maltais, F., Rouleau, M., Beaupre, A.,
Begin, R., Renzi, P., Nault, D., Borycki, E., Schwartzman, K.,
Singh, R., Collet, J.-P.: Chronic Obstructive Pulmonary Disease
axis of the Respiratory Network Fonds de la Recherche en Sante
du Quebec: reduction of hospital utilization in patients with
chronic obstructive pulmonary disease: a disease-specific self-
management intervention. Arch. Intern. Med. 163, 585–591
(2003)
28. Trappenburg, J.C.A., Niesink, A., de Weert-van Oene, G.H., van
der Zeijden, H., van Snippenburg, R., Peters, A., Lammers, J.-
W.J., Schrijvers, A.J.P.: Effects of telemonitoring in patients with
chronic obstructive pulmonary disease. Telemed. J. E Health 14,138–146 (2008)
29. McKinstry, B.: The use of remote monitoring technologies in
managing chronic obstructive pulmonary disease. QJM 106,883–885 (2013)
30. Zwerink, M., Brusse-Keizer, M., van der Valk, P.D.L.P.M.,
Zielhuis, G.A., Monninkhof, M., van der Palen, J., Frith, P.A.,
Effing, T.: Self management for patients with chronic obstructive
pulmonary disease. Cochrane Database Syst. Rev. 3, CD002990(2014)
31. Wilkinson, T.M.A., Donaldson, G.C., Hurst, J.R., Seemungal,
T.A.R., Wedzicha, J.A.: Early therapy improves outcomes of
exacerbations of chronic obstructive pulmonary disease. Am.
J. Respir. Crit. Care Med. 169, 1298–1303 (2004)
32. Pare, G., Poba-Nzaou, P., Sicotte, C., Beaupre, A., Lefrancois, E.,
Nault, D., Saint-Jules, D.: Comparing the costs of home tele-
monitoring and usual care of chronic obstructive pulmonary
disease patients: a randomized controlled trial. Eur. Res. Tele-
med. 2, 35–47 (2013)
33. Haesum, L.K.E., Soerensen, N., Dinesen, B., Nielsen, C., Grann,
O., Hejlesen, O., Toft, E., Ehlers, L.: Cost-utility analysis of a
telerehabilitation program: a case study of COPD patients. Tel-
emed. J. E Health 18, 688–692 (2012)
34. Pinnock, H., Hanley, J., McCloughan, L., Todd, A., Krishan, A.,
Lewis, S., Stoddart, A., van der Pol, M., MacNee, W., Sheikh, A.,
Pagliari, C., McKinstry, B.: Effectiveness of telemonitoring
integrated into existing clinical services on hospital admission for
exacerbation of chronic obstructive pulmonary disease:
researcher blind, multicentre, randomised controlled trial. BMJ
347, f6070 (2013)
35. McLean, S., Chandler, D., Nurmatov, U., Liu, J., Pagliari, C.,
Car, J., Sheikh, A.: Telehealthcare for asthma: a Cochrane
review. CMAJ 183, E733–E742 (2011)
36. Anthonisen, N.R., Connett, J.E., Enright, P.L., Manfreda, J.:
Lung Health Study Research Group: hospitalizations and mor-
tality in the Lung Health study. Am. J. Respir. Crit. Care Med.
166, 333–339 (2002)
37. Achelrod, D., Welte, T., Schreyogg, J., Stargardt, T.: Costs and
outcomes of the German disease management programme (DMP)
for chronic obstructive pulmonary disease (COPD)—a large
population-based cohort study. Health Policy (2016). doi:10.
1016/j.healthpol.2016.08.002 (in press)38. Rubin, D.B.: Formal mode of statistical inference for causal
effects. J. Stat. Plan. Inference. 25, 279–292 (1990)
882 D. Achelrod et al.
123