Health Economic Assessment Tool for walking & cycling …€¦ · Luc Int Panis, Michelle Laeremans...
70
HEALTH ECONOMIC ASSESSMENT TOOL FOR WALKING & CYCLING Luc Int Panis, Michelle Laeremans, Evi Dons & Jurgen Buekers 28/02/2018 CYCLE HIGHWAY ACADEMY Essen ©VITO – Not for distribution 1
Transcript of Health Economic Assessment Tool for walking & cycling …€¦ · Luc Int Panis, Michelle Laeremans...
HEALTH ECONOMIC ASSESSMENT
TOOL FOR WALKING & CYCLING
Luc Int Panis, Michelle Laeremans, Evi Dons & Jurgen Buekers
28/02/2018 CYCLE HIGHWAY ACADEMY Essen©VITO – Not for distribution 1
2
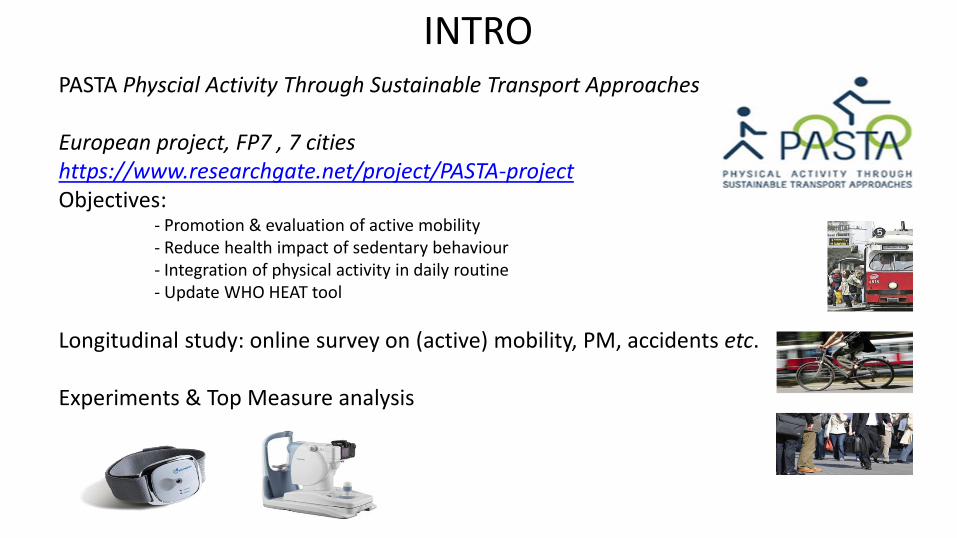
PASTA Physcial Activity Through Sustainable Transport Approaches
European project, FP7 , 7 citieshttps://www.researchgate.net/project/PASTA-projectObjectives:
- Promotion & evaluation of active mobility- Reduce health impact of sedentary behaviour- Integration of physical activity in daily routine- Update WHO HEAT tool
Longitudinal study: online survey on (active) mobility, PM, accidents etc.
Experiments & Top Measure analysis
INTRO


AGENDA
Inactivity: a global health hazardHealth Economic Assessment for walking & cycling•Why?•What do we need?•Relative risks & dose-response functions•Monetary values for health
Case studies & available models- The Health Economic Assessment Tool (HEAT) for walking & cycling- Flemish model (CWIcalc)
Summary & conclusions

PHYSICAL INACTIVITY:A GLOBAL HEALTH HAZARD
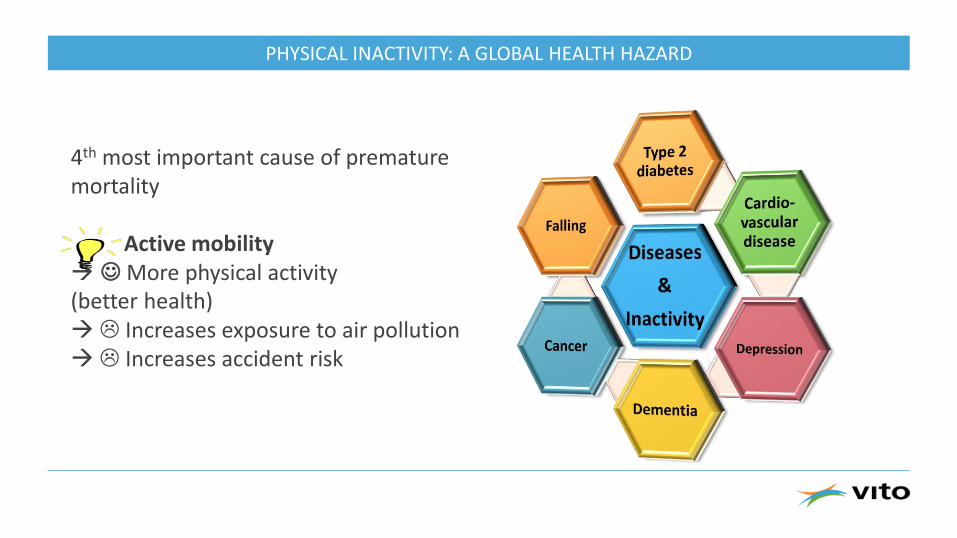
PHYSICAL INACTIVITY: A GLOBAL HEALTH HAZARD
4th most important cause of premature mortality
Active mobilityMore physical activity(better health) Increases exposure to air pollution Increases accident risk
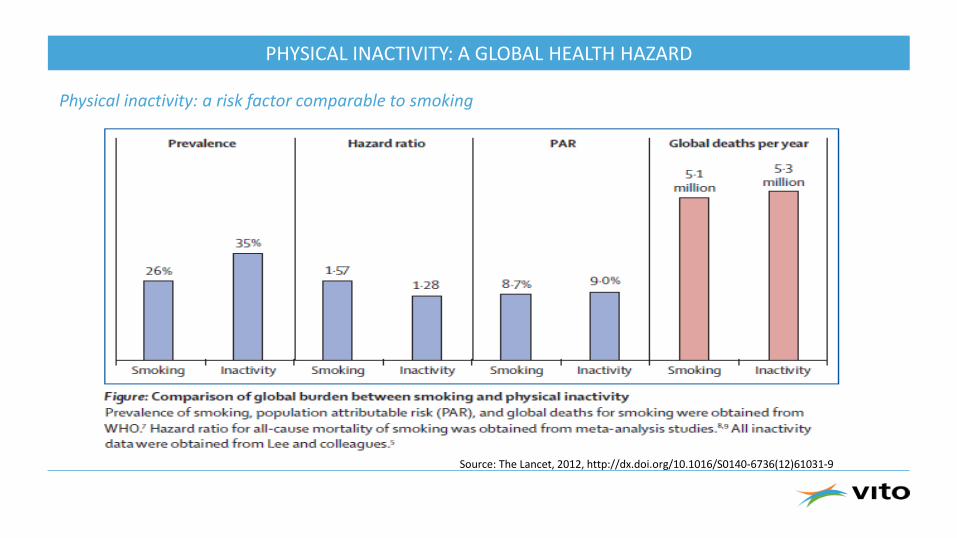
PHYSICAL INACTIVITY: A GLOBAL HEALTH HAZARD
Physical inactivity: a risk factor comparable to smoking
Source: The Lancet, 2012, http://dx.doi.org/10.1016/S0140-6736(12)61031-9

PHYSICAL INACTIVITY: A GLOBAL HEALTH HAZARD
Impacts on health in Flanders
Risk DALYs
(avg/year)
Healthy life years lost (per capita)
Smoking 144687 1.9
Obesity 94750 1.3
Air pollution (PM) 79000 1.1
Physical inactivity 54134 0.7
Hypertension 53690 0.7
Traffic accidents* 36476 0.5
High holesterol 27930 0.4
Alcohol 10113 0.1
Passive smoking 6600 0.1
Tuberculosis <1000 <0.01
Hepatitis B <1000 <0.01
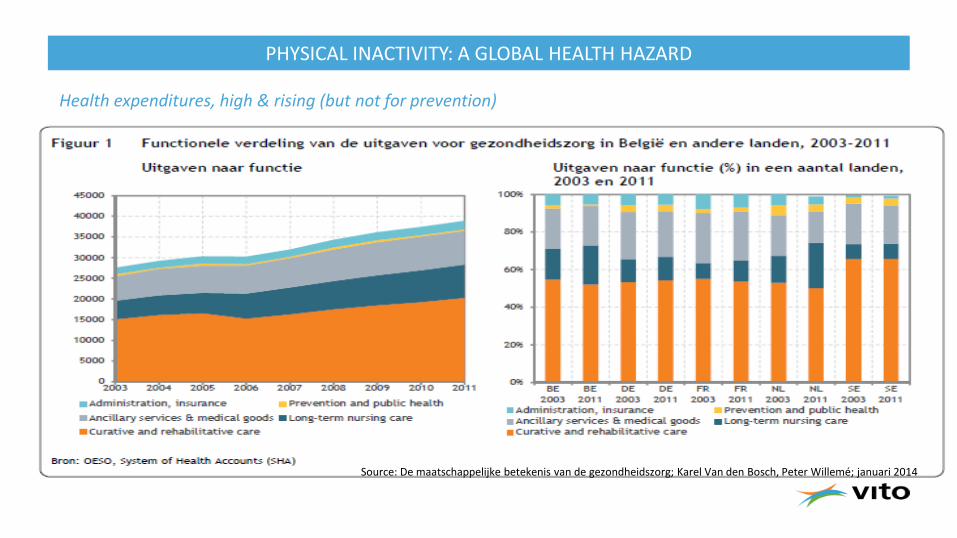
PHYSICAL INACTIVITY: A GLOBAL HEALTH HAZARD
Health expenditures, high & rising (but not for prevention)
Source: De maatschappelijke betekenis van de gezondheidszorg; Karel Van den Bosch, Peter Willemé; januari 2014

THE HEALTH ECONOMICASSESSMENT TOOL FOR
WALKING & CYCLING (HEAT)

HEALTH ECONOMIC ASSESSMENT TOOL (HEAT) FOR WALKING & CYCLING: A COLLABORATIVE PROJECT
Harry Rutter, Francesca Racioppi, Sonja Kahlmeier, Nick Cavill, Pekka Oja, Heini Sommer, Hywell Dinsdale, Charlie Foster, Paul Kelly, ThomasGötschi, Christian Schweizer
Karim Abu-Omar, Lars Bo Andersen, Finn Berggren , Tegan Boehmer, Nils-Axel Braathen, Dushy Clarke, Andy Cope, Audrey de Nazelle, Mark Fenton, Jonas Finger, Richard Fordham, Eszter Füzeki, Frank George, Regine Gerike, Mark Hamer, Max Herry, Marie-Eve Heroux, Michal
Krzyzanowski, I-Min Lee, Christoph Lieb, Brian Martin, Markus Maybach, Christoph Schreyer, Marie Murphy, Nanette Mutrie, Luc Int Panis,Laura Perez, Gabe Rousseau, David Rojas Rueda, Candace Rutt, Tom Schmid, Elin Sandberg, Mulugeta Yilma, Daniel Sauter, Peter Schantz,
Peter Schnohr, Dave Stone, Jan Sørensen, Gregor Starc, James Woodcock, Wanda Wendel Vos, Paul Wilkinson

HEAT FOR WALKING & CYCLING: WHY & HOW?
HEAT 12
Need for integration between different policy domains(transport, urban planning, health, etc.)
HEAT: User friendly tool to estimate economic value of health benefits of cycling & walking
Answer the question: “For a given volume of walking or cycling
what is the economic value of the health benefits?”
Inputs:•Data on ‘volume’ of walking or cycling•How many people?•Which people?•How far/often?

Input required
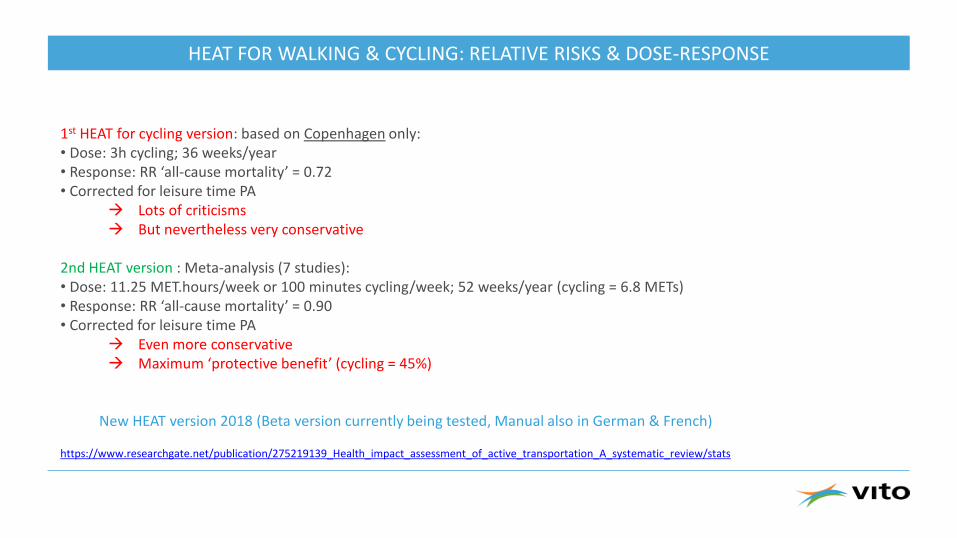
HEAT FOR WALKING & CYCLING: RELATIVE RISKS & DOSE-RESPONSE
1st HEAT for cycling version: based on Copenhagen only: • Dose: 3h cycling; 36 weeks/year• Response: RR ‘all-cause mortality’ = 0.72• Corrected for leisure time PA
Lots of criticisms But nevertheless very conservative
2nd HEAT version : Meta-analysis (7 studies): • Dose: 11.25 MET.hours/week or 100 minutes cycling/week; 52 weeks/year (cycling = 6.8 METs)• Response: RR ‘all-cause mortality’ = 0.90• Corrected for leisure time PA
Even more conservative Maximum ‘protective benefit’ (cycling = 45%)
New HEAT version 2018 (Beta version currently being tested, Manual also in German & French)
https://www.researchgate.net/publication/275219139_Health_impact_assessment_of_active_transportation_A_systematic_review/stats
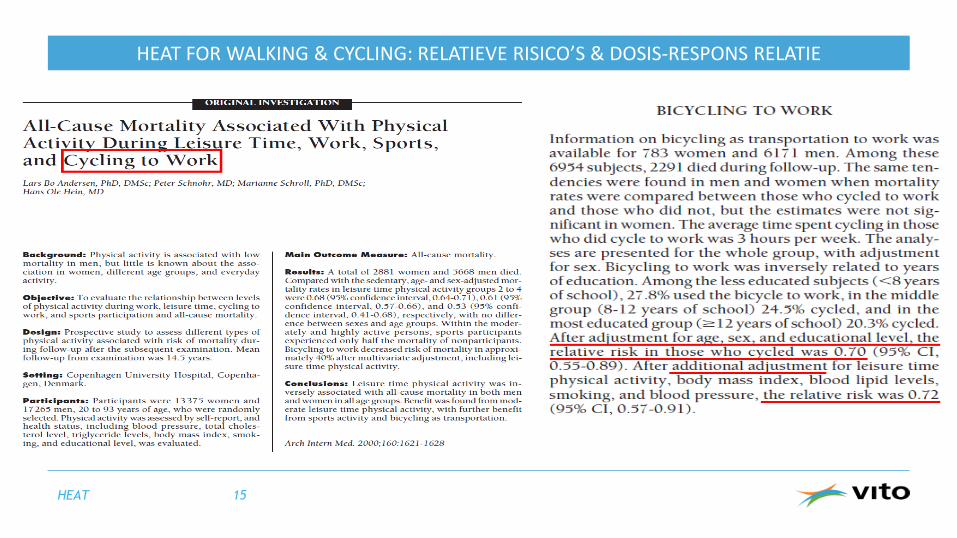
HEAT FOR WALKING & CYCLING: RELATIEVE RISICO’S & DOSIS-RESPONS RELATIE
HEAT 15

HEAT FOR WALKING & CYCLING: MONETARY VALUATION OF HEALTH BENEFITS
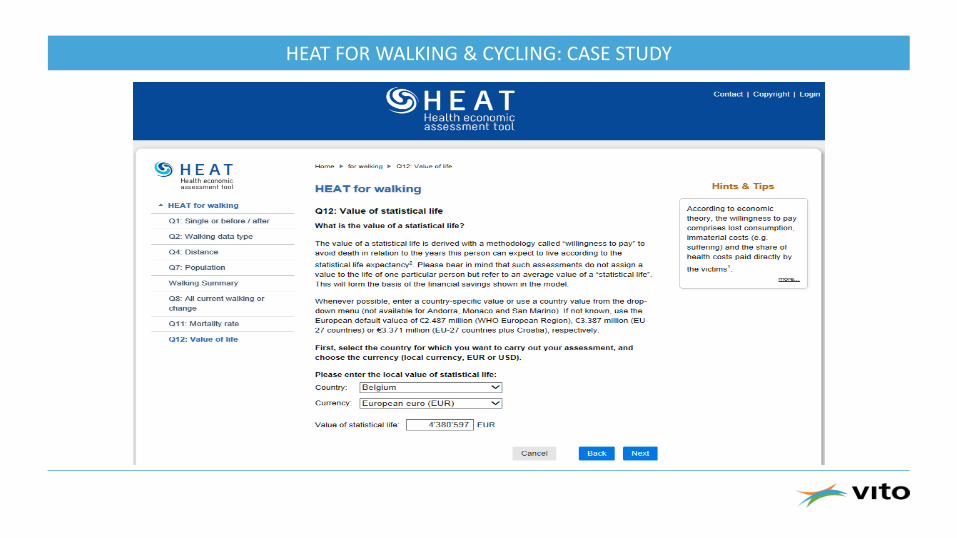
‘Value of a Statistical Life’ (VSL)• ‘willingness to pay’ to reduce mortality risk e.g. from 3/10000 to 2/10000?• Different for each country
Should be discounted
WHO European region average 2 587 175 EUR
België 4 380 597 EUR
Hongarije 1 576 768 EUR

HEAT FOR WALKING & CYCLING:WHAT IS/WAS MISSING?
HEAT 17
• Interaction between transport related PA & air pollution• Accidents/crashes• Morbidity• Climate• Noise• Social• …

HIGH AIRPOLLUTION CONCENTRATIONON CYCLE LANES
Near “park”
(Louisa Square, KDG avenue)
“Busy street canyon” rue de la Loi
“Quiet street” (rue Jozef II)

ACCIDENTS/CRASHES
19

HEAT FOR WALKING & CYCLING: WHAT IS/WAS MISSING?
20

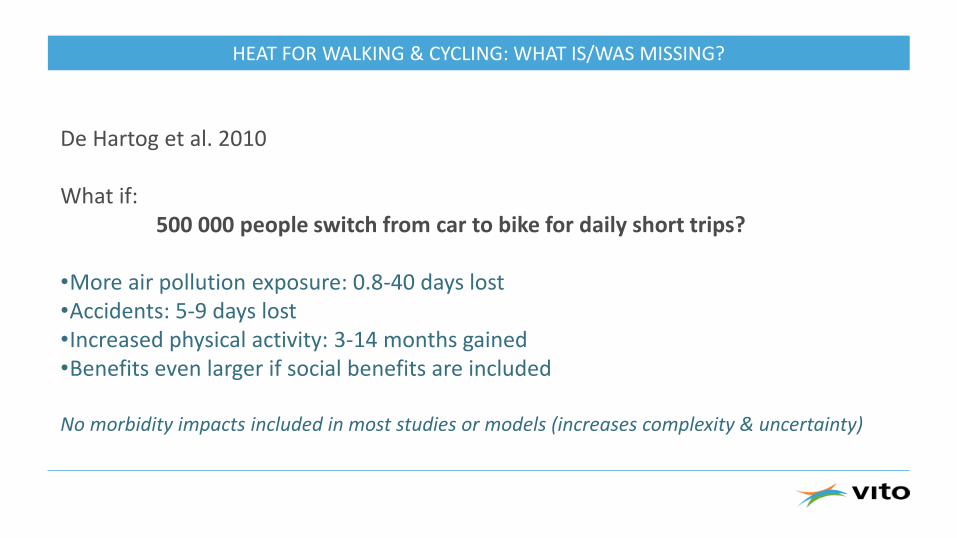
HEAT FOR WALKING & CYCLING: WHAT IS/WAS MISSING?
De Hartog et al. 2010
What if: 500 000 people switch from car to bike for daily short trips?
•More air pollution exposure: 0.8-40 days lost•Accidents: 5-9 days lost•Increased physical activity: 3-14 months gained•Benefits even larger if social benefits are included
No morbidity impacts included in most studies or models (increases complexity & uncertainty)

HEAT FOR WALKING & CYCLING: AIR POLLUTION IS HARD TO EXTRAPOLATE
Source: Presentation of Aphekom findings at the Policy Workshop: EU Year of Air – how can we reduce air pollution to improve health? 13 September 2012, Brussels, Belgium, http://www.aphekom.org/c/document_library/get_file?uuid=e5e5777f-968c-484c-8a51-652f132030c7&groupId=10347

AIR POLLUTION IS USUALLY NOT A PROBLEM IN EUROPE
Woodcock, Tainio et alhttps://ig.ft.com/sites/urban-cycling/

HEAT FOR WALKING & CYCLING: CONCRETE
What?•Planning of new projects (infrastructure or other)•Monetise health benefits of estimated use
•Evaluation of finished projects•Monetise health benefits of observed change in use
As part of general economic evaluation of transportation projects(e.g. relative to cost of investment, ROI, …)

CASE STUDIES

HEAT FOR WALKING & CYCLING: CASE STUDY
http://oldheatwalkingcycling.org
Example 1: Cycling bridge over ring road in AntwerpConnects Bicycle highway F1 (Antwerpen-Mechelen) withBerchem train station and city center.
Expectations:• New cyclists• Safer• Faster (traffic lights)
HEAT FOR WALKING & CYCLING: CASE STUDY
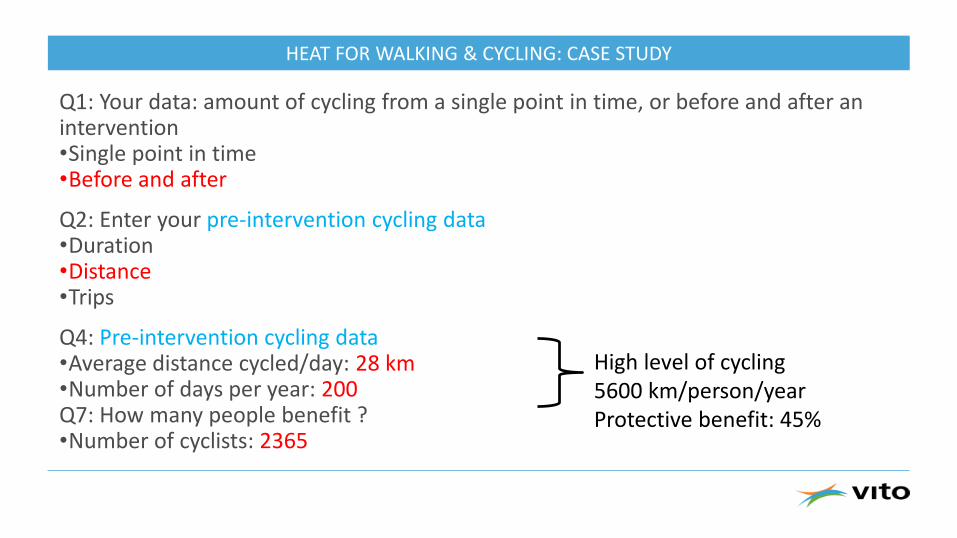
Q1: Your data: amount of cycling from a single point in time, or before and after an intervention•Single point in time•Before and after
Q2: Enter your pre-intervention cycling data•Duration •Distance •Trips
Q4: Pre-intervention cycling data•Average distance cycled/day: 28 km •Number of days per year: 200Q7: How many people benefit ?•Number of cyclists: 2365
High level of cycling5600 km/person/yearProtective benefit: 45%

HEAT FOR WALKING & CYCLING: CASE STUDY
Q2: Enter your post-intervention cycling data•Duration •Distance •Trips Q4: Post-intervention cycling data•Average distance cycled/day: 28 km •Number of days per year: 200• Q7: How many people benefit•Number of cyclists: 2601
High level of cycling5600 km/person/yearProtective benefit: 45%

HEAT FOR WALKING & CYCLING: CASE STUDY
• Q9: How much of the change is attributed to the intervention•Proportion: 100%
Q10: Time needed to reach full level of cycling•Years: 1 year
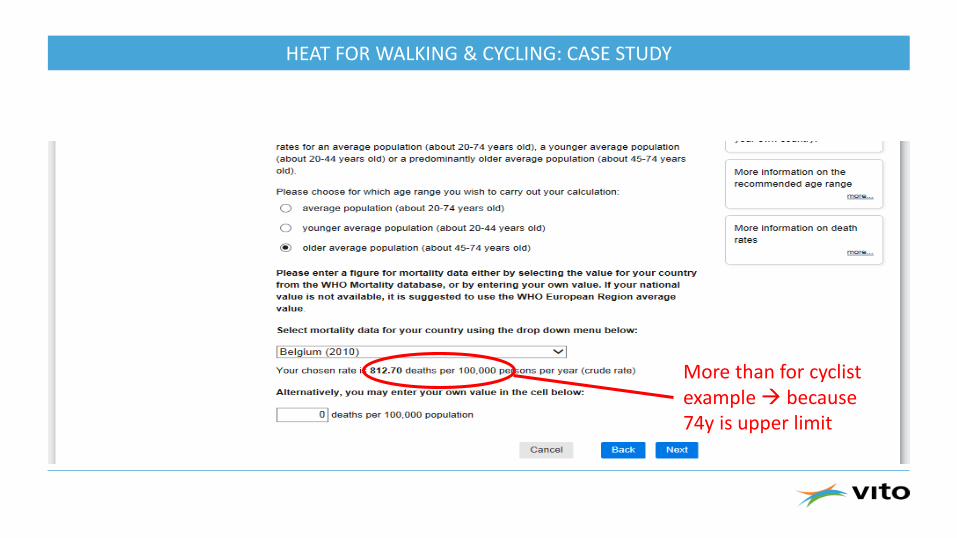
• Q11: mortality rate• Age
•Average population (20-64 years old)•Younger average population (20-44 years old)•Older average population (45-64 years old)
•Country mortality data: Belgium (524 deaths/100000 persons/year)

HEAT FOR WALKING & CYCLING: CASE STUDY
• Q9: How much of the change is attributed to the intervention•Proportion: 100%
Q10: Time needed to reach full level of cycling•Years: 1 year
• Q11: mortality rate• Age
•Average population (20-64 years old)•Younger average population (20-44 years old)•Older average population (45-64 years old)
•Country mortality data: Belgium (524 deaths/100000 persons/year)

HEAT FOR WALKING & CYCLING: CASE STUDY
Q12: Value of a statistical life?•Belgium (4 380 597 Euro)• Q13: Time period over which benefits are calculated?•Years: 10 years• Q14: Costs to include a benefit-cost ratio in the HEAT calculation?•Yes•NoQ15: Cost associated with promoting cycling?
• Total costs: 4 000 000 Euro• Duration to calculate benefit-cost ratio: 10 years (standard this is
equal to Q13)Q16: Discount rate to apply to future benefits: 5%

HEAT FOR WALKING & CYCLING: CASE STUDY

HEAT FOR WALKING & CYCLING: CASE STUDY
HEAT FOR WALKING & CYCLING: CASE STUDY

HEAT FOR WALKING & CYCLING: CASE STUDY
http://oldheatwalkingcycling.org
Example 2: Estimate the value of the present level of walkingon an existing trail in Belgium.
100 elderly people walk 3 km every day
What is the value of that level of physical activity over 10 years?

HEAT FOR WALKING & CYCLING: CASE STUDY

HEAT FOR WALKING & CYCLING: CASE STUDY

HEAT FOR WALKING & CYCLING: CASE STUDY

HEAT FOR WALKING & CYCLING: CASE STUDY

HEAT FOR WALKING & CYCLING: CASE STUDY

HEAT FOR WALKING & CYCLING: CASE STUDY

HEAT FOR WALKING & CYCLING: CASE STUDY
HEAT FOR WALKING & CYCLING: CASE STUDY
More than for cyclistexample because74y is upper limit
HEAT FOR WALKING & CYCLING: CASE STUDY

HEAT FOR WALKING & CYCLING: CASE STUDY

HEAT FOR WALKING & CYCLING: CASE STUDY

HEAT FOR WALKING & CYCLING: CASE STUDY

HEAT FOR WALKING & CYCLING: CASE STUDY

SUMMARY & CONCLUSION
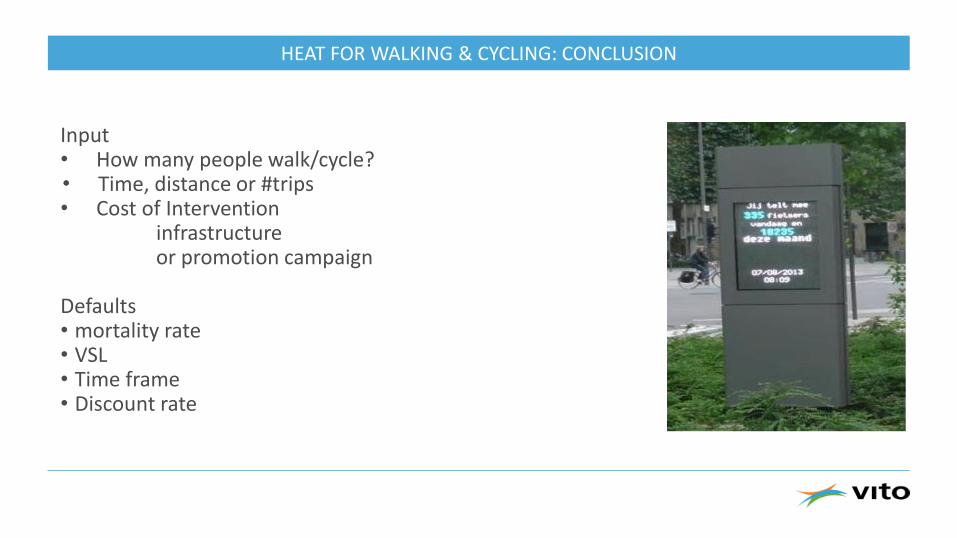
HEAT FOR WALKING & CYCLING: CONCLUSION
Input• How many people walk/cycle?• Time, distance or #trips• Cost of Intervention
infrastructureor promotion campaign
Defaults• mortality rate• VSL• Time frame• Discount rate

Output ‘Protective benefit’ Average benefit per year (key output) Over longer period
(default = 10 years) Discounted benefit per year (Cost-Benefit ratio)
HEAT FOR WALKING & CYCLING: CONCLUSION
52
Tool designed for transport plannersEvidence-basedTransparentSimple to use
Order of magnitude only

HEAT FOR WALKING & CYCLING: CONCLUSIE
HEAT 53
http://www.euro.who.int/HEAThttp://www.heatwalkingcycling.org
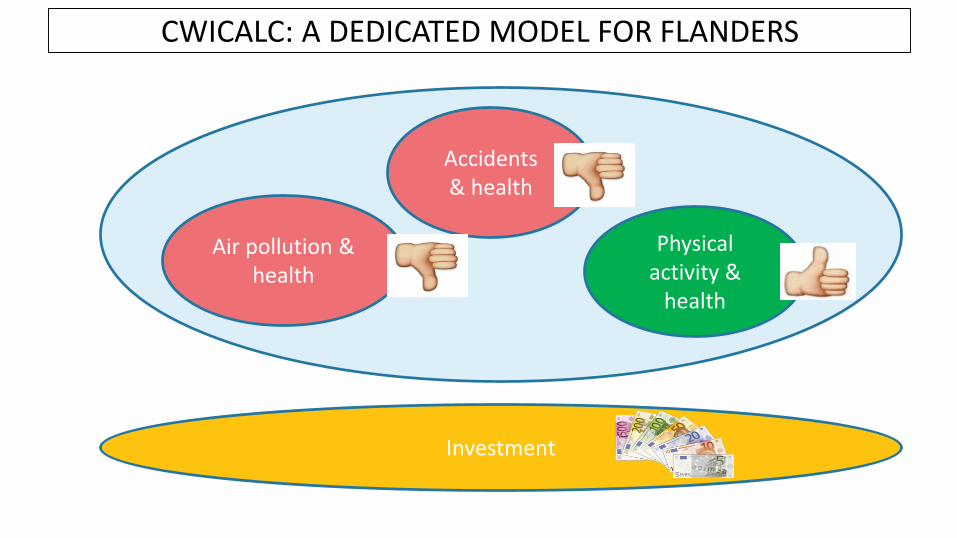
CWICALC: A DEDICATED MODEL FOR FLANDERS
54
Accidents& health
Air pollution & health
Physicalactivity &
health
Investment

55
Investment
Air pollution& health
MODEL
Accidents
Physicalactivity &
health
Bicycle/Walk data
Indicator = €

56
HEAT compared to CWICalc
- Estimate benefits of regularcycling/walking
- Estimate external benefits- Compare with investment
(e.g. building bicycle highway)- New update: including air pollution,
accidents, climate(but not morbidity)
- Order of magnitude- VSL (country specific)
http://old.heatwalkingcycling.org
- Estimate benefits of regular cycling/walking- DALY’s & external benefits/costs- Impact of increase in cycling accidents- Impacts of air pollution: PM2.5- Compare with investment (e.g. bicycle highway)- YOLL & Cost of Illness & WTP (Willingness To Pay) - VOLY (Flanders)- Order of magnitude+ Mortality & Morbidity:
ischaemic HD, cancer (bowel, breast) diabetes type II, depression, dementia (>70j)
+ Option: congestion, CO2, noise
https://sites.google.com/site/cwicalc/input

57
Model specifics
- Adults
- Shift car => cycling / walking
- Establishing health benefits takes years
- Health benefit is capped
- VOLY: 40000 euro (some use up to 180000 euro; 40000 euro = conservative).
=> CWICalc is very conservative!
- Specifieke values for Flanders (Belgium). Treatment costs depend on national
organisation of health care system
- Air pollution : PM2.5 only (WHO preferred indicator)

58
Counting cyclists on Bicycle highways

59
CWICalc application: fietsostrades / fietssnelwegen
Why Flanders?
• lots of data on cycling (counts)• high air pollution• data on accidents
- Scenario 1:
- F1 Mechelen-Antwerpen- 600 cyclists- 27 km/day- 4 days per week- 20 year evaluation period- Building Cost: 6×10⁶ Euro

60https://www.researchgate.net/publication/281612872_Health_impact_model_for_modal_shift_from_car_use_to_cycling_or_walking_in_Flanders_Application_to_two_bicycle_highways

CWICALC MODEL
61
Investment
PM2.5
MODEL
Accidents
Physicalactivity
Data on cycling/walking
Indicators

62
Results (DALY)
Crash risk over estimated or under estimated?

63
Results (costs in €)

weight Avg. cost (€) CI_low (€) CI_high (€)NO_I 22.4% 295 157 476
LIGHT_I 47.5% 322 244 411ABI_ST 25.7% 820 588 1089ABI_LT 4.4% 9348 3764 17425
minor accident 100% 841 579 1205
Costs of cycling accidents
•Risk of minor accident is 155 per million kilometers cycled (link)(one accident every 6500 km)
•Risk of injury is 121 per million kilometers cycled
(one injury each 8300 km)
•Average cost of minor accident is 841 euro (vs €60.776 for major non-fatal accident)
(0.125 euro/ km)
•Total cost of minor accidents in Belgium is 57 - 183 million € /year
Cycling highways expected to lower both the risk and the cost

65
Results (costs/benefits)

66
Results: (costs/benefits)
Most scenarios positive.

RESULTS IN THE NEWSPAPERS
67
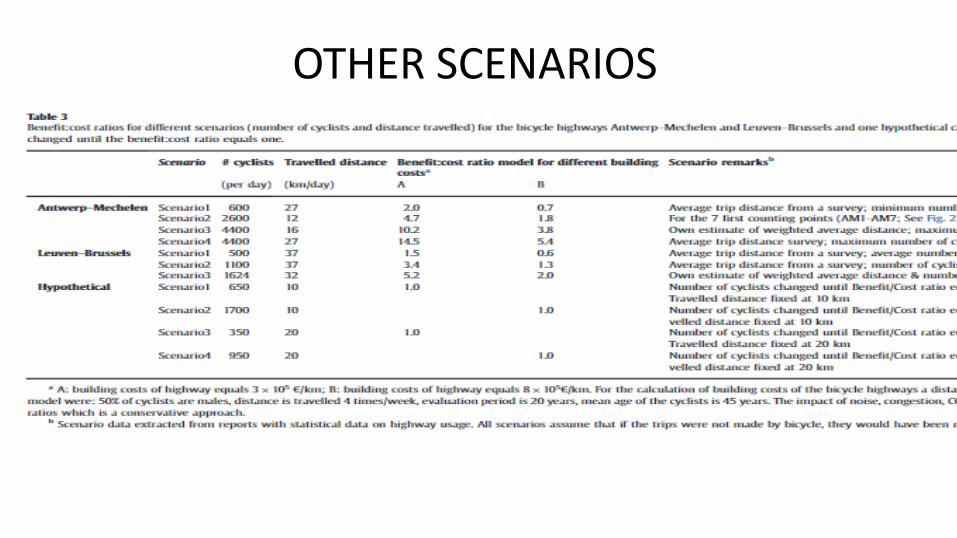
OTHER SCENARIOS
68

CONCLUSIONResearch shows that cycling is healthier than not cycling
(If it increases the physical acitivity of sedentary people)
Air pollution•Exposure peaks can be very high•Physiological changes are evident• Scientifically challenging• May lead to clinical effects in the long term
Policy should reduce exposure (e.g. bicycle highways)
Accidents•Risk of minor accident in general traffic is much higher than is higher than expected
(even among experienced cyclists)•Costs are high
=> Policy should eliminate conflicts, risks, consequences (e.g. bicycle highway design)
Cost efficient policies/infrastructure is possible Benefits almost always (much) higher than cost
70
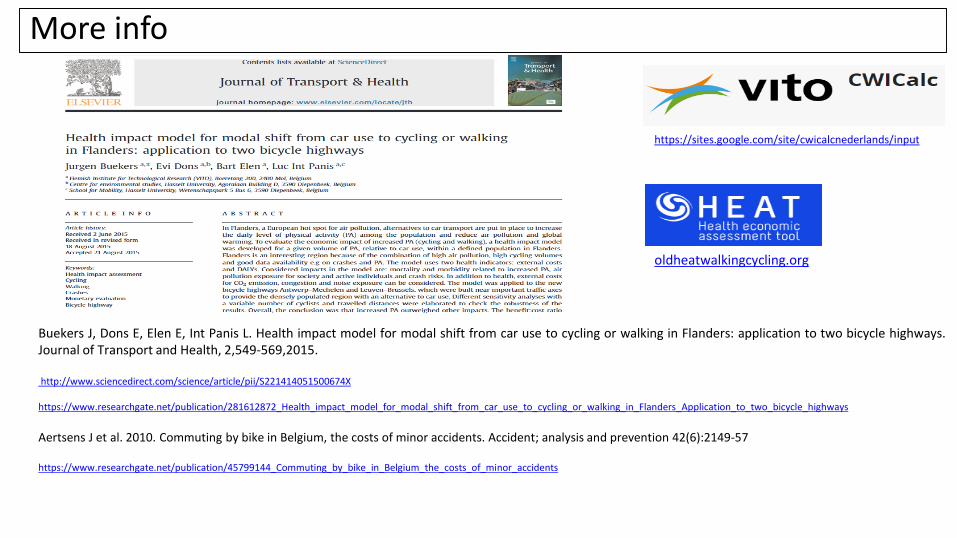
More info
Buekers J, Dons E, Elen E, Int Panis L. Health impact model for modal shift from car use to cycling or walking in Flanders: application to two bicycle highways.Journal of Transport and Health, 2,549-569,2015.
http://www.sciencedirect.com/science/article/pii/S221414051500674X
https://www.researchgate.net/publication/281612872_Health_impact_model_for_modal_shift_from_car_use_to_cycling_or_walking_in_Flanders_Application_to_two_bicycle_highways
Aertsens J et al. 2010. Commuting by bike in Belgium, the costs of minor accidents. Accident; analysis and prevention 42(6):2149-57
https://www.researchgate.net/publication/45799144_Commuting_by_bike_in_Belgium_the_costs_of_minor_accidents
https://sites.google.com/site/cwicalcnederlands/input
oldheatwalkingcycling.org