Health Care Costs and Hospitals - Home | Colorado Hospital ...€¦ · Health Care Costs and...
20
Health Care Costs and Hospitals Drivers and Opportunies
Transcript of Health Care Costs and Hospitals - Home | Colorado Hospital ...€¦ · Health Care Costs and...

Health Care Costs and Hospitals
Drivers and Opportunities
2/12/2019 Colorado Hospital Association 1
Health Care Costs and Hospitals: Drivers and Opportunities
Executive Summary In the mid-1800s, a severe outbreak of cholera in London killed more than 600 people. Many experts at the time believed that disease spread through smells in the air (“miasma”), but physician John Snow questioned that theory and began analyzing the data available to him. That included mapping out the known cases to look for a cause, which ultimately led him to the discovery of an infected water pump on Broad Street. Many who got water there ended up sick. Now known as the 1854 Broad Street cholera outbreak, Dr. Snow helped bring it to an end by removing the handle from that water pump so that the infected water was no longer accessible to Londoners. The outbreak was stopped, and the eventual understanding that cholera was spread through water – not smells – led to significant shift in how the city managed the disease in the future. Just as we learned from Dr. Snow, the problems with health care – and affordability in particular – will require finding the right solution. Like believing in miasmas, turning the wrong lever, or assuming the wrong conclusion without correct data and analysis, will fail to solve the true issue. This report examines what some of the right questions, conclusions and solutions may be – or may not be – when it comes to hospital and health care costs in Colorado. The top takeaways include:
1. Colorado’s high cost of living significantly drives health care costs up.
2. Something in addition to health care costs is driving insurance premium rates in Colorado. High insurance premiums do not directly correlate with hospital overhead costs, nor with health care expenditures.
3. Coloradans’ spending on health care and insurance premiums is lower – and growing slower – than the rest of the United States.
4. Hospital spending is the largest expense “bucket” – and it should be. Hospitals care for people when they are the sickest, and most other care is provided in other (less expensive) places.
5. What Colorado hospitals pay for workers, services and equipment is 6th highest in the nation. These expenses are also influenced by Colorado’s high cost of living. Further analysis is required to understand why Colorado’s proportion of non-medical costs is high.
6. Communities small and large need their hospitals to be there when they need care, especially when there’s a large-scale event, like a flu outbreak or natural disaster. Hospitals have to plan for those terrible events, and as Colorado’s population grows, hospitals will grow, too. Many Colorado hospitals reported operating at full-capacity on multiple occasions in 2018.

2/12/2019 Colorado Hospital Association 2
Recommendations Following the legacy of Dr. Snow, a deep-dive analysis on the drivers of heath care costs in Colorado was conducted and led to different findings than have been recently discussed. Focusing on administrative costs, capital expenses and building and charity care costs are likely the miasmas of our current health care system; the quick answer that in the end will not solve the problem. Rather, it is recommended that we work together to:
1. Save money by having hospitals identify and act on opportunities to reduce unwarranted care variation and unnecessary care.
2. Save money by reducing emergency department visits for non-emergency medical conditions – most prevalent in uninsured and Medicaid populations – by refocusing on improving access to primary and urgent care.
3. Examine Medicaid (HCPF) inpatient admissions to determine why Colorado’s proportion of
Medicaid admissions is the second highest in the country and take action to reduce unnecessary admissions and readmissions.
4. Create a statewide scorecard designed to generate agreement and track progress toward a set
of clear, concise and measurable goals for cost, access and quality that will drive desired outcomes.

2/12/2019 Colorado Hospital Association 3
Health care costs continue to be a source of concern for many Americans. The current system is likely unsustainable, and stakeholders from public payers to providers are looking for new solutions. However, these solutions will only be effective if they are able to target the correct sources of cost growth and provide viable alternatives. As such, it is essential to untangle the incredibly complicated economics of health care in Colorado and the nation. With such pressing need, resorting to simple answers is tempting but ultimately will fail to actually solve our great challenges. The first step is accurately understanding what the current picture of health care looks like in Colorado, and then zeroing in on the levers that will most effectively move the system in the correct direction.
Overall Health Care Spending Trends in Colorado In 2014, the most recent year that CMS released expenditure data, Colorado spent the 5th lowest amount per capita on health care (including Washington, D.C.) and nearly 17 percent less per person than the national average (source, see total in Table 1a). Kaiser Family Foundation shows per capita health spending overall has grown slightly more rapidly in Colorado than the nation from 1991 to 2014, at 4.9 percent compared to a national rate of 4.5 percent, while CMS expenditure data shows that Colorado’s total health care spending per enrollee for all payer types grew more slowly for Colorado than the nation (fig. 1). Figure 1. Overall change in total health care spending 2009 to 2014, and 1999 to 2014. Data from CMS Expenditure Dataset.
Besides low overall spending in health care, Commonwealth Fund analysis shows that Colorado residents pay below the national average for premiums, both in an absolute amount (Fig. 2a) and as a percentage of median household income (Fig. 2b).

2/12/2019 Colorado Hospital Association 4
Figure 2a. Average total premium amount for an employer-based single person plan, 2015. Colorado is highlighted in green. From the Commonwealth Fund Issue Brief Oct 2016 (Source).
Figure 2b. Percent of total household income spent on family health insurance premiums by state, 2015. Colorado is highlighted in green. From the Commonwealth Fund Issue Brief Oct 2016 (Source).
2/12/2019 Colorado Hospital Association 5
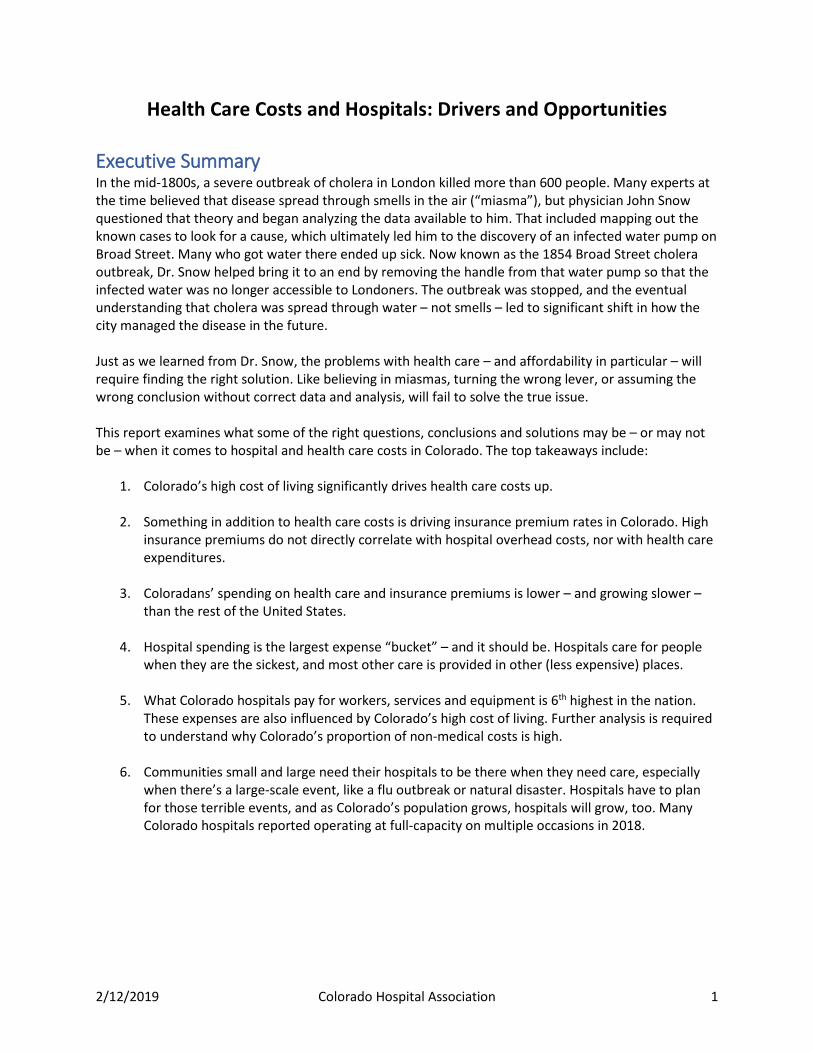
Trended data from Kaiser Family Foundation, via the Medical Expenditure Panel Survey (MEPS), shows how Colorado has moved relative to the national average until 2017 (Fig. 3). The Colorado Division of Insurance (DOI) reported 2018 saw significant increases in premium rates in Colorado in 2018 as well, but the 2019 rates are substantially reduced; DOI announced increases of less than 6 percent, compared to increases in the 30s previously. This may lead to Colorado once again sitting below the national average when updated data are released from MEPS.
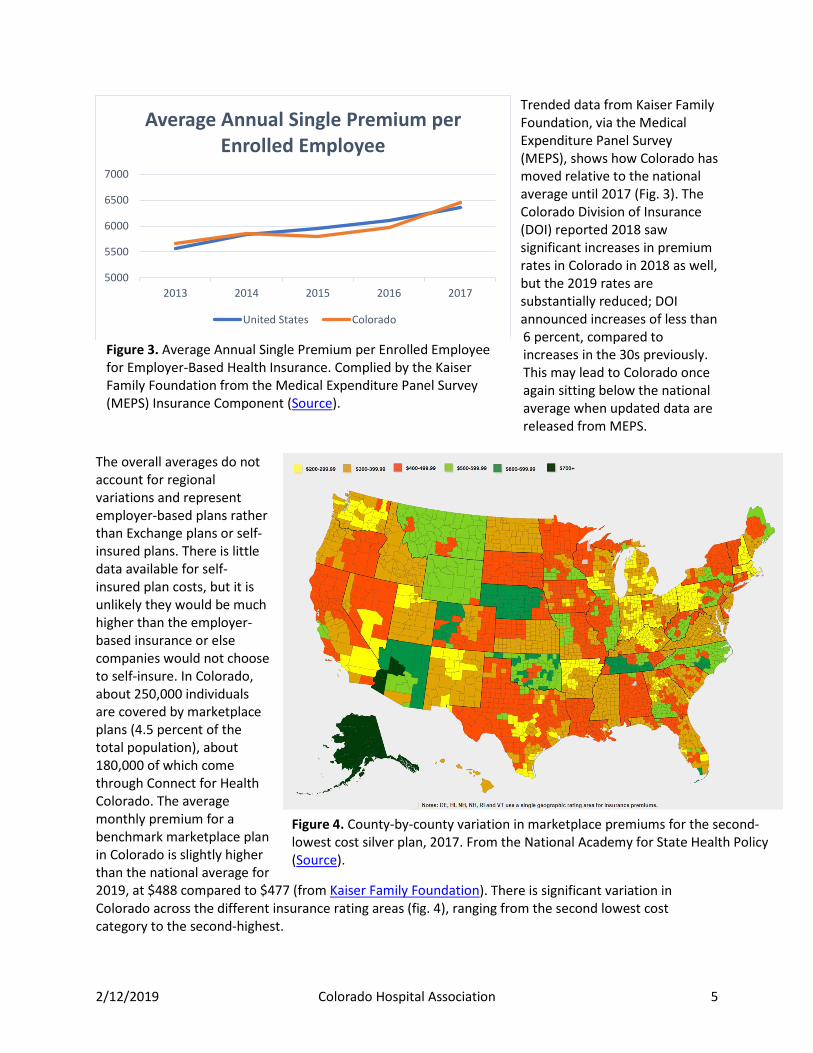
The overall averages do not account for regional variations and represent employer-based plans rather than Exchange plans or self-insured plans. There is little data available for self-insured plan costs, but it is unlikely they would be much higher than the employer-based insurance or else companies would not choose to self-insure. In Colorado, about 250,000 individuals are covered by marketplace plans (4.5 percent of the total population), about 180,000 of which come through Connect for Health Colorado. The average monthly premium for a benchmark marketplace plan in Colorado is slightly higher than the national average for 2019, at $488 compared to $477 (from Kaiser Family Foundation). There is significant variation in Colorado across the different insurance rating areas (fig. 4), ranging from the second lowest cost category to the second-highest.
5000
5500
6000
6500
7000
2013 2014 2015 2016 2017
Average Annual Single Premium per Enrolled Employee
United States Colorado
Figure 3. Average Annual Single Premium per Enrolled Employee for Employer-Based Health Insurance. Complied by the Kaiser Family Foundation from the Medical Expenditure Panel Survey (MEPS) Insurance Component (Source).
Figure 4. County-by-county variation in marketplace premiums for the second-lowest cost silver plan, 2017. From the National Academy for State Health Policy (Source).

2/12/2019 Colorado Hospital Association 6
Overall, health care costs in Colorado compare favorably across the nation. While the current rate of spending is not sustainable and for many sub-populations is already unaffordable, it’s vital to recognize that Colorado is not an outlier in health care costs but rather building on a better foundation to tackle the similar challenges facing the whole nation. Understanding where Colorado sits in comparison to other states suggests that many of the drivers behind health care costs are systemic across the nation, and that Colorado is not an outlier in this regard.
Potential Drivers of Health Care Costs Hospital spending makes up the greatest proportion of total per capita spending (Table 1a and b). Overall, per capita hospital spending was nearly 12 percent lower in Colorado than the national average but made up a slightly higher proportion of total spending. Accordingly, changes in hospital spending—up or down—can have a significant impact on total spending. Since 1991, hospital costs have increased in line with other expenses in Colorado, and at the same rate as the nation. However, this growth has accelerated since 2009 (Fig. 5 and Figs. 6a & b). The Rocky Mountain Region as a whole demonstrates a similar pattern; even if Colorado was driving a significant portion of its region’s trend, it remains below the average for its region. Table 1a. Total health spending per capita by service, 2014. From CMS Expenditure Data, calculated by Kaiser Family Foundation (Source).
Hospital Care
Physician and Clinical Services
Other Prof. Services
RX drugs
Nursing Home Care
Dental Services
Home Health Care
Medical Durables
Other Health, Residential, and Personal Care Total
US $3,079 $1,874 $260 $1,114 $479 $354 $262 $146 $475 $8,043 CO $2,739 $1,602 $325 $681 $385 $419 $192 $172 $290 $6,805
Table 1b. Proportion of health spending per capita by service, 2014.
Hospital Care
Physician and Clinical Services
Other Prof. Services
RX drugs
Nursing Home Care
Dental Services
Home Health Care
Medical Durables
Other Health, Residential, and Personal Care
US 38% 23% 3% 14% 6% 4% 3% 2% 6%
CO 40% 24% 5% 10% 6% 6% 3% 3% 4%

2/12/2019 Colorado Hospital Association 7
Figure 5. The proportion of total per enrollee/beneficiary spending allocated to hospital care, 1991-2014, for all payers. Data from CMS Expenditure Dataset.
Figure 6a. Percent change from 1991 to 2014 in per enrollee/beneficiary health care spending by service, Colorado vs. the United States. Data are directly from CMS Expenditure Dataset.

2/12/2019 Colorado Hospital Association 8
Figure 6b. Percent change from 2004 to 2014 in per enrollee/beneficiary health care spending by service, Colorado vs. the United States. Data are directly from CMS Expenditure Dataset.
To look at per unit cost, Kaiser Family Foundation shows AHA data on Adjusted Expenses per Inpatient Day (fig. 7a). Overall, Colorado hospitals have higher costs than the national average, ranking 6th in the nation in 2016 and 9th in 2009. We also see that there is a large amount of variation in the percent change from year to year in Colorado adjusted expenses per inpatient day; on average for the entire time period reported, Colorado hospital expenses per unit increased 4.8 percent, while national hospital per unit expenses increased 4.5 percent (fig. 7b). Figure 7a. Average adjusted expenses per inpatient day. “Adjusted expenses” includes all operating and non-operating expenses and are adjusted to estimate both inpatient and outpatient care in the hospital setting. Aggregated by Kaiser Family Foundation from AHA survey data (Source).

2/12/2019 Colorado Hospital Association 9
Figure 7b. Year-over-year percent change in adjusted expenses per inpatient day. Percent change calculated from aggregated Kaiser Family Foundation data above.
During the same time period that hospital costs grew a little more quickly in Colorado than the nation, inflation was also increasing faster in Denver than the national average (fig. 8). The difference accelerates from 2009 to 2017, suggesting that overall inflation may have also impacted hospital costs during that time. Figure 8. Total rates of inflation starting at 1991 and 2009 as base years. Data from U.S. Bureau of Labor Statistics, pulled from the Official Data Foundation (Source).
To identify what might most effectively control these increases costs in hospital care, it is vital to differentiate drivers that are within hospitals’ control from external factors. Hospital costs can be broken into multiple components to separate out administrative and capital (or non-medical) expenses, and the actual cost of providing the medical care to the patient. Administrative costs per adjusted inpatient discharge have increased dramatically in Colorado (fig. 9a). However, the primary reason for the increase in administrative costs per adjusted discharge is the implementation of the Provider Fee and later the Medicaid Expansion in Colorado. Administrative costs
-2.0%
0.0%
2.0%
4.0%
6.0%
8.0%
10.0%
12.0%
1999 2000 2001 2002 2003 2004 2005 2006 2007 2008 2009 2010 2011 2012 2013 2014 2015 2016
US CO
0
0.2
0.4
0.6
0.8
1
1.2
Inflation Rate from 1991 Base
US Denver
0
0.05
0.1
0.15
0.2
0.25
Inflation Rate from 2009 Base
Denver US

2/12/2019 Colorado Hospital Association 10
were very similar to the national average in Colorado prior to implementing the Provider Fee, which is included in HCPF’s calculation of administrative costs. The growth rate is actually less than the nation between 2010 and 2013 (18 percent compared to 22 percent), after which it grows again with the expansion of Medicaid, which also increased the size of the Provider Fee. The Hospital Provider Fee increases total administrative expenses by 28 percent (fig. 9b). Figure 9a. Administrative costs per adjusted discharge for Colorado and the nation, 2008 to 2016.
Figure 9b. Impact of Hospital Provider Fee on Total Hospital Administrative Costs and Proportion of Total Expenses Allocated to Administrative Costs in Colorado. Calculated from Cost Reports using CHA methodology.
0
500
1000
1500
2000
2500
3000
2015 2016
Adm
inist
rativ
e Co
sts,
in $
mill
ions
Total Hospital Administrative Costs
With HPF Without HPF
0
5
10
15
20
2015 2016
Adm
inist
rativ
e %
Percent of Total Expenses in Administrative Costs
With HPF Without HPF

2/12/2019 Colorado Hospital Association 11
Cost report data shows that capital costs per adjusted discharge are also high in Colorado compared to the nation and increasing more rapidly. However, there are also likely external confounding variables that are impacting both capital and administrative costs. There is a significant and substantial correlation between the BEA's Price Parity Index and these costs (Figs. 10a and 10b). These relationships suggest that one possible explanation of higher costs in Colorado is the overall higher price of goods and services in the state. Colorado also recovered faster from the 2008 recession than the nation as a whole, which would contribute to its price parity increasing over the last decade, as can be seen in the earlier inflation figure (fig. 8). Price parity is just one measure of just one factor that could be confounding the findings of Colorado's higher capital and administrative costs. It is essential to better understand how much of the differences in cost types are explainable by factors such as these, because they are completely outside of the hospitals' control. Figure 10a: R2 between Price Parity and Capital Costs per Adjusted Discharge is 0.35; p<0.0001
Figure 10b: R2 between Price Parity and Administrative Costs per Adjusted Discharge is 0.31; p<0.0001
2/12/2019 Colorado Hospital Association 12
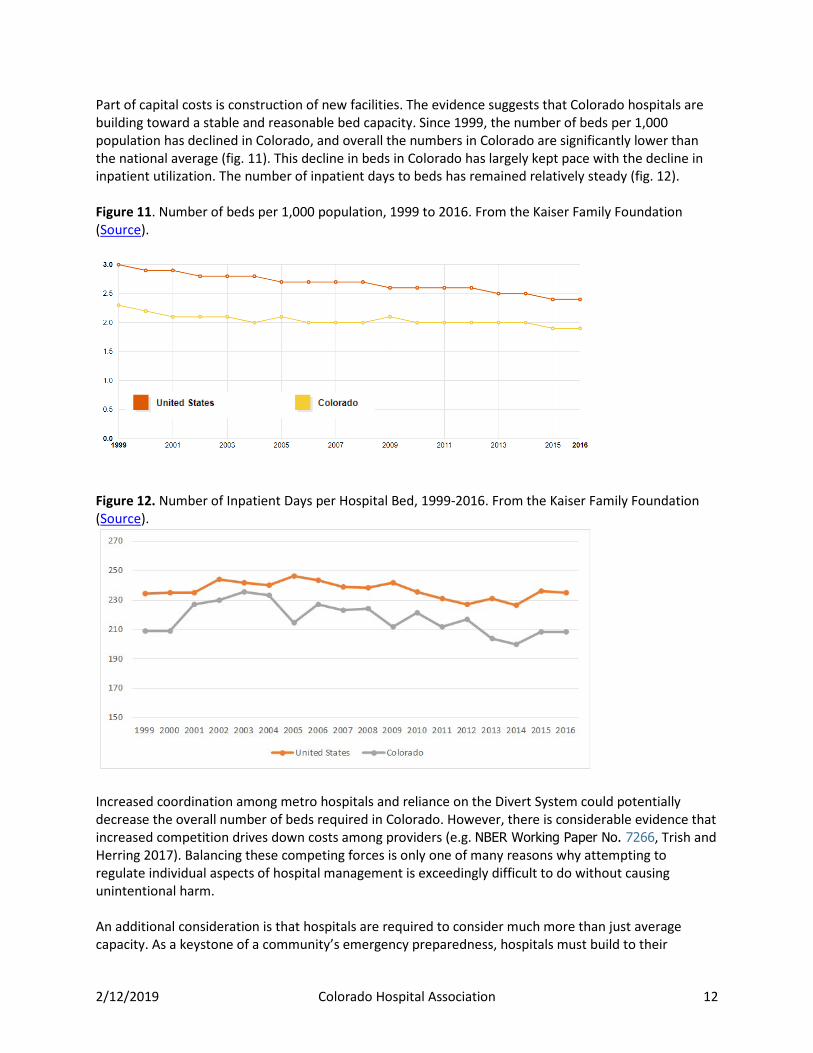
Part of capital costs is construction of new facilities. The evidence suggests that Colorado hospitals are building toward a stable and reasonable bed capacity. Since 1999, the number of beds per 1,000 population has declined in Colorado, and overall the numbers in Colorado are significantly lower than the national average (fig. 11). This decline in beds in Colorado has largely kept pace with the decline in inpatient utilization. The number of inpatient days to beds has remained relatively steady (fig. 12). Figure 11. Number of beds per 1,000 population, 1999 to 2016. From the Kaiser Family Foundation (Source).
Figure 12. Number of Inpatient Days per Hospital Bed, 1999-2016. From the Kaiser Family Foundation (Source).
Increased coordination among metro hospitals and reliance on the Divert System could potentially decrease the overall number of beds required in Colorado. However, there is considerable evidence that increased competition drives down costs among providers (e.g. NBER Working Paper No. 7266, Trish and Herring 2017). Balancing these competing forces is only one of many reasons why attempting to regulate individual aspects of hospital management is exceedingly difficult to do without causing unintentional harm. An additional consideration is that hospitals are required to consider much more than just average capacity. As a keystone of a community’s emergency preparedness, hospitals must build to their

2/12/2019 Colorado Hospital Association 13
maximum days, not average days (Table 2). Even if a hospital is only at full capacity during a flu outbreak or other mass casualty event, it must always be ready for that volume. For example, Castle Rock Adventist Hospital has an average occupancy rate around 60 percent but also had 14 days at capacity. If it were to reduce its number of beds to increase its average occupancy rate, it would not be able to handle its full case load on some days. Table 2. The proportion of hospital days spent at each occupancy level, using CHA Discharge Claims and Cost Report Available Beds.
Hospital Category 60% or less 61-70% 71-80% 81-90% CRTCL 92.7% 2.2% 1.7% 0.4% RURAL 81.8% 8.1% 5.6% 2.9% SPLTY 11.6% 13.5% 20.9% 27.9% URBAN 44.5% 19.2% 17.8% 9.8%
Conversely, Colorado has the highest average proportion of non-medical expense per discharge in country, so there needs to be a close examination of the reasons why. Without understanding the major factors driving the high proportion of non-medical costs in Colorado when compared other states, it would be ineffective and likely damaging to assume the increased non-medical costs are unnecessary. Additionally, there are a number of hospitals that are under the national average (34 for capital, 8 for admin), so any action taken here would need to ensure it only impacts those who have issues in these areas to address.
Hospital Costs and Their Impact on Private Insurance Premiums While reducing total spend is important from a statewide policy perspective, the average consumer cares most about the more direct and visible impact of private insurance premiums. Do administrative costs or capital costs within hospitals on their own relate to private premium amounts? No. There is no direct evidence that overhead costs (administrative plus capital expense) per adjusted discharge are correlated with high premiums across the states (Fig 13). As we would expect, there is some correlation between total operating expense per adjusted discharge and average private premiums; however, this association is mostly driven by Alaska’s extreme costs (red dot in the upper right-hand corner). Removing Alaska reduces the R2 of this association to less than 14 percent. The reason for such a low relationship between total per unit expense and private premiums is that premiums are calculated based on total spend, not per unit price; in other words, it is the combination of price and utilization that actually matters for premium calculations. Not only is there little evidence that Colorado's higher than average hospital cost per discharge is related to higher than average premiums or insurance costs for individuals, there is no obvious mechanism for cost per discharge to be directly connected to premium costs, as insurance companies base premium rates (at least in part) off total per person expenditure for those individuals within their risk pool. According to CMS' expenditure data, in 2014 Colorado had the fifth lowest total spend for all payers and the tenth-lowest hospital spend per person. This means it is essential to understand how cost and utilization might be connected to each other as well. Spending that reduces utilization can actually result in reduced total cost, even if it causes increased cost per unit.

2/12/2019 Colorado Hospital Association 14
Figure 13. Lack of association between overhead costs and average private premiums across the states, 2015; limited association between total operating expense per adjusted discharge and premiums, driven largely by Alaska’s extreme values. Data from Cost Reports (per AD costs) and the Commonwealth Fund Issue Brief Oct 2016 (Source).
For individual and small-group plans, the DOI publishes rate view files. Examining the three primary insurers in Colorado for which we have complete data (Cigna, Kaiser, and BCBS/Anthem) shows that the average total projected per member per month target rates for Colorado are significantly below the national average and growing more slowly (Fig. 14a). In these rate review documents, insurers map out projected per unit costs, utilization rates and the resulting component costs for each of the five types of service: inpatient hospital care, outpatient hospital care, professional services, prescriptions, and other medical, plus capitation. Target rates for per member per month (PMPM) prices are set using total cost of care (i.e. per unit cost times rates of usages). For Cigna, Kaiser and BCSC, both inpatient and outpatient total components of the PMPM price have been growing more slowly in Colorado than the rest of the states, and do not seem to be growing out of line in Colorado. Hospital costs are the largest components of the types of care. But since overall premium growth has been better than the nation in Colorado, perhaps the hospital sector should be receiving some credit instead of blame.
Figure 14a. Average PMPM Target rates for Kaiser, BCBS/Anthem and Cigna, Colorado vs the national average.

2/12/2019 Colorado Hospital Association 15
Figure 14b. Average PMPM Target rates attributed to just hospital care for Kaiser, BCBS/Anthem and Cigna, Colorado vs the national average. Instead, it indicates that the current system in Colorado is likely better than the average state, and that the drivers of the growth in costs are not unique to Colorado. In other words, there does not seem to be evidence that Colorado's higher than average non-medical costs, or even higher than average total cost per unit of hospital care, are driving higher than average private insurance costs. There is also an additional conflicting incentive regarding insurance companies that comes to light in review of their rate setting practices. Because their profits are capped at a percentage of total revenues, they earn more total money if total cost of care increases. In other words, there is a direct benefit to health insurance companies when health care costs to rise, especially in areas that impact all insurance companies; the only check on complete inflation of costs from the insurers’ point of view is competition with other insurers for market share. This may explain in part why many insurers have been less proactive in direct care coordination efforts, even though they are the sole player who possesses the complete care history of a patient or reducing administrative burdens on providers for collections. There is a strong relationship between total expenditure and total premium costs by state (fig. 15). Compared to other states, Colorado has relatively higher premium costs per total spend. This may be an area that deserves more focus, not least because since any future reduction in medical costs must pass through the payer to reach the consumer.

2/12/2019 Colorado Hospital Association 16
Figure 15. Correlation between total health expenditure for all payers and cost of private premiums. From CMS Expenditure Data, which does not provide a total spend amount for private payers alone. Total spend is clearly not the only factor in determining premiums. Although the relationship is significant and nearly half of the variability in premiums correlates with changes in total health care spend, there is more than 55 percent that is not explained by this relationship. For individual costs to be brought down to sustainable levels, the rest of this relationship must be understood. What other drivers besides actual health care spending could be influencing premium costs? One possibility is availability of multiple insurance plans in a particular area. Research shows that limited competition among payers can increase premiums, even if total spending on health is low. Another possible factor suggested by external research (such as the most recent CHASE Cost Report) is the volume of cost shifting, as areas with very low Medicaid reimbursement rates may need to charge proportionally more of their private insurers—a cost that the insurers likely pass directly onto the patients. Variation in Medicaid and Medicare spending could also impact this relationship, as CMS data does not provide a Private Payer breakout for all expense categories (only personal health spending).

2/12/2019 Colorado Hospital Association 17
Conclusion By many measures, Colorado's health care compares favorably across the nation. But being among the best in an unsustainable system does not exempt us from tackling the major challenges that face every state. It is clear that hospital costs alone are not responsible in Colorado for increased overall expenditure on health care or for increased premium costs to individuals. However, hospitals still contribute the majority of health care expenditure; while justified, this fact as well as the prominence of hospitals within many communities, generates a significant burden of responsibility. With margins stabilizing and even increasing for many Colorado hospitals (Fig. 16), they will need to answer with meaningful changes to improve both the affordability and value of health care for Coloradans. Figure 16. Colorado hospital margins by peer group. From DATABANK.
If hospital administrative and capital costs are not solely, or even largely, responsible for the increases in private health insurance and overall spending on health care, then what is? This question has plagued our country for decades, virtually since the creation of our modern health care and insurance systems in the mid-1900s. The challenges in untangling the actual cause-and-effect relationships out of an incredibly noisy system are obvious in a correlation matrix of just the nine major variables explored in this analysis. Not only do seven of the nine variables show a correlation with private premium prices, but many of the variables show varying levels of correlation to each other (Fig. 17). This extensive relatedness is a not just a serious statistical problem for attempting to create an informative model, but it also strongly indicates that there are relationships among the variables—either directly with each other, or via confounding variables that have not been examined. If nothing else, Colorado’s agencies

2/12/2019 Colorado Hospital Association 18
and stakeholders should proceed with deliberate caution and humility. There is still much we can do in the face of this complexity, but there will be little success without clear definitions of goals, meaningful measures of progress and a willingness to embrace the interconnected and intricate nature of the health care industry. Figure 17. Complete correlation matrix listing R2 values for the variables examined in the analysis. White, non-bold cells are not significantly correlated with each other. Values mirrored across the black diagonal line are duplicates, retained for ease of reference when comparing two variables.
One area that could generate benefits for all stakeholders – payers, patients and providers alike – would be tackling avoidable care and variations from best clinical practices. By one measure, emergency department (ED) visits for non-emergency conditions cost the Colorado health care system an estimated $570 million (based on CHA analysis using 3M avoidable care methodology). Solving this challenge will require a united effort across the system; unnecessary ED visits often occur because of care that should be provided in the primary care setting or because of untreated conditions that worsen.
Figure 18. Proportion of potentially avoidable ED visits by preventable reason (calculated using 3M PPC methodology on CHA claims data).

2/12/2019 Colorado Hospital Association 19
Figure 18 shows the variation in causes of potentially avoidable ED visits by payer, which may be driven in part by differences in access to care as well as differences in underlying clinical patterns. According to the 2017 Colorado Health Access Survey, Medicaid patients are four times as likely as commercial patients to report that providers don't accept their insurance, the majority of which was sought for primary care. Medicaid patients account for a little less than half of all potentially avoidable ED visits (Fig. 19).
Focusing on these kinds of avoidable care costs would improve patients’ care as well as reduce costs, without causing unintended harm to providers that direct regulations of business operations will likely do. While still complex, care variation and the resulting cost to the system are much less tied to large external factors like cost of living, inflation and other factors outside of the scope of health care. Finding these kinds of fruitful interventions that the Colorado health care system can implement collaboratively are the best way to rein in unsustainable growth in health care costs while insuring appropriate and quality care to all patients.
Figure 19. Total potentially avoidable ED visits by primary payer (calculated using 3M PPC methodology on CHA claims data).