Affordable Care Act - Healthcare Reform Briefing for Careerminds
Upload
linda-barkerCategory
view
213download
0
Health Care BriefingHealth Care BriefingUniversity of Texas at San Antonio
November 17, 2006
Eva DeLuna Castro, Senior Budget Analyst

Outline
• Health insurance coverage data
• Highlights of CPPP/MHM June 2006 report, Texas Health Care
• Prospects for the 80th Legislative Session
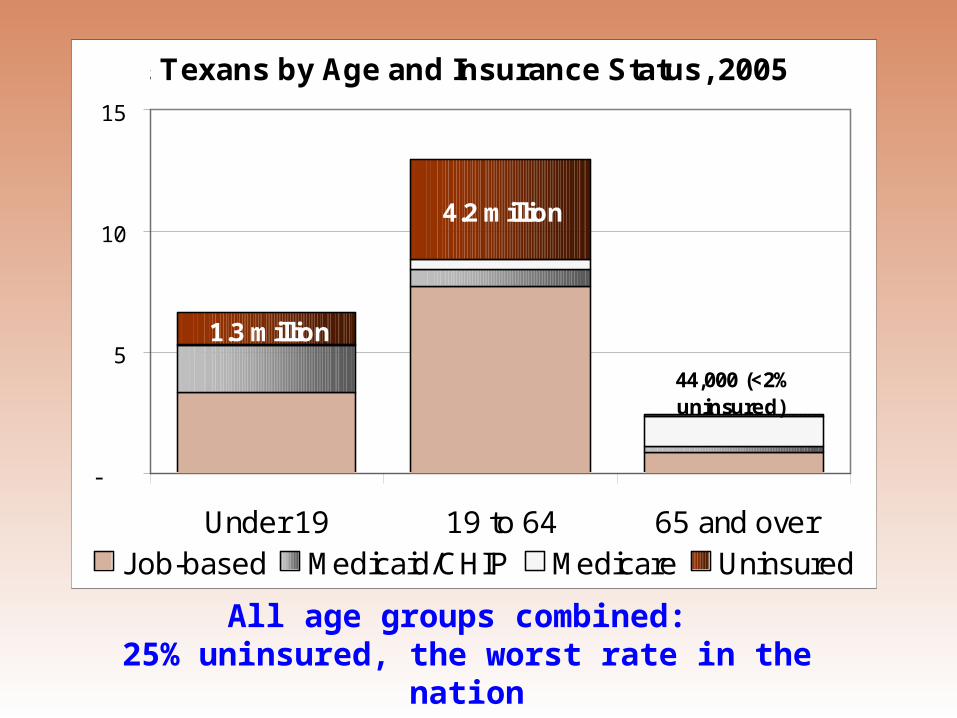
Texans by Age and Insurance Status, 2005
4.2 million
1.3 million
44,000 (<2% uninsured)
-
5
10
15
Under 19 19 to 64 65 and overJob-based Medicaid/CHIP Medicare Uninsured
Millions
20% uninsured
31% uninsured
All age groups combined: 25% uninsured, the worst rate in the nation

How Does Immigration Factor In?•Immigrants NOT the main cause of our last-place ranking
–Texas is home to 2.4 million non-citizens (legal residents & undocumented persons); 1.3 million are uninsured (55% of non-citizens)
–BUT! Removing non-citizens from the equation, Texas would still be tied with New Mexico for last place at 20.6% uninsured (4.2 million Texans), even if you left the non-citizens in NM’s rate. (Without immigrants, New Mexico’s rate drops to 18.9%)
Citizenship Status of Uninsured Texans in 2005 (Total: 5.5 million)
U.S.-born Citizen
72%
Naturalized 5%
Not a U.S. Citizen
24%

Insurance Status of Texas Children
Uninsured
Employment-based
-
2
4
6
8
1995 1996 1997 1998 1999 2000 2001 2002 2003 2004 2005
CHIPMedicare and Military
In millions
Medicaid
Of 1.367 million uninsured kids (TX 04-05 average), about 919,000 are below 200% of poverty. Excluding undocumented kids (230,000), this means 689,000 more children could be reached by Medicaid or CHIP.

0
10
20
30
2000 2001 2002 2003 2004 2005
Ra
te (
pe
rce
nt)
Bexar County’s Economic Indicators (from American Community Survey)
No significant improvements in poverty; low-paying jobs are unlikely to provide health insurance.
Unemployment Rate: 6.6% in 2005
Poverty rate, all ages: 17% in 2005
Child Poverty Rate: 24.1% in 2005

What Has Happened and What Work Remains
Texas Health Care:

2005 Session Gains for Medicaid: • Restoration of coverage of podiatry services, eyeglasses, hearing
aids, and mental health services for adults; • New Buy-In program for working adults with disabilities• New health “waiver” to provide basic preventive check-ups (such as
diabetes, breast/cervical cancer) and family planning services to low-income women (up to 185% of poverty, ages 18 to 44)
Medicaid Cuts Still in Effect: • Medically Needy Spend Down Program for Parents; • Rate cuts for many Medicaid and CHIP health care providers (about
$740 million over two years)
Other Medicaid Challenges: Covering working-poor parents up to the poverty line ($16,600 for
family of 3); for women’s health waiver, outreach is needed, as well as a way to provide follow-up care for illnesses not covered by Medicaid
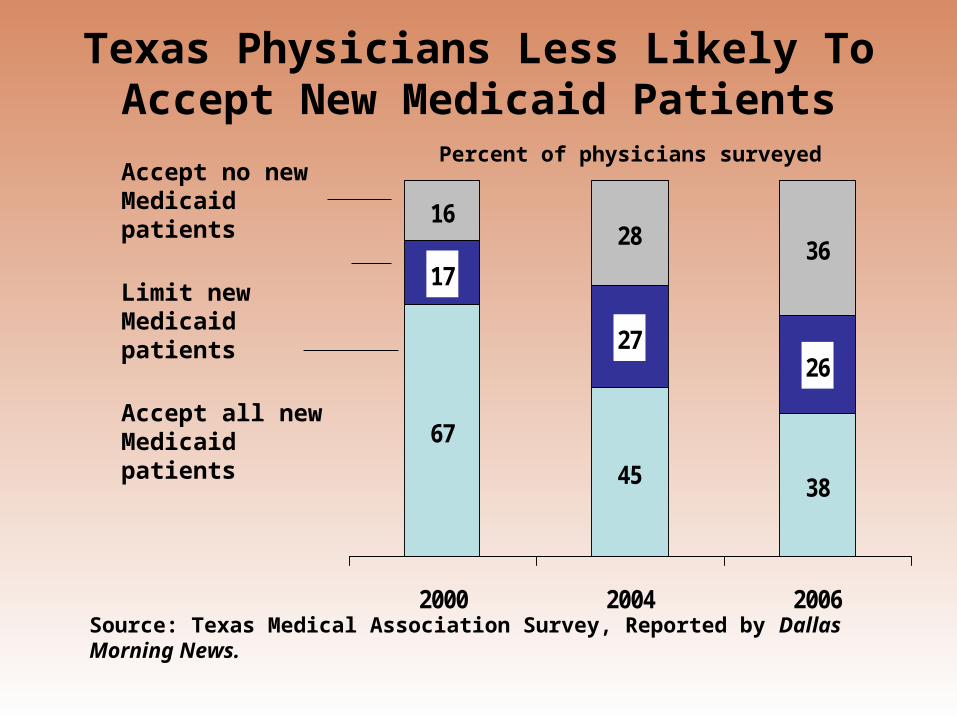
67
45 38
17
2726
1628
36
2000 2004 2006Source: Texas Medical Association Survey, Reported by Dallas Morning News.
Texas Physicians Less Likely To Accept New Medicaid Patients
Accept no new Medicaid patients
Limit new Medicaid patients
Accept all new Medicaid patients
Percent of physicians surveyed

Income Caps for Texas Medicaid & CHIP, 2006
133100
133
74
200
13.622.3
185 185222
0
50
100
150
200
250
Newborns Ages 1 to5
Ages 6 to18
CHIP PregnantWomen
TANFParent of
2, NoIncome
WorkingParent of
2
SSI (agedor
disabled)
Long-TermCare
Federal Mandate State Option
Percent of federal poverty line

Texas Medicaid Enrollees and Expenditures, 2004
70%
30%
9%
11%
21%
59%
0%
20%
40%
60%
80%
100%
Enrollees: 2.6 million Expenditures: $14.7 billion
Children
Other Adults
Elderly/Disabled
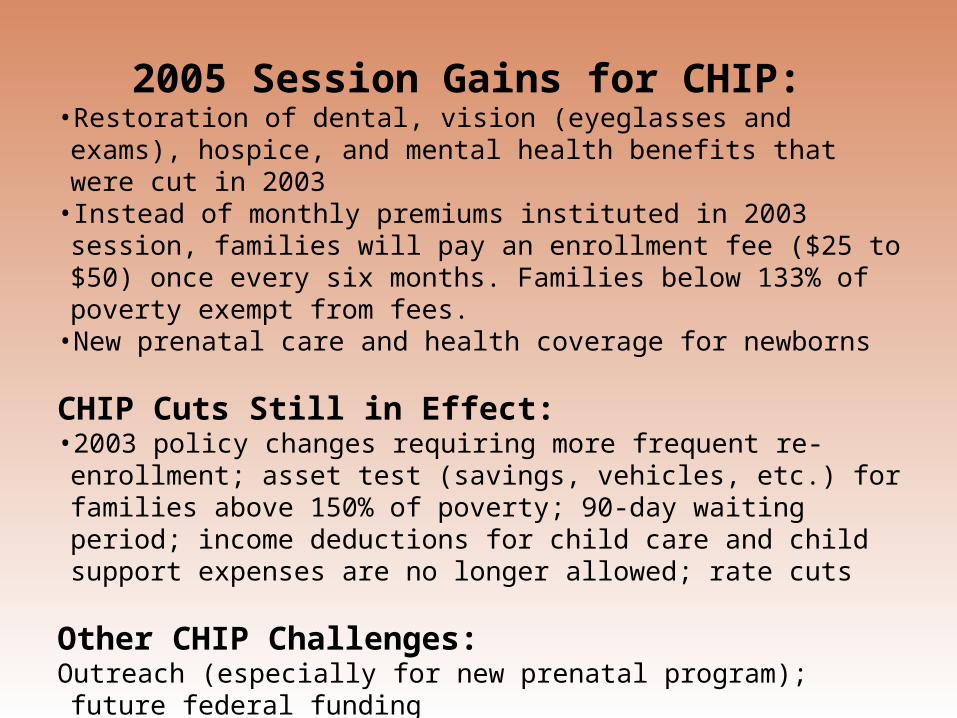
2005 Session Gains for CHIP: •Restoration of dental, vision (eyeglasses and exams), hospice, and mental health benefits that were cut in 2003
• Instead of monthly premiums instituted in 2003 session, families will pay an enrollment fee ($25 to $50) once every six months. Families below 133% of poverty exempt from fees.
•New prenatal care and health coverage for newborns
CHIP Cuts Still in Effect: • 2003 policy changes requiring more frequent re-enrollment; asset test (savings, vehicles, etc.) for families above 150% of poverty; 90-day waiting period; income deductions for child care and child support expenses are no longer allowed; rate cuts
Other CHIP Challenges: Outreach (especially for new prenatal program); future federal funding

2005 Session Gains for Public Health, Safety, Mental Health, and Prevention Programs:
• Funding and caseloads increased for immunizations, HIV drug program, newborn screening, and County Indigent Health Care (state grants to counties that fund health care for the impoverished)
• Increased funding for Children with Special Health Care Needs (seriously ill/medically fragile); 1,463 clients receiving medical services in 2003 versus 2,897 by 2007
• More funding for substance abuse services and staffing levels/facilities repairs at state mental hospitals
Cuts Still in Effect: • County Indigent Health Care, along with other programs such as
Kidney Health, Primary Health Care, and Community Mental Health services for adults & children, are still below pre-2003 funding levels
Other Challenges: Potential impact of “10% Cut in General Revenue” budget instructions
for 2008-09; future federal funding
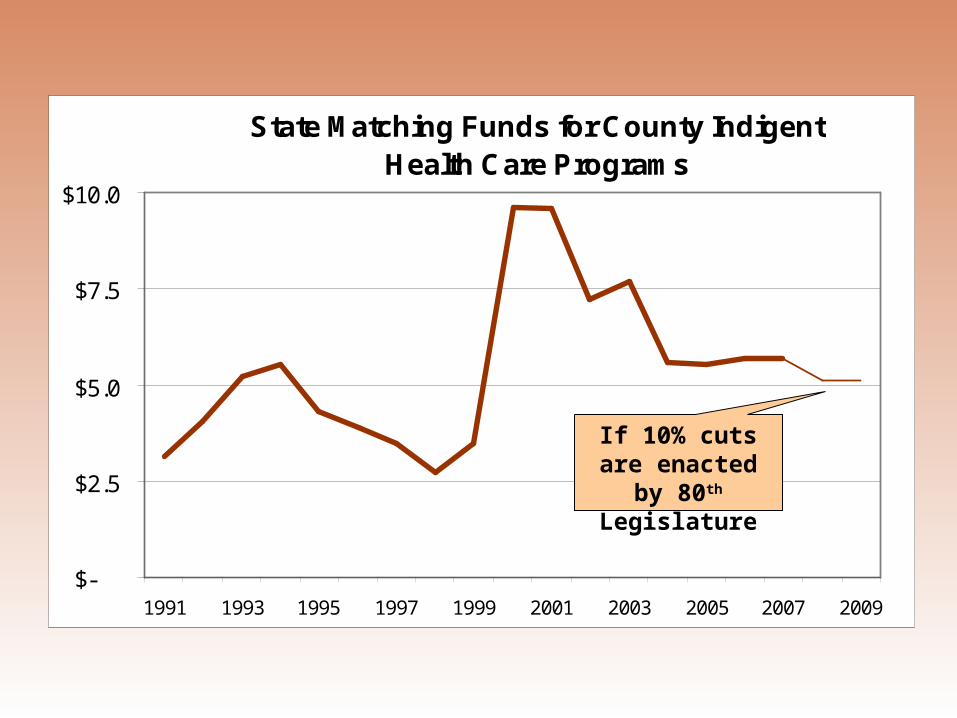
State Matching Funds for County Indigent Health Care Programs
$-
$2.5
$5.0
$7.5
$10.0
1991 1993 1995 1997 1999 2001 2003 2005 2007 2009
In million $
If 10% cuts are enacted by 80th
Legislature

2005 Session and Privatization/Outsourcing of Eligibility Determination for Safety Net Programs: •HHSC was directed to change the way Texans apply for public benefits, including Medicaid, CHIP, Food Stamps, and cash aid (Temporary Assistance for Needy Families)•June 2005: 5-year, $899 million contract signed by Accenture (Texas Access Alliance, or TAA), to operate & revamp eligibility and enrollment systems. Instead of 310 local offices, there would be 167 full-service offices and 44 “satellite” offices open on certain days only; 99 offices would close. Four call centers to provide assistance from 8 AM to 8 PM and receive and process applications; consumers could track applications through an automated phone system. Primary number for assistance would be 2-1-1; calls for eligibility services routed to TAA (not the 2-1-1 call centers).
Major Problems/Declines in Enrollment Lead to a Delay in Further Implementation of New System CHIP enrollment taken over by Accenture in Dec. 2005; in Jan. 2006, new system for TANF/Food Stamps/Medicaid launched in Travis & Hays counties

Texas CHIP Enrollment
0
200,000
400,000
600,000
May'00
Nov'00
May'01
Nov'01
May'02
Nov'02
May'03
Nov'03
May'04
Nov'05
May'05
Nov'05
May'06
Nov'06
Source: Texas Health and Human Services Commission*Sept. ’03 is the beginning of the state fiscal year in which
CHIP cuts/policy changes started taking effect.
High: May ’02: 529,271
Sep. ’03*: 507,259
Nov. ’06: 321,341

Recent Declines in Texas CHIP Enrollment
December 2005
October 2006
Decline, December to October
State total 322,898 300,685 -22,213 -6.9%
Bexar 20,915 19,202 -1,713 -8.2%
Cameron 7,814 8,125 311 4.0%
Dallas 33,325 31,848 -1,477 -4.4%
El Paso 13,628 12,009 -1,619 -11.9%
Harris 65,465 58,711 -6,754 -10.3%
HAYS 1,489 1,371 -118 -7.9%
Tarrant 19,754 19,231 -523 -2.6%
TRAVIS 8,550 8,540 -10 -0.1%
Webb 5,279 5,385 106 2.0%
Source: Texas Health and Human Services Commission

Texas Child Medicaid and CHIP Enrollment
1.5
2.0
2.5
3.0
Jan 0
2
Apr 0
2
Jul 0
2
Oct 0
2
Jan 0
3
Apr 0
3
Jul 0
3
Oct 0
3
Jan 0
4
Apr 0
4
Jul 0
4
Oct 0
5
Jan 0
5
Apr 0
5
Jul 0
5
Oct 0
5
Jan 0
6
Apr 0
6
Jul 0
6
Oct 0
6
En
rollm
en
t (m
illio
ns
)
0.5
1.5
2.5
3.5
4.5
5.5
6.5
Ch
ild p
op
ula
tio
n (
mill
ion
s)
Sources: Enrollment from Texas Health and Human Services Commission; Texas State Demographer's 0-17 Population Estimates
Sept. ’03: 2,150,543
Oct. ’06: 2,020,710
Estimated child population growth of almost 70,000 per year
Combined CHIP/Child Medicaid Enrollment

Declines in Texas Children’s Medicaid Enrollment
December 2005 October 2006
Decline, December to October
State total 1,838,239 1,720,025 -118,214 -6.4%
Bexar 139,682 133,204 -6,478 -4.6%
Cameron 64,339 62,992 -1,347 -2.1%
Dallas 182,954 170,054 -12,900 -7.1%
El Paso 98,319 89,265 -9,054 -9.2%
Harris 316,896 291,991 -24,905 -7.9%
HAYS 4,953 5,108 155 3.1%
Tarrant 97,908 89,483 -8,425 -8.6%
TRAVIS 52,667 49,267 -3,400 -6.5%
Webb 36,473 32,746 -3,727 -10.2%
Source: Texas Health and Human Services Commission. November preliminary enrollment has increased.

Want more information on privatization of eligibility determination?
See CPPP report released earlier this week (free on our website)

Improving/Protecting Health Care Access in 2008-2009
•Cover Texas children
•Expand access to Medicaid for poor parents
•Improve Medicaid access and quality by adequately paying health care providers
•Ensure that revamped/privatized eligibility system doesn’t impede access to Medicaid and CHIP
All of the above require adequate state tax revenue (currently 50th per capita) to draw down federal funds
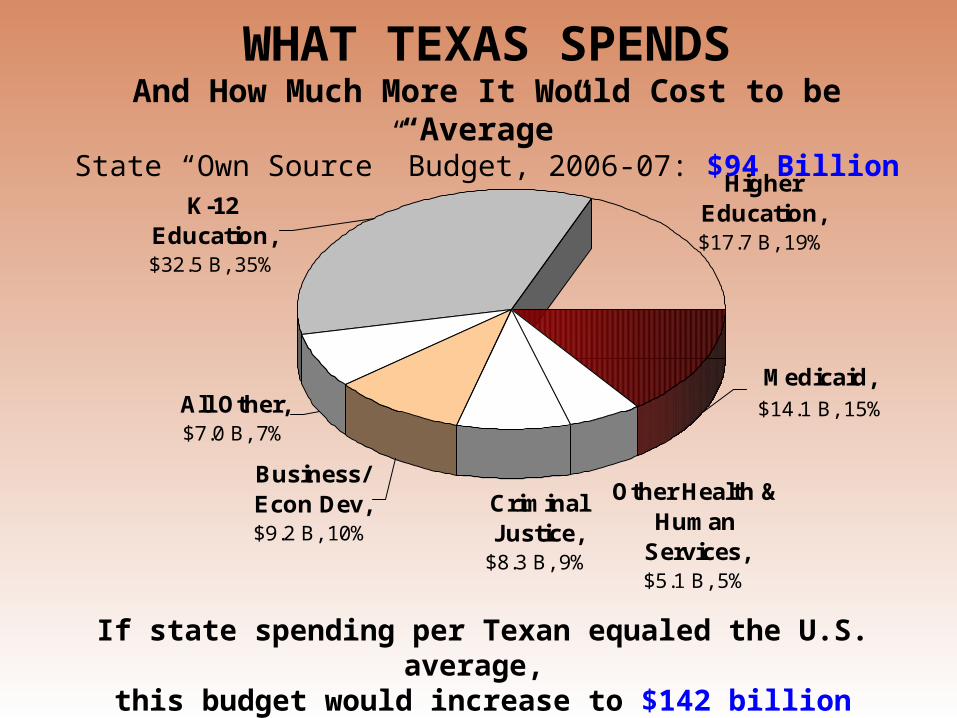
Higher Education, $17.7 B, 19%
Medicaid, $14.1 B, 15%
Other Health & Human
Services, $5.1 B, 5%
Criminal Justice,
$8.3 B, 9%
Business/Econ Dev, $9.2 B, 10%
All Other, $7.0 B, 7%
K-12 Education, $32.5 B, 35%
WHAT TEXAS SPENDSAnd How Much More It Would Cost to be “Average”
State “Own Source” Budget, 2006-07: $94 Billion
If state spending per Texan equaled the U.S. average, this budget would increase to $142 billion

Higher Education
K-12 Education
$1.7 B more
$7.9 B more
$0.5 B moreHealth & Human
Services
$3.7 B moreCriminal Justice
$0.3 B more
Business/ Eco Dev
Other
‘CURRENT SERVICES’ FOR 2008-2009?“Own Source” Budget: at least $108 Billion
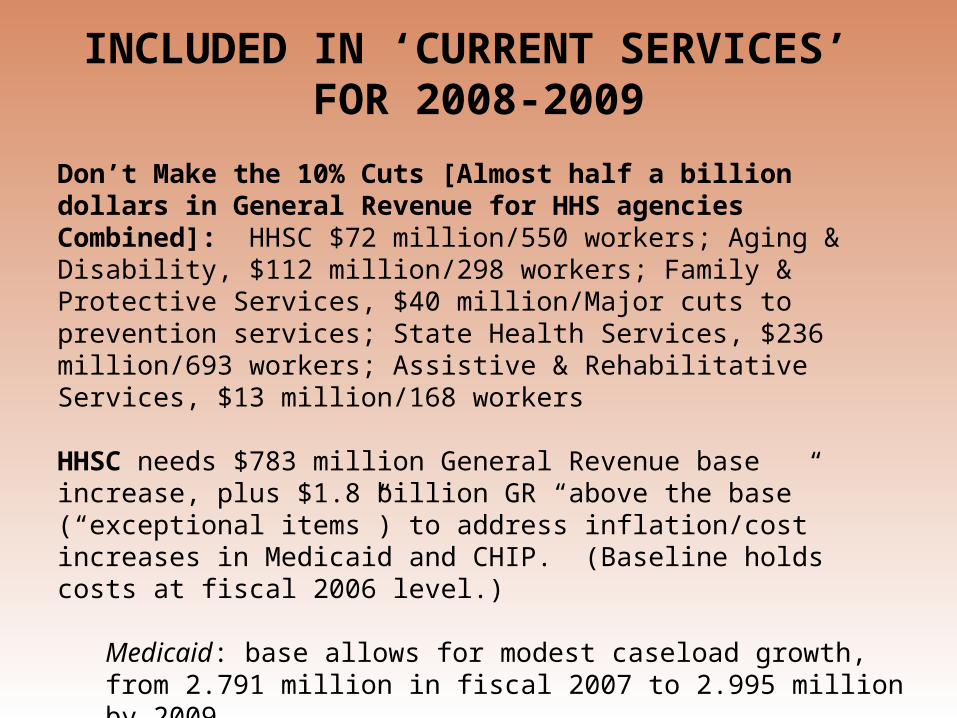
INCLUDED IN ‘CURRENT SERVICES’ FOR 2008-2009
Don’t Make the 10% Cuts [Almost half a billion dollars in General Revenue for HHS agencies Combined]: HHSC $72 million/550 workers; Aging & Disability, $112 million/298 workers; Family & Protective Services, $40 million/Major cuts to prevention services; State Health Services, $236 million/693 workers; Assistive & Rehabilitative Services, $13 million/168 workers
HHSC needs $783 million General Revenue base increase, plus $1.8 billion GR “above the base” (“exceptional items”) to address inflation/cost increases in Medicaid and CHIP. (Baseline holds costs at fiscal 2006 level.)
Medicaid: base allows for modest caseload growth, from 2.791 million in fiscal 2007 to 2.995 million by 2009
CHIP: Enrollment assumed to cap at 339,000 in 2009

BEYOND ‘CURRENT SERVICES’ (additional General Revenue needed)
Restoring health care provider rates to 2003 Levels: $237 million for Medicaid and CHIP rate restoration; $11 million for long-term care and other providers of Aging & Disability Services; $3 million for State Health Services health care providers
HHS program expansions/improvements: almost $1.1 billion in GR•$255 million to reduce community care waiting/interest lists•$54 million for private urban hospital upper payment limit (UPL) program; $117 million to replace nonrecurring intergovt transfers; $53 million for hospital financing; $81 million for Graduate Medical Education•$82 million to provide mental health community crisis services for children and adults•$32 million to address nursing/other health care professional shortages•$23 million to reduce spread of HIV and tuberculosis
More info: Texas Health and Human Services Consolidated Budget Fiscal 2008-2009 (on HHSC website)

KEY STAGES IN JANUARY 2007• Legislative Budget Board will release “starting point” for budget
• Governor’s Budget Office may also release a detailed budget, mentioning his program initiatives
• New Comptroller of Public Accounts will issue a revenue estimate for the 2008-2009 budget cycle; may also issue a new economic forecast (latest one is from Spring 2006) that changes the revenue estimate for fiscal 2007
• House and Senate committee assignments will be made

Use of This PresentationThe Center for Public Policy Priorities encourages you to reproduce and distribute
these slides, which were developed for use in making public presentations.
If you reproduce these slides, please give appropriate credit to CPPP.
The data presented here may become outdated. For the most recent information or to sign up for
our free E-Mail Updates, visit www.cppp.org.
© CPPP
Center for Public Policy Priorities900 Lydia StreetAustin, TX 78702
Phone 512-320-0222 Fax 512-320-0227