Health and Wellbeing Survey 2019 - hackneyjsna.org.uk
60
Research Report Health and Wellbeing Survey 2019 Prepared for: Hackney Council Prepared by: BMG Research
Transcript of Health and Wellbeing Survey 2019 - hackneyjsna.org.uk
Research Report
Health and Wellbeing Survey 2019
Prepared for: Hackney Council
Prepared by: BMG Research

Health and Wellbeing Survey 2019
Prepared for: Hackney Council
Prepared by: BMG Research
Date: March 2019
Produced by BMG Research
© BMG Research Ltd, 2019
www.bmgresearch.co.uk
Project: 1747
Registered in England No. 2841970
Registered office:
BMG Research Beech House Greenfield Crescent Edgbaston Birmingham B15 3BE UK
Tel: +44 (0) 121 3336006
UK VAT Registration No. 580 6606 32
Birmingham Chamber of Commerce Member No. B4626
Market Research Society Company Partner
The provision of Market Research Services in accordance with ISO 20252:2012
The provision of Market Research Services in accordance with ISO 9001:2015
The International Standard for Information Security Management ISO 27001:2013
Interviewer Quality Control Scheme (IQCS) Member Company
Registered under the Data Protection Act - Registration No. Z5081943
A Fair Data organisation
Cyber Essentials certification
The BMG Research logo is a trade mark of BMG Research Ltd.

Table of Contents
1 Introduction .................................................................................................................... 1
1.1 Background............................................................................................................. 1
1.2 Methodology and sampling ..................................................................................... 1
1.3 Questionnaire design .............................................................................................. 1
1.4 Analysis and reporting ............................................................................................ 2
2 Key Findings .................................................................................................................. 4
2.1 Exercise and Recreation ......................................................................................... 5
2.2 Diet ......................................................................................................................... 5
2.3 Smoking .................................................................................................................. 6
2.4 Sexual Health Services ........................................................................................... 6
2.5 Mental Wellbeing .................................................................................................... 7
2.6 Substance Misuse................................................................................................... 7
2.7 Interactions unhealthy behaviours ........................................................................... 8
3 Segmentation ................................................................................................................. 9
3.1 Introduction ............................................................................................................. 9
3.2 Overview of segmentation results ......................................................................... 10
4 Exercise and Recreation .............................................................................................. 13
4.1 Exercise levels reported ........................................................................................ 13
4.2 Types of exercise undertaken ............................................................................... 18
4.3 Where residents exercise ...................................................................................... 19
4.4 Perceptions of exercise levels ............................................................................... 21
4.5 Barriers to exercise ............................................................................................... 23
5 Diet .............................................................................................................................. 25
5.1 Perceptions of diet ................................................................................................ 25
5.2 Barriers ................................................................................................................. 26
5.3 Consumption of fruit and vegetables ..................................................................... 27
5.4 Types of meals consumed .................................................................................... 30
6 Smoking ....................................................................................................................... 34
6.1 Frequency smoke ................................................................................................. 34
6.2 Barriers ................................................................................................................. 36
6.3 Services available ................................................................................................. 37
Health and Wellbeing Survey 2019
7 Sexual Health Services ................................................................................................ 39
8 Mental Wellbeing ......................................................................................................... 40
9 Substance Misuse ........................................................................................................ 44
9.1 Alcohol use ........................................................................................................... 44
9.2 Audit C Tool .......................................................................................................... 47
9.3 Awareness of low risk drinking limit ....................................................................... 48
9.4 Other substance use ............................................................................................. 49
Appendix A: Sample Profile................................................................................................. 52
Appendix B: Statement of Terms ........................................................................................ 55
Introduction
Document Number: 22126785
Document Name: HWB survey final report Word version 1
1 Introduction
1.1 Background
In January 2019, BMG Research was commissioned to undertake a survey among
Hackney residents to help the Council better understand the health behaviours and
needs of the borough’s residents. This document summarises the findings of 1,024 face
to face interviews completed among Hackney residents aged 16+ during February and
March 2019. A separate cross-tabulated data report is available for more detailed
analysis.
1.2 Methodology and sampling
The last equivalent research among Hackney residents was completed in February and
March 2015 using a telephone methodology. However, given the recent introduction of
GDPR has meant many sampling providers now struggle to provide sufficient and robust
telephone sample frames, a decision was made to change the methodology. A transition
to a face to face interviewing approach was made to increase the inclusivity of the
research.
The revised approach was to deploy a stratified random locational sampling approach,
with interviews completed at pre-selected sampling points across Hackney. To generate
these sampling points Lower Super Output Areas (LSOAs) were ranked by the Index of
Multiple Deprivation (IMD 2015) within each ward. LSOAs were then segmented into
quintiles within each ward. After the LSOAs within the borough had been sorted in this
way, sampling points (COAs) were selected randomly and all addresses were identified
from the postcode address file within each COA to form the sample. The number of
addresses per COA ranged from 67 to 259.
The number of sampling points required per ward was calculated based on interviews
being achieved proportionately to ward populations, with a target of 10 interviews being
set per sampling point. Whilst the interviewers were able to approach any address within
a sampling point, quotas were set by age, gender and ethnicity within each ward to
ensure a representative spread of interviews. Quotas for working status and tenure were
also set at an overall borough level.
1.3 Questionnaire design
A full review of the 2015 questionnaire was undertaken by Hackney Council to ensure
that the 2019 version focused on the key health issues for the borough. Several
questions from the 2015 survey have been retained for comparability, but this was not
the primary driver of the questionnaire design. Comparisons, where relevant, to the 2015
survey findings have been made throughout this report, although when examining year
on year differences, the reader should recall the change in methodology between the
two datasets. Therefore, any apparent changes between 2015 and 2019 should be
interpreted with caution.
Health and Wellbeing Survey 2019
2
A small pilot consisting of 32 interviews was conducted to check the flow of the
questionnaire and any new questions. Findings from the pilot were fed back to Hackney
Council and following this, the order of the questionnaire was revised. Besides order,
no other changes were made and therefore the pilot interviews are included in the overall
findings.
1.4 Analysis and reporting
The purpose of this report is to provide an overall summary of the dataset for each
aspect of public health that the research covered. We recognise that adverse health
behaviours and outcomes are likely to be more prevalent among certain demographic
groups and within particular geographies and our analysis will draw out these variations.
However, we also acknowledge that subsequent policy interventions are likely to be
more community focused. Developing health profiles/priorities for the variety of
communities within Hackney is beyond the scope of this summary report, but will be
possible once this primary data is aligned with other datasets the Public Health Team
within Hackney Council hold.
Based on the Hackney population aged 16+ being 218,543 as per the 2017 mid-year
population estimates, the sample size in this research of 1,024 has a confidence interval
of ±3.06 at a 95% level of confidence. This means that we can be 95% certain that the
percentages reported from this sample are within 3.06 percentage points of the
percentages that would be observed if the entire Hackney population was interviewed.
Weights have been applied to the data by ward, age, gender, ethnicity, working status
and tenure using 2017 mid-year population statistics (or for variables such as ethnicity
not covered by mid-year estimates, 2011 census statistics). This is to ensure that the
data is as representative as possible at the borough level.
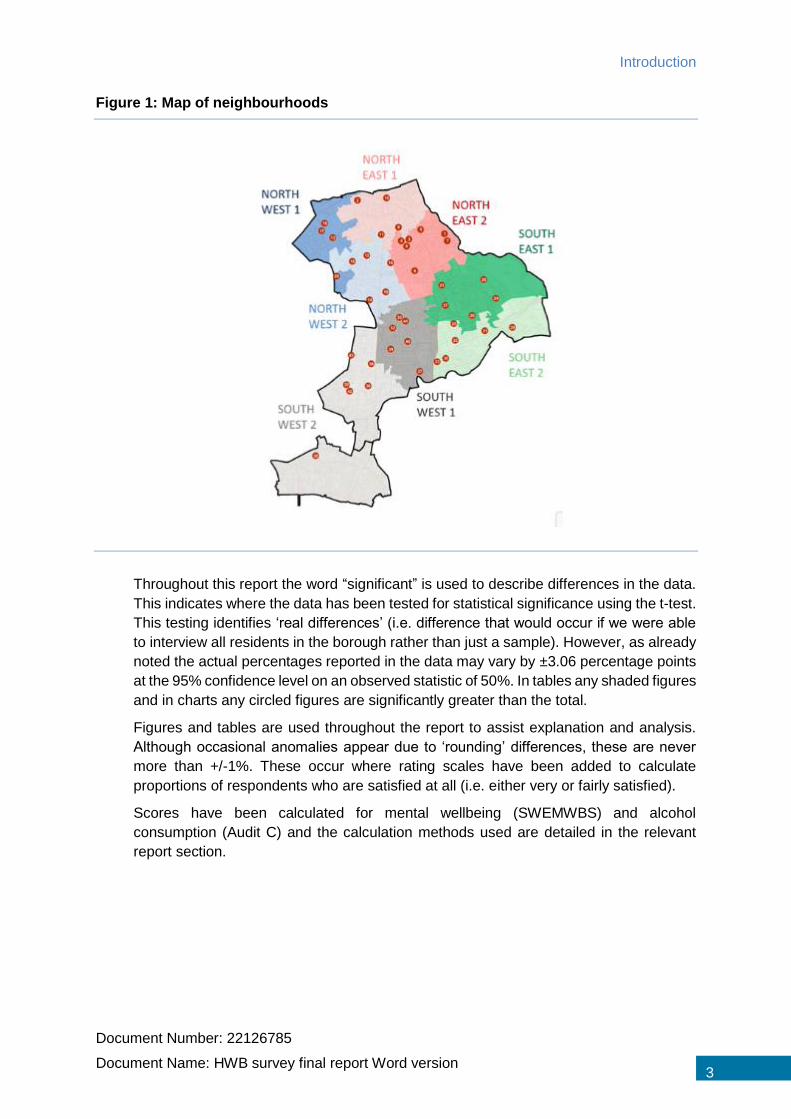
Within the 1,024 interviews completed, the ward level sample sizes are relatively small.
On this basis, survey responses have been aggregated into 8 neighbourhoods using a
postcode look-up file provided by Hackney Council. These neighbourhoods are based
on the boundaries of GP catchment areas, and align with the geographical groupings of
GPs and other local services that have been established to deliver integrated care for
local residents. Spatial analysis in this report will be undertaken using these 8
neighbourhoods which are listed in the table below.
Table 1: Neighbourhood units for spatial analysis
Neighbourhood Sample size
NE1 97
NE2 106
NW1 100
NW2 136
SE1 138
SE2 117
SW1 151
SW2 179
Introduction
Document Number: 22126785
Document Name: HWB survey final report Word version 3
Figure 1: Map of neighbourhoods
Throughout this report the word “significant” is used to describe differences in the data.
This indicates where the data has been tested for statistical significance using the t-test.
This testing identifies ‘real differences’ (i.e. difference that would occur if we were able
to interview all residents in the borough rather than just a sample). However, as already
noted the actual percentages reported in the data may vary by ±3.06 percentage points
at the 95% confidence level on an observed statistic of 50%. In tables any shaded figures
and in charts any circled figures are significantly greater than the total.
Figures and tables are used throughout the report to assist explanation and analysis.
Although occasional anomalies appear due to ‘rounding’ differences, these are never
more than +/-1%. These occur where rating scales have been added to calculate
proportions of respondents who are satisfied at all (i.e. either very or fairly satisfied).
Scores have been calculated for mental wellbeing (SWEMWBS) and alcohol
consumption (Audit C) and the calculation methods used are detailed in the relevant
report section.
Health and Wellbeing Survey 2019
4
2 Key Findings
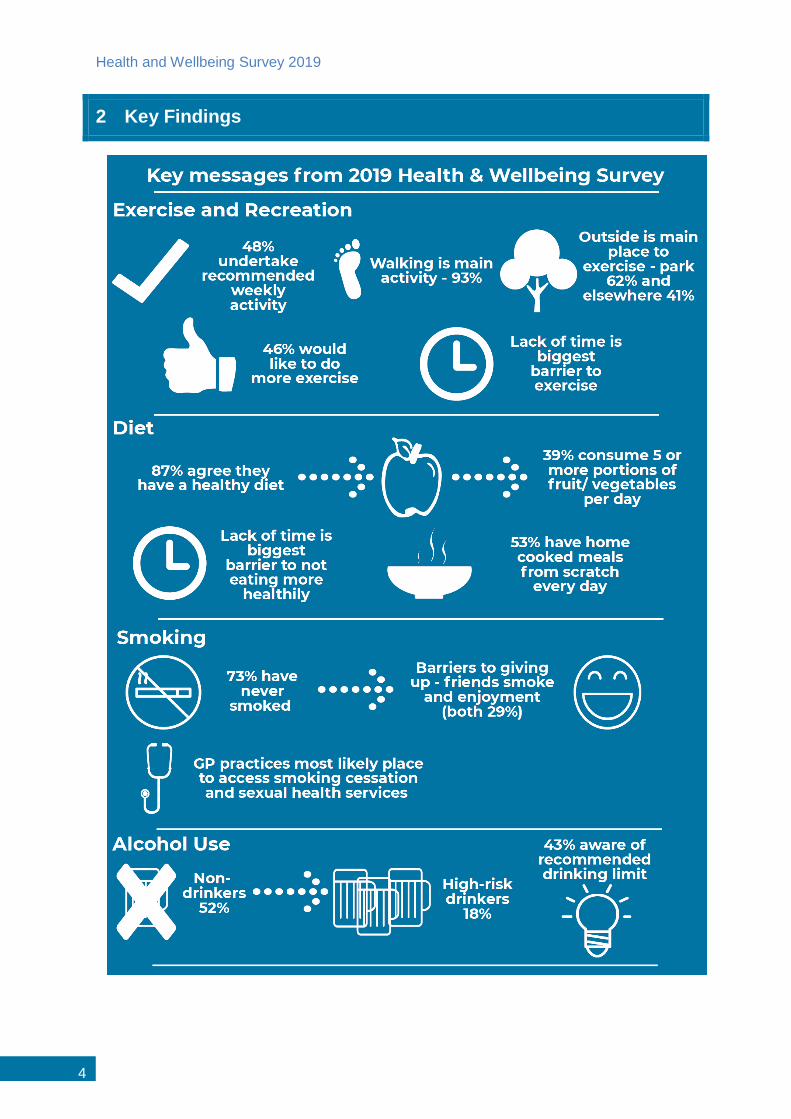
This section summarises the headline messages from the research, with further analysis
following in subsequent report chapters.
Key Findings
Document Number: 22126785
Document Name: HWB survey final report Word version 5
2.1 Exercise and Recreation
Based on the frequency with which Hackney residents say they take part in
moderate and vigorous exercise, just under half (48%) undertake the
recommended weekly amount of physical activity. Even in groups significantly
more likely to be exercising sufficiently such as the economically active and those
aged 16-34 the proportion doing so is only into the mid-50%. This level of
inactivity clearly has wider health implications.
A slight majority of residents (57%) feel they already exercise enough. On this
basis there may be a need to further raise expectations about what appropriate
levels of exercise are. Although, alongside this it is notable that close to a half of
residents (46%) would like to do more exercise, suggesting there is potential to
raise exercise levels in the future. This rises significantly to 56% amongst
residents who already undertake the recommended weekly amount of activity
compared to less than two fifths (38%) of those who do not. Looking specifically
at residents who undertake less than 30 minutes of moderate or vigorous
exercise in a typical week, which is a key target group for Hackney, shows that
over a quarter of these residents (26%) would like to do more exercise.
The dominant barrier to residents doing more exercise is a lack of time, with
close to two thirds of residents (63%) stating this. This was also the key barrier
identified in the equivalent 2015 research among Hackney residents. Health
problems and cost are also important, but less common, stated barriers. Time
issues are also the main barrier perceived by parents with children for their
children not doing more exercise.
The most common form of physical activity that Hackney residents do currently is
walking, with over nine in ten (93%) residents who exercise doing this. Exercise
as part of travelling plays an important part in residents’ current activity, with 76%
of residents who do some moderate or vigorous activity walking for travel.
The main places for residents to exercise are outside either at the local park
(62%) or outdoors but not a park (41%). There is some evidence in the data that
spaces specifically for exercise such as gyms are significantly more likely to be
used by those in the least deprived areas of the borough. It also should be
recognised that the home is also a key exercise space for three in ten Hackney
residents.
2.2 Diet
Almost nine in ten residents (87%) agree they have a healthy diet overall, with
only 4% disagreeing. However, there appears to be a gap between perceptions
and behaviours given that only just under two fifths of residents (39%) say they
consume the recommended five portions of fruit and vegetables a day. Indeed,
even among those who do not have their five portions a day, 83% still perceive
that they have a healthy diet.
Health and Wellbeing Survey 2019
6
Echoing the findings relating to exercise, the main barrier to eating healthy is
perceived to be lack of time.
While 43% of Hackney residents say they have a take away meal at least weekly,
residents are most likely to say that a home cooked meal prepared from scratch
is what they eat daily (55%). Further exploration may be needed regarding the
nature of the ingredients being used in such home cooked meals (e.g. use of salt
and saturated fats).
Younger residents are significantly more likely to say they consume larger
volumes of take-aways and fast food, with double the number of those aged 16-
34 (16%) eating such meals two or more times a week compared to those aged
65+ (8%).
2.3 Smoking
Close to three quarters of residents (73%) report having never smoked. A fifth of
residents (21%) say they currently smoke. Smokers in Hackney are significantly
more likely to be male and White British.
Smoking behaviours are also more commonly evident among those who exhibit
high risk drinking behaviours, potentially compounding these health risks.
The main barriers to quitting are social, i.e. having friends who also smoke (29%)
and the fact that they enjoy smoking (29%). This suggests that these smoking
behaviours potentially could be deeply entrenched.
Over a half of smokers are aware of GP practice-based support for stopping
smoking (56%) with close to half aware of pharmacy-based support (48%). Two
in five (42%) are aware of the NHS Smokefree website.
Residents who smoke were more likely to say they would use face-to-face
support services if they needed support to give up smoking – local GP (60%),
local pharmacy (32%) and drop in clinic (23%). Awareness of online services in
particular does not appear to be translating into propensity to use these services.
2.4 Sexual Health Services
The majority of residents (85%) state that they would consider using at least one
of the free services available locally if they needed support in relation to their
sexual health. As with support to stop smoking, GP based services are the most
popular (79% say they would consider using).
Key Findings
Document Number: 22126785
Document Name: HWB survey final report Word version 7
2.5 Mental Wellbeing
Using SWEMWBS to assess resident wellbeing, the median overall raw score
calculated for residents was 27.3 against a maximum possible score of 35. The
distribution of scores from the SWEMWBS calculations are unchanged since
2015.
Exploring socio-demographic variations in SWEMWBS scores, there are clearly
some groups of residents that have higher reported wellbeing than others, with a
significantly higher score seen among:
Younger residents i.e. those aged 16-34
Those economically active
Those with children
Those without a disability
2.6 Substance Misuse
The majority of residents (87%) perceive that they drink within the recommended
low risk limit. Close to a half of residents (48%) state they did not drink at all.
Those who state that they do not drink, are significantly more likely to be:
Female (54%) rather than male (42%);
Aged 65+ (63%);
Black (59%) or of another non-White British ethnicity (62%);
Summarising alcohol consumption using the Audit C system shows over a half of
Hackney residents are reported non-drinkers (52%). Close to a fifth (18%) are
classified as high-risk drinkers on the basis of their reported drinking behaviour.
Young, white males most commonly fall into this category.
Over two fifths of Hackney residents (43%) are aware of the recommended low
risk drinking limit. Lower awareness of the recommended number of alcohol units
per week is found among the most deprived quintile of the borough (50%),
although these areas of deprivation also have higher proportions of non-drinkers.
The majority of residents (80%) say they have not taken any unprescribed
substances, with just 14% stating they have taken an unprescribed substance.
The most common substance reportedly used is cannabis (13%). Very few users
have used a substance in the last month (17%), which equates to just 2% of all
residents. Around a third (34%) of residents that have used a substance have
used it within the last 12 months.

Health and Wellbeing Survey 2019
8
2.7 Interactions unhealthy behaviours
Numerous interactions between healthy and unhealthy behaviours can been seen within
the dataset which have implications for wider health outcomes. These include:
Residents that do not themselves undertake the recommended weekly amount of
physical activity and have children are significantly more likely to feel their child
does about the right amount of exercise:
89% of parents with children under 5 who themselves do not undertake the
recommended amount of exercise say their child does the right amount of
exercise vs 77% of parents who do undertake the recommended amount.
87% of parents with children aged 5 to 18 who themselves do not undertake
the recommended amount of exercise say their child does the right amount
of exercise vs 76% of parents who do undertake the recommended amount.
In this context there is a risk that low expectations/aspirations regarding exercise
are be perpetuated in subsequent generations.
A quarter of reported high-risk drinkers (24%) say they consume take-aways or
fast food two or more days a week, 10% above the survey average, suggesting a
routine unhealthy lifestyle among this group.
Residents reported as high-risk drinkers are more likely to be substance takers
(42% of this category has taken a substance vs 14% low-risk drinkers and 4%
non-drinkers) as are smokers (28% of smokers have taken any substance vs 9%
non-smokers) linking these three behaviours together.
Segmentation
Document Number: 22126785
Document Name: HWB survey final report Word version 9
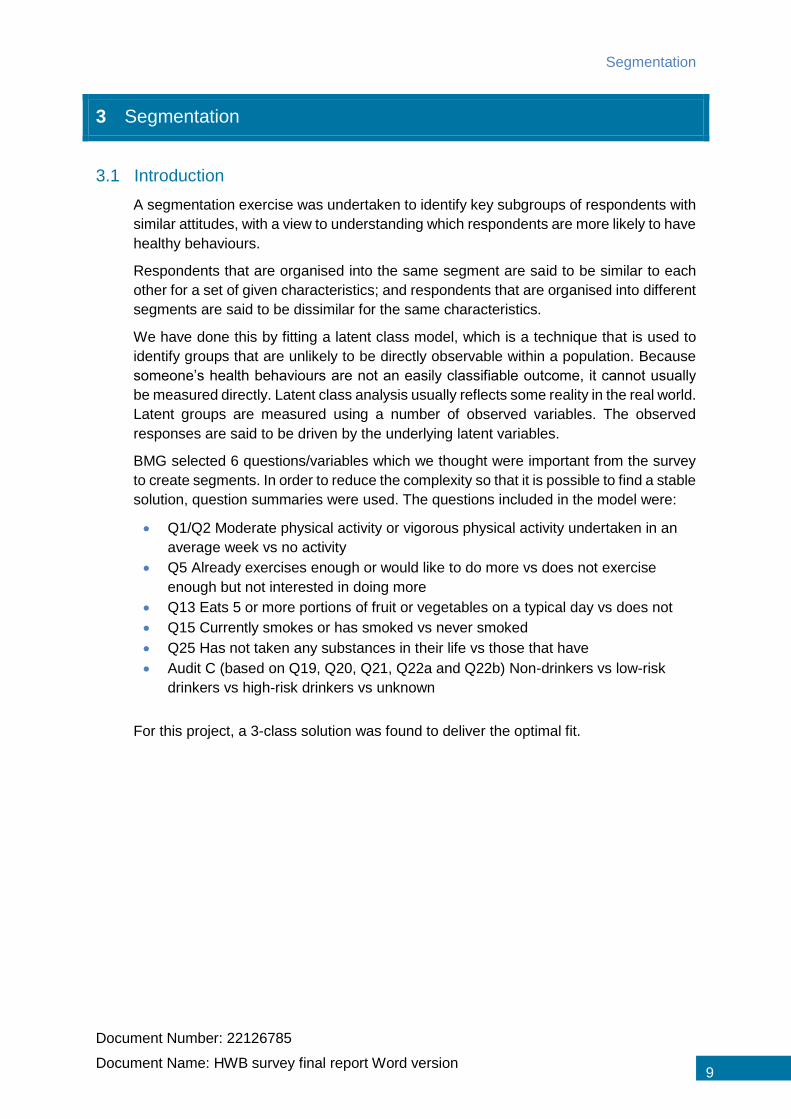
3 Segmentation
3.1 Introduction
A segmentation exercise was undertaken to identify key subgroups of respondents with
similar attitudes, with a view to understanding which respondents are more likely to have
healthy behaviours.
Respondents that are organised into the same segment are said to be similar to each
other for a set of given characteristics; and respondents that are organised into different
segments are said to be dissimilar for the same characteristics.
We have done this by fitting a latent class model, which is a technique that is used to
identify groups that are unlikely to be directly observable within a population. Because
someone’s health behaviours are not an easily classifiable outcome, it cannot usually
be measured directly. Latent class analysis usually reflects some reality in the real world.
Latent groups are measured using a number of observed variables. The observed
responses are said to be driven by the underlying latent variables.
BMG selected 6 questions/variables which we thought were important from the survey
to create segments. In order to reduce the complexity so that it is possible to find a stable
solution, question summaries were used. The questions included in the model were:
Q1/Q2 Moderate physical activity or vigorous physical activity undertaken in an
average week vs no activity
Q5 Already exercises enough or would like to do more vs does not exercise
enough but not interested in doing more
Q13 Eats 5 or more portions of fruit or vegetables on a typical day vs does not
Q15 Currently smokes or has smoked vs never smoked
Q25 Has not taken any substances in their life vs those that have
Audit C (based on Q19, Q20, Q21, Q22a and Q22b) Non-drinkers vs low-risk
drinkers vs high-risk drinkers vs unknown
For this project, a 3-class solution was found to deliver the optimal fit.

Health and Wellbeing Survey 2019
10
3.2 Overview of segmentation results
The following summarises the key characteristics of the three segments identified.
Segment 1 - (16% of residents)
Respondents in this segment account for close to a fifth of all residents.
They do not undertake any physical activity in an average week. Although they are the
most likely to identify that they don’t exercise enough (67%) they are the most likely to
say they are not interested in doing any more (69%).
Residents in this group are significantly more likely to cite health problems as the barrier
to them conducting more exercise (40%). Lack of time is also an issue for this group
(47%) although significantly less than the other groups.
The things that prevent this group from eating more healthily than the other groups
identified are lack of interest (14%), which excluding the 51% who said they felt they
already had a healthy diet, this was the biggest barrier. In addition to this healthy food
being too expensive (13%), confusion about what is healthy (8%) and the fact that
healthy food is not easily available (6%) were also contributing factors.
They are the least likely to eat the recommended 5 or more portions of fruit or vegetables
in a typical day (26%). This group are the most likely to consume ready meals every
day in a typical week (10%) however, they are the most likely to never consume take
away or fast food in a typical week (19%).
Only a third of this group (33%) are aware of the low risk drinking limit. However, this
group is the most likely to be classified as non-drinkers (83%).
In terms of mental wellbeing this group is the most likely to have the lowest SWEMWBS
of 7 to 19 (22%).
In terms of demographics in comparison to the other groups this group is likely to:
Not have children aged up to 18 (75%)
State they have difficulty making ends meet at the end of the month (50%)
Have a disability (41%)
Be aged 55+ (48%)
Female (64%)
Be of another ethnic group than White British or Black British (52%)
Economically inactive (58%)
Live in social rented housing (66%)
Live in NE1 or SE1 neighbourhoods (15% and 19% respectively).
Segmentation
Document Number: 22126785
Document Name: HWB survey final report Word version 11
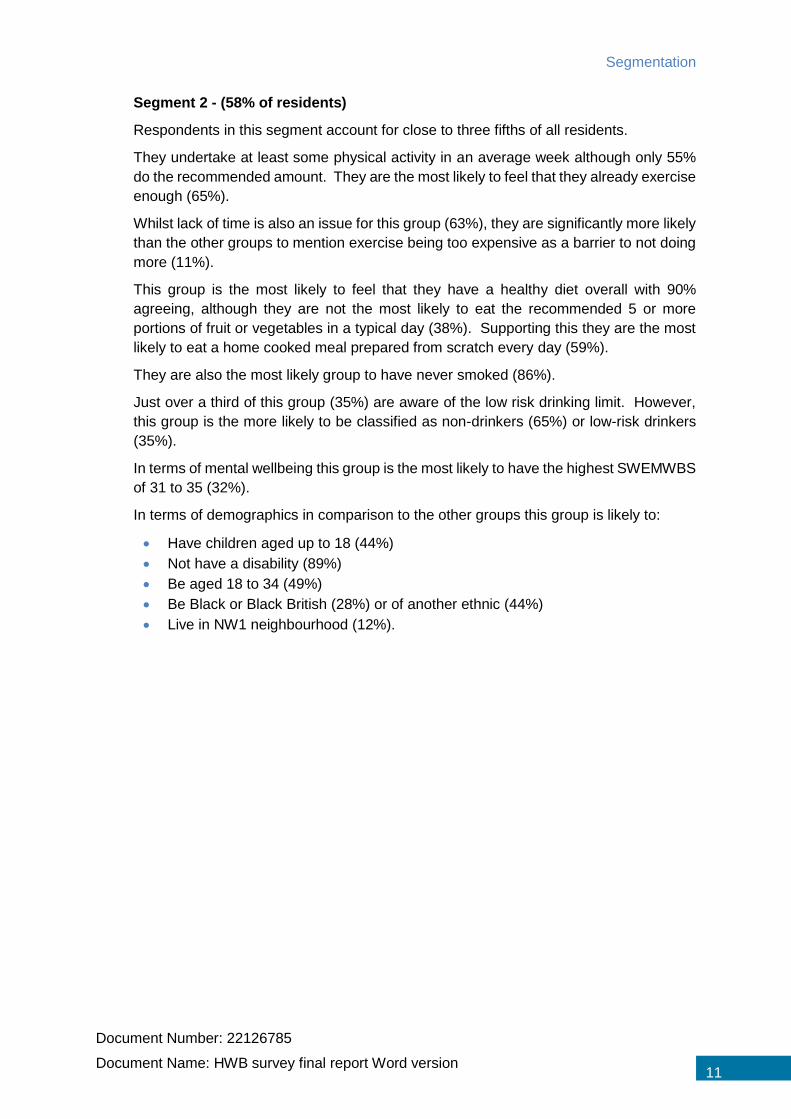
Segment 2 - (58% of residents)
Respondents in this segment account for close to three fifths of all residents.
They undertake at least some physical activity in an average week although only 55%
do the recommended amount. They are the most likely to feel that they already exercise
enough (65%).
Whilst lack of time is also an issue for this group (63%), they are significantly more likely
than the other groups to mention exercise being too expensive as a barrier to not doing
more (11%).
This group is the most likely to feel that they have a healthy diet overall with 90%
agreeing, although they are not the most likely to eat the recommended 5 or more
portions of fruit or vegetables in a typical day (38%). Supporting this they are the most
likely to eat a home cooked meal prepared from scratch every day (59%).
They are also the most likely group to have never smoked (86%).
Just over a third of this group (35%) are aware of the low risk drinking limit. However,
this group is the more likely to be classified as non-drinkers (65%) or low-risk drinkers
(35%).
In terms of mental wellbeing this group is the most likely to have the highest SWEMWBS
of 31 to 35 (32%).
In terms of demographics in comparison to the other groups this group is likely to:
Have children aged up to 18 (44%)
Not have a disability (89%)
Be aged 18 to 34 (49%)
Be Black or Black British (28%) or of another ethnic (44%)
Live in NW1 neighbourhood (12%).
Health and Wellbeing Survey 2019
12
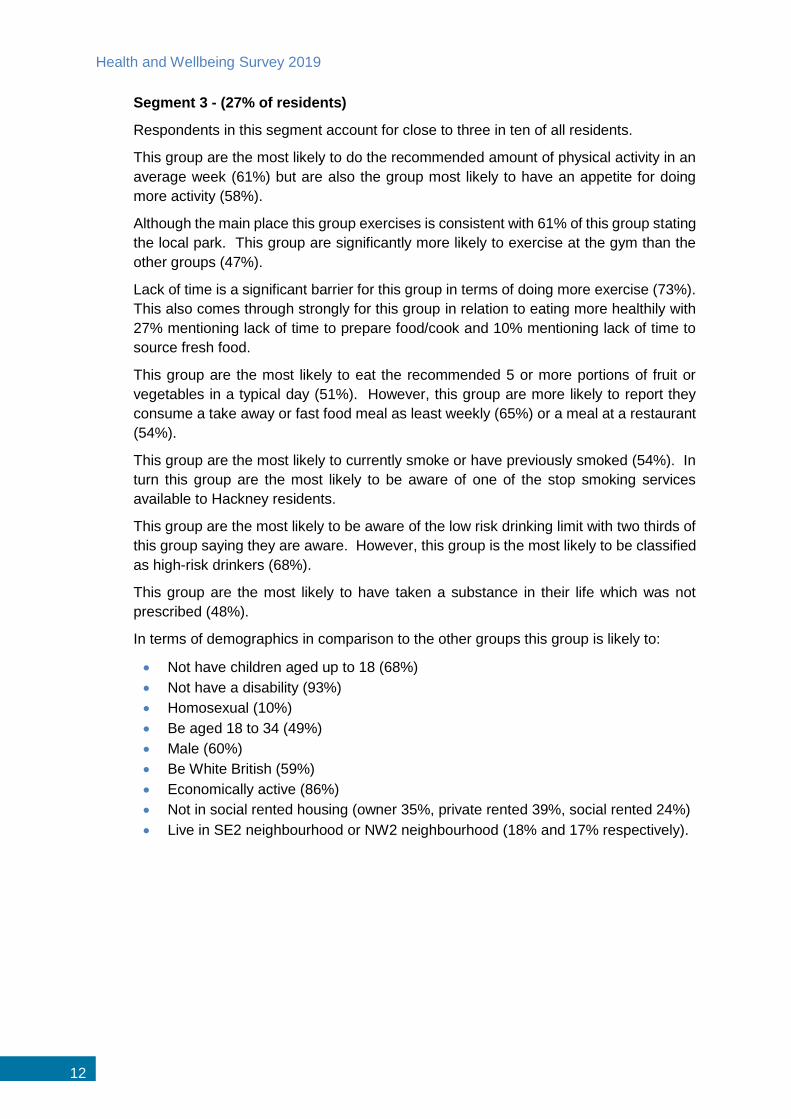
Segment 3 - (27% of residents)
Respondents in this segment account for close to three in ten of all residents.
This group are the most likely to do the recommended amount of physical activity in an
average week (61%) but are also the group most likely to have an appetite for doing
more activity (58%).
Although the main place this group exercises is consistent with 61% of this group stating
the local park. This group are significantly more likely to exercise at the gym than the
other groups (47%).
Lack of time is a significant barrier for this group in terms of doing more exercise (73%).
This also comes through strongly for this group in relation to eating more healthily with
27% mentioning lack of time to prepare food/cook and 10% mentioning lack of time to
source fresh food.
This group are the most likely to eat the recommended 5 or more portions of fruit or
vegetables in a typical day (51%). However, this group are more likely to report they
consume a take away or fast food meal as least weekly (65%) or a meal at a restaurant
(54%).
This group are the most likely to currently smoke or have previously smoked (54%). In
turn this group are the most likely to be aware of one of the stop smoking services
available to Hackney residents.
This group are the most likely to be aware of the low risk drinking limit with two thirds of
this group saying they are aware. However, this group is the most likely to be classified
as high-risk drinkers (68%).
This group are the most likely to have taken a substance in their life which was not
prescribed (48%).
In terms of demographics in comparison to the other groups this group is likely to:
Not have children aged up to 18 (68%)
Not have a disability (93%)
Homosexual (10%)
Be aged 18 to 34 (49%)
Male (60%)
Be White British (59%)
Economically active (86%)
Not in social rented housing (owner 35%, private rented 39%, social rented 24%)
Live in SE2 neighbourhood or NW2 neighbourhood (18% and 17% respectively).
Exercise and Recreation
Document Number: 22126785
Document Name: HWB survey final report Word version 13
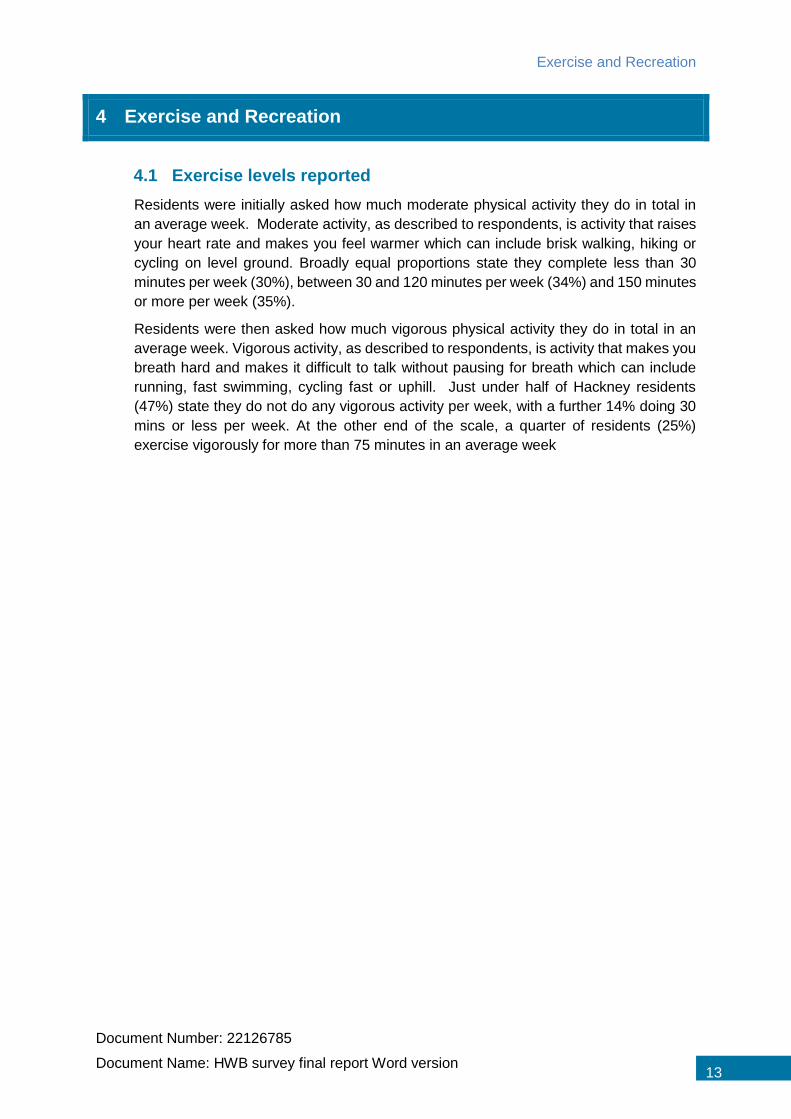
4 Exercise and Recreation
4.1 Exercise levels reported
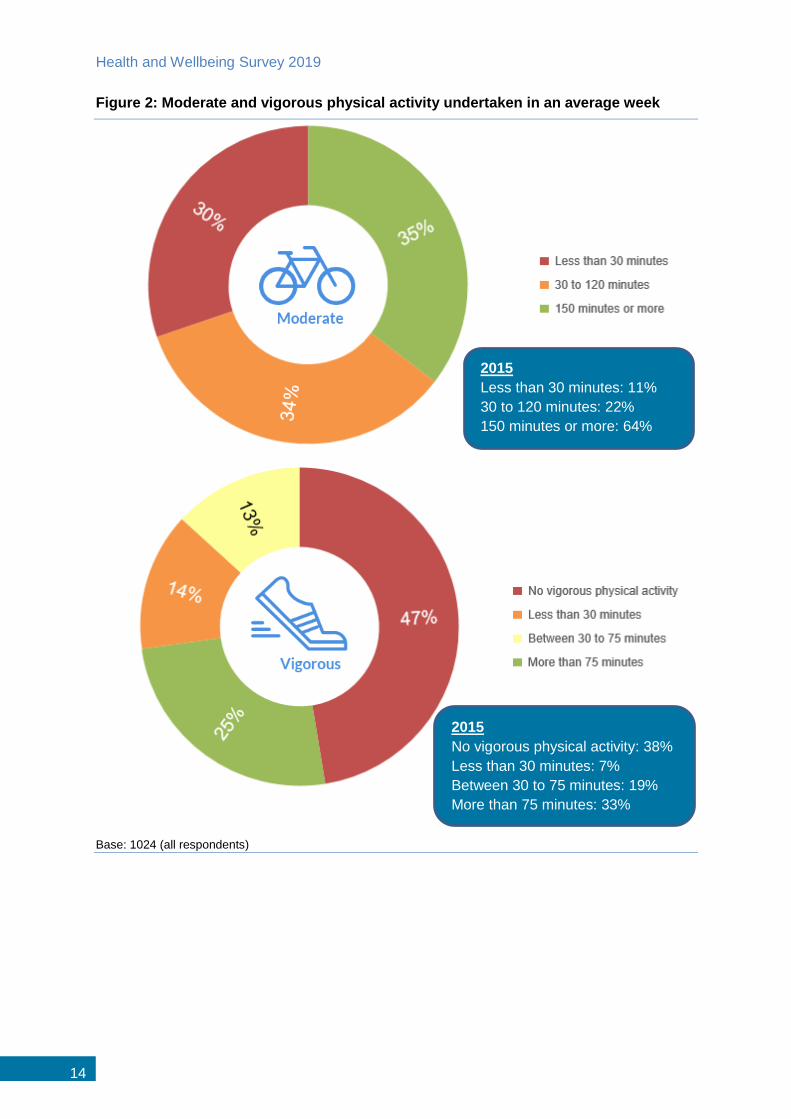
Residents were initially asked how much moderate physical activity they do in total in
an average week. Moderate activity, as described to respondents, is activity that raises
your heart rate and makes you feel warmer which can include brisk walking, hiking or
cycling on level ground. Broadly equal proportions state they complete less than 30
minutes per week (30%), between 30 and 120 minutes per week (34%) and 150 minutes
or more per week (35%).
Residents were then asked how much vigorous physical activity they do in total in an
average week. Vigorous activity, as described to respondents, is activity that makes you
breath hard and makes it difficult to talk without pausing for breath which can include
running, fast swimming, cycling fast or uphill. Just under half of Hackney residents
(47%) state they do not do any vigorous activity per week, with a further 14% doing 30
mins or less per week. At the other end of the scale, a quarter of residents (25%)
exercise vigorously for more than 75 minutes in an average week
Health and Wellbeing Survey 2019
14
Figure 2: Moderate and vigorous physical activity undertaken in an average week
Base: 1024 (all respondents)
2015
Less than 30 minutes: 11%
30 to 120 minutes: 22%
150 minutes or more: 64%
2015
No vigorous physical activity: 38%
Less than 30 minutes: 7%
Between 30 to 75 minutes: 19%
More than 75 minutes: 33%
Exercise and Recreation
Document Number: 22126785
Document Name: HWB survey final report Word version 15
Chief Medical Office (CMO) guidance recommends at least 150 minutes of moderate
activity or 75 minutes of vigorous activity a week is conducted or a combination of both.
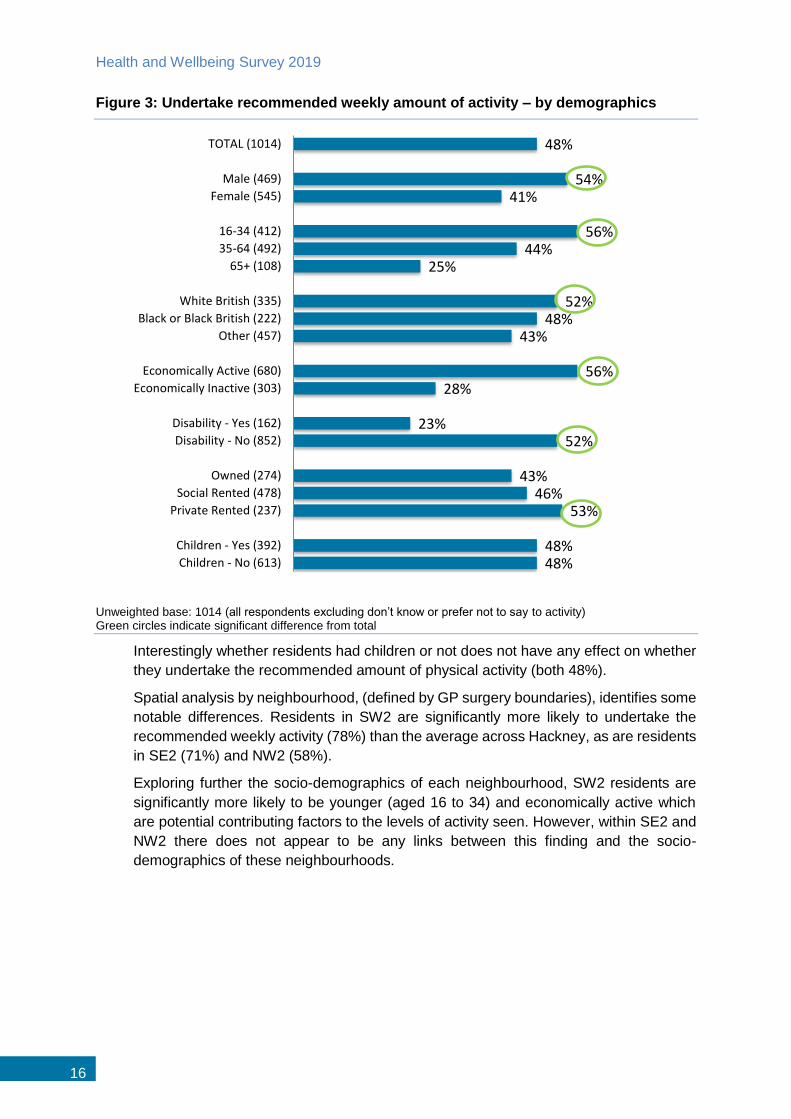
Close to a half of residents (48%) undertake the recommended weekly amount of
activity1 which as shown in the figure overleaf varies by demographics.
Males are significantly more likely than females to undertaken the recommended
weekly amount of activity (54% males vs 41% females).
As might be expected the level of activity significantly decreases with age with
over a half of residents aged 16 to 34 (56%) undertaking the recommended
amount compared with 44% of those aged 35 to 64 and just 25% of those aged
65+.
White British residents are significantly more likely to undertake the
recommended weekly amount of activity (52% vs 46% non-White-British).
Economically active residents are significantly more likely than those
economically inactive to undertake the recommended weekly amount of activity
(56% vs 28%) which is linked to the fact that 90% of respondents aged 65+ are
economically inactive.
Also, as might be expected residents with a disability are significantly less likely
to undertake the recommend weekly amount of activity (23% vs 52% without a
disability). Again, this group includes a high percentage of respondents aged
65+.
Those in private rented accommodation are significantly more likely to undertake
the recommended weekly amount of activity (53% vs 46% social rented and 43%
owned), although it is worth noting those in private rented accommodation are
more likely to be aged 16 to 34.
1 Residents have been classified as active if moderate = 150 minutes or more, vigorous = 75 minutes or more, also a combination of moderate and vigorous as follows:
- 120 minutes moderate and some vigorous activity (less than 30 minutes or 30 to 75 minutes)
- 30, 60 or 90 minutes moderate and 30 to 75 minutes vigorous
Health and Wellbeing Survey 2019
16
Figure 3: Undertake recommended weekly amount of activity – by demographics
Unweighted base: 1014 (all respondents excluding don’t know or prefer not to say to activity) Green circles indicate significant difference from total
Interestingly whether residents had children or not does not have any effect on whether
they undertake the recommended amount of physical activity (both 48%).
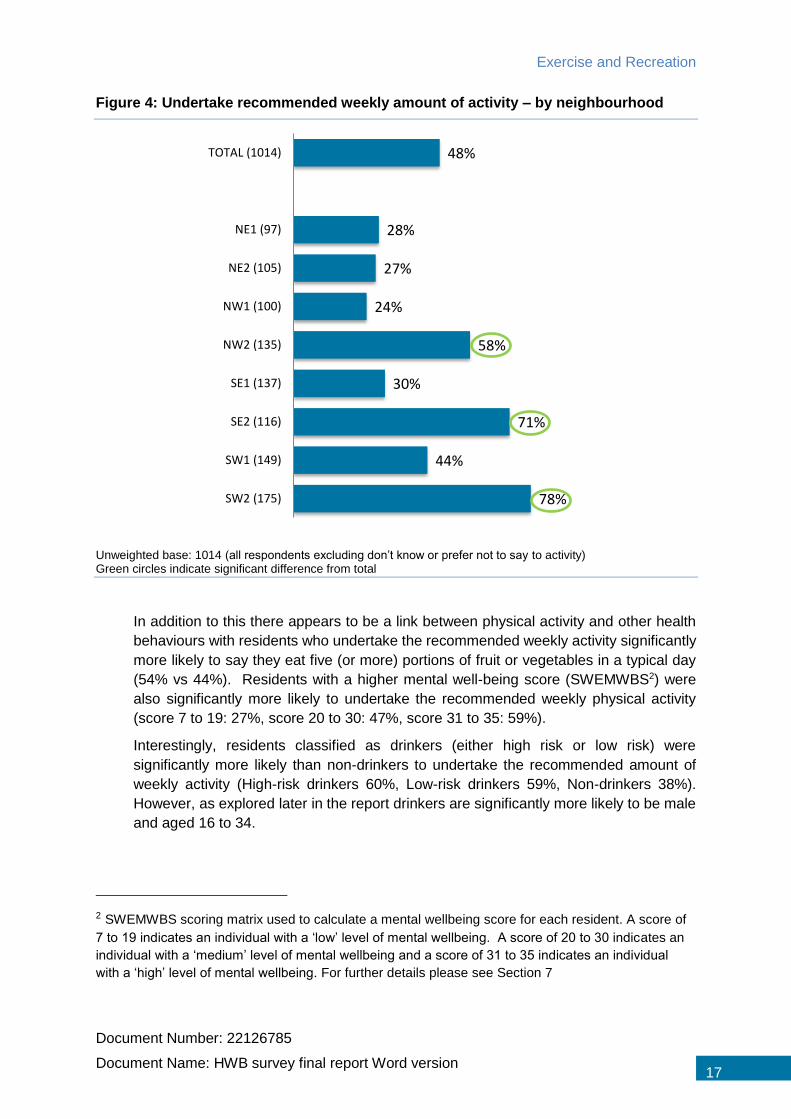
Spatial analysis by neighbourhood, (defined by GP surgery boundaries), identifies some
notable differences. Residents in SW2 are significantly more likely to undertake the
recommended weekly activity (78%) than the average across Hackney, as are residents
in SE2 (71%) and NW2 (58%).
Exploring further the socio-demographics of each neighbourhood, SW2 residents are
significantly more likely to be younger (aged 16 to 34) and economically active which
are potential contributing factors to the levels of activity seen. However, within SE2 and
NW2 there does not appear to be any links between this finding and the socio-
demographics of these neighbourhoods.
48%
54%41%
56%44%
25%
52%48%
43%
56%28%
23%52%
43%46%
53%
48%48%
TOTAL (1014)
Male (469)
Female (545)
16-34 (412)
35-64 (492)
65+ (108)
White British (335)
Black or Black British (222)
Other (457)
Economically Active (680)
Economically Inactive (303)
Disability - Yes (162)
Disability - No (852)
Owned (274)
Social Rented (478)
Private Rented (237)
Children - Yes (392)
Children - No (613)
Exercise and Recreation
Document Number: 22126785
Document Name: HWB survey final report Word version 17
Figure 4: Undertake recommended weekly amount of activity – by neighbourhood
Unweighted base: 1014 (all respondents excluding don’t know or prefer not to say to activity) Green circles indicate significant difference from total
In addition to this there appears to be a link between physical activity and other health
behaviours with residents who undertake the recommended weekly activity significantly
more likely to say they eat five (or more) portions of fruit or vegetables in a typical day
(54% vs 44%). Residents with a higher mental well-being score (SWEMWBS2) were
also significantly more likely to undertake the recommended weekly physical activity
(score 7 to 19: 27%, score 20 to 30: 47%, score 31 to 35: 59%).
Interestingly, residents classified as drinkers (either high risk or low risk) were
significantly more likely than non-drinkers to undertake the recommended amount of
weekly activity (High-risk drinkers 60%, Low-risk drinkers 59%, Non-drinkers 38%).
However, as explored later in the report drinkers are significantly more likely to be male
and aged 16 to 34.
2 SWEMWBS scoring matrix used to calculate a mental wellbeing score for each resident. A score of
7 to 19 indicates an individual with a ‘low’ level of mental wellbeing. A score of 20 to 30 indicates an
individual with a ‘medium’ level of mental wellbeing and a score of 31 to 35 indicates an individual
with a ‘high’ level of mental wellbeing. For further details please see Section 7
48%
28%
27%
24%
58%
30%
71%
44%
78%
TOTAL (1014)
NE1 (97)
NE2 (105)
NW1 (100)
NW2 (135)
SE1 (137)
SE2 (116)
SW1 (149)
SW2 (175)
Health and Wellbeing Survey 2019
18
4.2 Types of exercise undertaken
Those residents who said they did some moderate or vigorous exercise in an average
week were asked what types of exercise, sport or other physical activity they typically
do. This included physical activity undertaken as part of their job or around the home.
Residents were shown a list of activities, such as, walking, cycling, team sports, etc and
asked to pick what they do from the list. This was then followed up with a further question
to ascertain exactly what activities they undertake.
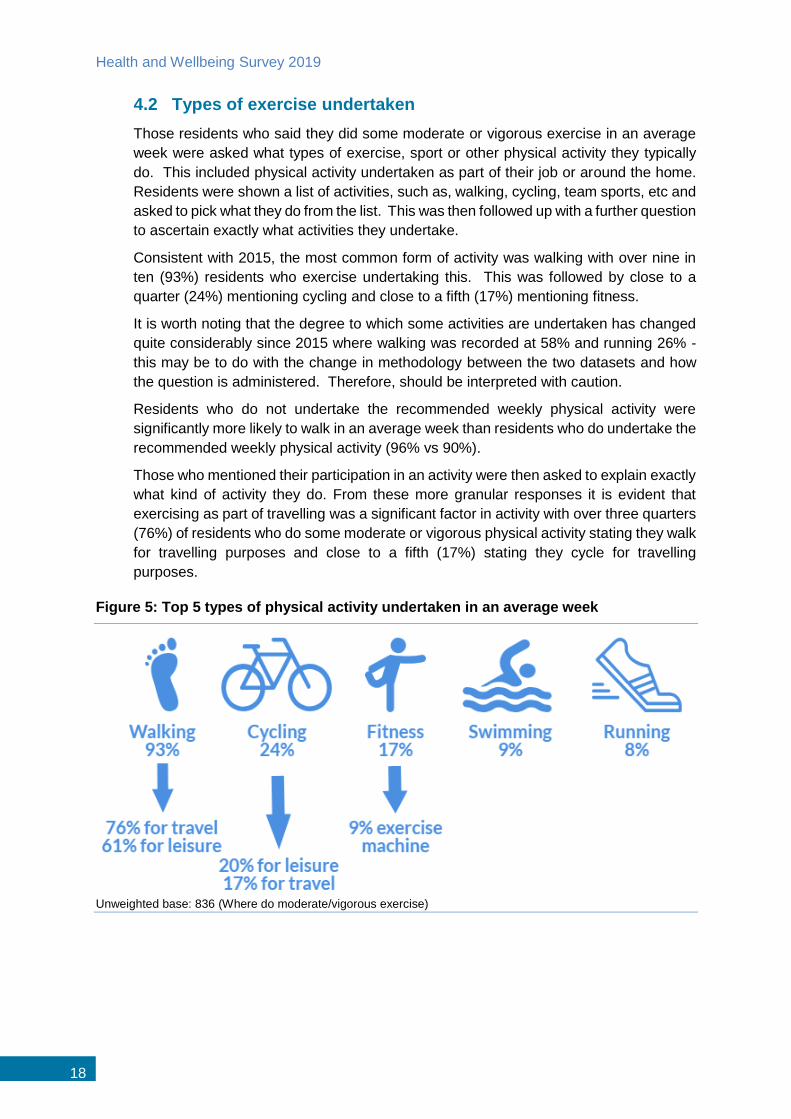
Consistent with 2015, the most common form of activity was walking with over nine in
ten (93%) residents who exercise undertaking this. This was followed by close to a
quarter (24%) mentioning cycling and close to a fifth (17%) mentioning fitness.
It is worth noting that the degree to which some activities are undertaken has changed
quite considerably since 2015 where walking was recorded at 58% and running 26% -
this may be to do with the change in methodology between the two datasets and how
the question is administered. Therefore, should be interpreted with caution.
Residents who do not undertake the recommended weekly physical activity were
significantly more likely to walk in an average week than residents who do undertake the
recommended weekly physical activity (96% vs 90%).
Those who mentioned their participation in an activity were then asked to explain exactly
what kind of activity they do. From these more granular responses it is evident that
exercising as part of travelling was a significant factor in activity with over three quarters
(76%) of residents who do some moderate or vigorous physical activity stating they walk
for travelling purposes and close to a fifth (17%) stating they cycle for travelling
purposes.
Figure 5: Top 5 types of physical activity undertaken in an average week
Unweighted base: 836 (Where do moderate/vigorous exercise)

Exercise and Recreation
Document Number: 22126785
Document Name: HWB survey final report Word version 19
4.3 Where residents exercise
Residents who undertake moderate or vigorous physical activity in a typical week were
then asked in which places they undertake exercise. Consistent with 2015 the main
places to undertake exercise remains outside either at the local park (62%) or outdoors
but not a park (41%).
Figure 6: Where exercise is undertaken
Unweighted base: 836 (Where do moderate/vigorous exercise)
The following groups of residents are significantly more likely to exercise at home:
Females (35% vs 28% males)
Residents aged 65+ (50% vs 30% 16-64)
Black or Black British (37% vs 30% other and 28% White British)
Economically inactive (38% vs 29% active).
Residents previously identified as being generally more physically active are significantly
more likely to exercise at a gym or leisure centre (whether that be privately run or Council
run). Among those who do the recommended level of weekly exercise 48% exercise in
a gym, compared to 20% of those who do not do the recommended level of exercise.
Deprivation appears to also be a contributing factor to where residents exercise with
those in the most deprived quintile significantly more likely to exercise at home (42%)
and those in the least deprived quintile significantly more likely to exercise at a gym
(44%) than the average across Hackney.

Health and Wellbeing Survey 2019
20
Facilities available nearby maybe a contributing factor regarding where exercise is done
and therefore where residents exercise has been explored by neighbourhood. As
highlighted in the table below there are some differences by neighbourhood with
residents in NE2, NW1 and SW1 significantly more likely to use the local park whereas
SE2 and SW2 residents are significantly more likely to exercise outdoors but not in a
park.
Interestingly SW2 residents, who as identified previously are the most likely to undertake
the recommended amount of activity, were significantly more likely to undertake physical
activity at home (41%) than the average across Hackney. Exploring this further shows
no links between this finding and the socio-demographics of SW2 residents.
Table 2: Where exercise is undertaken – by neighbourhood
Neighbourhood Local Park
Outdoors, but not a park
Gym or Leisure Centre
Home
NE1 (72) 65% 25% 37% 26%
NE2 (85) 80% 40% 21% 15%
NW1 (91) 74% 17% 27% 26%
NW2 (120) 52% 46% 36% 33%
SE1 (100) 64% 25% 38% 37%
SE2 (106) 57% 55% 37% 28%
SW1 (114) 71% 47% 41% 35%
SW2 (148) 46% 55% 42% 41%
Green shading indicates significant difference from total
Exercise and Recreation
Document Number: 22126785
Document Name: HWB survey final report Word version 21
4.4 Perceptions of exercise levels
After establishing how much exercise and the types of exercise residents undertake,
they were then asked about their perceptions of the levels of exercise they undertake
and whether they felt it was enough or not and whether they would like to do more.
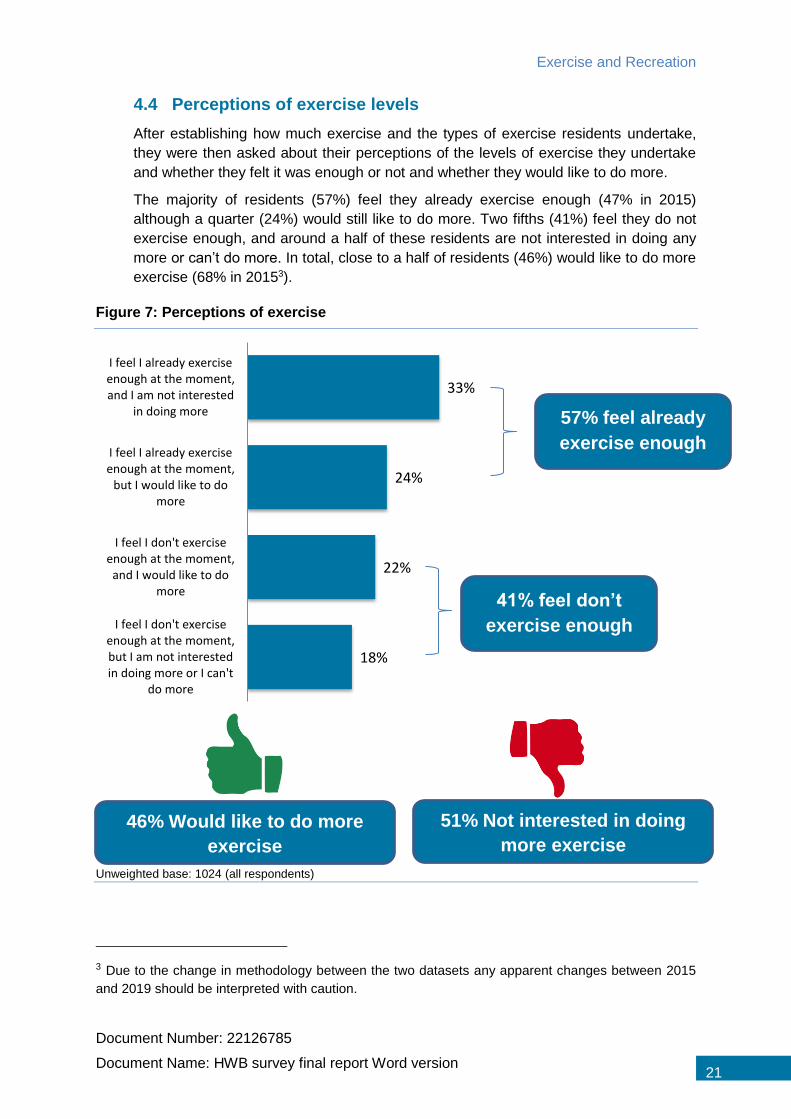
The majority of residents (57%) feel they already exercise enough (47% in 2015)
although a quarter (24%) would still like to do more. Two fifths (41%) feel they do not
exercise enough, and around a half of these residents are not interested in doing any
more or can’t do more. In total, close to a half of residents (46%) would like to do more
exercise (68% in 20153).
Figure 7: Perceptions of exercise
Unweighted base: 1024 (all respondents)
3 Due to the change in methodology between the two datasets any apparent changes between 2015
and 2019 should be interpreted with caution.
33%
24%
22%
18%
I feel I already exerciseenough at the moment,and I am not interested
in doing more
I feel I already exerciseenough at the moment,
but I would like to domore
I feel I don't exerciseenough at the moment,and I would like to do
more
I feel I don't exerciseenough at the moment,but I am not interestedin doing more or I can't
do more
46% Would like to do more
exercise
51% Not interested in doing
more exercise
57% feel already
exercise enough
41% feel don’t
exercise enough

Health and Wellbeing Survey 2019
22
Residents who currently already undertake the recommended weekly amount of activity
are significantly more likely to say they would like to do more (56% vs 38% who do not
do recommended amount). Looking specifically at residents who undertake less than
30 minutes of moderate or vigorous exercise in a typical week, which is a key target
group for Hackney, shows that over a quarter of these residents (26%) would like to do
more exercise.
Economically active residents are significantly more likely to feel they do enough
exercise (59% vs 48% economically inactive). The resident groups most likely to say
they don’t do enough exercise but did not want to do more tended to be those as
mentioned previously that did not undertake the recommended amount of activity i.e.:
Those who have a disability (37% vs 15% without a disability);
Those who are economically inactive (31% vs 13% economically active);
Those aged 65+ (32% vs 20% 35-64 and 13% 16-34).
Residents who have children under 18 in their household were also asked to consider
whether they feel that their child(ren) exercises too much, about right amount or too little.
In response, the majority of residents with children feel that their child(ren) does about
the right amount of exercise – 82% of residents with children aged 5 to 18 and 83% of
residents with children under 5.
Figure 8: Perceptions of Children’s exercise
Unweighted bases: 210 (where had children under 5), 294 (where had children 5-18)
2%
1%
8%
9%
83%
82%
6%
8%
Children under 5
Children aged 5 to 18
Don't know Too little About the right amount Too much
Exercise and Recreation
Document Number: 22126785
Document Name: HWB survey final report Word version 23
Interestingly residents that do not themselves undertake the recommended weekly
amount of physical activity who have children were more likely to feel their child did
about the right amount of exercise:
89% of parents with children under 5 who themselves do not undertake the
recommended amount of exercise say their child does the right amount of
exercise vs 77% of parents who do the recommended amount.
87% of parents with children aged 5 to 18 who themselves do not undertake the
recommended amount of exercise say their child does the right amount of
exercise vs 76% of parents who do the recommended amount.
The proportion of parents who feel their children do the right amount of exercise is
significantly higher than in the 2015 survey, when 70% of parents with children under 5
and 67% of parents with children aged 5 to 18 felt their child(ren) did the right amount
of exercise. However, it must be stressed that this question is perceptions based. The
level of exercise the children in question do was not recorded in this research. As
previously mentioned, any apparent changes between 2015 and 2019 should be
interpreted with caution due to change in methodology.
4.5 Barriers to exercise
Residents who feel that they don’t exercise enough and those who feel they already
exercise enough but would like to do more, were asked what if anything prevents them
from doing more exercise
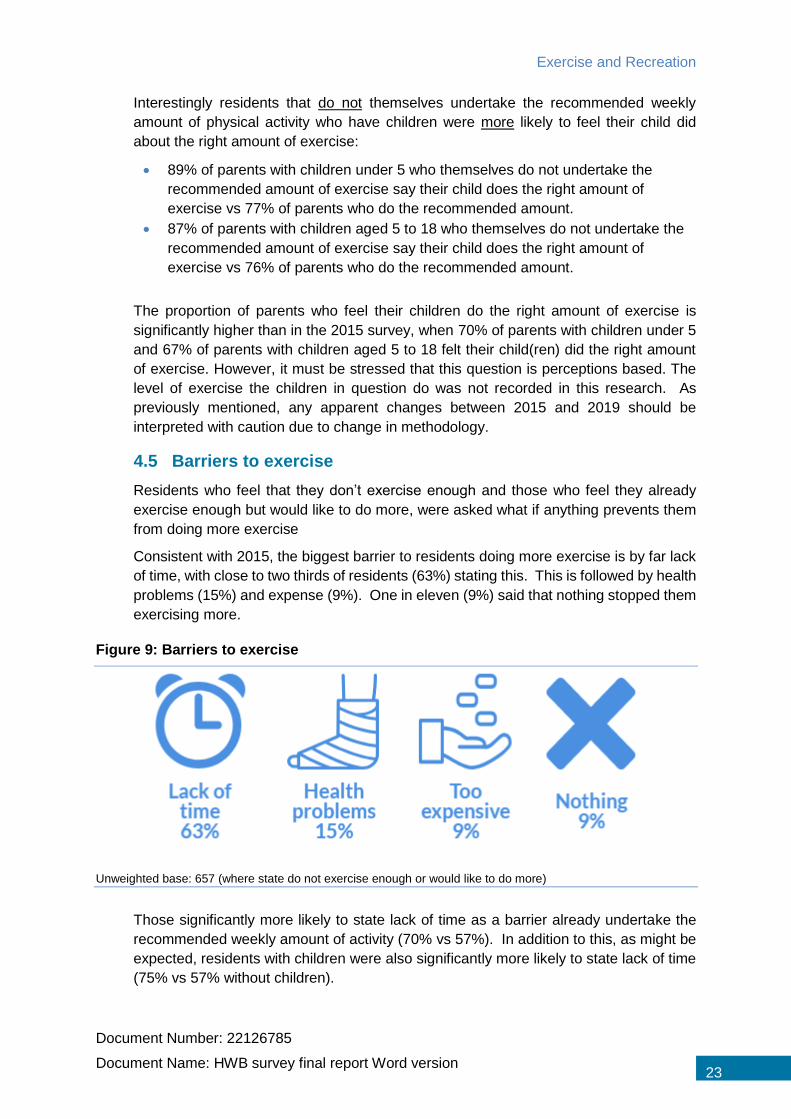
Consistent with 2015, the biggest barrier to residents doing more exercise is by far lack
of time, with close to two thirds of residents (63%) stating this. This is followed by health
problems (15%) and expense (9%). One in eleven (9%) said that nothing stopped them
exercising more.
Figure 9: Barriers to exercise
Unweighted base: 657 (where state do not exercise enough or would like to do more)
Those significantly more likely to state lack of time as a barrier already undertake the
recommended weekly amount of activity (70% vs 57%). In addition to this, as might be
expected, residents with children were also significantly more likely to state lack of time
(75% vs 57% without children).
Health and Wellbeing Survey 2019
24
Although not the biggest barriers to exercise there were some interesting mentions
which included:
Lack of organised sport in my area (2% - 13 residents)
Facilities/classes are not at convenient times (1% - 10 residents)
Facilities/classes difficult to get to (1% - 9 residents) – especially amongst SE2
residents (5% - 4 residents).
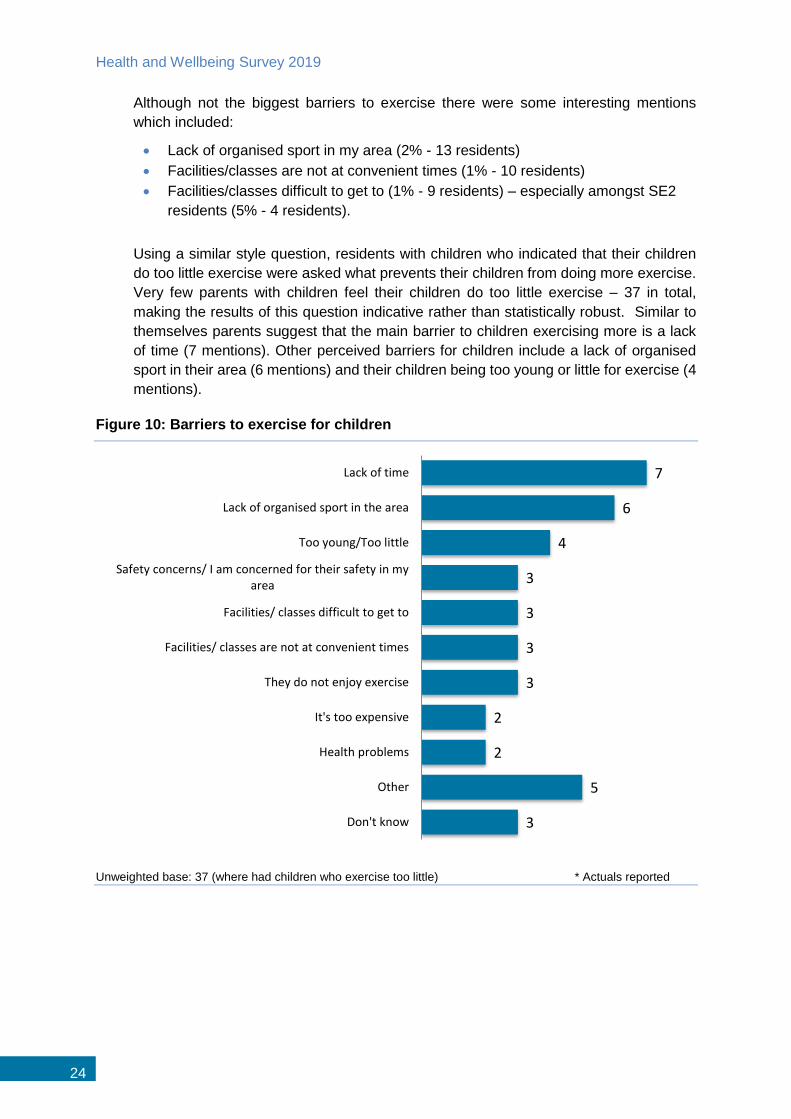
Using a similar style question, residents with children who indicated that their children
do too little exercise were asked what prevents their children from doing more exercise.
Very few parents with children feel their children do too little exercise – 37 in total,
making the results of this question indicative rather than statistically robust. Similar to
themselves parents suggest that the main barrier to children exercising more is a lack
of time (7 mentions). Other perceived barriers for children include a lack of organised
sport in their area (6 mentions) and their children being too young or little for exercise (4
mentions).
Figure 10: Barriers to exercise for children
Unweighted base: 37 (where had children who exercise too little) * Actuals reported
7
6
4
3
3
3
3
2
2
5
3
Lack of time
Lack of organised sport in the area
Too young/Too little
Safety concerns/ I am concerned for their safety in myarea
Facilities/ classes difficult to get to
Facilities/ classes are not at convenient times
They do not enjoy exercise
It's too expensive
Health problems
Other
Don't know

Diet
Document Number: 22126785
Document Name: HWB survey final report Word version 25
5 Diet
5.1 Perceptions of diet
All residents participating in the research were asked about their food and eating habits
and to what extent they feel they have a healthy diet overall.
Almost nine in ten residents (87%) agree they have a healthy diet overall, which is 7%
higher than reported in 20154. This includes 40% who gave the most positive response
of strongly agree. Only 4% disagree they have a healthy diet.
Figure 11: Perceptions of diet – ‘To what extent to do you agree or disagree that you have a healthy diet overall’
Unweighted base: 1024 (all respondents)
There is a link between healthy diet and the ability of individuals to make ends meet.
90% of those who rarely or never have difficulties in making ends meet are likely to
agree they have a healthy diet overall. This proportion drops significantly (83%) among
those who sometimes or always have difficulty making ends meet. However, this still
means that a clear majority of households have positive perceptions of their diet. No
significant variations are evident in these perceptions by IMD quintile.
Looking at perceptions of diet by neighbourhood shows residents living in SE2 are
significantly less likely than the average across Hackney to feel they eat healthily overall
(75%). Interestingly, this was one of the neighbourhoods where residents are more likely
to undertake the recommended amount of physical activity. This is partially linked to the
fact that SE2 residents are significantly more likely to be in social rented housing.
There is, perhaps not surprisingly, a correlation between perceived healthiness of diet
and reported consumption of fruit and vegetables. More than nine in ten (94%) residents
who consume their daily 5 a day intake feel they have a healthy diet overall. This is 11-
percentage points higher than among those who report not having their five portions a
day (83%).
4 Due to the change in methodology between the two datasets any apparent changes between 2015
and 2019 should be interpreted with caution.
40% 47% 9% 3%1%
Strongly agree Tend to agree Neither agree nor disagree
Tend to disagree Strongly disagree
Health and Wellbeing Survey 2019
26
Those with a lower mental wellbeing score (SWEMWBS) are significantly less likely to
feel they have a healthy diet with just seven in ten (71%) of those with a score of 7 to 19
agreeing.
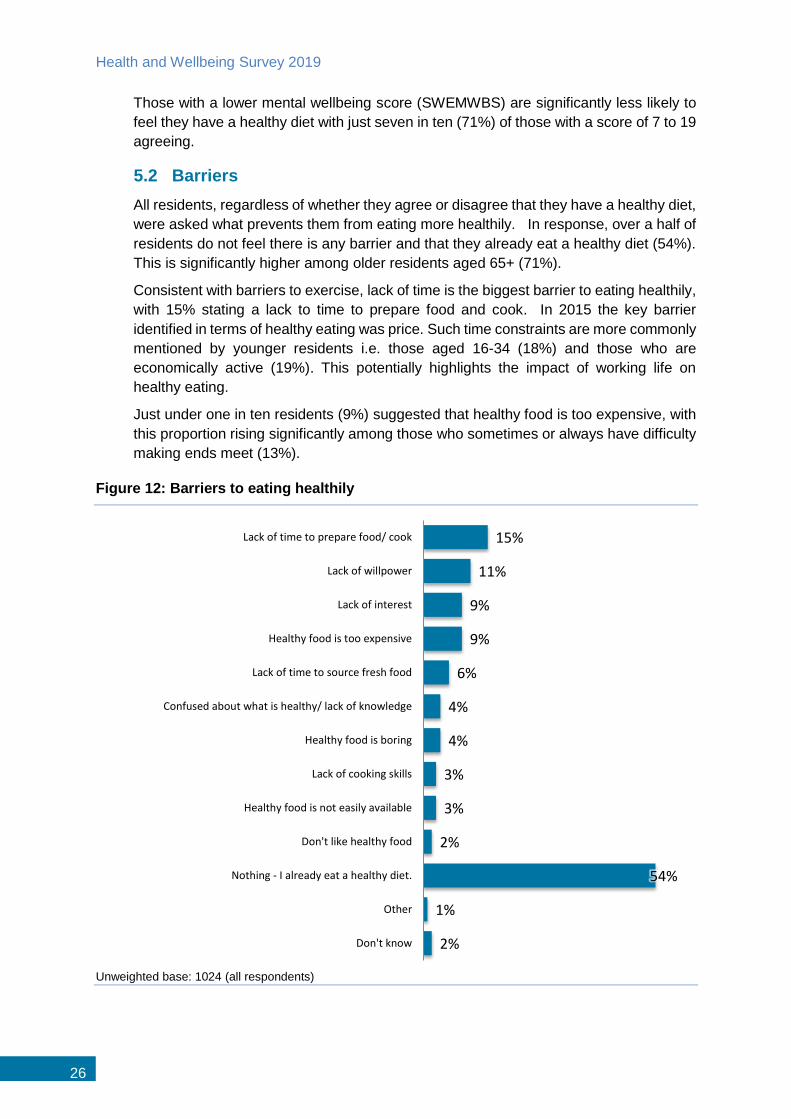
5.2 Barriers
All residents, regardless of whether they agree or disagree that they have a healthy diet,
were asked what prevents them from eating more healthily. In response, over a half of
residents do not feel there is any barrier and that they already eat a healthy diet (54%).
This is significantly higher among older residents aged 65+ (71%).
Consistent with barriers to exercise, lack of time is the biggest barrier to eating healthily,
with 15% stating a lack to time to prepare food and cook. In 2015 the key barrier
identified in terms of healthy eating was price. Such time constraints are more commonly
mentioned by younger residents i.e. those aged 16-34 (18%) and those who are
economically active (19%). This potentially highlights the impact of working life on
healthy eating.
Just under one in ten residents (9%) suggested that healthy food is too expensive, with
this proportion rising significantly among those who sometimes or always have difficulty
making ends meet (13%).
Figure 12: Barriers to eating healthily
Unweighted base: 1024 (all respondents)
15%
11%
9%
9%
6%
4%
4%
3%
3%
2%
54%
1%
2%
Lack of time to prepare food/ cook
Lack of willpower
Lack of interest
Healthy food is too expensive
Lack of time to source fresh food
Confused about what is healthy/ lack of knowledge
Healthy food is boring
Lack of cooking skills
Healthy food is not easily available
Don't like healthy food
Nothing - I already eat a healthy diet.
Other
Don't know
Diet
Document Number: 22126785
Document Name: HWB survey final report Word version 27
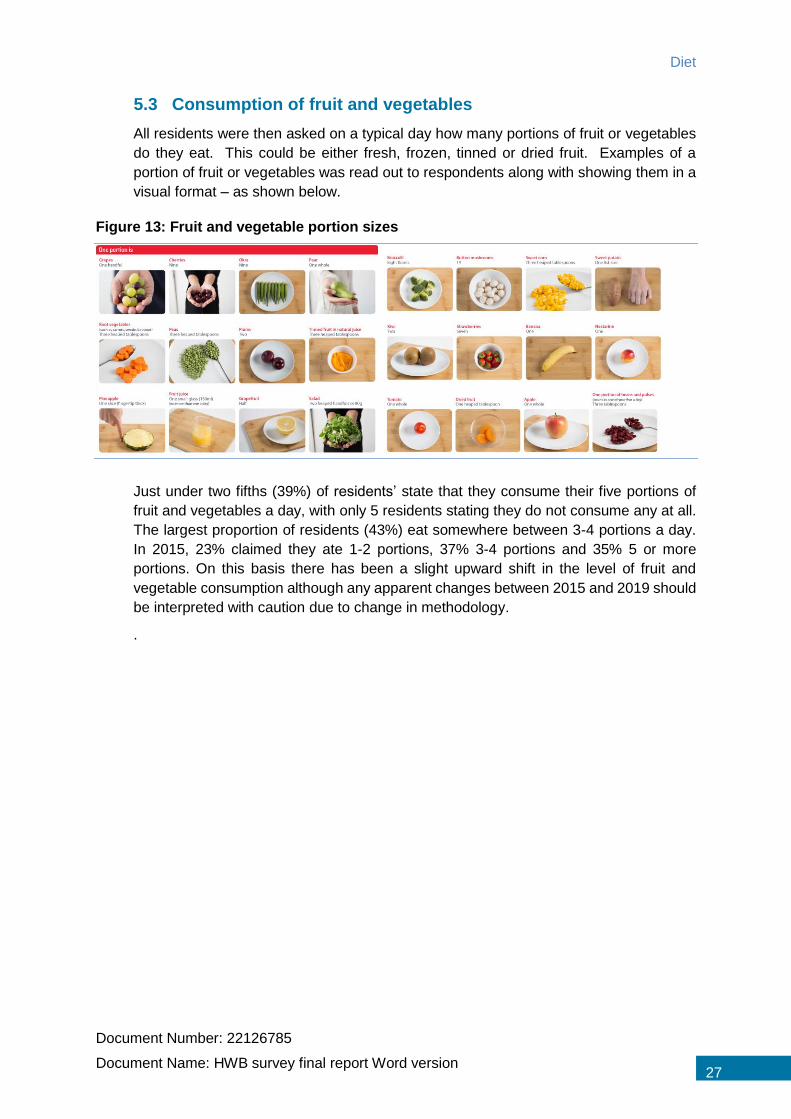
5.3 Consumption of fruit and vegetables
All residents were then asked on a typical day how many portions of fruit or vegetables
do they eat. This could be either fresh, frozen, tinned or dried fruit. Examples of a
portion of fruit or vegetables was read out to respondents along with showing them in a
visual format – as shown below.
Figure 13: Fruit and vegetable portion sizes
Just under two fifths (39%) of residents’ state that they consume their five portions of
fruit and vegetables a day, with only 5 residents stating they do not consume any at all.
The largest proportion of residents (43%) eat somewhere between 3-4 portions a day.
In 2015, 23% claimed they ate 1-2 portions, 37% 3-4 portions and 35% 5 or more
portions. On this basis there has been a slight upward shift in the level of fruit and
vegetable consumption although any apparent changes between 2015 and 2019 should
be interpreted with caution due to change in methodology.
.
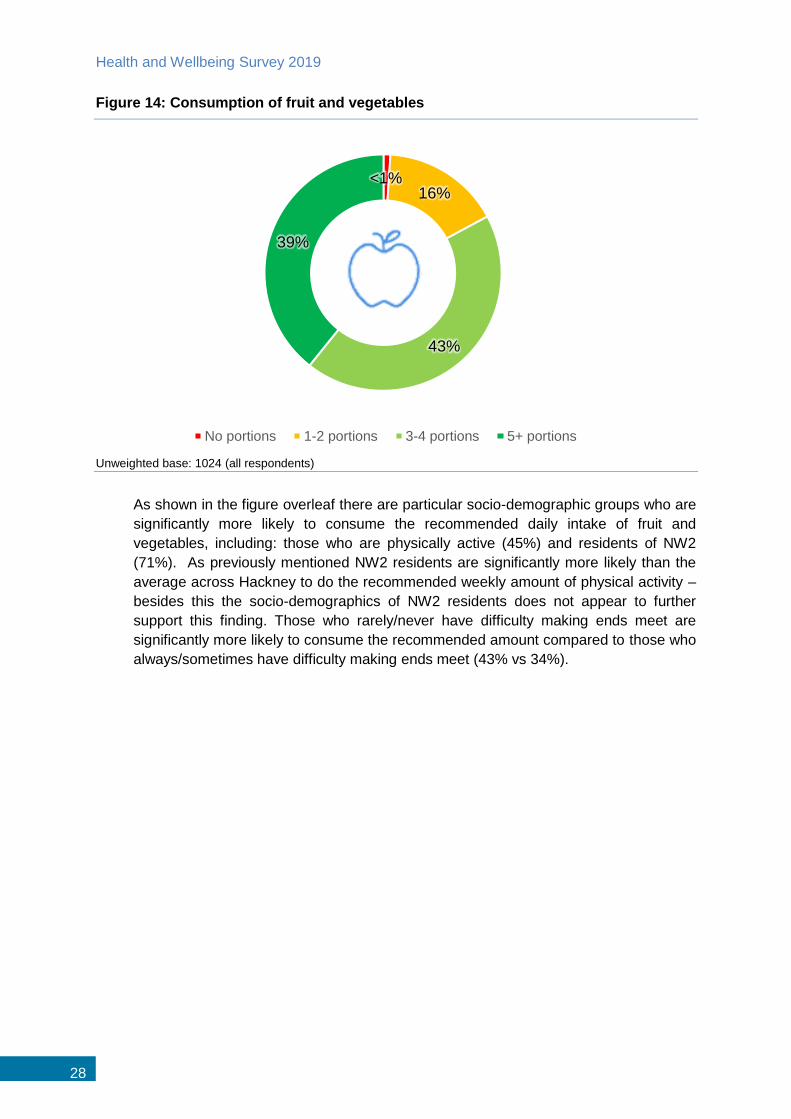
Health and Wellbeing Survey 2019
28
Figure 14: Consumption of fruit and vegetables
Unweighted base: 1024 (all respondents)
As shown in the figure overleaf there are particular socio-demographic groups who are
significantly more likely to consume the recommended daily intake of fruit and
vegetables, including: those who are physically active (45%) and residents of NW2
(71%). As previously mentioned NW2 residents are significantly more likely than the
average across Hackney to do the recommended weekly amount of physical activity –
besides this the socio-demographics of NW2 residents does not appear to further
support this finding. Those who rarely/never have difficulty making ends meet are
significantly more likely to consume the recommended amount compared to those who
always/sometimes have difficulty making ends meet (43% vs 34%).
<1%16%
43%
39%
No portions 1-2 portions 3-4 portions 5+ portions

Diet
Document Number: 22126785
Document Name: HWB survey final report Word version 29
Figure 15: Groups significantly more likely to consume recommended daily intake of fruit and vegetables
Unweighted base: 1024 (all respondents)
Health and Wellbeing Survey 2019
30
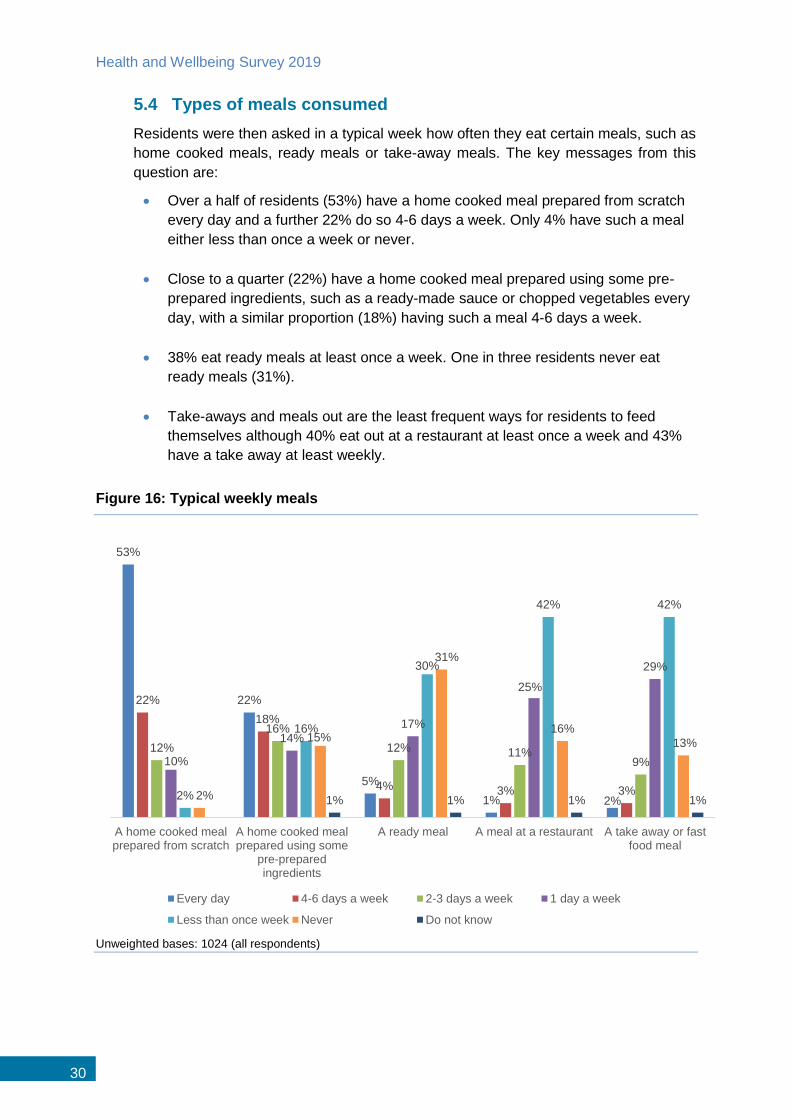
5.4 Types of meals consumed
Residents were then asked in a typical week how often they eat certain meals, such as
home cooked meals, ready meals or take-away meals. The key messages from this
question are:
Over a half of residents (53%) have a home cooked meal prepared from scratch
every day and a further 22% do so 4-6 days a week. Only 4% have such a meal
either less than once a week or never.
Close to a quarter (22%) have a home cooked meal prepared using some pre-
prepared ingredients, such as a ready-made sauce or chopped vegetables every
day, with a similar proportion (18%) having such a meal 4-6 days a week.
38% eat ready meals at least once a week. One in three residents never eat
ready meals (31%).
Take-aways and meals out are the least frequent ways for residents to feed
themselves although 40% eat out at a restaurant at least once a week and 43%
have a take away at least weekly.
Figure 16: Typical weekly meals
Unweighted bases: 1024 (all respondents)
53%
22%
5%
1% 2%
22%
18%
4% 3% 3%
12%
16%
12% 11%9%10%
14%
17%
25%
29%
2%
16%
30%
42% 42%
2%
15%
31%
16%
13%
1% 1% 1% 1%
A home cooked mealprepared from scratch
A home cooked mealprepared using some
pre-preparedingredients
A ready meal A meal at a restaurant A take away or fastfood meal
Every day 4-6 days a week 2-3 days a week 1 day a week
Less than once week Never Do not know
Diet
Document Number: 22126785
Document Name: HWB survey final report Word version 31
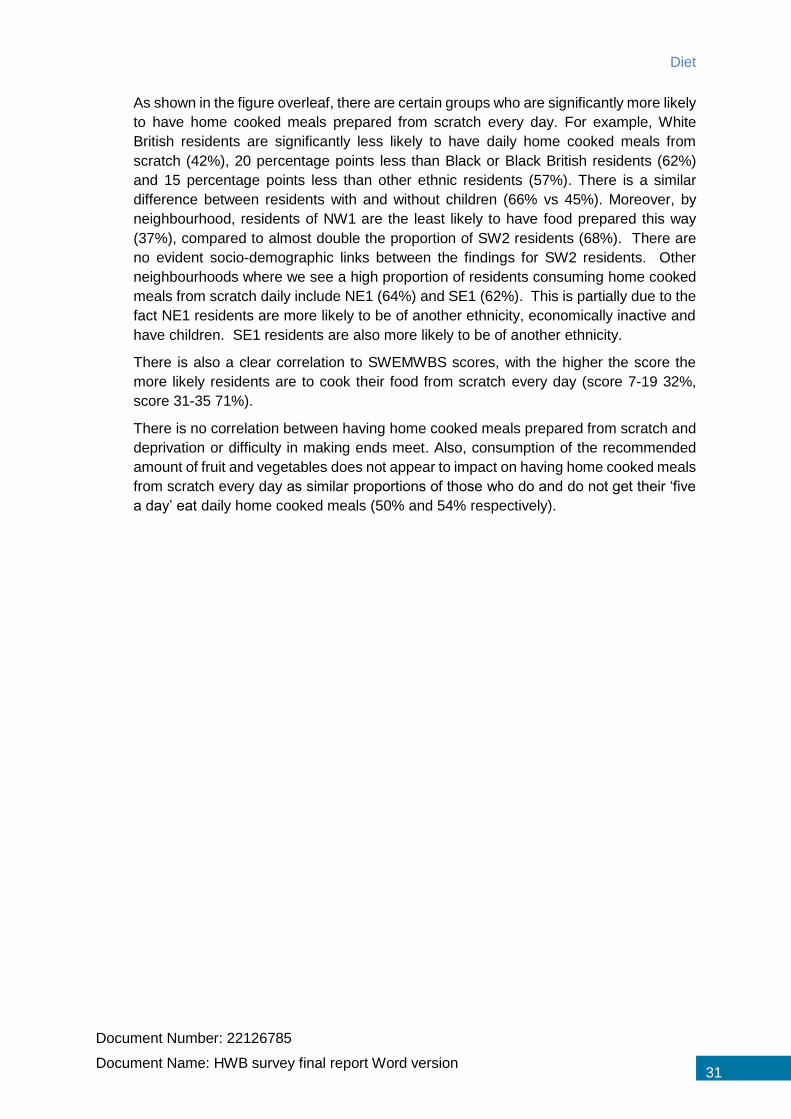
As shown in the figure overleaf, there are certain groups who are significantly more likely
to have home cooked meals prepared from scratch every day. For example, White
British residents are significantly less likely to have daily home cooked meals from
scratch (42%), 20 percentage points less than Black or Black British residents (62%)
and 15 percentage points less than other ethnic residents (57%). There is a similar
difference between residents with and without children (66% vs 45%). Moreover, by
neighbourhood, residents of NW1 are the least likely to have food prepared this way
(37%), compared to almost double the proportion of SW2 residents (68%). There are
no evident socio-demographic links between the findings for SW2 residents. Other
neighbourhoods where we see a high proportion of residents consuming home cooked
meals from scratch daily include NE1 (64%) and SE1 (62%). This is partially due to the
fact NE1 residents are more likely to be of another ethnicity, economically inactive and
have children. SE1 residents are also more likely to be of another ethnicity.
There is also a clear correlation to SWEMWBS scores, with the higher the score the
more likely residents are to cook their food from scratch every day (score 7-19 32%,
score 31-35 71%).
There is no correlation between having home cooked meals prepared from scratch and
deprivation or difficulty in making ends meet. Also, consumption of the recommended
amount of fruit and vegetables does not appear to impact on having home cooked meals
from scratch every day as similar proportions of those who do and do not get their ‘five
a day’ eat daily home cooked meals (50% and 54% respectively).
Health and Wellbeing Survey 2019
32
Figure 17: Groups significantly more likely to have a home cooked meal from scratch every day
Unweighted base: 1024 (all respondents)
Diet
Document Number: 22126785
Document Name: HWB survey final report Word version 33
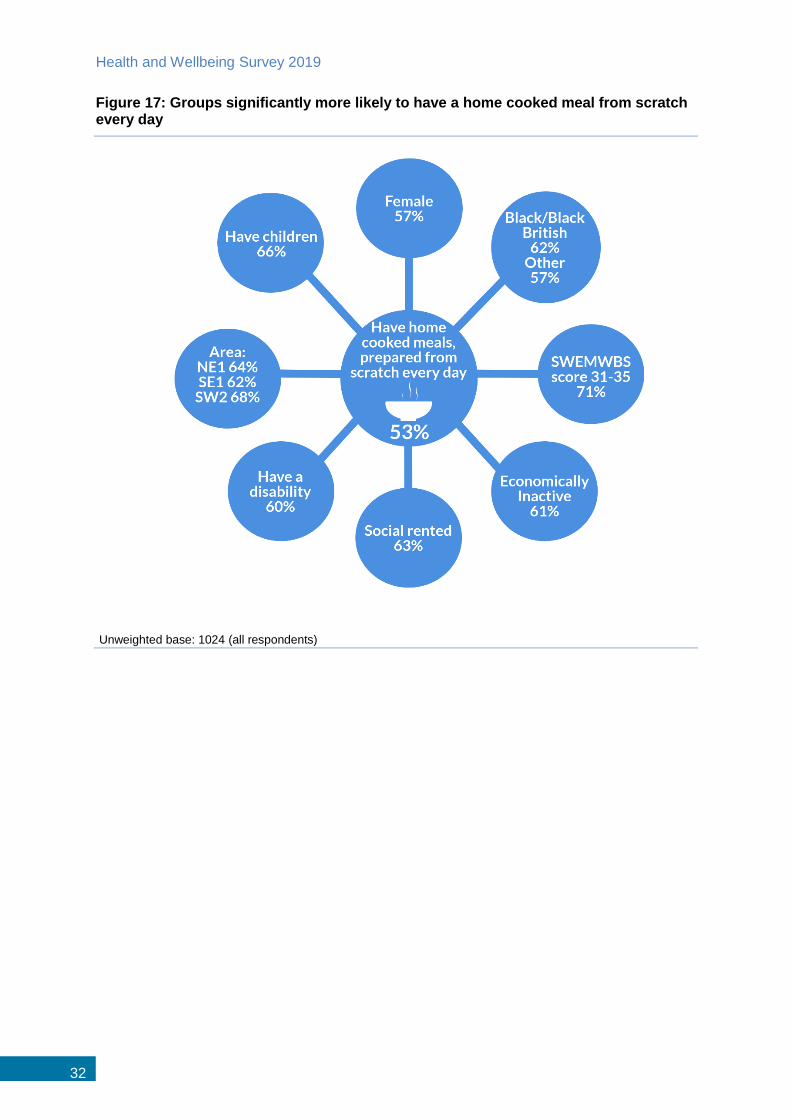
There are particular socio-demographic groups who more commonly report consuming
take-aways or fast food two or more days per week. This includes residents living in
NW2 (21%) and SW1 (20%), those without children under 18 (17%), and carers (20%).
There is also a clear pattern by age, as younger residents are most likely to consume
larger volumes of take-aways and fast food, with double the number of those aged 16-
34 (16%) doing so compared to those aged 65+ (8%).
The neighbourhood findings are partially linked to socio-demographics with NW2
residents more likely to always or sometimes have difficulty making ends meet and SW1
residents more likely to not have children.
Furthermore, almost a quarter of high-risk drinkers (24%) report consuming take-aways
or fast food two or more days a week, 10% above the total average. It should also be
noted that one in four (24%) of those with the lowest SWEMWBS scores report
consuming take-aways and fast food two or more days a week, with 6% consuming them
daily.
Figure 18. Groups who consume higher than the average take-aways or fast food over two or more days per week
Unweighted base: 1024 (all respondents)
Health and Wellbeing Survey 2019
34
6 Smoking
6.1 Frequency smoke
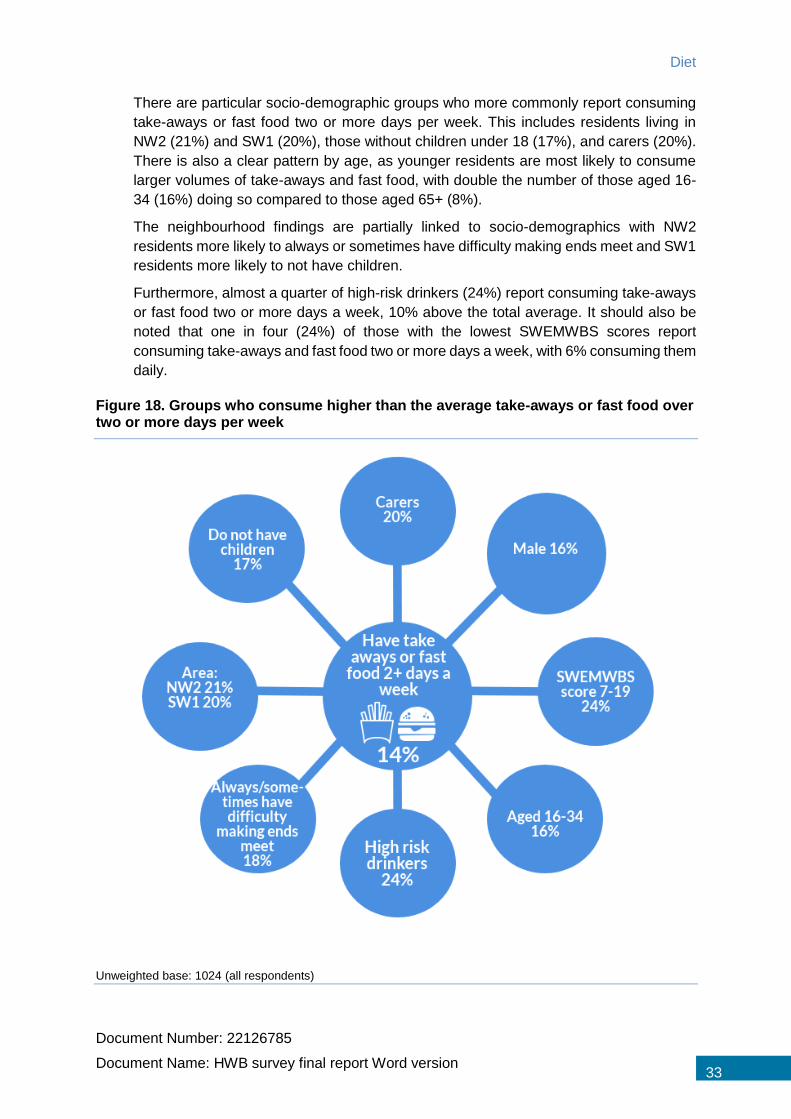
All survey respondents were asked about their smoking habits which included cigarettes,
electronic cigarettes, pipes, chewing tobacco, water pipes or something else. Close to
three quarters of all residents’ report having never smoked (73%). Therefore, consistent
with 2015, a fifth of residents (21%) currently smoke with 5% of residents previously
smoking.
Figure 19: Smoking habits
Unweighted base: 1024 (all respondents)
Those who smoked (or used to smoke) were more likely to be:
Males (32% vs 21% female)
White British (32% vs 19% Black or Black British and 25% Other)
Without children (28% vs 23% with children)
Have a disability (33% vs 25% without a disability)
Have difficulty making ends meet always or sometimes (32% vs 23% rarely or
never)
SE2 neighbourhood residents (45%)
High-risk drinkers (53% vs 16% Non-drinkers or 26% Low-risk drinkers).
Exploring the socio-demographics of SE2 residents further does not identify any links
between socio-demographics and the higher rates of current or ex-smokers reported.
The table overleaf details how often residents smoke.
73%
16% 4%1%
5%
I have never smoked Once a day or more Several times a week
At least once a month Used to smoke

Smoking
Document Number: 22126785
Document Name: HWB survey final report Word version 35
Table 3: What smoke by frequency
UNWEIGHTED
BASE
10+ per day
1<9 per day
Several times a week
At least once per month
Used in the past
Cigarettes (pre rolled)
168 23% 25% 13% 6% 34%
Cigarettes (roll up)
123 24% 36% 17% 4% 19%
Electronic cigarettes, e-cigarettes or vapes
41 19% (N=8)
12% (N=5)
18% (N=8)
12% (N=5)
39% (N=17)
Pipe 14 0%
9%
(N=1)
6%
(N=1) 0%
85% (N=11)
Chewing tobacco
18 8%
(N=1)
6%
(N=1) 0%
10% (N=2)
76% (N=13)
Shisha, hookah or water pipes
19 5%
(N=1) 0% 0% 0%
95% (N=17)
Something else 122 29% 30% 19% 7% 15%
Health and Wellbeing Survey 2019
36
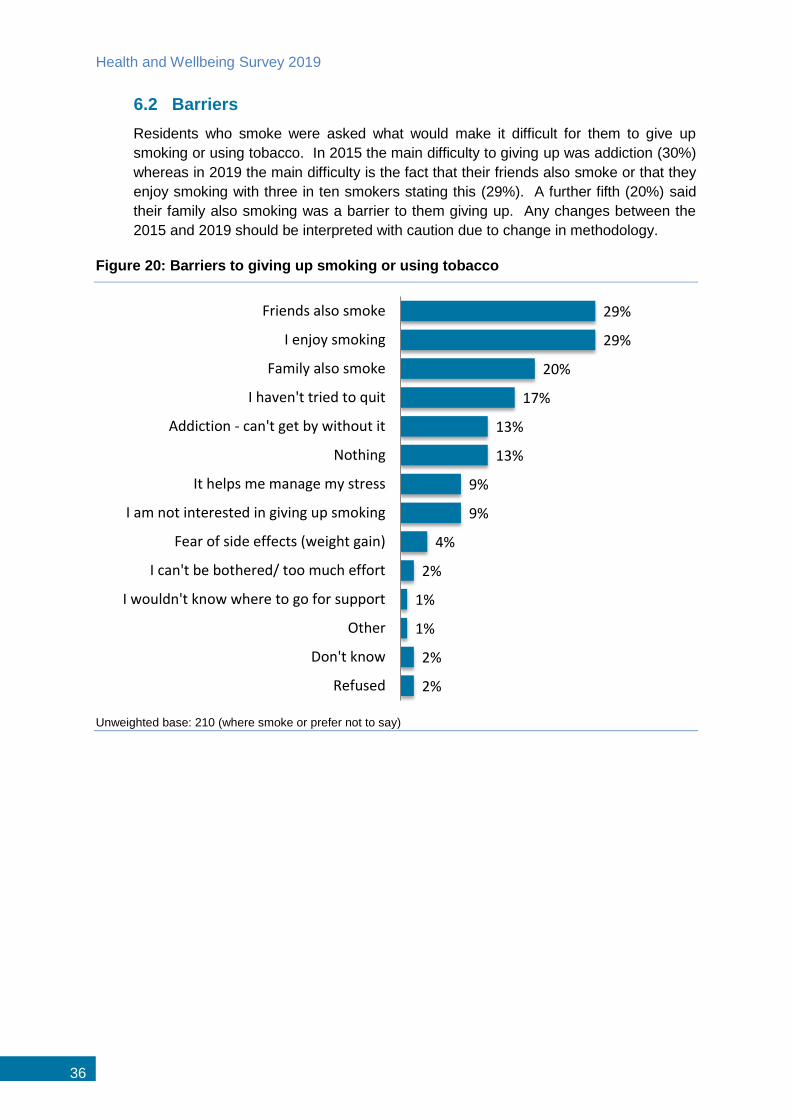
6.2 Barriers
Residents who smoke were asked what would make it difficult for them to give up
smoking or using tobacco. In 2015 the main difficulty to giving up was addiction (30%)
whereas in 2019 the main difficulty is the fact that their friends also smoke or that they
enjoy smoking with three in ten smokers stating this (29%). A further fifth (20%) said
their family also smoking was a barrier to them giving up. Any changes between the
2015 and 2019 should be interpreted with caution due to change in methodology.
Figure 20: Barriers to giving up smoking or using tobacco
Unweighted base: 210 (where smoke or prefer not to say)
29%
29%
20%
17%
13%
13%
9%
9%
4%
2%
1%
1%
2%
2%
Friends also smoke
I enjoy smoking
Family also smoke
I haven't tried to quit
Addiction - can't get by without it
Nothing
It helps me manage my stress
I am not interested in giving up smoking
Fear of side effects (weight gain)
I can't be bothered/ too much effort
I wouldn't know where to go for support
Other
Don't know
Refused
Smoking
Document Number: 22126785
Document Name: HWB survey final report Word version 37
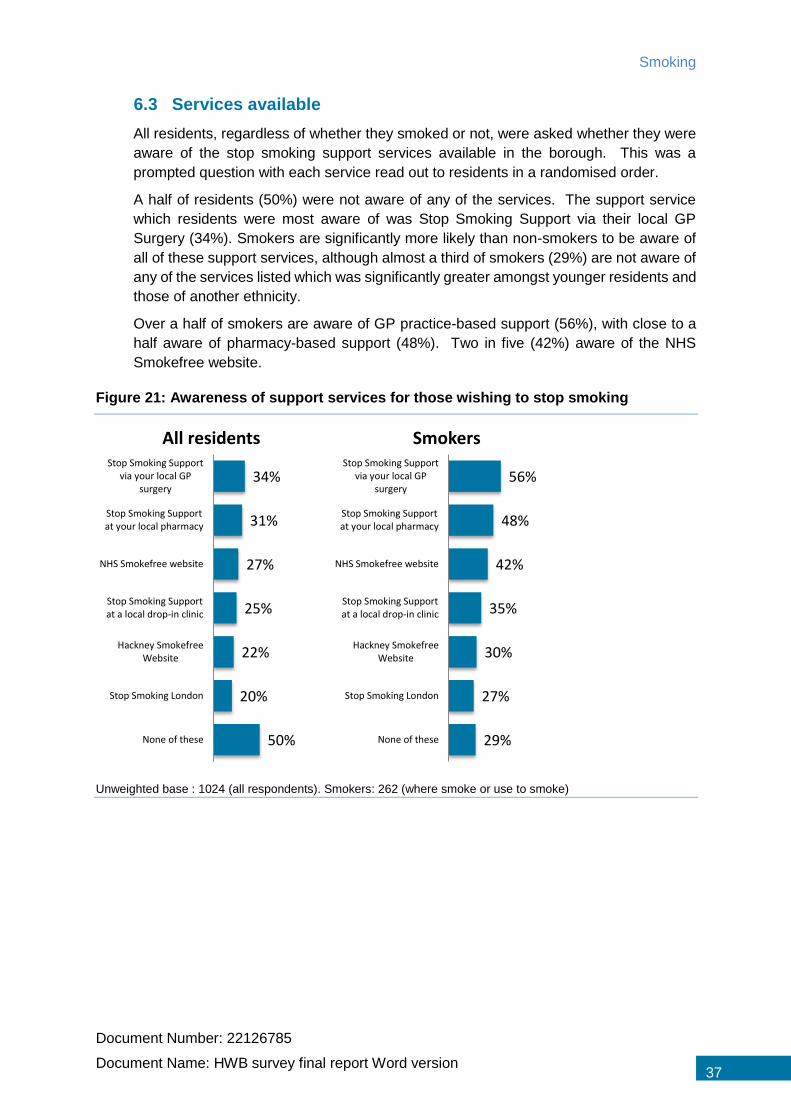
6.3 Services available
All residents, regardless of whether they smoked or not, were asked whether they were
aware of the stop smoking support services available in the borough. This was a
prompted question with each service read out to residents in a randomised order.
A half of residents (50%) were not aware of any of the services. The support service
which residents were most aware of was Stop Smoking Support via their local GP
Surgery (34%). Smokers are significantly more likely than non-smokers to be aware of
all of these support services, although almost a third of smokers (29%) are not aware of
any of the services listed which was significantly greater amongst younger residents and
those of another ethnicity.
Over a half of smokers are aware of GP practice-based support (56%), with close to a
half aware of pharmacy-based support (48%). Two in five (42%) aware of the NHS
Smokefree website.
Figure 21: Awareness of support services for those wishing to stop smoking
Unweighted base : 1024 (all respondents). Smokers: 262 (where smoke or use to smoke)
34%
31%
27%
25%
22%
20%
50%
Stop Smoking Supportvia your local GP
surgery
Stop Smoking Supportat your local pharmacy
NHS Smokefree website
Stop Smoking Supportat a local drop-in clinic
Hackney SmokefreeWebsite
Stop Smoking London
None of these
All residents
56%
48%
42%
35%
30%
27%
29%
Stop Smoking Supportvia your local GP
surgery
Stop Smoking Supportat your local pharmacy
NHS Smokefree website
Stop Smoking Supportat a local drop-in clinic
Hackney SmokefreeWebsite
Stop Smoking London
None of these
Smokers
Health and Wellbeing Survey 2019
38
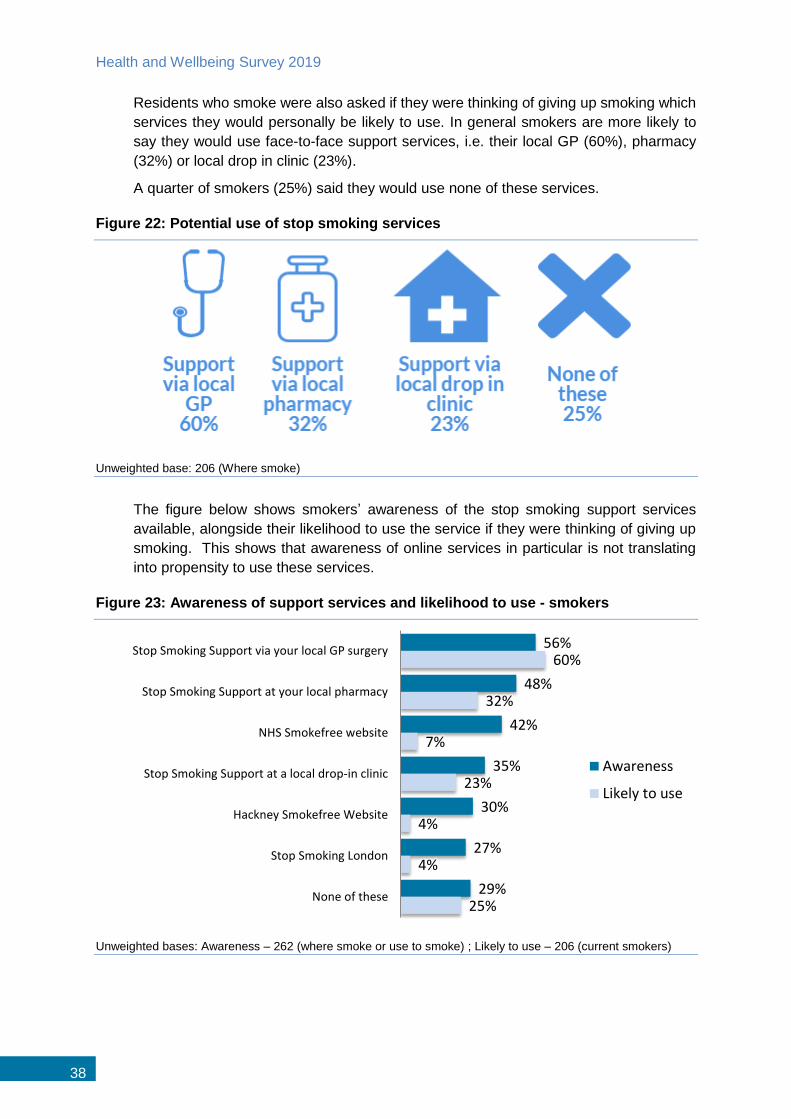
Residents who smoke were also asked if they were thinking of giving up smoking which
services they would personally be likely to use. In general smokers are more likely to
say they would use face-to-face support services, i.e. their local GP (60%), pharmacy
(32%) or local drop in clinic (23%).
A quarter of smokers (25%) said they would use none of these services.
Figure 22: Potential use of stop smoking services
Unweighted base: 206 (Where smoke)
The figure below shows smokers’ awareness of the stop smoking support services
available, alongside their likelihood to use the service if they were thinking of giving up
smoking. This shows that awareness of online services in particular is not translating
into propensity to use these services.
Figure 23: Awareness of support services and likelihood to use - smokers
Unweighted bases: Awareness – 262 (where smoke or use to smoke) ; Likely to use – 206 (current smokers)
56%
48%
42%
35%
30%
27%
29%
60%
32%
7%
23%
4%
4%
25%
Stop Smoking Support via your local GP surgery
Stop Smoking Support at your local pharmacy
NHS Smokefree website
Stop Smoking Support at a local drop-in clinic
Hackney Smokefree Website
Stop Smoking London
None of these
Awareness
Likely to use

Sexual Health Services
Document Number: 22126785
Document Name: HWB survey final report Word version 39
7 Sexual Health Services
Residents were asked if they needed support in relation to their sexual health which free
services would they consider using. Sexual health services could include reproductive
health services, contraceptive use and preventing/testing/treating sexually transmitted
infections.
The majority of residents (85%) said they would consider using at least one of the free
services available locally. Consistent with what we have seen previously with regards
to stop smoking support services, the service residents would be most likely to use to
access sexual health services if they needed it was GPs with close to four fifths (79%)
of residents mentioning this. Over a half of residents (52%) said they would use sexual
health clinics in Hackney.
There were 15% of residents saying they would not use any of the services which was
higher amongst residents aged 65 or above.
Figure 24: Use of sexual health services
Unweighted base: 1024 (all respondents)
79%
52%
39%
37%
30%
27%
15%
85%
GPs
Sexual health clinics in Hackney
Pharmacies
Sexual Health clinics across London
Online/e-services
Local community organisations
None of these
Summary: Any of these
Health and Wellbeing Survey 2019
40
8 Mental Wellbeing
In order to assess mental wellbeing residents were asked about their thoughts and
feelings generally and how often they had felt a certain way over the past two weeks.
The shortened Warwick-Edinburgh Mental Well-being scale (SWEMWBS) which
consists of 7 positively worded items for assessing mental wellbeing was used5.
Residents were invited to complete this bank of questions themselves with the
interviewer handing them their tablet computer. Interviewers were able to assist any
residents who were unable to complete the questions themselves.
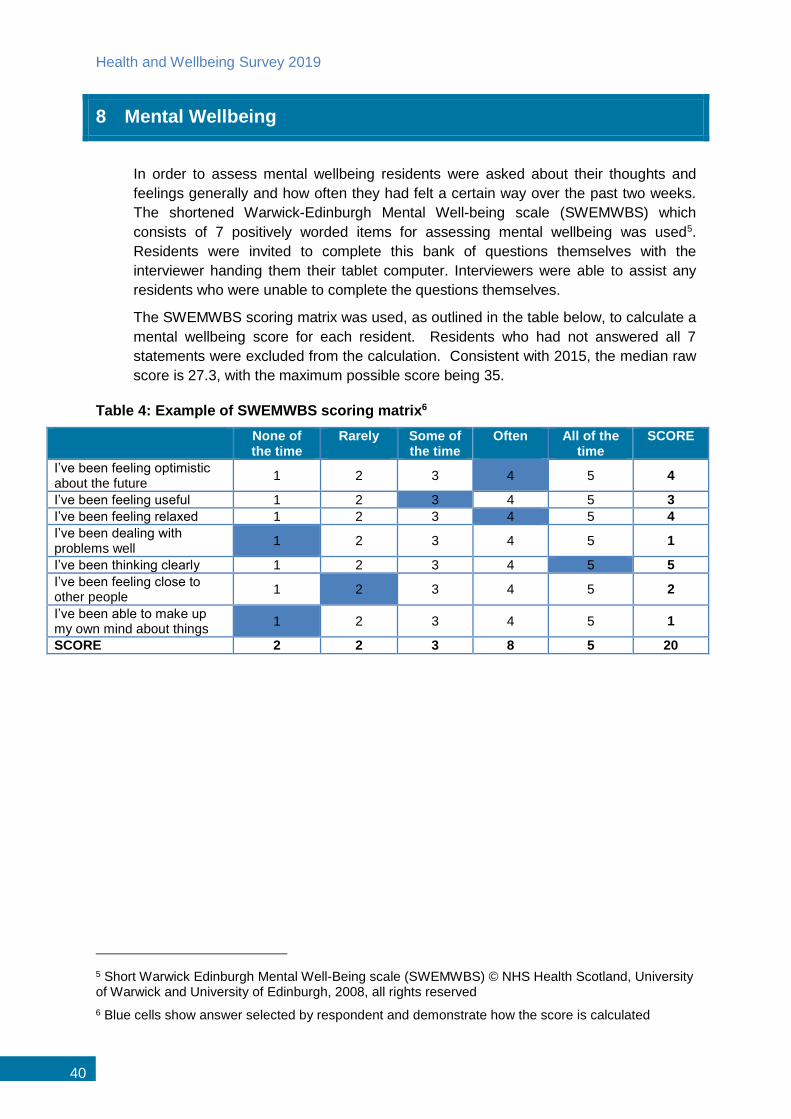
The SWEMWBS scoring matrix was used, as outlined in the table below, to calculate a
mental wellbeing score for each resident. Residents who had not answered all 7
statements were excluded from the calculation. Consistent with 2015, the median raw
score is 27.3, with the maximum possible score being 35.
Table 4: Example of SWEMWBS scoring matrix6
None of the time
Rarely
Some of the time
Often
All of the time
SCORE
I’ve been feeling optimistic about the future
1 2 3 4 5 4
I’ve been feeling useful 1 2 3 4 5 3
I’ve been feeling relaxed 1 2 3 4 5 4
I’ve been dealing with problems well
1 2 3 4 5 1
I’ve been thinking clearly 1 2 3 4 5 5
I’ve been feeling close to other people
1 2 3 4 5 2
I’ve been able to make up my own mind about things
1 2 3 4 5 1
SCORE 2 2 3 8 5 20
5 Short Warwick Edinburgh Mental Well-Being scale (SWEMWBS) © NHS Health Scotland, University of Warwick and University of Edinburgh, 2008, all rights reserved
6 Blue cells show answer selected by respondent and demonstrate how the score is calculated
Mental Wellbeing
Document Number: 22126785
Document Name: HWB survey final report Word version 41
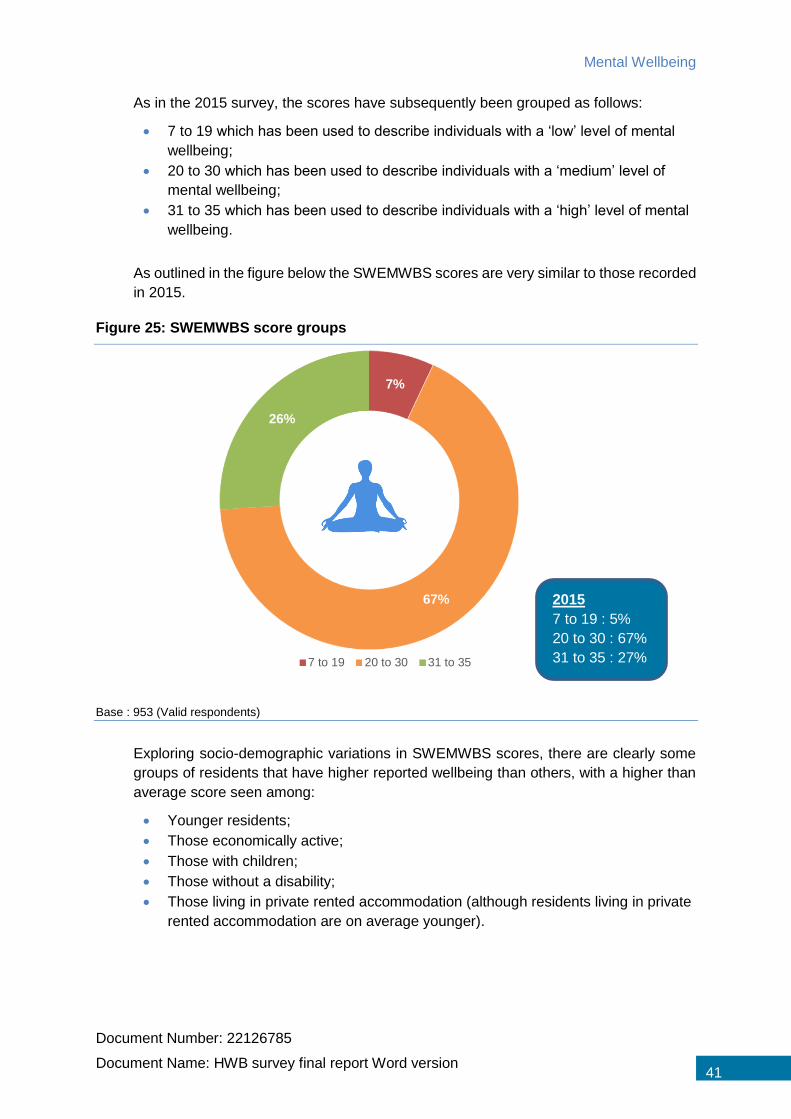
As in the 2015 survey, the scores have subsequently been grouped as follows:
7 to 19 which has been used to describe individuals with a ‘low’ level of mental
wellbeing;
20 to 30 which has been used to describe individuals with a ‘medium’ level of
mental wellbeing;
31 to 35 which has been used to describe individuals with a ‘high’ level of mental
wellbeing.
As outlined in the figure below the SWEMWBS scores are very similar to those recorded
in 2015.
Figure 25: SWEMWBS score groups
Base : 953 (Valid respondents)
Exploring socio-demographic variations in SWEMWBS scores, there are clearly some
groups of residents that have higher reported wellbeing than others, with a higher than
average score seen among:
Younger residents;
Those economically active;
Those with children;
Those without a disability;
Those living in private rented accommodation (although residents living in private
rented accommodation are on average younger).
7%
67%
26%
7 to 19 20 to 30 31 to 35
2015
7 to 19 : 5%
20 to 30 : 67%
31 to 35 : 27%

Health and Wellbeing Survey 2019
42
Furthermore, those residents who undertake the recommended weekly amount of
activity have a higher mental wellbeing score (28.34 vs 26.39) than those residents
classified as inactive. This also supports findings from the Mental Health Foundation
where links between physical health and mental health have been identified with poor
physical health leading to an increased risk of developing mental health problems and
vice versa poor mental health having a negative impact on physical health.
Further analysis also shows that residents who rarely or never have difficulty making
ends meet have a higher mental wellbeing score (27.99 vs 26.24) than those residents
who always or sometimes have difficulty making ends meet. This is further supported
with those residents in social rented accommodation having a lower mental wellbeing
score (26.91).
Figure 26: SWEMWBS score – by demographics
Unweighted base: Bases in parenthesis (All valid respondents) Green circles indicate significant difference from total
The figure overleaf summarises the balance of the responses given in relation to each
of 7 statements about mental wellbeing.
27.33
27.4527.22
27.9626.88
26.69
26.9527.67
27.49
27.5726.81
24.4627.85
27.3826.91
27.90
28.2726.79
Total (953)
Male (435)Female (518)
16-34 (382)35-64 (464)
65+ (104)
White British (320)Black or Black British (209)
Other (424)
Economically Active (642)Economically Inactive (284)
Disability - Yes (158)Disability - No (795)
Owned (250)Social Rented (450)
Private Rented (231)
Children - Yes (377)Children - No (570)

Mental Wellbeing
Document Number: 22126785
Document Name: HWB survey final report Word version 43
Figure 27: Perceptions of wellbeing
Unweighted bases: 1024 (all respondents)
10%
9%
7%
6%
6%
6%
5%
64%
61%
67%
66%
67%
69%
73%
5%
4%
4%
5%
4%
5%
5%
I've been feeling optimistic about the future
I've been feel relaxed
I've been feeling useful
I've been dealing with problems well
I've been thinking clearly
I've been feeling close to other people
I've been able to make up my own mind about things
None of the time/ Rarely Often/ All the time Don't know / Prefer not to say
Health and Wellbeing Survey 2019
44
9 Substance Misuse
9.1 Alcohol use
In this final section residents were initially asked about their consumption of alcohol.
Residents were asked from a list of statements which best describes their drinking
habits. Residents were not informed prior to answering this question what the
recommended low risk drinking limit was so therefore answered this question based on
their perception only.
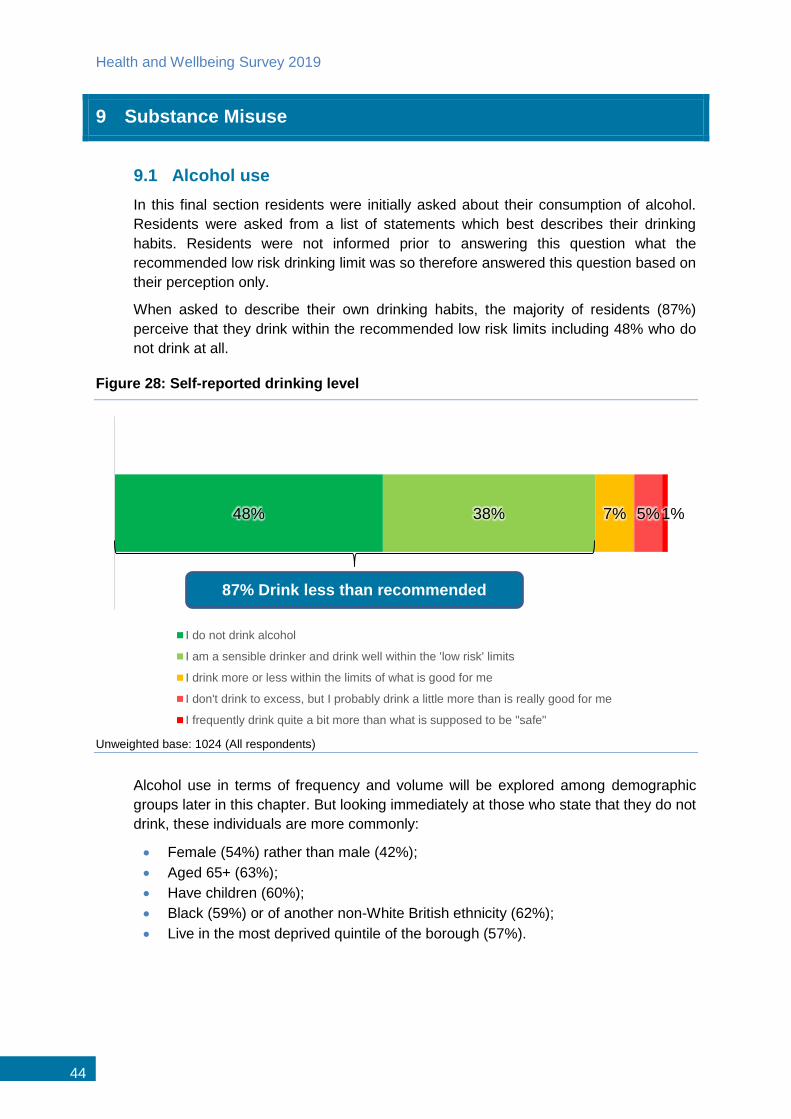
When asked to describe their own drinking habits, the majority of residents (87%)
perceive that they drink within the recommended low risk limits including 48% who do
not drink at all.
Figure 28: Self-reported drinking level
Unweighted base: 1024 (All respondents)
Alcohol use in terms of frequency and volume will be explored among demographic
groups later in this chapter. But looking immediately at those who state that they do not
drink, these individuals are more commonly:
Female (54%) rather than male (42%);
Aged 65+ (63%);
Have children (60%);
Black (59%) or of another non-White British ethnicity (62%);
Live in the most deprived quintile of the borough (57%).
48% 38% 7% 5%1%
I do not drink alcohol
I am a sensible drinker and drink well within the 'low risk' limits
I drink more or less within the limits of what is good for me
I don't drink to excess, but I probably drink a little more than is really good for me
I frequently drink quite a bit more than what is supposed to be "safe"
87% Drink less than recommended
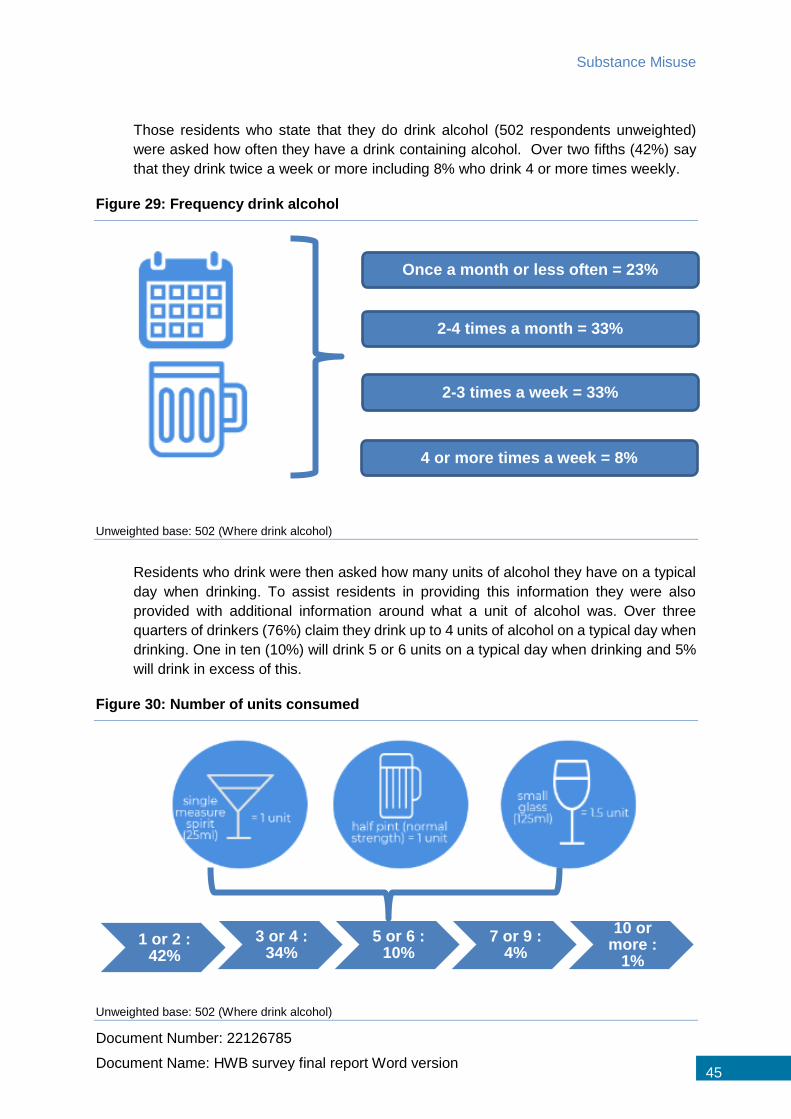
Substance Misuse
Document Number: 22126785
Document Name: HWB survey final report Word version 45
Those residents who state that they do drink alcohol (502 respondents unweighted)
were asked how often they have a drink containing alcohol. Over two fifths (42%) say
that they drink twice a week or more including 8% who drink 4 or more times weekly.
Figure 29: Frequency drink alcohol
Unweighted base: 502 (Where drink alcohol)
Residents who drink were then asked how many units of alcohol they have on a typical
day when drinking. To assist residents in providing this information they were also
provided with additional information around what a unit of alcohol was. Over three
quarters of drinkers (76%) claim they drink up to 4 units of alcohol on a typical day when
drinking. One in ten (10%) will drink 5 or 6 units on a typical day when drinking and 5%
will drink in excess of this.
Figure 30: Number of units consumed
Unweighted base: 502 (Where drink alcohol)
1 or 2 : 42%
3 or 4 : 34%
5 or 6 : 10%
7 or 9 : 4%
10 or more :
1%
Once a month or less often = 23%
2-4 times a month = 33%
2-3 times a week = 33%
4 or more times a week = 8%
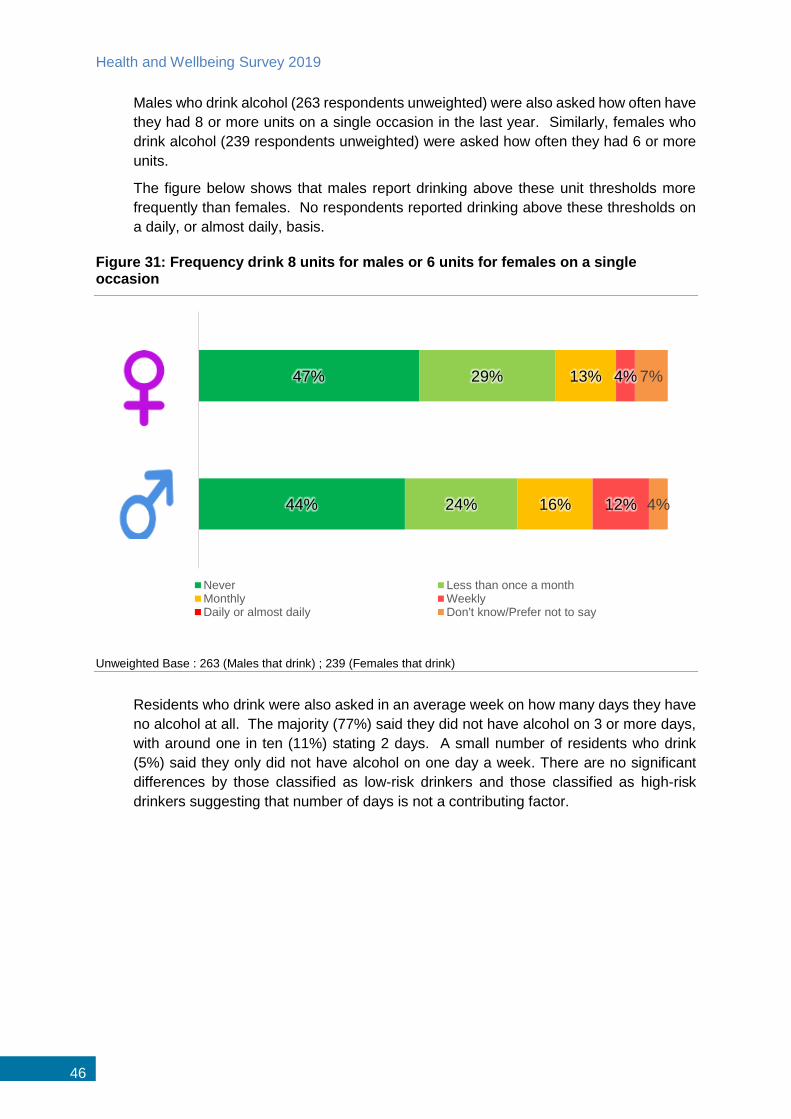
Health and Wellbeing Survey 2019
46
Males who drink alcohol (263 respondents unweighted) were also asked how often have
they had 8 or more units on a single occasion in the last year. Similarly, females who
drink alcohol (239 respondents unweighted) were asked how often they had 6 or more
units.
The figure below shows that males report drinking above these unit thresholds more
frequently than females. No respondents reported drinking above these thresholds on
a daily, or almost daily, basis.
Figure 31: Frequency drink 8 units for males or 6 units for females on a single occasion
Unweighted Base : 263 (Males that drink) ; 239 (Females that drink)
Residents who drink were also asked in an average week on how many days they have
no alcohol at all. The majority (77%) said they did not have alcohol on 3 or more days,
with around one in ten (11%) stating 2 days. A small number of residents who drink
(5%) said they only did not have alcohol on one day a week. There are no significant
differences by those classified as low-risk drinkers and those classified as high-risk
drinkers suggesting that number of days is not a contributing factor.
44%
47%
24%
29%
16%
13%
12%
4%
4%
7%
Never Less than once a monthMonthly WeeklyDaily or almost daily Don't know/Prefer not to say
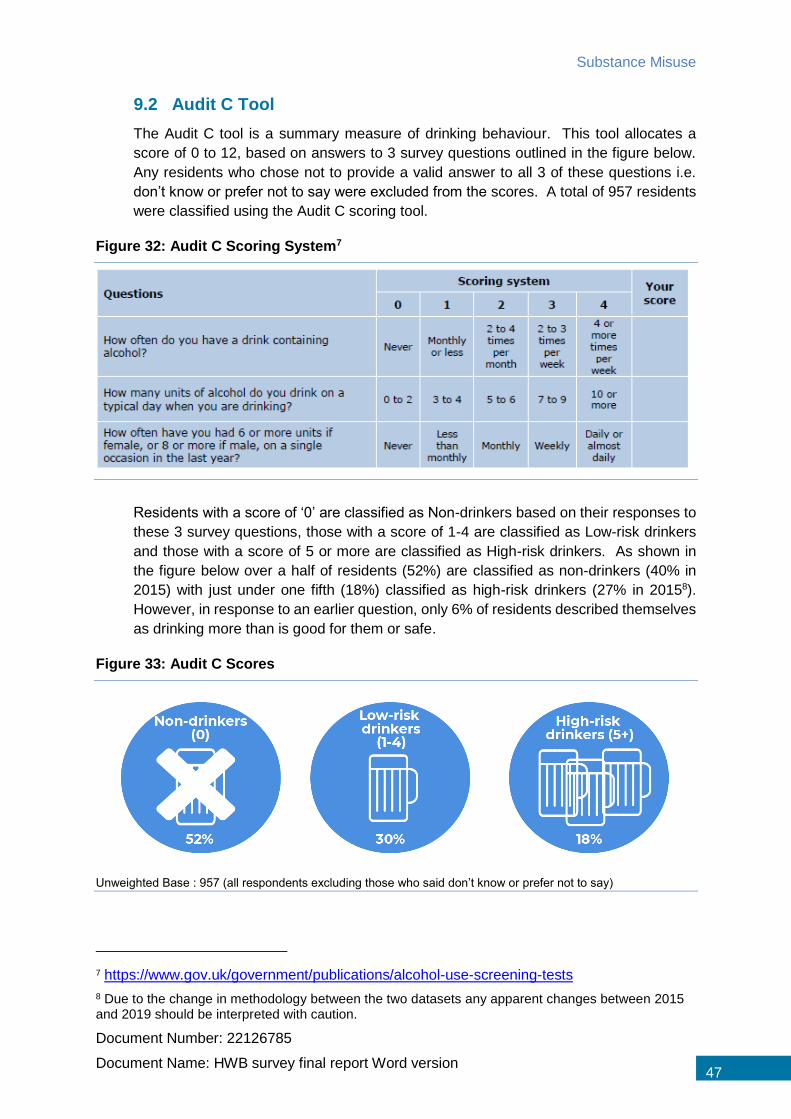
Substance Misuse
Document Number: 22126785
Document Name: HWB survey final report Word version 47
9.2 Audit C Tool
The Audit C tool is a summary measure of drinking behaviour. This tool allocates a
score of 0 to 12, based on answers to 3 survey questions outlined in the figure below.
Any residents who chose not to provide a valid answer to all 3 of these questions i.e.
don’t know or prefer not to say were excluded from the scores. A total of 957 residents
were classified using the Audit C scoring tool.
Figure 32: Audit C Scoring System7
Residents with a score of ‘0’ are classified as Non-drinkers based on their responses to
these 3 survey questions, those with a score of 1-4 are classified as Low-risk drinkers
and those with a score of 5 or more are classified as High-risk drinkers. As shown in
the figure below over a half of residents (52%) are classified as non-drinkers (40% in
2015) with just under one fifth (18%) classified as high-risk drinkers (27% in 20158).
However, in response to an earlier question, only 6% of residents described themselves
as drinking more than is good for them or safe.
Figure 33: Audit C Scores
Unweighted Base : 957 (all respondents excluding those who said don’t know or prefer not to say)
7 https://www.gov.uk/government/publications/alcohol-use-screening-tests
8 Due to the change in methodology between the two datasets any apparent changes between 2015 and 2019 should be interpreted with caution.
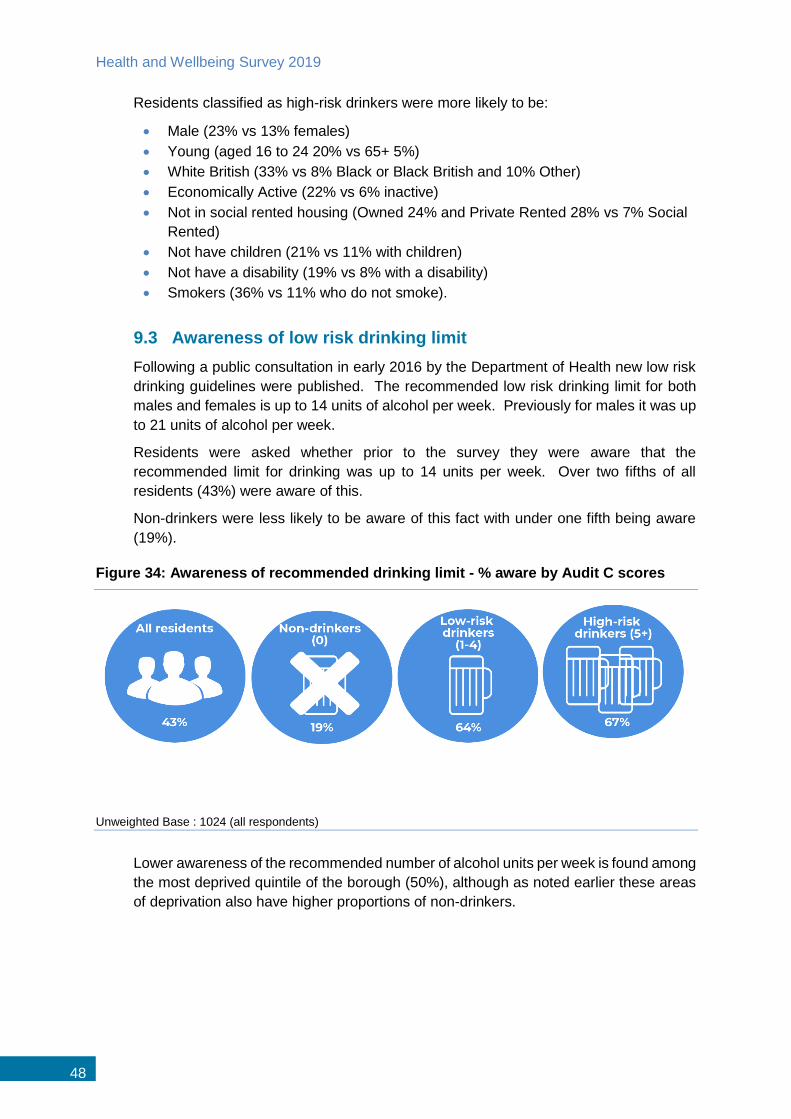
Health and Wellbeing Survey 2019
48
Residents classified as high-risk drinkers were more likely to be:
Male (23% vs 13% females)
Young (aged 16 to 24 20% vs 65+ 5%)
White British (33% vs 8% Black or Black British and 10% Other)
Economically Active (22% vs 6% inactive)
Not in social rented housing (Owned 24% and Private Rented 28% vs 7% Social
Rented)
Not have children (21% vs 11% with children)
Not have a disability (19% vs 8% with a disability)
Smokers (36% vs 11% who do not smoke).
9.3 Awareness of low risk drinking limit
Following a public consultation in early 2016 by the Department of Health new low risk
drinking guidelines were published. The recommended low risk drinking limit for both
males and females is up to 14 units of alcohol per week. Previously for males it was up
to 21 units of alcohol per week.
Residents were asked whether prior to the survey they were aware that the
recommended limit for drinking was up to 14 units per week. Over two fifths of all
residents (43%) were aware of this.
Non-drinkers were less likely to be aware of this fact with under one fifth being aware
(19%).
Figure 34: Awareness of recommended drinking limit - % aware by Audit C scores
Unweighted Base : 1024 (all respondents)
Lower awareness of the recommended number of alcohol units per week is found among
the most deprived quintile of the borough (50%), although as noted earlier these areas
of deprivation also have higher proportions of non-drinkers.
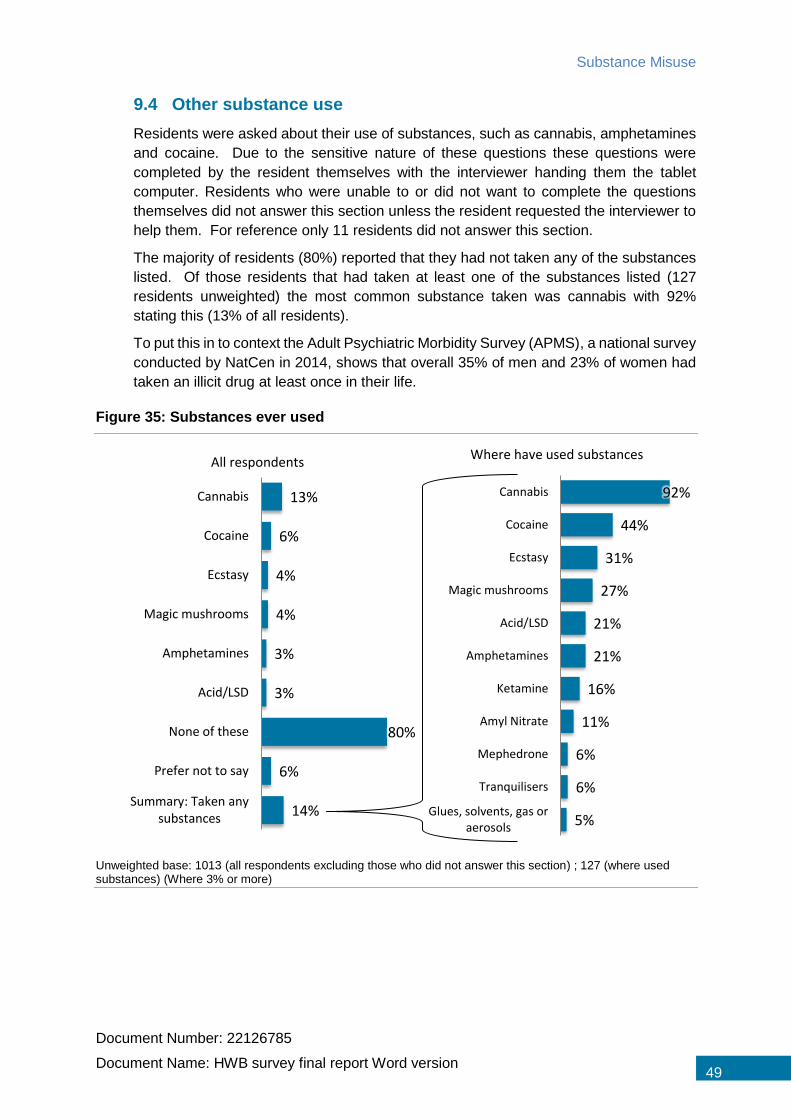
Substance Misuse
Document Number: 22126785
Document Name: HWB survey final report Word version 49
9.4 Other substance use
Residents were asked about their use of substances, such as cannabis, amphetamines
and cocaine. Due to the sensitive nature of these questions these questions were
completed by the resident themselves with the interviewer handing them the tablet
computer. Residents who were unable to or did not want to complete the questions
themselves did not answer this section unless the resident requested the interviewer to
help them. For reference only 11 residents did not answer this section.
The majority of residents (80%) reported that they had not taken any of the substances
listed. Of those residents that had taken at least one of the substances listed (127
residents unweighted) the most common substance taken was cannabis with 92%
stating this (13% of all residents).
To put this in to context the Adult Psychiatric Morbidity Survey (APMS), a national survey
conducted by NatCen in 2014, shows that overall 35% of men and 23% of women had
taken an illicit drug at least once in their life.
Figure 35: Substances ever used
Unweighted base: 1013 (all respondents excluding those who did not answer this section) ; 127 (where used substances) (Where 3% or more)
13%
6%
4%
4%
3%
3%
80%
6%
14%
Cannabis
Cocaine
Ecstasy
Magic mushrooms
Amphetamines
Acid/LSD
None of these
Prefer not to say
Summary: Taken anysubstances
All respondents
92%
44%
31%
27%
21%
21%
16%
11%
6%
6%
5%
Cannabis
Cocaine
Ecstasy
Magic mushrooms
Acid/LSD
Amphetamines
Ketamine
Amyl Nitrate
Mephedrone
Tranquilisers
Glues, solvents, gas oraerosols
Where have used substances
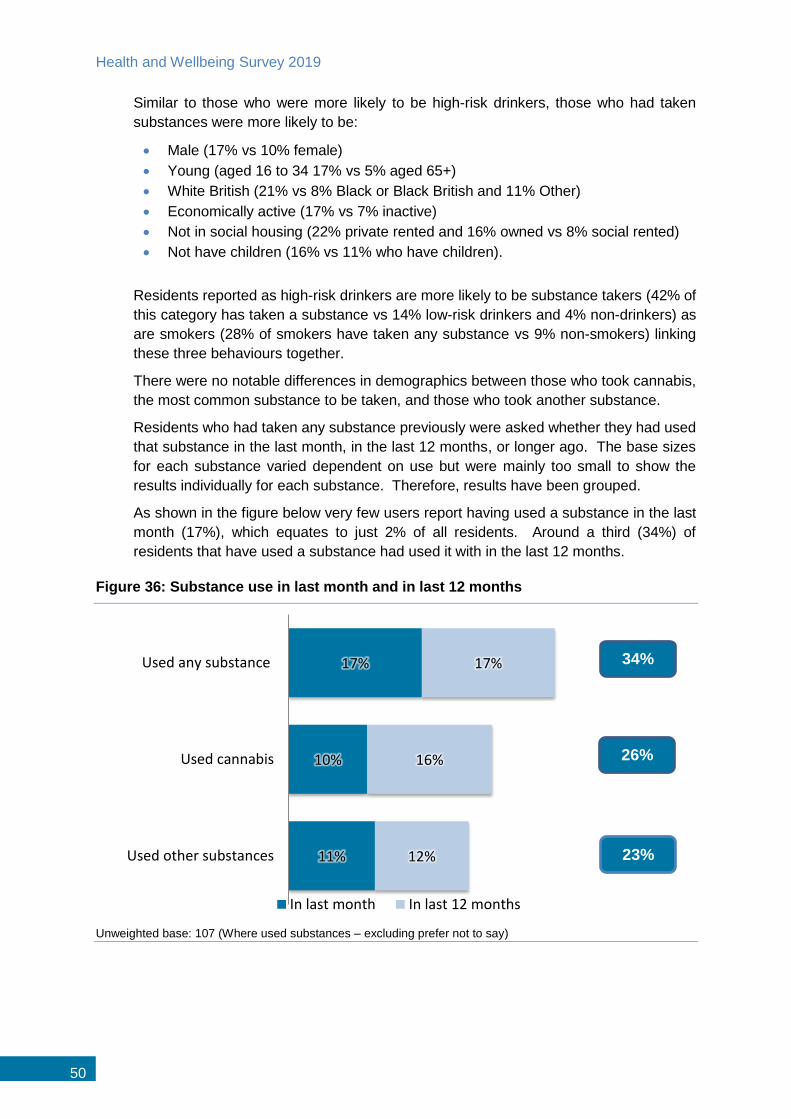
Health and Wellbeing Survey 2019
50
Similar to those who were more likely to be high-risk drinkers, those who had taken
substances were more likely to be:
Male (17% vs 10% female)
Young (aged 16 to 34 17% vs 5% aged 65+)
White British (21% vs 8% Black or Black British and 11% Other)
Economically active (17% vs 7% inactive)
Not in social housing (22% private rented and 16% owned vs 8% social rented)
Not have children (16% vs 11% who have children).
Residents reported as high-risk drinkers are more likely to be substance takers (42% of
this category has taken a substance vs 14% low-risk drinkers and 4% non-drinkers) as
are smokers (28% of smokers have taken any substance vs 9% non-smokers) linking
these three behaviours together.
There were no notable differences in demographics between those who took cannabis,
the most common substance to be taken, and those who took another substance.
Residents who had taken any substance previously were asked whether they had used
that substance in the last month, in the last 12 months, or longer ago. The base sizes
for each substance varied dependent on use but were mainly too small to show the
results individually for each substance. Therefore, results have been grouped.
As shown in the figure below very few users report having used a substance in the last
month (17%), which equates to just 2% of all residents. Around a third (34%) of
residents that have used a substance had used it with in the last 12 months.
Figure 36: Substance use in last month and in last 12 months
Unweighted base: 107 (Where used substances – excluding prefer not to say)
17%
10%
11%
17%
16%
12%
Used any substance
Used cannabis
Used other substances
In last month In last 12 months
34%
26%
23%
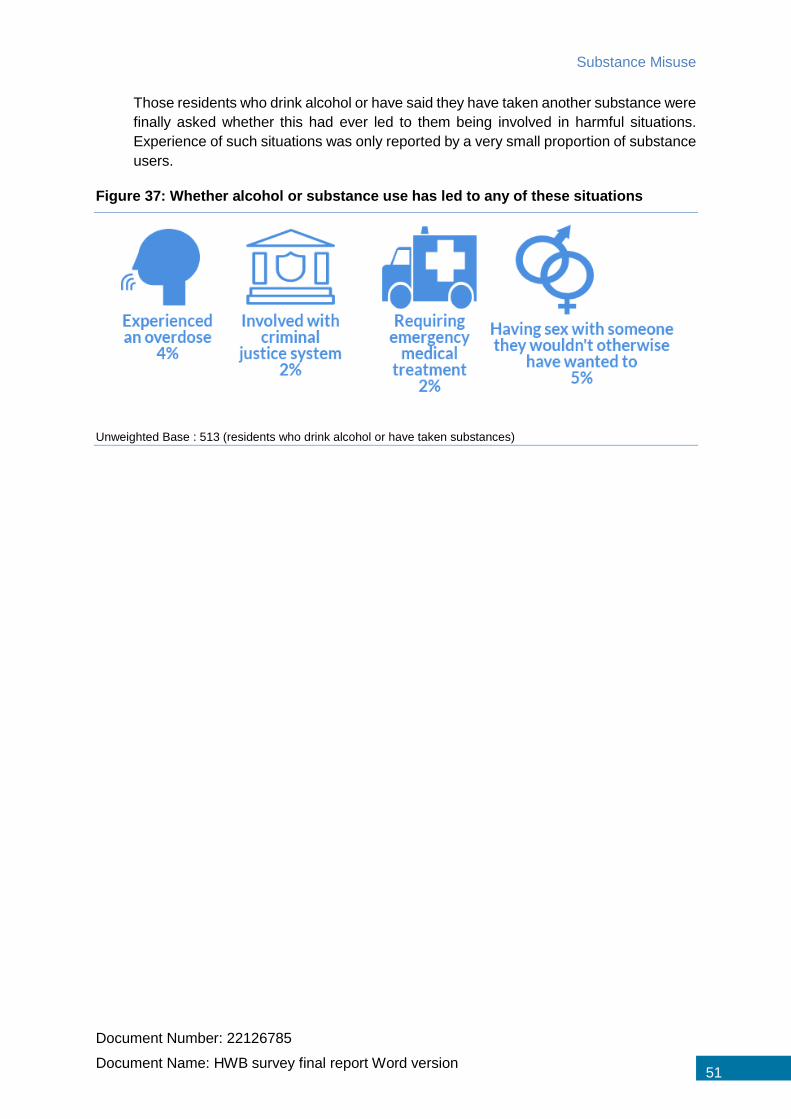
Substance Misuse
Document Number: 22126785
Document Name: HWB survey final report Word version 51
Those residents who drink alcohol or have said they have taken another substance were
finally asked whether this had ever led to them being involved in harmful situations.
Experience of such situations was only reported by a very small proportion of substance
users.
Figure 37: Whether alcohol or substance use has led to any of these situations
Unweighted Base : 513 (residents who drink alcohol or have taken substances)

Health and Wellbeing Survey 2019
52
Appendix A: Sample Profile
The following table presents the profile of the sample both pre and post the application
of weights. This table demonstrates that the use of the face to face methodology
delivered a sample profile close to profile of the Hackney population, with the weighting
making only minor adjustments to the shape of the data.
Table 5: Respondent profile
Unweighted Weighted
Gender
Male 46% 49%
Female 54% 51%
Ethnicity
White British 33% 36%
Black or Black British 22% 23%
Other 45% 41%
Age
16-24 13% 14%
25-34 28% 30%
35-44 19% 18%
45-54 17% 16%
55-64 13% 12%
65-74 6% 5%
75+ 4% 4%
Refused <1% <1%
Sexuality
Heterosexual 94% 93%
Not Heterosexual 4% 4%
Prefer not to say 2% 2%
Work Status
Economically active 67% 69%
Economically inactive 30% 28%
Refused 1% 1%
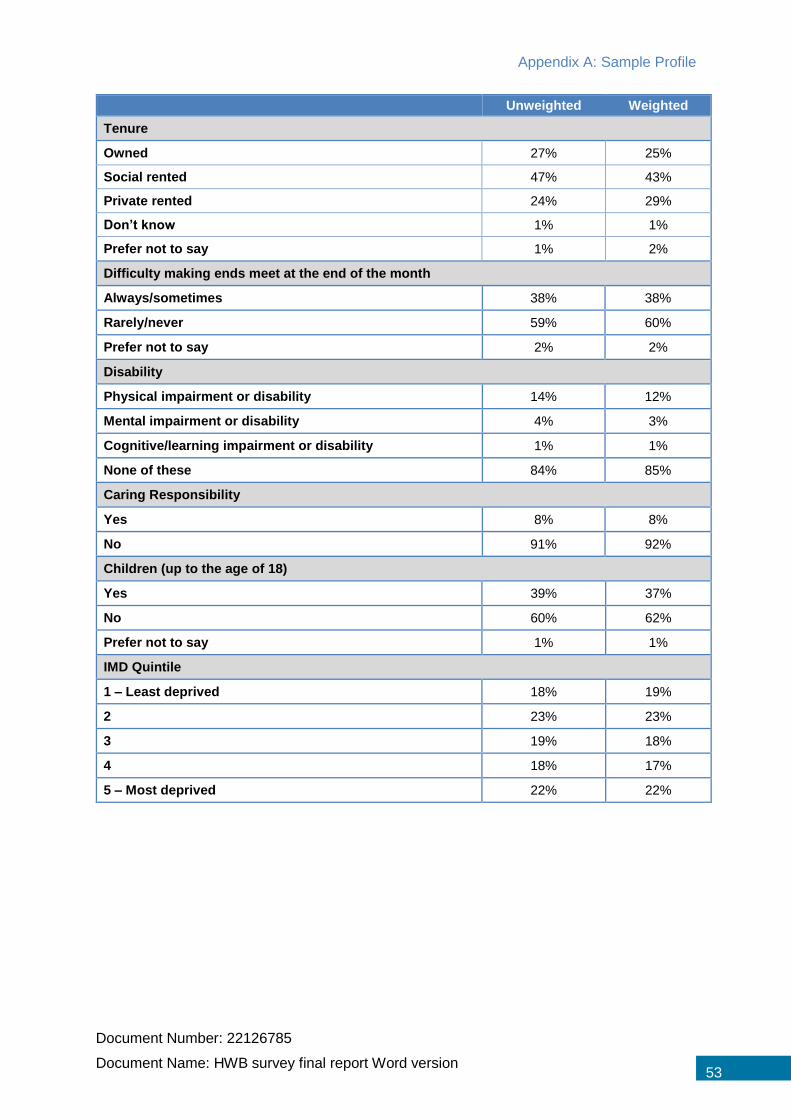
Appendix A: Sample Profile
Document Number: 22126785
Document Name: HWB survey final report Word version 53
Unweighted Weighted
Tenure
Owned 27% 25%
Social rented 47% 43%
Private rented 24% 29%
Don’t know 1% 1%
Prefer not to say 1% 2%
Difficulty making ends meet at the end of the month
Always/sometimes 38% 38%
Rarely/never 59% 60%
Prefer not to say 2% 2%
Disability
Physical impairment or disability 14% 12%
Mental impairment or disability 4% 3%
Cognitive/learning impairment or disability 1% 1%
None of these 84% 85%
Caring Responsibility
Yes 8% 8%
No 91% 92%
Children (up to the age of 18)
Yes 39% 37%
No 60% 62%
Prefer not to say 1% 1%
IMD Quintile
1 – Least deprived 18% 19%
2 23% 23%
3 19% 18%
4 18% 17%
5 – Most deprived 22% 22%
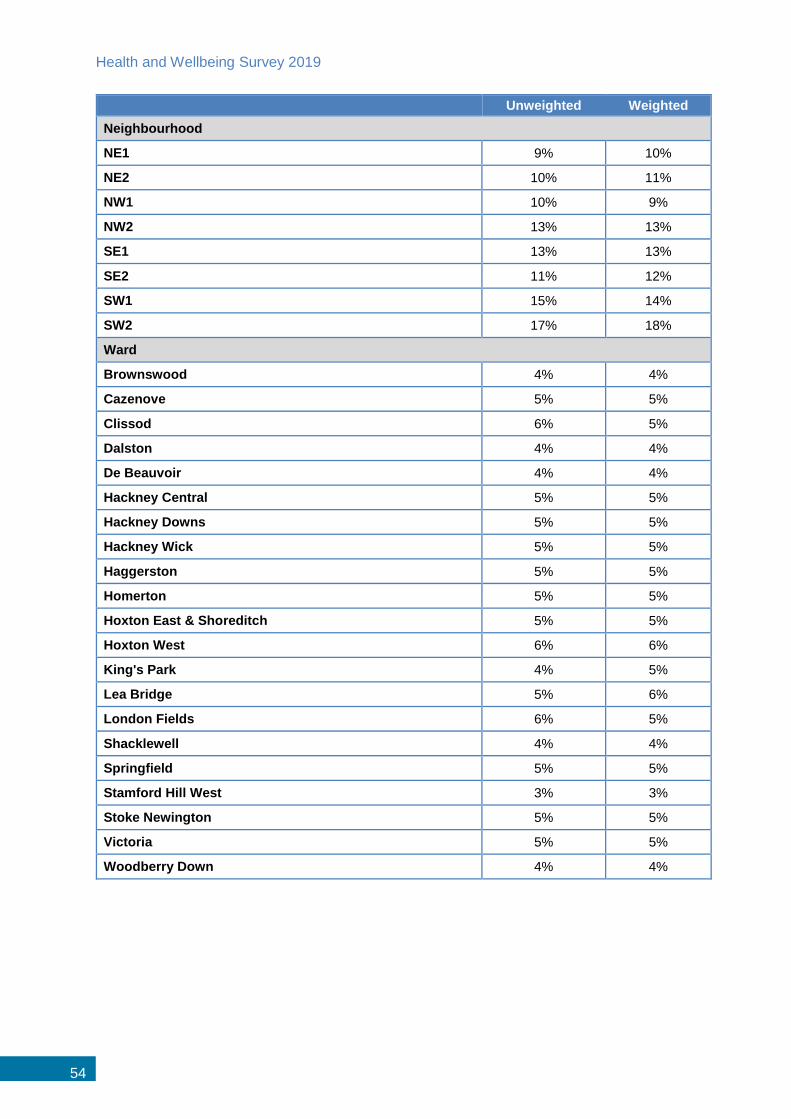
Health and Wellbeing Survey 2019
54
Unweighted Weighted
Neighbourhood
NE1 9% 10%
NE2 10% 11%
NW1 10% 9%
NW2 13% 13%
SE1 13% 13%
SE2 11% 12%
SW1 15% 14%
SW2 17% 18%
Ward
Brownswood 4% 4%
Cazenove 5% 5%
Clissod 6% 5%
Dalston 4% 4%
De Beauvoir 4% 4%
Hackney Central 5% 5%
Hackney Downs 5% 5%
Hackney Wick 5% 5%
Haggerston 5% 5%
Homerton 5% 5%
Hoxton East & Shoreditch 5% 5%
Hoxton West 6% 6%
King's Park 4% 5%
Lea Bridge 5% 6%
London Fields 6% 5%
Shacklewell 4% 4%
Springfield 5% 5%
Stamford Hill West 3% 3%
Stoke Newington 5% 5%
Victoria 5% 5%
Woodberry Down 4% 4%
Appendix B: Statement of Terms
Document Number: 22126785
Document Name: HWB survey final report Word version 55
Appendix B: Statement of Terms
Compliance with International Standards
BMG complies with the International Standard for Quality Management Systems requirements
(ISO 9001:2015) and the International Standard for Market, opinion and social research
service requirements (ISO 20252:2012) and The International Standard for Information
Security Management (ISO 27001:2013).
Interpretation and publication of results
The interpretation of the results as reported in this document pertain to the research problem
and are supported by the empirical findings of this research project and, where applicable, by
other data. These interpretations and recommendations are based on empirical findings and
are distinguishable from personal views and opinions.
BMG will not publish any part of these results without the written and informed consent of the
client.
Ethical practice
BMG promotes ethical practice in research: We conduct our work responsibly and in light of
the legal and moral codes of society.
We have a responsibility to maintain high scientific standards in the methods employed in the
collection and dissemination of data, in the impartial assessment and dissemination of findings
and in the maintenance of standards commensurate with professional integrity.
We recognise we have a duty of care to all those undertaking and participating in research
and strive to protect subjects from undue harm arising as a consequence of their participation
in research. This requires that subjects’ participation should be as fully informed as possible
and no group should be disadvantaged by routinely being excluded from consideration. All
adequate steps shall be taken by both agency and client to ensure that the identity of each
respondent participating in the research is protected.

With more than 25 years’ experience, BMG Research has established a strong reputation for delivering high quality research and consultancy.
BMG serves both the public and the private sector, providing market and customer insight which is vital in the development of plans, the support of campaigns and the evaluation of performance.
Innovation and development is very much at the heart of our business, and considerable attention is paid to the utilisation of the most up to date technologies and information systems to ensure that market and customer intelligence is widely shared.