Health and Long-term care Volunteerism Recreation Education Spirituality Social Engagement...
24
Health and Long-term care Volunteerism Recreation Education Spirituality Social Engagement Transportation Physical Health Mental Health Housing Caregiving Employment Legal Financial Protections Community Supports West Central AAA
-
date post
20-Dec-2015 -
Category
Documents
-
view
215 -
download
0
Transcript of Health and Long-term care Volunteerism Recreation Education Spirituality Social Engagement...

Health and Long-term care
Volunteerism
Recreation
Education
Spirituality Social Engagement
Transportation
Physical Health
Mental Health
HousingCaregiving
Employment
Legal
Financial
Protections
Community SupportsWest Central AAA
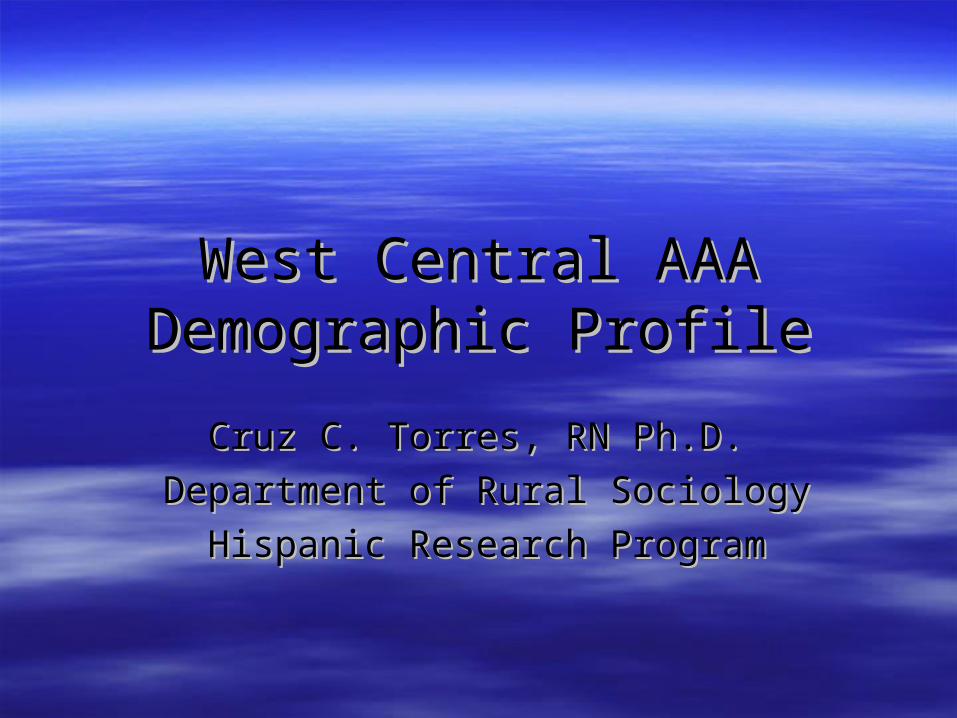
West Central AAAWest Central AAADemographic ProfileDemographic Profile
Cruz C. Torres, RN Ph.D. Cruz C. Torres, RN Ph.D.
Department of Rural SociologyDepartment of Rural Sociology
Hispanic Research ProgramHispanic Research Program

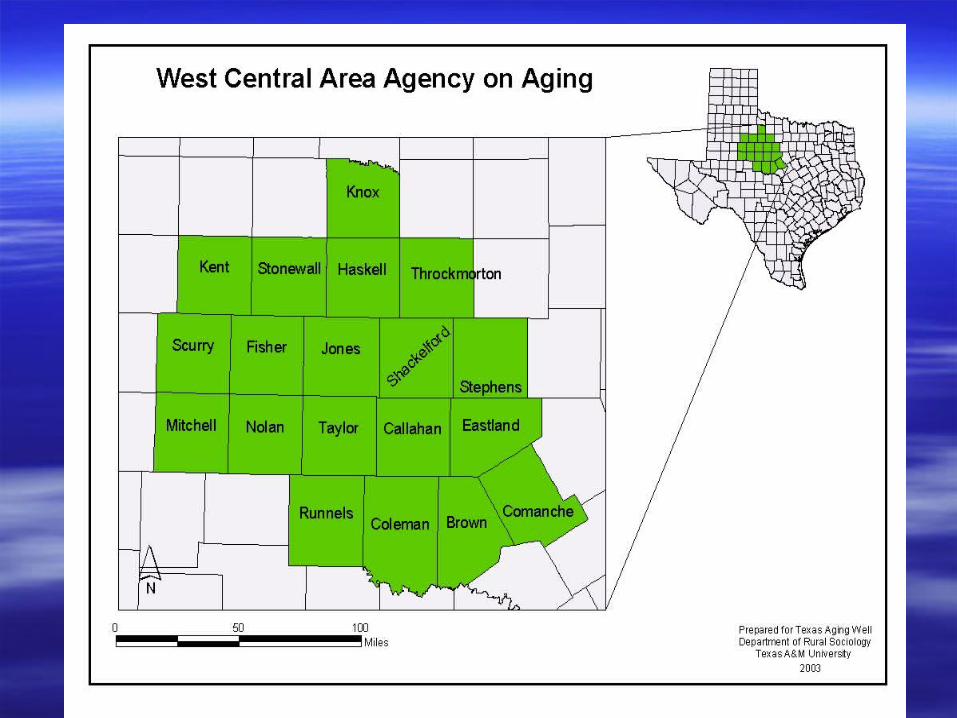
AAA Map goes here
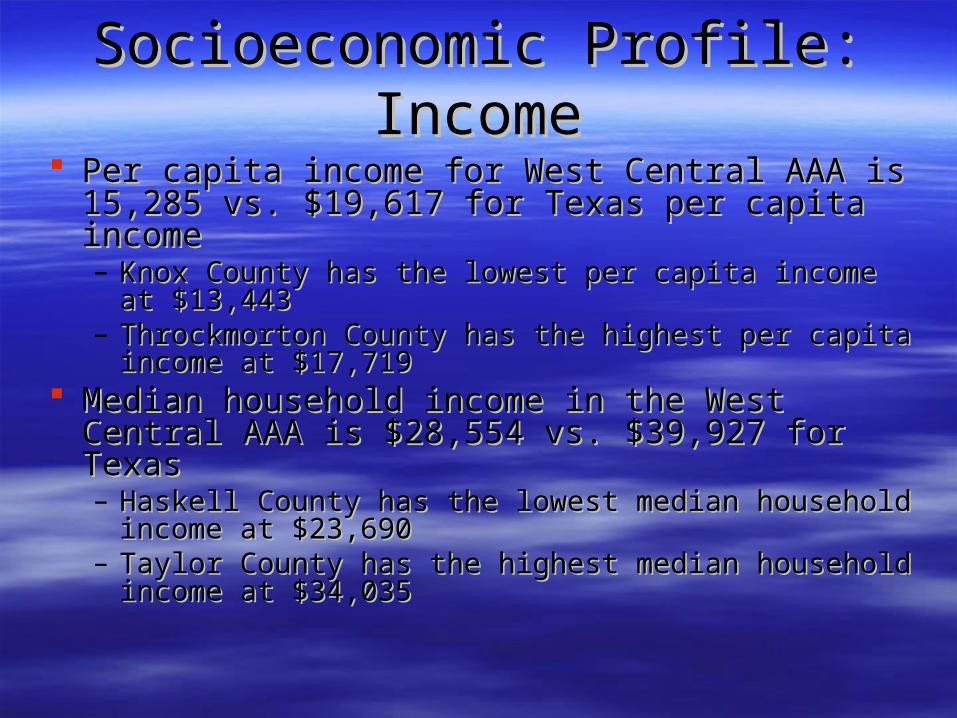
Socioeconomic Profile: IncomeSocioeconomic Profile: Income Per capita income for West Central AAA is 15,285 Per capita income for West Central AAA is 15,285
vs. $19,617 for Texas per capita incomevs. $19,617 for Texas per capita income– Knox County has the lowest per capita income at Knox County has the lowest per capita income at
$13,443$13,443– Throckmorton County has the highest per capita income Throckmorton County has the highest per capita income
at $17,719at $17,719 Median household income in the West Central Median household income in the West Central
AAA is $28,554 vs. $39,927 for TexasAAA is $28,554 vs. $39,927 for Texas– Haskell County has the lowest median household Haskell County has the lowest median household
income at $23,690income at $23,690– Taylor County has the highest median household Taylor County has the highest median household
income at $34,035income at $34,035

Socioeconomic Profile: PovertySocioeconomic Profile: Poverty
16.3% of West Central AAA residents live 16.3% of West Central AAA residents live below poverty vs. 15.4% of Texas below poverty vs. 15.4% of Texas residentsresidents– Knox County has highest poverty rate: 22.9%Knox County has highest poverty rate: 22.9%– Kent County has lowest poverty rate:10.4%Kent County has lowest poverty rate:10.4%
12.8% of West Central AAA elderly live 12.8% of West Central AAA elderly live below poverty vs. 12.8% of Texas elderlybelow poverty vs. 12.8% of Texas elderly– Mitchell County has highest rate of elderly Mitchell County has highest rate of elderly
living below poverty, 20.9%living below poverty, 20.9%– Kent County has the lowest rate of elderly Kent County has the lowest rate of elderly
living below poverty, 6.1%living below poverty, 6.1%
Elderly Household CharacteristicsElderly Household Characteristics
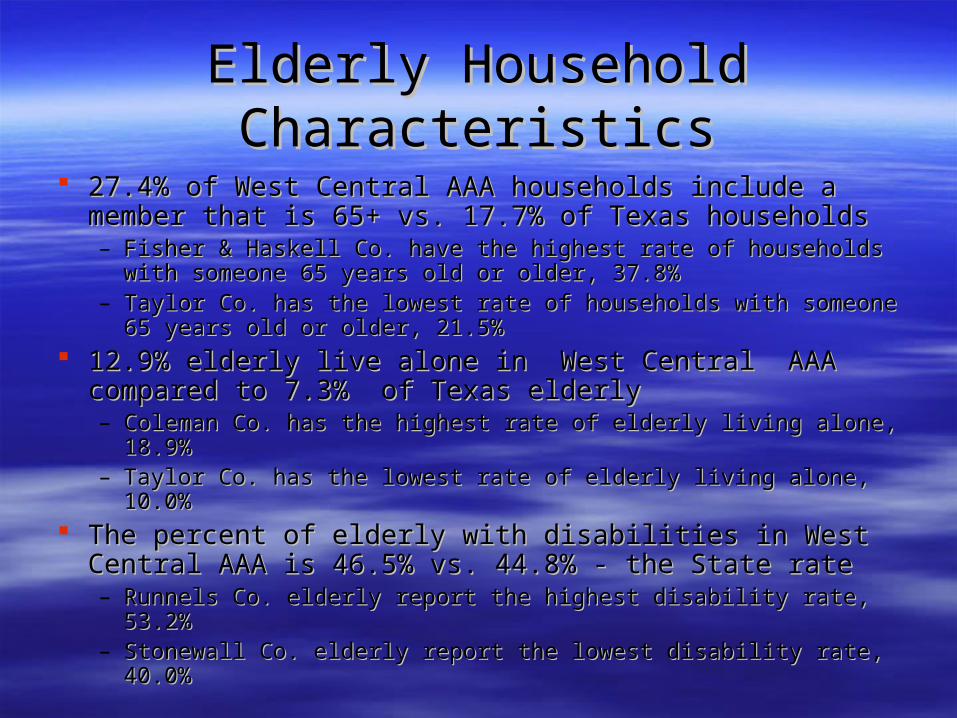
27.4% of West Central AAA households include a 27.4% of West Central AAA households include a member that is 65+ vs. 17.7% of Texas householdsmember that is 65+ vs. 17.7% of Texas households– Fisher & Haskell Co. have the highest rate of households with Fisher & Haskell Co. have the highest rate of households with
someone 65 years old or older, 37.8%someone 65 years old or older, 37.8%– Taylor Co. has the lowest rate of households with someone 65 Taylor Co. has the lowest rate of households with someone 65
years old or older, 21.5%years old or older, 21.5% 12.9% elderly live alone in West Central AAA compared 12.9% elderly live alone in West Central AAA compared
to 7.3% of Texas elderly to 7.3% of Texas elderly – Coleman Co. has the highest rate of elderly living alone, 18.9%Coleman Co. has the highest rate of elderly living alone, 18.9%– Taylor Co. has the lowest rate of elderly living alone, 10.0%Taylor Co. has the lowest rate of elderly living alone, 10.0%
The percent of elderly with disabilities in West Central The percent of elderly with disabilities in West Central AAA is 46.5% vs. 44.8% - the State rateAAA is 46.5% vs. 44.8% - the State rate– Runnels Co. elderly report the highest disability rate, 53.2%Runnels Co. elderly report the highest disability rate, 53.2%– Stonewall Co. elderly report the lowest disability rate, 40.0%Stonewall Co. elderly report the lowest disability rate, 40.0%

Language & Education ProfileLanguage & Education Profile 15.4% of West Central AAA residents speak a language 15.4% of West Central AAA residents speak a language
other than English vs. 31.2 % of Texas residentsother than English vs. 31.2 % of Texas residents– Mitchell Co. has highest rate, 27.6%Mitchell Co. has highest rate, 27.6%– Callahan Co. has the lowest rate, 5.9% Callahan Co. has the lowest rate, 5.9%
14.2% of West Central AAA residents speak Spanish vs. 14.2% of West Central AAA residents speak Spanish vs. 27.0% of Texas residents27.0% of Texas residents– Mitchell Co. has highest rate of Spanish speakers, 27.3%Mitchell Co. has highest rate of Spanish speakers, 27.3%– Callahan Co. has the lowest rate, 5.4%Callahan Co. has the lowest rate, 5.4%
High School completion or equivalency in West Central AAA High School completion or equivalency in West Central AAA is 75.2% vs. 75.7% for Texasis 75.2% vs. 75.7% for Texas– Taylor Co. has highest HS completion rate, 81.2%Taylor Co. has highest HS completion rate, 81.2%– Jones Co. has lowest rate, 64.4%Jones Co. has lowest rate, 64.4%

Figure 1: Texas and West Central AAA Language Diversity in 2000
0.0
5.0
10.0
15.0
20.0
25.0
30.0
35.0
State
of T
exas
Wes
t Cen
tral A
AA
Brown
Calla
han
Colem
an
Coman
che
Eastla
nd
Fisher
Haske
ll
Jone
sKen
t
Knox
Mitc
hell
Nolan
Runnel
s
Scurr
y
Shack
elfo
rd
Stephe
ns
Stonew
all
Taylo
r
Throck
mor
ton
Pe
rce
nt
of
Po
pu
lati
on
Other than English
Spanish Speaking
Residency Status of PopulationResidency Status of Population
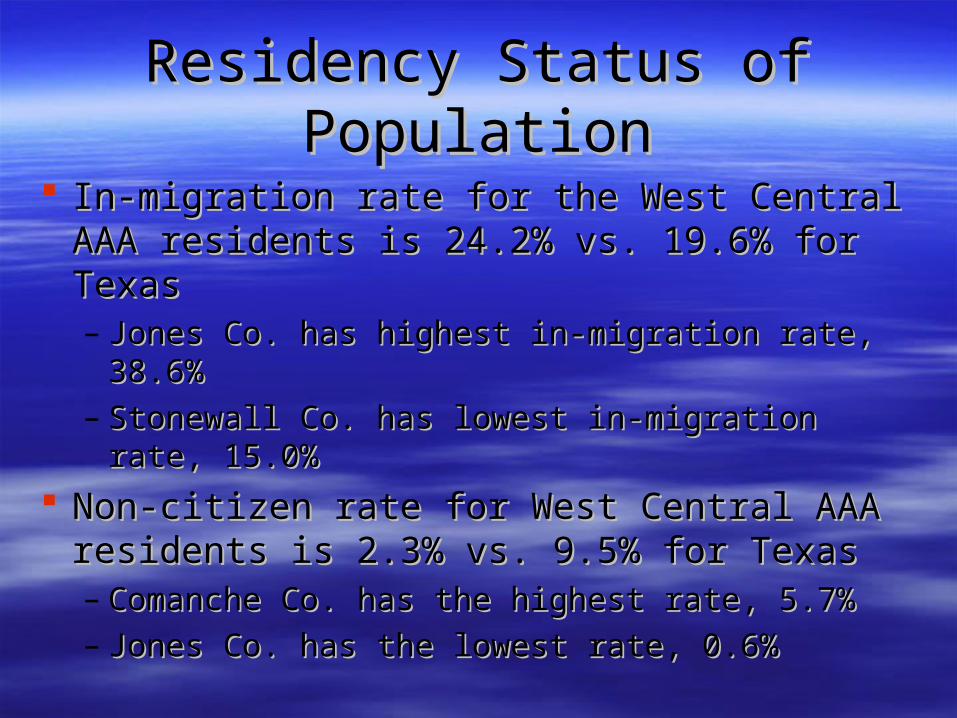
In-migration rate for the West Central AAA In-migration rate for the West Central AAA residents is 24.2% vs. 19.6% for Texasresidents is 24.2% vs. 19.6% for Texas– Jones Co. has highest in-migration rate, 38.6%Jones Co. has highest in-migration rate, 38.6%– Stonewall Co. has lowest in-migration rate, Stonewall Co. has lowest in-migration rate,
15.0%15.0%
Non-citizen rate for West Central AAA Non-citizen rate for West Central AAA residents is 2.3% vs. 9.5% for Texasresidents is 2.3% vs. 9.5% for Texas– Comanche Co. has the highest rate, 5.7%Comanche Co. has the highest rate, 5.7%– Jones Co. has the lowest rate, 0.6% Jones Co. has the lowest rate, 0.6%

Figure 2. Texas and West Central AAA Resident Characteristics in 2000
0.0
5.0
10.0
15.0
20.0
25.0
30.0
35.0
40.0
State
of T
exas
Wes
t Cen
tral A
AA
Brown
Calla
han
Colem
an
Coman
che
Eastla
nd
Fisher
Haske
ll
Jone
sKen
t
Knox
Mitc
hell
Nolan
Runnel
s
Scurr
y
Shack
elfo
rd
Stephe
ns
Stonew
all
Taylo
r
Throck
mor
ton
Pe
rce
nt
of
Po
pu
lati
on
In-Migrants
Non-Citizens
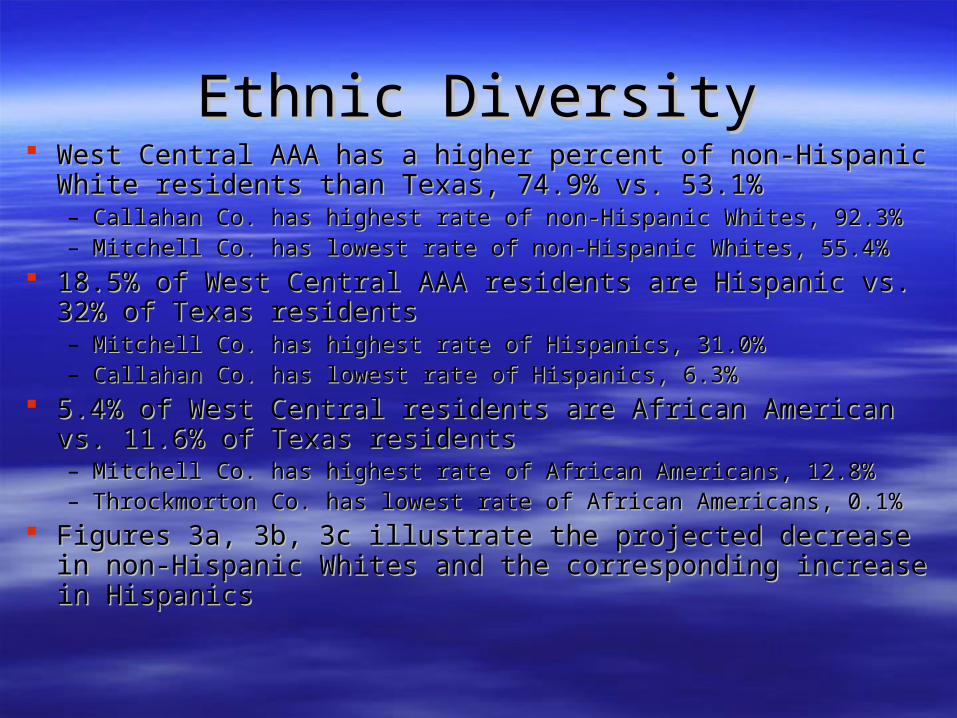
Ethnic DiversityEthnic Diversity West Central AAA has a higher percent of non-Hispanic West Central AAA has a higher percent of non-Hispanic
White residents than Texas, 74.9% vs. 53.1%White residents than Texas, 74.9% vs. 53.1%– Callahan Co. has highest rate of non-Hispanic Whites, 92.3%Callahan Co. has highest rate of non-Hispanic Whites, 92.3%– Mitchell Co. has lowest rate of non-Hispanic Whites, 55.4%Mitchell Co. has lowest rate of non-Hispanic Whites, 55.4%
18.5% of West Central AAA residents are Hispanic vs. 32% 18.5% of West Central AAA residents are Hispanic vs. 32% of Texas residentsof Texas residents– Mitchell Co. has highest rate of Hispanics, 31.0%Mitchell Co. has highest rate of Hispanics, 31.0%– Callahan Co. has lowest rate of Hispanics, 6.3%Callahan Co. has lowest rate of Hispanics, 6.3%
5.4% of West Central residents are African American vs. 5.4% of West Central residents are African American vs. 11.6% of Texas residents11.6% of Texas residents– Mitchell Co. has highest rate of African Americans, 12.8%Mitchell Co. has highest rate of African Americans, 12.8%– Throckmorton Co. has lowest rate of African Americans, 0.1%Throckmorton Co. has lowest rate of African Americans, 0.1%
Figures 3a, 3b, 3c illustrate the projected decrease in non-Figures 3a, 3b, 3c illustrate the projected decrease in non-Hispanic Whites and the corresponding increase in HispanicsHispanic Whites and the corresponding increase in Hispanics

Figure 3a. Texas and West Central AAA Ethnic Diversity in 2000
0.0
10.0
20.0
30.0
40.0
50.0
60.0
70.0
80.0
90.0
100.0
State
Of T
exas
Wes
t Cen
tral A
AA
Brown
Calla
han
Colem
an
Coman
che
Eastla
nd
Fisher
Haske
ll
Jone
sKen
t
Knox
Mitc
hell
Nolan
Runnel
s
Scurr
y
Shack
elfo
rd
Stephe
ns
Stonew
all
Taylo
r
Throck
mor
ton
Pe
rce
nt
of
Po
pu
lati
on
AngloBlackLatino

Figure 3c. Texas and West Central AAA Ethnic Diversity in 2040
0.0
10.0
20.0
30.0
40.0
50.0
60.0
70.0
80.0
90.0
100.0
State
Of T
exas
Wes
t Cen
tral A
AA
Brown
Calla
han
Colem
an
Coman
che
Eastla
nd
Fisher
Haske
ll
Jone
sKen
t
Knox
Mitc
hell
Nolan
Runnel
s
Scurr
y
Shack
elfo
rd
Stephe
ns
Stonew
all
Taylo
r
Throck
mor
ton
Pe
rce
nt
of
Po
pu
lati
on
AngloBlackLatino

Current & Projected Elderly PopulationCurrent & Projected Elderly Population
Figure 4 illustrates current and projected elderly Figure 4 illustrates current and projected elderly percent of populationpercent of population
Figures 5a, 5b, 5c illustrate the ethnic shift that will Figures 5a, 5b, 5c illustrate the ethnic shift that will occur in the elderly population by 2040occur in the elderly population by 2040
Figures 5d, 5e, 5f illustrate the increase of elderly Figures 5d, 5e, 5f illustrate the increase of elderly within each ethnic population within each ethnic population
Figures 6a, 6b, 6c illustrate the current and projected Figures 6a, 6b, 6c illustrate the current and projected sex ratio among the elderly sex ratio among the elderly
Figures 7a, 7b, 7c (in your packet) illustrate the Figures 7a, 7b, 7c (in your packet) illustrate the current and projected proportion of the population current and projected proportion of the population that will be elderly for each ethnic group by 2040 that will be elderly for each ethnic group by 2040

Figure 4. Current and Projected Percent of Population that will be Elderly
0.0
5.0
10.0
15.0
20.0
25.0
30.0
35.0
40.0
45.0
State
Of T
exas
West
Cen
tral A
AA
Brow
n
Callahan
Colem
an
Coman
che
Eastla
nd
Fisher
Haskel
l
Jones
Kent
Knox
Mitc
hell
Nolan
Runnels
Scurry
Shacke
lford
Stephen
s
Stonew
all
Taylo
r
Throck
morto
n
Per
cen
t o
f P
op
ula
tio
n A
ge
60 a
nd
Ove
r
2000
2020
2040
Missing figure 5a – has 2 figure 4
0.0
20.0
40.0
60.0
80.0
100.0
State
of T
exas
West
Cen
tral A
AA
Brow
n
Callahan
Colem
an
Coman
che
Eastla
nd
Fisher
Haskel
l
Jones
Kent
Knox
Mitc
hell
Nolan
Runnels
Scurry
Shacke
lford
Stephen
s
Stonew
all
Taylo
r
Throck
morto
n
Per
cen
t o
f E
lder
ly
60+ Anglo *60+ Black60+ Latino85+ Anglo **85+ Black85+ Latino
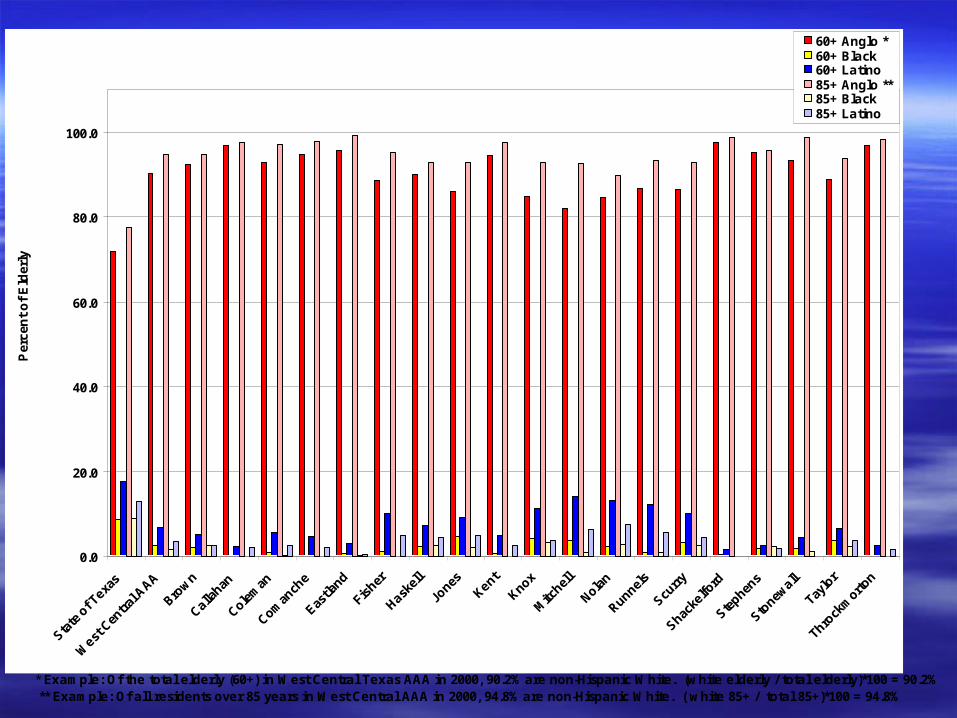
Figure 5a. Percent of the Elderly by Ethnic Group and Age Group in 2000
* Example: Of the total elderly (60+) in West Central Texas AAA in 2000, 90.2% are non-Hispanic White. (white elderly / total elderly)*100 = 90.2% ** Example: Of all residents over 85 years in West Central AAA in 2000, 94.8% are non-Hispanic White. ( white 85+ / total 85+)*100 = 94.8%

0.0
20.0
40.0
60.0
80.0
100.0
State
of T
exas
West
Cen
tral A
AA
Brow
n
Callahan
Colem
an
Coman
che
Eastla
nd
Fisher
Haskel
l
Jones
Kent
Knox
Mitc
hell
Nolan
Runnels
Scurry
Shacke
lford
Stephen
s
Stonew
all
Taylo
r
Throck
morto
n
Per
cen
t o
f E
lder
ly
60+ Anglo *60+ Black60+ Latino85+ Anglo **85+ Black85+ Latino
Figure 5c. Percent of the Elderly by Ethnic Group and Age Group in 2040
* Example: Of the total elderly (60+) in West Central Texas AAA in 2040, 70.0% are non-Hispanic White. (white elderly / total elderly)*100 = 70.0% ** Example: Of all residents over 85 years in West Central Texas AAA in 2040, 77.6% are non-Hispanic White. ( white 85+ / total 85+)*100 = 77.6%

Figure 5d. Percent of the Population within each Ethnic Group that are 60+ and Percent of those 60+ that are 85 and Older in 2000
0.0
10.0
20.0
30.0
40.0
50.0
60.0
70.0
State
of T
exas
West
Cen
tral A
AA
Brow
n
Callahan
Colem
an
Coman
che
Eastla
nd
Fisher
Haskel
l
Jones
Kent
Knox
Mitc
hell
Nolan
Runnels
Scurry
Shacke
lford
Stephen
s
Stonew
all
Taylo
r
Throck
morto
n
Per
cen
t o
f P
op
ula
tio
n
60+ Anglo *60+ Black60+ Latino85+ Anglo **85+ Black85+ Latino
100.0
* Example: Of the total non-Hispanic Whites living in West Central AAA in 2000, 24.4% are over the age of 60 years. ** Example: Of the total non-Hispanic Whites 60+ in West Central AAA in 2000, 11.5% are 85+. (white 85+ / white 60+)*100 = 11.5%.
0.0
10.0
20.0
30.0
40.0
50.0
60.0
70.0
State
of T
exas
West
Cen
tral A
AA
Brow
n
Callahan
Colem
an
Coman
che
Eastla
nd
Fisher
Haskel
l
Jones
Kent
Knox
Mitc
hell
Nolan
Runnels
Scurry
Shacke
lford
Stephen
s
Stonew
all
Taylo
r
Throck
morto
n
Per
cen
t o
f P
op
ula
tio
n
60+ Anglo *60+ Black60+ Latino85+ Anglo **85+ Black85+ Latino
100.0
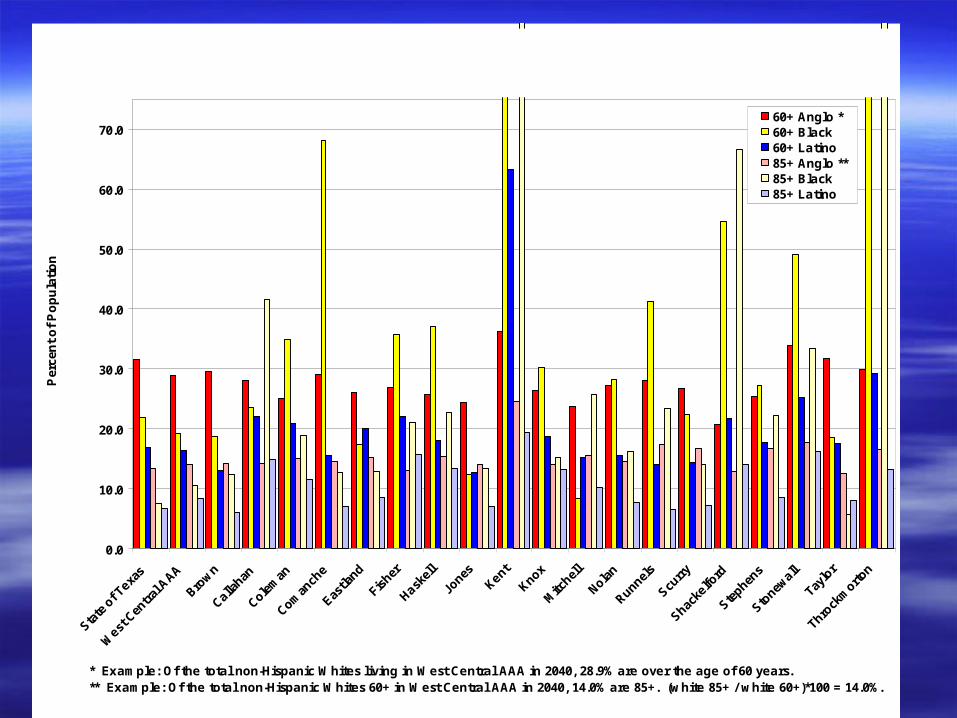
Figure 5f. Projected Percent of the Population within each Ethnic Group that are 60+ and Percent of those 60+ that are 85 and Older in 2040
* Example: Of the total non-Hispanic Whites living in West Central AAA in 2040, 28.9% are over the age of 60 years. ** Example: Of the total non-Hispanic Whites 60+ in West Central AAA in 2040, 14.0% are 85+. (white 85+ / white 60+)*100 = 14.0%.

Figure 6a. Differences in Sex Distribution Among the Elderly Population in 2000
0
10
20
30
40
50
60
70
80
State
of T
exas
West
Cen
tral
AAA
Brow
n
Callahan
Colem
an
Coman
che
Eastla
nd
Fisher
Haskel
l
Jones
Kent
Knox
Mitc
hell
Nolan
Runnels
Scurry
Shacke
lford
Stephen
s
Stonew
all
Taylo
r
Throck
morto
n
Per
cen
t o
f E
lder
lyMale 60+Female 60+Male 85+Female 85+

Figure 6c. Differences in Sex Distribution Among the Elderly Population in 2040
0
10
20
30
40
50
60
70
80
State
of T
exas
West
Cen
tral
AAA
Brow
n
Callahan
Colem
an
Coman
che
Eastla
nd
Fisher
Haskel
l
Jones
Kent
Knox
Mitc
hell
Nolan
Runnels
Scurry
Shacke
lford
Stephen
s
Stonew
all
Taylo
r
Throck
morto
n
Per
cen
t o
f E
lder
lyMale 60+Female 60+Male 85+Female 85+
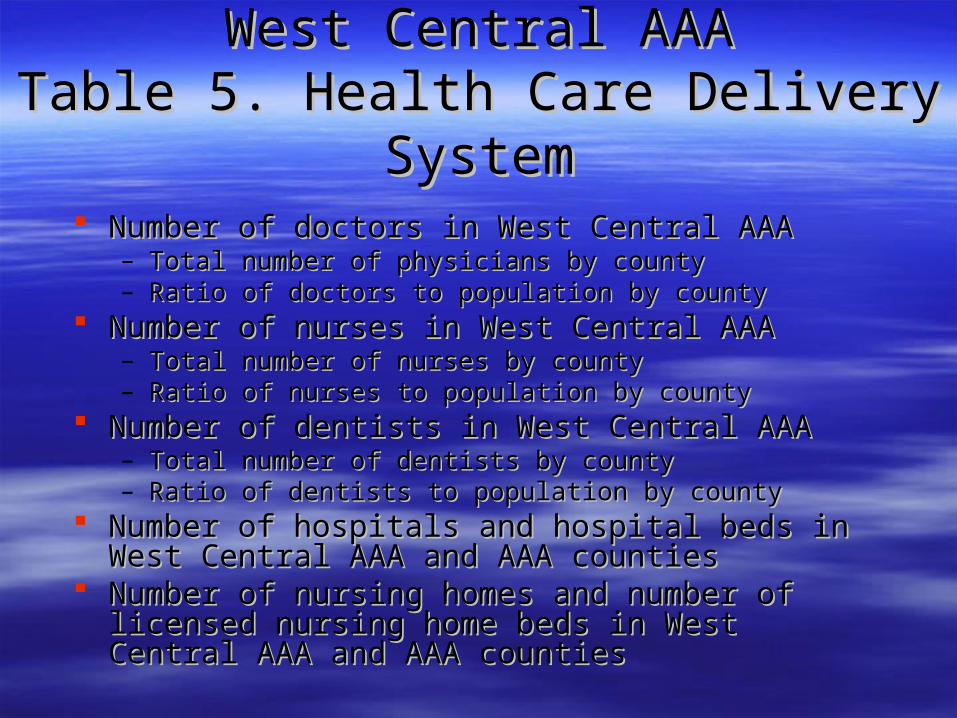
West CentralWest Central AAAAAATable 5. Health Care Delivery SystemTable 5. Health Care Delivery System
Number of doctors in West Central AAANumber of doctors in West Central AAA– Total number of physicians by countyTotal number of physicians by county– Ratio of doctors to population by countyRatio of doctors to population by county
Number of nurses in West Central AAANumber of nurses in West Central AAA– Total number of nurses by countyTotal number of nurses by county– Ratio of nurses to population by countyRatio of nurses to population by county
Number of dentists in West Central AAANumber of dentists in West Central AAA– Total number of dentists by countyTotal number of dentists by county– Ratio of dentists to population by countyRatio of dentists to population by county
Number of hospitals and hospital beds in West Central Number of hospitals and hospital beds in West Central AAA and AAA countiesAAA and AAA counties
Number of nursing homes and number of licensed Number of nursing homes and number of licensed nursing home beds in West Central AAA and AAA nursing home beds in West Central AAA and AAA countiescounties