Head Start Children's Entry into Public School: A Report ... · PDF fileEarly Childhood...
315
Head Start Children’s Entry into Public School: A Report on the National Head Start/Public School Early Childhood Transition Demonstration Study Submitted by: Sharon L. Ramey, Ph.D. Craig T. Ramey, Ph.D. Martha M. Phillips, Ph.D. Robin G. Lanzi, Ph.D. Carl Brezausek, M.S. Charles R. Katholi, Ph.D. Scott Snyder, Ph.D. November 28, 2000 Civitan International Research Center The University of Alabama at Birmingham 1719 6 th Avenue South Birmingham, AL 35294-0021 Contract number 105-95-1935 (205) 934-8900 • Fax (205) 975-6330 Email: [email protected] [email protected] Prepared for: U.S. Department of Health & Human Services Administration for Children & Families Head Start Bureau 330 C Street SW Washington, DC 20201
Transcript of Head Start Children's Entry into Public School: A Report ... · PDF fileEarly Childhood...

Head Start Children’s Entry into Public School: A Report on the National Head Start/Public School Early Childhood Transition Demonstration Study
Submitted by: Sharon L. Ramey, Ph.D.
Craig T. Ramey, Ph.D.
Martha M. Phillips, Ph.D.
Robin G. Lanzi, Ph.D.
Carl Brezausek, M.S.
Charles R. Katholi, Ph.D.
Scott Snyder, Ph.D.
November 28, 2000
Civitan International Research Center The University of Alabama at Birmingham
1719 6th Avenue South Birmingham, AL 35294-0021
Contract number 105-95-1935
(205) 934-8900 • Fax (205) 975-6330 Email: [email protected]
Prepared for: U.S. Department of Health & Human Services
Administration for Children & Families Head Start Bureau 330 C Street SW
Washington, DC 20201
ACKNOWLEDGMENTS
The analyses reported here were based on the National Core Data sets collected for the National Evaluation of the Head Start/Public School Early Childhood Transition Demonstration Project, which was designed and implemented by the National Transition Demonstration Consortium. The Consortium was comprised of Principal Investigators and Project Directors from each of the 31 local sites, Principal Investigators and staff from the Civitan International Research Center at the University of Alabama at Birmingham (UAB), staff from the Administration on Children, Youth and Families (ACYF), and a National Research Advisory Panel/Technical Work Group for the study.
We are deeply appreciative of the collaboration , advice, and support received from colleagues throughout the country. This project was ambitious and required much dedication and active problem-solving to fulfill its goals. The findings reported here provide an overview of the results of 31 distinct programs and evaluations, and the engagement of literally hundreds of individuals and many community agencies and organizations at each local site.
Members of the Consortium, including current members and those who have been involved in the Transition Demonstration effort since its inception in 1991, are listed below. (Note: any omissions from this extensive list are inadvertent. Gratitude is extended to all persons who are or have been part of the National Transition Demonstration Consortium over the past 5 years.) Dates of service vary by individual. Current members of Consortium are indicated by *
The national evaluation was supported by grants from the Head Start Bureau of the Administration on Children, Youth, and Families to each of the 31 local demonstration sites, as well as by a coordinating contract (#105-91-1935) to the Civitan International Research Center at the University of Alabama at Birmingham.
ACYF STAFF
Karen Anderson, Ph.D. Merrily Beyreuther Patricia Divine-Hawkins, Ph.D. Marlys Gustafson Wade Horn, Ph.D. Esther Kresh
Michael Lopez, Ph.D.* Martha Moorehouse, Ph.D. Michele Plutro, Ed.D.* Mary Bruce Webb, Ph.D.* E. Dollie Wolverton, M.A.*
NATIONAL RESEARCH COORDINATING TEAM (CIVITAN INTERNATIONAL RESEARCH CENTER, UAB)
Sharon Ramey, Ph.D.* Co-Principal Investigator
Craig T. Ramey, Ph.D.* Co Principal Investigator
Jenny Ashworth Alfred A. Bartolucci, Ph.D. Fred J. Biasini, Ph.D. Clancy B. Blair, Ph.D. Janet P. Boldizar, Ph.D. Norman W. Bray, Ph.D. Carl Brezausek, M.S.* Eurnestine Brown, Ph.D. Mike Brown, M.B.A.* Sandra Cluett, M.S. Betty Cotton, M.S. Valorie J. Domino, M.D. Robbie Dunn Cindi Norton-Eastwood David Finn, Ed.D. Leslie Franklin Robin Gaines Lanzi, Ph.D., M.P.H.* Denise Giles, M.P.H. Amanda Walley, Ph.D. Wanda Washington, Ph.D. Jackie Weatherly
J. Michael Hardin Joan Hargrove Zee Hildreth Lee van Horn Jay Hsu, Ph.D. Sean Hwang, Ph. D. Anita Ingram Charles R. Katholi, Ph.D.* Bette Keltner, Ph.D. Brenda Lewis Angela Matthews Kathleen G. Nelson, M.D. Fran D. Perkins, Ph.D. Sharina Person, Ph.D. Martha Phillips, Ph.D., Ed.S., M.B.A.* Sherri-Lynn Prather, M.S. David Redden, Ph.D. Lori Renkl-Breeden, M.Ed David Roth, Ph.D. Sonja Ruff Scott W. Snyder, Ph.D.* Joseph J. Sparling, Ph.D. Christopher Taylor, Ph.D. Lydia Tchividijian, M.S. Andrew Westfall, M.S. Kenneth L. Wilson, Ph.D. Kimberly Wood

NATIONAL RESEARCH ADVISORY PANEL/TECHNICAL WORK GROUP
Karen Anderson, Ph.D.* American Psychological Association
Margaret Burchinal, Ph.D.* UNC at Chapel Hill
William Darity, III, Ph.D. UNC at Chapel Hill
Steve Forness, Ph.D.* University of California at LA
Nicholas Ialongo, Ph.D.* Johns Hopkins University
Sharon Lynn Kagan, Ph.D.* Yale University
Luis Laosa, Ph.D.* Educational Testing Service
Robert A. LeVine, Ph.D. Harvard University
Richard A. Light, Ph.D. Harvard University
Ingram Olkin, Ph.D. Stanford University
John (Jack) Pascoe, M.D.* University of Wisconsin
Nancy Robinson, Ph.D.* University of Washington
William Rosenberg, Ph.D.* Drexel University Survey Research Center
Arnold J. Sameroff, Ph.D.* The University of Michigan
Neal Schmitt, Ph.D.* Michigan State University
Diana Slaughter-Defoe, Ph.D.* Northwestern University
Richard A. Weinberg, Ph.D.* University of Minnesota
STATISTICAL ADVISORY COMMITTEE
Margaret Burchinal, Ph.D., Chair* UNC at Chapel Hill
Ken Brewer, Ph.D. Florida State University
Lisa LaVange, Ph.D.* Chapel Hill, NC
Nicholas Ialongo, Ph.D.* Johns Hopkins University
Ingram Olkin, Ph.D. Stanford University
Stephen Raudenbush, Ph.D.* Michigan State University

PROGRAM DIRECTORS
Alabama Ethel Hall, Ph.D. Lynneice Rutledge-Williams*
Alaska Laurelee Ahlman, Ph.D.*
Arkansas Sandra thresher Donna Alliston*
Arizona Sandra Foreman*
Florida Cathia Darling, Ed.D.*
Georgia Dianne Schafer* Latrelle Jackson
Iowa James Swope*
Idaho Janet Balcolm Marilyn Sword*
Illinois Linda Kolbusz*
Indiana Victoria Benckenstein Linda Whikehart*
Massachusetts Alan Chates, Ed.D.*
Maryland Nancy Goldsmith*
Michigan Kimberly Mitchell*
Minnesota Elaine Raspel-Borth*
Missouri L. Carol Scott, Ed.D Rick Jackson*
North Carolina Kelly Downing* Missy Parker-Lohr
Nebraska Linda Hellerich-Tuttle* Ann Michaelis
New Jersey Everene Downing Horace Phelps*
Navajo Nation Kenneth Holyan* Mike Luther
Nevada Ed Markovich* Jan Morrison
New York Deborah Broderick-Johnson Carmella Cohen*
Ohio Ann Bardwell, Ph.D. Myra Crouch-Robinson*
Oregon Ron Herndon*
Pennsylvania Barbara G. Pile Jill Springer*
Rhode Island Christine Chiacu-Forsythe*
South Dakota Jane Drapeaux*
Tennessee Thomas Hamilton, Ph.D. Barbara Blount*
Texas Allen Sullivan, Ph.D.* Michelle Goady
Virginia Moe Gaines* Florence Calhoun*
West Virginia Sheila Burns, Ph.D. Lynn Bolen*
Wisconsin Julia Herwig

LOCAL RESEARCHERS
Alabama Martha Abbott-Shim, Ph.D.*
Georgia State University Annette Sibley*
Quality Assist, Inc.
Alaska Ann Millard, Ph.D. Helen Barrett, Ph.D.
University of Alaska-Anchorage Ray Fenton, Ph.D.*
Anchorage School District
Arkansas Dr. Robert Abbott John Hall, Ph.D.*
Arkansas State University Ron Bramlett, Ph.D.*
University of Central Arkansas
Arizona Linda Wetzel, Ph.D.
Arizona State University Richard Packard, Ed.D.
Northern Arizona University Andrea Greene, M.S. Lori Mulholland, M.S.*
Arizona State University
Florida Darryl Greenfield, Ph.D.* Susan Gold, Ed.D.
University of Miami
Georgia Gene Brody, Ph.D.* Zolinda Stoneman, Ph.D.* David Glassman, Ph.D. Kelly McCoy, Ph.D.
University of Georgia
Idaho Bryce Fifield, Ph.D.* Carol J. Nelson, Ed.D.*
University of Idaho
Iowa Susan Hegland, Ph.D.* Dania Clark-Lempers, Ph.D.
New Jersey Gita Z. Wilder, Ph.D.
Illinois Margo Gottlieb, Ph.D.*
Des Plaines, IL Sue Rasher, M.Ed.* Harriet Talmage, Ph.D.
OER Associates Indiana
Youli Mantzicopulous, Ph.D.* Purdue University
Massachusetts Dr. Lisanio Orlandi
Developmental Resource Group, Inc. Robert Mooney, Ph.D.* Alice Stadhaus, Ed.D.*
Salem State College
Maryland Carol Seefeldt, Ph.D.* Alice Galper, Ph.D.*
University of Maryland
Michigan Thomas M. Reischl, Ph.D.* Jeannette Gassaway, Ph.D.*
Michigan State University
Minnesota Daniel P. Mueller, Ph.D.*
Wilder Research Center
Missouri Sue Vartuli, Ph.D.*
University of MissouriKansas City
North Carolina Donna Bryant, Ph.D.* Frances Campbell, Ph.D.*
University of North CarolinaChapel Hill
Nebraska Gary Hoeltke, Ed.D. Helen Raikes, Ph.D.*
SRI/Gallup Institute
Tennessee Mark Appelbaum, Ph.D.

Educational Testing Service Paul W. Speer, Ph.D.*
Rutgers University
Navajo Nation John R. Bergan, Ph.D.* Jason Feld*
University of Arizona
Nevada Deborah Loesch-Griffin, Ph.D.* JoAnn Everts, Ph.D.
University of Nevada, Reno
New York Carolyn Jarvis, Ph.D.*
New York University
Ohio Evelyn Luckey, Ph.D.*
Otterbein College
Oregon Jan Jewett, Ph.D. Dean Arrasmith, Ph.D. Tim Speth, Ph.D.*
N.W. Regional Educational Laboratory
Pennsylvania Joseph L. French, Ed.D.*
Penn State University
Rhode Island David Robinson, Ph.D.*
Mss. Society for the Prevention of Cruelty to Children
South Dakota Michael Hoadley, Ph.D.
University of Missouri-Kansas City Ray Thompson, Ph.D.*
University of South Dakota
Vanderbilt University Jack Sellers, Ph.D.*
University of North Alabama
Texas David Brown, Ph.D.*
East Texas State University Lin Moore, Ph.D.*
East Texas State University
Virginia Marvin G. Cline, Ph.D.*
Virginia Polytechnic Institute & State University
Frances Bridges-Cline, Ph.D.* Falls Church, VA
Wisconsin Joseph T. Lawton, Ph.D.*
University of Wisconsin
West Virginia Carole Vickers, Ph.D. Steve Banks, Ph.D.* Robert Bickel, Ph.D.* Linda Spatig, Ph.D.*
Marshall University

TABLE OF CONTENTS
Executive Summary . . . . . . . . . . . . . . . . . . . . . . . . . . . . . . . . . . . . . . . . . . . . . . . . . . . . . . . . . . . . i
PART 1: HISTORY AND BACKGROUNDChapter 1: Introduction . . . . . . . . . . . . . . . . . . . . . . . . . . . . . . . . . . . . . . . . . . . . . . . . . . . . . . 1
Chapter 2: Rationale and Design . . . . . . . . . . . . . . . . . . . . . . . . . . . . . . . . . . . . . . . . . . . . . . . 6
PART 2: IMPLEMENTATIONChapter 3: Context of Program Implementation:
Diversity among Families, Schools, and Communities . . . . . . . . . . . . . . . . . . 20
Chapter 4: Implementation . . . . . . . . . . . . . . . . . . . . . . . . . . . . . . . . . . . . . . . . . . . . . . . . . . 32
Chapter 5: Extent of Implementation . . . . . . . . . . . . . . . . . . . . . . . . . . . . . . . . . . . . . . . . . . 56
Chapter 6: Factors Influencing Variation . . . . . . . . . . . . . . . . . . . . . . . . . . . . . . . . . . . . . . . 71
Chapter 7: What Contributes to Successful Implementation . . . . . . . . . . . . . . . . . . . . . . . 83
PART 3: FINDINGS Chapter 8: Report of Investigations of the Comparability of Groups
Prior to Outcome Analyses . . . . . . . . . . . . . . . . . . . . . . . . . . . . . . . . . . . . . . . . 93
Chapter 9: Change in Schools and Classrooms . . . . . . . . . . . . . . . . . . . . . . . . . . . . . . . . . 109
Chapter 10: Changes in Family Well-being, Strengths, and Challenges . . . . . . . . . . . . . . 118
Chapter 11: Parent Involvement in Children’s Learning and in Schools . . . . . . . . . . . . . 127
Chapter 12: Children’s Academic and Social Outcomes . . . . . . . . . . . . . . . . . . . . . . . . . . . 139

Table of Contents 2
TABLES AND FIGURES
TABLES
Table 1: Design and enrollment of Former Head Start Children and Families Longitudinal National Transition Demonstration Study . . . . . . . . . . . . . . . . 13
Table 2: Sample sizes for 30 sites in National Transition Demonstration Study . . . . . 14
Table 3: Characteristics of schools, compared to school districts and countiesparticipating in the Transition Demonstration Project . . . . . . . . . . . . . . . . . . 21
Table 4: Organizational and financial characteristics of participating schooldistricts . . . . . . . . . . . . . . . . . . . . . . . . . . . . . . . . . . . . . . . . . . . . . . . . . . . . . . 22
Table 5: Family types and key characteristics . . . . . . . . . . . . . . . . . . . . . . . . . . . . . . . 26
Table 6: Patterns of family strengths and challenges by family type . . . . . . . . . . . . . . 29
Table 7: Percentage of sites indicating health service delivery by type andarea of need . . . . . . . . . . . . . . . . . . . . . . . . . . . . . . . . . . . . . . . . . . . . . . . . . . 49
Table 8: Percentage of sites providing information and education servicesto participant groups . . . . . . . . . . . . . . . . . . . . . . . . . . . . . . . . . . . . . . . . . . . 50
Table 9: Percentage of schools with health services staff available . . . . . . . . . . . . . . . 51
Table 10: Health services provided . . . . . . . . . . . . . . . . . . . . . . . . . . . . . . . . . . . . . . . . 52
Table 11: Percentage of schools with social/emotional and family involvementstaff available . . . . . . . . . . . . . . . . . . . . . . . . . . . . . . . . . . . . . . . . . . . . . . . . . 53
Table 12: Educational programs available in schools . . . . . . . . . . . . . . . . . . . . . . . . . . 53
Table 13: National Research Coordinating Team Ratings . . . . . . . . . . . . . . . . . . . . . . . 57
Table 14: Program Implementation Profile ratings . . . . . . . . . . . . . . . . . . . . . . . . . . . . 59
Table 15: NRCT ratings for high- and low- implementation groups . . . . . . . . . . . . . . . 88
Table 16: Factors potentially influencing variation in implementation . . . . . . . . . . . . . 89

Table of Contents 3
Table 17: Sample sizes by cohort and treatment condition . . . . . . . . . . . . . . . . . . . . . . 94
Table 18: Comparability of cohorts at baseline . . . . . . . . . . . . . . . . . . . . . . . . . . . . . . . 96
Table 19: Comparability of treatment groups at baseline . . . . . . . . . . . . . . . . . . . . . . . 97
Table 20: Percentage of families remaining in study . . . . . . . . . . . . . . . . . . . . . . . . . . . 99
Table 21: Results of univariate analyses (logistic regression, predicting lossto follow-up) . . . . . . . . . . . . . . . . . . . . . . . . . . . . . . . . . . . . . . . . . . . . . . . . 100
Table 22: Perceptions of school climate . . . . . . . . . . . . . . . . . . . . . . . . . . . . . . . . . . . 111
Table 23: Transition practices as reported by principals and teacher . . . . . . . . . . . . . 113
Table 24: Percentage of former Head Start families reporting services by type by year . . . . . . . . . . . . . . . . . . . . . . . . . . . . . . . . . . . . . . . . . . . . . . . 121
Table 25: Results of logistic regression analyses, predicting participation insupportive programs by family type . . . . . . . . . . . . . . . . . . . . . . . . . . . . . . . 123
Table 26: Activities engaged in by parent involvement staff, as reported by principals . . . . . . . . . . . . . . . . . . . . . . . . . . . . . . . . . . . . . . . . . . . . . . . . . . . 129
Table 27: Mean number of traditional and non-traditional parent involvementopportunities . . . . . . . . . . . . . . . . . . . . . . . . . . . . . . . . . . . . . . . . . . . . . . . . 130
Table 28: Percentage of parent indicating at-home educational activities withchildren . . . . . . . . . . . . . . . . . . . . . . . . . . . . . . . . . . . . . . . . . . . . . . . . . . . . 134
Table 29: Frequency of family routines as reported by caregivers . . . . . . . . . . . . . . . . 135
Table 30: School involvement opportunities for parents . . . . . . . . . . . . . . . . . . . . . . . 136
Table 31: HLM analyses of academic and language scores over time . . . . . . . . . . . . . 155
Table 32: HLM analyses of parent and teacher SSRS ratings . . . . . . . . . . . . . . . . . . . 158
Table 33: Child outcomes by family type . . . . . . . . . . . . . . . . . . . . . . . . . . . . . . . . . . 174
Table 34: Parent ratings of children’s adjustment to school . . . . . . . . . . . . . . . . . . . . 176

Table of Contents 4
Table 35: Ratings of children’s social adjustment . . . . . . . . . . . . . . . . . . . . . . . . . . . . 179
FIGURES
Figure 2.1: Revised Transition Conceptual Model . . . . . . . . . . . . . . . . . . . . . . . . . . . 17
Figure 3.1: Family Strengths . . . . . . . . . . . . . . . . . . . . . . . . . . . . . . . . . . . . . . . . . . . 28
Figure 3.2: Family Challenges . . . . . . . . . . . . . . . . . . . . . . . . . . . . . . . . . . . . . . . . . . 28
Figure 3.3: Example of profiles of family types within sites . . . . . . . . . . . . . . . . . . . 30
Figure 4.1: Language programs . . . . . . . . . . . . . . . . . . . . . . . . . . . . . . . . . . . . . . . . . 54
Figure 5.1: NRCT rating of family involvement component . . . . . . . . . . . . . . . . . . . 60
Figure 5.2: Site self-ratings of degree of implementation – Family Involvement . . . 61
Figure 5.3: NRCT rating of education component . . . . . . . . . . . . . . . . . . . . . . . . . . . 62
Figure 5.4: Site self-ratings of degree of implementation – Education . . . . . . . . . . . 63
Figure 5.5: NRCT rating of social services component . . . . . . . . . . . . . . . . . . . . . . . 64
Figure 5.6: Site self-ratings of degree of implementation – Social Services . . . . . . . 65
Figure 5.7: NRCT ratings of health, nutrition, and mental health component . . . . . . 66
Figure 5.8: Site self-ratings of degree of implementation – Health, Nutrition,and Mental Health . . . . . . . . . . . . . . . . . . . . . . . . . . . . . . . . . . . . . . . . . . 67
Figure 5.9: Comparisons of NCRT and self-assessment ratings . . . . . . . . . . . . . . . . 68
Figure 6.1: Factors influencing variation in implementation . . . . . . . . . . . . . . . . . . . 72
Figure 6.2: Challenges associated with characteristics . . . . . . . . . . . . . . . . . . . . . . . 78
Figure 8.1: Program participation by treatment group . . . . . . . . . . . . . . . . . . . . . . . 104
Figure 8.2: Cross-over patterns by treatment group . . . . . . . . . . . . . . . . . . . . . . . . . 104
Table of Contents 5
Figure 8.3: Drop-out patterns by treatment group . . . . . . . . . . . . . . . . . . . . . . . . . . 105
Figure 9.1: Scaled scores from Assessment Profile subscales, by treatmentgroup and over time . . . . . . . . . . . . . . . . . . . . . . . . . . . . . . . . . . . . . . . . 115
Figure 10.1: Percentage of families reporting increase in family income . . . . . . . . . 119
Figure 10.2: Percentage of families reporting participation in at least onejob training program . . . . . . . . . . . . . . . . . . . . . . . . . . . . . . . . . . . . . . . . 119
Figure 10.3: Percentage of families reporting participation in at least oneeducational program . . . . . . . . . . . . . . . . . . . . . . . . . . . . . . . . . . . . . . . . 120
Figure 10.4: Percentage of families reporting participation in at least onefamily support program . . . . . . . . . . . . . . . . . . . . . . . . . . . . . . . . . . . . . 120
Figure 11.1: Volunteer activities reported by parents . . . . . . . . . . . . . . . . . . . . . . . . 131
Figure 11.2: Parent participation in parent involvement opportunities . . . . . . . . . . . 131
Figure 11.3: Parent participation in volunteer opportunities . . . . . . . . . . . . . . . . . . . 132
Figure 11.4: Percentage of parents reporting learning interactions with the child in the past week . . . . . . . . . . . . . . . . . . . . . . . . . . . . . . . . . . . . . . . 134
Figure 11.5: Percentage of parents reporting involvement in school governanceactivities . . . . . . . . . . . . . . . . . . . . . . . . . . . . . . . . . . . . . . . . . . . . . . . . . 136
Figure 12.1: Academic performance of former Head Start children in the firstfour years of school . . . . . . . . . . . . . . . . . . . . . . . . . . . . . . . . . . . . . . . . 146
Figure 12.2: Distance of estimated population means from reference score . . . . . . . 148
Figure 12.3: Math - predicted quadratic growth curve with DC treatment . . . . . . . . 161
Figure 12.4: Math - predicted quadratic growth curve and school climate . . . . . . . . 162
Figure 12.5: Math - predicted quadratic growth curve & school transition practices 163
Figure 12.6: Math - predicted quadratic growth curve for children in high and low poverty schools . . . . . . . . . . . . . . . . . . . . . . . . . . . . . . . . . 164

Table of Contents 6
Figure 12.7: Reading - predicted growth curve with DC treatment . . . . . . . . . . . . . . 165
Figure 12.8: Reading - predicted quadratic growth curve and school climate . . . . . . 166
Figure 12.9: Reading - predicted quadratic growth curve and school transition practices . . . . . . . . . . . . . . . . . . . . . . . . . . . . . . . . . . . . . . . . . . . . . . . . . 167
Figure 12.10: Reading - predicted quadratic growth curve for children in high and low poverty schools . . . . . . . . . . . . . . . . . . . . . . . . . . . . . . . . . 168
Figure 12.11: Language - predicted quadratic growth curve and school transitionpractices . . . . . . . . . . . . . . . . . . . . . . . . . . . . . . . . . . . . . . . . . . . . . . . . 169
Figure 12.12: Language - predicted quadratic growth curve for children inhigh and low poverty schools . . . . . . . . . . . . . . . . . . . . . . . . . . . . . . . . . 170
Figure 12.13: Parent SSRS - predicted quadratic growth curve with DC treatment . . 171
Figure 12.14: Percentage of children with positive school impressions:Kindergarten and third grade . . . . . . . . . . . . . . . . . . . . . . . . . . . . . . . . . 176
Figure 12.15: Academic performance of children with more and less positiveratings of school in kindergarten . . . . . . . . . . . . . . . . . . . . . . . . . . . . . . 177
Figure 12.16: Teacher ratings of children’s performance . . . . . . . . . . . . . . . . . . . . . . 178
Figure 12.17: Special education placements of children with more and lesspositive ratings of school . . . . . . . . . . . . . . . . . . . . . . . . . . . . . . . . . . . . 178
Figure 12.18: Percentage of special education placement by year in schooland initial treatment condition . . . . . . . . . . . . . . . . . . . . . . . . . . . . . . . . 182
Figure 12.19: Year of placement by initial treatment condition . . . . . . . . . . . . . . . . . . 183
Figure 12.20: In-class, partial day out of class, and full day out of classplacement by school treatment condition, by year in school . . . . . . . . . 183
Figure 12.21: Distributions of special education, retained, and promotedchildren by initial treatment conditions . . . . . . . . . . . . . . . . . . . . . . . . . 184
Figure 12.22: Patterns of performance by children in special education and retained in grade . . . . . . . . . . . . . . . . . . . . . . . . . . . . . . . . . . . . . . . . . . . 185

EXECUTIVE SUMMARY
A BRIEF HISTORY OF THE NATIONAL HEAD START – PUBLIC SCHOOL
EARLY CHILDHOOD TRANSITION DEMONSTRATION PROJECT
In 1990, the U. S. Congress authorized a major program designed to enhance the early
public school transitions of former Head Start children and their families. Former Head Start
children, like many other children living in poverty, were at risk for poor school
achievement. This new program was launched to test the value of extending comprehensive,
Head Start-like supports “upward” through the first four years of elementary school. This
project, administered by the Head Start Bureau of the Administration on Children, Youth,
and Families, funded 31 local Transition Demonstration Programs in 30 states and the
Navajo Nation from the 1991-92 school year through the 1997-98 school year and involved
more than 450 public schools.
Page i

The National Transition Demonstration Study was conducted to provide information
about the implementation of this program and its impact on children, families, schools, and
communities. The study design involved random assignment of schools to a Transition
Demonstration group, which received additional supports and staff funded by this project,
or to a Comparison group. A total of 7,515 former Head Start children and families were
enrolled in the National Study in 1992/93 and 1993/94. Thousands of other children and
families, however, participated in the Transition Demonstration Program, since supports and
educational enhancements were offered to all children and families in the classrooms.
KEY FEATURES OF THE TRANSITION DEMONSTRATION PROGRAM
The 31 local Transition Demonstration Programs all implemented major programs related
to:
(1) parent involvement activities;
(2) educational enhancement, especially to promote use of
developmentally appropriate practices and continuity in children’s
educational experiences;
(3) family social support services; and
(4) health and nutrition.
The Transition Demonstration Programs
also sought to achieve close collaboration
between public schools and Head Start
programs. As required, each local program
established a Governing Board comprised of at
least 51 percent former Head Start parents and
hired Family Service Coordinators (1 per 35
families) to assist families and promote parent
involvement. In addition, most local sites had
plans for:
Examples of highly valued activitiesfrom local Transition Demonstration Programs:• creating Parent Resource Rooms in
children’s elementary schools • making home visits to families • sending special newsletters to families
about school and community activities• teaching families about home-based
learning supports to help their children succeed
promoting the inclusion of children with disabilities into regular
classrooms;
addressing cultural and linguistic diversity and appreciation; and
developing individualized transition plans for each child.
Page ii

Local programs were designed to be responsive to community needs and evolved over
the seven years of implementation. From the start, local sites varied tremendously in terms
of the willingness of their schools and communities to enact major changes, as well as their
previous experience in conducting large-scale, multi-pronged, school-based partnership
programs.
LOCAL PROGRAMS VARIED TREMENDOUSLY IN HOW
SUCCESSFULLY THEY IMPLEMENTED SERVICES AND SUPPORTS
Overall, the program implementation data
(based on annual site visits, review of program
documentation, and reports of participating
families, teachers, principals, and Family
Service Coordinators) support four major
findings:
(1) All sites encountered multiple obstacles
and barriers in their efforts to provide
comprehensive and well coordinated
supports to children, families, and
schools.
(2) Highly competent and stable leadership
exerted a powerful influence on the
strength and implementation of a local program.
(3) Only about 20% of the sites implemented very strong programs. Of the 31 local
sites, 6 were rated as very good to excellent in all features of their program, while 8
were judged as fair or weak in all aspects. The majority of local programs (17, or
55%) showed a combination of strengths and weaknesses in their programs and most
fluctuated in how well they implemented different features over the years.
(4) Many features of the Transition Demonstration Programs were highly valued by
schools and families, leading to plans for continuation after program funding ended.
In addition, these features were adopted by many of the Comparison schools and
supported through re-allocation of resources or external funding.
Local Transition Demonstration Programs facilitated: • better access to needed social and
health services • greater awareness of community
supports and gaps in the service delivery system
• parents becoming active in governance and educational improvement
• local commitment to ensuring theschool success of former Head Start children
• new local partnerships or collaborations to benefit young children and their families
Collectively, these schools, Head Start programs, and communities strongly endorsed the
value of outreach efforts to families and the need to address young children’s needs during
their early years of transition to school.
Page iii

HOW THE MOST AND LEAST SUCCESSFUL PROGRAMS DIFFERED
Some of the distinctive characteristics of the 6 most successful local programs were:
(1) their strong, positive relationships between the public schools and the
Head Start programs;
(2) their highly committed, competent, and respected leadership within the
programs; and
(3) a successful track record of creating strong partnerships to implement and
to evaluate large-scale programs.
An interesting and unanticipated feature of these successful sites was that they tended to
have the most “competition” from local Comparison schools. That is, the Comparison
schools often launched programs similar to the Transition Demonstration Program. These
sites also evidenced widespread local commitment to improving the school adjustment of
former Head Start and other low income children, as well as to increasing parent involvement
and to improving family well-being.
In the 8 sites where implementation was the least successful, at least 6 were plagued by
multiple local conflicts, including personality and agency clashes. The leadership for these
sites also was less involved, less experienced, and less skillful in training and supervising
program staff and in working effectively with school and community personnel. These least
successful sites tended to have very high rates of poverty in their school districts, although
several highly successful sites had equally high poverty levels. A few of the grantees with
early and serious problems identified in the planning year -- especially major conflicts among
the participating partners and failure to develop program plans considered minimally
adequate by the funding agency -- were among those that implemented the weakest
Transition Demonstration Programs.
Features which did not reliably distinguish which sites would be the most or least
successful were: the location of the school district (rural, suburban, urban, or inner city); the
average per pupil expenditures in the local school districts; the proportion of local, state, and
federal funding to the local schools; whether the program was administered by a Head Start
program, a school district, or a combined Head Start/school district grantee; the amount of
annual funding from ACYF for the local program; the size of the local program (number of
participating schools, families, and children); or the quality of the original grant application.
Page iv
EDUCATIONAL ENHANCEMENT WAS THE MOST CHALLENGING AREA
TO IMPLEMENT FULLY
In terms of ensuring that classrooms offered developmentally appropriate and
individually tailored instruction, many of the local programs encountered resistance and most
did not fully achieve their goals. The reasons for this were many, including reluctance and
ambivalence on the part of some teachers and/or some schools and school districts to adopt
proposed changes and the fact that many schools already had implemented their own version
of “developmentally appropriate practices.” In other schools, educators judged these
practices to be of uncertain merit and not yet proven; accordingly, they were less willing to
make certain types of changes in classroom organization and instructional approaches. One
of the strongest findings was that even within the same treatment condition in a local site,
there was tremendous variation in the educational practices observed in different classrooms.
The importance of individual teachers’ skills and educational approach was apparent, as was
the impact of the principals’ commitment to educational excellence and ongoing
improvement.
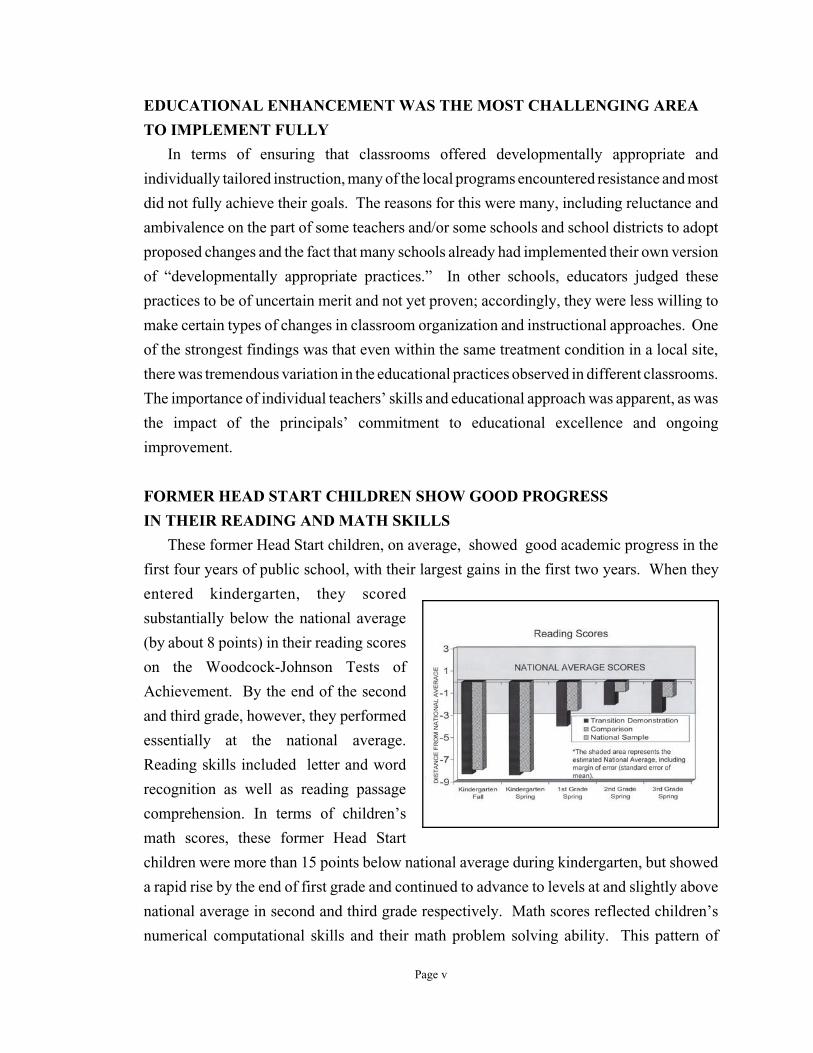
FORMER HEAD START CHILDREN SHOW GOOD PROGRESS
IN THEIR READING AND MATH SKILLS
These former Head Start children, on average, showed good academic progress in the
first four years of public school, with their largest gains in the first two years. When they
entered kindergarten, they scored
substantially below the national average
(by about 8 points) in their reading scores
on the Woodcock-Johnson Tests of
Achievement. By the end of the second
and third grade, however, they performed
essentially at the national average.
Reading skills included letter and word
recognition as well as reading passage
comprehension. In terms of children’s
math scores, these former Head Start
children were more than 15 points below national average during kindergarten, but showed
a rapid rise by the end of first grade and continued to advance to levels at and slightly above
national average in second and third grade respectively. Math scores reflected children’s
numerical computational skills and their math problem solving ability. This pattern of
Page v

positive academic achievement in both math and reading occurred for children in both
treatment conditions.
In sum, not only did former
Head Start children “maintain” any
gains that might have resulted from
their Head Start experience; in fact,
they showed acceleration in the two
skill areas -- reading and math-
actively taught in early elementary
grades. In terms of children’s
receptive language skills or their
vocabulary knowledge, however,
the gains were less dramatic and
their scores remained lower relative
to national norms than in reading and math. Collectively, these assessment data provide
strong support for the conclusion that Head Start children typically enter school “ready
to learn” and that they can achieve academically at national norms.
TEACHERS, PARENTS, AND CHILDREN REPORT POSITIVE
SCHOOL ADJUSTMENT EVERY YEAR
Teachers’ ratings of children’s
academic abilities corresponded
moderately well with children’s
standardized test scores on the
i n d i v i d u a l l y a d m i n i s t e r e d
assessments, although teacher ratings
of overall academic achievement are
somewhat lower than children’s test
scores in reading and math.
Parents consistently rated their
children’s school adjustment as very
positive from the spring of
kindergarten through the end of third grade. Only a small percentage of children (less than
10%) were judged to have early school adjustment problems. When former Head Start
families encountered problems, they reported these were usually resolved well. Across all
Page vi

years and both treatment groups, parents and children expressed that they highly valued
doing well in school.
The children overwhelmingly reported having positive early school experiences. The
vast majority like school, value doing well, try hard, report getting along well with teachers
and peers, and say they learn a lot from their teachers. In the spring of kindergarten, only
7% of the children reported that they did not like school and thought they were not doing
well. For this small group, their early self-report of poor adjustment was predictive of later
academic difficulties and higher rates of grade retention and placement in special education,
even though their academic and social skills at the time of school entry did not differ
significantly from those of other Head Start children.
THE HIGHEST ACHIEVING FORMER HEAD START CHILDREN ARE
HIGHLY CAPABLE AND COMPETITIVE ACADEMICALLY
Within this multi-site study, the former Head Start children with the highest levels of
academic skills (the top 3%) were identified. These children earned reading and math
standardized scores that placed them in the 98th percentile nationally. These children were
more likely to have families with somewhat higher resource levels, fewer stressors, and
parents who endorsed more responsive and non-restrictive parenting styles than did other
Head Start families. These academically talented former Head Start children represent an
important group who are likely to benefit from increased early learning and language
opportunities, as well as other academic enrichment activities.
Page vii
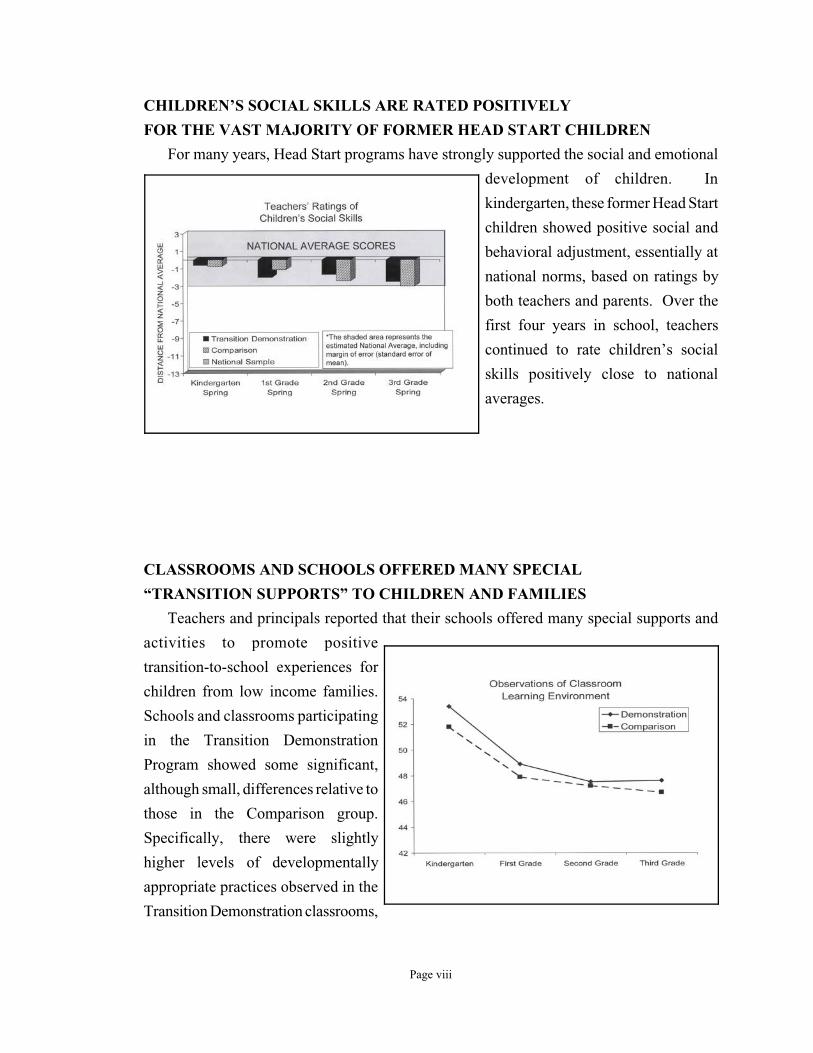
CHILDREN’S SOCIAL SKILLS ARE RATED POSITIVELY
FOR THE VAST MAJORITY OF FORMER HEAD START CHILDREN
For many years, Head Start programs have strongly supported the social and emotional
development of children. In
kindergarten, these former Head Start
children showed positive social and
behavioral adjustment, essentially at
national norms, based on ratings by
both teachers and parents. Over the
first four years in school, teachers
continued to rate children’s social
skills positively close to national
averages.
CLASSROOMS AND SCHOOLS OFFERED MANY SPECIAL
“TRANSITION SUPPORTS” TO CHILDREN AND FAMILIES
Teachers and principals reported that their schools offered many special supports and
activities to promote positive
transition-to-school experiences for
children from low income families.
Schools and classrooms participating
in the Transition Demonstration
Program showed some significant,
although small, differences relative to
those in the Comparison group.
Specifically, there were slightly
higher levels of developmentally
appropriate practices observed in the
Transition Demonstration classrooms,
Page viii

more parent involvement activities of a non-traditional nature, and increased use of certain
transition supports as reported by principals.
It is noteworthy that many schools and classrooms, in both the Transition Demonstration
and Comparison groups, had multiple transition supports in place, such as communication
between Head Start programs and the public schools prior to a child entering kindergarten
and multi-year continuity in the educational curriculum. Parents in both the Transition
Demonstration and Comparison schools had highly favorable impressions of their school
climate, as did teachers and principals.
MANY FORMER HEAD START FAMILIES STEADILY DECREASED IN THEIR
NEED FOR PUBLIC ASSISTANCE PROGRAMS
In the kindergarten year, about
37% of these former Head Start
families received some federal cash
assistance (AFDC). Over the next
four years, about 25% of these
families became economically self-
sufficient and no longer received
AFDC. (Note: This was before the
Welfare Reform legislation of 1996.)
Similarly, about the same percentage
decline occurred for families living in
public or subsidized housing.
Further, the percentage of families reporting they had unmet social, health, or employment
needs declined from about 28% when their child entered kindergarten to less than 17% at the
end of third grade. Each year, about 20-25% of the families reported an increase in their
family’s income. This pattern of increased self-sufficiency appeared for families in both the
Transition Demonstration and Comparison groups.
Page ix

HEALTH CARE IS RATED POSITIVELY BY FORMER HEAD START FAMILIES
When these former Head Start children entered kindergarten, more than 85% of their
families reported that they had
adequate health care insurance,
including Medicaid for nearly 60%.
Further, they are well satisfied with
the quality of health care they receive.
This positive appraisal of the health
care received and the overall health
status of former Head Start children
continues throughout the first four
years of school. More than 77% of
the children are rated as having
“excellent” or “very good” health,
with only 6% having chronic or serious health care conditions that interfere with their full
participation in school programs. (Note: the study sample included the 10% of former Head
Start children who had disabilities identified before they entered public school.)
MATERNAL DEPRESSION IS A SIGNIFICANT FACTOR
FOR MANY FAMILIES LIVING IN POVERTY
Despite the overall well-being of the children, somewhat more than 40% of the primary
caregivers (mostly mothers) were screened positive for depressive symptomatology when
their children enter kindergarten. About 19% of the mothers reported continued, chronic
problems with depression when their children were completing third grade.
In addition, a subgroup of approximately 3% of these former Head Start families reported
that the primary caregiver suffered major health problems sufficient to interfere with their
ability to provide routine support for their children’s learning and participation in school-
related activities. The need to consider the well-being of the child’s primary caregiver,
particularly mental health services, is important, especially during this transition to school
period.
Page x

OUTCOMES FOR THE TRANSITION DEMONSTRATION GROUP DIFFERED IN
ONLY VERY SMALL WAYS FROM THOSE OF THE COMPARISON GROUP
Using complex statistical models of growth curves and hierarchical linear modeling
of children’s academic and social development from kindergarten through the first four
years in public school, a few statistically significant differences were detected between
those in the Transition Demonstration versus Comparison groups. These differences
Reading Scores Predicted quadratic growth curves for
Transition Demonstration (—) and Comparison (- - -) Groups
Child’s Age at Time of Assessment
Math Scores Predicted quadratic growth curves for
Transition Demonstration (—) and Comparison (- - -)
Child’s Age at Time of Assessment
Page xi

appeared for aspects of the children’s growth in reading and math skills, although the
magnitude was so small as to be considered, by conventional standards, non-
consequential.
At least three factors may have contributed to the fact that participants in the Transition
Demonstration Program showed limited benefits relative to the comparison group. First,
only one-fifth of the Transition Demonstration Programs were implemented at consistently
high levels, while most were either moderate or uneven in their quality and intensity and
more than one-fourth were weak. Second, the Comparison schools often enacted additional
programs and supports that essentially mimicked those in the Transition Demonstration
group. In fact, the philosophy guiding this Congressionally supported program was widely
endorsed at the community level and many of the Comparison schools sought outside
funding to offer special supports to former Head Start children and parents. Third, the
children in both the Transition Demonstration and Comparison groups appeared to benefit
tremendously from their school experiences. The vast majority of children earned high
marks for positive school adjustment as indicated by: scoring at national averages in their
reading and math abilities, having social skills rated positively by teachers and by parents,
and their parents and the children themselves reporting that children liked school and were
doing well.
Many exploratory and confirmatory analyses were conducted to better understand these
findings. Analyses of individual sites indicated that the children in one treatment group
sometimes performed slightly higher and showed greater gains than did those in the other,
although these differences tended to be very small in magnitude, not necessarily stable across
years, and not consistently favoring either the Transition Demonstration or Comparison
group. Further, more than one-third of the children changed schools at least once. At some
sites, over half of the children moved at least once in the first four years of school. This high
mobility limited the number of children and families at each site who received the full “dose”
of the planned Transition Demonstration Program and prevented testing the maximum
benefits for some children and families.
SUMMARY
The National Head Start-Public School Early Childhood Transition Demonstration
Program was implemented in 31 sites to varying degrees in terms of quality and intensity of
supports and services provided to children, families, and schools. All sites reported they
strongly valued the program and many instituted aspects of the program for continuation
Page xii

beyond the funding period. Many of the innovative activities and programs enacted have
the potential for use in other schools, particularly those that:
(1) seek to make schools more welcoming to low income families,
(2) improve the quality of classroom instruction for young children,
(3) show appreciation for cultural and linguistic diversity of children and families,
(4) guide parents in how to support their children’s learning at home,
(5) afford parents expanded and non-traditional ways of becoming involved with
their children’s schools, and
(6) create strong community-based partnerships to streamline and enhance the social
and health service supports to low income families and children.
After only two or three years in public school, the vast majority of former Head Start
children are achieving essentially at national averages – a significant gain over their skills
when they entered kindergarten. This study clearly refutes the longstanding view of a
“fade-out effect”of benefits for Head Start children.
The children overwhelmingly reported they liked school, got along well with teachers and
peers, and tried to do their best in school, reflecting the strong values that their parents and
the children themselves placed on the importance of school. Some of the children showed
remarkable academic talent, while others required special education placement and/or
repeated a grade, usually due to a combination of poor social and academic progress.
These former Head Start families generally showed annual improvements in their living
conditions, steadily relying less on government support programs. Whether this remarkably
encouraging picture of thousands of former Head Start children extends to the nation as a
whole -- especially to communities that did not participate in this special federal program or
that are not actively seeking to foster partnerships with Head Start programs -- is not known.
The portrayal of the remarkably positive school adjustment of these former Head Start
children is in marked contrast to earlier reports that these children “lose the gains” from their
Head Start experiences. Although these positive outcomes cannot be ascribed clearly to any
single aspect of treatment or even strongly to the Transition Demonstration program itself,
there was clear evidence that community partnerships were strengthened and that multiple
transition supports were enacted in most of these sites to promote the early school adjustment
of children who begin school with economic and other challenges in their families and
communities.
Page xiii

PART 1: HISTORY & BACKGROUND
**************
Chapter 1 - A Brief History of the National Head Start Public School Early Childhood Transition Project
Chapter 2 - Rationale and Design

PART 1: HISTORY AND BACKGROUND
The two chapters included in this section present key information concerning the
background, history, rationale, and organization of the National Head Start/Public School Early
Childhood Transition Demonstration Project and its evaluation, the National Transition
Demonstration Study. An understanding of the underlying rationale, conceptual model, research
design, and study size is essential to interpreting the findings reported in subsequent chapters.
The national evaluation of the National Transition Demonstration Project was designed by
ACYF to achieve three goals:
“1. Identify successful strategies used, problems encountered, and solutions found when Head
Start grantees, parents, local education agencies and other community agencies cooperate
and coordinate a program of comprehensive and continuous services to children and
families from Head Start through third grade.” These findings are presented in Part 2 of
this report.
“2. Determine the effects of the demonstration on children, families, the Head Start program,
the public school system and the community.” These findings are presented in Part 3 of
this report.
“3. Assess the effectiveness of the transition concept as a means for the maintenance and
enhancement of early gains achieved by Head Start children and families.” These issues
are addressed throughout the discussions of both program implementation (Part 2) and
outcomes (Part 3).
Part 1 - Page ii

CHAPTER 1 - INTRODUCTION
In 1994 the One Hundred Third
Congress of the United States of America
passed the Goals 2000: Educate America
Act, specifying a series of eight national
goals and related objectives to be achieved
by the year 2000. These goals, endorsed by
the nation’s governors and leading
educators, encompassed school readiness,
school completion, student achievement
and citizenship, mathematics and science,
adult literacy and lifelong learning, safe
and productive learning environments, and
parental participation. The first goal
addressed the national commitment that all children would enter school ready to take full advantage
of the learning experiences to come in the years ahead. The eighth and final goal addressed the
commitment to build parent-school partnerships to facilitate child growth and development and to
engage in shared educational decision making.
Established in 1965, the Head Start program serves preschool children, ages three through five,
with the goal of providing comprehensive developmental services in the areas of education, socio
emotional development, physical and mental health, and nutrition. The program strives to ensure
that children enter kindergarten prepared to succeed. In the 30 years since its inception, Head Start
has provided and secured services for nearly 14 million children and families (ACYF, 1997). Two
features have distinguished Head Start from many other preschool programs: (1) its approach to
assisting children by providing comprehensive supports and emphasizing family development
(Parker, Piotrkowski, Horn, & Greene, 1995; Zigler & Valentine, 1979) and (2) its emphasis on
By the Year 2000, all children in America will start
school ready to learn...
• All children will have access to high-quality and
developmentally appropriate preschool programs
that prepare children for school;
• Every parent in the United States will be a child’s
first teacher and devote time each day to helping
such parent’s preschool child learn, and parents will
have access to the training and support parents
need; and
• Children will receive the nutrition, physical activity
experiences, and health care needed to arrive at
school with healthy minds and bodies, and to
maintain the mental alertness necessary to be
prepared to learn.
Chapter 1 - Page 1

parent involvement in both the growth and development of children and in governance of programs
(ACYF, 1997).
The National Head Start/Public School Early Childhood Transition Demonstration Project has
also been an effort to promote the national educational goals. Providing comprehensive, continuous,
Head Start-like services to children and families as they make the transition from Head Start into
public school kindergarten and through the early elementary grades, the Transition Demonstration
Project has included many of the same key features that have distinguished successful Head Start
programs: supportive social services to
encourage family development; health,
nutrition, and mental health services to
improve the immediate and long-term
health and well-being of children and
t h e i r f a m i l i e s ; s t r o n g a n d
developmentally appropriate early
childhood educational programs to
support cognitive, social, and emotional
development for young children; and
activities and supports to encourage and
strengthen family involvement in
learning at home, at school, and in the
community. Individual Transition
Demonstration Programs have been
implemented in 31 diverse communities
in 30 states and the Navajo Nation, providing a rich fund of information about the processes,
challenges, successes, and – ultimately – the outcomes of these efforts. The sites, along with their
geographic locations, grantee agencies, project directors, and local evaluators, are detailed in
Appendix A. Chapter 2 provides background and contextual information about the rationale, design,
goals, and evaluation of the National Transition Demonstration Project.
By the Year 2000, every school will promote partnerships
that will increase parental involvement and participation in
promoting the social, emotional, and academic growth of
children.
• Every State will develop policies to assist local schools
and local educational agencies to establish programs for
increasing partnerships that respond to the varying needs
of parents and the home, including parents of children
who are disadvantaged or bilingual, or parents of
children with disabilities;
• Every school will actively engage parents and families in
a partnership which supports the academic work of
children at home and shared educational decision making
at school; and
• Parents and families will help to ensure that schools are
adequately supported and will hold schools and teachers
to high standards of accountability.
Chapter 1 - Page 2

PURPOSE OF THIS REPORT
This report presents key findings of the National Transition Demonstration Study. Its purpose
is to summarize the results relating to both the process and the outcomes of program implementation.
These results are important for three specific purposes:
1. To address the national research questions that have guided the National Transition
Demonstration Study;
2. To understand the outcomes for former Head Start children, families, schools, and
classrooms and,
3. To highlight key policy implications.
NATIONAL STUDY QUESTIONS
The National Transition Demonstration Study was guided by a set of questions related to
understanding successful transitions and the effects of the Transition Demonstration Project. These
questions were:
Question 1: How have the Head Start/Public School Early Childhood Transition Demonstration
Programs been implemented at local sites?
Question 2: To what extent have comprehensive, continuous Head-Start-like services been
provided to participating children and families?
Question 3: What have been the barriers and difficulties encountered in implementing the
Transition Demonstration Programs?
Question 4: What characteristics of local sites are associated with more (or less) successful
implementation of a Transition Demonstration Program?
Question 5: As a result of the Head Start/Public School Early Childhood Transition
Demonstration Programs, what institutional and systemic changes are evident at local
sites? Specifically, what systemic changes are noted in how schools, service
providers, and communities offer transition supports?
Question 6: To what extent do families participating in a Transition Demonstration Program
show positive outcomes? Is there evidence of increased parental involvement,
improved family and parent functioning, or increased self-sufficiency as a function
Chapter 1 - Page 3

of program participation?
Question 7: To what extent do children in Transition Demonstration Programs show positive
outcomes? Specifically, do children in the Transition Demonstration group,
compared to those in the comparison group, show more favorable attitudes toward
school, better social-emotional adjustment, higher achievement in academic and
language skills, and lower rates of grade retention and special education placement?
Question 8: Do some families and children appear to benefit more than others from the Transition
Demonstration Program? If yes, what are their characteristics and why are they likely
to show more benefits?
Question 9: For families and children who have poor transition experiences, what are the factors
associated with non-optimal outcomes?
UNDERSTANDING OUTCOMES
Understanding program implementation is crucial to understand the impact on children, families,
schools, and communities. In the National Transition Demonstration Study, there has been
tremendous variation, including:
1. Program design variation. As with Head Start programs, the local Transition Demonstration
Programs were to design and implement programs to provide supports to children, families,
schools, and communities in four key component areas: family social services, family
involvement in education and governance, developmentally appropriate educational practices
and programs, and health and nutritional services. However, within broad parameters, local
programs were allowed and encouraged to develop innovative, individualized programs that
built on the strengths of their communities and participating agencies (Head Start, local
education agencies, and community service providers) and met the needs of their children,
families, schools, and communities. As discussed in a previous report (see Interim Report
on the National Head Start/Public School Early Childhood Transition Demonstration Study),
this program development strategy yielded a great deal of variation across, and even within
sites. There is no single definition of the intervention involved in the Transition
Demonstration Study. Rather, there are 31 interventions that evolved over time and varied
Chapter 1 - Page 4

from school to school.
2. Local community variation. The 31 sites reflect some of the diversity found in communities
across our country. The Transition Demonstration Programs were implemented in very
diverse communities – inner city, urban fringe, city, small town, rural – by diverse Head Start
agencies and school districts. Local philosophy, culture and experiences are reflected in
many aspects of program implementation.
3. Partnership variation. ACYF required that a local consortium implement the demonstration
program, including the Head Start program, a local education agency (LEA), and a
university-based or non-profit research group. These trials were partnerships identified in
the original grant application. However, the size and complexity of these local partnerships
differed. For example, some sites included a single Head Start agency and a single school
district, while others included multiple Head Start and multiple LEA partners.
Administratively, the Transition Demonstration Program was operated sometimes by the
Head Start agency, sometimes by a school district, or sometimes through a joint Head Start-
public school arrangement that was already established. The prior history of these
partnerships in enacting other special projects also varied, from first-time partnerships to well
established, highly successful collaborations.
Because of these variations, the National Transition Demonstration Study is not amenable to a
simplistic “treatment versus control” analysis of outcomes if the goal is to understand what
combination of factors promotes positive transition-to-school experiences. Rather, an in-depth
appreciation of local site variation is necessary for interpreting the findings from the national
evaluation.
Chapter 1 - Page 5

CHAPTER 2 - RATIONALE
In the 36 years (Head Start was established in
1965) that Head Start has been in operation, much
has been learned about intervention programs for
young children, their effectiveness, their long-term
benefits, and their limitations. The National Head
Start/Public School Early Childhood Transition
Demonstration Project was designed to build on
and push forward this body of knowledge. This
chapter first summarizes some of the insights gained through research in early intervention and then
discusses some of the key concerns and positive events that formed the impetus of this national
demonstration project. A brief description of the National Transition Demonstration Project follows,
including a discussion of program goals and key components. Finally, a brief overview of the
National Transition Demonstration Study is presented, highlighting the new style of research that
is operationalized within the study. The research design and the conceptual model underlying the
evaluation are presented to provide a framework for the discussions of findings in subsequent
chapters.
In this chapter:
• Lessons from early intervention research
• Impetus for this Transition Demonstration
Project
• Description of the National Transition
Demonstration Project
• Program Goals
• National Transition Demonstration Study
LESSONS FROM EARLY INTERVENTION RESEARCH TO DATE
In recent reviews of the status of early intervention research, Ramey and Ramey (1998, 1999)
have reported that randomized, controlled trials of strong programs — i.e., those providing high
quality, intensive early education to children and relying on developmental theory to guide the
content of the intervention — have yielded significant benefits for children, often extending through
adolescence and into young adulthood (Ramey, Campbell, Sparling & Ramey, 2000; Campbell,
Ramey, Sparling, & Burchinal, 1999). In addition, the Rameys (Ramey & Ramey, 1992) identified
six principles regarding successful early childhood interventions for at-risk children and their
families:
Chapter 2 - Page 6

1. Timing. Interventions beginning earlier and continuing longer tend to show greater benefits for
participants than those beginning later and not lasting as long.
2. Intensity. Programs that are more intensive (that is, more hours per day, more days per week,
more weeks per year, and multi-year) produce greater positive effects than those that are less
intensive. In addition, there is some evidence that children and parents who participate more
actively (receive greater amounts of services and supports) show the greatest amount of progress.
3. Direct intervention. The provision of services directly to children, enhancing their daily learning
experiences, produces more positive and lasting results than the provision of indirect services
(such as parent training or home-based services only).
4. Breadth. Interventions that provide more comprehensive services typically show stronger effects
that those that are more narrow in focus. Specifically, interventions that include both direct and
indirect interventions produce the most robust effects.
5. Individual differences. Some children appear to benefit more from interventions than do others,
most likely as a function of the initial risk status of the family and the degree to which the
program provides needed supports to compensate for risks.
6. Environmental maintenance. The initial positive effects of early intervention are most likely to
be sustained in later years when there are continuing supports, particularly the availability of
good quality public education and community supports for low income families.
The National Transition Demonstration Project was designed to build upon this knowledge
about effective early interventions. The local programs were to be comprehensive and multi-
pronged. All were multi-year and coordinated with Head Start programs. Both direct child supports
for education and health, as well as indirect supports to the families and school were provided.
Further, the Transition Demonstration Programs extended throughout the school year, and in some
sites included extended day services or summer programs for children.
Chapter 2 - Page 7

IMPETUS FOR DEVELOPMENT OF TRANSITION DEMONSTRATION PROGRAM
Impetus for this Transition Demonstration
Project:
• New perspectives on school readiness
• Concern about levels of parental involvement
in schools
• Concern about the perceived fade-out
phenomenon
• Educational statistics regarding poor
performance of children from low income
families
• Success of Head Start in component areas
• Promising outcomes of earlier transition
The Transition Demonstration Project
effort was grounded in a desire to foster the
implementation of “unified child and family
development programs that span the early
childhood years from preschool through [at
least] third grade.” (ACYF, 1991). These
unified, two-generational programs were seen
as desirable and necessary based on several
factors. First, the current views about what
“ready to learn” means go well beyond
traditional ideas of the child’s readiness, in
terms of reading readiness or social readiness
(cf. Crnic & Lamberty, 1994; Kagan, 1994; Ramey & Ramey, 1994, 1999). The new perspectives
on school readiness recognize the importance of three additional factors: (1) the readiness of schools
to meet the needs of children who enter at varying levels of development and progress at different
rates; (2) the readiness of families to support the growth and development of their children as they
move into and through the formal educational years; and (3) the readiness of communities to invest
in education for children and families (Kagan, 1994). This more comprehensive concept of
“readiness for school” has led Head Start programs, public schools, and communities to collaborate
more closely in the provision of a wide range of educational experiences and supports for children.
Involvement of parents in the learning activities of children is assumed to improve achievement
and other educational outcomes for student. Students whose parents are involved in their learning
are more likely to remain in school and are less likely to be retained in grades (e.g., Rubin, Olmsted,
Szegda, Wetherby, & Williams, 1983). They tend to make better grades, achieve higher test scores,
and show more positive attitudes and behavior in school than those with less involved families (e.g.,
Peterson, 1989; Gorges, 1995; Reynolds, 1996).Increasingly, there is concern that many children
do not receive optimal levels of parent involvement with schools or learning activities at home.
Several factors of concern include: (1) the large number of single parent households and households
Chapter 2 - Page 8
that have two working parents; (2) parental uncertainty about how to help their children with school-
related tasks; and (3) linguistic and cultural barriers faced by immigrants and families that have
limited English proficiency. One of the goals of the Transition Demonstration Program was to help
promote parent involvement, taking into account the multiple challenges faced by many low income
families.
There is a vast literature documenting the increased risk for poor school performance among
children from economically impoverished families (e.g., Byrd & Weitzman, 1994; Davis & McCaul,
1991; Duncan, 1993; Powell, 1995; Zill & Collins, 1996). Indeed, the concern about increased risk
faced by children in poverty was one of the original sources of impetus for the Head Start program
in the early 1960's.
There also are concerns that former Head Start children may not do well as they progress
through the elementary school years. Early childhood researchers and practitioners have suggested
that a “one-year inoculation” (the typical length of most Head Start programs is about 8-9 months)
is insufficient to sustain early benefits (Kagan, 1991) if children then go to poor quality schools.
Others have speculated that a fade-out effect may occur when there is lack of continuity in
philosophy, methods, services, and environment as children move from Head Start into the public
schools (Lombardi, 1992). Recent analyses indicate that former Head Start children who enter
inferior schools are indeed those most likely to show this “fade-out effect,” while those who attend
better quality schools do not (Currie & Thomas, 1995, 1997). The Transition Demonstration
Programs promoted improved quality and continuity of curriculum and educational practices, as well
as offering supports to children and families.
Another impetus for the Transition Project was the belief that continuity among environments
provides positive benefits for children moving from Head Start to public school. A national survey
conducted a decade ago showed most schools had only a few formal transition supports in place
(Love, Logue, Trudeau, & Thayer, 1992). In the late 1980s, ACYF funded a demonstration initiative
to promote specific activities to foster positive school transitions for Head Start children and
families. These programs implemented a variety of activities, such as sharing information between
Head Start and kindergarten teachers, kindergarten classroom visits by Head Start children and
parents, and shared planning for children with special needs(Love, Logue, Trudeau, & Thayer, 1992).
Chapter 2 - Page 9

Review of earlier research has shown that some Head Start programs are associated with gains
in cognitive development, academic achievement, and social development (McKey, Condelli,
Ganson, Barrett, McConkey, & Plantz, 1985). Head Start children are more likely to receive
preventive and remedial services, including medical and dental examinations, speech services, and
vision screening or examinations than other low-income children (Fosburg & Brown, 1984; Hale,
Seltz, & Zigler, 1990). Important changes in family functioning have been noted (Leik & Chalkley,
1988), and families have reported feeling more capable of supporting their children’s learning,
spending more time in learning activities, being more knowledgeable about age-appropriate
activities, and learning how to find assistance in their communities (Reedy, 1991). These point to
the successes that Head Start programs can facilitate through providing comprehensive supports
to children and families. The Transition Demonstration hoped to build on these successes by
continuing these supports through the early years of elementary school.
DESCRIPTION OF THE NATIONAL TRANSITION DEMONSTRATION PROJECT
In 1991, Congress passed legislation authorizing the National Head Start/Public School Early
Childhood Transition Demonstration Project. Specifically, each local Transition Demonstration
Program was to address three major tasks:
1. The development of successful strategies in which Head Start programs, parents, LEAs,
and other community agencies join together to plan and implement a coordinated and
continuous program of comprehensive services for low-income children and their
families, beginning in Head Start and continuing through the first four years of public
school;
2. The development of effective strategies to support the active involvement of families in
the education of their children; and
3. The testing of the hypothesis that the provision of continuous, comprehensive supports
will maintain and enhance the early benefits of Head Start children and their families.
The key program components of the Transition Demonstration Program included:
1. Family support services
Chapter 2 - Page 10

S supportive social services, including special family service coordinators, to help
facilitate positive family-school interactions and to assist in securing and
coordinating services across agencies;
S comprehensive family strengths and needs assessments and individualized family
support plans;
2. Family involvement opportunities
S programs for families to increase their involvement in children’s school activities;
S local governing boards, established to guide program development and
implementation and comprising parents, school, and community representatives;
3. Health, nutrition, and mental health services
S essential health and nutrition services to ensure the physical and mental health of the
entire family;
S appropriate health, nutrition, and mental health education activities for children and
families to promote the physical and mental health of the entire family
4. Educational programming
S developmentally appropriate curricula and educational practices in the classroom to
individualize learning experiences for children;
S strong partnerships between Head Start programs and public schools to ensure
continuity in educational experiences;
S parent education programs to promote strong parenting skills, educational and
vocational growth for adult family members, and strong and stable family
functioning;
S individual child transition plans to ensure the smooth transition of children from
Head Start into public schools;
S activities to encourage the inclusion of children with disabilities (that is, special
education students) in regular school programs.
Included in all program efforts was to be an emphasis on cultural diversity, sensitivity, and
awareness. Local programs were to:
• develop activities to promote cultural awareness and sensitivity among children, families,
Chapter 2 - Page 11

schools, and communities; and
• promote the inclusion of culturally relevant activities and the recognition and
accommodation of diversity in the school and community.
NATIONAL TRANSITION DEMONSTRATION STUDY
This Transition Demonstration Project is distinctive in two important ways. First, research was
included as an integral component of the program, providing information about the project’s success
in achieving its goals and objectives. Each local Transition Demonstration Program was required
to conduct an evaluation locally to measure program impact. Second, there was a National Study -
a multi-site, randomized, and longitudinal study -- to yield an overall, systematic evaluation of this
national project. Accordingly, all local evaluation teams participated in the national study as
partners. This dual research strategy permits a valuable unique understanding of program variation
and participant variation in relation to program impact.
New Research Approaches
The dual local/national research design specified within the National Transition Demonstration
Project reflects a new style of research recommended in 1990 by the Advisory Panel for the Head
Start Evaluation Design Project. The panel was convened to further future research about the
effectiveness of Head Start programs. The Advisory recommended ACYF implement an integrated
and coordinated set of research and evaluation studies designed to address the questions of which
Head Start practices maximize benefits for children and families, how participants with different
characteristics benefit and under what circumstances, and how gains are sustained after the Head
Start experience (ACYF, 1990). The Panel also recommended that:
• The diversity of children, families, and communities be recognized;
• Different outcomes relating to children, families, communities, and institutions be included;
• Multiple indicators and measures that can be readily understood by multiple audiences be
used;
• Program variation be explored in relation to differential outcomes; and
• Research efforts build on the strengths of Head Start programs.
These recommendations are operationalized in the request for proposal for the National
Chapter 2 - Page 12

Transition Demonstration Study. For further description about this new approach to evaluating
multi-pronged educational evaluations via partnerships, see Ramey and Ramey (1997).
RESEARCH DESIGN AND IMPLEMENTATION
The National Transition Demonstration Study is a multi-site, randomized trial designed to test
the overall hypothesis that the delivery of continuous, comprehensive services in Head Start and
continuing through third grade can maintain and enhance the early gains of former Head Start
children and their families (ACYF, 1991). Each site was to identify two clusters of Head
Start/elementary school units serving similar types and numbers of children and families and then
randomly select one cluster to become the Treatment (demonstration) group and the other to become
the Comparison (control) group. The demonstration group would receive the Transition
Demonstration services, while the Comparison group received typical services. This design
minimizes (but does not eliminate) the possibility of bias (such as providing the Transition
Demonstration only in certain types of schools or to certain types of participants) and strengthens
the scientific merit of the study. (Note: the study design varied somewhat across sites.a)
Two groups of former Head Start children and their families were recruited at 31 sites to
participate in the study. The first group (Cohort 1) includes 3,540 children and families, enrolled
as they entered kindergarten in the fall of 1992; the second group (Cohort 2) includes 3,975 families
whose children entered kindergarten in the fall 1993. Table 1 summarizes the sample of children
and families that were available for analysis in the national study. The procedures used to create this
analysis sample are outlined in Technical Report 1.
Table 1Design and Enrollment of Former Head Start Children and Families
Available for Analysis in the Longitudinal National Transition Demonstration Study(Demonstration and Comparison Groups)
Demonstration Group
Comparison Group Total
Cohort 1 (Fall, 1992) 1,889 1,651 3,540
Cohort 2 (Fall, 1993) 2,039 1,936 3,975
Total 3,928 3,587 7,515
Chapter 2 - Page 13

Table 2 Sample Sizes for 31 Sites in National Transition Demonstration Study
Cohort 1 Cohort 2 Combined Cohorts
26 44 70
49 52 101
47 57 104
56 48 104
90 51 141
83 68 151
94 93 187
102 87 189
93 106 199
94 115 209
94 118 212
97 126 223
83 154 237
118 125 243
126 121 247
118 132 250
140 120 260
127 135 262
125 138 263
136 131 267
112 157 269
137 138 275
157 160 317
160 159 319
107 215 322
168 172 340
116 241 357
191 187 378
203 192 395
291 333 624
3,540 3,975 7,515
Table 2 presents the sample size at each of the 31 sites. Local sites recruited samples that ranged
from 70 to 624 families (both cohorts combined). It is important to note that the number of families
involved in the demonstration group within the research study does not represent the total number
of families receiving services from the local programs. There were three important reasons for this
Chapter 2 - Page 14

difference. First, a key feature of the program design was the provision of services to all children
in the classroom, regardless of whether they were previously enrolled in Head Start or not. Second,
the size of the local programs differed considerably, and it was not always feasible to enroll all
former Head Start children in the national study. For these sites, a representative sample was invited
to participate. Finally, as in all research, families were free to decline to participate in the research
but still continue to receive services through the program – although only a small percentage of
invited families did not volunteer to participate.
SOURCES OF INFORMATION
The National Transition Demonstration Study has collected data from a variety of sources and
in a variety of ways, providing multiple perspectives on the progress of children, families, schools,
and communities over the course of the Transition Demonstration Project. The data collection
strategies, described more extensively in a previous report, the Interim Report on the National Head
Start/Public School Early Childhood Transition Demonstration Study (1996), have included:
Interviews with family members, conducted by trained, community-based individuals, using
standardized assessment tools and a few instruments developed specifically for this study;
Direct assessments of children, administered by trained child examiners, relying on
standardized tests of achievement and children’s self-report of their school experiences;
Standardized ratings completed by teachers concerning individual children, classrooms, and
school environments;
Reports by principals on school climate and use of transition supports;
Direct observation of classrooms, using standardized assessment procedures;
Annual 3-day local site visits conducted by multidisciplinary teams to provide systematic and
qualitative data about program implementation and local site challenges and
accomplishments;
Review and abstraction of records, including children’s school records and project-specific
program documentation and reports;
Content analysis and systematic coding of open-ended and qualitative information collected
during interviews with family members, project directors, and other key informants within
each site; and
Chapter 2 - Page 15

Collection of community-level aggregated data from public information sources, such as
United States Census data and national school databases.
The specific sources of information used in analyses reported in the chapters to follow are
described in the relevant chapters. An overview of the data collection process by instrument,
informant, domain, and data collection period is presented in Appendix B.
CONCEPTUAL MODEL
The conceptual model that underlies the National Transition Demonstration Study is presented
in Figure 2.1 (next page). This model is based on developmental systems theory and specifies
context, inputs, process, and outcomes. On the left side of the figure, child inputs are portrayed as
being embedded within and influenced by the family’s inputs. Both the child and family are
influenced by the community context and community resources, including the availability and quality
of social services, child care supports, school systems, and health services. Further, positive
transition outcomes for children and families are expected to relate systematically to what is
happening within eight major functional domains, including: survival resources to meet the child’s
and family’s needs; health and nutrition; safety and security; self-concept; values and motivation to
do well in school; social support to facilitate transitions to and through school; communication skills;
and basic academic, social and work skills.
These eight domains essentially may be used to characterize the child’s and family’s status (in
terms of both strengths and needs) when children enter kindergarten. The elements of the Transition
Demonstration Program were specified to help programs identify the strengths and service needs of
families and children, providing a basis for Individualized Family Plans and Individualized Child
Transition Plans. Ultimately, the services provided by the Transition Demonstration Program in the
areas of family support services, health and nutrition, education, and family involvement, are
expected to facilitate the adjustment of children and families to elementary school; to generate a
comprehensive web of support for children, families and schools during the early years of elementary
school; and to enhance positive expectations by children and families regarding future learning.
Chapter 2 - Page 16

Chapter 2 - Page 17

The potential outcomes for children, families, schools, and communities are specified at the far right
of the model. These include:
• children have positive feelings about school, teachers, parents, and peers;
• children show good progress in physical, social emotional, and intellectual development;
• parents and key adults express positive attitudes toward school and actively promote
children’s learning;
• teachers and school personnel appreciate and provide programs adapted to children’s
individual development and cultural/linguistic diversity; and
• mutuallly supportive relationships occur among families, school personnel, service
providers, and communities.
An earlier Interim Report (1996) presented preliminary information about the child and family
inputs in the eight major functional domains. This report is concerned with the elements of the
model that have been shaded: the community context, the processes of Transition Demonstration
Program implementation, and the provision of comprehensive supports for children and families
during the early years of elementary school. This report also discusses the outcomes that occurred
for children and families.
Chapter 2 - Page 18

ENDNOTES, CHAPTER 2
a. The 31 sites employed a variety of randomization strategies in meeting the requirements of the RFP. These randomization strategies fall into three basic categories:
1. Schools were randomly assigned to demonstration or Comparison condition. A total of 14 sites utilized this strategy. Within one of those sites, the research team also randomly selected classrooms within the school (after the school had been assigned its treatment condition).
2. Schools were grouped and then randomly assigned to treatment condition. In 10 sites the research team grouped schools into clusters or pairs based on demographic characteristics. Sites that utilized clusters then randomly assigned a cluster of schools to either demonstration or Comparison condition. Sites that paired schools most often randomly chose one school within the pair to be the demonstration school and assigned the other school in the pair to be the Comparison school.
3. School districts were randomly assigned to treatment condition. In 6 sites the school district was the unit of randomization, with whole school districts being randomly assigned to serve as demonstration or Comparison. Schools within that district then were designated as demonstration or Comparison based on the district’s assignment.
One site randomly assigned families to demonstration or Comparison groups as the children entered kindergarten. Demonstration children in that site all attended a single new school, established by the participating school district to serve as a demonstration school for best practices in developmentally appropriate educational programming and parent involvement.
Chapter 2 - Page 19

PART 2: IMPLEMENTATION
**************
Chapter 3. Context of Program Implementation: Diversity Among Families, Schools, and Communities
Chapter 4. Implementation
Chapter 5. Extent of Implementation
Chapter 6. Factors Influencing Variation
Chapter 7. What Contributes to Successful Implementation

OVERVIEW AND SUMMARY FINDINGS
The chapters included in Part 2: Implementation summarize the
findings related to the implementation of the National Transition
Demonstration Project in the 31 local sites. The initial chapter (Chapter 3)
addresses the context of the implementation, highlighting the diversity that
was found among the sites – diversity among the communities, the school
districts, the schools, and the families participating in the Transition
Demonstration Project and its National Transition Demonstration Study.
Subsequent chapters present discussions of: the ways in which the local
sites designed and conducted their programs (Chapter 4); the extent to
which the various program components were implemented at the local site
level (Chapter 5); the variation in program implementation across the 31
sites and how the context of the local program influenced program
implementation over the years, including challenges encountered (Chapter
6); and factors associated with the most and least successful implementation
of these ambitious, Head Start-like programs (Chapter 7).
Overall, it is noted that the 31 sites did, indeed, implement the
Transition Demonstration Program in accordance with the mandates and
guidelines included in the original Request for Proposals. Each site addressed to some degree the
four components and provided an array of comprehensive services designed to meet the social,
health, and educational needs of children and families and to stimulate family involvement in the
education of their children. The specific strategies and activities sites employed to address the
implementation varied substantially across sites. While there were many implementation features
shared by sites, the actual program implementation within each of the 31 sites was a unique
configuration of activities and personnel devised to take advantage of the strengths and address the
needs of the children, families, schools, and community agencies. In many sites, transition-like
services were also offered in comparison schools, sometimes with very similar quality and intensity.
Part 2 - Page ii
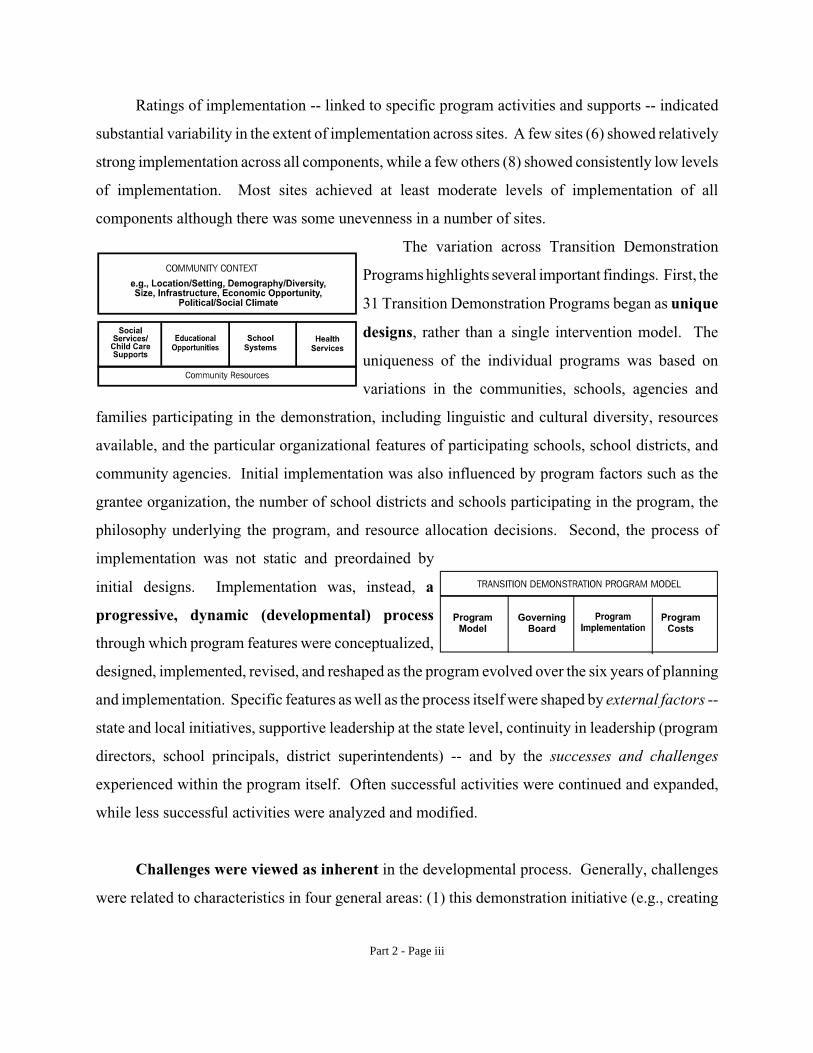
Ratings of implementation -- linked to specific program activities and supports -- indicated
substantial variability in the extent of implementation across sites. A few sites (6) showed relatively
strong implementation across all components, while a few others (8) showed consistently low levels
of implementation. Most sites achieved at least moderate levels of implementation of all
components although there was some unevenness in a number of sites.
The variation across Transition Demonstration
Programs highlights several important findings. First, the
31 Transition Demonstration Programs began as unique
designs, rather than a single intervention model. The
uniqueness of the individual programs was based on
variations in the communities, schools, agencies and
families participating in the demonstration, including linguistic and cultural diversity, resources
available, and the particular organizational features of participating schools, school districts, and
community agencies. Initial implementation was also influenced by program factors such as the
grantee organization, the number of school districts and schools participating in the program, the
philosophy underlying the program, and resource allocation decisions. Second, the process of
implementation was not static and preordained by
initial designs. Implementation was, instead, a
progressive, dynamic (developmental) process
through which program features were conceptualized,
designed, implemented, revised, and reshaped as the program evolved over the six years of planning
and implementation. Specific features as well as the process itself were shaped by external factors -
state and local initiatives, supportive leadership at the state level, continuity in leadership (program
directors, school principals, district superintendents) -- and by the successes and challenges
experienced within the program itself. Often successful activities were continued and expanded,
while less successful activities were analyzed and modified.
Challenges were viewed as inherent in the developmental process. Generally, challenges
were related to characteristics in four general areas: (1) this demonstration initiative (e.g., creating
Part 2 - Page iii

viable governing boards and dealing with the requirements of the evaluation); (2) the local
community in which the program was implemented (e.g., dealing with diversity and mobility,
creating community networks, and removing barriers to access); (3) the program design chosen by
the site (e.g., staffing, developing effective partnerships, maintaining communication, and
documenting program implementation); and (4) the participating systems and individuals (e.g.,
creating of family-friendly environments, reconciliation of policies across organizations,
implementation of developmentally appropriate practices).
Information from key informants, site visitors, and data gathered to describe the characteristics
of sites indicates that several key factors supported the successful implementation of the Transition
Demonstration Programs at the local level. The key factors that did influence the success of
implementation included: (1) careful planning before and during implementation; (2) involvement
of all key participants in the design and implementation of program components; (3) a recognition
and acceptance of the role that time plays in implementation and a patience with the processes of
consensus building and change; (4) individualization of program activities to meet the needs of
diverse participants, along with a fundamental acceptance of the differences in the readiness of
participants to change; (5) flexibility and willingness to adapt to changes in the environment, the
participants, or the organizations involved in the program; (6) ongoing formative evaluation designed
to provide timely feedback about the program’s progress toward goals, with feedback used to modify
and strengthen the program; and (7) strong, consistent, leadership in the Transition Program and in
the participating schools and Head Start. In these collaborative endeavors, the ability of program
leaders to build consensus, create a shared vision and communicate that vision to others, and
communicate effectively with a wide variety of people and systems have been key factors in building
successful programs. Factors that did not appear related to implementation levels were: the size of
the project (measured by the number of schools and school districts participating), grantee
designation (school or Head Start), and demographic characteristics of the children, families, or
communities.
An understanding of the fundamental diversity that was found within the communities, school
districts, schools, and families participating in the Transition Demonstration Program is essential
to a full understanding of the outcomes presented in Part 3. These communities, school districts,
Part 2 - Page iv

schools, and families are not representative of the nation or the Head Start population. The groups
o, however, reflect the immense diversity that is found
mong Head Start children and families in terms of their
ommunity contexts and life situations. A key finding was
at despite their shared eligibility characteristic of having
n income below the federal poverty level at the time of
nrollment and therefore being eligible for Head Start
ervices, this was not a homogeneous group.
sing cluster analysis techniques, seven distinctive family
pes were reliably identified. These family types are
beled by their most salient characteristics, even though not
d
a
c
th
a
e
s
U
ty
la
every family within each type has all of these features. These family types are:
• The Most Resourceful families, based on their income (on average, above the poverty
level), full-time employment of the child’s primary caregiver, higher levels of caregiver
education, and increased father involvement in the child’s routine care. The group
accounted for the largest single group of former Head Start families -- representing 42%
of the sample.
• Single parent, welfare families were distinguished by the majority receiving some form
of cash assistance (AFDC and/or SSI) and very low levels of father involvement. Nearly
one-third of the families fit this group, which had the lowest levels of parent education
and family income.
• Foreign language families all spoke a language other than English as their primary
language at home and most (91%) have foreign-born caregivers: They represented 11%
of the sample, and had high father involvement and intermediate levels of family income.
• Highly mobile families were those distinguished by changing residences two or more
times in the year prior to kindergarten. They comprised 6% of the families;
• Recently homeless families had all been homeless for at least some time in the 12
months before their child entered kindergarten. In this sample, 3% of the families fit this
definition;
Part 2 - Page v

• Mother-absent families had the distinguishing feature that the mother was not part of
the regular care of her child and did not live with her child. In this study, 5% of the
children lived in mother-absent families and typically were cared for by an older female
relative.
• Chronic health problem families included families in which the primary caregiver had
a chronic health problem that interfered with the daily care of the child. Among these
former Head Start families, 3% were affected by major health conditions.
Part 2 - Page vi
CHAPTER 3 – CONTEXT OF PROGRAM IMPLEMENTATION:DIVERSITY AMONG FAMILIES, SCHOOLS, AND COMMUNITIES
As we describe in some detail in the chapters that follow, the Transition Demonstration Project
was not a single program enacted in 31 separate locations. Rather, it was 31 separate programs, each
designed to address the unique characteristics and needs of
the community, schools, agencies, and families participating
in the program while also meeting the broad program
guidelines set forth by ACYF. As noted earlier, this feature
which encouraged local adaptation and control was planned
by ACYF. In addition, the selection criteria for the
Transition Demonstration Program grantees indicated that
no two programs would be awarded in a single state until all
states with applicants had at least one grantee. This ensured
that programs would be distributed across the United States.
The resulting diversity among the grantees, and participating
In this chapter:
Diversity among:
Communities & School
Districts
Schools & Classrooms
Former Head Start Families
Family Types
Strengths & Challenges
Impact of Diversity on Program
Implementation
families, schools, school districts, and communities was substantial. This diversity is important to
understand because it influenced both the plans for local programs as well as implementation at the
local level.
DIVERSITY AMONG COMMUNITIES AND SCHOOL DISTRICTS
As described in some detail in previous reports (see Head Start Children’s Entry into Public
School: An Interim Report on the National Head Start-Public School Early Childhood Transition
Demonstration Study, 1996 ), the 31 participating communities were very different in terms of their
economic, political, and historical climates and in the strength of previous collaborative relationships
between Head Start and public schools. To add additional evidence of the diversity across sites,
Table 3 summarizes populations characteristics for the 53 participating counties and their school
districts (data available for 81 of the 85 school districts). It can be readily seen that the communities
within which the Transition Demonstration Programs were implemented were quite different,
Chapter 3 - Page 20

compared to each other and compared to national averages.
Table 3. Characteristics of schools, compared to school districts and counties participating in the Transition Demonstration Project
National
Average in Participating
School Districts
Demonstration Schools
Comparison Schools
Mean Min. Max. Mean Min. Max.
Percent non-white (minority)
32.0 14.4 41.6 0.0 100.0 42.2 0.0 100.0
Percent of households in which a language other than English is spoken
16.0 -- 13.0 0.0 59.1 11.5 0.9 49.9
Percentage of children who speak English “not well” or “not at all”
2.0 1.2 2.0 0.0 14.1 1.9 0.0 14.0
Percentage of households deemed “linguistically isolated”
3.0 -- 2.6 0.0 19.7 2.2 0.0 13.0
Percentage of adults with less than high school diploma
24.0 27.0 27.5 3.7 59.8 27.7 6.8 66.1
Percentage of adults with college degree
19.0 19.1 19.0 2.4 70.5 16.9 0.0 66.1
School enrollment (number of students)
– -- 468 112 965 460 94 1102
Sources: School District Analysis Book, 1990 Census (National Center for Education Statistics); Common Core Data, 1991-92 (National Center for Education Statistics)
Key observations include:
* Cultural and linguistic diversity. Taken together, the communities of the Transition
Demonstration Project were more homogeneous and less ethnically and culturally diverse than the
nation as a whole. They typically included lower percentages of minority or ESL children and had
lower percentages of households in which a language other than English was spoken. There was,
Chapter 3 - Page 21

however, substantial variability among the participating communities. For example, the percentage
of minority students in the 81 school districts ranged from nearly zero to nearly 100 percent, and the
percentage of foreign language households ranged from less than one percent to more than 40
percent.
* Financial and economic circumstances. Economically, the Transition communities and
school districts appear to be very similar to national averages. For example, the average percentage
of children in poverty (20%) was not substantially different from the national percentage (22%).
There was, however, substantial variation across sites. For example, the median income for
households with children ranged from $15,603 (nearly half of the national median) to $89,649 (more
than two and a half times the national figure).
* Educational attainment. While the average percentage of adults with less than a high school
diploma appeared close to national averages, percentages across sites ranged from 5 percent to 55
percent.
There was also important variation among the participating school districts in their organizational
and financial characteristics, as shown below in Table 4. Participating school districts ranged in size
from some of the smallest (less than 200 students) to some of the largest (nearly a million students).
Annual per-pupil school district expenditures ranged widely (from $2,900 to $8,500 per student) as
did the percentage of district revenues from federal sources.
Table 4. Organizational and financial characteristics of participating school districts
School District (n=81)
Mean Minimum Maximum
Enrollment 27,040 197 890,612
National size ranking 3,827 1 12,578
Teacher-pupil ratio 16.8 11.2 21.2
Per pupil expenditures $4,587 $2,863 $8,507
Percent of district revenues from federal 7.5 0.6 28.5
Percent of district revenues from local 41.9 12.9 89.6
Chapter 3 - Page 22

DIVERSITY AMONG SCHOOLS AND CLASSROOMS
The Transition Demonstration Project was implemented in a total of 453 schools (219
demonstration and 234 comparison schools) and more than 5600 classrooms over the six years of
implementation. As might be expected, these schools and classrooms mirrored the diversity of their
communities, their school districts, and their student populations in many ways (see Table 3 above).
Overall, the profiles of the individual schools were similar to those of their counties and school
districts in the areas of linguistic diversity, educational attainment, and enrollment. However, there
is much variation across schools (as there was among school districts and counties) in the study. One
notable difference between schools in the Transition Demonstration Project and their local school
district as a whole was that they served much larger percentages of minority students. Specifically,
the average percentage of minorities within the participating school districts was 14 percent, while
the average percentage among participating schools was 42 percent (the actual values ranged from
zero to 100%).
Schools also varied greatly in terms of the percentage of students eligible for free or reduced-
price meal programs. Principals reported that, on average, half of their student populations were
eligible for free or reduced-price meals. Percentages within individual schools ranged from nearly
zero to 100 percent1. Similarly, the proportion of students eligible for Chapter 1 programs was
reported to be between zero and 100 percent, with the average being 30 percent of students eligible
and 23 percent of students receiving services from Chapter 1 programs. These proportions are not
unexpected, since not all eligible schools participate in the Chapter 1 program and some schools are
designated as school-wide programs, meaning, in effect, that all students are eligible for and may
receive services through the program.
The 5,629 classrooms participating in the Transition Demonstration Project included those in
both demonstration or comparison schools participating in the program. Over the six years of
implementation, a total of 1573 kindergarten, 1583 first grade, 1072 second grade, 1121 third grade,
1Of the nine schools which reported no students eligible for meal programs, six were located in a single site. Where the Transition Demonstration Project was implemented in locations across the state, locations were chosen for their diversity rather than their poverty status. The one school that reported 100 percent eligibility for meal programs was located in a school district that established an entirely new Transition Demonstration Project school, serving only former Head Start children.
Chapter 3 - Page 23

and 280 other classrooms participated in the project. The majority of “other” classrooms were multi
grade classrooms, although a few were self-contained special education classrooms.
Classrooms ranged in size from 4 to 5 students (in special education self-contained classrooms)
to 50 or more students (in team-teaching classrooms with multiple teachers). The average class size
was 20 students.
DIVERSITY AMONG FORMER HEAD START FAMILIES
Families are eligible for Head Start based solely on income below the federal poverty line at the
time of enrollment, unless the child has a disability. (Note: the majority of Head Start children with
disabilities also come from families with poverty level incomes.) Within poverty, however, there
is wide variation in family structure, life circumstances, and family strengths and risks (cf. Huston,
1992; C. Ramey, Ramey, & Lanzi, 1998).
Family types. A series of special analyses was completed to adequately represent the diversity
among former Head Start families as the children enter kindergarten. Fifteen family characteristics2
were chosen, representing a combination of risk conditions and life challenges, as well as factors that
previously have been associated with non-optimal school outcomes for children. Cluster analytic
techniques that were applied to data from the kindergarten year were used to determine whether
distinctive groups of families could be identified reliably (see Technical Report 2 for more
information on specific methodology). The results of the cluster analyses reveal that, within this
National Transition Demonstration Study, there are remarkably clear major distinctions within the
low-income families that Head Start serves. A clear identification of seven major family types
emerged (see Table 5 below). A brief characterization of the seven family types follows. (Note: all
major ethnic/cultural groups are represented in all types of families.) The family types can be
depicted as:
2The fifteen variables included: family receiving AFDC; family receiving SSI; primary caregiver employed full-time; percent of poverty; caregiver has high school diploma or GED; caregiver age when child entered school; caregiver has positive depression screen; caregiver has chronic health condition that interferes with parenting duties; father active in child’s life; mother absent from child’s life; number of children in home; primary caregiver born outside United States; family speaks language other than English in the home as primary language; family moved two or more times in year prior to kindergarten entry; family was homeless at some time in year prior to kindergarten.
Chapter 3 - Page 24

“Resourceful families.” The largest group of the
former Head Start families (42%) may be described as
“resourceful” in terms of income, employment, caregiver
education, and father involvement. These families have
average incomes just above the poverty line (105% of
poverty) one year after being in Head Start. About half of
the primary caregivers (48%) are employed full-time and
the majority (79%) have at least finished high school. In
two-thirds of the families, the fathers live with the child
or are reported to assume regular parenting responsibilities. These families also are not challenged
by homelessness, frequent moves, or major parental illness.
Diversity Among Families
Seven major types of families
Resourceful (42%)Single Parent Welfare (30%)Foreign Language (11%) Highly Mobile (6%)Recently Homeless (3%)Mother Absent (5%)Chronically Ill Caregiver (3%)
Site variation in preponderance of
family type
“Single parent families receiving cash assistance.” This group represents nearly one-third
(30%) of the participating families. Their distinguishing characteristics are that most receive some
form of cash assistance: either AFDC (85%) and/or SSI (27%). In addition, the majority (64%) are
single parents (primarily single mothers) heading the household. Typically, fathers are not present
or active in their children’s lives (68%). Only a small percent are employed full-time (12%).
“Foreign language families.” These families speak a language other than English as their
primary language at home. Most parents (91%) were born outside the United States. More than
three fourths (77%) of the families have a father active in the child’s life and two parents at home.
Self-report of parent education was lowest in this group (42% finished high school), although
differences in education across countries make accurate assessment difficult. These families
represent about a tenth (11%) of the participants in the National Transition Demonstration Study.
These families are similar to the Resourceful families in parent age, family size, residential stability,
and parental health.
“Highly mobile families.” This family type is distinguished by families having changed
residences at least twice in the past year. Their average income is quite low, with mean incomes at
77 percent of the poverty level. About half (49%) receive AFDC, and 14 percent receive SSI.
Chapter 3 - Page 25

Tab
le 5
. F
amily
typ
es a
nd k
ey c
hara
cter
isti
cs
VA
RIA
BL
ES
USE
D I
N C
LU
STE
R
AN
AL
YSI
S
Tot
al
Sam
ple
FAM
ILY
TY
PE
Res
ourc
eful
Si
ngle
Par
ent
Wel
fare
Fo
reig
n L
angu
age
Hig
hly
Mob
ile
Abs
ent
Mot
her
Chr
onic
H
ealth
Pr
oble
m
Rec
ently
H
omel
ess
n=25
84
42%
n=18
40
30%
n=65
6
11%
n=33
6
6%
n=28
0
5%
n=19
8
3%
n=19
7
3%
Rec
eive
s A
FDC
38
%
4%
85%
21
%
49%
40
%
50%
59
%
Rec
eive
s SS
I 12
% 0
.9%
27
%
5%
14%
21
%
27%
13
%
Prim
ary
Car
egiv
er E
mpl
oyed
Ful
l-T
ime
32%
48
%
12%
37
%
31%
40
%
15%
19
%
Perc
ent o
f Po
vert
y (F
amily
Inc
ome)
M
= 79
.4
M=1
05.1
M
=49.
7 M
=76.
6 M
=70.
5 M
=93.
1 M
= 67
.7
M=5
0.5
Prim
ary
Car
egiv
er F
inis
hed
Hig
h Sc
hool
67
%
79%
64
% 4
2%
68%
63
%
63%
59
%
Prim
ary
Car
egiv
er A
ge (
Whe
n C
hild
Ent
ered
) M
=31.
2 M
=31.
05
M=2
9.3
M=3
2.0
M=2
8.1
M=
43.1
M
=34.
3 M
=29.
8
Prim
ary
Car
egiv
er w
ith D
epre
ssiv
e Si
gns
43%
37
%
48%
40
%
53%
36
%
62%
67
%
Prim
ary
Car
egiv
er h
as a
Chr
onic
Hea
lth P
robl
em
4%
0%
0%
0%
0%
0%
100%
5%
Fath
er A
ctiv
e in
Chi
ld’s
Lif
e 52
%
64%
32%
77
%
43%
38
%
51%
41
%
Mot
her
Abs
ent f
rom
Chi
ld’s
Lif
e 5%
0%
0%
0%
0%
100
%
8%
4%
Num
ber
of C
hild
ren
in F
amily
M
=2.9
M
=2.6
M
=3.0
M
=2.9
M
=2.8
M
=3.0
M
=2.7
M
=3.1
Pare
nt(s
) B
orn
Out
side
the
Uni
ted
Stat
es
17%
6%
0.
9%
91%
11
%
6%
14%
12
%
Lan
guag
e ot
her
than
Eng
lish
Spok
en in
Hom
e 14
%
0%
0%
100%
8%
4%
9%
9%
Fam
ily M
oved
2 o
r M
ore
Tim
es in
Las
t Yea
r 8%
0%
0%
0%
10
0%
6%
6%
43%
Hom
eles
s in
Pas
t 12
Mon
ths
3%
0%
0%
0%
0%
0%
0%
100%

Over half (53%) of the primary caregivers screened positive for depression. Less than half (40%)
of the families have fathers who are active in the child’s life.
“Recently homeless families.” This family type represents only three percent of the study
sample. All of these families were homeless at least some time in the past 12 months. This family
type represents the lowest income family type with the mean percent of poverty at 50 percent. AFDC
is received by 59 percent of these families, and 13 percent receive SSI. Only 19 percent of the
families are employed full-time. Nine percent of the families do not speak English as their first
language at home.
“Mother absent families.” This family type represents five percent of the study families. The
distinguishing features of this family type are that the mother is absent from the child’s life in all of
these families and the primary caregiver is older -- by an average of 9 to 15 years -- than the primary
caregivers in other families. Interestingly, 45 percent of the caregivers in this group were
grandmothers, 22 percent fathers, 11 percent foster parents, 9 percent stepparents, and 9 percent
“other relative.” Thirty-eight percent of the fathers were reported to be active in the child’s life.
None of the caregivers reported a chronic health problem or being homeless in the past year.
“Chronic health problem families.” This family type represents only three percent of the study
sample. In all of these families, the primary caregiver has a chronic major health problem sufficient
to interfere with regular parenting responsibilities. Only 15 percent of these families were employed
full-time. On average, these families were at 67 percent poverty, with 50 percent receiving AFDC
and 27 percent receiving SSI. Two-thirds of the primary caregivers screened positive for depression.
This family type represents the second oldest group, with the average caregiver age of 34 years.
Family strengths and challenges. Taking a somewhat different look at the diversity among
former Head Start families, we investigated the challenges and strengths reported by participating
families. Two indices were created, one reflecting the self-reported strengths of families and the
second capturing circumstances that are likely to pose a risk to families. The Family Strengths
Index was created based on six characteristics judged to be positive for child outcomes, including:
primary caregiver has college degree or higher; both mother and father are active as parents (defined
as either living in the home or being active in helping with regular parenting duties); income is
greater than or equal to 150% of poverty; family perceives living in the neighborhood as positive for
Chapter 3 - Page 27
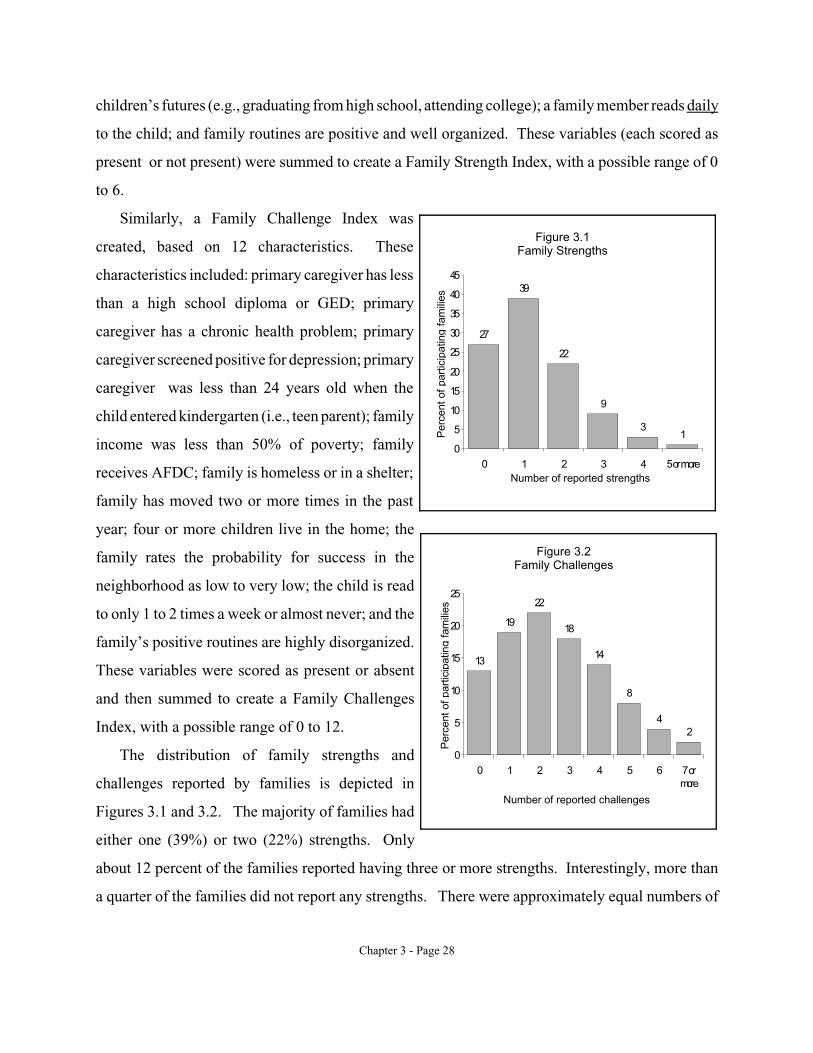
children’s futures (e.g., graduating from high school, attending college); a family member reads daily
to the child; and family routines are positive and well organized. These variables (each scored as
present or not present) were summed to create a Family Strength Index, with a possible range of 0
to 6.
Similarly, a Family Challenge Index was
created, based on 12 characteristics. These
characteristics included: primary caregiver has less
than a high school diploma or GED; primary
caregiver has a chronic health problem; primary
caregiver screened positive for depression; primary
caregiver was less than 24 years old when the
child entered kindergarten (i.e., teen parent); family
income was less than 50% of poverty; family
receives AFDC; family is homeless or in a shelter;
family has moved two or more times in the past
27
39
22
9
3 1
0
5
10
15
20
25
30
35
40
45
0 1 2 3 4 5 ormore
Per
cent
of p
artic
ipat
ing
fam
ilies
Figure 3.1 Family Strengths
Number of reported strengths
year; four or more children live in the home; the
family rates the probability for success in the
neighborhood as low to very low; the child is read
to only 1 to 2 times a week or almost never; and the
family’s positive routines are highly disorganized.
These variables were scored as present or absent
and then summed to create a Family Challenges
Index, with a possible range of 0 to 12.
The distribution of family strengths and
challenges reported by families is depicted in
Figures 3.1 and 3.2. The majority of families had
13
19
22
18
14
8
4 2
0
5
10
15
20
25
0 1 2 3 4 5 6 7 or more
Per
cent
of p
artic
ipat
ing
fam
ilies
Figure 3.2 Family Challenges
Number of reported challenges
either one (39%) or two (22%) strengths. Only
about 12 percent of the families reported having three or more strengths. Interestingly, more than
a quarter of the families did not report any strengths. There were approximately equal numbers of
Chapter 3 - Page 28

families who reported one challenge (19%), two challenges (22%), and three challenges (18%).
Somewhat fewer, but still a fair number of families, reported four challenges (14%) or five or more
challenges (14%). Interestingly, more than one out of ten former Head Start families (13%) reported
that they did not have any of these challenges3.
Looking across the sites, all of our identified family types -- except the Foreign Language
families -- were evident in each of the 31 sites. There was marked variation, however, in the
distribution of family types in these sites. Figure 4 (next page) illustrates five different sites and the
proportion of seven family types they served. There were also some interesting patterns in the
relationships between family type and the number of strengths and challenges reported by families.
As shown in Table 6 below, Resourceful and Foreign Language families tended to report many more
strengths and fewer challenges, while the Single Parent Welfare and the Recently Homeless Families
reported the opposite -- experiencing many challenges with few strengths. An unanticipated finding
was that the Mother Absent families reported the fewest strengths and also the fewest challenges,
whereas Chronically Ill families reported a high number of challenges but also had many strengths.
Table 6. Patterns of family strengths and challenges by family type
Strengths Challenges
Few (0 to 1)
Many (3 or more)
Few (0 to 1)
Many (5 or more)
Mother Absent
Single Parent Welfare
Recent Homeless
(79%)
(77%)
(75%)
Resourceful
Foreign Language
Chronically Ill
(22%)
(19%)
(12%)
Resourceful
Foreign Language
Absent Mother
(54%)
(31%)
(32%)
Recently Homeless (58%)
Chronically Ill (35%)
Highly Mobile (28%)
Single Parent Welfare (21%)
IMPACT OF DIVERSITY ON PROGRAM IMPLEMENTATION
It was predicted that the differences seen among communities, schools, and families would
create substantial differences in the programs designed and implemented in the 31 sites. In fact, as
discussed in more detail in the chapters that follow, there was substantial variation in program design
and implementation (see Chapter 4). It appears that an important amount of this diversity in
implementation can be attributed to differences in the communities, school districts, schools, and
3It is important to note that there are some important aspects of family life that are known to affect children about which we did not have information. Factors such as the presence of a special mentor or special person who is actively engaged in a child’s life, substance abuse, domestic violence, child abuse and neglect, parental intellectual disability, and incarceration, among others, were not always known.
Chapter 3 - Page 29

families participating in the local Transition Demonstration programs (see Chapter 6).
Figure 3.3. Examples of profiles of family types within sites
Family types --Site A (n =227)
Recently Homeless
Chronic Health Problem
Mother Absent
Highly Mobile
Foreign Language
Single Parent Welfare
Resourceful 32%
48%
2%
4%
6%
6%
3%
0% 10% 20% 30% 40% 50% 60%
Family types --Site C (n =236)
RecentlyHomeless
ChronicHealthProblem
AbsentMother
HighlyMobile
Foreign Language
Single Parent Welfare
Resourceful
3%
3%
5%
7%
0%
14%
69%
0% 10% 20% 30% 40% 50% 60% 70% 80%
Familytypes --Site E (n =157)
Recently Homeless
Chronic Health Problem
AbsentMother
HighlyMobile
Foreign Language
Single Parent Welfare
Resourceful
0%
13%
4%
6%
10%
3%
31%
34%
10% 20% 30% 40%
Familytypes -- Site B (n = 187)
RecentlyHomeless
Chronic HealthProblem
AbsentMother
HighlyMobile
Foreign Language
Single Parent Welfare
Resourceful
2%
4%
5%
6%
0%
32%
51%
0% 10% 20% 30% 40% 50% 60%
Family types --Site D (n =241)
Recently Homeless
Chronic Health Problem
AbsentMother
HighlyMobile
Foreign Language
Single ParentWelfare
Resourceful
2%
5%
3%
2%
43%
12%
34%
0% 10% 20% 30% 40% 50%
Chapter 3 - Page 30

SUMMARY FINDINGS
Although the National Transition Study is not exactly representative of either the national
elementary school population or Head Start families, tremendous diversity in all characteristics of
the schools, school districts, and families existed. Further, an important finding confirmed
tremendous variation in former Head Start families in terms of their most salient demographic
characteristics. Distinctive types of Head Start families differed in their relative family strengths and
their challenges and risks. Documentation of this tremendous diversity in families served by Head
Start has helped to guide subsequent data analyses about the impact of transition supports on
children’s academic and social development as well as parent involvement in their children’s
education.
Chapter 3 - Page 31

CHAPTER 4 - IMPLEMENTATION
In this chapter:
• Philosophy
• Role of Family Service Workers
• Family Involvement
• Education
• Supportive Social Services
• Health and Nutrition
The implementation of the Transition Demonstration Program in each local site was a complex
endeavor involving the simultaneous implementation of four major components: supportive social
services, family involvement, health and nutrition, and
educational enhancements. This chapter builds upon
previous discussions of implementation (see Head Start
Children’s Entry into Public School: Interim Report on the
National Head Start/Public School Early Childhood
Transition Demonstration Study). The underlying
philosophical bases for the local implementations are
addressed first, followed by a discussion of the vital role
played by family service workers in the implementation of the Transition Demonstration Program.
The chapter describes implementation of the four components -- family involvement, education,
supportive social services, and health and nutrition. Each discussion begins with a brief review of
the philosophical and pragmatic aspects of service delivery in the component, such as the expansion
of definitions and roles, predominant service delivery models, and staffing patterns used to address
the implementation. In addition, the following specific topics are addressed for each component:
Family Involvement – parent resource rooms; parent participation in planning; educational
involvement in the home; parent participation in classrooms; and barrier reduction.
Education – transition meetings; Individualized Transition Plans; transfer of written records;
and developmentally appropriate curriculum and teaching practices.
Supportive Social Services – types of services provided for children and families; utilization
of home visits; and barrier reduction.
Health & Nutrition – screening programs; health services; and health information and
education.
Finally, the extent to which Transition-like supports were offered in comparison schools is discussed.
Chapter 4 - Page 32

PHILOSOPHY
The Transition Demonstration Programs endorsed a philosophy that builds on the existing
strengths in families, children, schools, teachers, and communities and then sought to provide
supports in areas of identified needs. Various approaches have affirmed this strengths-based
orientation. The “family services team” in several sites, for example, used a family assessment tool
that identifies areas of strength in family functioning, rather than relying on a more traditional needs
assessment that focuses on problems only. Other sites used an approach known as “family resource
mapping” to highlight family strengths and identify areas where additional resources might be
needed. The use of a strengths model, rather than a deficit model which has dominated much of the
intervention with poverty families, was widely evident. In the efforts to strengthen the use of
developmentally appropriate educational practices in classrooms, sites encouraged teachers to
identify and build on the strengths of each child in the classroom, as well as to develop and expand
their own repertoire of teaching skills. In the area of parent and family involvement, Transition
Program staff worked with school personnel to identify and nurture the talents of parents as primary
teachers for their children, as caregivers, as learning assistants for others (children and adults), and
as decision makers. In the health component, there was a strong emphasis on wellness, nutrition,
and preventing illness and injury. Programs assisted families in establishing a source for primary
health care, learning more about how to prevent problems, and becoming more proactive in their
family’s health and health care management.
Sites also strongly endorsed an individualized approach to working with families, children, and
teachers. The supportive social services for families were based on individual family service plans
and often were implemented through personalized contacts and home visits. The same was true of
the health and nutrition component, which was tied to supportive social services. In the area of
parent and family involvement, many of the successes reported related to individualized efforts to
remove barriers and facilitate program participation. In working with teachers to implement the
education component, many sites began with a general, large group approach to training and
consultation. By the end of the five years of implementation, however, the majority of sites adopted
a more individualized approach, offering teachers a variety of choices for further professional
development, based on their interests or most pressing needs. In the site located in Arkansas, for
Chapter 4 - Page 33

example, the program worked with teachers to complete self-assessments of their skills and then
encouraged them to develop professional growth goals. A number of sites provided personalized
assistance to teachers in the form of educational consultants or mentors, who then worked
individually with teachers. Thus, the philosophical hallmarks of the Transition Demonstration
Project incorporated those of good teaching itself, namely, building on strengths and individualizing
instruction and supports.
ROLE OF FAMILY SERVICE WORKERS
A unique aspect of the Transition Demonstration was the assignment of family service workers
to schools. At most sites, the family service workers were pivotal to the implementation of the
program, particularly the social services component. Family service workers were central to efforts
to help families access existing public and private community services, and to promote the well
being of individual family members (adults and children) as well as the family as a unit. They also
actively sought to strengthen communication between families and schools, help parents learn more
about child development and how to support their children’s learning, help school personnel become
more aware of family issues and the demands placed on children by their environments and cultures,
and recruit and encourage parents to participate in school and the Transition Program. Even though
many sites hired additional staff to address specific health needs of families or to coordinate family
involvement activities, the family service workers participated substantially in these efforts as well.
Much of this involvement was founded in the strong caring, trusting, and personal relationships
developed between the family service workers and the families they served.
Over the five years of implementation, family service workers became increasingly integrated
into the schools. Since family service workers were primarily housed in the school buildings, their
proximity to school personnel facilitated the development of collaborative relationships and frequent
communication between school and project personnel. Family service workers gained the respect
of teachers, principals, and other school personnel. They served as a resource for individual school
staff members and participated regularly on student assistance teams, multidisciplinary team
meetings, and other school-based support meetings. In addition to collaborating with counselors,
nurses, behavior specialists, and school social workers, they developed strong working relationships
Chapter 4 - Page 34

with a range of community service providers, and frequently served on community-based committees
charged with identifying needs and gaps in service delivery, developing cooperative programs, and
removing barriers to access for consumers. At the heart of their efforts, however, were the personal
contacts between the family service worker and the family and child. These personalized
interactions were consistently reported during site visits by parents, teachers, principals, and project
directors to have been the key element in the success of the Transition Demonstration Programs in
delivering high quality, individualized supports to families and children and in engaging families in
home-school partnerships.
FAMILY INVOLVEMENT
Increasing parental involvement in their children’s education was a focus for each of the 31 local
Transition Demonstration Programs. This component served as the primary focal point for several
local implementations and held a key position in the implementation of all other sites. Family
service workers were instrumental in providing linkages between families and schools and
encouraging family participation in program activities.
Approaches
The traditional definition of parent involvement in schools often emphasized participation in
school-based activities, such as attending parent-teacher conferences, attending PTA or PTO
meetings and other school events, helping to raise money for school improvement projects, assisting
with field trips, and volunteering at the school. Increasingly, however, schools and families are
shifting this definition of parent involvement to include a broader range of activities (Epstein, 1995).
The broader definition of parent involvement in education endorsed by most of the 31 Transition
Demonstration Programs included an expanded role for parent volunteers within schools, involving
them in more direct student assistance and organization of the overall volunteer effort in the school.
In addition, parent involvement also endorsed home-based activities that support children’s learning
and positive school adjustment.
Further, sites endorsed a philosophy of family involvement that included parents,
grandparents, siblings, and other caregivers and significant adults in school involvement and home-
Chapter 4 - Page 35

based learning activities.
Some sites initiated programs
targeted at specific caregivers,
(for example, fathers or
grandparents), while other
sites focused on bringing
extended family members into
the school and into active
participation.
Expanded role for parents:
In the classroom:
Working with individual students
Assisting with small group instructional activities
In the school:
Assisting in tutoring programs
Assisting in after-school programs (reading, recreational)
Assisting with large group activities (i.e., during meals or
on the playground)
Providing assistance in the library or the school office
Organizing parent volunteer programs
Spearheading school improvement activities
Participating in school governance
Visiting classrooms
Home-based activities:
Establishing daily study routines and a place to study
Providing stable family and home environment
Encouraging consistent school attendance
Modeling the importance of learning
Asking about the school day
Helping with homework
Providing other learning activities at home
Using the public library
Reading, listening, talking about books
Staying in touch with teachers
Writing letters and messages
SERVICE DELIVERY
Staffing. The staffing
related to the family
involvement component varied
across sites. Nearly three-
fourths of the sites relied on
the family service workers to
implement the family
involvement component.
Some sites, however, had a
designated Parent Involvement
Coordinator as part of the
Transition Demonstration
Program staff, and a few sites hired Parent Assistants to
support the family service workers and/or the activities
within the parent resource rooms.
Following the Head Start model of supporting family
growth and employment, over half of the sites chose to
support parents or family members, at least occasionally, as
Parent Resource Rooms
• Information
• Workshops & classes
• Lending libraries
• Computers & other equipment
• Support staff
Chapter 4 - Page 36

paid employees of the school or the Transition
Demonstration Program. Site visit interviews
indicated that some parents were paid (either hourly
or on salary) to provide assistance to teachers in
classrooms, to assist family service workers in
parent resource rooms, or to help school staff in
developing family involvement activities.
Alternative Approaches to Parent
Resource Rooms:
• Regional Centers – centrally located to
serve parents whose children attend a
cluster of schools
• District-wide Parent Resource Center –
centralizing student services, and
information for the school district Parent resource rooms. During the 1995-96
site visits, over one-third of the sites were noted to
sponsor parent resource rooms within schools. On the Program Implementation Profile, completed
in the winter of 1997, 83 percent of sites indicated that a parent/family area was available in most
or all of the schools, and 96 percent indicated that such space was available for parents in at least
some of the schools. Even though space is a premium commodity in many school buildings, sites
were able to secure classroom space (often in the last year of implementation) to develop parent
resource rooms.
Parent resource rooms were the location of a variety of parent-focused materials and activities,
including:
• informational brochures and pamphlets
• application forms for community agencies, social services, and supportive programs
• multi-cultural materials for families
• lending libraries for families (developmentally appropriate educational materials (games,
books, supplies, and activities)
• audiovisual materials for both adults and children
• ESL, adult basic education, and GED materials for adults
A few sites placed computers in the resource rooms for use by parents and children, and several
had audiovisual equipment (such as videocassette players and tape recorders) available for on-site
use or for check-out. Parents were encouraged to use the computers to assist children with
homework, develop personal computer skills, and complete job applications. In a number of sites,
the parent resource rooms were the sites of parent education workshops, ESL classes, and GED
Chapter 4 - Page 37

preparation classes supported by the Transition Demonstration Program. In a few sites, the parent
resource rooms also served as the offices for the family service workers.
Parent participation in planning. Efforts to involve parents in decision-making within the
schools gained strength over the years of the implementation. Over 90 percent of sites planned and
presented parent education and family-school activities based on surveys of parents that identified
their interests and needs. Approximately half of the sites indicated by their responses on the
Program Implementation Profile that family involvement activities were regularly planned and
implemented by the families themselves. In a number of sites, parents also participated on school
improvement teams, and it was noted by project directors and principals that these teams had grown
in substance and importance within the schools over the past five years. Over half of the site visit
reports in the final year indicated that Transition parents were highly involved in the parent-teacher
organizations within their schools, often holding leadership positions.
Educational involvement in the home. Transition Demonstration Programs assisted parents
in identifying home-based activities to support classroom instruction and each provided families
with ideas, materials, and/or tools to complete home-based instructional activities. Many sites
distributed newsletters that included ideas for home-based learning activities, and family service
workers universally supported parent efforts during home visits and other contacts. Project staff
shared information about child development and school readiness, ideas for home-based activities,
instructions for the completion of activities, and basic materials (crayons, paper, glue, etc.). They
also focused on helping parents communicate more effectively with teachers about educational
goals and activities.
Parents in classrooms. Families were brought into the schools in supporting roles
(traditionally spoken of as “volunteers”) in increasing numbers, within individual sites and
throughout the Transition Demonstration Project. Approximately 95 percent of the sites indicated
via the Program Implementation Profile that family members participated in the classroom as
observers or volunteers at least occasionally, and over 50 percent indicated that families were in the
classrooms on a regular basis. Parents recruited and coordinated parent volunteers for the school,
assisted teachers by completing clerical duties, assisted children by giving them one-to-one attention
and assistance in the classroom, and completed other tasks such as organizing and offering story
hours and reading clubs for students, making arrangements for field trips (in addition to serving as
Chapter 4 - Page 38

chaperones), and assisting in the office and cafeteria.
Barrier reduction. Sites made substantial efforts to reduce barriers to family involvement.
Strategies used to remove language and logistic barriers included:
• Provision of translation services • Changing school policies to open school buildings for meetings and events in the evenings
and on weekends • Creating telephone trees manned by parents to ensure awareness of and encourage
participation in events • Providing transportation using Head Start vans, school buses, vouchers for public
transportation • Establishing carpools for parents • Providing child care during meetings and school events
EDUCATION
As a component of the Transition Demonstration Project effort, the education component
proved for many sites to be one of the most challenging to implement. Grantees were required to
address four educational areas: (1) transition meetings to include the sending and receiving teachers
and the parents; (2) individualized Transition Plans for each child; (3) some transfer of written
information (records) about the child; and (4) the implementation of developmentally appropriate
curricula and teaching practices within the classrooms. Sites were very creative in devising
strategies to meet these requirements.
Transition Meetings. A clear goal of the education component was to have sending and
receiving teachers meet with the child’s parents to plan the child’s transition from one grade to the
next. Several barriers were encountered. First, class assignments were often not made by principals
until just before, or even just after, the opening of school in the fall. Thus, it was not possible to
know who the receiving teacher was so that a meeting about a specific child could occur. Second,
Head Start children entering public school for the first time often did not actually enroll in the
anticipated kindergarten because of a change in family residence during the summer or for other
reasons. Third, conflicting schedules or limited teacher availability often made it difficult for all
three parties to meet together.
Almost all sites were able to schedule meetings between the parent and either the sending or
receiving teacher. Even when no formal teacher-to-teacher meetings were scheduled, teachers
reported that there were informal contacts between sending and receiving teachers that facilitated
Chapter 4 - Page 39

the transition from grade to grade.
Individualized Transition Plans. Three-fourths of the sites indicated that they were able to
develop individualized transition plans for each child, addressing the transition between Head Start
and kindergarten. Sites tended to
view the plans as working documents
that set goals and identified strategies
and responsibilities. Only half of the
sites, however, completed similar
plans to transition children from grade
to grade within the elementary school.
Teachers in many sites reported
during site visits that informal
communications between teachers, the
cumulative records and work
portfolios, and teacher-parent
conferences held each spring and/or
fall served together to create a more
informal planning process without the attendant paperwork of a formal transition planning
document.
Transfer of Written Records. The large majority of sites were able to put into place
procedures for the transfer of records from Head Start to public schools and from grade to grade
within the public schools. In most sites, the transfer was accomplished with parental permission,
which was obtained routinely as part of the Head Start exit conference or the kindergarten
registration process. Nearly half of the sites reported that transferred records were specifically
sought and used by school personnel to plan classes, curriculum, and instruction.
Developmentally Appropriate Teaching Practices. One of the key program elements
specified by ACYF in the Request for Proposals (1991) was “a developmentally appropriate
curriculum” (p. 31822) defined as:
“a curriculum that is appropriate for the child’s age and all areas of the individual child’s development, including educational, physical, emotional, social, cognitive, and communication.” (p. 31819)
Chapter 4 - Page 40
Alternative Strategies for Transition Planning:
• Team meetings – teachers with family services workers,
discussing a group of children
• Liaison approach – family services worker meets with
teachers and parents separately, relaying information
and obtaining input from all parties
• Spring send-off meetings – parents and sending teachers
meet in spring, parents meet with receiving teacher in the
fall
• Paired meetings – sending teacher and parent, receiving
teacher and parent, teacher and family service worker,
parent and family service worker, sending and receiving
teachers – with ultimate coordination by parent and
family service worker

The concept of developmental appropriateness of classroom practices and curriculum is a
relatively new educational approach, endorsed by the National Association for the Education of
Young Children (NAEYC) and many leading early childhood educators. Generally,
developmentally appropriate practices (Bredekamp, 1986; Howes & Olenick, 1986; McCartney,
1984) are seen as including:
An integrated curriculum that provides for social and emotional as well as physical and
cognitive development
Promotion of learning through free play and interaction
Provision of opportunities for children to choose from a variety of learning materials and
activities
Organization of classroom environments and schedules in a child-focused manner
Individualization of instruction to match the developmental level of the child
Guidance of children’s learning by teachers, rather than didactic instruction
Integral to the concept of developmentally appropriate practices is the issue of continuity — of
learning environment, curriculum, teaching approaches and practices, and learning experiences
(Barbour & Seefeldt, 1993). The continuous nature of children’s growth and development, from
preschool through the elementary and secondary years, requires educational experiences that are
also continuous, coordinated, and that build one upon another (Barbour & Seefeldt, 1993). The
National Transition Demonstration Programs, in bringing together Head Start and elementary
school programs, sought to bring about the developmental continuity of curriculum, learning
environment, and teaching practices that would enhance the learning of children.
The implementation of developmentally appropriate practices was a particularly challenging
aspect of the Transition Demonstration Program’s effort for many sites. Most sites included
experienced teachers, some of whom viewed developmentally appropriate practices (DAP) as one
of the “teaching fads” that affect educational systems over time. Other teachers, both novice and
experienced, embraced the opportunity to expand their repertoire of teaching practices and
incorporate different strategies into their classrooms. Nearly all sites faced the challenge of meeting
the diverse needs of teachers who are distributed along a continuum of acceptance and
implementation of DAP.
Chapter 4 - Page 41

Staffing. Approximately 65 percent of the Transition
Demonstration Programs provided on-site, technical
assistance for elementary teachers in the form of a peer
coach, mentor, or education coordinator. These persons
were available on a regular and frequent basis to provide
specific and direct assistance to teachers and principals in
the form of materials, guidance, teaching demonstrations,
support and encouragement, problem-solving and strategy
building, and mentoring. Teachers reported that the
availability of an education coordinator or mentor to
provide one-on-one assistance and feedback was highly
valued and promoted their implementation of
developmentally appropriate educational practices. A few
sites provided teaching assistants for demonstration
classrooms, in an effort to reduce child-to-adult ratios in classrooms and provide additional support
for teachers.
Supports for Teachers
• Mentors & peer coaches
• Teaching assistants
• Books & articles
• Workshops & conferences
S Registration fees
S Expense reimbursement
S Release time & substitutes
• Classroom materials &
supplies
• Classroom equipment &
furniture
• Collaboration opportunities
S Reciprocal classroom visits
S Joint planning
Professional development. Virtually every site supported teachers in their efforts to develop
a greater understanding of the theory and practice of developmentally appropriate practices. This
support was provided in a variety of ways, including:
• professional articles, books, and other resources
• training provided directly by project personnel
• professional development workshops or conferences sponsored locally
• joint training for Head Start and elementary school teachers
• opportunities to attend state, regional, or national workshops or conferences
• funds for substitute teachers when training occurred and/or registration fees
All sites worked with local school districts and school administrators to identify potentially helpful
professional development opportunities, encourage teachers and principals to take advantage of
these opportunities, and facilitate teacher attendance by providing release time. In a number of
sites, teachers chose from an array of professional development activities, creating an individual
Chapter 4 - Page 42

plan (formal or informal) to meet their own unique needs. As diversity among teachers increased,
the smorgasbord strategy served to increase participation by and satisfaction among teachers.
Classroom materials. All of the sites provided at least some additional classroom materials
and supplies to classrooms participating in the Transition Demonstration Program, although the
specific method and extent of assistance varied by site. Some sites provided funds to the
demonstration schools to be used at the principals’ discretion and with some guidance from the
project. Other sites provided funds to each classroom and teacher, and teachers made purchasing
requests to the project. Still other Transition Programs chose and purchased materials for
distribution to the demonstration classrooms. Developmentally appropriate, anti-bias, and
multicultural materials were included in the purchases. Further, over 60 percent of the Transition
Demonstration Programs also purchased equipment and non-consumables, such as computers and
classroom furniture, for use in the elementary demonstration classrooms.
Collaboration among teachers. Sites provided many opportunities for teachers to collaborate
with one another. Collaboration opportunities, provided by more than 80 percent of sites, included
classroom observations, joint planning, curriculum development, and sharing of information,
strategies, and materials. Like the training opportunities, many of these were made possible by the
Transition Demonstration Programs, which provided substitutes or other staff to create release time.
Child assessment practices. School districts in many sites continued to use traditional report
cards as indicators of achievement and student progress, although some schools at almost every site
have investigated the utility and practicality of alternative assessment methods. Local Transition
Demonstration Programs (92%) provided training, technical support, and materials in the area of
developmentally appropriate child assessment. Over 80 percent of the sites reported that authentic
assessment procedures (e.g., use of portfolios of children’s products, narrative reports) were
implemented in the primary grades to at least some degree, and 54 percent indicated that those
procedures were used regularly in the schools in their Transition Demonstration Programs.
SUPPORTIVE SOCIAL SERVICES
In most sites, the provision of supportive social services for families was another highly valued
cornerstone of the program. Especially in an educational environment where the provision of social
services was not traditionally part of the school’s mission, the advent of the Transition
Chapter 4 - Page 43

Demonstration Project with its social services component
and family service workers was a unique experience for
many participating schools. At the end of the fifth year of
implementation, many principals and superintendents
participating in the local Transition Demonstration
Programs were aggressively seeking local, state, federal,
and non-profit foundation funding to maintain these social
services within the schools.
Alternative Approach:
Although most sites provided on-site
services, at least five sites located their
family service staff in places other
than school buildings. Four of those
sites were Head Start grantees that
had transition Demonstration Program
family service staff work in the Head
Start offices; the other family-based
program was a statewide project.Approaches to Service Delivery. The majority of
sites endorsed a two-generational approach to service
delivery, addressing the needs of both children and families. In most sites, the service delivery
systems were school-based — that is, family service workers, parent involvement specialists, and
health coordinators were located at the schools, reaching out to families and drawing them into the
school buildings. This model follows on the school-linked services models that have seen
increasing popularity in recent years (e.g., Larson, Gornby, Shiono, Lewit, & Behrman, 1992).
School-based services are considered practical because: (1) school is where children already go; (2)
frequent contacts between school personnel and families can facilitate the identification of and
response to needs; and (3) school buildings tend to be accessible within neighborhoods and can
serve as positive community centers (Levy & Shepardson, 1992).
A case management model was the primary approach to meeting the social service and health
needs of children and families in the large majority of sites. Whenever possible, Transition
Demonstration Programs tended to utilize existing services in the school or community rather than
provide the services (counseling, child care, etc.) directly. The extent to which this occurred
reflected: (1) the availability of service providers within the community able to meet the needs of
families; (2) the emphasis on helping families develop the ability to access services independently;
(3) the emphasis on building capacity (within families, within communities) that would continue
when funding for the Transition Demonstration Program ended; and (4) a specific decision to use
case management to extend the capacity of family service staff to meet the needs of greater numbers
of families.
Chapter 4 - Page 44

Service Delivery. The Transition Demonstration Programs offered a wide range of
comprehensive services to help families develop skills that could prevent difficulties and enhance
development as well as help families meet immediate, more
basic needs. In areas related to education, literacy, and Service Delivery Areas
• ESL, ABE, GED classes
• Life skills
• Parenting skills
• Adult & Family literacy
• Vocational assessment
• Interviewing & Job Skills
employment, sites reported that they regularly met needs in a
broad array of areas. Family service workers operated tutoring
programs for children, provided basic counseling for families,
led parenting education and family development workshops,
shared health promotion and nutrition information, and worked
with family members to develop interviewing and job skills.
They helped family members locate, enroll in, and complete
GED, vocational, English as Second Language (ESL), Adult Basic Education (ABE), and
community college or university courses.
All sites offered at least some education or employment
support services to families and all sites offered services
through all of the service delivery options (direct,
referral, partnerships).
As in the basic needs
Service Delivery Methods
• Direct services by program staff or
funds
• Referrals to other providers
• Partnership agreements with agencies Service Delivery
What:
• Food & Clothing
• Shelter
• Transportation
• Child Care
• Language assistance
• Legal services
• Immigration/citizenship
• Daily living skills
• Counseling
S Domestic violence
S Substance abuse
areas, education and
employment supports typically involved referrals to existing
community programs. Services most frequently provided directly
by the Transition Demonstration Programs included daily living
skills, life skills, and parenting skills. Anecdotal information
obtained during site visits indicated that these topics frequently
arose during home visits and were addressed by family service
workers in that forum. Assistance with increasing parenting skills
was frequently delivered through partnership agreements.
Family service workers helped families obtain safe and affordable
housing, clothing and food, financial assistance, and legal
assistance. There was, however, some substantial variation in the
Chapter 4 - Page 45

types of services provided. As noted above, basic needs of families were most often met using
referrals to community providers, although transportation and translation services tended to be
provided more directly by sites. Some sites, however, frequently and consistently met the basic
needs of families by a combination of direct services and referrals.
Home Visits. Home visits have long been a central feature of Head Start programs, enabling
program staff to reach and involve families who might otherwise have not participated. Following
on this successful tradition, home visits were required to be a part of the service delivery and
outreach program for each Transition Demonstration Program (ACYF, 1991). From the mandate,
home visiting evolved into a highly valued and productive activity in the work of the family service
workers, serving to help personalize the contacts and bridge the gap between families and the
school. Other contacts with families — such as school visits and conferences, school-sponsored
or program-sponsored events, and telephone contacts — increased in frequency and utility over
time, as family independence grew and as family service workers were drawn into school- and
community-based planning and coordination activities.
The frequency of home visits appeared to Frequency of Home Visits Influenced by:
• size of caseload – smaller caseloads of active,
high-need families allowed more hope visits per
family
• level of family need – families in crisis and with
many needs received more intensive attention
• specific program requirements – some programs
mandated a specific number of home visits per
family monthly, quarterly, or annually
be impacted by the diversity of activities in
which family service workers engaged. As
the five-year implementation progressed,
family service workers were more frequently
asked to serve on school-wide committees,
to serve as members of student intervention
teams, to serve on service planning and
integration committees within the
community, and to provide training for other agencies or providers seeking to adopt some portion
of the family service model implemented by the Transition
Demonstration Program. These activities were perceived as essential
to the effort to extend, coordinate, and institutionalize family support
services, but they reduced the amount of time available for direct
contact with families. Eighty percent of the sites indicated that school
personnel — teachers, principals, nurses, counselors, and school social
Barriers to access:
• Language
• Transportation
• Child care
• Scheduling
• Complex procedures
Chapter 4 - Page 46

workers — accompanied family service workers on home visits at least occasionally. Over 30
percent of the sites indicated that these joint home visits were frequent occurrences. In 60 percent
of the sites, family service workers made at least 2 home visits per year to each participating family.
Nearly 20 percent of the sites, however, indicated that they were not able to make 2 visits per family
per year.
Overcoming barriers to accessing services. Overcoming barriers to access was a significant
focus for the majority of sites. Transportation and language barriers were key areas of concern for
Transition Demonstration Program staff helping families access community services, although the
exact nature of the barrier varied with site locale.
In most cases, family service teams developed strategies that helped to overcome barriers for many
families. These strategies included:
• direct intervention of project staff — such as staff providing transportation for
appointments, accompanying families as translators, or providing child care during
appointments with doctors or community agencies
• utilization of project resources — such as projects providing taxi vouchers for families
or emergency funds to pay for dental or medical follow-up when other funds were not
available
• coordination and collaboration of project staff with community agencies — such as
creating on-site screening clinics, developing satellite clinics or offices in schools or
other neighborhood locations, providing translation services within community agencies
or by the school district, and utilizing Head Start vans or buses to provide transportation
for families
The choice of strategies for reducing or eliminating barriers depended on family resources,
community resources, and the philosophy and resources of the local project. Those sites with a
strong emphasis on family empowerment and independence and on capacity building within
schools, communities, and families tended to rely less on direct intervention or project resources
and more on coordination and collaboration with community services and supports.
Chapter 4 - Page 47

HEALTH/NUTRITION
Approaches
The health and nutrition component in most sites was tied to family support services, and in
some sites was indistinguishable from those efforts. All sites offered supports to families as they
sought medical and dental care, encouraged families
to seek needed mental health care and provided Support models for nursing services:
• Full funding for Transition nurses –
providing nursing services to
demonstration schools
• Supplemental funding for district or
health department nurses – increasing
nursing time in demonstration schools
information and services related to nutrition. In
addition, most sites placed some emphasis on
preventive care. In fact, in seven sites (nearly a
quarter of the total number), the emphasis on wellness
and prevention of disease and injury was noted in site
visit reports as a particular feature of the site’s health
component implementation.
Staffing. Staffing patterns utilized to address the implementation of the health component
varied across the 31 sites. Only a few sites chose to follow the Head Start model and designate
within the project staff a health coordinator to develop and coordinate activities. In the large
majority of sites (over 75%), the component was implemented by nurses, a more traditional
approach within schools. In a few sites, health assistants were available in demonstration schools,
and in at least four sites a mental health or behavioral specialist was supported by the Transition
Demonstration Program. In virtually every site, the family
service workers were pivotal to the provision of health
services.
Service Delivery
Screening programs. Screening clinics were among the
most common and most popular health services supported by
the Transition Demonstration Programs. Each of the 31 sites
offered vision, hearing, and mental health screening of some
type for children. All but one of the sites offered nutrition
screening, and all but one offered physical health screening
as well. Over two-thirds of the sites offered lead screening
Health Services
• Screening
S Vision & hearing
S Dental
S Physical/medical/nutritional
S Lead
S Mental health
• Intervention
S Medical, dental treatment
S Immunization
S Mental health treatment
Chapter 4 - Page 48
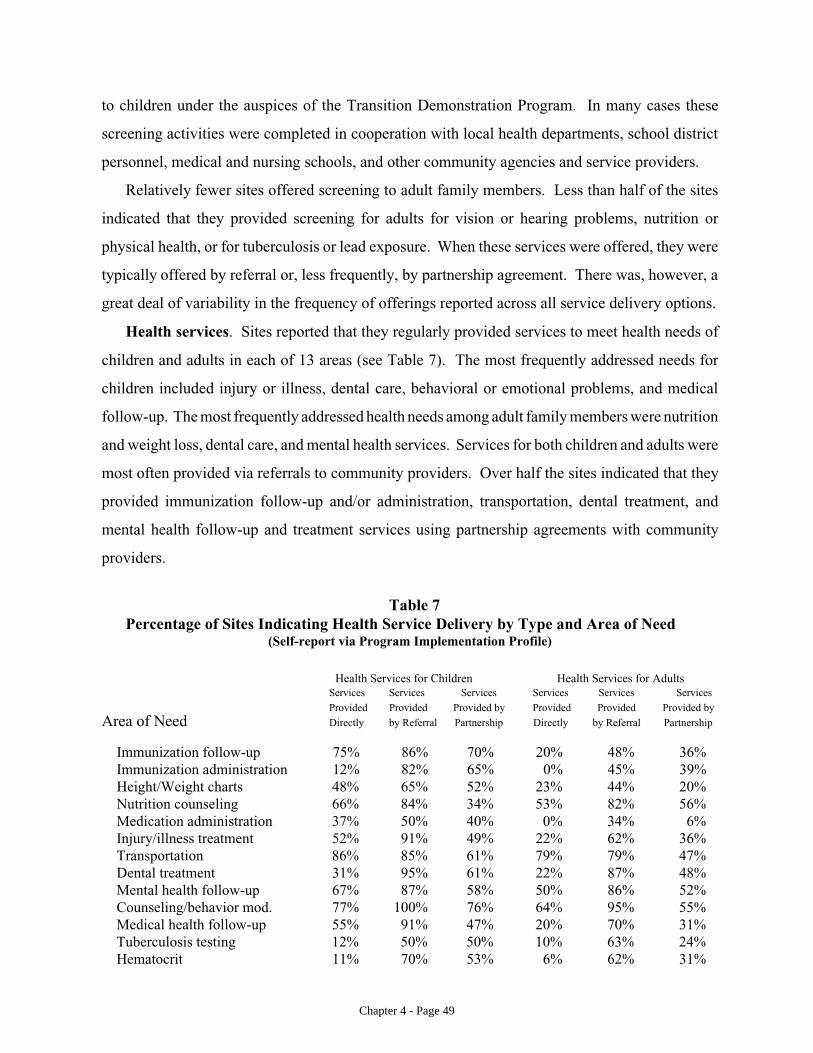
to children under the auspices of the Transition Demonstration Program. In many cases these
screening activities were completed in cooperation with local health departments, school district
personnel, medical and nursing schools, and other community agencies and service providers.
Relatively fewer sites offered screening to adult family members. Less than half of the sites
indicated that they provided screening for adults for vision or hearing problems, nutrition or
physical health, or for tuberculosis or lead exposure. When these services were offered, they were
typically offered by referral or, less frequently, by partnership agreement. There was, however, a
great deal of variability in the frequency of offerings reported across all service delivery options.
Health services. Sites reported that they regularly provided services to meet health needs of
children and adults in each of 13 areas (see Table 7). The most frequently addressed needs for
children included injury or illness, dental care, behavioral or emotional problems, and medical
follow-up. The most frequently addressed health needs among adult family members were nutrition
and weight loss, dental care, and mental health services. Services for both children and adults were
most often provided via referrals to community providers. Over half the sites indicated that they
provided immunization follow-up and/or administration, transportation, dental treatment, and
mental health follow-up and treatment services using partnership agreements with community
providers.
Table 7 Percentage of Sites Indicating Health Service Delivery by Type and Area of Need
(Self-report via Program Implementation Profile)
Health Services for Children Health Services for Adults Services Provided Directly
Services Provided by Referral
Services Provided by Partnership
Services Provided Directly
Services Provided
by Referral
Services Provided by Partnership Area of Need
Immunization follow-up 75% 86% 70% 20% 48% 36% Immunization administration 12% 82% 65% 0% 45% 39% Height/Weight charts 48% 65% 52% 23% 44% 20% Nutrition counseling 66% 84% 34% 53% 82% 56% Medication administration 37% 50% 40% 0% 34% 6% Injury/illness treatment 52% 91% 49% 22% 62% 36% Transportation 86% 85% 61% 79% 79% 47% Dental treatment 31% 95% 61% 22% 87% 48% Mental health follow-up 67% 87% 58% 50% 86% 52% Counseling/behavior mod. 77% 100% 76% 64% 95% 55% Medical health follow-up 55% 91% 47% 20% 70% 31% Tuberculosis testing 12% 50% 50% 10% 63% 24% Hematocrit 11% 70% 53% 6% 62% 31%
Chapter 4 - Page 49

Health information and education services. In the majority of sites, efforts were made to
provide health-related information to children, parents, school personnel, and others. Methods
used to deliver information included:
• a regular project newsletter
• personal contacts (home visits, telephone contacts)
• brochures and pamphlets in parent resource centers
• health fairs
• workshops for families and school personnel
Site responses on the Program Implementation Profile indicated that information and
education on health and safety, as well as nutrition, mental health and, substance abuse were
provided to children, families, and Transition staff on a regular basis by 50 percent or more of
the sites (see Table 8). Sites were less likely to provide similar information on a regular basis to
Head Start staff or school personnel (about a third of the sites). Ten sites (about a third)
indicated that they rarely, if ever, provided health information or education for Head Start staff
and eight sites (about a fourth) rarely, if ever, provided such information for school personnel.
Table 8 Percentage of Sites Providing Information and Education Services to Participant Groups
(Self-report via Program Implementation Profile)
Head Start Families
Transition staff
School staff Children Personnel
Health information 75% 83% 58% 83% 65% Health education 54% 54% 50% 67% 42% Nutrition information 67% 75% 54% 71% 46% Nutrition education 50% 54% 37% 58% 29% Mental health information 70% 75% 46% 75% 42% CPR, First Aid Substance abuse prevention Safety information Safety education
21% 70% 68% 57%
33% 65% 73% 50%
33% 35% 45% 43%
50% 61% 71% 52%
21% 43% 55% 39%
Chapter 4 - Page 50

TRANSITION-LIKE ACTIVITIES AND SUPPORTS IN COMPARISON SCHOOLS
The implementation of the 31 Transition Demonstration Programs occurred in environments
that are dynamic and subject to secular trends. Even though the schools participating in the
Transition Demonstration Programs were randomized either to receive the demonstration
services or to participate as comparison schools, there was early and ongoing evidence that
comparison schools often incorporated programs, activities, staffing patterns, teaching practices,
and other features consistent with those found in demonstration schools and actively promoted
by the Transition Demonstration Program. In some cases, comparison schools were the
recipients of professional development opportunities and Transition-like supports because of
school district policies that required equal access to opportunities by all schools. In other cases,
the schools that were randomly selected to be comparison schools had already begun to
incorporate Transition-like activities and simply continued on their charted course without
additional encouragement or assistance from the Transition Demonstration Program. In a few
cases, the leadership and staff of comparison schools were disappointed that they were not
selected to receive demonstration services, perceiving the significant needs of their families and
children, and so made a strong commitment to secure such services independent of the program.
Finally, and to an increasing degree as the implementation progressed, networks of principals
(including those from both
demonstration and
comparison schools) began to
share their positive
experiences with the program
and the successes achieved
for children and families, and
the programming ideas and
strategies promulgated by the
Transition Demonstration
Program were informally
shared across schools.
Table 9 Percentages of Schools with Health Services Staff
(Based on principals’ reports)
Demonstration Comparison
Nurses 83.2% 90.5% Less than 2 days/wk 31.5% 35.4% 2-3 days/wk 30.3% 35.4%4 or more days/wk 38.2% 29.2%
Paraprofessionals 51.4% 42.9%Less than 2 days/wk 11.1% 20.0% 2-3 days/wk 16.7% 20.0% 4 or more days/wk 72.2% 60.0%
Parent volunteer(s) 29.0% 26.7% Less than 2 days/wk 22.6% 32.1%2-3 days/wk 29.0% 17.9% 4 or more days/wk 48.4% 50.0%
Chapter 4 - Page 51

The extent to which comparison schools incorporated features and services that were
essentially the same as those in the demonstration schools is important to the understanding and
interpretation of outcomes for children and families. To that end, information was gathered
from principals in both demonstration and comparison schools about services available for
parents and children. Questionnaires at the end of the project period also gathered data from
principals about changes in their schools over the previous 5 years. In fact demonstration and
comparison principals reported strikingly similar services. Regarding staff available to address
the health and other basic needs of children, principals in both the demonstration and
comparison schools reported that they
had nurses, paraprofessionals, and/or
parent volunteers to assist in meeting
children’s health and screening needs
in the school (see Table 9). There was
a trend toward having health-related
personnel of all types (professional,
paraprofessional, and parent
volunteers) in the demonstration
schools for 4 or more days per week.
These included additional staff
members hired by the local Transition
Demonstration Program.
Table 10 Health Services Provided
(Based on principals’ reports)
Demonstration Comparison
Vision screening 96.8% 95.8% Hearing screening 96.7% 95.7% Dental Screening Other screening
89.5% 78.4%
84.2% 87.9%
Home visits 75.4% 78.6% Referrals to providers 92.5% 89.5% Case management 58.1% 66.7% Medication dispensing 94.2% 91.6% Health ed. for classrooms 91.4% 87.0% Health ed. for parents Consultation w/teachers
70.5% 90.5%
56.3% 93.8%
Medical examinations 68.6% 63.6%
The types of services provided by these health related staff generally did not differ
significantly between the demonstration and comparison schools (see Table 10). The single
exception was that health education for parents was provided in significantly more
demonstration schools (71%) than comparison schools (56%).
Findings about the availability of staff (counselors, behavioral specialists, and social
workers) to address the social, emotional, and mental health needs of students and to promote
family involvement (see Table 11) indicate that in all professional categories, more
demonstration than comparison schools had additional support staff. The largest differences
Chapter 4 - Page 52

were the availability of
social workers for at least 4
days per week in
demonstration schools
(53%) compared to
comparison schools (31%),
as well as para-
professionals for 4 or more
days each week (73% in
Demonstration schools
versus 61% in comparison
schools). These categories
included the Family
Service Coordinators hired
by the Transition
Demonstration program.
In the area of family
involvement, there was a
Table 11 Percentages of Schools with Social/Emotional and
Family Involvement Staff Available (Based on principals’ reports)
Demonstration Comparison
Counselor 89.7% 86.7% Less than 2 days/wk 12.6% 5.5% 2-3 days/wk 14.8% 17.6%4 or more days/wk 72.6% 76.9%
Behavioral Interventionist/therapist 40.2% 35.2% Less than 2 days/wk 32.6% 21.6% 2-3 days/wk 23.3% 16.2%4 or more days/wk 44.2% 62.2%
Social worker 49.5% 45.7% Less than 2 days/wk 35.9% 54.2% 2-3 days/wk 11.3% 14.6%4 or more days/wk 52.8% 31.2%
Professional 55.1% 42.9% Less than 2 days/wk 15.5% 18.2% 2-3 days/wk 13.8% 11.3%4 or more days/wk 70.7% 70.5%
Paraprofessional 55.1% 35.2% Less than 2 days/wk 10.3% 13.9% 2-3 days/wk 17.2% 25.0%4 or more days/wk 72.5% 61.1%
Parent volunteer(s) 32.7% 34.3% Less than 2 days/wk 37.2% 25.0% 2-3 days/wk 17.2% 25.0%4 or more days/wk 45.6% 50.0%
greater tendency for demonstration schools to have professional and paraprofessional staff to
address family involvement
and to have these persons in
the school for more time
during the week.
Approximately equal
numbers of principals in both
groups indicated that they had
parent resource rooms in the
school, formal and informal
links with community
Table 12Educational Programs Available in Schools
(Based on principals’ reports)
Demonstration Comparison
Head Start in building 50.0% 45.8%Head Start on campus 22.7% 43.5% Other Pre-Kg program 74.1% 76.5% Birth-to-three program 40.7% 38.1% Before school care 59.5% 65.1% After school program 84.1% 84.7%Tutoring program/school year 91.8% 82.6% Tutoring program/summer 61.1% 71.9%Recreational program/school year 78.9% 74.0% Recreational program/summer 60.5% 64.9%
Chapter 4 - Page 53

44.8
78.7
60.5
34.8
80
58.8
0
10
20
30
40
50
60
70
80
90
Per
cent
age
of p
artic
ipan
ts
Transition Demonstration
Comparison
Figure 4.1. Language Programs
Bilingual ESL for Children ESL for Adults
resources, partnerships with businesses, Head
Start and other preschool programs integrated
into the school, before- and after-school
programs for children, and tutoring and
recreational programs during the summer
months (see Table 12). It was noted that
somewhat fewer comparison schools offered
tutoring programs during the school year, but
more comparison than demonstration schools
offered tutoring for students in the summer. An
interesting difference in school programming
was noted in the area of language programs offered for children and families (see Figure 4.1).
Demonstration and comparison principals reported relatively equal percentages of schools
offering bilingual education and ESL classes for children, but more demonstration schools
reported providing ESL classes for families (45% versus 35%).
SUMMARY FINDINGS
Overall, it is noted that the 31 sites did, indeed, implement the Transition Demonstration
Program in accordance with the mandates and guidelines included in the original Request for
Proposal. Each site addressed the four major components and provided an array of
comprehensive services designed to meet the social, health, and educational needs of children
and families and to stimulate family involvement in all aspects of the educational processes of
children. The specific strategies and activities employed to address the implementation varied
substantially across sites. While there were many implementation features shared by sites, the
actual program implementation within each of the 31 sites was a unique configuration of
activities and personnel devised specifically to take advantage of the strengths and address the
needs of the children, families, schools, and community agencies participating in a given
Transition Demonstration Program. In many sites, transition-like services were also offered in
comparison schools, sometimes with very similar quality and intensity.
Chapter 4 - Page 54

As might be expected, individual sites varied in the extent to which they achieved
implementation of each of the four components and overall. The nature and degree of this
variation in extent of implementation is described in Chapter 5. Possible reasons for variation
in program design and extent of implementation are addressed in Chapter 7.
Chapter 4 - Page 55

CHAPTER 5 - EXTENT OF IMPLEMENTATION
This chapter summarizes the overall extent of
implementation for each of the components of the
Transition Demonstration Program -- Social Services,
Family Involvement, Education, and Health -- and
presents two perspectives on that implementation: the
viewpoint of the National Research Coordinating Team
and the viewpoint of the sites themselves. Information is
drawn from two distinct but complementary sources: the
ratings of program implementation completed by the
National Research Coordinating Team (NRCT) and the self-assessment ratings provided by the local
sites via the Program Implementation Profile. Ratings from each source are presented separately
and then compared for each of the four components.
In this chapter:
• Description of Rating Scales
• Extent of Implementation (Ratings)
- Family Involvement
- Education
- Social Services
- Health
• Comparison of NRCT and Self-Assessment Ratings
DESCRIPTION OF RATING SCALES
The level of implementation is important because (1) it reflects the extent to which programs
were successful in achieving program goals and (2) it may affect ultimate outcomes. National
Research Coordinating Team ratings are available for each of the 31 sites as a whole and in each of
the component areas. These ratings utilize a 6-point scale for Family Involvement, Social Services,
and Health and a 5-point scale for Education, with possible values ranging from 1 to 6 arrayed as
follows:
1. Minimal or no evidence of activity
2. Program supports traditional school-based activity but does little to extend or expand on
school programs
3. Program provides enhanced services in some areas
4. Program provides multiple, innovative activities but with some unevenness in availability
5-6. Program provides multiple, innovative activities with consistent availability to all
participant groups
Chapter 5 - Page 56

The ratings for each site are presented in Table 13.
Table 13. Level of Program Implementation by Local Sites
based on National Research Coordinating Team ratings*
Social Services
Family Involvement Health Education Overall Score
N-1 3 1 2 1 7
N-2 2 2 2 2 8
N-3 2 3 2 1 8
N-4 3 2 2 2 9
N-5 3 2 2 2 9
N-6 2 2 2 4 10
N-7 3 3 2 3 11
N-8 3 4 4 3 11
N-9 2 4 3 3 12
N-10 4 2 3 4 13
N-11 4 3 4 3 14
N-12 3 4 5 3 15
N-13 5 4 3 3 15
N-14 4 3 4 4 15
N-15 4 4 4 3 15
N-16 4 3 5 3 15
N-17 3 4 4 4 15
N-18 4 4 4 3 15
N-19 4 5 4 3 16
N-20 4 4 4 4 16
N-21 5 4 5 2 16
N-22 4 5 4 4 17
N-23 5 4 5 3 17
N-24 6 3 5 4 18
N-25 5 5 5 4 19
N-26 6 6 4 3 19
N-27 5 6 5 4 20
N-28 4 6 6 4 20
N-29 6 4 6 4 20
N-30 6 5 5 5 21
N-31 5 6 6 5 22
* Scale of 1 (low) to 6 (high) for social services, family involvement, and health; 1 (low) to 5 (high) for education
Chapter 5 - Page 57

In the final year of the program, self-assessments were completed at each site by committees
broadly representing the participants in and constituents of the Transition Demonstration Programs.
Project directors facilitated the process of completion but were not to directly influence committee
ratings. In nearly every site, the Governing Board reviewed the full document and approved it for
submission to the National Research Coordinating Team.
The self-assessment ratings within the Program Implementation Profile use a 10-point scale,
with possible values ranging from 1 (low) to 10 (high). The scale is anchored by only three
descriptors:
1 = Limited implementation
5 = Moderate implementation
10 = High degree of implementation
The sites’ self-assessment ratings are available for 25 sites (the remaining sites did not submit
Program Implementation Profiles) and for each of the four component areas, as well as for three
additional areas of interest: Leadership, Continuity with Head Start, and Readiness to Change.
Ratings were made of (1) degree of implementation at the beginning of the project (1992-93), (2)
degree of implementation at the end of the project (1996-97), and (3) amount of variation in
implementation across schools participating within this local Transition program. Self-assessment
ratings for each of four components (beginning and end of implementation) are presented in Table
14.
It is interesting to note that only two sites rated themselves as being uniformly low in
implementation in the first year, and only two sites rated themselves as being uniformly high. The
two sites indicating low implementation in the first year showed substantial gains in implementation
by the ending ratings. Generally, sites indicated uniformly moderate implementation across the four
components, a finding that is consistent with information obtained during early site visits. Three
sites indicated generally low implementation with one component showing some strength in the first
year, while eight other sites indicated generally moderate to above average implementation with one
component showing significant weakness in the first year. In these sites, there were often deliberate
decisions made to concentrate program resources and emphasis on a year-by-year basis, rather than
attempt an extensive implementation of all four components at once. Thus, it appears clear that site
Chapter 5 - Page 58

self-ratings reflect the varying approaches taken to implementation as well as the variation in level
of self-perceived success in implementation.
Table 14Local sites’ self-report of level of program implementation*
Site Social services Family Involvement Health Education
Beginning End Beginning End Beginning End Beginning End
P-1 1.0 9.0 1.0 9.0 1.0 9.0 1.0 7.0
P-2 2.0 9.0 2.0 9.5 2.0 9.0 2.0 9.0
P-3 2.0 9.0 1.0 9.0 2.0 9.0 7.0 9.0
P-4 2.0 8.0 1.0 4.5 ** ** 6.0 8.0
P-5 2.5 8.5 3.5 9.5 8.0 9.5 3.5 7.5
P-6 4.5 9.5 4.0 7.5 3.0 6.0 2.0 6.0
P-7 5.0 7.0 6.0 8.0 5.0 7.0 6.0 6.0
P-8 5.0 9.5 2.0 7.0 5.0 7.0 5.0 7.0
P-9 5.0 9.0 9.0 9.0 5.0 9.0 4.0 9.0
P-10 5.0 10.0 6.5 10.0 1.0 8.0 3.0 10.0
P-11 5.0 9.0 0.5 7.0 2.0 8.0 8.0 8.5
P-12 5.0 9.0 10.0 8.0 2.5 9.0 8.0 10.0
P-13 5.0 9.0 3.0 7.0 8.0 9.0 6.0 9.0
P-14 5.5 8.5 1.0 8.0 3.5 8.0 1.5 8.0
P-15 5.5 5.5 6.0 9.0 2.5 8.5 8.5 7.5
P-16 5.5 7.0 8.0 7.5 ** 7.5 1.5 6.0
P-17 6.5 9.5 3.5 7.5 9.5 9.5 9.5 9.5
P-18 7.0 9.5 7.5 3.5 ** 6.5 4.0 9.0
P-19 7.0 9.0 3.5 7.0 3.5 7.5 1.0 6.5
P-20 7.0 10.0 6.0 9.0 5.0 2.0 0.0 5.5
P-21 8.0 8.0 5.0 9.0 5.5 8.0 5.5 9.0
P-22 8.0 8.0 8.0 9.0 8.0 8.0 4.0 5.0
P-23 9.0 2.0 8.5 9.0 7.5 5.0 8.0 9.0
P-24 9.0 9.0 4.0 8.0 9.0 9.0 7.5 6.5
P-25 9.5 9.50 9.5 8.50 7.5 7.5 6.5 6.0
P-26 9.5 9.5 9.5 10.0 9.5 9.5 10.0 5.0
* Scale of 1 (low) to 10 (high) at the beginning and end of the Transition Demonstration Program
Chapter 5 - Page 59

FAMILY INVOLVEMENT
NRCT Ratings of Family Involvement
Figure 5.1 presents the ratings of implementation of the family involvement component that were
completed by the National Research Coordinating Team. Eleven sites achieved ratings of 5 or 6,
indicating evidence of multiple and innovative activities to stimulate and encourage family
involvement in education. Activities were offered
at diverse times, and parents were included in the
planning. Sites achieving the highest ratings
provided highly visible and individualized
activities that were consistently available to all
participant groups without the site, were offered
frequently, and included parents in all aspects of
the planning, modification, and implementation of
activities. More than half of the sites (54%)
achieved moderate ratings of 3 or 4. These sites
were found to have, with moderate to vigorous
1
5
7
10
4 4
0
2
4
6
8
10
12
1 2 3 4 5 6
ting
Num
ber
of s
ites
Figure 5.1. Implementation of Family Involvement Activities
Rating
effort, accomplished tasks such as: (1) establishing parent resource centers; (2) providing educational
activities for use at home and supporting the families in the completion of those activities; (3)
reducing barriers to family participation in school-based activities, and (4) planning activities based
on surveys of family interests and needs. Six sites were given ratings of 1 or 2, indicating minimal
implementation in the area of family involvement. The implementation efforts in these sites were
limited to the support of existing efforts on the part of the schools and did not add substantial
intensity to the efforts to involve families in education.
Self-Assessment Ratings of Family Involvement
Figure 5.2 summarizes the self-ratings provided by sites on the Program Implementation Profile
concerning the degree of implementation of the family involvement component at the beginning of
the implementation and at the end. Overall, the average rating of this component at the beginning
(1992-93) was 4.8, indicating a moderate degree of implementation. There was, however, a
significant amount of variation in the ratings that sites gave themselves. Seven sites (29%) gave
Chapter 5 - Page 60

Figure 5.2 Change in Degree of Implementation of
Family Involvement Component on Program Implementation Profile (self ratings)
Deg
re o
f Im
plem
enta
tion
9
8
7
6
5
4
3
2
1
0
8
4.8
Year 1 (1992-93) Year 5 (1996-97)
themselves a rating of 2 or less, indicating very
limited implementation in the initial year, and
seven sites gave themselves high ratings for initial
implementation. In contrast, there was little
variability among sites in ratings of
implementation at the end of the project period.
The average rating was 8.0, indicating a very high
degree of implementation. Only two sites gave
themselves a rating of less than 7 at the end.
Comparing the ratings given by individual sites
of beginning and ending implementation levels, it
is evident that some sites perceived large amounts of change in implementation over time. Six sites
had differences between beginning and ending ratings of 6 points or more. Three sites showed a
decline in ratings of 2 to 4 points. Only one site did not indicate any notable change over time in the
implementation of family involvement, in part because the site rated itself at the very highest levels
of implementation at both times (9.5 and 10.0).
Asked to rate the degree of variability within their site, half of the sites indicated that there was
at least moderate variability across schools within their programs in the level of implementation of
the family involvement component. Of those 16 sites, nine indicated that there was a substantial
amount of intra-site variability by giving a rating of 8 or higher. These ratings most likely reflect
a deliberate decision to individualize services at the district or building level, but they may also
reflect differences in the school populations and neighborhoods as well as the differences in staff
within the various schools. Eight sites (26%) showed very low variability ratings (2 or less),
indicating a perception of consistency in implementation across the schools.
Chapter 5 - Page 61

EDUCATION
NRCT Ratings of Education
The ratings of the implementation of the
education component by the National Research
Coordinating Team are summarized in Figure 5.3.
The large majority of sites (23 of 31, or 74%)
obtained a rating of 3 or 4, indicating moderate to
moderately high implementation of the education
component. These sites were found to: work with
teachers to identify staff development needs and
provide training based on that assessment; to
reduce barriers for teachers by providing materials,
substitute teachers, and reimbursement for
2
4
12 11
2
0
2
4
6
8
10
12
14
1 2 3 4 5
ng
Num
ber
of s
ites
Figure 5.3 Implementation of Education Activities
(external ratings)
Rating
conference expenses; to provide programs specifically designed to enhance academic and social
development of students (e.g., tutoring programs, summer enrichment programs, social skills
development activities, reading clubs); to monitor changes in classrooms and teacher practices and
modify classroom supports and training based on observations; and to include teachers and principals
in the design of curriculum and staff development activities.
Six sites were given lower ratings, indicating that activities to enhance the educational
component were primarily restricted to encouraging discussion among teachers and limited
dissemination of basic information about developmentally appropriate practices. Only two sites
achieved the highest implementation rating of 5 for their efforts in the educational component.
These sites showed consistent and broad evidence of multiple, innovative programs to enhance
student performance; enrichment programs designed to support classroom-based instruction; efforts
to integrate home-based and classroom-based instructional efforts; specific activities related to
continuity of curriculum throughout the early childhood years; individualized support for teachers;
extensive involvement of teachers and principals in the design and implementation programs for
students, families, and school staff; and efforts to coordinate educational support activities with other
programs within the school (e.g., Title I, special education, library, bilingual education, etc.).
It should be noted that while a number of sites showed evidence of one or more of the activities
Chapter 5 - Page 62
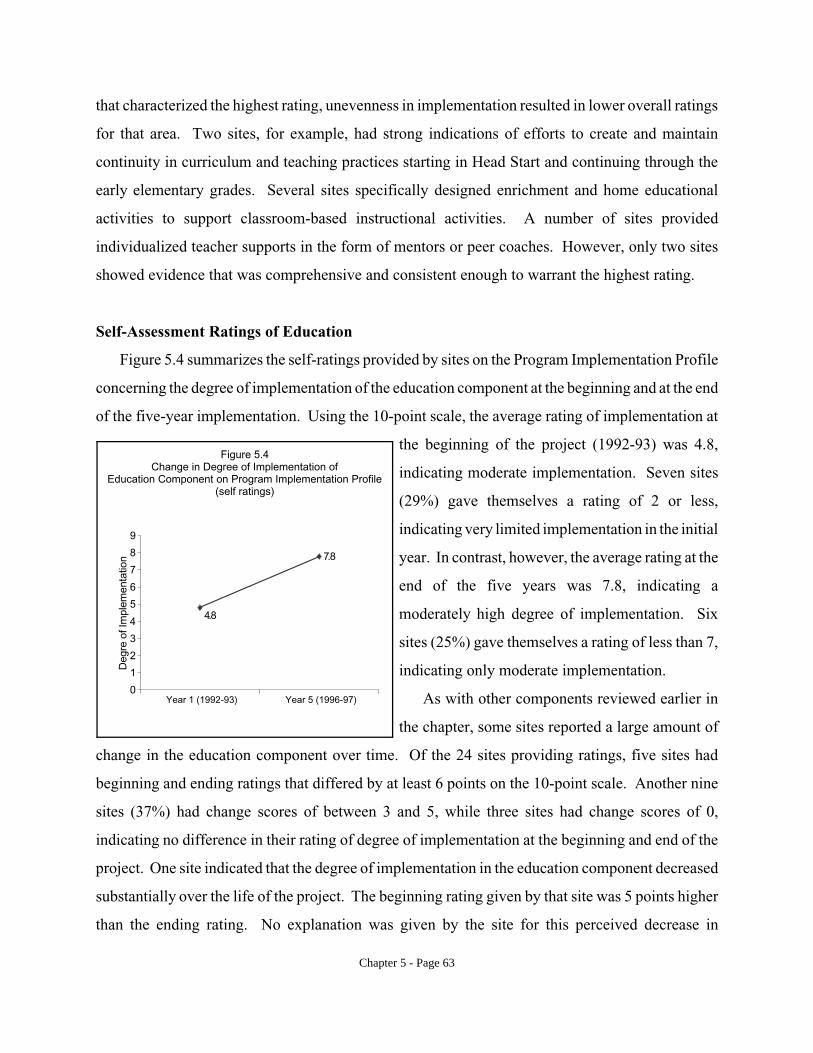
that characterized the highest rating, unevenness in implementation resulted in lower overall ratings
for that area. Two sites, for example, had strong indications of efforts to create and maintain
continuity in curriculum and teaching practices starting in Head Start and continuing through the
early elementary grades. Several sites specifically designed enrichment and home educational
activities to support classroom-based instructional activities. A number of sites provided
individualized teacher supports in the form of mentors or peer coaches. However, only two sites
showed evidence that was comprehensive and consistent enough to warrant the highest rating.
Figure 5.4 Change in Degree of Implementation of
Education Component on Program Implementation Profile (self ratings)
Deg
re o
f Im
plem
enta
tion
9
8
7
6
5
4
3
2
1
0
7.8
4.8
Year 1 (1992-93) Year 5 (1996-97)
Self-Assessment Ratings of Education
Figure 5.4 summarizes the self-ratings provided by sites on the Program Implementation Profile
concerning the degree of implementation of the education component at the beginning and at the end
of the five-year implementation. Using the 10-point scale, the average rating of implementation at
the beginning of the project (1992-93) was 4.8,
indicating moderate implementation. Seven sites
(29%) gave themselves a rating of 2 or less,
indicating very limited implementation in the initial
year. In contrast, however, the average rating at the
end of the five years was 7.8, indicating a
moderately high degree of implementation. Six
sites (25%) gave themselves a rating of less than 7,
indicating only moderate implementation.
As with other components reviewed earlier in
the chapter, some sites reported a large amount of
change in the education component over time. Of the 24 sites providing ratings, five sites had
beginning and ending ratings that differed by at least 6 points on the 10-point scale. Another nine
sites (37%) had change scores of between 3 and 5, while three sites had change scores of 0,
indicating no difference in their rating of degree of implementation at the beginning and end of the
project. One site indicated that the degree of implementation in the education component decreased
substantially over the life of the project. The beginning rating given by that site was 5 points higher
than the ending rating. No explanation was given by the site for this perceived decrease in
Chapter 5 - Page 63

implementation.
Asked to rate the variability within the site, six sites (25%) indicated that there was very little
variability (ratings of less than 3) across schools within their programs in the implementation of the
education component. Eight sites (33%) indicated a moderate amount of variability (ratings of
between 3 and 7), and 10 sites (42%) indicated a large amount of variability (ratings of greater than
7). This degree of perceived variability within a site is the greatest among the four components. It
is consistent with reports from site visits and from project directors that there were substantial
differences among schools and teachers in the degree of acceptance and implementation of
developmentally appropriate practices and other efforts to improve the educational practices in
schools.
SOCIAL SERVICES
NRCT Ratings of Social Services
Figure 5.5 presents the ratings of social service implementation completed by the National
Research Coordinating Team. A third of the sites achieved ratings of 5 or 6, indicating multiple
innovative contacts with families, outreach to hard-to-reach families to bring them into participation
in program activities, vigorous efforts to minimize duplication of services, evidence that support
plans guided service provision for individual families and that plans were modified based on
outcomes, use of a strengths-based model of family
support, and evidence of specific efforts to promote
the independence of families in goal setting and
service access. Sites achieving the highest ratings
also demonstrated extensive and broad-reaching
efforts to serve hard-to-reach families, extensive
participation in community efforts to modify or
create new services, and considerable evidence of
incorporation of strength-based models.
Another 17 sites were given moderate ratings.
These ratings reflected evidence of active efforts to
reduce barriers to access to service, multiple
0
4
7
10
4
0
2
4
6
8
10
12
1 2 3 4 5 6
ng
Num
ber
of s
ites
Figure 5.5 Implementation of Social Activities
Rating
6
Chapter 5 - Page 64

individualized contacts with families, evidence of efforts to address specific cultural needs of
families, and family participation in the development and enactment of family support plans. Only
4 sites were given ratings of 2, indicating limited evidence of supportive social services for families.
These sites tended to be those in which there was a great deal of turnover in program staff, limiting
the sites’ ability to mount or maintain a consistent effort.
Figure 5.6 Change in Degree of Implementation of
Social Service Component on Program Implementation Profile (self ratings)
10
9
Year 1 (1992-93) Year 5 (1996-97)
8.7
Deg
ree
of Im
plem
enta
tion
8
7
6
5 5.2 4
3
2
0
1
Self-Assessment Ratings of Social Services
Figure 5.6 summarizes the self-ratings provided by sites on the Program Implementation Profile
concerning the degree of implementation of the social services component at the beginning of the
implementation and at the end. Overall, the average rating of implementation at the beginning
(1992-93) was 5.2, indicating moderate implementation. By the final year, this increased to 8.7, with
only 3 sites rating themselves less than 8.
The distribution of ratings across the 25 sites
indicates substantial variation at the beginning of the
project. Ratings ranged from 1 to 10, indicating that
some sites began with very limited social services in
the schools for children and families, while other
sites started the project with much higher degrees of
support already available. By the end of the project,
however, there is little variation in the ratings.
Twenty-two of the 25 sites submitted ratings of 8 or
higher, indicating their perception of strong
implementation in the final year of the project.
Looking at the degree of change indicated for each site, it is noted that some sites reported a large
amount of change in the social services component over time. Twenty percent indicated that a great
deal of change had taken place – their beginning and ending ratings at least 6 points apart. Another
40 percent of the sites had moderate change scores between 3 and 5 points, while 20 percent
indicated no appreciable change over five years. Note, however, that four of these “no-change” sites
had high self-ratings at the beginning of the project period, while one site had a moderate rating at
both periods.
Chapter 5 - Page 65
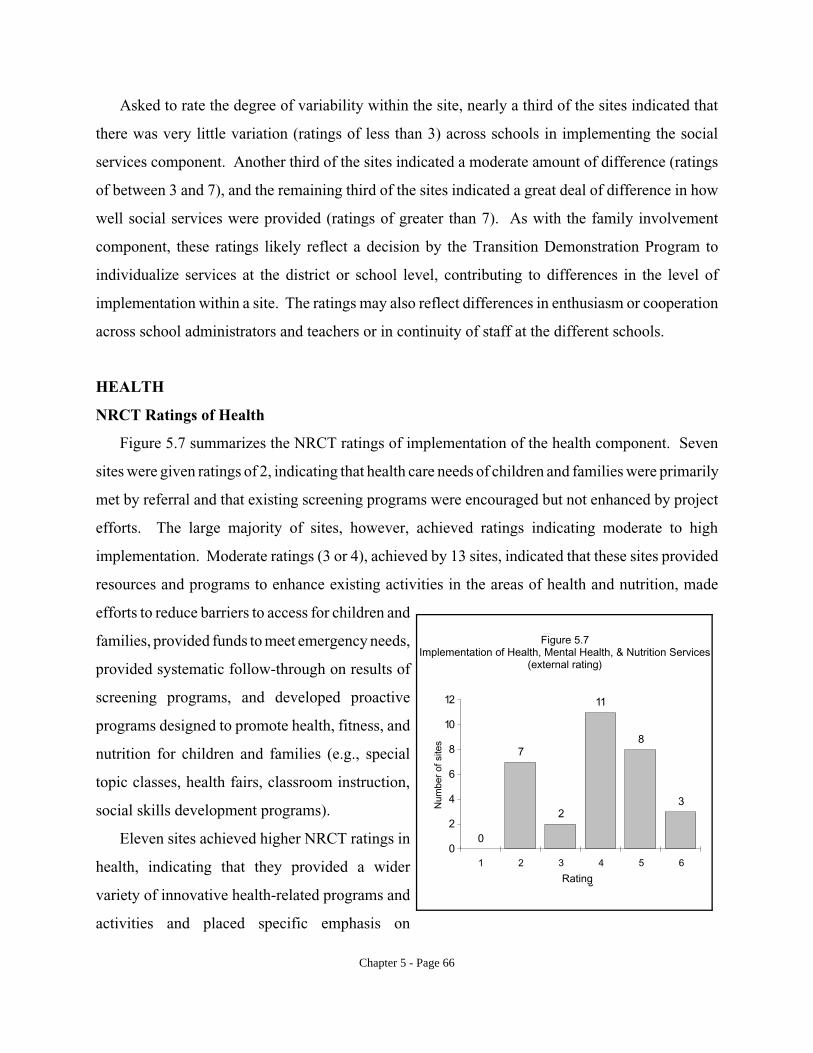
Asked to rate the degree of variability within the site, nearly a third of the sites indicated that
there was very little variation (ratings of less than 3) across schools in implementing the social
services component. Another third of the sites indicated a moderate amount of difference (ratings
of between 3 and 7), and the remaining third of the sites indicated a great deal of difference in how
well social services were provided (ratings of greater than 7). As with the family involvement
component, these ratings likely reflect a decision by the Transition Demonstration Program to
individualize services at the district or school level, contributing to differences in the level of
implementation within a site. The ratings may also reflect differences in enthusiasm or cooperation
across school administrators and teachers or in continuity of staff at the different schools.
HEALTH
NRCT Ratings of Health
Figure 5.7 summarizes the NRCT ratings of implementation of the health component. Seven
sites were given ratings of 2, indicating that health care needs of children and families were primarily
met by referral and that existing screening programs were encouraged but not enhanced by project
efforts. The large majority of sites, however, achieved ratings indicating moderate to high
implementation. Moderate ratings (3 or 4), achieved by 13 sites, indicated that these sites provided
resources and programs to enhance existing activities in the areas of health and nutrition, made
efforts to reduce barriers to access for children and
families, provided funds to meet emergency needs,
provided systematic follow-through on results of
screening programs, and developed proactive
programs designed to promote health, fitness, and
nutrition for children and families (e.g., special
topic classes, health fairs, classroom instruction,
social skills development programs).
Eleven sites achieved higher NRCT ratings in
health, indicating that they provided a wider
variety of innovative health-related programs and
activities and placed specific emphasis on
Figure 5.7
0
7
2
11
8
3
0
2
4
6
8
10
12
1 2 3 4 5 6
ng
Num
ber
of s
ites
Figure 5.7 Implementation of Health, Mental Health, & Nutrition Services
(external rating)
Rating
Chapter 5 - Page 66

prevention, health promotion, and family wellness. Of these 11 sites, three were given the highest
rating of 6, based on evidence of highly unique and broadly available programming, fundamental
emphasis on wellness and prevention as central themes, comprehensive programming encompassing
all areas of health, and strong evidence of efforts to facilitate system change in the community and
the schools, thus building capacity to meet the ongoing health needs of children and families.
Figure 5.8 Change in Degree of Implementation of
Health Component on Program Implementation Profile (self ratings)
9
8 8
4.7
0
Deg
re o
f Im
plem
enta
tion 7
6
5
4
3
2
1
Year 1 (1992-93) Year 5 (1996-97)
Self-Assessment Ratings of Health
Figure 5.8 summarizes the self-ratings by sites concerning implementation of the health
component at the beginning and end of the five-year implementation. Using the 10-point scale, the
average implementation rating at the project’s
beginning (1992-93) was 4.7, indicating moderate
implementation. Seven sites (29%) gave
themselves a rating of 2 or less, indicating very
limited implementation in the first year. In
contrast, however, the average rating at the end of
the five years was 8.0, indicating a high degree of
implementation. At this time, only four sites gave
themselves a rating of less than 7.
Looking at the degree of change indicated for
each site, it is noted that some sites (29%) reported
a large amount of change in the health component over time. Of the 24 sites providing ratings, seven
sites had beginning and ending ratings that differed by at least 6 points. Another 5 sites (21%) had
change scores of between 3 and 5, while 3 sites had change scores of 0, indicating no difference in
their rating of degree of implementation at the beginning of the project and at the end.
Asked to rate the variability within the site, 8 sites (33%) indicated that there was very little
variability (ratings of less than 3) across schools within their programs in the implementation of the
health component. Twelve sites (50%) indicated a moderate amount of variability (ratings of
between 3 and 7), and only 4 sites indicated a large amount of variability (ratings of greater than 7).
Chapter 5 - Page 67

Figure 5.9 Comparisons of External and Self-assessment Ratings
20 1816 14
3 2
3 1
3 4
7
10
19 19
14 14
External>Self NRCT = Self Self>External
Num
ber
of s
ites
12 10 8 6 4 2 0
Social Services Family HealthHealth Education Involvement
Comparison of NRCT and Self-Assessment Ratings
Ratings of implementation for each of the four components were compared, and Figure 5.9
presents the results. (Note: Both sets of ratings were converted to a single scale — 0, 2, 4, 6, 8, 10
— before comparison. The ratings for the education component were converted to: 0, 2.5, 5.0, 7.5,
10.) Only self-assessment ratings of implementation at the end of the project were compared to the
NRCT ratings.
There were noticeable differences between the ratings of component implementation made by
the National Research Coordinating Team and the sites themselves. Ratings made by the National
Research Coordinating Team, which rated programs against pre-specified criteria, tended to be lower
for the majority of sites in every component area.
The differences in NRCT and self-assessment
ratings are not unexpected, and are most likely
related to several factors, including (1) the
differences in the two rating scales; (2)
differences in the rating methods; and (3) real
discrepancies in perceptions or evaluations of
the programs. As described earlier in this
chapter and in Chapter 3, the two scales and the
processes by which ratings were made were
quite different. The NRCT rating scale was
designed to capture differences and, to the extent
possible, to discriminate differences among sites, while the self-assessment (Program
Implementation Profile) rating scale was not designed to discriminate in such a fashion. The NRCT
rating scale was more global in its approach, while the Program Implementation Profile was
designed to reflect implementation in some detail. Second, the NRCT ratings were created by a
single individual using extensive written documents, site visit reports, and interviews (although
ratings were validated by other reviewers). The self-assessment ratings were created by committees
of individuals within each site, via a consensus process and using a broad range of information
obtained from written documents, interviews, observation, and other sources. Thus, to some extent,
differences in perceptions at the local site level may have been obscured through this process. Third,
Chapter 5 - Page 68

the NRCT ratings were completed with a perspective that encompassed all 31 sites, while the self-
assessment ratings were focused on a single site. Thus, both the purposes and processes of
producing ratings were different in the two endeavors and therefore would be expected to yield
somewhat different results.
SUMMARY FINDINGS
This chapter presents ratings of implementation produced through two processes: ratings made
by the National Research Coordinating Team (NRCT) and self-assessment ratings given by each site
through a consensus process. Different scales and different rating processes yielded, not
unexpectedly, somewhat different results. Key findings are as follows:
1. Sites tended to indicate that the levels of implementation were low to moderate in the first
year of the program. By the end of the five-year implementation period, sites indicated
consistently higher degrees of implementation in all program areas. This is consistent with
the a priori expectation that the implementation of the comprehensive Transition
Demonstration Programs would take some time to accomplish.
2. Sites tended to indicate moderate to high degrees of variability within sites. The variation
seen in implementation within a site is most likely related to conscious decisions to
individualize program offerings to meet the unique needs of specific schools and
neighborhoods. Variation in implementation within a site may also reflect differences in
level of acceptance among school personnel or differences in continuity in staff.
3. There is relatively little variability across sites at the end of the implementation period as
reflected in the self-assessment ratings. The self-assessment ratings from the Program
Implementation Profile generally reflect a perception on the part of the sites that they
achieved the goals they set for their projects. The appreciation of accomplishments reflects
the views of a variety of stakeholders within the site, because of the broad representation on
the committees completing ratings.
4. The NRCT ratings, however, do indicate variability across sites. Distributions of NRCT
ratings evidence a range from limited to extensive implementation for each of the four
components, with the majority of sites showing moderate implementation. A few sites
showed relatively limited implementation across all components, and, similarly, a few sites
Chapter 5 - Page 69

showed consistently extensive implementation. Most sites achieved at least moderate
implementation of all components and many of them showed evidence of extensive
implementation in one or more areas. Even sites with lower levels of implementation
achieved moderate ratings in at least one component.
Taken together, the self-assessment and NRCT ratings of the program implementation efforts
in the 31 sites indicate that the large majority of sites did, in fact, implement innovative,
comprehensive, creative programs to build on the strengths and meet the needs of the children,
families, schools, and communities within which they operated. Variation in implementation, both
in type and extent of program offered, reflected, at least in part, the inherent variation in the
communities, neighborhoods, organizations, and cultures participating in the National Transition
Demonstration Project across the 31 sites.
In Chapter 7, a group of six highly successful local sites and the eight least successful sites in
terms of program implementation are identified. Exploratory analyses about what contributed to the
tremendous differences between these types of sites are presented in that chapter.
Chapter 5 - Page 70
CHAPTER 6 – FACTORS INFLUENCING VARIATION
As noted in the introduction to this report, the
implementation of the Transition Demonstration
Program was designed by ACYF to create 31 unique
programs, each designed locally to address the
characteristics and needs of the local community.
There was no single program to be implemented;
In this chapter:
• Developmental View of
Implementation
S Baseline Factors
S Program Factors
rather, ACYF set forth broad guidelines within the original program announcement and guided the
National Transition Demonstration Consortium as it worked over time to clarify the guidelines and
shape local programs. Thus, the 31 Transition Demonstration Programs began as unique designs,
rather than a single intervention model. Previous chapters have highlighted the features of the
implementations achieved at each of the 31 sites, the extent to which implementation was achieved
in the four component areas and overall, and the variability of implementation both across and within
sites. This chapter will discuss some of the factors that are thought to have shaped program designs
at the outset and influenced the progression of implementation over time.
DEVELOPMENTAL IMPLEMENTATION
The process of implementation of this demonstration program was neither static nor governed
primarily by initial designs. Rather, implementation was a progressive, dynamic (developmental)
process throughout which program features were conceptualized, designed, implemented, and
revised as the program evolved. Figure 6.1 provides a graphical overview of the progression of
planning and implementation and some of the factors thought to influence programmatic processes
and outcomes.
Initially, program designs reflected the unique characteristics of the communities, schools,
programs, and populations participating in and being served by the program. These factors included
the linguistic homogeneity or diversity found within the communities, the financial resources within
families and the community at large, and the structure and philosophy of schools, school districts,
Chapter 6 - Page 71

Figure 6.1Some of the Factors Influencing
Variation in ImplementationProgram Factors
* Grantee * Number of schools * Number of * Program philosophy
school districts * Resource allocation
Bas
elin
e F
acto
rs*
Com
mun
ity
* Sc
hool
s *
Pop
ulat
ion
Transition Demonstration
Program
Transition Demonstration
Program
* Successes *Challenges
Transition Demonstration
Program
* H
ead
Star
t
External Factors
* State/local initiatives * Turnover/continuity in partnerships
and community agencies, including Head Start. The influences of these baseline factors were not
only felt during program initiation, but continued to be important influences over time. The
implementation of the Transition Demonstration Program was a dynamic process through which
initial program designs were modified to accommodate both internal (program) and external
influences. Program factors that may have impacted program features included the grantee agency
itself (whether the program is initiated from a Head Start program, a local education agency or a
combined Head Start/school grantee), the number of school districts and schools included in the
programs, the philosophical base from which the program operated, and specific resource allocation
decisions made by the program. These factors interacted with more external influences, which may
include state and local initiatives that support or conflict with the program objectives and continuity
(or turnover) in key positions within the program and its partnering agencies. In addition, the
program’s implementation was shaped by its own successes and “failure,” growing and moving
forward by building on experience. At the end of the developmental period, the “final” program
Chapter 6 - Page 72
design may resemble but be very different from the design that was identified during the planning
period -- because of the influences of the baseline, and internal and external factors encountered
along the way. Thus, multiple factors contributed to local site variations.
Baseline Factors
Baseline factors that influenced variation in program implementation included characteristics of
the families, schools, agencies, and communities serving as the foundation for the Transition
Demonstration Program. Specifically, linguistic or cultural diversity, resources within families and
the community at large, and the structure and philosophy of schools, school districts, and community
agencies participating in the program all exerted an influence on local programs.
Information obtained during site visits indicated that substantial cultural and linguistic diversity
within a site influenced the nature of program services and the types of barriers families encountered
in schools and communities. Sites with significantly larger populations that were linguistically
divergent needed to offer translation services to ensure that families had full access to programs and
services offered by the Transition Demonstration Program and within the community. Print
materials had to be presented in multiple languages, and oral program presentations had to be
presented in multiple languages or translated. Some Transition Demonstration Programs offered
classes in English as a Second Language for adults. Further, considerable attention was paid to
devising program offerings that were culturally appropriate and relevant for participants. Cultural
customs and perspectives on educational processes were accommodated in many sites to facilitate
program participation.
The degree to which families and communities had readily available, high quality services or
resources also had a significant impact on program design and implementation. For those
communities with a strong base of services available to families, the major challenges for the
Transition Demonstration Program were to (1) help families access services more efficiently and (2)
develop or strengthen networks of service providers within the community to reduce redundancy in
services as well as to identify and fill service gaps in a collaborative manner. In other communities
with fewer preexisting resources for families, the Transition Demonstration Program was challenged
to bring these needs to the attention of the community, to strengthen efforts to meet the needs, and
Chapter 6 - Page 73

at the same time to help families gain access to services wherever they might be located. These
differences in resources were found within sites as well as across sites. For example, some sites
noted a high baseline rate of developmentally appropriate practices within some schools, allowing
those programs to support existing resources in that area and concentrate additional resources on
development of services in other component areas (e.g., family involvement). Similarly, at least one
site perceived that health and nutrition services were already at a high level at the beginning of the
program and required only enhancement rather than development. These resource differences
contributed to variation within and among sites as they designed their Transition Demonstration
Programs.
The structure and philosophy of schools also had a substantial impact on individual program
designs. Factors such as school size, teacher-student ratios, per-pupil expenditures, and experience
implementing federally funded programs varied widely across the schools and school districts
participating in the 31 local Transition Demonstration Programs. Experience with site-based school
management also varied across sites, and occasionally within sites. Sites that included smaller
school districts and Head Start programs with flat organizational structures had more immediate
access to decision-makers than did sites that included very large organizations with complex,
bureaucratic decision-making processes. Further, in schools where site-based management or other
local policies afforded teachers and principals the opportunity to make decisions for their own
schools and classrooms, program implementation strategies were more localized than centralized.
Program Factors
As the Transition Demonstration Programs progressed through the planning and implementation
stages, a number of program-specific factors influenced decisions and created variation in
implementation. These factors included, but were not limited to: (1) the grantee organization for the
Transition Demonstration Program; (2) the number of school districts participating in the program;
(3) the number of schools served by the program; (4) the philosophical base upon which the program
was founded; and (5) resource allocation demands imposed upon or made by program leaders.
The location of the Transition Demonstration Program grant within the Head Start program or
the local education agency had some impact on the local program design and implementation
Chapter 6 - Page 74

strategies. Whether or not the impetus for systemic change came from inside the public schools or
from outside the school district was reported by Project Directors and site visit teams to have
influenced the implementation strategies adopted by Transition Demonstration Programs,
particularly in the implementation of the education component. Similarly, the familiarity of Head
Start programs with the processes of providing social support services and promoting health and
nutrition within families created variation in the design and implementation of those components,
based solely on the closeness of the relationship between the Transition Demonstration Program and
the Head Start program.
The challenges of bringing together three partners and developing strong, productive working
relationships are substantial. Those sites that involved more than one school district or Head Start
program in the implementation faced challenges and complexities in implementation not faced by
those programs that dealt with only a single school district or Head Start partner. Creating shared
vision, establishing and maintaining communication, resolving differences in policies, and creating
continuity in philosophy and practice among the various agencies and systems were inherently more
difficult in sites with multiple partners and required different strategies and resource allocation than
in single-partner sites.
The number of schools involved in the Transition Demonstration Program was a key decision
by program planners and had continuing impact on implementation. Including larger numbers of
schools in the demonstration effort increased the possibility of broad systemic impact, but also
distributed staff and other program resources more widely (that is, less per school or classroom).
Variations in the strategies used to provide supports for teachers and families were, in part, related
to the number of schools and classrooms participating in the Transition Demonstration Program.
The philosophical underpinnings of the program affected many decisions during the planning
period and throughout the implementation. Some sites adopted a strong family-focused approach,
where the majority of program activities centered around home visits and other individualized family
contacts. Other sites adopted a more school-based intervention approach; program activities in those
sites were centered in the school. Some sites adopted from the very inception of the program a
philosophy of family empowerment that drove all decisions about what supports would be offered
to families and in what ways. Other sites made decisions about program offerings always with a
Chapter 6 - Page 75

consideration of continuation after grant funding expired, so that no Transition Demonstration
Program activity was organized or funded solely by the program. These sometimes subtle, but
important philosophical foundations were a key source of variation across the 31 local Transition
Demonstration Programs.
Finally, program design and implementation variation was influenced by resource allocation
decisions. Some decisions were controlled by program leadership – such as choices to hire
professional staff versus parents and community staff, to provide services directly or via referrals,
to include component coordinators within the program staff or to centralize leadership in the project
director, to co-mingle funds with other programs or to maintain separate funding streams for key
items. Other factors external to the programs also affected expenditures, such as salary scales within
school districts, personnel policies that required particular qualifications for positions, and agency
or district policies forbidding certain kinds of expenditures. Thus, resource allocation both reflected
and influenced program design and implementation across the sites.
External Factors
External factors also contributed to variation in implementations of the 31 Transition
Demonstration Programs. Each state and local community had ongoing local initiatives in the areas
of education, social support services for families, health and welfare, and family involvement in
education. In some cases, these state and local initiatives were consistent with and supportive of the
goals and objectives of the Transition Demonstration Program. For example, many school districts
sought and received funding for kindergarten programs, for Safe and Drug-Free Schools, for family
involvement initiatives, and for curriculum development. Local communities obtained federal and
state funding to support the development of supportive services and collaborative networks of
service providers. Rural health initiatives in some sites enhanced program efforts to provide health
and nutrition services for families. The availability of many of these opportunities was site-specific,
however, and there was considerable variation in the vigor with which local communities, agencies,
and school districts sought new sources of funding and programming. In other instances, local or
state initiatives were less supportive of or in direct conflict with the goals and objectives of the
Transition Demonstration Program. Several states, for example, were experiencing educational
Chapter 6 - Page 76

reform movements that were perceived by principals and teachers to be in conflict with program
initiatives (e.g., accountability movements that put great emphasis on standardized achievement test
scores at the classroom and school level).
Project directors frequently reported during site visits and interviews that the existence of
supportive leadership at the state level, in the office of the governor or other state educational
agency, facilitated their efforts to implement change at the local level. Some also reported that state
leaders were less supportive or that changes in leadership during the period of program
implementation affected their programs adversely. The net effect of these external factors was to
create climates within which change could occur with more or less ease, with or without oppositional
pressures.
Another factor related to program variation was the degree of continuity in the program
leadership and key positions, such as Head Start directors, school superintendents, principals, and
family service workers. In sites with high levels of continuity throughout the five years of program
implementation, project staff members were able to establish and maintain strong working
relationships, to build on joint experiences, and move forward without minimal disruption. When
frequent turnover occurred in key positions, however, there was significant interference or loss of
program momentum. Local consortia spent many resources (time, personal, and financial) on
training and assimilating new persons into the implementation network. Progress in those sites was
less likely to be steady, and staff morale and new initiatives often were affected negatively.
Successes and Challenges of Implementation
The successes and challenges encountered during the implementation of the 31 Transition
Demonstration Programs had a profound impact on the variation ultimately noted in the
demonstrations. Project directors and site visit teams consistently noted that programs evolved
based, in part, on their experiences. Successful activities were continued, expanded, and
institutionalized. Less successful activities were analyzed, modified, sometimes dropped or
attempted again -- and again -- until the activity became a successful and productive part of the
implementation.
Challenges were viewed as an inherent part of the developmental process and were discussed in
Chapter 6 - Page 77

some detail in previous reports (see Interim Report, 1996; Ramey, & Ramey, 1993). Figure 6.2
depicts challenges in four general areas: characteristics of this demonstration initiative; the local
community within which a program was implemented; the program design chosen by a local site,
and the participating systems and individuals. These characteristics shaped the nature, duration, and
intensity of the challenges faced by an individual program effort and were a key source of variability
in the nature and degrees of challenges faced by the 31 sites.
Figure 6.2Challenges Associated with Program Implementation
Challenges Associated with Characteristics of the Community:
* Family Diversity * Community networks
* Removing barriers to access * Mobility of families
Challenges Associated with Characteristics of this
Demonstration Initiative: Challenges Associated with
* Understanding and interpreting PROGRAM Program Design:
Federal Register IMPLEMENTATION * Limited Resources * Staffing
* Governing Boards * Effective partnerships
* Fulfilling evaluation design * Communication * Documentation of* Reconciling local and
national evaluation plans Challenges Associated with program implementation
* Participation of comparison Participatingparticipants Systems/Individuals:
* Analytic complexity * Differences in policies between
Head Start and public schools * Family involvement
* Family independence and empowerment
* Developmentally appropriate practices
* Family friendly school environments
In general, challenges associated with this demonstration initiative related to specific features
(or mandates) found within the initial program design as specified by ACYF. The most challenging
features were making the Governing Boards viable decision-making bodies, as well as fulfilling the
requirements of the local evaluation component. Reconciling local and national evaluation plans,
maintaining consistent involvement of comparison participants over the five years of the study, and
dealing with the analytic complexities imposed by the evaluation design have been areas of particular
challenge for many sites.
Chapter 6 - Page 78

Challenges associated with the characteristics of the community within which the program was
implemented included: dealing with cultural, linguistic, and economic diversity among families;
creating and facilitating community networks of providers; removing barriers to access; and dealing
with family mobility. These challenges varied substantially across sites based on the community
context. For example, in some sites, families tended to stay within the community for a long period
of time, reducing the impact of family mobility on program delivery and evaluation, while in other
sites mobility among families was quite high and the associated challenges were substantial.
Similarly, some sites had very homogenous populations with little linguistic diversity, while other
sites had great linguistic and cultural diversity among participating families. These sites faced many
challenges in their efforts to increase appropriate and relevant activities, to reduce barriers to access
for families, and to accommodate the diversity in the evaluation process.
Challenges associated with the characteristics of the local program’s design included staffing,
creating and developing effective partnerships, establishing effective ongoing communication, and
documenting program implementation. Staffing presented unique challenges in those sites with
large, complex organizations and agencies as grantees. Extensive and complicated hiring procedures
often contributed to delays in hiring key staff at the beginning of the project and as turnover occurred
during the implementation years. These staffing delays contributed to discontinuities in service for
some families and schools and limited the ability of programs to respond rapidly to situations. The
development of partnerships within the local consortia was more challenging in sites with multiple
school districts, more than one Head Start program, and/or a large geographic dispersion of partners.
The decision, for example, by one site’s design team to develop a statewide implementation,
incorporating five separate Head Start programs and five school districts in five distinct communities
dispersed across the state, while enhancing the probability of large-scale impact within the state,
created many challenges in the development of strong partnerships and in communication within the
project.
Finally, some challenges appeared related to the characteristics of participating agencies,
systems, or individuals. The challenges associated with the implementation of developmentally
appropriate educational practices, the creation of family-friendly environments within classrooms
and schools, and the reconciliation of differences between Head Start and public schools were
mediated by the characteristics of the participating Head Start programs and schools within each site.
Some local consortia involved smaller agencies and school districts with more accessible
Chapter 6 - Page 79

organizational structures, while other sites included very large Head Start programs or school
districts with very formal, complex administrative structures. The challenges faced in reconciling
policies and changing practices within the two types of organizations differed. Similarly, the
challenges associated with encouraging and strengthening involvement of families in education
varied by site, based in part on the characteristics of the families themselves, their resources, and
their challenging life circumstances. An urban, midwestern site, for example, faced unique cultural
as well as linguistic barriers in encouraging the participation of a large number of foreign-language
families in educational activities. Sites with large numbers of recent immigrants faced significant
challenges in helping those families become assimilated into school and community environments.
In addition, project directors noted that the implementation of developmentally appropriate practices
in schools and classrooms was influenced strongly by the existing educational philosophy of the
school participating in the demonstration. Some schools were already moving to make classrooms
more developmentally appropriate for children, and the Transition Demonstration Program served
to enhanced their efforts. In other schools, the introduction of developmentally appropriate practices
required a paradigm shift on the part of teachers, requiring a different implementation approach and
generating different challenges for the site. In addition, it is undeniable that individual personalities
and the past history of collaboration experiences, both positive and negative, contributed
substantially to the degree of progress in program implementation.
It is important to note that many obstacles evolved over the life of the implementation. In the
planning and start-up years of the program, challenges were most often related to creation and
establishment of Governing Boards, of effective partnerships, and of viable communication
strategies. In the middle years of implementation, challenges were most often related to maintaining
and strengthening aspects of the program and to ensuring continuity in positive program features.
Finally, as the programs moved into the final phase of the implementation of the program and the
end of the Transition Demonstration Project as a federally funded program, the challenges most often
related to the need to extend (bringing in more participants, creating a broader base of participation),
create more consistency in implementation (across schools, classrooms, diverse participant groups),
and shift ownership to schools, families, and community agencies, ensuring that successful activities
or program elements would continue after the Transition Demonstration Program funding ceased.
Chapter 6 - Page 80

SUMMARY FINDINGS
The review of the variability in and among transition Demonstration Programs highlights several
important findings. First, the 31 Transition Demonstration Programs began as unique designs,
rather than a single intervention model. The uniqueness of the individual programs was based on
variations in the communities, schools, agencies and families participating in the demonstration,
including linguistic and cultural diversity, resources available, and the particular organizational
features of participating schools, school districts, and community agencies. Initial implementation
was also influenced by program factors such as the grantee organization, the number of school
districts and schools participating in the program, the philosophy underlying the program, and
resource allocation decisions.
Second, the process of implementation was not static and determined solely by initial designs.
Implementation was, instead, a progressive, dynamic (developmental) process through which
program features were conceptualized, designed, implemented, revised, and reshaped as the program
evolved over the six years of planning and implementation. Specific features as well as the process
itself were shaped by external factors -- state and local initiatives, supportive leadership at the state
level, continuity in leadership (program directors, school principals, district superintendents) -- and
by the successes and challenges experienced within the program itself. In general, successful
activities were continued and expanded, while less successful activities were analyzed and modified
until they became successful.
Challenges were viewed as inherent in the developmental process. Generally, challenges were
related to characteristics in four general areas: (1) particular demands on this demonstration initiative
(e.g., creating viable Governing Boards and dealing with the requirements of the evaluation); (2) the
local community in which the program was implemented (e.g., dealing with diversity and mobility,
creating community networks, and removing barriers to access); (3) the program design chosen by
the site (e.g., staffing, developing effective partnerships, maintaining communication, and
documenting program implementation); and (4) the participating systems and individuals (e.g.,
creating of family-friendly environments, reconciliation of policies across organizations,
implementation of developmentally appropriate practices).
The net outcome of the evolutionary process has been 31 individual programs, often with
variations within programs accommodating the unique characteristics of neighborhoods or
Chapter 6 - Page 81

subpopulations within a program. These individual programs shared a common goal and a basic
framework -- the four mandated components -- but were highly variable in their specific design,
processes, and legacies.
Chapter 6 - Page 82

CHAPTER 7 – WHAT CONTRIBUTES TO SUCCESSFUL IMPLEMENTATION?
This chapter presents insights about the process of implementation and the factors that contribute
to successful implementation. This summary is based on information obtained from project directors
and other key informants in the sites during site visits, final interviews, and other contacts. The
“lessons learned” are founded in the experiences of the 31 sites individually and the National
Transition Demonstration Consortium collectively. Taken together with an understanding of the
barriers and challenges that may be encountered in such implementation efforts, a discussion of the
factors that are thought to have contributed to successful implementation in this context may serve
to inform those who would seek to implement similar programs in other communities. The
information is presented in two parts: insights provided by the sites themselves and insights obtained
through a review of characteristics of sites that achieved stronger versus weaker program
implementation.
WHAT THE SITES TELL US
The ongoing experiences of the project’s six years led project directors and other key partners
in the local implementations to identify seven basic factors that appear to be related to successful
program implementation within the context of the Transition Demonstration Project.
These factors include:
• Planning
• Involvement
• Patience
• Individualization
• Flexibility
• Evaluation
• Leadership
Careful planning is consistently reported to provide the strongest foundation for future and
ongoing implementation. Even though the National Transition Demonstration Project allowed for
Chapter 7 - Page 83

a full year of planning at the beginning of the project, some sites were more successful than others
in getting key staff hired and establishing the planning processes early in that year. A number of
sites reported that they did not really start planning until the second year, when implementation was
already underway. Key informants in these sites felt that having to plan and implement
simultaneously was an inefficient process and hindered the forward progress of the implementation.
Other sites reported that, even though the program design had to be modified early on as
implementation revealed its fallacies, the process of intensive planning served to bring participants
together, stimulate communication, and begin the creation of the shared vision. Those relationships
then were brought to bear on the modification and growth processes of the implementation period.
It was also seen as critically important for the planning to be in a strong conceptual base. The
early identification of the program’s conceptual model and underlying philosophy appeared to make
other processes move forward more readily. Program elements were then chosen and added based
on their contribution to and consistency with the underlying model. Differences of opinion and
philosophy among planners were minimized or were resolved using the conceptual model to guide
decisions. When the conceptual model was based on accepted scientific or programmatic theory,
there was added strength. Some sites deliberately built on the knowledge bases found in the research
and program literatures of education, child and family development, social work, health, and
organizational behavior. The use of these accepted theorems and practices to establish a framework
for the local Transition Demonstration Program was reported to facilitate the planning process,
adding strength to the final program design, and lending credibility where needed.
The involvement of all key participants in the planning and implementation processes was also
seen as an important factor in successful implementation. The investment of teachers and principals
in the planning process was a strong supportive factor. Many sites included teachers in the planning
of professional development activities; several sites involved teachers and principals in the
development of the developmentally appropriate curriculum to be applied in demonstration
classrooms, and most sites included both Head Start and school district personnel in the design of
the processes by which Head Start records would be transferred to the school and transition planning
meetings would be held. Those sites which utilized such participatory strategies reported that the
acceptance of the outcome and the realization of the activity were significantly strengthened by the
Chapter 7 - Page 84

inclusive process. Sites consistently report that the processes of decision-making and change,
particularly the inclusive participatory processes, required patience and time. Processes moved at
a pace that seemed slow to many, but efforts to speed the process often were reported to be
counterproductive. Some experts note that significant change in large systems takes 2 to 3 years to
occur and that institutional change, such as was advocated by the Transition Demonstration
Programs, can take as much as 5 years or longer (Fullan, 1991). In fact, many sites reported a rapid
increase in the rate of change within the schools and communities toward the end of the 5-year
implementation period.
Project leaders also indicated that individuals and organizations entered the program at various
stages of readiness for change. Through the five years of intervention, sites learned that:
• interventions designed to help teachers change classroom instructional practices needed to
be tailored to the acceptance level of the individual teacher
• some schools were more ready to embrace social support services for families and could
accommodate different programming strategies than other schools within the same site
• some schools and teachers were more ready to accept parents as full partners in decision-
making than others
• some families were more receptive to efforts to effect change, growth, and development than
were other families
This variation in readiness to change is consistent with the stages of change models used in the
behavior change literature (e.g., Prochaska & DiClemente, 1982). These models typically include
five stages through which individuals (or agencies, institutions) progress in changing behavior:
1. Precontemplation – no intention to change
2. Contemplation – intending to change but not yet ready
3. Preparation – planning to change in the immediate future
4. Action – in the process of changing
5. Maintenance – changing for a significant period of time
Research further indicates that most intervention programs assume that the individual (organization,
system) is ready to change and prematurely offer action programs, which in turn the individual
(organization, system) is less likely to accept because of lack of readiness (Prochaska, 1992). The
tailoring of intervention to the stage of change has been shown to be more effective in achieving
Chapter 7 - Page 85

individual behavior change (e.g., Prochaska, 1992). In general, sites learned over time to recognize
the degree to which schools, teachers, community agencies, families, school systems, and Head Start
programs were ready to adopt new strategies and thus to tailor program activities and interventions
to meet those various levels.
The creation of unique programs that would meet the needs of the 31 highly individual sites was
a feature of this National Transition Demonstration Project from the beginning. One site structured
the Transition Demonstration Program so that schools were offered a menu of available programs,
all falling under the umbrella of the Transition Program, and were allowed to choose those program
options perceived to meet the needs of their school population and most consistent with their
school’s goals and philosophy. Thus, the Transition Demonstration Program’s intervention in each
of the schools served by that site was very different, although linked together by overlapping
services.
Clearly, sites adopted an individualized approach to family development, devising family-
specific goals and action plans, creating individualized child transition plans, and tailoring the types
and frequency of family contacts to meet the needs of the family. The trend to individualization was
evidenced in other ways as well. Because of the differences in readiness to change and in skill levels
among teachers, sites increasingly adopted an individualized approach to professional development
to promote developmentally appropriate practices. One site had teams of teachers devise
development plans for the school year, based on their interests, needs, and the school’s improvement
goals. Another site worked individually with teachers to identify professional goals and implement
individual development plans for the school year. Other sites offered an array of professional
development opportunities and encouraged teachers to select those activities that would be most
beneficial to them.
Program leaders consistently noted during site visits that the trend to individualize the program
for schools, teachers, and families was as essential to their success as the opportunity to design a
unique intervention for their community.
Sites also noted that the process of change is a dynamic process requiring frequent adjustments -
to changes in the environment, changes in the organizations involved, changes in personnel, and
changes in needs. Successful implementation required that program developers be flexible, willing
Chapter 7 - Page 86

to modify and adapt as necessary to the changing demands and needs, while maintaining the essence
of the intervention. The existence of a strong conceptual foundation for the program was helpful in
this regard, allowing modifications to be made while maintaining the connection with the basic
conceptual framework.
The existence of a system of formative evaluation was identified by program leaders as being
valuable to implementation. The ability to monitor in an ongoing manner the program’s progress
toward achieving goals and the use of this information to modify and improve program offerings was
reported by many sites to be helpful in their success. In some sites, the monitoring systems were
established and maintained by the program staff; in other sites, the evaluation team took the lead in
completing the formative evaluation and providing feedback to the program. The most important
aspect, however, was receiving information in a timely manner and broadly throughout the local
consortium and the use of discussion and feedback to strengthen the program’s efforts.
Finally, the existence of strong and effective leadership was a cardinal feature in the successful
implementation of both the local Transition Demonstration Programs and the National Transition
Demonstration Project. Interviews with Project Directors, other program leaders in the local sites,
and ACYF staff confirm that the strongest and most successful leaders in the Transition
Demonstration effort were those who had: (1) the ability to create a broad sense of ownership
throughout the program; (2) the ability to negotiate and facilitate consensus-building decision-
making processes; and (3) the ability to communicate consistently, frequently, and effectively with
a wide range of individuals and groups. These leadership characteristics were found to be equally
important in the settings of school buildings (among school principals), in school districts (among
school superintendents and school boards), and in the Transition Demonstration Program itself
(among Transition Demonstration Program Directors).
WHAT THE DATA TELL US
A second approach to identifying factors that contributed to successful implementation involved
reviewing characteristics of sites that achieved strong implementations. A review of implementation
ratings given by the National Research Coordinating Team identified a group of 6 sites that had
consistently above average implementation ratings (the “high implementation” group) and another
group of 8 sites with consistently low implementation ratings (the “low implementation” group).
The ratings of the 14 sites are summarized in Table 15.
Chapter 7 - Page 87
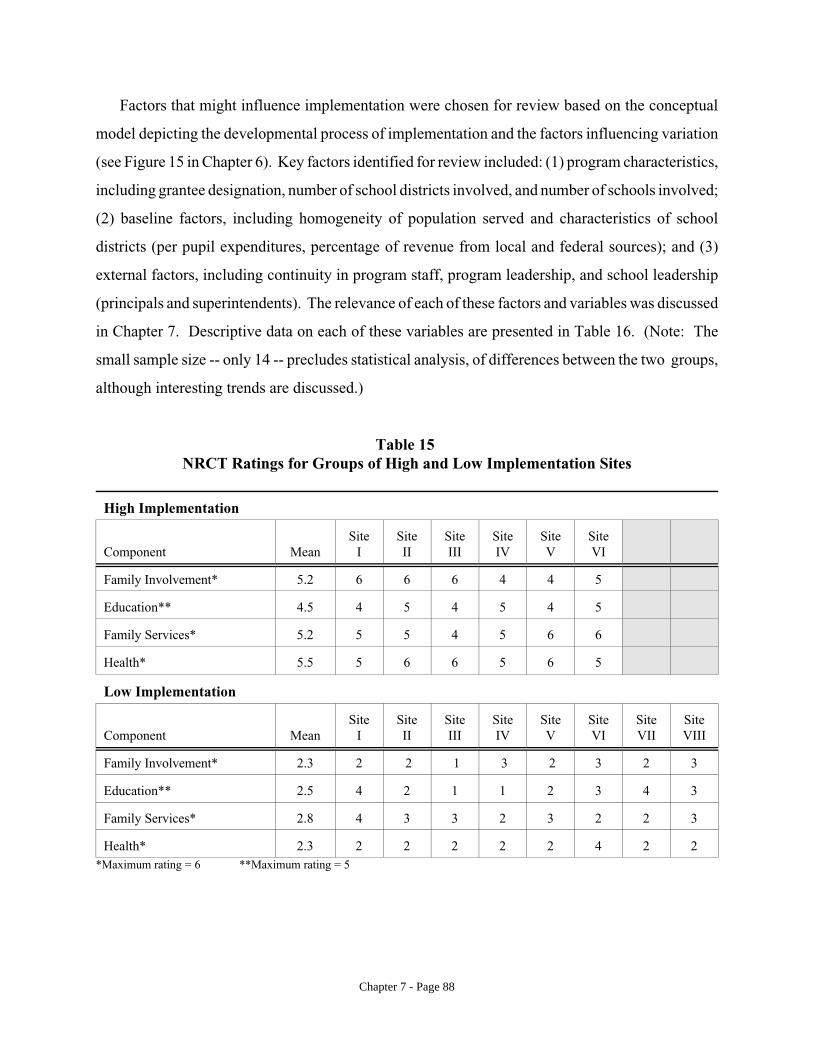
Factors that might influence implementation were chosen for review based on the conceptual
model depicting the developmental process of implementation and the factors influencing variation
(see Figure 15 in Chapter 6). Key factors identified for review included: (1) program characteristics,
including grantee designation, number of school districts involved, and number of schools involved;
(2) baseline factors, including homogeneity of population served and characteristics of school
districts (per pupil expenditures, percentage of revenue from local and federal sources); and (3)
external factors, including continuity in program staff, program leadership, and school leadership
(principals and superintendents). The relevance of each of these factors and variables was discussed
in Chapter 7. Descriptive data on each of these variables are presented in Table 16. (Note: The
small sample size -- only 14 -- precludes statistical analysis, of differences between the two groups,
although interesting trends are discussed.)
Table 15 NRCT Ratings for Groups of High and Low Implementation Sites
High Implementation
Component Mean Site
I Site II
Site III
Site IV
Site V
Site VI
Family Involvement* 5.2 6 6 6 4 4 5
Education** 4.5 4 5 4 5 4 5
Family Services* 5.2 5 5 4 5 6 6
Health* 5.5 5 6 6 5 6 5
Low Implementation
Component Mean Site
I Site II
Site III
Site IV
Site V
Site VI
Site VII
Site VIII
Family Involvement* 2.3 2 2 1 3 2 3 2 3
Education** 2.5 4 2 1 1 2 3 4 3
Family Services* 2.8 4 3 3 2 3 2 2 3
Health* 2.3 2 2 2 2 2 4 2 2 *Maximum rating = 6 **Maximum rating = 5
Chapter 7 - Page 88

Table 16 Factors Potentially Influencing Variation in Implementation *
Variable High Implementation Group
(n=6) Low Implementation Group
(n=8)
Grantee for Transition Program Head Start: 17% LEA: 83%
Head Start: 50% LEA: 50%
Number of school districts participating in Transition Program
Mean Range
1.7 1 - 3
1.1 1 - 2
Number of demonstration schools Mean Range
4.5 3 - 8
6.1 2 - 10
Previous partnership between school district and Head Start
100% 25%
Homogeneous population served by Transition Project (study sample within site composed of at least 80% of one ethnic group)
17% 63%
Per pupil expenditure for school district
Mean Range
$ 3,401 $ 3,375 - $7,419
$ 5,540 $ 2,957 - $ 8,507
Percentage of school district revenue from local sources
Mean Range
52.6% 12.9% - 89.6%
47.5% 20.9% - 85.1%
Percentage of school district revenue from federal sources
Mean Range
5.9% 0.6% - 10.5%
9.8% 2.7% - 16.9%
Percentage of children in poverty in school district
Mean Range
15.9% 2.1% - 29.0%
25.6% 4.2% - 45.3%
Changes in project director and/or coordinator
2 sites 8 sites
Changes in Head Start Director 1 site 2 sites
Changes in school superintendent(s) 4 changes in 10 districts 8 changes in 9 districts
Number of changes in Demonstration principals
7 changes in 39 reporting schools 21 changes in 29 reporting schools
* All figures represent baseline (1990-1991) unless otherwise noted (e.g., personnel changes over time) LEA (Local Education Agency)
Chapter 7 - Page 89

Program Characteristics
The data indicate that in all of the high implementation sites, there were strong relationships or
partnerships between Head Start and the public schools that preceded the Transition Demonstration
effort. In marked contrast, these pre-existing relationships were reported for only two of the low
implementation sites. The grantee for the Transition Demonstration Program did not, however, seem
to affect extent of implementation. In both groups, there were public school grantees and Head Start
grantees. In fact, it is noted that in three of the four high implementation sites with LEA grantees,
the public school system (LEA) also provided the Head Start program, either as a direct grant to the
school district or under a delegate agreement. This close, administrative relationship between public
schools and Head Start was present, however, in only two of the eight low implementation sites.
No important differences or trends were noted in the number of school districts participating in
these groups. The data do indicate, however, that low implementation sites tended to have a larger
number of demonstration schools participating. The average number of demonstration schools in
the low-implementation group (6.1) was higher than in the high-implementation group (4.5). Three
of the eight low-implementation sites worked with a considerably larger number of schools. This
suggests that the low implementation sites may have been challenged by spreading their personnel
and financial resources over a larger number of schools. (However, many of the sites rated in the
moderated level of implementation had as many or more schools per site.)
Baseline Factors
Interestingly, the majority of high implementation sites had substantial ethnic diversity served
by the Transition Program, while the majority of the low-implementation sites served more
homogeneous populations (all European American or all African American). The cultural and ethnic
diversity found within the schools served by the high implementation sites may have stimulated a
greater degree of innovation to meet the needs of children, families, and schools.
Per-pupil expenditures within the participating school districts were slightly lower for the high
implementation sites, although both groups showed wide ranges of expenditures among participating
school districts. Similarly, there were no substantial differences between the two groups in the
percentage of revenues that came from local sources. There was a somewhat greater portion of
Chapter 7 - Page 90
revenue from federal sources seen in the school districts of the low-implementation group. This is
likely related to the finding that the percentage of children in poverty in the low-implementation
school districts was 1.6 times greater than the percentage of children in poverty in the high-
implementation sites. The larger percentages of children poverty suggests eligibility for a greater
number of federally funded programs and targeted funds. It may also correspond to greater needs
to provide social and health services and more obstacles to engaging families in their children’s
education.
Leadership
Some particularly interesting differences between the low and high implementation groups were
seen in the continuity of leadership at the local site. On the average, changes in Project Director or
program coordinator, Head Start director, school district superintendents, and demonstration school
principals occurred with much greater frequency among sites in the low implementation group. High
implementation sites evidenced a notable stability in their leadership positions. This finding is
consistent with the report of sites themselves that stable and effective leadership promotes successful
implementation.
Additional insights into the occurrence of higher versus lower implementation in these groups
can be found in the data obtained during annual site visits. These data indicated that the sites in the
lower implementation group experienced significantly less cohesiveness within the local
consortium. In seven of the eight sites, there was significant and ongoing disagreement concerning
philosophy, implementation practices, and resource allocations. These disagreements resulted in
delays in planning and implementation, created discontinuity within the programs, and limited the
program’s ability to move forward across the five years. Five of the low rated eight sites had
significant difficulty reaching consensus within the consortium about many issues, in particular the
delegation of responsibility for implementation tasks. This difficulty was particularly detrimental
to the programs, given the project’s emphasis on shared decision-making and inclusive, consensus-
based processes. In contrast, program and consortium leadership in all eight of the high-
implementation sites had previous experience working in situations where shared responsibility and
consensus decision-making were hallmarks.
Chapter 7 - Page 91

SUMMARY FINDINGS
Taken together, information from key informants and observers in the sites and from the data
gathered to describe the characteristics of sites and the influences on variation indicates that several
key factors supported the successful implementation of the Transition Demonstration Programs at
the local level. The key factors that did influence success of implementation included: (1) careful
planning before and during implementation; (2) involvement of all key participants in the design and
implementation of program components; (3) a recognition and acceptance of the role that time plays
in implementation and a patience with the processes of consensus building and change; (4)
individualization of program activities to meet the needs of diverse participants, along with a
fundamental acceptance of the differences in the readiness of participants to change; (5) flexibility
and willingness to adapt to changes in the environment, the participants, or the organizations
involved in the program; (6) ongoing formative evaluation designed to provide timely feedback
about the program’s progress toward goals, with feedback used to modify and strengthen the
program; and (7) strong, consistent, leadership in the Transition Program and in the participating
schools and Head Start. In these collaborative endeavors, the ability of program leaders to build
consensus, create a shared vision and communicate that vision to others, and communicate
effectively with a wide variety of people and systems have been key factors in building successful
programs.
A comparison of the sites judged the most (6 sites) and the least (8 sites) successful in their
implementation of a strong, multi-pronged program revealed important differences in having had a
pre-existing partnership or relationship between Head Start and the school district(s), continuity in
key leadership at multiple levels, diversity in student population and somewhat less reliance on
federal program revenues, and lower rates of poverty in the school districts. Per-pupil expenditures
related mostly to proportion of poverty children and families served, but not to successful program
implementation.
Chapter 7 - Page 92

PART 3: FINDINGS
**************
8. Report of Investigations of the Comparability of Groups Prior to Outcome Analyses
9. Change in Schools and Classrooms
10. Change in Family Well-Being, Strengths, and Challenges
11. Parent Involvement in Children’s Learning and in Schools
12. Children’s Academic and Social Outcomes

OVERVIEW AND SUMMARY FINDINGS
The chapters included in Part 3: Findings summarize the results of an array of analyses
designed to answer the research questions regarding changes in children, families, classrooms,
schools, and communities as a result of participation in the Transition Demonstration Program.
Initial analyses were undertaken to identify key characteristics of the groups that would be included
in outcome analyses -- that is, the demonstration and comparison groups, the two cohorts of children
and families, and the group of families who were lost to follow-up during the study period. These
initial analyses, reported in Chapter 8, have supported a number of important assumptions that
underlie subsequent analyses. First, the children and families in the two treatment groups -
demonstration and comparison -- did not differ significantly when the National Transition
Demonstration Study began. Second, the children and families in Cohort 1 (1991-1992) did not
significantly differ from those in Cohort 2 (1992-1993). Accordingly, for final analyses and
presentation, the two cohorts have been combined.
Study sample maintenance was good: 87 percent of the children and families originally
enrolled in the study provided endpoint data in at least one of the final two years. Children and
families who were lost to follow-up (mostly due to moving) did not significantly differ in their entry
characteristics from those who remained in the study. Further, the rates of attrition were similar for
the Transition Demonstration and comparison groups.
Treatment dosage (years of participation in the Transition Demonstration) and group
crossover effects were of concern. Approximately 60 percent of those in the demonstration received
the full four years of intervention. At the same time, 25 percent received only two or fewer years
of intended treatment. Program dropout was attributable to the high mobility of this sample.
Because of this variation in length of participation, number of years in the Transition Demonstration
was considered in analyses of outcomes. In addition, 13 percent of those assigned to the comparison
group received at least one year of schooling in a Transition Demonstration school. This crossover
also was considered in analyses of outcomes.
The remaining chapters present findings about changes in schools and classrooms (Chapter
9), families (Chapter 10), parent involvement (Chapter 11), and children’s school progress (Chapter
12). Key findings are highlighted here.
Part 3 - Page ii

Children’s academic achievement, social development, and school adjustment
What do Head Start children look like?
Overall, these former Head Start children showed remarkably positive progress and school
adjustment by all indicators. Despite entering kindergarten with scores somewhat below national
norms, performance in both reading and math showed early significant gains, to the point that
children performed at national averages by the end of second and third grades. Teacher ratings of
overall academic adjustment and test scores of receptive language skills
indicated somewhat lower levels of progress, although children performed
well within the normal range. Children’s social skills, as rated by
teachers, also place them at national norms during the kindergarten year
and the subsequent three years in public school.
Both parents and children confirmed this picture of good school
progress for the overwhelming majority of former Head Start children.
Their impressions of children’s overall school adjustment, academic
performance, social development, liking school, and motivation to do well
in school -- a high value for this group of children and parents -- are
consistently positive as a group. A small subgroup of children, however,
reported early impressions of school (spring of kindergarten) that were
less favorable. For these children (7 percent of the total), their school
progress was much less favorable both academically and socially. Indeed,
the children with early non-optimal school impressions were at very high risk for special education
placement (24% in special education by third grade).
Participation in the Transition Demonstration Program did not significantly elevate
children’s academic or social outcomes above this very favorable picture. Analyses that explored
whether characteristics of the children or families interacted with intervention benefits, such that
certain groups may have benefitted more or less, did not yield any pattern of consistent results. In
general, children from families with higher levels of resources entered school with higher levels of
skills and maintained this advantage throughout the first four years in school. Children from
immigrant families showed exceptionally high social skills and rapid gains in language and literacy
Part 3 - Page iii

skills. The children who fared the most poorly -- although still showing steady progress -- were
those from families that received cash assistance, and those whose parents were not as likely to be
in the work force and whose fathers were not active in the children’s lives.
Classroom educational practices
There was limited evidence that Transition Demonstration classrooms exhibited higher
levels of developmentally appropriate practices. Demonstration classrooms had significantly, but
only slightly higher ratings, based on annual classroom observations. Specifically, Transition
Demonstration classrooms, compared to comparison classrooms, had
better arrangement and availability of classroom materials and
environments, as well as somewhat better scheduling, planning, and
variety of classroom activities. Observations of classroom practices
across grade levels confirmed that the classrooms were complex,
varied, and dynamic, both within and
across sites.
Parent involvement in education
Former Head Start parents
report being very involved with their
children’s learning at home, in terms of
providing supportive environments and
routines (such as having regular
bedtimes for children and family meals), engaging in learning
activities on a regular basis (such as reading or storytelling and
discussing what their child learned in school), and communicating
with teachers frequently. This self-report of high parental
involvement counters the negative stereotype of “uninvolved” low-
income families.
Although there was no difference, parents in the Transition
Part 3 - Page iv

Demonstration Program reported that, overall, they had more opportunities to be involved in the
schools and their children’s education. In addition to the traditional parent involvement
opportunities that were widely available to parents in all schools (such as teacher-parent conferences,
open houses, social activities for children and parents, PTA meetings), significantly more non
traditional opportunities (such as home visits from school personnel, family educational activities,
parent discussion groups, parent resource rooms, and home lending libraries) were offered to
families in the Transition Demonstration versus comparison schools.
Health, safety, and health care
Overall, former Head Start children appeared to be remarkably healthy when they entered
kindergarten, and almost all reported having satisfactory health care coverage and regular health care
providers. Only 12 percent of caregivers reported that they had no health insurance for their
children. At the end of the Transition Demonstration Study, only 40 percent of the families indicated
that their children were covered by Medicaid, and more than a third (36%) were
covered by insurance obtained as an employment benefit. With the exception of
reported rates of asthma (nearly double the national averages), children’s patterns of
illnesses, injuries, and disabilities was generally typical of the nation. The reported
rates of engaging in safety behaviors -- such as using a seatbelt or child restraint
consistently and having smoke or fire detectors in the home -- were also reported by families at rates
that are typical nationally.
Changes in family well-being
Although providing comprehensive, individualized supports for families was a high priority
for all of the 31 local Transition Demonstration programs, the level of participation in job training,
employment counseling, educational programs, cash or cash alternative assistance programs, and
mental health counseling programs cannot be attributed to participation in the
Transition Demonstration Program. Service use patterns varied by family type. For
example, the Single Parent Welfare families were more than two and a half times
as likely to participate in job training programs as were the Resourceful families
Part 3 - Page v

(Part 2 - Page V). Highly Mobile, Recently Homeless, and Single Parent Welfare families were also
more likely to participate in educational programs. Foreign Language families were strikingly less
likely to participate in external supportive programs.
Demonstration and comparison families overwhelmingly indicated that the majority of
health, social, emotional, educational and behavioral needs of their children were met and services
were obtained when needed. Demonstration families were more likely to report that “someone from
the school” helped them obtain services, usually Transition Demonstration caseworkers, while
comparison families more often indicated they obtained needed services on their own. This funding
is compatible with the belief that when . If supportive personnel are available, families take
advantage of and benefit from their supports and referrals.
Systemic change
There was strong and substantial evidence in many sites that important systemic changes did
occur. These included changes in the ways that Head Start and public schools collaborated to meet
the needs of children, in school policies to reduce barriers to parent participation, and in policies and
practices of community agencies to sustain a more coordinated and accessible service delivery
system for families during the transition-to-school years. In the majority of the participating
communities, school districts, and Head Start programs, these changes were reported to be
facilitated directly by the Transition Demonstration Program. What remains to be learned is
to what extent these consortia of community agencies, Head Start programs, and local school
partners will continue after the Federal funding for the Transition Demonstration
Program has ended.
Part 3 - Page vi

CHAPTER 8 - REPORT OF INVESTIGATIONS OF THE COMPARABILITYOF GROUPS PRIOR TO OUTCOME ANALYSES
INTRODUCTION
An understanding of the characteristics and dynamics of the sample being followed within the
National Transition Demonstration Study is essential to interpreting subsequent analyses. A series
of investigations was undertaken to: (1) identify initial differences for which adjustments should be
made; (2) determine whether or not the two cohorts could reasonably be combined for analysis
without adjustment for cohort membership; (3) determine the comparability of the group of
participants who were available for assessment at the end of the study versus those who were
irretrievably lost to follow-up at some time during the study period; and (4) review patterns of
mobility among study participants. These analyses are all closely related to one another and are
fundamental to subsequent analyses of program impact.
METHODS
Data were available from a total of 7,515 former Head Start families. The participating families
were enrolled in two cohorts, one entering kindergarten in the fall of 1992 and the second entering
kindergarten in the fall of 1993. No other family or child characteristics were employed to
determine cohort membership. Families were enrolled in the treatment (demonstration) or control
(comparison) condition based on the school within which the child enrolled in kindergarten. Schools
had been previously randomized to demonstration or comparison conditions based on randomization
plans devised and employed within the 31 local sites. Table 17 summarizes resulting sample sizes
for the two cohorts and the two treatment groups at baseline.
Families were followed longitudinally for four consecutive years, as the child progressed through
kindergarten and the first three grades of elementary school. Assessments were completed in the fall
and spring of kindergarten and in the spring of each year after. Because recruitment into the study
occurred throughout the kindergarten year, as children and families were identified as having been
Head Start participants prior to entering kindergarten, the two kindergarten assessments were
Chapter 8 - Page 93
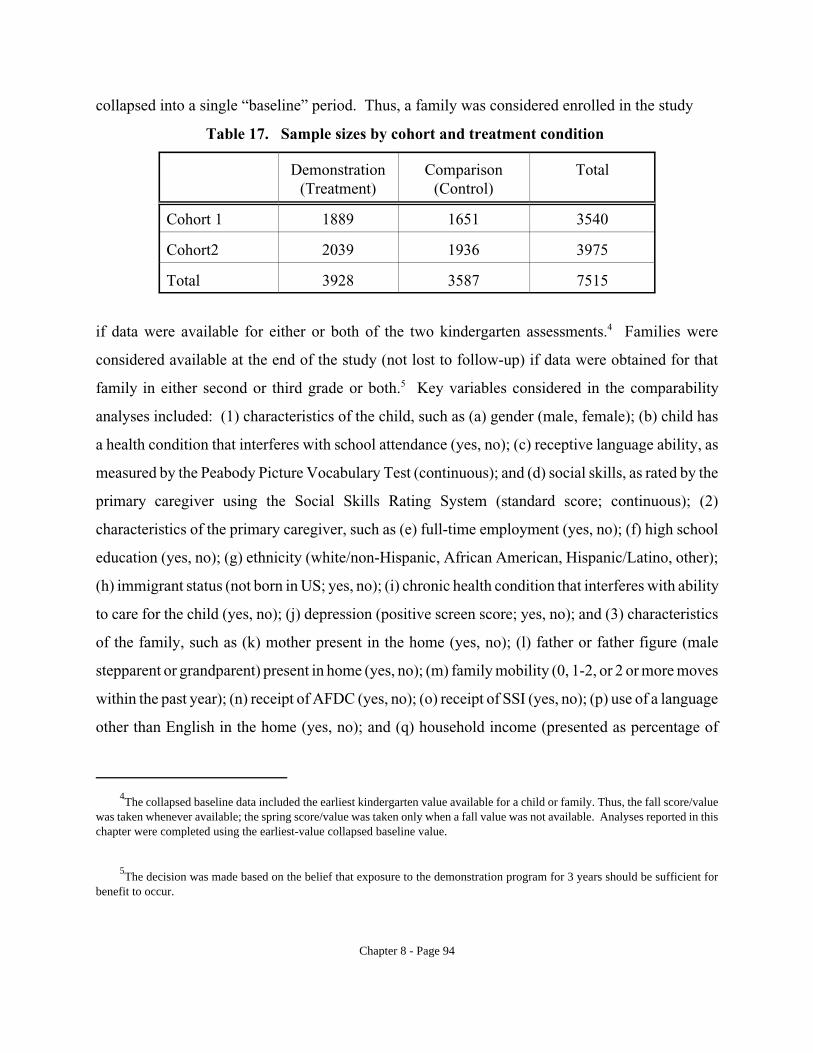
collapsed into a single “baseline” period. Thus, a family was considered enrolled in the study
Table 17. Sample sizes by cohort and treatment condition
Demonstration (Treatment)
Comparison (Control)
Total
Cohort 1 1889 1651 3540
Cohort2 2039 1936 3975
Total 3928 3587 7515
if data were available for either or both of the two kindergarten assessments.4 Families were
considered available at the end of the study (not lost to follow-up) if data were obtained for that
family in either second or third grade or both.5 Key variables considered in the comparability
analyses included: (1) characteristics of the child, such as (a) gender (male, female); (b) child has
a health condition that interferes with school attendance (yes, no); (c) receptive language ability, as
measured by the Peabody Picture Vocabulary Test (continuous); and (d) social skills, as rated by the
primary caregiver using the Social Skills Rating System (standard score; continuous); (2)
characteristics of the primary caregiver, such as (e) full-time employment (yes, no); (f) high school
education (yes, no); (g) ethnicity (white/non-Hispanic, African American, Hispanic/Latino, other);
(h) immigrant status (not born in US; yes, no); (i) chronic health condition that interferes with ability
to care for the child (yes, no); (j) depression (positive screen score; yes, no); and (3) characteristics
of the family, such as (k) mother present in the home (yes, no); (l) father or father figure (male
stepparent or grandparent) present in home (yes, no); (m) family mobility (0, 1-2, or 2 or more moves
within the past year); (n) receipt of AFDC (yes, no); (o) receipt of SSI (yes, no); (p) use of a language
other than English in the home (yes, no); and (q) household income (presented as percentage of
4The collapsed baseline data included the earliest kindergarten value available for a child or family. Thus, the fall score/value
was taken whenever available; the spring score/value was taken only when a fall value was not available. Analyses reported in this chapter were completed using the earliest-value collapsed baseline value.
5The decision was made based on the belief that exposure to the demonstration program for 3 years should be sufficient for
benefit to occur.
Chapter 8 - Page 94

poverty; continuous). These 17 variables were chosen for inclusion in comparability analyses
because they were either (1) outcome variables for primary analyses or (2) thought to be potentially
related to differential program participation and/or outcomes. The follow-up status variable was
computed as a binary variable for each family -- data exists/does not exist -- reflecting the existence
of at least some portion of the child and/or family data at either second or third grade, or both.
COMPARABILITY OF COHORTS AT BASELINE
To the extent that the two cohorts are similar at baseline, they can be reasonably joined into a
single sample without adjustment for cohort membership and resulting loss of degrees of freedom
within analyses. There was no reason to believe that children entering school in one year would be
systematically different from children entering school in the following year.
Results. A review of the analysesa indicates that the two cohorts were not substantially different
on these key characteristics (see Table 18). They were statistically different on five of the 17
variables -- two child characteristics (receptive language and social skills), two caregiver
characteristics (immigrant status and chronic health condition), and one family characteristic (family
speaks a language other than English in the home). However, the difference between the two groups
on, for example, receptive language and social skills was a single point -- a trivial difference that
achieved statistical significance because of the large sample size.
COMPARABILITY OF TREATMENT GROUPS AT BASELINE
Background. Typically, the investigation of the comparability of the treatment groups at
baseline is undertaken to validate the random assignment procedures employed. In the case of the
National Transition Demonstration Study, the random assignment occurred at the level of the school
or school district, not at the level of the child or family. Nonetheless, the baseline comparability
analysis is considered essential to the analytical process. To the extent that the two groups of
demonstration and comparison children and/or families were equivalent at baseline on key outcome
and other characteristics, any differences found at the end of the study are more likely to be the result
of program intervention, rather than undetected baseline differences.
Chapter 8 - Page 95
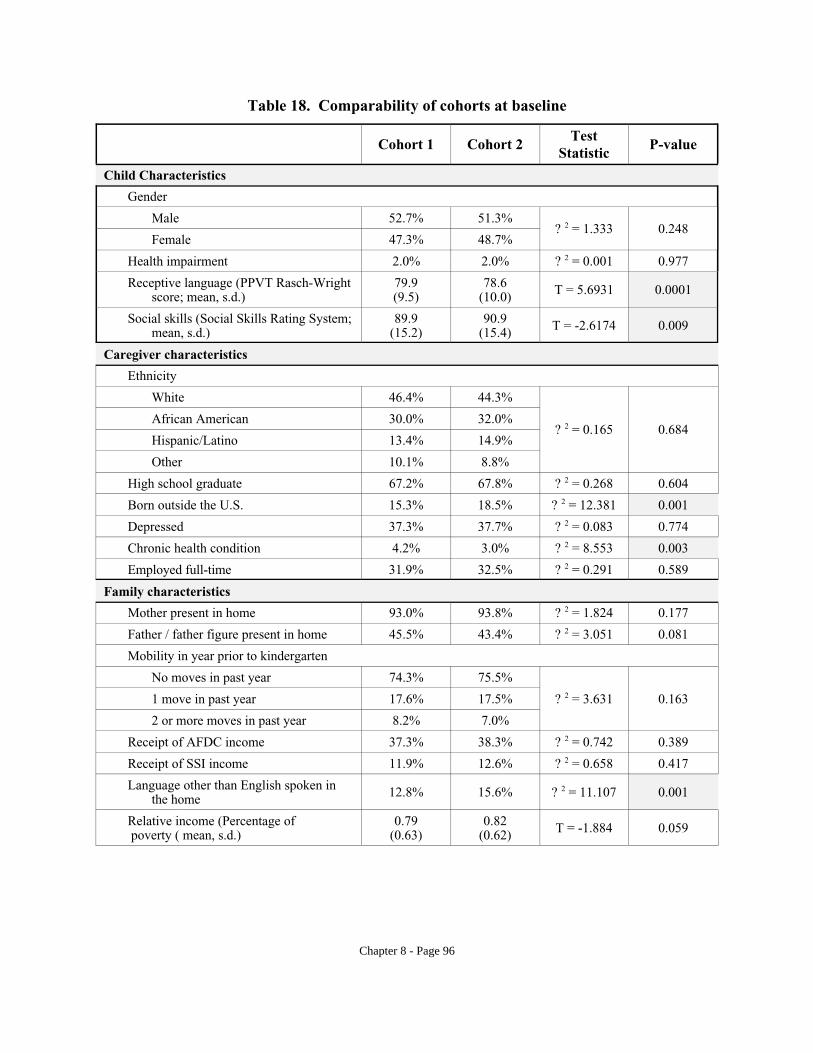
Table 18. Comparability of cohorts at baseline
Cohort 1 Cohort 2 Test
Statistic P-value
Child Characteristics
Gender
Male 52.7% 51.3% ? 2 = 1.333 0.248
Female 47.3% 48.7%
Health impairment 2.0% 2.0% ? 2 = 0.001 0.977
Receptive language (PPVT Rasch-Wright score; mean, s.d.)
79.9 (9.5)
78.6 (10.0) T = 5.6931 0.0001
Social skills (Social Skills Rating System; mean, s.d.)
89.9 (15.2)
90.9 (15.4) T = -2.6174 0.009
Caregiver characteristics
Ethnicity
White 46.4% 44.3%
African American 30.0% 32.0% ? 2 = 0.165 0.684
Hispanic/Latino 13.4% 14.9%
Other 10.1% 8.8%
High school graduate 67.2% 67.8% ? 2 = 0.268 0.604
Born outside the U.S. 15.3% 18.5% ? 2 = 12.381 0.001
Depressed 37.3% 37.7% ? 2 = 0.083 0.774
Chronic health condition 4.2% 3.0% ? 2 = 8.553 0.003
Employed full-time 31.9% 32.5% ? 2 = 0.291 0.589
Family characteristics
Mother present in home 93.0% 93.8% ? 2 = 1.824 0.177
Father / father figure present in home 45.5% 43.4% ? 2 = 3.051 0.081
Mobility in year prior to kindergarten
No moves in past year 74.3% 75.5%
1 move in past year 17.6% 17.5% ? 2 = 3.631 0.163
2 or more moves in past year 8.2% 7.0%
Receipt of AFDC income 37.3% 38.3% ? 2 = 0.742 0.389
Receipt of SSI income 11.9% 12.6% ? 2 = 0.658 0.417
Language other than English spoken in the home 12.8% 15.6% ? 2 = 11.107 0.001
Relative income (Percentage of poverty ( mean, s.d.)
0.79 (0.63)
0.82 (0.62) T = -1.884 0.059
Chapter 8 - Page 96

The results of these analysesb indicated that the two treatment groups were not different as they
entered kindergarten and the study. The demonstration and comparison groups differed statistically
on only two characteristics: children’s social skills and caregiver full-time employment. In both of
these instances, the difference between the demonstration and comparison group was very small
(social skills: 89.9 vs. 91.1. full time employment 30% vs. 34%) and not practically significant.
Table 19. Comparability of treatment groups at baseline Demonstration Comparison Test
Statistic P-value
Child Characteristics Gender
Male 52.9% 51.2% c ² = 2.017 0.156 Female 47.1% 48.8%
Health impairment 2.0% 2.0% c ² = 0.054 0.817 Receptive language (PPVT Rasch-
Wright score; mean, s.d.) 79.3 (9.5)
79.5 (9.9) t = -0.9179 0.3507
Social skills (Social Skills Rating System; mean, s.d.)
89.9 (15.4)
91.1 (15.3) t = -3.0645 0.0022
Caregiver Characteristics Ethnicity
White 44.8% 45.8% c ² = 1.937 0.509 African American 30.9% 31.2% Hispanic/Latino 14.4% 14.1% Other 9.9% 8.9%
High school graduate 66.1% 67.2% c ² = 0.947 0.330 Born outside the U.S. 16.3% 17.8% c ² = 2.705 0.100 Depressed 38.4% 36.6% c ² = 1.790 0.181 Chronic heath condition 3.6% 3.5% c ² = 0.110 0.740 Employed full-time
Family Characteristics 30.3% 33.9% c 2 = 10.49 0.001
Mother present in home 93.8% 93.1% c ² = 1.288 0.256 Father/father figure present in home 54.4% 56.1% c ² = 2.155 0.142 Mobility in year prior to Kindergarten
No moves in past year 75.3 75.8 c ² = 0.865 0.352 1 move in past year 17.0 17.4 2 or moves in past year 7.7 6.8
Receipt of AFDC income 39.1 36.3 c ² = 5.835 0.016 Receipt of SSI income 11.7 13.0 c ² = 2.206 0.137 Language other than English spoken
spoken in home 13.8 14.8 c ² = 1.472 0.225 Relative income(Percentage of
poverty (mean, s.d.) 0.79
(0.64) 0.82
(0.61) t = -1.8307 0.0672
Chapter 8 - Page 97

COMPARABILITY OF FOLLOW-UP GROUPS AT BASELINE
Background. Loss to follow-up, also referred to as attrition, has implications for all research
endeavors, but it may be particularly problematic within longitudinal studies, when specific
participants must be located and interviewed on repeated occasions (Manheim & Rich, 1991). The
threat that dropouts pose to the validity of research efforts is frequently referred to and appears to
be accepted in the literature, particularly in the area of prevention research (Cook & Campbell, 1979;
Jurs & Glass, 1971; Hansen, Collins, Malotte, Johnson, & Fielding, 1985; Farrington, Gallagher,
Morley, St. Ledger, & West, 1990). Excessively high drop-out rates decrease sample size and power
available within a study, limiting the study’s ability to demonstrate a statistically significant
difference between treatment groups (Fuller, 1990). More importantly, however, loss of subjects
poses potential threats to a study’s internal and external validity. If high risk or less successful
participants drop out of the treatment condition at a disproportionately high rate, findings may
exaggerate a difference between groups, suggesting that the intervention is effective when, in fact,
it is not (Cook & Campbell, 1979; Jurs & Glass, 1971; Farrington, Gallagher, Morley, St. Ledger,
& West, 1990; Meinert, 1986). In contrast, high risk subjects dropping out of control groups or more
successful participants dropping out of treatment groups may serve to mask program effects that are
actually present (Cook & Campbell, 1979; Jurs & Glass, 1971; Farrington, Gallagher, Morley, St.
Ledger, & West, 1990; Meinert, 1986).
The results of our investigation of attrition within the National Transition Demonstration
Study indicate that 87% of the families enrolled in the study were available for interview at the end
of the study (i.e., data collected in either second or third grade or both; see Table 20). The rate of
attrition did not differ by cohort or by treatment condition.
Chapter 8 - Page 98

Table 20. Percentage of families remaining in study
Present at End of Study
Not Present at End of Study
Cohort 1 3073 86.8%
467 13.2%
Cohort 2 3475 87.4%
500 12.6%
Demonstration 3411 86.8%
517 13.2%
Comparison 3137 87.5%
450 12.5%
We also compared the baseline characteristics of the group of families who were available
for assessment at the end of the study with the characteristics of the group of families who were not
available for interview in either second or third gradec. The two groups did not differ substantially
on the majority of the key characteristics (see Table 21). Not surprisingly, the two groups did differ
to a statistically significant degree in mobility. Families who remained available for interview at the
end of the study period were less likely to have moved within the year prior to kindergarten than
were families who had moved at least once prior to entering kindergarten.
DISCUSSION
The comparability analyses revealed few important differences between treatment groups,
cohorts, or follow-up groups. Some differences between treatment groups at baseline would be
reasonably expected, since treatment groups will be identical only on those characteristics controlled
in randomization (Meinert, 1986); because the unit of randomization employed for this study was
the school, it would not be expected that the two treatment groups would be identical on variables
related to individual child, caregiver, or family characteristics. The two groups, demonstration and
comparison, differ only in terms of two characteristics: Specifically, families with a caregiver who
has a chronic health condition and those that are mobile (moved 1 or more times in the last year) are
significantly more likely to not be included in the follow-up study.
The finding that the two cohorts are essentially equivalent at baseline in the national
sample suggests that the two groups can be collapsed into a single cohort without prejudice.
Chapter 8 - Page 99

Odds Ratio
95% Confidence interval
p-value
Child Characteristics
Gender
Male 1.0 0.90 - 1.2 0.5852
Female
Health impairment 1.1 0.7 - 1.8 0.7331
Receptive Language Ability ( Rasch-Wright Score; mean, s.d.) 1.0 0.99 - 1.01 0.2733
Social Skills (Standard Score; mean, s.d.) 1.0 0.99 - 1.01 0.4243
Caregiver Characteristics
Ethnicity
White/non-Hispanic 1.0 reference group –
African American 1.0 0.85 - 1.18 0.9873
Hispanic/Latino 0.9 0.7 - 1.18 0.5885
Other 0.8 0.62 - 1.07 0.1449
High school graduate 1.1 0.91 - 1.25 0.4498
Born outside the U.S. 0.9 0.73 - 1.09 0.2665
Caregiver depressed 0.9 0.80 - 1.12 0.5333
*Caregiver has chronic health condition that interferes with ability to care for child 0.6 0.37 - 0.96 0.0333
Caregiver employed full-time 0.9 0.78 - 1.07 0.2563
Family characteristics
Father figure present in home 1.0 0.67 - 1.60 0.8739
Mother present in home 1.1 0.82 - 1.49 0.5339
Family mobility
No moves in past year 1.0 reference group –
* 1 move in past year 1.4 1.16 - 1.66 0.0004
* 2 or more moves in past year 1.4 1.11 - 1.85 0.0059
Family receives AFDC 1.0 0.88 - 1.18 0.8470
Family receives SSI 0.9 0.75 - 1.17 0.5682
Family speaks language other than English at home 1.1 0.86 - 1.31 0.5780 *significant associations with drop-out
Table 21. Results of univariate analyses (logistic regression) predicting loss to follow-up This table shows the likelihood (odds ratios) that a particular child, caregiver, or family characteristic is significantly associated with loss or drop-out in the study.
Chapter 8 - Page 100

Taken together, the results reported above indicate that the findings from the National Transition
Demonstration Study are not likely to be compromised by either the extent of attrition from the study
or by differential attrition from treatment groups or other subgroups of participating families. The
attrition rate of 13 percent experienced within this study is well within the expected range for a
longitudinal investigation involving young families in poverty. The average attrition rate in major
surveys of American populations with follow-up periods of between 4 and 10 years has been
reported to be 47 percent (Farrington, Gallagher, Morley, St. Ledger, & West, 1990). The attrition
rate for this 5-year longitudinal investigation is well below that average rate.
PROGRAM PARTICIPATION, CROSS-OVER, AND DROP-OUT PATTERNS
It was the original intent of the program planners that children and families participating in the
demonstration group of the National Transition Demonstration Project would receive four
consecutive years of continuous, comprehensive, Head Start-like services, beginning when the
children entered kindergarten and continuing through the first four years of their elementary school
experience. Similarly, children and families enrolled in the comparison group would, by design,
receive no specific Head Start-like services for a similar period of time. Rather than randomly
assigning children and families to treatment groups, the National Transition Demonstration Project
randomly assigned schools to the treatment (demonstration) or control (comparison) condition, and
program services were offered to classrooms, families, and children within the demonstration
schools. Thus, children and families received program services when they were enrolled in
demonstration schools and did not receive such services when they were enrolled in comparison
schools or in schools not participating in the project at all.
To the extent that children and families stayed in the same demonstration school or transferred
to another demonstration school, it was possible for them to participate in the program for a full four
years. However, given the natural mobility of families with young children, and especially young
families in poverty, it was reasonable to expect that a number of demonstration families would
receive less than the full four years of treatment, and that some families who began the study in the
comparison condition might receive some benefit from some program services because the child
transferred to and enrolled in a demonstration school for some period of time. It was also expected
Chapter 8 - Page 101

that some families would withdraw from the program by virtue of moving to a school that was not
participating in the National Transition Demonstration Project at all (either as a demonstration or as
a comparison school).
To the extent that children and families received the full, intended “dose” of the program,
differential outcomes might be reasonably ascribed to program participation. If, however, a
substantial number of comparison families in fact received as many years of program services as did
demonstration families, or a substantial number of demonstration families received only a limited
quantity of program services because of later enrollment in comparison schools, then differences
between groups might be limited or obscured.
For each of the 7,515 former Head Start families participating in the National Transition
Demonstration Project, a participation “score” was created. If the child was enrolled in a
demonstration school at the time of the data collection, then one year of participation credit was
given. If the child was enrolled in a comparison school or in a school outside the study, then no
credit was given. Thus, the range of possible participation scores was zero to four years.
The key assumption in the calculation of the participation score is, of course, that the child was
enrolled in the same school for the entire year. The data available within the National Core Data Set
mandates this assumption. Reliable data are available consistently across all sites to identify the
school in which the child was enrolled at the time of the data collection. Reliable and consistent data
are not available for all sites for all years, however, to identify more precisely the number of different
schools attended by the child during a year and/or the number of months enrolled in demonstration
and/or comparison schools. Thus, the less precise assignment of years of credit is a requirement of
the data.
The key concepts of program participation, crossover, and drop-out from the program were
defined as follows:
Program participation is defined as the number of years enrolled in a demonstration school
(calculated as described above). The underlying assumption is that program services were available
to child and family as long as the child was enrolled in the school. Services could be received
actively or passively. For example, many of the services offered through the educational component
of the program (developmentally appropriate educational curriculum and instructional practices)
Chapter 8 - Page 102

would be received by all children enrolled in a participating classroom, while others (e.g., tutoring
services, adult educational programs) would be more specifically targeted and could be accepted or
refused by participating families. Similarly, social support services and many parent involvement
activities were typically offered to all families within participating classrooms but could be actively
accepted or refused, based on family need and preference. Thus, the program participation score can
be thought of as an indication of exposure to the program but should not be thought of as a measure
of quantity, intensity, or quality of program participation at the family level.
Crossover is defined as the movement of a family from one treatment condition (either
demonstration or comparison) to the other, always remaining in either a demonstration or a
comparison school. Those families who moved to a school outside the project (to a school that was
not participating as either a demonstration or comparison school) or who moved outside the
catchment area and could not be located for interview or assessment for a period of time were
defined as drop-outs from the study. Study drop-out, as defined here, overlaps with but is not
synonymous with loss to follow-up within the National Transition Demonstration Study. Loss to
follow-up is defined as those children and families for whom there is no available data for either the
third or the fourth year in school. Families who are lost to follow-up are a portion of the group who
dropped out of the program. That group of drop-out families also includes, however, families who
moved to a non-study school for one or more years but remained available for interview and families
who moved outside the catchment area for one or more years but returned and/or were available for
interview or assessment in either the third or the fourth year of school. The key feature of drop-out
families is that they moved to a school outside the study for some period of time, limiting their
possible exposure to Transition or Transition-like services. Unless otherwise specified, analyses
reported in Chapters 9 through 12 utilized all available data, that is, children and/or families were
included regardless of their cross-over or drop-out status. Those families and children who were lost
to follow-up (i.e., had no data in either of the last 2 years of the study) were excluded from analysis.
Chapter 8 - Page 103
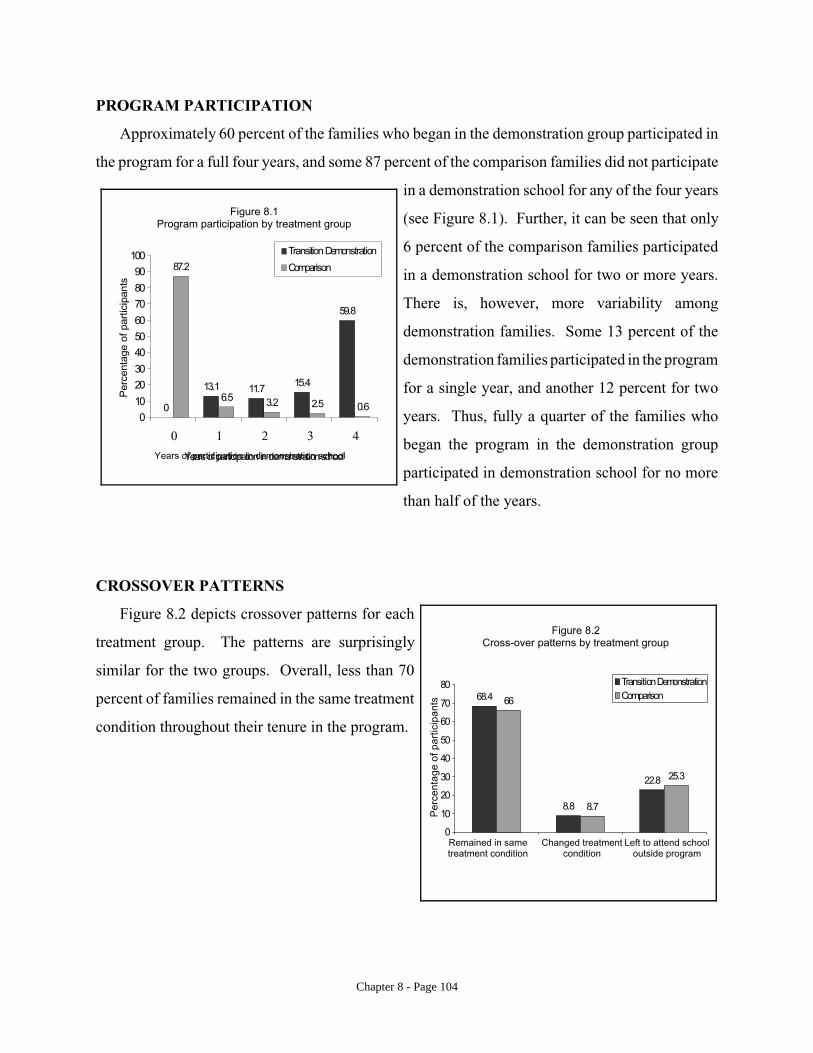
PROGRAM PARTICIPATION
Approximately 60 percent of the families who began in the demonstration group participated in
the program for a full four years, and some 87 percent of the comparison families did not participate
n a demonstration school for any of the four years
see Figure 8.1). Further, it can be seen that only
6 percent of the comparison families participated
n a demonstration school for two or more years.
There is, however, more variability among
demonstration families. Some 13 percent of the
demonstration families participated in the program
or a single year, and another 12 percent for two
years. Thus, fully a quarter of the families who
began the program in the demonstration group
participated in demonstration school for no more
han half of the years.
iFigure 8.1 (Program participation by treatment group
Transition Demonstration
Comparison 100
87.290 i
f
80
70 59.8
60
50
40
30
20 13.1 11.7 15.4 6.510 3.2 2.5 0.60
0
0 1 2 3 4
Years of participation in demonstration schoolYears of participation indemonstrationschool
Per
cent
age
of p
artic
ipan
ts
t
CROSSOVER PATTERNS
Figure 8.2 depicts crossover patterns for each
treatment group. The patterns are surprisingly
similar for the two groups. Overall, less than 70
percent of families remained in the same treatment
condition throughout their tenure in the program.
Figure 8.2 Cross-over patterns by treatment group
80 TransitionDemonstration Comparison68.4 6670
60
Per
cent
age
of p
artic
ipan
ts
50
40
30 22.8 25.3
20 8.8 8.7
10
0 Remained in same Changed treatment Left to attend school treatment condition condition outside program
Chapter 8 - Page 104
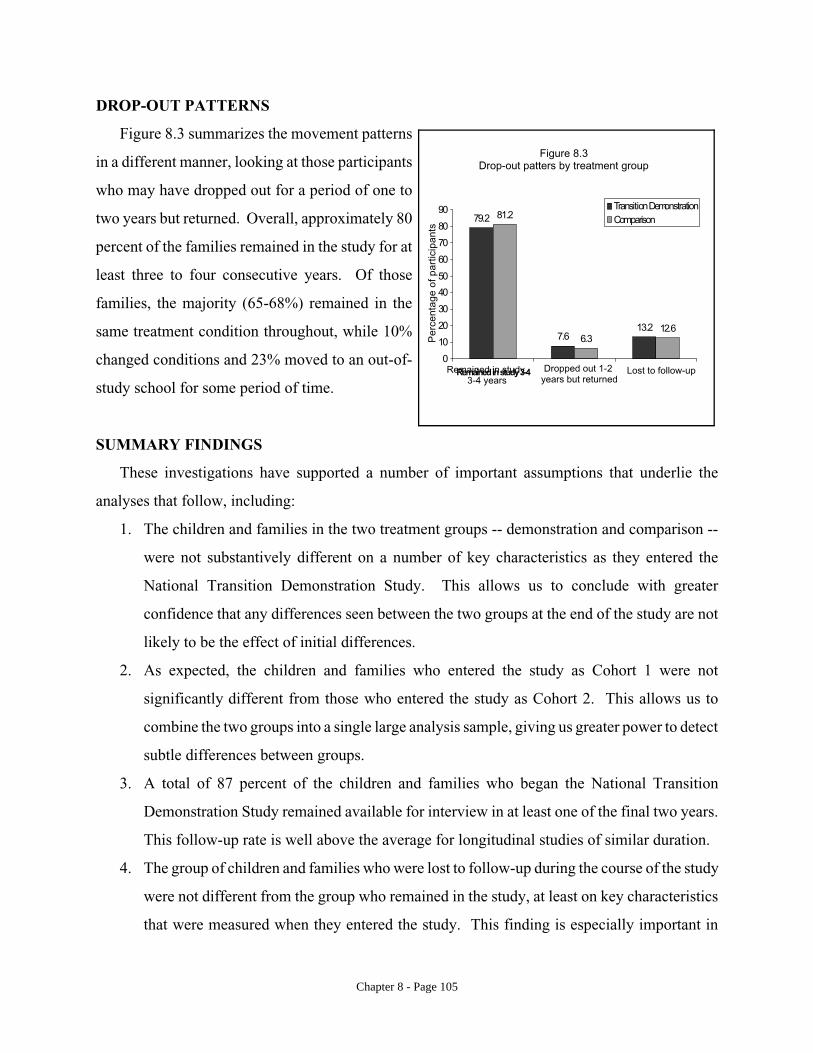
Per
cent
age
of p
artic
ipan
ts
Figure 8.3 Figure 8.3 Drop-out patters by treatment group
90 79.2 81.2
80
70
60
50
40
30
20
10
Transition Demonstration Comparison
13.2 12.6 7.6 6.3
0 Remained in study Dropped out 1-2 Lost to follow-up
3-4 years years but returnedRemained in study 3-4
DROP-OUT PATTERNS
Figure 8.3 summarizes the movement patterns
in a different manner, looking at those participants
who may have dropped out for a period of one to
two years but returned. Overall, approximately 80
percent of the families remained in the study for at
least three to four consecutive years. Of those
families, the majority (65-68%) remained in the
same treatment condition throughout, while 10%
changed conditions and 23% moved to an out-of
study school for some period of time.
SUMMARY FINDINGS
These investigations have supported a number of important assumptions that underlie the
analyses that follow, including:
1. The children and families in the two treatment groups -- demonstration and comparison -
were not substantively different on a number of key characteristics as they entered the
National Transition Demonstration Study. This allows us to conclude with greater
confidence that any differences seen between the two groups at the end of the study are not
likely to be the effect of initial differences.
2. As expected, the children and families who entered the study as Cohort 1 were not
significantly different from those who entered the study as Cohort 2. This allows us to
combine the two groups into a single large analysis sample, giving us greater power to detect
subtle differences between groups.
3. A total of 87 percent of the children and families who began the National Transition
Demonstration Study remained available for interview in at least one of the final two years.
This follow-up rate is well above the average for longitudinal studies of similar duration.
4. The group of children and families who were lost to follow-up during the course of the study
were not different from the group who remained in the study, at least on key characteristics
that were measured when they entered the study. This finding is especially important in
Chapter 8 - Page 105

terms of the validity of the study and our ability to have confidence in its findings.
5. Approximately 60 percent of the families who began in the demonstration group remained
in a demonstration school for the full four years, receiving the full “dose” of Transition
services. Fully a quarter of the families who began the program in the demonstration group
participated in the demonstration school for no more than half of the years. This suggests
that the exposure of children and families to Transition demonstration services may have
been somewhat diluted or limited.
Chapter 8 - Page 106

END NOTES, CHAPTER 8
a. Chi-square analyses were used when variables were categorical (nominal) (child gender, health impairment, ethnicity, caregiver education, immigrant status, caregiver depression, chronic health condition of caregiver, employment, mother present in home, father figure present in home, family mobility, AFDC receipt, SSI receipt, language) and t-tests were used when variables were continuous (receptive language score, social skills score, distance from poverty cut-off). Analyses were completed using the former Head Start analysis sample (n = 7,515) with casewise deletion because of missing data. For a discussion of missing data (extent and patterns), the reader is referred to Technical Report # 7.
b. As above.
c. Analyses were completed using the former Head Start analysis set (n = 7,515) and univariate logistic regression models. Loss to follow-up (defined as family enrolled at baseline but not present in either second or third grade) was included as the dependent variable; a single independent predictor variable was included in each model. Associations were not adjusted for treatment condition. The PROC LOGISTIC procedure in SAS was used for all analyses.
Chapter 8 - Page 107

CHAPTER 9 - CHANGE IN SCHOOLS AND CLASSROOMS
INTRODUCTION
The National Transition Demonstration Project was designed to have an impact on several key
elements of schools and how they interact with preschool and community agencies, families, and
children. Previous research has established the importance of examining perceptions held by
parents, teachers, principals, and students concerning the environmental and organizational features
of a school. Such features have been labeled “school climate.” Individual and group perceptions
of school climate directly influence attitudes and expectations which, in turn, may influence behavior
within the school. Available cross-sectional research has established a predictive relationship
between perceptions of school climate and academic achievement. The National Transition
Demonstration Study provided longitudinal data to explore the year by year perceptions of the
elementary school climate as well as the association between school climate and children’s
academic achievement and social behavior. Additionally, information was gathered each year from
principals and teachers concerning the existence of specific transition supports available for children
and families. This chapter addresses these aspects of the Transition Demonstration effort.
SOURCES OF INFORMATION
Information about schools was obtained in the spring of each school year via (1) interviews with
families, (2) questionnaires completed by principals and teachers, and (3) reviews of children’s
school records. In addition, supplemental (“exit”) questionnaires were completed by teachers and
principals in the final year of their participation in the Transition Demonstration Project. These
sources of information have provided much of the information available to describe the baseline
status of the schools and the changes that occurred over time. Specific instruments included:
School Climate Survey (Kelley, et al, 1986), administered in the spring of each school year
(1993 through 1997), with families, teachers, and principals serving as informants. This
instrument was created to measure perceptions of how the community feels about the school.
Respondents are asked to rate how much ‘most people’ would agree with given statements
Chapter 9 - Page 108

about the school environment. Examples are:
“Teachers treat each student as an individual.”
“The administrators in this school talk often with teachers and parents.”
“Parents and members of the community attend school meetings and other activities.”
The shortened survey yields 9 subscales: Teacher-Student Relationships, Security and
Maintenance, Administration, Student Academic Orientation, Student Behavioral Values,
Student-Peer Relationships, Instructional Management, and Student Activities.
The School Survey of Early Childhood Programs (RMC Research Corporation, 1989),
developed to seek information from teachers and principals about the availability of special
transition supports in school programs serving kindergarten or pre-kindergarten children. Part
A seeks information about the school and community context, such as the total enrollment
and the number of students eligible for and participating in Chapter 1 or reduced-price meal
programs. Part B provides information about characteristics of all kindergarten and first
grade programs in the school, including staff development programs, use of standardized
testing, and opportunities available for parent participation in school activities and
governance. Part C explores the continuity of children’s experiences as they enter public
school kindergarten, focusing on the sharing of information about individual children
between teachers and the coordination of curriculum. Principals completed all parts of the
survey; teachers completed Part C only.
The Assessment Profile for Early Childhood Classrooms, Research Version (Abbott-Shim
& Sibley, 1991), designed to assess elements of developmentally appropriate practices in
preschool and primary grade classrooms via a checklist of observed characteristics and
interactions. Direct observation of each classroom for a period of at least one hour, in
addition to a short interview with the teacher, provides information about: the Learning
Environment (the availability, variety, and appropriateness of learning materials and space);
Scheduling (evidence of a schedule that balances a variety of instructional activities);
Interacting (the quality of teacher-child interactions and the nature of classroom management
strategies); Curriculum (the type and nature of instructional delivery); and Individualizing
(the nature and use of assessment).
Chapter 9 - Page 109

SCHOOL CLIMATE
The perceptions of school climate were analyzed separately for the various respondents -
families, principals, and teachers.
Family perceptions. Overall, families were highly positive about their schools, even in the first
years of their participation.a On a scale of 1 to 5, with 1 being “strongly disagree” and 5 being
“strongly agree” (with positively-worded statements), families endorsed positive statements about
their schools in all areas questioned (see Table 21). They were least positive, however, about
statements regarding Student Behavioral Values (perceptions about the level of appropriate student
behaviors in the school and classroom), with scores in the neutral range (neither agreeing or
disagreeing with the statements). Of all the domains, Student Behavioral Values also displayed the
widest variation among the respondents. Family members’ perceptions of schools did not change
appreciably over time in either demonstration or comparison schools -- that is, they remained
positive over the first four years of elementary school. In kindergarten, ratings of school climate
were comparable in the demonstration and comparison schools.
Teacher perceptions. Teachers reported a similar pattern of positive perceptions (see Table
22).b Like families, they were generally positive about most aspects of the school environment,
regardless of whether the school was a demonstration or comparison school. They rated Teacher-
Student Relationships (teacher attitudes and behaviors toward students) as more positive than did
parents, and were more neutral than were parents concerning Instructional Management (the extent
to which teacher time can be focused on instruction). Teachers were most uniform in their high
appraisal of Teacher-Student Relationships and differed the most in their ratings of Instructional
Management. Teachers’ perceptions of school climate, like those of families, did not change
significantly over the course of the study. It is important to remember, however, that different
groups of teachers provided information each year -- that is, kindergarten teachers were the only ones
who provided the first year perceptions, while predominantly third grade teachers provided the final
year perceptions.
Chapter 9 - Page 110

Table 22. Perceptions of school climate as expressed by families, teachers and principals over time. [Expressed as average ratings, scale = 1 (strongly disagree) to 5 (strongly agree) with positively-worded statements] D = Demonstration schools; C = Comparison schools
Families Teachers Principals
D C D C D C
Teacher-Student Relationships
First year 4.0 4.0 4.4 4.4 4.4 4.4
Final year 4.0 4.0 4.3 4.4 4.5 4.4
Security & Maintenance
First year 4.2 4.2 4.1 4.1 4.4 4.4
Final year 4.2 4.2 4.1 4.1 4.4 4.4
Administration
First year 4.0 4.0 4.2 4.2 4.6 4.6
Final year 3.9 4.0 4.1 4.2 4.7 4.7
Student Academic Orientation
First year 4.1 4.1 4.0 4.1 4.3 42
Final year 4.1 4.1 3.9 4.0 4.2 4.2
Student Behavioral Values
First year 2.8 2.8 3.1 3.1 3.5 3.5
Final year 2.8 3.0 3.1 3.1 3.8 3.6
Student-Peer Relationships
First year 3.8 3.8 3.9 3.9 4.1 4.0
Final year 3.8 3.9 3.8 3.9 4.2 4.1
Instructional Management
First year 3.9 3.9 3.2 3.3 3.6 3.6
Final year 3.9 4.0 3.1 3.3 3.7 3.7
Student Activities
First year 4.1 4.1 3.9 4.0 4.2 4.2
Final year 4.0 4.0 3.9 4.0 4.2 4.2
Chapter 9 - Page 111

Principal perceptions. Principals’ perceptions of school climate were the most positive of the
three informant groups.c Principals provided the highest average ratings for all domains, with the
exception of a higher rating by parents in the area of Instructional Management. Like teachers and
parents, principals were less positive when rating Student Behavioral Values. They were also less
favorable about Instructional Management than about some other areas. Principals were the most
positive about the school’s performance in the area of Administration (the extent to which the
administrators set appropriate standards, serve as appropriate role models, and assure appropriate
communication), rating this area the highest of all and significantly higher than did families or
teachers. Again, principals’ perceptions did not differ significantly over time or by treatment group.
TRANSITION PRACTICES
Principals and teachers provided information concerning transition practices in operation
throughout program implementation. Respondents were asked to estimate the percentage of students
in their school who received particular types of supports. Principals from demonstration schools
reported a slightly more positive set of transition practices than did those from comparison schools,
although these were not statistically significant. Specifically, more demonstration principals
estimated that the majority of students in their schools had shared information when they entered
kindergarten, and that they had help with transition or adjustment. Nonetheless, even in
demonstration schools -- where there had been 5 years of program implementation -- theses types
of supports were available in less than one-third of the schools.
Teachers indicated how often communication of information about students occurred and how
often curricula were coordinated across the elementary school grades.d A total of 866 teachers (431
demonstration, 435 comparison) provided data (see Table 23). Demonstration teachers reported
somewhat greater communication with former teachers concerning both individual children and the
curriculum, but these differences were not statistically significant. For both demonstration and
comparison groups, more than 40 percent of the teachers reported that curriculum was coordinated
across grade levels -- indicating active efforts within schools to provide continuity in educational
experiences for young students.
These findings indicate a trend in the expected direction. That is, in demonstration schools,
Chapter 9 - Page 112

Table 23. Transition practices as reported by principals and teachers at the end of program (5 years after program was started)
principals and teachers reported somewhat higher levels of communication and coordination with
preschool programs, as well as greater provision of transition supports, although not statistically
significant.
Percentage of students for which service is provided
0-25% (Very few students receive service)
75-100% (Majority of students receive service)
Joint workshops occur with preschool programs
Demonstration principals 46.6% 11.0%
Comparison principals 59.5% 12.1%
Information shared about children entering kindergarten
Demonstration principals 32.0% 29.2%
Comparison principals 33.5% 20.8%
Help with transition is provided for children and families
Demonstration principals 23.1% 33.3%
Comparison principals 24.3% 29.5%
Adjustment help is provided for students
Demonstration principals 37.4% 26.5%
Comparison principals 41.0% 19.7%
Communication with previous teacher about children
Demonstration teachers 21.1% 39.7%
Comparison teachers 24.8% 32.9%
Communication with previous teacher about curriculum
Demonstration teachers 26.8% 33.3%
Comparison teachers 31.1% 27.9%
Coordination of curriculum
Demonstration teachers 22.3% 41.1%
Comparison teachers 24.8% 41.5%
Chapter 9 - Page 113

CHANGE IN CLASSROOMS
The classroom environment and teaching practices are considered potentially important
influences on children’s academic progress and social adjustment. The National Association for the
Education of Young Children (NAEYC) has proposed guidelines for optimal classroom planning
and functioning for young children from birth through age eight (c.f., Bredekamp, 1987, 1998).
These guidelines, known as “developmentally appropriate practices” (DAP) have been designed to
facilitate developmental responsivity and contextual sensitivity within classrooms. Unfortunately,
there is an absence of rigorous studies that document the levels of implementation of DAP across
kindergarten through third grade for a large, representative sample of classrooms or that evaluate the
relative benefits (or potential limitations) of DAP as recommended by NAEYC.
Developmentally appropriate practices (DAP) in the classrooms
Scores for the five scales of the Assessment Profile (originally developed to measure DAP in
preschool and kindergarten settings) were available annually for both the demonstration and
comparison classrooms (see Figure 9.1). An analysis of these data (using multivariate analysis of
variance) indicates that scores for demonstration classrooms were significantly higher than for
comparison classrooms for each of the five subscales.e The largest difference between types of
classrooms was found in their Learning Environment (mean difference = 0.9; p < 0.001). This
suggests that demonstration classrooms provided greater accessibility to a range of curriculum
materials and had more clearly defined working/learning areas than did comparison classrooms. In
practical terms, however, the small magnitude of the difference (less than 1 point) is not sufficient
to be considered meaningful.
Across grades, the pattern of scores varied by subscale. For example, scores for the Learning
Environment scale decreased for every grade, reflecting decreased availability of certain types of
learning materials and reduced use of partitioned spaces by third grade. Scores for Scheduling (the
extent to which scheduling of activities and instructional planning is evident and reflects a variety
of activities) showed a significant drop between kindergarten to first grade, but then increased for
second and third grades. The Curriculum scale measures the extent to which teachers use a variety
of techniques to facilitate learning of different skills and to support individual learners. Scores on
Chapter 9 - Page 114

Figure 9.1. Scaled scores from Assessment Profile subscales, by treatment group and over time Observations of Classroom SchedulingObservation of Classroom Observations of Classroom Scheduling
Learning Environment 5154 Demonstration
ComparisonDemonstration 50
52 Comparison
4950
4848
4746
4644
4542Kindergarten First Grade Second Grade Third Grade Kindergarten First Grade SecondGrade ThirdGrade
Observations of Classroom Curriculum
4851.5
47 51
50.5 46
50
45 Demonstration 49.5Comparison 49
4448.5
43 48
47.5 42
47
46.5
Kindergarten FirstGrade SecondGrade ThirdGrade 46
41
Obse ti fClassroom Indi iduali ingObservations of Classroom Individualizing
50.5 Demonstration
50 Comparison
49.5
49
48.5
48
47.5
47
46.5
46
45.5 Kindergarten FirstGrade Second Grade ThirdGrade
Observations of Classroom Interacting
Demonstration Comparison
Kindergarten First Grade Second Grade Third Grade
Chapter 9 - Page 115

this subscale declined between kindergarten and first grade and subsequently increased between first
and third grades. With the exception of the Individualizing scale (which showed a reversal between
comparison and demonstration classrooms in the first and second grade), the pattern of change across
grades was similar for the demonstration and comparison groups.
Overall, 17 of 31 sites had significant differences between demonstration and comparison
classrooms, but they were divided as to whether they favored the Demonstration or Comparison
classrooms.
SUMMARY FINDINGS
These analyses suggest that classroom practices represent a complex and dynamic construct
within and across the sites. Results indicate that classrooms in demonstration schools were observed
to have slightly better arrangement and availability of classroom materials and environments, as well
as somewhat better evidence of scheduling, planning, and variety of classroom activities than were
classrooms in the comparison schools. Whether the observed levels of implementing these aspects
of classroom practices are “ideal” or “optimal” is unknown, largely because there are no quantitative,
objective standards or national norms or studies indicating that these classroom practices produce
significant differences in children’s learning.
Chapter 9 - Page 116

ENDNOTES, CHAPTER 9
a. While there was some variability in the quantity of usable data across domains, family responses to the School Climate Survey were available from 5,900 parents at kindergarten, 5,300 parents at first and second grades, and 2,700 parents at third grade. The large drop in numbers for third grade was due to this instrument being voluntarily administered by the sites that year, while it was required in the earlier years. A slightly greater percentage of the respondents were from the demonstration group at each grade for each domain. The marked decline in the number of respondents during third grade is attributed to the School Climate Survey being made optional for local sites during third grade.
Results reported in this section are based on repeated measures analysis of variance applied to cases with complete longitudinal data (four years) available within a given domain. Sample sizes for these analyses ranged from 1,605 family respondents (806 demonstration, 799 comparison) for the Security and Maintenance domain to 1,026 (527 demonstration, 499 comparison) respondents for the Administration domain. Supplemental analyses were also conducted on those cases with complete longitudinal data available for all eight domains. The resulting data set included 559 respondents (293 demonstration, 266 comparison). Means and inferential conclusions based on this truncated data set are similar to results of the more inclusive data set. Complete analyses are available in Technical Report # 4.
b. While there was some variability regarding sample sizes within the domain due to fluctuation in the amount of usable data, analyses reported in this section are based on repeated measures analysis of variance applied to responses from approximately 650 kindergarten teachers in 1993, approximately 1,400 kindergarten or first grade teachers in 1994, approximately 1,600 first or second grade teachers in 1995, approximately 1,670 second or third grade teachers in 1996, and approximately 850 third grade teachers in 1997. These numbers were distributed evenly between demonstration and comparison classrooms.
c. Data were collected from approximately 450 principals each year. While there was some variability regarding the sample sizes within domain due to fluctuations in the amount of usable data, analyses reported in this section are based on repeated measures analysis of variance applied to responses from 263 principals from whom longitudinal data was available from 1993 to 1997 and who remained within the same school across this time period. Principals were approximately evenly distributed between demonstration and comparison assignments.
d. Information for these analyses was available form a total of 866 teachers (431 demonstration, 435 comparison). These teachers were primarily third grade teachers who responded in their final year of program participation. Although both teachers and principals responded to these questions, only the responses from teachers were analyzed, since it was believed that teachers would be more familiar with the nature and extent of interactive communications concerning children and curriculum. Chi-square analyses were used to assess the association of the school’s treatment condition with the categorical response variables.
e. Assessment Profiles were completed on 5,329 classrooms (2,707 demonstration, 2,622 comparison). Data were collected in 1,023 kindergarten, 1,436 first grade, 1,548 second grade, and 1,322 third grade classrooms. A slightly greater percentage of data was collected from demonstration classrooms in kindergarten, second, and third grades. Analyses reported in this section are based on a factorial multivariate analysis of variance with grade and comparison group as the between-subjects factors. Greater detail concerning the analyses is provided in Technical Report #4.
Chapter 9 - Page 117

CHAPTER 10 - CHANGES IN FAMILY WELL-BEING,STRENGTHS, AND CHALLENGES
INTRODUCTION
The family services component of the National Transition Demonstration Program was designed
to help strengthen families to realize personalized goals. To this end, family service workers were
employed to help families deal with crises, secure basic services (medical, dental, child care), set
intermediate and long-term goals for personal and family growth, and participate in relevant
educational and training programs. This chapter concerns the extent to which families reported
receiving additional services and supports, on a yearly basis, and how they gained access to these.
Analyses concerning differential service patterns for the demonstration and comparison groups are
reported first, followed by subsequent analyses about use patterns among different family types.
SOURCES OF INFORMATION
Information about family well-being was obtained from family informants in the fall and spring
of kindergarten, and in the spring of each year thereafter for three consecutive years. Two
instruments served as the primary sources of information, including:
* The Family Background Interview, developed for the National Transition Demonstration Study,
included questions about family income and a wide array of support services including educational
programs, job counseling and training, financial assistance, health services, and other support
programs.
* The Supplemental Interview for Families, also developed for the National Transition
Demonstration Study, concerned the assistance that families received in gaining access to services
for children and adults in the family.
Chapter 10 - Page 118
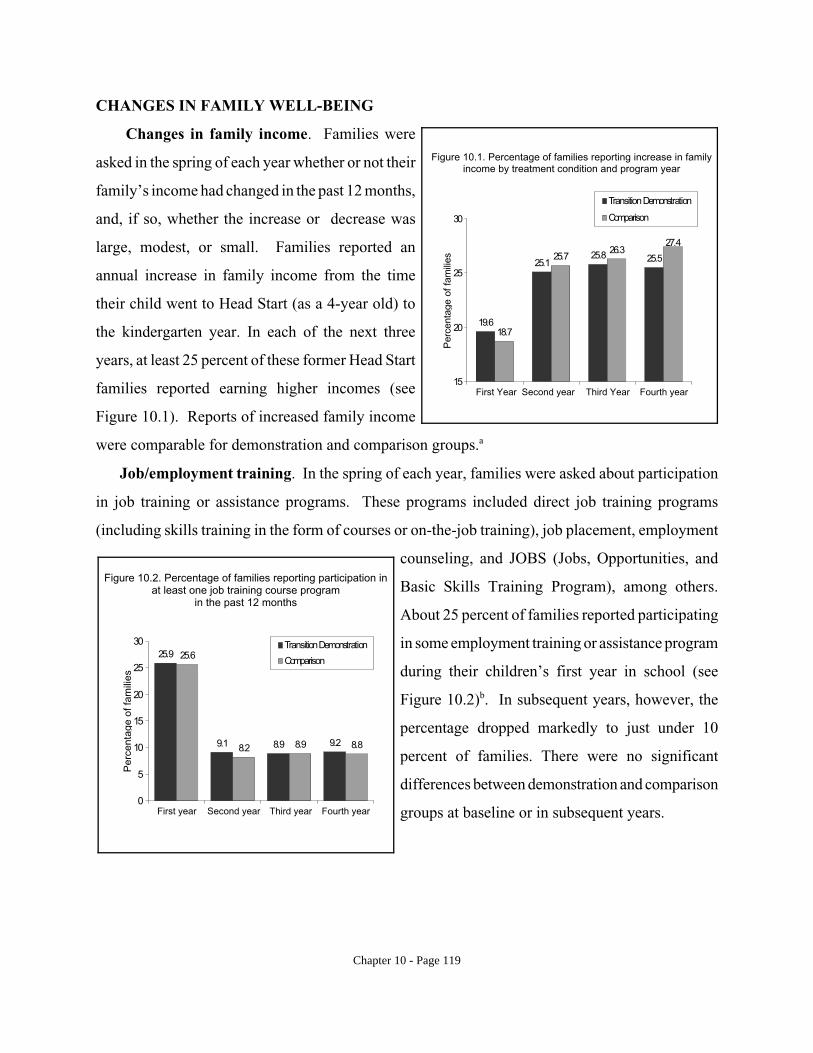
CHANGES IN FAMILY WELL-BEING
Changes in family income. Families were
asked in the spring of each year whether or not their
family’s income had changed in the past 12 months,
and, if so, whether the increase or decrease was
large, modest, or small. Families reported an
annual increase in family income from the time
their child went to Head Start (as a 4-year old) to
the kindergarten year. In each of the next three
years, at least 25 percent of these former Head Start
families reported earning higher incomes (see
Figure 10.1). Reports of increased family income
19.6
25.1 25.8 25.5
18.7
25.7 26.3
27.4
15
20
25
30
Per
cent
age
of fa
mili
es
Transition Demonstration
Comparison
Figure 10.1. Percentage of families reporting increase in family income by treatment condition and program year
First Year Second year Third Year Fourth year
were comparable for demonstration and comparison groups.a
Job/employment training. In the spring of each year, families were asked about participation
in job training or assistance programs. These programs included direct job training programs
(including skills training in the form of courses or on-the-job training), job placement, employment
counseling, and JOBS (Jobs, Opportunities, and
Basic Skills Training Program), among others.
About 25 percent of families reported participating
in some employment training or assistance program
during their children’s first year in school (see
Figure 10.2)b. In subsequent years, however, the
percentage dropped markedly to just under 10
percent of families. There were no significant
differences between demonstration and comparison
groups at baseline or in subsequent years.
25.9
9.1 8.9 9.2
25.6
8.2 8.9 8.8
0
5
10
15
20
25
30
Per
cent
age
of fa
mili
es
TransitionDemonstration
Comparison
Figure 10.2. Percentage of families reporting participation in at least one job training course program
in the past 12 months
First year Second year Third year Fourth year
Chapter 10 - Page 119

Educational programs. Family informants
indicated which, if any, educational programs they
had received during the past year. Examples of
these programs include GED preparation, literacy
or adult reading, English as a Second Language,
government training, vocational technical school,
community college or junior college, and four-year
college or university programs or courses. Each
year, between 20 to 25 percent of families reported
participating in some adult education program (see
Figure 10.3).c In all years, slightly more of the
22.4 24.5
25.8
21.8 21.1 22.422.8
19.8
0
5
10
15
20
25
30
First year Second year
Per
cent
age
of fa
mili
es
Transition Demonstration
Comparison
Figure 10.3. Percentage of families reporting participating in at least one educational program in the past 12 months
First year Second year Third year Fourth year
demonstration families reported participating in educational programs (2-3 % higher).
77.8
71.9
68.2 67.0
76.0
69.2
65.5 63.6
50
55
60
65
70
75
80
Per
cent
age
of fa
mili
es
Transition Demonstration
Comparison
Figure 10.4. Percentage of families reporting participation in family income support program (AFDC and/or SSI)
in the past 12 months
First year Second year Third year Fourth year
Family Support Programs. Families reported
about receipt of a variety of other family support
programs, including cash or cash-alternative
programs (e.g., AFDC, SSI, food stamps),
counseling (e.g., substance abuse, mental health),
housing-related assistance (e.g., public housing),
energy programs, and others. In the first year, more
than 75 percent of the former Head Start families
received at least one type of family assistance,
although by the end of the fourth year, participation
rates dropped to approximately 65 percent (see
Figure 10.4).d This trend is consistent with the interpretation that these families are becoming more
self-sufficient over time. It is also noted that slightly more demonstration families report receiving
benefits of a variety of family assistance activities each year. This suggests that the Transition
Demonstration Program, probably through the efforts of the Family Service Workers, assisted and/or
encourages families to participate in such programs.
Chapter 10 - Page 120

Specific types of services reported by families. Much of the decline in the percentage of
families who reported receiving assistance is attributable to declines in AFDC and/or SSI payment
received to supplement household income (see Table 24). Similarly, there was a large decline in
nutritional services (WIC and/or food stamps) in families.
Table 24. Percentage of former Head Start families reporting services by type by year
SERVICES First year Second year Third year Fourth year
Employment assistance
Demonstration 25.8% 9.1% 8.9% 9.2%
Comparison 15.4% 8.1% 9.9% 8.8%
Cash assistance (AFDC and/or SSI)
Demonstration 44.4% 41.9% 39.5% 35.9%
Comparison 42.9% 39.1% 36.7% 33.3%
Nutritional services (WIC and/or food stamps)
Demonstration 64.5% 57.0% 50.0% 45.3%
Comparison 60.4% 52.0% 47.1% 40.6%
Energy program
Demonstration 13.3% 13.3% 11.4% 8.7%
Comparison 13.1% 12.8% 10.0% 7.9%
Literacy Program
Demonstration 0.3% 0.6% 0.7% 0.4%
Comparison 0.3% 0.4% 0.6% 0.1%
Social/Mental health services
Demonstration 6.3% 6.1% 6.7% 6.3%
Comparison 4.9% 5.8% 4.9% 5.9%
Public Housing
Demonstration 21.2% 19.1% 19.3% 16.9%
Comparison 19.6% 17.2% 17.0% 15.7%
Unmet needs (no services provided)
Demonstration 29.1% 18.2% 17.3% 17.1%
Comparison 26.0% 17.3% 15.5% 16.4%
Chapter 10 - Page 121
The percentage of families -- less than one percent -- who reported participating in adult literacy
programs (to learn to read or to improve reading skills) is surprisingly low, particularly because the
Transition Demonstration Programs were aware of a high need in this area. It is possible that parents
may not have labeled these as “literacy programs” and thus under-reported their participation, or they
may have been uncomfortable reporting this to an interviewer. It may also be that local programs
were not successful in engaging parents to participate in reading programs.
The percentage of families reporting receipt of mental health services, including counseling and
treatment for substance abuse, was slightly higher for those in the demonstration than the comparison
group, and this remained steady over time. The percentage of both demonstration and comparison
families living in public housing showed a steady decline from kindergarten to third grade.
Each year, families were asked if they had family needs that were not being met. In the
kindergarten year, between 25 to 30 percent of families indicated they had unmet needs, which they
further specified as including money for basic needs, safer and more affordable housing, medical and
dental care for children and/or adults, employment, improved literacy and education programs for
both children and adults, improved parenting skills, assistance with child care, violence prevention,
and substance abuse counseling and treatment. By the end of their child’s fourth year in school,
many families reported unmet needs -- between 16 to 17 percent. Thus, unmet needs declined, at
the same time families received fewer services.
Assistance in obtaining services. It was hypothesized that more demonstration than comparison
families would report that school or project personnel assisted them in obtaining services. Based on
interviews in the spring of their child’s fourth year in school, demonstration families were
significantly more likely to report that school personnel helped them obtain services, while
comparison families reported they found these services on their own initiative.e This suggests that
many former Head Start families have the skills to find and obtain needed services without having
special service coordinators. However, when there are supportive personnel available to help make
referrals, families take advantage of this assistance.
Chapter 10 - Page 122

DIFFERENCES IN SERVICE UTILIZATION PATTERNS BY FAMILY TYPE
Additional analyses explored whether different types of families participated to a greater extent
in job, educational, and family support programs. Logistic regression analyses were used to predict
program participation by different family types (see Table 25).f
Job training programs. Single Parent Welfare families were more than two and a half times
more likely than Resourceful families to participate in job training. This finding likely relates to
efforts to move families from welfare to work, although this study was conducted prior to the full
implementation of the 1996 Welfare Reform Act. Interestingly, Highly Mobile families also were
nearly 50 percent more likely to receive job training, in contrast to ESL families, who were
approximately 50 percent less likely to participate in job training than were the Resourceful families.
Educational programs. Adults in the Single Parent Welfare, Highly Mobile, and Homeless
families were 50 to 60 percent more likely to participate in educational programs than were those
in the Resourceful families. Not unexpectedly, Mother Absent families were the least likely to
participate in educational programs, in part because the primary caregiver typically was older (e.g.,
a grandparent) and perhaps less able to participate in formal educational opportunities.
Table 25. Results of logistic regression analyses, predicting participation in supportive programs by family type.
Family type
Odds ratio (95% confidence interval)
Job Training Programs Educational Programs Income and Family Support Programs
Resourceful 1.0 (Reference group)
1.0 (Reference group)
0.1 * (0.1 - 0.2)
Single Parent Welfare 1.9 * (1.7 - 2.2)
1.6 * (1.4 - 1.8)
1.0 (Reference group)
Foreign Language 0.5 * (0.4 - .06)
1.5 * (1.2 - 1.9)
0.1 * (0.1 - 02)
Highly Mobile 1.5 * (1.1 - 2.0)
1.6 * (1.2 - 2.2)
0.6 0.3 - 1.2)
Recently Homeless 2.7 * (1.8 - 3.9)
1.5 (1.1 - 2.2)
3.8 (.5 - 27.5)
Mother Absent 1.0 (0.7 - 1.2)
0.6 * (0.4 - 0.8)
0.5 (0.3 - 1.0)
Chronically Ill 1.1 (0.8 - 1.6)
0.9 (0.7 - 1.3)
0.4 (0.2 - 0.9)
* p 0.001
Chapter 10 - Page 123

Family support programs. As expected, the Resourceful families were the least likely to use
income and family support programs, especially when compared to Single Parent Welfare families.
Similarly, the Foreign Language families were less likely than others to use income and other family
supports. As noted earlier, these families are much like the Resourceful families except for the
language they speak at home. That is, the foreign language families have a lower percentage
receiving financial assistance (AFDC and/or SSI), more fathers who are actively involved in their
children’s lives, and higher rates of parental employment.
Overall patterns of usage. Both the Homeless and the Single Parent Welfare groups are the
most likely to participate in assistance programs of all types -- job training, educational, and income
and family support programs. Service use by Mother Absent families is quite low, while there is
some variation across other family types.
SUMMARY FINDINGS
Former Head Start families participated in a variety of educational, employment, and family
support programs. Income trends for these families, both demonstration and comparison, were
generally positive over the early elementary school years, and reliance on AFDC and SSI and other
income supports declined steadily for these families. No statistically significant differences between
groups were noted regarding quantity or types of programs or services received. Single Parent
Welfare families were the most likely to participate in job training, educational, and family support
programs. Families in the comparison group were more likely to access services on their own, while
those in the Transition Demonstration group reported that they received referral assistance from
family service workers who were hired by the Transition Demonstration Program. Over time,
families in both groups experienced a decline in the challenges or stressors they experienced.
Similarly, the rates at which families reported they had unmet needs declined considerably over the
first four years in elementary school.
Chapter 10 - Page 124

ENDNOTES, CHAPTER 10
a. Chi-square analyses were completed cross-sectionally to review the relationship between initial treatment condition (demonstration or comparison) and reported change in family income (large increase, modest increase, small increase, small decrease, modest decrease, large decrease, no change). The initial analysis sample included the 7.515 former Head Start families in the baseline sample. Cross-sectional samples included all families who completed family interviews and responded to the question, with the following sample sizes resulting:
Spring, first year: 6,126 total [1,389-- without interview; 3,274 -- demonstration; 2,852 -- comparison] Spring, second year: 5,457 total [2,958 – without interview; 2,892 – demonstration; 2,565 – comparison] Spring, third year: 5,252 total [2,263 – without interview; 2,772 – demonstration; 2,480 – comparison] Spring, fourth year: 5,176 total [2,339 – without interview; 2,739 – demonstration; 2,437 – comparison]
b. In the spring of each year of program participation, families were asked if they had participated in one or more of five job training or employment counseling programs during the past year. For each year (cross-sectional data, all families with valid family interviews) a variable was created to indicate how many programs the family participated in that year. Distributions were highly skewed to the right each year. Efforts to treat summed variables as continuous and enter them as outcome variables in repeated measures ANOVA or MANOVA models failed because the distributions so badly violated the normality assumptions underlying those models.
Therefore, for each of the families who responded to the question in each of the four interviews (i.e., had complete data for that question; n = 4,050 total; 2,168 = demonstration; 1,859 = comparison), a variable was created to indicate the number of years in which the family reported having participated in at least one job training or employment counseling program. Chi-square analyses were completed to assess the association between initial treatment condition (demonstration, comparison) and (1) participation in at least one program during the year (cross-sectional analyses) and (2) number of years of participation in job training programs (longitudinal analyses). No significant differences were noted. Additional analyses compared number of years of participation in job training programs with years in demonstration school (range of values, 0 to 4) but did not reveal significant differences.
c. In the spring of each year of program participation, families were asked if they had participated in one or more of nine educational programs (i.e., GED, Head Start training, literacy/reading, ESL, government training, vocational technical school, community or junior college, college or university, other) during the past year. For each year (crosssectional data, all families with valid family interviews) a variable was created to indicate how many programs the family participated in that year. Distributions were highly skewed to the right each year. Effort to treat summed variables as continuous and enter them as outcome variables in repeated measures ANOVA or MANOVA models failed because the distributions so badly violated the normality assumptions underlying those models.
Therefore, for each of the families who responded to the question in each of the four interviews (i.e., had complete data for that question; n = 4,050 total; 2,186 = demonstration; 1,864 = comparison), a variable was created to indicate the number of years in which the family reported having participated in at least aneducational program. Chi-square analyses were completed to assess the association between initial treatment condition (demonstration, comparison) and (1) participation in at least one program during the year (cross-sectional analyses) and (2) number of years of participation in educational programs (longitudinal analyses). No significant differences were noted. Additional analyses compared number of years of participation in educational programs with years in demonstration school (range of values, 0 to 4) but did not reveal significant differences.
d. In the spring of each year of program participation, families were asked if they had participated in one or more of fifteen family assistance programs (AFDC, SSI, food stamps, public housing assistance, medical assistance, unemployment insurance, WIC, energy program assistance, home visits, mental health services or counseling, nutrition services, parenting education, literacy education, social services, other) during the past year. For each year (crosssectional data, all families with valid family interviews) a variable was created to indicate how many programs the family participated in that year. Distributions were highly skewed to the right each year. Effort to treat summed variables as continuous and enter them as outcome variables in repeated measures ANOVA or MANOVA models failed because the distributions so badly violated the normality assumptions underlying those models.
Chapter 10 - Page 125

Therefore, for each of the families who responded to the question in each of the four interviews (i.e., had complete data for that question; n = 4,050 total; 2,168 = demonstration; 1,859 = comparison), a variable was created to indicate the number of years in which the family reported having participated in at least a family support program. Chi-square analyses were completed to assess the association between initial treatment condition (demonstration, comparison) and (1) participation in at least one program during the year (cross-sectional analyses) and (2) number of years of participation in family support programs. No significant differences were indicated. Additional analyses compared number of years of participation in family support programs with years in demonstration school (range of values, 0 to 4) but did not reveal significant differences.
e. Supplemental interviews were optional on the part of the local sites. A total of 23 sites administered Supplemental Interviews for Families to at least some percentage of the families in their final year of study participation. A total of 2,827 supplemental family interviews were available for analysis (2,001 demonstration and 1,826 comparison). No specific statistical analyses were completed to test hypotheses about associations because the data were incomplete and sampling plans varied substantially by site. Thus, the outcomes reported on these data are descriptive only.
f. In kindergarten, there were 7,078 families (94% of the 7,515 Head Start families in the analysis data set) for whom a family interview was available. Of the 7,078 families, 784 (11.1%) were deleted from these analyses because their interviews were missing values on two or more key challenge index variables. Therefore, there were 6,294 families (3,318 demonstration and 2,976 comparison) for whom a kindergarten family challenge index score was created.
g. Logistic regression analyses were completed using the analysis sample outlined in notes b through d above. Logistic models were constructed separately for the three program types – job training, educational, and family support. All models included participation in at least one program during the four years as the outcome variable and family type entered as the predictor variable (entered as six dummy variables indicating cluster membership, with the Resourceful family group serving as the reference group for job training and educational program models and the Single Parent Welfare group serving as the reference group for the family support model).* SAS Proc Logistic procedures were utilized. Odds ratios and 95% confidence intervals were computed and reported in the text.
* The Single Parent Welfare group was chosen as the reference group for the family support programs model because a large percentage (85%) of those families reported receiving AFDC, one of the family support programs used to establish the dichotomous participation variable. Using the Resourceful families group as the reference group caused a quasi-complete separation of the data (since virtually all of the Single Parent Welfare families fell into the yes-participation group), resulting in an unstable model. Use of the Single Parent Welfare group as the referent group yielded a stable, interpretable model.
Chapter 10 - Page 126

CHAPTER 11 - PARENT INVOLVEMENT IN CHILDREN’S LEARNINGAND IN SCHOOLS
INTRODUCTION AND BACKGROUND
Parental involvement in schools and children’s learning has long been a focus for Head Start
programs and was included in the National Transition Demonstration Programs as one of the four
major component areas. The emphasis within the National Transition Demonstration Program on
strengthening and expanding parent involvement in children’s learning and in schools is founded in
two decades of research documenting the benefits of such involvement. Overall, this body of
research, including both correlational and intervention studies (Henderson, 1987), has consistently
concluded that parental involvement has a significant positive relationship to a wide range of child,
family, and school outcomes, including higher achievement for children and more positive schools
(Epstein, 1995; Grolnick, Banjet, Kurowski, & Apostoleris, 1997; Henderson, 1987). This has been
found to be true in a diverse set of populations, including both gifted and disadvantaged children
(Henderson, 1987). Further, parental involvement with schools’ and children’s academic endeavors
has been found to improve parental attitudes toward the school and the school’s climate, and to
promote a more positive atmosphere within the school (Epstein, 1985).
SOURCES OF INFORMATION
The information reported below was obtained from multiple sources. Informants included
families (via personal interviews completed in the spring of each school year), teachers and
principals (via questionnaires completed at the end of the program), Transition Demonstration
Program staff (via site visits completed annually), and others (via the Program Implementation
Profile, completed in the final year of program implementation). The instruments used to obtain
information included:
Family Involvement in Children’s Learning (National Transition Demonstration Research
Consortium, 1995), a 20-item instrument devised by the National Transition Demonstration
Research Consortium to gather information about the different ways schools and families
Chapter 11 - Page 127

work together to help children learn. The questionnaire was administered to families in the
spring of the final two years of their program participation.
Family Background Interview This interview included four items specifically designed to
address communication with the child and teacher about school activities and supportive
educational activities in the home. It was administered to families each spring.
Family Routines Questionnaire (Boyce, Jensen, James, & Peacock, 1983), a 27-item
inventory designed to measure an individual family’s enactment of positive routines that are
thought to be protective for family members. The areas considered are workday routines,
children/s routines, disciplinary routines, meals, weekend and leisure time, bedtime, extended
family activities, leaving and homecoming, and chores. The questionnaire was administered
to families in the fall of the first program year, and in the spring of the last (fourth) program
year.
Supplemental Questionnaires for Principals and Teachers, completed by teachers and
principals in the spring of the final year of program participation. These questionnaires
gathered information about: (1) the existence of Transition-like services and personnel in
both demonstration and comparison schools, (2) the needs of the families served by the
school, (3) parent involvement opportunities available in the school, and (4) barriers to
parent involvement perceived by school personnel. These supplemental questionnaires were
optional, so data was not available for all sites or for all teachers or principals within sites.
SCHOOL-BASED ACTIVITIES TO FACILITATE LEARNING
Staffing Patterns and Activities
Within the Supplemental Questionnaire for Principals, principals were asked if they had staff
assigned to facilitate parent involvement in the school.a Slightly more demonstration principals
(67%) indicated they did have such staff identified, compared to comparison principals (65%).
Demonstration schools (70%) were more likely to have paid paraprofessional staff than comparison
schools (45%), and the difference was statistically significant (p = 0.001). Comparison schools
reported more paid professional staff assigned to facilitate parent involvement (66% demonstration,
75% comparison; p = 0.161)
Chapter 11 - Page 128

Staff in demonstration schools were more likely to staff the parent resource room, schedule
parent education or information programs, recruit and schedule parent volunteers for classrooms,
provide parent education through home visits, coordinate the production and distribution of parent
newsletters, and schedule and coordinate family-focused activities and programs. In addition, staff
in demonstration schools engaged in a larger number of different types of activities (see Table 26).
Overall, it appears that the demonstration was successful in facilitating parent involvement
opportunities, at least from the principals’ point of view.
Table 26. Activities engaged in by parent involvement staff, as reported by principals
Activity Demonstration Comparison ?2
Staff the parent resource room 62.3% 42.2% 4.822
Schedule parent education programs 83.5% 70.2% 1.520
Develop & coordinate child-focused programs
59.5% 59.0% 0.223
Develop & coordinate after-school programs for children
38.7% 38.6% 0.006
Recruit & schedule parent volunteers for classrooms
82.8% 74.3% 0.458
Provide parent education through home visits
61.0% 43.2% 0.591
Parent newsletters 72.1% 60.8% 4.693*
Schedule & coordinate family activities 85.4% 65.7% 1.272
Mean (s.d.) number of activities 3.4 (2.6) 3.0 (2.6%) 5.702*
Median number of activities 4 3 --
*p 0.05 **p .01 *** p 0.001
School-Wide Activities
Parents were asked to indicate whether they had been offered opportunities to participate in 12
different kinds of school-based activities thought to facilitate student learning by bringing schools
and families closer togther. The activities have been characterized as either traditional (open house,
teacher-parent conferences, student programs, family social events, field trips, and lunch or breakfast
at school for parents) or non-traditional (home visits with school staff, parent education, parent
discussion groups, parent resource rooms, and home lending libraries).
Chapter 11 - Page 129
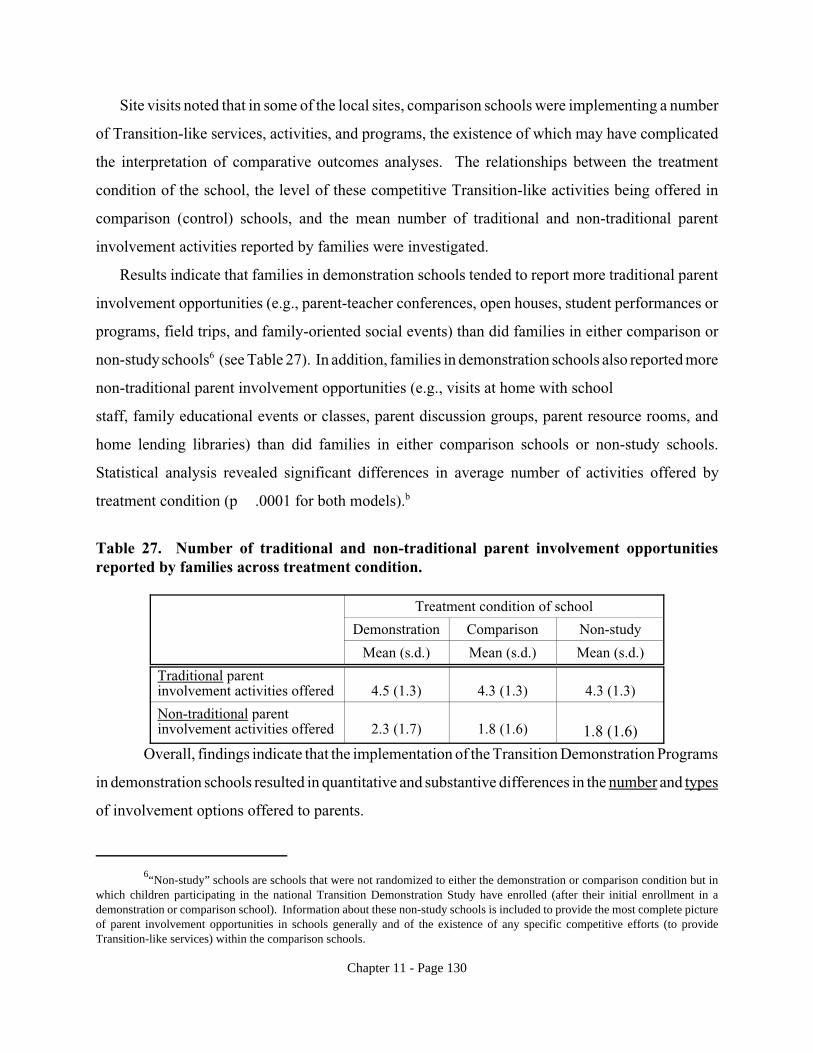
Site visits noted that in some of the local sites, comparison schools were implementing a number
of Transition-like services, activities, and programs, the existence of which may have complicated
the interpretation of comparative outcomes analyses. The relationships between the treatment
condition of the school, the level of these competitive Transition-like activities being offered in
comparison (control) schools, and the mean number of traditional and non-traditional parent
involvement activities reported by families were investigated.
Results indicate that families in demonstration schools tended to report more traditional parent
involvement opportunities (e.g., parent-teacher conferences, open houses, student performances or
programs, field trips, and family-oriented social events) than did families in either comparison or
non-study schools6 (see Table 27). In addition, families in demonstration schools also reported more
non-traditional parent involvement opportunities (e.g., visits at home with school
staff, family educational events or classes, parent discussion groups, parent resource rooms, and
home lending libraries) than did families in either comparison schools or non-study schools.
Statistical analysis revealed significant differences in average number of activities offered by
treatment condition (p .0001 for both models).b
Table 27. Number of traditional and non-traditional parent involvement opportunities reported by families across treatment condition.
Treatment condition of school
Demonstration Comparison Non-study
Mean (s.d.) Mean (s.d.) Mean (s.d.)
Traditional parent involvement activities offered 4.5 (1.3) 4.3 (1.3) 4.3 (1.3)
Non-traditional parent involvement activities offered 2.3 (1.7) 1.8 (1.6) 1.8 (1.6)
Overall, findings indicate that the implementation of the Transition Demonstration Programs
in demonstration schools resulted in quantitative and substantive differences in the number and types
of involvement options offered to parents.
6“Non-study” schools are schools that were not randomized to either the demonstration or comparison condition but in
which children participating in the national Transition Demonstration Study have enrolled (after their initial enrollment in a demonstration or comparison school). Information about these non-study schools is included to provide the most complete picture of parent involvement opportunities in schools generally and of the existence of any specific competitive efforts (to provide Transition-like services) within the comparison schools.
Chapter 11 - Page 130

Volunteer Activities
Families were also asked to indicate which volunteer opportunities were made available to them
within the schools, both at the classroom level (send treats for the class, help with parties, be a room
parent, help teacher with work in the classroom, help with field trips, work with children in the
classroom) and at the school level (help in the library, computer lab, office, cafeteria, or playground;
help with fund-raising; help with newsletter; and help other parents become involved).
Opportunities to work with children in the
classroom and to help other parents become
involved were of particular interest, since they
were most often emphasized as part of the broader
definition of parent involvement within the
Transition Demonstration Program. Analyses
indicated significant differences between school
groups in the percentage of families who reported
having been offered those opportunities (see
Figure 11.1).c These findings indicate that
demonstration schools were significantly more
likely to offer parents the opportunity to pursue
non-traditional and substantive volunteer
opportunities than were either comparison or non
study schools.
PARTICIPATION IN ACTIVITIES
Participation in school-wide activities. It was
anticipated that families in demonstration schools
would be more likely to participate in parent
Figure 11.1Volunteer activities reported by parents in
demonstration, comparison,and non-study schools
46.8 Demonstration
45 50
40.5 39.8 Comparison
40 Non-study 32.6
35P
erce
ntag
e of
fam
ilies
rep
ortin
g27.4 25.6
2520151050
Workwith childrenin Helped other parents classroom becomeinvolved
30 P
erce
nta
ge
of
fam
ilies
rep
ort
ing
Figure 11.2Parent participation in parent involvement
opportunitiesoffered by schools
98.6 88.5
97.6
79
99.5
84
0
20
40
60
80
100
120
Traditional activities Non-traditional activities
Demonstration Comparison Non-study
Chapter 11 - Page 131

involvement activities, when offered, than families enrolled in comparison or non-study schools.
Parents who indicated that an activity was offered were asked if they attended or participated. Figure
49.6 43.6
47.3
39.5
50.8 47.4
0
10
20
30
40
50
60
Helping children in classroom Helping other parents get involved
Per
cent
age
of fa
mili
es r
epor
ting
Demonstration Comparison Non-study
Figure 11.3 Parent participation in volunteer opportunities
offered by schools
11.2 shows that the majority of families in all
schools reported participating in some traditional
and/or non-traditional parent involvement activity,
and there were no significant differences between dgroups.
Participation in volunteer activities. Families
were also asked to indicate whether or not they
participated in opportunities to volunteer in school
and classroom. Reviewing participation responses
for the two opportunities of particular interest -
working with children in the classroom and helping
other parents become involved in the school -- no significant differences were seen among families
in demonstration, comparison, or non-study schools (see Figure 11.3).e Between 40 and 45 percent
of the families in each group indicated that they had participated when the opportunity was offered.
Perceived and Reported Barriers to Parent Involvement. A majority of parents in
demonstration (71%), comparison (68%), and other schools (71%) reported the existence of barriers
to their becoming more involved in schools. These reported barriers included lack of child care or
transportation, work schedules, language barriers, feeling uncomfortable at school, health problems,
teacher or school policies, and previous negative experiences with the school. There were no
important differences in the types of barriers reported by families in demonstration or comparison
schools. To the extent that the Transition Demonstration Programs successfully raised awareness
of potential barriers and facilitated the remediation of barriers, one would expect that the number of
families reporting barriers in demonstration schools would be lower than in either comparison or
non-study schools. There were, however, no statistically significant differences between
demonstration and comparison schools.f
Principals were also asked at the end of their school’s participation in the Transition
Demonstration Program what, if any, barriers to parental involvement existed for families in the
school. Five barriers were proposed for consideration by principals: (1) limited transportation; (2)
Chapter 11 - Page 132

lack of release time from work; (3) low levels of parent education and/or literacy; (4) parents’
negative experiences with schools in the past; and (5) parental apathy. Principals most often reported
that lack of release time from work (85%) and apathy on the part of parents (72%) were significant
barriers to parent involvement. There were no significant differences between principals of
demonstration and comparison schools in their perception of barriers impacting parent involvement.g
HOME-BASED ACTIVITIES TO FACILITATE CHILDREN’S LEARNING
The completion of home-based activities to support learning activities in the classroom was an
important part of parent involvement in education as conceptualized by the Transition Demonstration
Programs. Families were asked in a number of ways to indicate whether or not, and how often, they
communicated with the teacher, read with the child, completed activities to support classroom
learning, and/or maintained routines in the home that might support learning (e.g., consistent times
for homework and bedtime each night).
Communication With Teachers
Families were asked each year in the spring how often they had spoken with the child’s teacher.
In kindergarten, 17 percent of caregivers indicated that they spoke with the child’s teacher nearly
every day, 61 percent several times a month, and 21 percent less than monthly. By the spring of
second or third grade, the percentage of caregivers reporting daily communication with teachers had
dropped to only 11 percent, and the percentage reporting communication several times monthly had
risen to 66 percent. These shifts in communication frequency are thought to be natural shifts, related
to the changing nature of classrooms and student-teacher-family interactions as children mature.
There were no significant differences between demonstration and comparison families. Further,
most parents in both demonstration and comparison schools indicated a high degree of satisfaction
with their interactions with their children’s teachers.h
Chapter 11 - Page 133

Educational Activities in the Home
Family-child activities. Families were asked
how often they worked with their children on
things the children might be learning in school,
and how often they read or looked at books with
the children (see Table 28). More than half
reported that they worked with the child nearly
every day and slightly over a third reported reading
or looking at books nearly every day, but there
were no differences among groups. Caregivers
were also asked whether some members of the
family had, in the past week, read to the child or
Figure 11.4 Percentage of parents reporting learning interactions
with the child in the past week
78.6
80.6
79.2
83.2
77.5
79.6
74
75 76
7778
79
80 81
82 83
84
Read to child Taught reading, spelling, math
Per
cent
age
of fa
mili
es r
epor
ting
Demonstration Comparison Non-study
taught reading, spelling, or math (see Figure 11.4).
More than three-fourths of the caregivers indicated that those activities had taken place in the past
week in their home but, again, there were no differences among groups.i These relatively high self-
reported engagement levels are counter to negative national stereotypes of “uninvolved” low income
parents.
Table 28. Percentage of parents indicating at-home educational activities with children, by school group.
Activity Almost Every Day
3-5 Times/ Week
1-2 Times/ Week
1-3 Times/ Month
Less than
Monthly
Almost Never ?2
Work with child on things he/she is learning in school
Demonstration schools Comparison schools Non-study schools
52.9% 56.6% 53.2%
24.4% 22.6% 22.9%
16.6% 16.5% 17.7%
4.2% 3.0% 3.6%
1.0% 0.8% 1.9%
1.0% 0.5% 0.8%
18.561
Read or look at books with child
Demonstration schools Comparison schools Non-study schools
36.6% 40.2% 33.5%
29.7% 28.7% 31.2%
24.4% 22.7% 25.4%
5.8% 5.3% 5.3%
2.2% 2.0% 3.0%
1.4% 1.2% 1.7%
15.376
* p 0.01 ** p 0.001
Chapter 11 - Page 134

Supportive family routines at home. Families were asked about the consistency of family
routines thought to be highly relevant to school performance, such as having a regular bedtime and
a predictable time for homework. The majority of families report consistency in these two family
routines (see Table 29), and there are no significant differences between groups.
Table 29. Frequency of family routines as reported by caregivers, by treatment condition
Routine Almost
Every Day 3-5 Times/
Week 1-2 Times/
Week Almost Never
?2
Children go to bed at a certain time each night
Demonstration 63.7% 24.8 5.8 5.6 1.612
Comparison 65.1% 24.2 5.5 5.2
Children do their homework at the same time of day or night.
Demonstration 33.6% 22.7 15.0 9.9 2.926
Comparison 34.0% 23.9 14.0 9.1
* p 0.01 ** p 0.001
FAMILY INVOLVEMENT IN SCHOOLS (GOVERNANCE)
Opportunities reported by principals. In the fifth year of program implementation, principals
were asked to identify opportunities that were available for parents to participate in schools.
Although differences between demonstration and comparison groups were not statistically
significant, demonstration schools were more often said to offer the following opportunities: (1)
providing input into teacher evaluation policies; (2) choosing a school for the child; (3) selecting the
child’s teacher; (4) providing input into hiring school staff; (5) evaluating teachers; (6) providing
input into budget policies and practices; and (7) serving on policy committees (see Table 30).
Opportunities reported by parents. In a similar manner, families were asked to respond to
questions relating to their involvement in what may be thought of as the governance of the school -
i.e., serving on committees or advisory boards, helping to make decisions about school policies and
programs. Their responses (see Figure11.5) indicate a positive and statistically significant effect (p
= 0.001) of Demonstration program participation, in that more families with children in
demonstration schools reported that they were offered opportunities to serve on committees, advisory
boards, or councils, and to help make decisions about school policies and programs.j
Chapter 11 - Page 135

Table 30. School involvement opportunities for parents, as reported by principals
Demonstration Schools
Comparison Schools ?2
Teacher evaluation policies 6.2% 1.3% 5.177
Parent involvement policies 56.5% 55.1% 0.062
Choosing a school for their child 34.5% 29.5% 0.863
Selecting child’s teacher 37.9% 33.9% 0.511
Development of grievance policies 7.6% 7.0% 0.032
Hiring staff 15.2% 9.0% 2.742
Evaluating teachers 2.8% 1.9% 0.231
Budget policies & practices 26.2% 21.2% 1.065
School goals 73.1% 76.9% 0.586
Long-range planning 71.7% 75.0% 0.413
Policy committees 45.5% 41.0% 0.618
Kindergarten retention policy 3.5% 7.0% 1.938
Grades 1 to 3 retention policy 4.1% 8.3% 2.237
* p 0.01 **p 0.001
Interestingly, nearly one third of the families
with children in comparison schools also indicated
the offering of such opportunities in their schools.
This may be the result of a national emphasis on
parent involvement. Further, fewer families in
non-study schools reported school involvement
activities were offered than did families in
comparison schools, again suggesting that
comparison schools were actively engaged in the
implementation of Transition-like school
involvement programs.
Figure 11.5 Percentage of parents reporting involvement in
school governance activities
37.4
29.9 30.5 27.1
30.1
24.3
0
5
10
15
20
25
30
35
40
Served on committee, advisory board, council
Helped make decisions about school policies or
programs
Per
cent
age
of fa
mili
es r
epor
ting
Demonstration Comparison Non-study
Chapter 11 - Page 136
SUMMARY FINDINGS
The investigations concerning parent involvement with children’s education reveal several
important findings. First, it is noted that former Head Start parents report being very involved with
their children’s learning at home, providing supportive environments and routines (e.g., having a
regular bedtime for children), engaging in learning activities on a regular basis (such as reading with
the child or reviewing things they learned in school), and communicating with teachers on a frequent
basis. This picture of parental involvement is counter to many of the negative stereotypes of
“uninvolved” low income families.
Second, parents reported that Transition Demonstration schools provided more opportunities for
parent involvement, and provided more non-traditional opportunities -- such as home visits, family
educational activities, parent discussion groups, parent resource rooms, and home lending libraries-
than did comparison schools. It is possible that two factors were working to achieve these findings:
first, demonstration schools were likely providing more opportunities of all kinds for parent
involvement, and, second, demonstration schools were more effective in making parents aware of
the opportunities available to them.
Chapter 11 - Page 137

ENDNOTES, CHAPTER 11
a. Supplemental Questionnaires for Principals were completed by 340 principals (158 demonstration, 182 comparison) in 23 of the 31 sites. Statistical analyses were completed using chi-square methods for categorical data.
b. A total of 4,783 families provided information for these analyses in their third or fourth years of study participation via the Family Involvement in Children’s Learning. These families were enrolled in 2,129 demonstration schools, 1,873 comparison schools, and 781 non-study schools. Analysis of variance techniques were used to assess the difference in mean number of opportunities reported by families enrolled in the three school groups. Separate models were constructed and analyzed for traditional and non-traditional opportunities.
c. A total of 4,832 families provided the data included in these analyses (2,084 in demonstration schools; 1,844 in comparison schools; 904 in non-study schools). Chi-square analyses were completed to assess relationships between the categorical variables.
d. These analyses include that group of families who indicated that opportunities were offered and provided information about their participation in those activities. A total of 1,150 families provided information concerning participation in traditional activities and 270 provided information concerning non-traditional activities. Analyses (using chi-square techniques) were completed separately for traditional and non-traditional activities.
e. These analyses include that group of families who indicated that opportunities were offered and provided information about their participation in those activities. A total of 2,074 families provided information (970 in demonstration schools, 744 in comparison schools, and 360 in non-study schools). Chi-square analyses were completed separately for each of the two types of volunteer participation.
f. Information concerning barriers to participation was available from a total of 4,836 families (2,085 in demonstration schools, 1,845 in comparison schools, and 906 in non-study schools). Chi-square analyses were completed to assess the relationship between school treatment condition and reporting of barriers to parent involvement.
g. While there was some variability in the number of responses to specific questions, approximately 300 principals (range 286 - 320) provided information via the Supplementation Questionnaire for Principals concerning perceived barriers to parent participation in schools. The principals were approximately equally distributed between demonstration and comparison schools. Chi-square analyses were completed to assess relationships between the categorical variables.
h. These analyses were completed for those 6,090 families who provided information concerning family involvement in learning in second and/or third grades. The families were evenly distributed between demonstration and comparison conditions.
i. See note h above.
j. The sample used for these analyses is the same as described in notes I and j above. Chi-square analyses were completed to assess the relationship between parent participation in school governance and school group (demonstration, comparison, non-study).
Chapter 11 - Page 138

CHAPTER 12 - CHILDREN’S ACADEMIC AND SOCIAL OUTCOMES
INTRODUCTION A major justification for the Head Start-Public School Early Childhood Transition
Demonstration Project was that former Head Start children are likely to need additional supports in
the first few years in elementary school to ensure that they maintain the benefits of their Head Start
participation. This is because low-income children have consistently been shown to be “at risk” for
performing below national average on a variety of indicators related to school success, especially
academic indicators (S. Ramey & Ramey, 1998; Brooks-Gunn, et al., 1994; Huston, 1992).
Remarkably little is known about the actual school performance of a large and nationally diverse
sample of former Head Start children, especially using a variety of indicators and informants on an
annual basis for the first four years in school. Thus, this study provides much needed information
about the early school adjustment of former Head Start children.
An extensive literature indicates that by the end of third grade, children’s academic and social
adjustment are strong predictors of their later school success, including their subsequent academic
achievement and their probability of completing high school. Both family income status (poverty
versus non-poverty) and maternal educational level have been strongly associated with children’s
early and later school success. Recent analyses conducted by Currie and Thomas (1997) on the
academic achievement levels of former Head Start children nationally (based on children who
enrolled in Head Start in the late 1970s and were in 8th grade by 1988) addressed the question of
“fade-out” of effects. They discovered that among former Head Start children, there was a large
ethnic or racial discrepancy in the quality of public schools they attended. Specifically, they
conclude that: “These results show that relative to other black children, black children who attended
Head Start subsequently went to schools of low quality in the sense that the black children in these
schools have poorer outcomes. The same is not true for white Head Start children. Thus, the results
are consistent with the hypothesis that differential fade-out in the effects of Head Start could be
caused by subsequent exposure to poor schools among black Head Start children.” (p. 15) This
conclusion is in agreement with the results of recent reviews (C. Ramey & Ramey, 1998; S. Ramey
Chapter 12 - Page 139

& Ramey, 2000) of the long-term effects of early educational interventions for “at risk” children:
namely, that for the benefits of early intervention to be sustained, children need continued supports
and opportunities for learning, such as participation in reasonably responsive schools that have high
expectations for academic achievement.
Before reporting the child outcomes, it is important to underscore two features about this study.
First, the sample of children and the schools they attended do not represent the nation as a whole and
may not represent accurately the school experiences of all former Head Start children. This is
because the local sites were selected based on submitting a competitive application that indicated
their interest in and ability to implement a broad program of supports and services to benefit former
Head Start children and their families. Thus, the school districts that were selected are much more
likely to represent schools that are sensitive to the needs of low income children and are highly
motivated to provide these children with a good start in school. Second, this study did not directly
measure or estimate possible benefits to the children of their Head Start experience. This was
impossible because children were not recruited into the study until they were enrolled in
kindergarten. Rather, the assumption that at least some children benefitted is based on other studies
that suggest Head Start can be helpful. One of the most recent studies of this, using a large
nationally representative sample, concluded that 6-year-olds who went to Head Start performed
significantly better on tests of receptive language and reading than did their siblings who had not
attended preschool (Currie & Thomas, 1995). Also, a comprehensive literature review
commissioned by the Head Start Bureau indicated a variety of benefits (McKey et al, 1985), although
this report, as well as other critiques, noted that adequately rigorous studies of Head Start’s actual
effectiveness have never been conducted (e.g., ACYF, 1990; GAO 1997; Zigler & Meunchow,
1992).
SOURCES OF INFORMATION
The National Transition Demonstration Research Consortium responsible for the final design
and conduct of the National Study relied on five sources of information to describe children’s
academic progress. These sources of information were:
(1) Direct assessment of each child in the fall of kindergarten and in the spring of kindergarten
and each of the next three years in school, via a one-to-one assessment by a trained child examiner
Chapter 12 - Page 140

during a relatively brief (20-30 minute) session with the child. This direct child assessment
concentrates on three skill areas:
*Receptive vocabulary, because of the importance of verbal comprehension to the everyday
school setting and the well-established relationship between children’s vocabulary skills and their
general intellectual knowledge. This was estimated by using the Peabody Picture Vocabulary Test
Revised (Dunn & Dunn, 1981). Children’s raw scores were transformed into Rasch-Wright scores
that take into account children’s ages and “typical” or average levels of performance from a broad
and representative sample of children who participated in the norming for this tool. Although the
National Consortium recognized that vocabulary tests have been strongly criticized as showing
cultural bias and underestimating the true language competency of many children, it was judged that
children’s gains in receptive language skills were important to estimate, and no truly “culture free”
test was available as a an alternative.
*Reading skills, because reading remains the single greatest predictor of children’s overall
success in school (Lyon, 1997) and because it is a skill that is directly taught to all children, for the
first time, in the early elementary school years. Reading skills were measured by the Woodcock-
Johnson Tests of Academic Achievement Letter-Word Identification and Passage Comprehension
Subtests (Woodcock & Johnson, 1989, 1990). Raw scores were converted to Rasch-Wright age-
adjusted scores and can be compared in terms of their distance from “reference scores” that reflect
children’s average performance, based on a diverse and representative national sample for norming
this test. Scores for the two subtests and an overall Broad Reading score were calculated.
*Math skills, particularly because math also is a central feature of the early elementary school
curriculum universally and few children are systematically introduced to mathematics activities
beyond counting and number recognition, prior to formal schooling. Rasch-Wright scores for Math
Computation and Applied Problems subtests and a Broad Math score were computed according to
test manual guidelines.
Collectively, a child’s early receptive vocabulary, reading, and math skills form an important
foundation on which increasingly complex academic skills are built. Indeed, language arts and math
continue as required subjects throughout the K-12 curriculum in almost all schools nationwide.
Further, language comprehension, reading, and math skills are essential for children to make good
progress in almost every other subject taught in school.
Chapter 12 - Page 141

(2) Teacher ratings of the child’s academic standing, in which the teacher compares the child
to others in the classroom as well as to grade-expectations in general. These teacher ratings were
completed during the spring of each of the first four years in elementary school for all participating
children. The standardized questionnaire for this is the Academic Competence Scale of the Social
Skills Rating System (Gresham & Elliott, 1990), comprising 9 questions about children’s reading,
math, and overall academic achievement. Teachers’ ratings then are converted to standardized
scores with a mean of 100 (representing the national average for the norming sample) and a standard
deviation of 15.
(3) School records for each child, which provided information about whether the child was
promoted versus retained a grade or placed in special education (and if so, for what types of special
needs). The review of children’s school records occurred at the end of each academic year and
followed the procedures of the School Archival Records Search (Walker, Block-Pedego, Todis, &
Severson, 1991) for extracting reliable information from existing school records.
(4) Parent report of the child’s academic progress, based on an interview of parents using
Your Child’s Adjustment to School (Reid & Landesman, 1988). Parents rated their children in the
spring of each academic year, using a 10-point scale where 10 represented the highest level of
achievement and 0 represented the lowest. Items addressed children’s academic progress and overall
school adjustment. Parents also were asked to describe the most positive aspects of their child’s year
in school as well as any problems or concerns that arose.
(5) Children’s own appraisal of how they are doing in school, using What I Think of School
(Reid & Landesman, 1988), a standardized dialogue in which children report in the spring of each
year their perceptions about different aspects of their school experiences, including how much they
like school, whether they think they are doing well in their schoolwork, how well they get along with
their teachers and peers, how much they try to do their best in school, how important they and their
parents think school is, and how much they learn from their teachers.
These five sources of information each provide distinct and useful information about the child’s
academic performance during the first four years in elementary school. Taken as a whole, the
information provides a broad picture of how these former Head Start children fared during the first
four years in public school.
In addition, information about children’s social adjustment was obtained from teachers, parents,
Chapter 12 - Page 142

and children themselves. Teachers and parents each rated children using the Social Skills
Questionnaire within the Social Skills Rating System (Gresham & Elliott, 1990), a scale that concerns
the child’s broad social and emotional adjustment. The items for parents and teachers are similar,
reflecting many aspects of children’s positive social skills, ability to get along with others, use of
socially appropriate behavior, independence in social areas, cooperativeness, and lack of serious
behavior problems. These ratings then are converted into a standardized score, using a scale where
100 represents the national average for the norming sample with a standard deviation of 15.
FINDINGS ABOUT CHILDREN’S OUTCOMES
Academic performance based on direct assessment of children
The direct assessment of children provides a standardized method for measuring children’s
academic skills each year. Eighty-seven percent of the children who were assessed in kindergarten
were also assessed in the second or third grade. In this longitudinal sample, seventy-six percent had
direct assessment measures available at every year.
These analyses focused on three central questions for the National Study:
(1) How do these former Head Start children do academically in the early elementary
school years? That is, do the children show a pattern of consistent growth in their academic
competency or do they stay relatively level or decline (that is, “lose the gains” they may have shown
from Head Start)? What is their level of performance each successive year on standardized tests
compared to national means or expectations for children of comparable ages?
(2) Does participation in the Demonstration Transition Program result in children showing
a significant boost in their academic performance compared to those in the comparison
condition? To the extent that children in the Transition Demonstration schools might have received
a more responsive, individualized, and developmentally appropriate education, then their academic
progress might be expected to be better than those in the comparison condition. More specifically,
it was hypothesized that children who received all 4 years of schooling in a Transition Demonstration
school would show the greatest benefits, based on the belief that continuity of positive experiences
in children’s early elementary school education would maximize their academic gains, by increasing
children’s comfort with and knowledge about school practices and expectations, as well as by
encouraging early successes that would generalize from one year to the next. In fact, only 60% of
Chapter 12 - Page 143
the original group received the full 4 years of Transition Demonstration intervention (that is, the full
“dose”) as planned, and 25% received only 1 or 2 years of planned intervention.
(3) To what extent does the academic performance of former Head Start children show an
association with their family characteristics or with child characteristics? The tremendous
diversity in the former Head Start families, much greater than expected, led to an early recognition
that family characteristics were likely to affect participation in the Transition Demonstration
Program, and possibly to affect the degree to which children benefitted from (or needed) the extra
supports. Child characteristics, such as gender, age at school entry, disability status, or their initial
academic competence when they first entered school, were considered as well, given an impressive
diversity in the former Head Start sample that was apparent even at the first round of child
assessments. If strong influences are detected between academic progress and family or child
characteristics, then it is possible that these factors might also influence the extent to which children
benefit (more or less) from their participation in the Transition Demonstration Program.
Performance on Standardized Assessments
Figure 12.1 (page 146) presents a composite picture of the performance of former Head Start
children (combining the demonstration and comparison groups) during the first four years in school,
based on the children’s mean scores on the four standardized Woodcock-Johnson measures of
reading and math skills.1 Separate lines are displayed for children in the two treatment groups. A
shaded area indicates national means or expected “average” scores for children of comparable ages
(with confidence intervals drawn to reflect standard error of measurement). This composite picture
reveals three strong and robust findings from this study:
The first finding is that these former Head Start children entered school somewhat below other
children nationally in terms of scopes. This finding affirms what many other studies have
consistently shown -- that children from very low income families start school at a disadvantage in
terms of their average entry level academic competency. Further, the children’s performance on the
Peabody Picture Vocabulary Test, indicating receptive vocabulary skills, places these children at an
even more marked disadvantage relative to a national sample, placing them just a little more than
one standard deviation below national norms during their first year in public school.
The second finding -- perhaps one of the strongest and most important of the National Study -
Chapter 12 - Page 144

is that these children show significant improvement on all 5 measures during these first four years
in school. In fact, for the two measures of reading skills and the two of math skills, former Head
Start children quickly rise to perform very close to or essentially right at the national averages -- with
average standardized test scores for both demonstration and comparison groups of 97 and 98
respectively for Broad Reading Scores and 100 and 101 for Broad Math in the spring of children’s
fourth year in school. These average scores are especially impressive, since children who were in
Special Education are included, as well as those who repeated a grade. The findings indicate that
the sharpest rise in children’s scores occurs between the kindergarten year and the end of the second
year in school (first grade, for most of the children) with a somewhat slower incline thereafter. A
very slight decline in this rate of improvement appears between the third and fourth years in school
only in children’s Letter-Word Identification, and is so small as to be not educationally relevant. The
area in which children’s relative gains were the least was on the Peabody Picture Vocabulary Test.
However, the children did show significant gains that brought their performance inside the normal
range of 100 plus or minus one standard deviation. The effect size for this gain from the
kindergarten year through the end of the fourth year in school was .29, a modest significant gain.
In contrast, the magnitude of gains for reading and math, measured in effect sizes, were on the order
of .36 and 1.01, respectively.
The third finding is that when looking at a composite of the children’s performance from these
sites, the year by year performance of the children in the Transition Demonstration and the
comparison groups is remarkably similar each year. In the combined sample, comparison children
had slightly higher baseline scores than did demonstration children although this very small
difference varied from site to site in terms of magnitude and direction. However, it is important to
note this national portrayal might be obscuring some group differences that could appear at some
local sites, but not others. Given the tremendous diversity across sites in the types of programs
Chapter 12 - Page 145
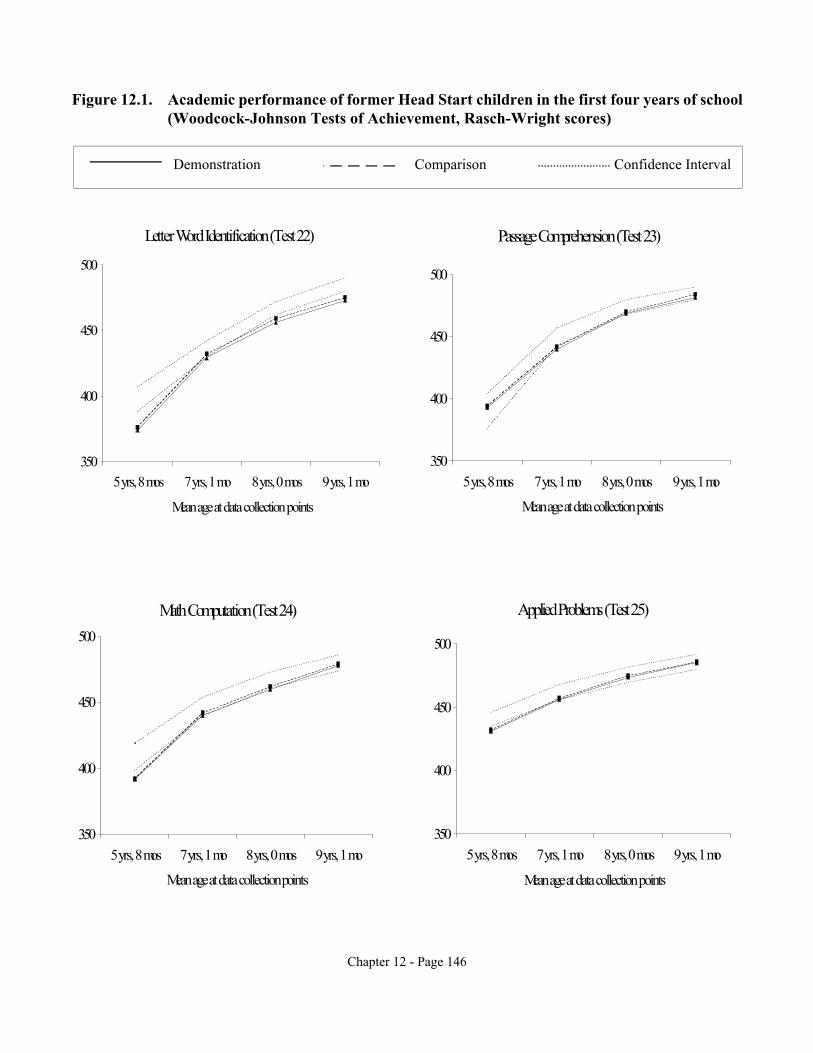
Figure 12.1. Academic performance of former Head Start children in the first four years of school (Woodcock-Johnson Tests of Achievement, Rasch-Wright scores)
Demonstration Comparison Confidence Interval
500
450
400
350
500
450
400
350
LetterWord Identification(Test 22)
500
450
400
3505yrs, 8 mos 7yrs, 1 mo 8 yrs, 0 mos 9 yrs, 1 mo
Mean age atdata collection points
MathComputation(Test 24)
500
450
400
350
5yrs, 8 mos 7 yrs, 1 mo 8 yrs, 0 mos 9 yrs, 1 mo
Mean age atdata collection points
PassageComprehension (Test23)
5yrs, 8 mos 7yrs, 1 mo 8 yrs, 0 mos 9 yrs, 1 mo
Mean age atdata collection points
Applied Problems (Test 25)
5yrs, 8 mos 7 yrs, 1 mo 8 yrs, 0 mos 9yrs, 1 mo
Mean age atdata collection points
Chapter 12 - Page 146

implemented, this would not be an unexpected outcome. Similarly, if some groups of children, but
not others, benefitted from the Transition Demonstration Program, then this simple comparison of
groups by treatment condition may not convey all relevant findings. Thus, a pre-planned series of
analyses explored many possible factors or explanatory models that could account for changes in
individual children’s growth curves on these 5 academic indicators. The results of these are
summarized below.
Growth Curve Analyses
Growth curve analyses are used to provide a more sensitive and accurate portrayal of the changes
in individual children’s performance over time. The hypothesis being tested is whether children in
the Transition Demonstration group show more rapid gains and whether they maintain or accelerate
their skill levels in subsequent years at a higher level than comparison children do. These involved
calculating individual growth curves for each child on all 5 measures related to academic
competence. Specifically, a technique known as B-spline allows modeling the exact shape of the
curve over time, and then permits analysis and display of these curves in ways that take into account
differences in children’s ages and their entry level skills. A more detailed description of this
statistical methodology is provided in Technical Report 5. The results of the growth curve analysis
provide a much more accurate depiction of the rate and nature of children’s changes in test
performance over time.2
These growth curve analyses were studied for individual sites and reviewed nationally in terms
of regularities in patterns of these growth curves. Overall, only five sites had statistically
significant, usually small magnitude, differences in children’s growth curves as a function of
treatment. Further, the differences were not consistent across test measures and the demonstration
and comparison groups did not differ significantly in any consistent way.
Examples of differences in the patterns across the 28 sites included in these analyses are worthy
of some scrutiny. In Figure 12.2, an example is provided of the most common pattern, observed in
20 sites, in which children in both the demonstration and comparison group show a rapid early rise
over the first two or three years in school in scores on the math and reading subtests and somewhat
less of an increase in their receptive language skills. These sites essentially mirror what the national
composite showed above. Across the sites, the slope of this early gain, as well as the exact entry
Chapter 12 - Page 147

Figure 12.2. Examples: rapid early rise in scores.
Chapter 12 - Page 148

levels and final achievement of the children varied. Further, for many sites, a slight drop-off in
scores between the third and fourth years in school was noted. In general, however, the patterns
toward clear gains from kindergarten to the end of the fourth year in school was remarkable. A
second pattern, observed in five sites, was that of improvement to a much lesser degree. Finally,
there were only 2 sites that did not show the general national pattern of improvement in children’s
scores.
Hierarchical Linear Models Applied to Outcomes.
Another data analytic approach, based on growth curves as well, involved applying a complex
hierarchical linear model (HLM) to these children’s test scores to evaluate whether multiple
influences could be contributing to patterns of change, and the extent to which local site factors may
be contributing to outcomes. The same hypothesis is being tested, but the statistical methodology
is considered particularly well suited to the study’s design. Specifically, hierarchical linear modeling
(HLM) is well suited to handling multiple data irregularities in a complex, longitudinal data set. The
results are both complex and informative. First, the findings about treatment effects are neither large
nor highly consistent across all outcomes or present in models. Second, some of the HLM analyses
do reveal some very small differences in the growth curve patterns of children in the treatment versus
comparison groups. When detected, these group differences favored children in the Transition
Demonstration group. Third, post hoc analyses to explore the likely basis for theses differences
associated with participating in the Transition Demonstration program have not provided clear
support for the major hypothesis that sites with the strongest programs would yield the largest
benefits, or that sites with the least “competition” from comparison schools would show greater
group differences than those with strong competition (that is, Head Start-like supports provided to
families and children in both treatment and comparison groups).
Our guiding principle in interpreting the results has been that there must be consistent findings
and a reasonably plausible explanation of these findings to substantiate a major conclusion. At the
same time, we think that even small or inconsistent findings should at least be mentioned in this final
report -- in order to indicate the complexity of issues and to stimulate continued analyses of this
unique longitudinal study.
Chapter 12 - Page 149

Dr. Margaret Burchinal lead the analyses and authored the following section on the HLM analyses
which describes patterns of development from entry to kindergarten through the child’s third or fourth
year of school. Child and family, school, and community characteristics that have theoretical links
to transition to school were identified. The following variables were included:
Child/family:
gender (child)
whether English is the primary language in household
whether the child ever had a IEP for a learning-related disabilities
maternal education
whether parent has partner in household
whether parent is depressed
family involvement
parental attitudes
School:
treatment & treatment implementation
teacher ratings of school climate
transition practices
percent of children in poverty for LEA
Community
Neighborhood scales (Barriers)
location of LEA – from inter-city to rural
Hierarchical linear models were conducted on the five major outcomes (Woodcock Johnson-
Reading, Woodcock Johnson-Math, parent rating of children’s social skills, and teacher ratings of
children’s social skills) to describe patterns of development of reading, math, and social skills as
reported by the parent and teacher. Individual quadratic growth curves were estimated and individual
growth parameters were estimated from the selected child/family, school, and community blocks of
variables.
Results are shown on the following pages. The top row of the tables list the number of
assessments included in the analyses. The next three rows describe the individual growth curve
parameters, listing the mean and random-effects variance for the individual growth curve parameters. Chapter 12 - Page 150

The test of the mean coefficient asks whether the parameter estimate, averaged over the sample,
differed from zero. This is interesting for the linear and quadratic slopes because it indicates the
extent to which children’s scores are changing over time. The test of the mean of the intercept is less
interesting because it tests whether the mean score was zero, a value that is not possible on any of the
outcomes. The test of variances provides information about whether there are systematic individual
differences in terms of overall level, linear rate of change, and quadratic rate of change. As shown
in Table 31, the children showed substantial differences in overall level, linear change, and quadratic
change for math, reading, and language scores over time.
The rest of the table lists the results of tests of the joint contribution of the child/family,
school, and community blocks and individual regression coefficients for predicting the individual
growth curve parameters. The block test indicates whether the set of variables is reliably related to
that individual growth curve parameter (e.g., the block test for the school variables in predicting the
individual growth linear slope parameter tests whether aspects of the school were related to the rate
of acquisition of that skill). The individual coefficients indicate the magnitude of the association for
a specific predictor, given all of the other variables in the model.
Math (see Table 31). The analyses indicated that children were clearly acquiring math skills
during the four years of this study. The individual growth curves suggest that children were scoring
at about 425 on average when they were 6 years of age. The rate of acquisition was steeper during
the first years of school than during second and third grade, resulting in significant linear and
quadratic individual growth curve parameter estimates. These individual growth curve estimates were
significantly related to the selected child/family, school, and community predictors.
The child and family block of variables significantly predicted children’s overall level, but not
rate of linear or quadratic change over time. Higher math scores were associated with
being a girl and having a mother with more education, more responsive and nonrestrictive
child rearing attitudes, and less depression.
The school block of variables significantly predicted children’s overall level of math skills,
linear rate of change, and quadratic rate of change. Each of these variables is discussed
separately.
• The treatment was considered part of the school block since it was a school level
intervention. The intervention children showed slightly more gains in math
skills initially, followed by slightly more leveling off in the rate of acquisition
Chapter 12 - Page 151

by 9 years of age (see Figure 12.3). The “treatment effect” was .6 points at
age 6, 1.3 points at age 7, 1.5 points at age 8, and 1.4 points at age 9 (the
children’s ages ranged from less than 5 to more than 10, but 90% of the
assessments were collected between the ages of 5.4 and 9.4 years)
• The school climate was related to linear and quadratic rates of change over time.
Figure 12.4 shows the predicted group growth curve for children in schools at
the 25% and 75% on the school climate measure. Children at schools with
higher levels of school climate showed slightly higher math scores at age 9 (.5
points), but lower scores at earlier ages.
• The use of transition practices was related to all three individual growth curve
parameters. Figure 12.5 shows the predicted group growth curve for children
in schools at the 25% and 75% on the transition practices measures. Children
in schools at the 75% score for transition activities showed higher math scores
than children in schools at the 25% score for transition activities at ages 6 (1.3
points), 7 (2.4 points), and 8 (1.9 points), but not at age 9 (-.4 points).
• The percentage of children in poverty in the LEA was related to linear and quadratic
rates of change over time. Figure 12.6 shows the predicted group growth
curve for children in schools at the 25% and 75% on the poverty measure.
Children at schools with higher levels of poverty showed slightly more gains
in math, especially during the first years of school, with differences of 1.9
points at age 6, .8 points at age 7, .6 points at age 8, and 1.1 points at age 9.
The community block was related only the estimated individual intercept. Children in
communities with more barriers tended to have slightly lower math scores over time.
Reading (Table 31). The analyses indicated that children were clearly acquiring reading skills
during the four years of this study. The individual growth curves suggest that children were scoring
at about 400 on average when they were 6 years of age. The rate of acquisition was steeper during
the first years of school than during second and third grade, resulting in significant linear and
quadratic individual growth curve parameter estimates. These individual growth curve estimates were
significantly related to the selected child/family, school, and community predictors.
Chapter 12 - Page 152

The child and family block of variables significantly predicted children’s overall level, linear
rate of change, and quadratic rate change over time. Higher reading scores at age 6 were
associated with being a girl, and having a mother with more education, more responsive
and nonrestrictive child rearing attitudes, and less depression. Girls tended to acquire
reading skills slightly more quickly, but also showed more deceleration in second and
third grade. Similarly, children with mothers with more education, with a partner in the
household, with depressive symptoms, and more progressive childrearing attitudes
showed faster acquisition of reading skills, especially during the first years of school.
The school block of variables significantly predicted children’s overall level of math skills,
linear rate of change, and quadratic rate of change. Each of these variables is discussed
separately.
• The treatment was considered part of the school block since it was a school level
intervention. The intervention children showed slightly more gains in reading skills
initially, followed by slightly more leveling off in the rate of acquisition by 9 years of
age (see Figure 12.7). The “treatment effect” was 1.0 points at age 6, 2.0 points at
age 7, 3.3 points at age 8, and 1.3 points at age 9 (the children’s ages ranged from less
than 5 to more than 10, but 90% of the assessments were collected between the ages
of 5.4 and 9.4 years)
• The school climate was related to linear and quadratic rates of change over time.
Figure 12.8 shows the predicted group growth curve for children in schools at the 25%
and 75% on the school climate measure. Children at schools at the 75% score on
school climate showed slightly higher reading scores at age 9 (.6 points) than children
at school at the 25% score on school climate, but slightly lower scores at earlier ages.
• The use of transition practices was related to all three individual growth curve
parameters. Figure 12.9 shows the predicted group growth curve for children in
schools at the 25% and 75% on the transition practices measures. The use of these
practices was related to better reading scores for younger children, with the difference
between the scores for schools at the 75% and 25% scores on transition practices
being 2.8 points for 6 year-olds, 6.1 points for 7 year-olds, 5.1 points for 8 year-old,
and -.5 points for 9 year-olds.
• The percentage of children in poverty in the LEA was not related to any of the
Chapter 12 - Page 153

individual growth curve parameters describing patterns of reading skill over time
(Figure 12.10).
The community block was related to all three individual growth curve parameters.
Children in communities with more barriers tended to have slightly lower reading
scores over time and to gain reading skills slightly more slowly. Children in more
urban settings tended to score slightly higher, show gains across time, and less
deceleration during second and third grade.
Language (Table 31). The analyses indicated that children were clearly acquiring language
skills during the four years of this study. The individual growth curves suggest that children were
scoring at about 85 on average when they were 6 years of age. The rate of acquisition was steeper
during the first years of school than during second and third grade, resulting in significant linear and
quadratic individual growth curve parameter estimates. These individual growth curve estimates were
significantly related to the selected child/family, school, and community predictors.
The child and family block of variables significantly predicted children’s overall level, but not
rate of linear or quadratic change over time. Higher language scores were associated with
having English spoken at home, and having a mother with more education, more
responsive and nonrestrictive child rearing attitudes, and more involvement in educational
activities. Boys showed slightly more gains over time in language than did girls.
Additionally, children whose families did not speak English at home, and children whose
mothers were depressed showed slightly more gains in language skills over time, although
the gains for children whose mothers were depressed were largely during the first years
of school.
The school block of variables significantly predicted children’s linear and quadratic rate of
change in language skills. Treatment was not related to language scores, but children at
schools that used more transition practices tended to show slightly greater gains and less
“leveling off” in second and third grades (Figure 12.11). Children in LEAs with more
poverty showed slightly greater gains in language initially, but began to lag behind other
children by second to third grade.
The community block was related only the estimated individual intercept. Children in
communities with more barriers tended to have lower language scores over time.
Chapter 12 - Page 154

Math Reading Language
Number of assessments 11016 11022 10556
Individual Growth Curves B (var) B (var) B (var)
Intercept 421.05 (109.2***) 395.89 (204.5***) 83.17 (31.25***)
Linear Slope 25.38***(18.96***) 35.86 ***(154.94***) 8.74***(2.80***)
Quadratic Slope -1.49***(.92***) -2.49 ***(10.35***) -1.04*** (.39***)
Population Growth Curve- with child, family, school, and community predictors (includes random
age-squared term)
Site *** *** ***
Predictors of Intercept B (se) B (se) B (se)
Child, family (block test, p<.0001) (block test, p<.0001) (block test, p<.0001)
Child gender 1.02* (.45) 2.37** (.62) -.15(.24)
English as home lang -.59 (1.00) .71 (1.35) 8.78***(.552)
M. education 1.82*** (.29) 2.62*** (.39) 1.41***(.15)
Partner in HH .41 (.48) .83 (.65) .35 (.25)
M. depression -1.11* (.47) -1.27* (.64) -.37 (.25)
Family Involvemt -.14 (.33) -.01 (.45) -.53** (.17)
Parent Attitudes (PDI) 1.68*** (.31) .84* (.42) 1.64***(.16)
School (block test, p<.0001) (block test, p<.0001) (block test, p=.17)
Demonstration trtmt .61 (.48) .99 (.66) .50 (.26) p=.051
School Climate -.39 (.34) -.39 (.48) -.10 (.18)
Transition Practices 1.23*** (.18) 2.84***(.25) .08 (.10)
% children in poverty -.16 (.11) -.10 (.14) -.06 (.06)
Community (block test, p=.023) (block test, p=.007) (block test, p=.0005)
Barriers -.27** (.10) -.33* (.14) -.21*** (.05)
locale (urban to rural) -.15 (.24) -.64* (.32) .02 (.13)
Table 31- HLM Analyses of Academic and Language Scores Over Time
Chapter 12 - Page 155
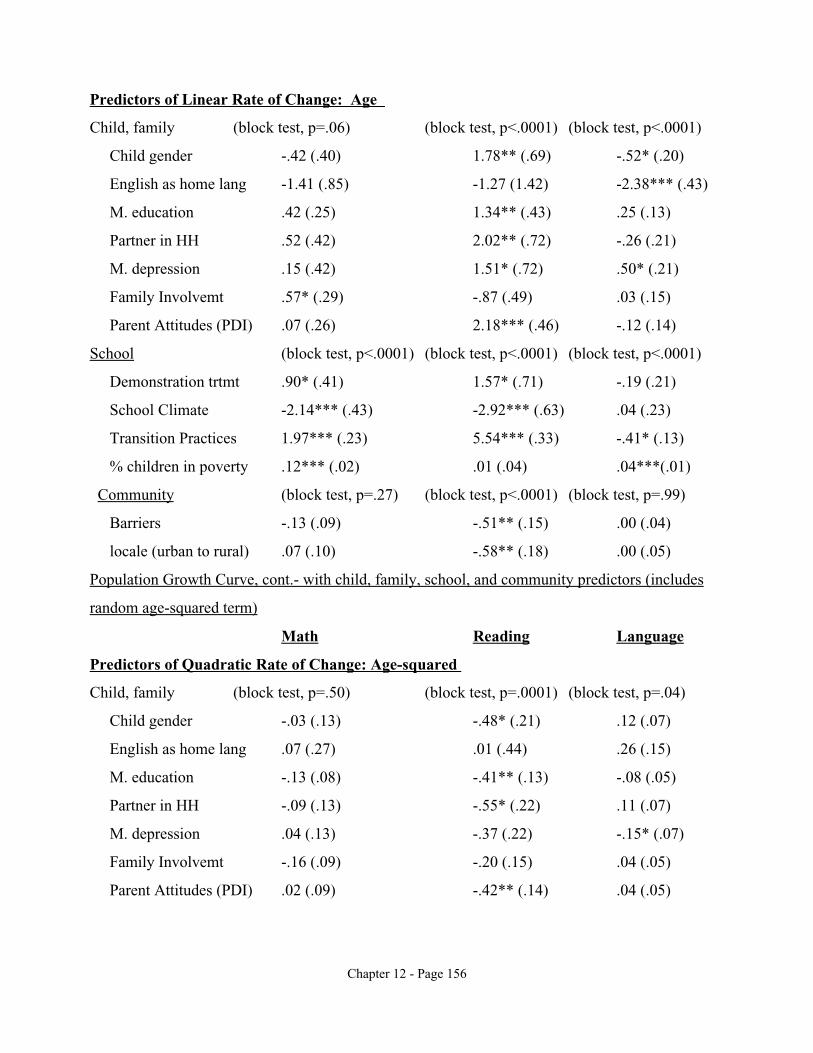
Predictors of Linear Rate of Change: Age
Child, family (block test, p=.06) (block test, p<.0001) (block test, p<.0001)
Child gender -.42 (.40) 1.78** (.69) -.52* (.20)
English as home lang -1.41 (.85) -1.27 (1.42) -2.38*** (.43)
M. education .42 (.25) 1.34** (.43) .25 (.13)
Partner in HH .52 (.42) 2.02** (.72) -.26 (.21)
M. depression .15 (.42) 1.51* (.72) .50* (.21)
Family Involvemt .57* (.29) -.87 (.49) .03 (.15)
Parent Attitudes (PDI) .07 (.26) 2.18*** (.46) -.12 (.14)
School (block test, p<.0001) (block test, p<.0001) (block test, p<.0001)
Demonstration trtmt .90* (.41) 1.57* (.71) -.19 (.21)
School Climate -2.14*** (.43) -2.92*** (.63) .04 (.23)
Transition Practices 1.97*** (.23) 5.54*** (.33) -.41* (.13)
% children in poverty .12*** (.02) .01 (.04) .04***(.01)
Community (block test, p=.27) (block test, p<.0001) (block test, p=.99)
Barriers -.13 (.09) -.51** (.15) .00 (.04)
locale (urban to rural) .07 (.10) -.58** (.18) .00 (.05)
Population Growth Curve, cont.- with child, family, school, and community predictors (includes
random age-squared term)
Math Reading Language
Predictors of Quadratic Rate of Change: Age-squared
Child, family (block test, p=.50) (block test, p=.0001) (block test, p=.04)
Child gender -.03 (.13) -.48* (.21) .12 (.07)
English as home lang .07 (.27) .01 (.44) .26 (.15)
M. education -.13 (.08) -.41** (.13) -.08 (.05)
Partner in HH -.09 (.13) -.55* (.22) .11 (.07)
M. depression .04 (.13) -.37 (.22) -.15* (.07)
Family Involvemt -.16 (.09) -.20 (.15) .04 (.05)
Parent Attitudes (PDI) .02 (.09) -.42** (.14) .04 (.05)
Chapter 12 - Page 156

School (block test, p<.0001) (block test, p<.0001) (block test, p<.0001)
Demonstration treatment -.22 (.13) -.48* (.22) .03 (.07)
School Climate .84*** (.14) 1.08*** (.21) .00 (.08)
Transition Practices -.83*** (.08) -2.22*** (.11) .17***(.04)
% children in poverty -.03** (.01) -.01 (.01) -.01 (.004)
Community (block test, p=.85) (block test, p=.0002) (block test, p=.69)
Barriers .00 (.03) .08 (.05) -.01 (.02)
locale (urban to rural) -.02 (.03) .20*** (.05) .00 (.02)
Teacher ratings on SSRS (Table 32). The analyses indicated that teachers tended to rate
the children close to the expected mean (100), but that second and third grade teachers were rating
the children less positively than kindergarten and first grade teachers. Children showed
systematic individual differences in their overall level and linear rate of change over time. In
contrast, the quadratic, not linear, rate of change averaged over children was significantly different
from zero. These individual growth curve estimates were significantly related to the selected
child/family, school, and community predictors.
The child and family block of variables significantly predicted children’s overall level, but
not rate of linear or quadratic change over time. Higher teacher ratings were
associated with having English not spoken at home, and having a mother with a
partner in the home, less depression, and more responsive and nonrestrictive child
rearing attitudes.
The school block of variables significantly predicted children’s intercept and quadratic rate
of change in language skills. Treatment was not related to language scores, but
children at schools with higher scores on school climate were rated higher on average.
Children in LEAs with more poverty tended to lag farther behind other children by
second to third grade (see figure 12.12).
The community block was related only the estimated individual intercept. Children in
communities with more barriers tended to have lower teacher ratings over time.
Parents ratings on SSRS (Table 32). The analyses indicated that parents tended to rate the
children below the expected mean (100), but their ratings increased over time. Children showed
systematic individual differences in their overall level and linear rate of change over time. These
individual growth curve estimates were significantly related to the selected child/family and
Chapter 12 - Page 157

community predictors, but not school predictors
The child and family block of variables significantly predicted children’s overall level and
rate of linear change over time. Higher parent ratings were associated with being a
girl, having English not spoken at home, and having a mother with more education,
less depression, less education activities, and more responsive and nonrestrictive child
rearing attitudes. Children in which English was not spoken in the household showed
larger changes over time in parent ratings
The school block of variables did not significantly predict children’s intercept or linear and
quadratic rate of change. However, treatment was related to parents’ ratings at age 6
(see Figure 12.13). Treatment parents rated their children higher on the SSRS than
comparison parents.
The community block was related to the estimated individual intercept and quadratic rate
of change. Children in communities with more barriers tended to have lower parent
ratings over time, with slightly less deceleration in the rate of change.
Table 32- HLM Analyses of Parent and Teacher SSRS Ratings
Teacher Parent
Number of assessments 8251 10810
Individual Growth Curves B (var) B (var)
Intercept 98.19 (101.2***) 90.87 (117.07***)
Linear Slope .54 (5.92***) 2.27***(9.81**)
Quadratic Slope -.40*** (1.69) -.12 (.42)
Population Growth Curve- with child, family, school, and community predictors (includes random
age-squared term)
Site *** ***
Predictors of Intercept B (se) B (se)
Child, family (block test, p<.0001) (block test, p<.0001)
Child gender .92 (.63) -2.89** (.48)
English as home language -5.90*** (1.34) -3.39** (1.03)
Chapter 12 - Page 158

M. education .65 (.40) 1.03*** (.30)
Partner in HH 1.79** (.67) -.85 (.51)
M. depression -1.90** (.66) -2.77*** (.50)
Family Involvement -.55 (.46) -3.47*** (.35)
Parent Attitudes (PDI) 1.87*** (.43) 1.53*** (.33)
School (block test, p<.0001) (block test, p=.26)
Demonstration treatment -.35 (.67) 1.14* (.51)
School Climate 3.62*** (.60) .09 (.39)
Transition Practices -.54 (.33) -.03 (.20)
% children in poverty .03 (.12) .06 (.11)
Community (block test, p=.023) (block test, p<.0001)
Barriers -.36*** (.10) -.74*** (.11)
locale (urban to rural) -.00 (.29) .48 (.25)
Predictors of Linear Rate of Change: Age
Child, family (block test, p=.76) (block test, p=.004)
Child gender .09 (.76) .30 (.43)
English as home language -.63 (1.57) -3.27*** (.89)
M. education .06 (.47) .23 (.27)
Partner in HH .32 (.79) .36 (.45)
M. depression .28 (.79) .60 (.45)
Family Involvement .45 (.55) -.52 (.31)
Parent Attitudes (PDI) -.79 (.50) .30 (.29)
School (block test, p=.12) (block test, p=.58)
Demonstration treatment .94 (.78) .43 (.45)
School Climate 1.03 (.84) .38 (.47)
Transition Practices .63 (.47) -.27 (.26)
% children in poverty .13** (.05) -.01 (.03)
Community (block test, p=.88) (block test, p=.051)
Barriers -.08 (.16) -.22* (.09)
Chapter 12 - Page 159

locale (urban to rural) -.02 (.20) -.04 (.11)
Population Growth Curve, cont.- with child, family, school, and community predictors (includes
random age-squared term)
SSRS Teacher SSRS Parent
Predictors Quadratic Rate of Change: Age-squared
Child, family (block test, p=.89) (block test, p=.74)
Child gender .23 (.23) -.00* (.15)
English as home language .22 (.47) .56 (.31)
M. education .01 (.14) .00 (.09)
Partner in HH -.07 (.24) -.04 (.15)
M. depression .03 (.24) -.11 (.15)
Family Involvement -.09 (.17) .04 (.11)
Parent Attitudes (PDI) .15 (.15) -.02 (.10)
School (block test, p=.02) (block test, p=.87)
Demonstration treatment -.29 (.23) -.15 (.15)
School Climate -.25 (.26) -.08 (.16)
Transition Practices -.07 (.14) .02 (.09)
% children in poverty -.04** (.01) -.00 (.01)
Community (block test, p=.96) (block test, p=.02)
Barriers .01 (.05) .09** (.03)
locale (urban to rural) .00 (.06) .01 (.04)
Chapter 12 - Page 160

Figure 12.3: Math - predicted quadratic growth curve with DC treatment.
Chapter 12 - Page 161

Figure 12.4: Math - predicted quadratic growth curve and school climate.
Chapter 12 - Page 162

Figure 12.5: Math - predicted quadratic growth curve and school transition practices.
Chapter 12 - Page 163

Figure 12.6: Math - predicted quadratic growth curve for children in high and low poverty schools.
Chapter 12 - Page 164

Figure 12.7: Reading - predicted growth curve with DC treatment.
Chapter 12 - Page 165

Figure 12.8: Reading - predicted quadratic growth curve and school climate.
Chapter 12 - Page 166

Figure 12.9: Reading - predicted quadratic growth curve and school transition practices.
Chapter 12 - Page 167

Figure 12.10: Reading - predicted quadratic growth curve for children in high and low poverty schools.
Chapter 12 - Page 168

Figure 12.11: Language - predicted quadratic growth curve and school transition practices.
Chapter 12 - Page 169

Figure 12.12: Language - predicted quadratic growth curve for children in high and low poverty schools.
Chapter 12 - Page 170

Figure 12.13: Parent SSRS - predicted quadratic growth curve with DC treatment.
Chapter 12 - Page 171

Summary of HLM findings. Undoubtedly, many types of influences contribute to
variations in children’s academic and language test scores. The central focus of the study was on
the importance of having special types of supports and services provided to maximize positive
transition-to-school experiences for former Head Start children. The HLM analysis that
considered the greatest number of factors that potentially could influence children’s achievement
scores did not find consistent advantages -- of being in the Demonstration, attending schools with
a more positive school climate, and the availability of more “transition practices” (such as
gathering information about a child prior to entering kindergarten and ensuring curriculum
continuity in the early elementary school years).
Because many sites did not implement the Transition Demonstration program in a strong
or uniform way (see Chapter 5), we decided to explore in a post hoc descriptive way the extent to
which these findings from the National Study may have been diluted in magnitude because of
weak program implementation. Further, as discussed in Part 2 of this report, a majority of sites
experienced local competition, where the comparison schools frequently provided similar Head
Start-like supports to the children and families, sometimes with other special grant funds or local
initiatives. In these post hoc analyses, we compared sites that did not have strong competition
and also looked at those that implemented stronger versus weaker educational programs and
parent involvement programs. Contrary to what we hypothesized, even the stronger programs
with the least competition did not show evidence that participating children were more likely to
have individual growth curves that were more favorable than those in less positive school
settings. Thus, at this point, we conclude that the advantages of the Transition Demonstration
Program are not confirmed strongly in any of the analyses. We recognize that this conclusion
may be weakened, however, if almost all of those schools had been enacting effective programs.
Teachers’ Judgements of Children’s Academic Achievement
Teachers’ ratings of children’s academic achievement correlated significantly with direct
assessment of children’s reading, math, and receptive vocabulary skills. The correlations were
much higher between both the reading and math subtest scores and teachers’ ratings of school
achievement than they were between receptive vocabulary and teachers’ overall appraisal of
children’s academic performance. Specifically, the correlations between teacher ratings in
second and third grade and children’s scores on standardized achievement tests of Letter-Word
Recognition (r=.54, p<0.0001) and Passage Comprehension (r=.50, p<0.0001) were somewhat
Chapter 12 - Page 172

higher than for Math Computation (r=.45, p<0.001) and Applied Problems (r=.50, p<0.001),
which in turn were much higher than the correlation with the Peabody Picture Vocabulary Test
(r=.31, p<0.001). Not unexpectedly, all of these correlations were somewhat lower during the
kindergarten year, except for the Peabody Picture Vocabulary Test, which was essentially the
same. During the kindergarten year, teachers may have fewer opportunities to directly assess
children’s emerging literacy and math skills, since these are not taught systematically until the
first grade.
Chapter 12 - Page 173

Tab
le 3
3. C
hild
out
com
es b
y fa
mily
typ
e*
Bri
ef
Des
crip
tion
R
esou
rcef
ul
Sing
le P
aren
t W
elfa
re
For
eign
L
angu
age
Hig
hly
Mob
ile
Mot
her
Abs
ent
Chr
onic
Hea
lth
Pro
blem
R
ecen
tly
Hom
eles
s
D
C
D
C
D
C
D
C
D
C
D
C
D
C
WJ-
Rea
ding
Sta
ndar
d Sc
ore
K
n=80
0
90.6
1
(13.
36)
n=76
1
90.1
1
(12.
96)
n=57
4
87.7
0
(12.
70)
n=48
4
87.0
2
(12.
25)
n=11
0
86.1
7
(12.
85)
n=85
89.0
1
(14.
43)
n=93
86.7
5
(13.
05)
n=84
83.6
1
(12.
20)
n=88
87.8
1
(13.
31)
n=76
87.5
5
(12.
51)
n=53
84.7
0
(10.
13)
n=52
90.9
2
(11.
84)
n=61
86.1
1
(10.
72)
n=45
85.0
0
(11.
81)
3 n=
816
100.
22
(16.
32)
n=77
8
101.
41
(15.
66)
n=59
3
94.9
3
(17.
08)
n=50
0
95.6
7
(16.
90)
n=12
2
95.0
0
(14.
86)
n=93
99.3
5
(15.
28)
n=10
3
96.3
9
(17.
67)
n=85
94.5
8
(15.
06)
n=91
96.3
0
(15.
76)
n=77
97.6
5
(15.
91)
n=57
96.7
5
(17.
01)
n=58
98.5
2
(18.
64)
n=63
95.5
1
(14.
39)
n=47
92.2
6
(15.
12)
WJ-
Mat
h St
anda
rd S
core
K
n=80
0
86.1
1
(15.
93)
n=76
1
86.7
9
(16.
21)
n=57
4
82.7
7
(16.
14)
n=48
5
81.7
4
(15.
55)
n=11
0
81.8
8
(17.
40)
n=85
82.6
5
(16.
92)
n=93
83.6
8
(16.
95)
n=84
78.6
9
(17.
47)
n=88
81.8
9
(15.
46)
n=76
82.9
3
(15.
01)
n=53
80.9
8
(15.
87)
n=52
86.3
1
(15.
49)
n=61
81.3
0
(15.
20)
n=45
81.3
6
(16.
93)
3 n=
816
104.
08
(17.
66)
n=77
9
104.
28
(16.
81)
n=59
2
96.8
0
(18.
85)
n=50
0
98.2
9
(19.
07)
n=12
2
100.
54
(14.
99)
n=93
103.
20
(16.
97)
n=10
3
97.5
5
(18.
72)
n=85
95.1
4
(17.
06)
n=91
97.4
4
(17.
52)
n=77
99.0
5
(16.
66)
n=57
97.6
8
(20.
00)
n=58
99.6
7
(21.
33)
n=63
96.1
3
(16.
09)
n=47
100.
21
(19.
18)
Soci
al S
kills
Rat
ing
Syst
em-T
each
er (
Aca
dem
ic)
K
n=79
6
92.8
6
(15.
14)
n=77
0
93.1
2
(14.
84)
n=58
7
87.7
2
(15.
41)
n=48
8
87.6
3
(14.
92)
n=11
7
92.6
4
(13.
75)
n=91
95.7
5
(14.
14)
n=97
87.4
4
(15.
74)
n=83
86.0
4
(15.
44)
n=90
87.5
7
(16.
48)
n=77
87.7
8
(12.
99)
n=54
88.7
6
(15.
69)
n=55
90.7
6
(15.
43)
n=60
86.4
0
(16.
37)
n=46
88.6
1
(14.
93)
3 n=
817
91.4
0
(14.
68)
n=77
9
92.0
6
(14.
39)
n=59
2
87.4
1
(14.
66)
n=49
9
86.1
5
(14.
88)
n=12
2
92.8
4
(13.
28)
n=92
93.7
9
(14.
32)
n=10
3
87.9
5
(15.
57)
n=85
86.9
9
(14.
29)
n=91
85.0
4
(14.
65)
n=77
87.0
3
(14.
90)
n=57
88.2
5
(17.
39)
n=58
90.0
2
(16.
50)
n=63
85.7
5
(17.
28)
n=47
87.3
4
(14.
34)
* L
ongi
tudi
nal s
ampl
e in
clud
es s
core
s fo
r fa
mily
uni
ts in
whi
ch th
ere
is a
fam
ily in
terv
iew
, chi
ld a
sses
smen
t, an
d te
ache
r in
terv
iew
in k
inde
rgar
ten
(fal
l and
/or
spri
ng)
and
end
poin
t (se
cond
and
/or
thir
d gr
ade)
. D
ata
from
29
site
s in
clud
ed in
ana
lysi
s.
Cha
pter
12
- Pa
ge 1
74

Overall, two interesting findings emerged about teachers’ ratings of children’s academic
competence. One was that teachers tended to rate children somewhat lower compared to national
norms than their actual test performance indicated. The reasons for this are not readily apparent.
One possibility is that teachers may be making comparisons within the classroom between
former Head Start children and non-Head Start children, and may see these children as still
somewhat lower in their overall academic competency -- even if objective indicators place them
close to or above national averages. Another possibility is that teachers’ ratings may take into
account much more than just the children’s math and reading skills that are assessed on the
Woodcock-Johnson, and thus may reflect some true differences in children’s overall fund of
knowledge or other classroom skills. In fact, teachers’ average ratings of the children place them
toward the low end of the normal range.
A second finding is that teachers’ ratings do not suggest any pattern of gains or growth in
children’s relative academic standing, unlike the direct assessments of their skills. Again, the
reasons for this are not readily apparent. Each year, different teachers rate the children. Do these
teacher ratings indicate possible bias or negative appraisal of children that follow them from year
to year and obscure true gains they are realizing? Or do the ratings by independent teachers
prevent teachers from observing the relative gains former Head Start children have made since
their kindergarten entry? In the absence of information about the trends for classmates who were
not previously in Head Start and those who are not from low income homes, it is difficult to
reach any conclusion.
Parent Ratings of Children’s Academic Adjustment
The parents’ ratings of children provide an exceptionally positive picture. Even though a
scale of 0-10 points was provided, the parents as a group used only the upper ranges. Table 34
summarizes parent ratings, providing means and standard deviations where 10 is the highest
rating. No significant group differences were found between Transition Demonstration and
comparison groups at either the start or the end of the study period. Also, parent ratings did not
show much change between the spring of kindergarten and the end of the third or fourth year in
school, although their overall estimation of how well their children were doing was slightly lower
at the end for how well children were doing academically, how well they got along with their
teachers, and their overall school adjustment.
Chapter 12 - Page 175

Although parent appraisals of their children’s school performance are undoubtedly
important for families and for children, the limited range in these scores indicates that parents’
ratings do not show an orderly relationship to either teacher appraisals or to children’s objective
test performance.
Table 34. Parent ratings of children’s adjustment to school (scale of 0 - 10)
First year Final year
Demonstration Mean (s.d.)
Comparison Mean (s.d.)
Demonstration Mean (s.d.)
Comparison Mean (s.d.)
How much child likes school 8.7 (1.76) 8.7 (1.73) 8.0 (1.97) 8.0 (1.98)
How much effort child puts into trying to do well in school
8.3 (1.76) 8.33 (1.72) 7.82 (1.95) 7.8 (1.96)
How well child actually does in school
7.7 (1.79) 7.7 (1.81) 7.4 (1.93) 7.4 (2.00)
How well child gets along with teacher
8.6 (1.76) 8.6 (1.89) 8.2 (2.14) 8.1 (2.10)
How well child get along with other children at school
7.8 (1.85) 8.0 (1.82) 7.7 (1.91) 7.7 (1.95)
Rating of overall adjustment to school
8.4 (1.62) 8.4 (1.72) 8.1 (1.87) 8.0 (1.86)
Figure 12.14 Percentage of childrenwithpositive school impressions:
Kindergarten and third grade
100
90
80
70
60
50
40 I like school I dowell in I get along Schoolis Schoolis I try hardin My teacher
school well with important to important to school helpsme other me my parents learn
children
Kindergarten Third grade
Children’s Impressions of Their Own
School Adjustment
Like parents, children presented a
positive picture of their school adjustment,
although there was somewhat greater diversity
in children’s own ratings of how well they
were doing. This is particularly noteworthy
since children used only a 3-point scale
indicating very positive, moderate, or
somewhat low or negative impressions for
each item. Figure 12.14 summarizes
Chapter 12 - Page 176

Figure 12.15 Academic performance ofchildrenwithmore andless positive
ratings of school in kindergarten
Woodcock-JohnsonMath 10
00
90
80
70
60
50
1
1
Woodcock-JohnsonReading
110
100
90
80
70
60
50First year Second year Third year Fourth year
Children with more positive ratingsin K Children withless positive ratingsin K
children’s positive appraisals of schools. Age-trends are apparent for 7 of the 8 items analyzed.
Specifically, older children provide less positive ratings for how much they like school; how well
they think they are doing in school -- the area with the most marked decline over the first four years
in school; and how well they get along with peers. Over these same years, they also indicate that
they think school is increasingly important, that they really want to do well in school, and that they
try hard to do their best -- with over 90% of the former Head Start children rating school as very
important and indicating they try at high levels to do well. They also confirm that the vast majority
of their parents think doing well in school is very important -- with 95 percent rating their parents
as valuing school at the highest level by the end
of the fourth year in school. These impressions
clearly defy a negative stereotype that these
children and their parents do not believe that
school is important or that the children are not
motivated to do their best. Interestingly, even in
the spring of kindergarten, the clear majority of
children (81%) rate their teachers as being very
good at helping them learn new things, and these
positive appraisals of teachers increase to even
higher levels (88%) by the end of their fourth
year in school.
An earlier report indicated that only a
small percentage of former Head Start children
(Ramey, Lanzi, Phillips, & Ramey, 1998)
provide extremely negative self-appraisals of
their progress in school and how much they like
school -- about 7 percent. These children, in
fact, are ones who show significantly poorer
academic progress as indicated by both their test
scores on the Woodcock-Johnson Tests of
Achievement (see Figure 12.15) and their
teachers’ ratings of their academic and social development (Figure 12.16). Note that the children’s
Chapter 12 - Page 177

Figure 12.16 Teacher ratings ofchildren’sperformance
Social skills
Academic Competence
First year Second year Third year Fourth year
Children with more positive ratingsin K Children withless positive ratingsin K
110
100
90
80
70
60
50
110
100
90
80
70
60
50
receptive language scores (PPVT) do not differ
significantly at school entry or thereafter.
These findings indicate that children’s
self-appraisals, even as early as kindergarten,
when they are quite young and cognitively not
very sophisticated in making comparative
judgments, reflect that children’s own reports
about school adjustment provide meaningful
information. Further analyses of children’s self-
reports indicate that including their self-appraisal
in a statistical model predicting school success
significantly increases the fit of this model. That
is, children’s impressions of how much they like
school and how well they are doing provides
useful information over and above their entry
level skills, teacher ratings, and parent ratings (S.
Ramey, Lanzi, Phillips, & Ramey, 1999).
Further, as Figure 12.17 shows, former Head
Start children who report in kindergarten that
things are not going well are significantly more
likely to be placed in special education by the
end of their fourth year in school. This is
particularly noteworthy because their rates of
special education placement were comparable in
kindergarten. Yet, the children who reported
less favorably on their school experiences had
more than a twofold increase in special
education assignment -- from 1 percent in
kindergarten to 24 percent four years later.
Figure 12.17 Special education placements
of children with more and less positive ratings of school
13 14
11
26
0
5
10
15
20
25
30
Kindergarten Third grade
Children with more positive ratings in K Children with less positive ratings in K
Chapter 12 - Page 178

Indeed, those with low academic self-ratings also have higher than average rates of self-reported
difficulty in getting along with peers and teachers, and do not think their parents place as high a
value on doing well in school.
Social Adjustment
In kindergarten, teachers’ ratings of children’s social development indicate that children in
both the demonstration and comparison groups are essentially at the national average (national mean
= 100 with 3 points standard error of measurement). Teachers continued to rate children’s social
adjustment as quite close to national average.
Table 35: Ratings of Children’s Social Adjustment
Teacher Parent
Demonstration Mean (s.d.)
Comparison Mean (s.d.)
Demonstration Mean (s.d.)
Comparison Mean (s.d.)
First Year 99.5 (16.3)
99.2 (16.1)
90.4 (15.2)
91.6 (15.0)
Second Year 98.0 (16.7)
98.1 (16.4)
93.4 (15.6)
95.2 (15.8)
Third Year 98.3 (16.6)
97.7 (16.6)
95.3 (16.2)
97.6 (16.0)
Fourth Year 97.3 (16.5)
96.8 (17.0)
96.8 (15.9)
97.7 (15.9)
In contrast, parents initially rate their children almost 10 points lower than did teachers,
placing them at the low end of the normal range. Over the four years in school, however, parents’
ratings show a clear increase, such that by the end of the third or fourth year in school, the national
mean for parents’ ratings is just slightly below (by 2 to 3 points) the national average of 100.
Teachers’ and parents’ ratings of individual children’s social adjustment showed only very
low levels of correlation, from r = 0.15 (p < 0.001) in the spring of kindergarten to a high of r = 0.20
(p < 0.0001) at the end of the fourth year in school. This is commonly the case with ratings of
children’s behavior and probably reflects differences in how children behave in home versus school,
Chapter 12 - Page 179

as well as the fact that parents and teachers may have different standards. This low correlation
indicates several likely influences: parents and teachers may be attending to somewhat different
aspects of a child’s behavior; children may display different levels or types of behavior in school
than they do at home; and parents and teachers may have different standards in mind when rating
their children’s social behavior. The finding that parents initially gave much lower ratings of their
children than did teachers was not expected. Further, even though overall averages for teacher and
parent ratings were similar four years later, their ratings for an individual child still were only
modestly in agreement. This indicates that some children who are rated very highly by their teachers
are not necessarily the same children rated the most highly by their parents (and vice versa). The
overall increase over time in parents’ ratings may reflect their appreciation of children’s adjustment
to school, increased opportunities to observe children’s social competencies in new areas, and/or that
children are truly displaying increases in social development at home that are in line with parent
expectations.
As in the area of academic competence, the results regarding significant differences between
demonstration and comparison groups are complex. No significant differences in teacher ratings
were found, although HLM analyses detected a small effect when considering parent ratings, when
taking into account baseline group differences. Further, site by site analyses did not reveal any
consistent pattern of significant treatment effects. Because the children showed good levels of social
adjustment (close to the national average of 100) at all time periods, based on teacher ratings, there
was no reason to expect that the Transition Demonstration intervention would result in above
average performance.
Multi-perspective definition of “successful transitions”
The National Transition Research Consortium endorsed a definition of “successful
transitions” for children that emphasizes multiple, interactive components, integrating good
academic and cognitive development with social adjustment, positive feelings about school and
learning, and mutually supportive relationships among children, families, and schools. Following
on this conceptualization of transition as a multi-faceted construct, a multi-perspective definition of
transition-to-school was developed. Six indicators of successful transition were identified and
scored in the final year of study participation (the child’s third or fourth year of school):3
The parent indicated that the child’s academic and overall adjustment to school were Chapter 12 - Page 180

good;
The child indicated that his or her own adjustment to school was good, by indicating
that they liked school and felt that they did well in school;
The teacher indicated satisfactory social adjustment;
The teacher indicated satisfactory academic adjustment, comparing the child to others
in the classroom and to grade level expectations;
Objective, standardized assessments of reading skills placed the child’s achievement
in reading at or above average, based on national norms; and
Objective, standardized assessments of math skills placed the child’s achievement
in math at or above average, based on national norms.
Dichotomous indicators (yes = criterion was met; no = criterion was not met) were created
for each of the six indicators and then summed to obtain an overall transition score (range 0 to 6).
The transition scores were then divided into three categories: (1) Highly successful transition,
(transition score of 5 or 6); (2) Moderately successful transition (transition score of 2, 3, 4); and (3)
Poor transition (transition score of 0 or 1). Thus, to be characterized as having achieved a “highly
successful transition,” the child had to be broadly judged as having made a good adjustment to
school and have exhibited average to above average achievement in key academic areas.
Just under a third of these former Head Start children (30%) met these stringent criteria and
were considered to have made a highly successful transition to school. Only 14 percent made poor
transitions, and the remainder were moderately successful.
Analyses indicated that children of caregivers not born in the United States were nearly twice
as likely to experience a highly successful transition as children of U.S.-born caregivers. This
association did not appear to be related to the language spoken in the home, and thus may reflect a
different attitude toward school and learning on the part of these families. Not unexpectedly, a
greater level of education on the part of the caregiver was also associated with a greater likelihood
of a highly successful transition for the child and less likelihood of a poor transition. In addition,
analyses indicated that children of families experiencing greater and more chronic poverty were less
likely to experience highly successful transitions and more likely to experience poor transitions.
Similarly, children whose families moved more often during the early school years were less likely
to experience highly successful transitions and more likely to experience poor transitions.
Chapter 12 - Page 181

Special education placement and grade retention
Based on reviews of individual school records, children placed in special education and those
retained in grade (that is, were not promoted to
the next grade) at least once during the first four
years in school, were identified. Figure 12.18
shows the percentage of children who were in
special education for at least one year in the first
four years in school: 24 percent of those in the
Transition demonstration group and 20 percent
of those in the comparison group. This small
but statistically significant difference might be
attributable to increased vigilance for the
children in the Transition Demonstration group,
although this cannot be affirmed. Because the
Figure 12.18 Percentage of special education placements by year in school and
initial treatment condition
9.8
12.5
16.1
19.2
8.5
15.3
12.7 10.7
0
5
10
15
20
25
1st year 2nd year 3rd year 4th year
Demonstration Comparison
children in the two treatment conditions did not
differ significantly on other tests of academic and social development, it is unlikely that these
differences in special education placement reflect greater learning disability or social maladjustment.
Indeed, whether special education placement benefits children or not continues to be vigorously
debated (e.g., Detterman & Thompson, 1997; S. Ramey & Ramey, 1998) and is likely to vary
depending on the quality of special education supports in a school district. A noteworthy finding in
this study is the tremendous variation in rates of special education across sites. These rates ranged
from less than 5 percent (in 10 sites) to more than 20 percent (in 2 sites).
Of those children who were placed in special education at some time during their first four
years in school, approximately 40 percent of these were placed prior to or during kindergarten, 23
percent during the second year of school, 20 percent during the third year, and 18 percent during the
fourth year (see Figure 12.19). The timing of the children’s placement into special education did not
differ significantly by treatment condition. That is, Transition Demonstration schools did not
systematically identify and place children in special education programs either earlier or later than
those in comparison schools.
Chapter 12 - Page 182

Figure 12.19 Year of placement by initial treatment condition
37.9
23.6 20.2
18.3
40
22.7 19.5 17.8
0
5
10
15
20
25
30
35
40
45
1st year 2nd year 3rd year 4th year
Demonstration Comparison
The frequency and duration of out-of
class placements for special education students
were expected to relate to participation in the
Transition Demonstration Project, since
mainstreaming or inclusion of special education
students was a stated goal for the Transition
Demonstration program. Although the
percentage of children being fully included
(that is, receiving all instruction in a regular
education classroom) did not differ
significantly over the four years as a function of
the treatment group, there was a consistent
pattern of partial-day inclusion favoring the demonstration schools (see Figure 12.20). For the years
after kindergarten, the percentage of special education children in demonstration schools maintained
in the regular classroom for at least part of the day was significantly greater than in comparison
schools. Similarly, the percentage of special
education children in demonstration schools
who were assigned to a full-day program out of
the regular classroom was lower than the
percentage of special education children in the
comparison schools. The difference between
the two groups increased each year until third
grade, when it diminished. About one-fifth of
the special education children were also grade-
retained. Specifically, 22 percent of those in the
Transition Demonstration and 20 percent in the
comparison group were held back at least one
grade.
Figure 12.20 In-class, partial day out of class, and full day out of class placement by
school treatmentcondition, by yearinschool
120
100
80
60
40
20
0
43 36 37 43 33
24 23 28
50 55 55 43 62
60 69 60
6 8 858 121614
Demo - Comp- Demo - Comp- Demo - Comp- Demo - Comp1st 1st 2nd 2nd 3rd 3rd 4th 4th
In class Partial Full
Chapter 12 - Page 183

Figure 12.21 Distributions of special education, retained, and promoted children by initial treatment conditions
6% Demonstration
Promoted, not special education Special Education
Retained and special education Retained
7% Comparison
70%
19%
5%
73%
16%
4%
Concerning overall rates of
grade retention, there were no
significant differences between
treatment groups: 11.8 percent of
those in the Transition Demonstration
group and 10.7 percent in the
comparison group were held back at
least once in the first four years in
school. Figure 12.21 shows overall
percentages of children who were:
grade-retained only, placed in special
education only, both grade-retained
and placed in special education, and
promoted annually and never placed
in special education. The majority of
former Head Start children were
never grade-retained or placed in
special education -- nearly seven of
every 10 children. Nonetheless, rates
of placement in special education are significantly higher than the national average, which is about
10 percent overall (U.S. Department of Education, 1997). An estimate for Head Start children
nationally was 14 percent (O’Brien et al., 1997). Reliable national data about rates of grade retention
were not available (to our knowledge) for these years by grade level.
Figure 12.22 shows that children who were either placed in special education and/or grade
retained performed at significantly lower levels on all measures than did other children. Especially
impressive is the finding that former Head Start children who are either grade-retained or placed in
special education are virtually indistinguishable from each other as groups. That is, it is not clear
from these data why decisions were made for special education versus grade retention. Further, both
groups of children continue to show both academic and social progress over the years, although not
as marked in their standardized test scores on reading and math as were children who were grade-
promoted and not placed in special education.
Chapter 12 - Page 184

Figure 12.22Patterns of performance by children in special education and retained in grade.
Woodcock-JohnsonBroadReading Woodcock-Johnson BroadMath
110
100
90
80
70
100
90
80
70
Special Education Retained Promoted, not special education
110
100
90
80
70
60
K 1 2 3
(SSRS) TeacherAcademicRating Special education Retained Promoted, not special education
110
100
90
80
(SSRS) Social Skills - Teacher
Special education Retained Promoted, not special education
Special education Retained Promoted, not special education
K 1 2 3
(SSRS) Social Skills - Family Special education Retained Promoted, not special education
K 1 2 3
110
100
90
80
K 1 2 3
Chapter 12 - Page 185

SUMMARY FINDINGS
In conclusion, former Head Start children in this study showed quite favorable early
school adjustment by all indicators. Despite entering kindergarten with scores somewhat below
national norms, the children significantly improved their performance in both reading and math,
such that they were essentially at national averages by the end of second and third grades. In
other words, although Head Start children entered school with academic skills that were
somewhat weaker than average, this does not appear to have impeded their ability to make rapid
progress once formal schooling began. Vocabulary skills, as measured by the Peabody Picture
Vocabulary Test - Revised, indicated somewhat lower levels of progress, although scores still
were within the normal range. Further, teachers’ ratings of the social skills of these former Head
Start children place them at national norms, from kindergarten on through the first four years in
public school.
Both parents and children confirm this portrayal of good school adjustment for the
overwhelming majority of former Head Start children. Their impressions of children’s overall
school adjustment, academic performance, social development, and motivation to do well in
school -- a high value for this group of children and parents -- are consistently positive as a
group. A small subgroup of children, however, reported early impressions of school that were
less favorable. For these children (7 percent), their school progress was much less favorable both
academically and socially. Indeed, the children with early non-optimal school impressions were
at very high risk for special education placement.
Family characteristics, as expected, related to aspects of children’s academic and social
adjustment. Consistent with extensive reports elsewhere (cf. S. Ramey & Ramey, 1998), children
from families with higher levels of resources (including parent education, parent employment,
income, two parents active in the child’s life, stable residence) entered school with generally higher
skills and continued to perform at higher levels. Children from families where English was not the
primary language spoken at home showed excellent progress in both reading and math, and very high
levels of social skills, despite their lower scores on receptive vocabulary and early reading
comprehension. Even children experiencing considerable life challenges such as homelessness,
frequent moves, or a parent with a chronic health problem, showed good early gains in academic
skills.
Chapter 12 - Page 186

ENDNOTES, CHAPTER 12
1. The sample used in these analyses included children who had individualized assessments of academic skills (Woodcock Johnson Tests of Achievement) in kindergarten and in either the third or fourth year of school. The total sample, as noted above, included 5,914 former Head Start children.
2. Extensive analyses showed that the conclusions are unchanged when analyses are conducted on those children who have 3, 4 or 5 sets of test scores (5 representing a full set of scores from fall and spring of kindergarten and spring of each of the subsequent three years in school). Therefore, the results presented in this report are based on the children who had complete test scores at all ages (65% of the total in the longitudinal analysis data set). The sample included a total of 3,474 subjects. This sample did not include those children who had been retained in grade, but did include children placed in special education programs.
3. Successful transitions analyses were completed using a total of 5,914 former Head Start children and families who were present at baseline and at the end of the study (either third or fourth year data available) and had child assessment data available. A total of 28 sites were represented within this data set.
The multi-perspective successful transitions outcome variable was defined using six indicators scored in the final year of study participation (using the later of the third or fourth year data). There informants (family, child, teacher) provided responses that were scored as follows:
a) The parent indicated that the child’s adjustment to school was good. That is, the parent, completing Your Child’s Adjustment to School, rated both the child’s adjustment and overall school adjustment as 5 or greater (on a 10-point scale). Higher ratings on both questions were required to meet criterion.
b) The child indicated that his or her own adjustment to school was good by indicating (via What I Think of School) that they liked school and felt that they did well in school (ratings of 2 or 3 on a 3-point scale). Higher ratings on both questions were required to meet criterion.
c) The teacher indicated satisfactory social adjustment [Social Skills Rating System, Social Skills Questionnaire, standard score of 95 or better (mean=100, standard deviation=15)].
d) The teacher indicated satisfactory academic adjustment [Social Skills Rating System, Academic Competence Scale, standard score of 90 or better (mean=100, standard deviation=15)].
e) The child achieves at an average level (for age) in reading (Woodcock Johnson Tests of Achievement, Broad Reading, standard score of 95 or better (mean=100, standard deviation=15).
f) The child achieves at an average level (for age) in math (Woodcock Johnson Tests of Achievement, Broad Math, standard score of 95 or better (mean=100, standard deviation=15).
Chapter 12 - Page 187

Binary indicators (0 = did not meet criterion; 1 = met criterion) were created for each of the six indicators. The six binary scores were then summed to create an overall adjustment score (range 0 to 6), and a categorical “success” variable was created as follows:
Poor success = overall adjustment score of 0 or 1 Moderate success = overall adjustment score of 2, 3, or 4 High success = overall adjustment score of 5 or 6.
The SUCCESS score was created for a total of 4,558 children. The remaining 1,356 children were missing key information on one or more of the six individual indicators (typically the teacher ratings of social and academic adjustment).
Key covariates considered for inclusion in the predictive models included: gender, age at entry into kindergarten, child has a health condition that interferes with school attendance, poverty status of family (in poverty at both beginning and ending assessments, at one assessment, or at neither assessment), language spoken in the home (English versus other), caregiver employed full-time, caregiver educational status, caregiver has chronic health condition that interferes with ability to care for child, family moves with frequency, family has been homeless at some time in the early school years, initial treatment condition, years in a demonstration school, and level of implementation of Transition Demonstration Program.
Chapter 12 - Page 188

References
Abbott-Shim, M., & Sibley, A. (1991). Assessment profile for early childhood programs. Atlanta: Quality Assist.
Administration on Children, Youth and Families. (1990). Head Start research and evaluation: A Blueprint for the future. (DHHS Pub. No. 91-31195).
Administration on Children, Youth, and Families (1991). Federal Register, July11.
Administration on Children, Youth, and Families (1998). Head Start fact sheet.
Barnett, S.W., (1995). Long-term effects of early childhood programs on cognitive and school outcomes. In: The Future of Children: Long-Term Outcomes of Early Childhood Programs, R.E. Behrman (Ed.), 5(3).
Barbour, N.J., & Seefeldt, C. (1993). Developmental continuity across preschool and primary grades: Implications for teachers. Wheaton, M.D.: Association for Childhood Education International.
Barton, P.E. & Coley, R.J. (1992). America’s smallest school: The family. Princeton, NJ: Educational Testing Service.
Boyce, W.T., Jensen, E.W., James, S.A., & Peacock, J.L. (1983). The family routines inventory: Theoretical origins. Social Science & Medicine, 17, 193-200.
Bredekamp, S. (Ed.). (1986). Developmentally appropriate practice. Washington, DC: National Association for the Education of Young Children.
Bredekamp, S. (Ed.). (1992). Developmentally appropriate practice in early childhood programs serving children birth through age 8. Washington, DC: National Association for the Education of Young Children.
Bredekamp, S. (1998). Defining standards for practice: The continuing debate. In C. Seefeldt, & A. Galper, (Eds.), Continuing Issues in Early Childhood Education (pp. 176-189). Columbus, Ohio: Merrill.
Brooks-Gunn, J., McCarton, C.M., Casey, P.H., McCormick, M.C., Bauer, C.R., Bernbaum, J.C., Tyson, J., Swanson, M., Bennett, F.C., Scott, D.T., Tonascia, J., & Meinert, C.L. (1994). Early intervention in low-birth-weight premature infants: results through age 5 years from the Infant Health and Development Program. JAMA, 272, 1257-1262.
Byrd, R.S. & Weitzman, M.L. (1994). Predictors of early grade retention among children in the United States. Pediatrics, 93(3), 481-487.

Coiro, M.J., Zill, N., & Bloom, B. (1994). Health of our nation’s children. Vital & Health Statistics - Series 10: Data From the National Health Survey. (191):1-61
Cook, T.D., & Campbell, D.T. (1979). Quasi-experimentation: Design and analysis issues for field settings. Boston: Houghton-Miffin.
Cook, P.J., & Ludwig, J. (1997). Guns in America: National survey on private ownership and use of firearms. National Institute of Justice Research Briefs, May.
Crnic, K. & Lamberty, G. (1994). Reconsidering school readiness: conceptual and applied perspectives. In K.A. Crnic (Ed.)., Early Education and Development, 5(2), 91-104.
Currie, J., & Thomas D. (1995). Does Head Start make a difference? The American Economic Review, 85, 341-364.
Currie, J., & Thomas, D. (1997). School quality and the longer-term effects of Head Start.
Davis, W.E., & McCaul, E.J. (1991). The emerging crisis: Current and projected status of children in the United States. ERIC.
Detterman, D.K., & Thompson, L.A. (1997). What is so special about special education? American Psychologist, 52, 1082-1090.
Duncan, G.J. et al. (1993). Economic deprivation and early-childhood development. ERIC.
Dunn, L.M., & Dunn, L.M. (1981). Peabody Picture Vocabulary Test - Revised: Manual. Circle Pines, Minnesota: American Guidance Service.
Epstein, J.L. (1985). Home and school connections in schools of the future: Implications of research on parent involvement. Peabody Journal of Education. 62(2), 18-41.
Epstein, J.L. (1995). School/family/community partnerships: Caring for the children we share. Phi Delta Kappan. 701-712.
Farrington, D.P., Gallagher, B., Morley, L., St. Ledger, R.J., & West, D.J. (1990). Minimizing attrition in longitudinal research: Methods of tracing and securing cooperation in a 24year follow-up study. In Magnusson, D. & Bergman, L.R., (Eds). Data Quality in Longitudinal Research. New York: Cambridge Univ. Press.
Fosburg, L.B., & Brown, B. (1984). The effects of Head Start health services: Executive Summary of the Head Start evaluation. Cambridge, MA: Abt Associates.
Fuller, R.K. (1990). Controlled clinical trials. XXXXXX 14(3):239-244.

General Accounting Office (GAO), (1997). Head Start research provides little information on impact of current program. GAO/HEHS-97-59, April 1997.
Gorges, T.C. (1995). Homework: parent and student involvement and their effects on academic performance. Canadian Journal of School Psychology, 11(1), 18-31.
Gresham, F.M., & Elliott, S.N. (1990). Social Skills Rating System. Circle Pines, MN: American Guidance Service, Inc.
Grolnick, W.S., Benjet, C., Kurowski, C.O., & Apostoleris, N. H. (1997). Predictors of parental involvement in children’s schooling. Journal of Educational Psychology, 89, 538-548.
Hale, B.A., Seltz, V., & Zigler, E. (1990). Health Services and Head Start: A forgotten formula. Journal of Applied Developmental Psychology, 11, 447-458.
Hansen, W.B., Collins, L.M., Malotte, K.C., Johnson, C.A., Fielding, J. (1985). Attrition in prevention research. Journal of Behavioral Medicine, 8(3), 261-275.
Henderson, A.T. (1987). The evidence continues to grow: Parental involvement improves student achievement. National Committee for Citizens in Education. Columbia: Maryland.
Howes, C., & Olenick, M. (1986). Child care and family influences on toddlers’ compliance. Child Development, 57, 202-216.
Huston, A. (Ed.). (1992). Children in poverty. NY: Cambridge University Press.
Jurs, S.G., and Glass, G.V. (1971). The effect of experimental mortality on the internal and external validity of the randomized comparative experiment. Journal of Experimental Education, 40, 62-66.
Kagan, S.L. (1991). Moving from here to there: Rethinking continuity in transitions in early care and education. In B. Spodek & O. Saracho (Eds.), The yearbook in early childhood education (vol. 2, pp. 132-151). New York: New York Teachers College Press.
Kagan, S.L. (1994). Early care and education: Beyond the fishbowl. Phi Delta Kappan, 76(3), 184-187.
Kelley, MA.K., Glover, J.A., Keefe, J.W., Halderson, C., Sorenson, C., & Speth, C. (1986). School climate survey. Reston, VA: National Association of Secondary School Principals.
Larson, C.S., Gornby, D.S., Shiono, P.H., Lewit, E.M., & Behrman, R.E. (1992). School-linked services: analysis. Future of Children, 2(1), pp 6-18.
Leik, R.K., & Chalkley, M.A. (1988). Final Report — The Head Start Family Impact Project.

Lee, V.E., Brooks-Gunn, J., & Shnur, E. (1988). Does Head Start work? A 1-year follow-up comparison of disadvantaged children attending Head Start, no preschool, and other preschool programs. Developmental Psychology, 24, 210-222.
Lee, V.E., Brooks-Gunn, J., Schnur, E., & Liaw, F. (1990). Are Head Start effects sustained? A longitudinal follow-up comparison of disadvantaged children attending Head Start, no preschool, and other preschool programs. Child Development, 61, 495-507.
Lombardi, J. (1992). Beyond transition: ensuring continuity in early childhood services. ERIC Digest.
Love, J.M., Logue, M.E., Trudeau, J.V., & Thayer, K. (1992). Final Report of the National Transition Study: Transitions to Kindergarten in American Schools. Portsmouth, NH: RMC Research Corporation.
Manheim, J.B., & Rich, R.C., (1991). Empirical political analysis: Research methods in political science, 3rd edition. White Plains NY: Longman.
McCartney, K. (1984). Effects of quality of day care environment on children’s language development. Developmental Psychology, 20, 244-260.
McKey, R., Condelli, L., Ganson, H., Barrett, B., McConkey, C., & Plantz, M. (1985). The impact of Head Start on children, family, and communities: Final report of the Head Start evaluation, synthesis, and utilization report. (DHHS Pub. No. OHDS 85-31193) Washington, DC: U.S. Government Printing Office.
Meinert, C.L. (1986). Clinical trials: Design conduct, and analysis. New York: Oxford University Press.
Orr S.T., James S.A., Burns B.J., Thomson B. Chronic stressors and maternal depression: Implications for prevention. American Journal of Public Health 1989; 79: 1295-1296.
Orr S.T., James S.A. Maternal depression in an urban pediatric practice: Implications for health care delivery. American Journal of Public Health 1984; 74: 363-365.
Parker, F.L., Piotrkowski, C.S., Horn, W.F., & Greene, S.M. (1995). The challenge for Head Start; Realizing its vision as a two-generation program. In S. Smith (Ed.), Two generation programs for families in poverty: A new intervention strategy. Advances in applied Developmental Psychology (Vol. 9).
Peterson, D. (1989). Parent involvement in the educational process. ERIC Digest.
Pettit, G.S., Bates, J.E., & Dodge, K.A. (1997). Supportive parenting, ecological context, and children’s adjustment: A seven-year longitudinal study. Child Development, 68, 908-923.

Powell, D.R. (1995). Enabling young children to succeed in school. Washington, DC: American Educational Research Association.
Prochaska, J.O., & DiClemente, C.C. (1982). Transtheoretical therapy: Toward a more integrative model of change. Psychotherapy; theory, research, and practice, 19, 176-288.
Prochaska, J.O. (1992). Helping patients at every stage of change. Behavioral approaches to addiction, 1(1), 2 - 7.
Ramey, S.L., & Ramey, C.T. (1992). The National Head Start/Public School Early Childhood Transition Study: An Overview. Washington, D.C.: Administration on Children, Youth, and Families.
Ramey, S.L., & Ramey, C.T. (1993). Obstacles and barriers to implementing the Head Start/Public School Early Childhood Transition Demonstration Project. Technical Report submitted to Administration on Children, Youth, & Families.
Ramey, C.T., & Ramey, S.L. (1994). Which children benefit the most from early intervention? Pediatrics, 94, 1064-1066.
Ramey, S.L. Ramey, C.T., & Phillips, M.M. (1996). Head Start children’s entry into public school: an interim report on the National Head Start/Public School early childhood transition Demonstration Study. Technical report, submitted to ACYF.
Ramey, S.L., & Ramey, C.T. (1997). Evaluating educational programs: Strategies to understand and enhance educational effectiveness. In: C. Seefeldt & A. Galper (eds.), Continuing Issues in Early Childhood Education (2nd edition), pp. 274 - 292. Englewood Cliffs, New Jersey: Prentice Hall.
Ramey, C.T. , & Ramey, S.L. (1998). Early intervention and early experience. American Psychologist, 53, 109-120.
Ramey, S.L., & Ramey, C.T. (1998). The transition to school: concepts, practices, and needed research. American Institutes for Research: Palo Alto, CA.
Ramey, C.T., & Ramey, S.L., & Lanzi, R.G. (1998). Differentiating developmental risk levels for families in poverty: creating a family typology. In M. Lewis and C. Feiring (Eds.) Families, risks, and competence. Mahwah, NJ: Lawrence Erlbaum Associates, Inc. 187-205.
Ramey, S.L., & Ramey, C.T. (1999). Going to school: How to help your child succeed. New York: Goddard Press.
Ramey, S.L., Lanzi, R.G., Phillips, M.M., & Ramey, C.T. (April, 1999). Poster symposium. Are children’s early impressions of school predictive and meaningful? Biennial Meeting, Society for Research in Child Development, Albuquerque, New Mexico.

Ramey, S. L, Ramey, C. T., & Lanzi, R. G. (in press). The transition to school: Building upon preschool foundations and preparing for lifelong learning. In E. Zigler & S. Styfco (Eds.), The Head Start debates. Connecticut: Yale University Press.
Ramey, C. T., & Ramey, S. L. (in press). Early educational interventions and intelligence. In E. Zigler & S. Styfco (Eds.), The Head Start debates. Connecticut: Yale University Press.
Reedy, Y.B. (1991). A comparison of long range effects of participation in Project Head Start and impact of three differing delivery models. State College, PA: Pennsylvania State University.
Reid, M., & Landesman, S. (1988). Your Child’s Adjustment to School. Seattle: University of Washington.
Reid, M., & Landesman, S. (1988). What I Think of School. Seattle: University of Washington.
Reynolds, A.J. (1996). Cognitive and family-support mediators of preschool effectiveness: A confirmatory analysis. Child Development, 67(3), 1119-1140.
Rubin, R.I., Olmsted, P.P., Szegda, M.J., Wetherby, M.J., & Williams, D.S. (1983). Long term effects of parent education Follow Through Program participation. Paper presented at the annual meeting of the American Educational Research Association, Montreal, April, 1983.
Santer, L.J. & Stocking, C.B. (1991). Safety practices and living conditions of low-income urban families. Pediatrics, 88(6), 1112-1118.
U.S. Department of Education (1994). Strong Families, Strong Schools: Building Community Partnerships for Learning.
U.S. Department of Education (1997). The nineteenth annual report to Congress on the implementation of the Individuals with Disabilities Education Act. Washington, D.C.: U.S. Office of Special Education.
Walker, H.M., Block-Pedego, A., Todis, B., & Severson, H. (1991). School Archival Records Search. Longmont: Sopris West.
Woodcock, R.W., & Johnson, M.B. (1990). Woodcock-Johnson psycho-educational battery revised. Allen,Texas: DLM Teaching Resources.7
Zill, N., & Collins, M. (1996). Approaching kindergarten: Family risk factors. ERIC.
Zigler, E., & Muenchow, S. (1992). Head Start: The inside story of America’s most successful educational experiment. New York: Basic Books.

Zigler, E., & Valentine, J. (Eds.). Project Head Start: A Legacy of the War on Poverty. New York: Free Press.

Technical Report #1
Creation of the Data Set for Analysis

The basic data set used for analysis in this report has been the product of a series of critical
decisions made and processes completed over the course of four years. Each step and decision was
based on careful review of the data themselves as well as other available information, consideration
of alternatives and implications, and often consultation with key advisors within ACYF and the
National Transition Demonstration Study’s Technical Work Group.
Because the National Transition Demonstration Study incorporated data obtained from a
variety of informants (children, families, teachers, principals, school records, national databases),
the construction of the final data set is based on the concept of family units. Unique seven-digit
family/child identification numbers were assigned to each child participating in the study, indicating:
(10 the cohort (one of 2); (2) the site (one of 31); (3) Head Start affiliation (former Head Start or
non-Head Start); (4) unique family affiliation (a 3-digit identifier); and (5) whether or not the child
had a sibling in the study (a single digit identifier). All data that were associated with a given child
(i.e., from the family interview, child assessments, child-specific teacher questionnaire, and
information from school records) was linked to the child, on all relevant forms, via this family/child
identification number. A family unit, then, was defined as a child/family unit (defined by the unique
identification number) that had, in kindergarten (at baseline), some associated data -- either a family
interview, a child assessment, a teacher questionnaire, or information from the school records. Any
combination of the four data sources could exist for the family unit at any given time point
throughout the four-year longitudinal follow-up period. In April 1995, at the mid-point of the study,
a total of 12, 067 family units were involved in the National Transition Demonstration Study.
A series of data clarification processes were completed in the ensuing four years, each
resulting in some modification to the number of observations within the data set. The steps of
clarification and the consequences in terms of lost cases (totaling 1,238 cases) are outlined in Table
1 below. The deletion of one site from the analysis sample (because of failure to submit adequate
documentation of random assignment of schools) led to the largest reduction in sample size (a total
of 785 cases removed from the analysis sample). The additional steps together removed total of a
435 cases from the analysis sample. The final analysis set, then, includes 7,515 cases -- 90 percent
of the original sample.
Technical Report 1 - Page 2

Table 1. Steps taken in clarification of data set and resulting loss of cases available for analysis
Decision/activity Cases remaining
Began with: 12,067
Clarification of family/child ID numbers, consolidation ofrecords in baseline, correction of cohort, or correction of Head Start status: total loss = 248 cases (2% of family units)
11,819
Removal of family units whose initial school was notincluded among study schools (primarily one site carrying a third local cohort): total loss = 82 cases (0.8% of familyunits)
11,737
Removal of family units whose only source of information atbaseline was the Information from School Records: total loss = 85 cases (0.8% of family units)
11,652
Removal of family units with no baseline information abouttreatment condition of school: total loss = 38 cases (0.3% of family units)
11,614
Removal of family units from one site that did not provideadequate documentation of random assignment of schools: total loss = 785 cases (468 cohort 1, 317 cohort 2)
10,829
Of these 10,829 family units included in the final data analysis set, 7,515 were former Head Start
participants and the remainder (3,314) did not participate in Head Start prior to enrolling in
kindergarten. Thus, the final analysis set used as a basis for child and family analyses reported
in this final report includes the 7,515 former Head Start children and families.
There was some variability in the completeness of data within and across rounds for a given
family unit. For example, a family interview could be present but the child assessment and teacher
questionnaire missing, or the family unit could have data available in kindergarten but not in the
following year. Table 2 summarizes the availability of data forms of certain types across rounds of
data collection, singly and in key combinations.
Technical Report 1 - Page 3

Table 2. Data available by type and by years (data collection points)
Source of Data Record Years in School
1 2 3 4 3 or 4
Child Assessment 7325 6065 5788 5740 6193
Family Interview 7078 5493 5284 5196 5903
Information from School Records 6535 5675 5383 5390 5900
Teacher, Part B 6501 5331 4821 4572 5445
Child Assessment and Family Interview 6894 5289 5037 4907 4276
Child Assessment and Information from School Records
6435 5460 5153 5145 4606
Child Assessment and Teacher B 6412 5188 4714 4484 3854
Family Interview and Information from School Records
6253 4945 4616 4583 3901
Family Interview and Teacher B 6208 4688 4229 4015 3308
Information from School Records and Teacher B
6054 5037 4620 4438 3800
Child Assessment, Family Interview and Information from School Records
6154 4859 4539 4452 5200
Child Assessment, Family Interview and Teacher B
6124 4609 4177 3962 4886
Child Assessment, Information from School Records, and Teacher B
5991 4947 4560 4385 5206
Family Interview, Information from School Records, and Teacher B
5798 4492 4091 3929 4807
Technical Report 1 - Page 4

Technical Report #2
Methodology Employed in Creating Family Clusters

Head Start families become Head Start families based on a single criterion: the family’s
income at time of application is below the federal poverty line for a family of a given size. There
is one exception to this: if a child has a disability, the family does not need to meet the income
eligibility criterion, although in fact the overwhelming majority of Head Start children with
disabilities also come from families with poverty level incomes.
In general, Head Start children are considered at elevated risk for non-optimal school
performance, based on many studies and reports that children from poverty families do less well than
children from higher income families on almost all measures of academic success, and sometimes
on measures of social adjustment. Follow-up studies of former Head Start children suggested there
may be a “loss of gains” over the first four years of school. Reviews of research on the effects of
Head Start suggest there may be benefits in social development and academic readiness. As stated
in the overview chapter, the rationale for this national project was largely to prevent this possible
decline. The goal was to enhance children’s school adjustment over the first four years.
What is often ignored in studies of how children adjust to school is the relationship of
poverty to many other life conditions and resources available to children, families, their schools, and
communities. Accordingly, in this study, it was recognized from the beginning, that different
children and families may have different needs, in part related to their life situation when the
children enrolled in kindergarten. Further, families are not static, and changes in the family’s life
situation may contribute to other important changes in the child’s adjustment to school.
In this chapter, we present descriptive information about the natural diversity that occurs
within a large sample of former Head Start children. It is important to note, however, that this is
not necessarily a nationally representative sample of former Head Start children. In fact, there is
an under representation of the Hispanic Latino families in this sample. The sample represents
grantees who were skillful in presenting a strong proposal for how they would enhance the school-
age outcomes for former Head Start children and their families, and these sites typically are
somewhat above the national average on a number of sociological and community level markers,
such as rates of unemployment, income, crime, and parent educational level. However, this sample
does include a wide range of characteristics, which is typical of national data presented about Head
Start (ACYF, 1998).
We also emphasize here that despite the risk conditions associated with poverty, there are a
Technical Report 2 - Page 2

number of important strengths that characterize many former Head Start families. These may be just
as important in helping to understand the different school age outcomes for children and families.
The slanted view often presented on families that are marginalized because of income or other
factors, such as ethnicity, has been well articulated (Huston, McLoyd, Garcia Coll, 1994; Huston,
1991).
Since family strengths historically have been neglected when studying children of poverty,
we begin by presenting these characteristics (referred to as the family strengths index). Next, we
describe the extent to which certain parent and family characteristics typically considered
“challenges” or “risk” variables affect this sample (referred to as the family challenges index).
Finally, we present several ways of looking at these characteristics collectively or holistically. The
findings indicate that there is tremendous diversity in this 31 site study. This diversity is so strong
that many of the analyses presented in later chapters on the outcomes for children, families, schools,
and communities take this natural diversity -- present when the study began -- into account.
Family Strengths Index
A family strengths index was created based on six characteristics related to child outcomes.
These characteristics included: primary caregiver has college degree or higher; mother and father
active as parents (defined as either living in the home or active in helping with parenting duties);
income greater than or equal to 150% of poverty; family rates the probability for success in the
neighborhood as high to very high (e.g. graduating from high school, attending college); family
member reads daily to child; and family routines are highly organized (see Table 1). These binary
variables were summed to create a family strengths index, with a possible range of 0 - 6. The
majority of the families had either one (39%) or two (22%) strengths. Only about 12% of the
families reported having three or more strengths. Interestingly, more than a quarter of the families
did not report strengths. The mean strength was 1.22 (1.06 SD).
It is important to note that there are some important aspects of family life that are known to
affect children about which we did not have information. Factors such as special mentor or special
person who is actively engaged in a child’s life were not always known, and day-to-day family
functioning was not measured objectively, but rather assessed through the perspective of the child’s
primary caregiver.
Technical Report 2 - Page 3

Table 1. Variables Included in Family Challenges and Strengths Indices
Variable Family Challenges Index
(12 variables)
Family Strengths Index
(6 variables)
Primary Caregiver
Caregiver education level less than high school college degree or higher
Caregiver has chronic health problem
yes -----
Caregiver has positive depression screen
yes -----
Caregiver’s age at child’s entry into kindergarten
less than 24 years -----
Mother and father active as parents (either live in home or help with parenting)
----- yes
Family Resources
Household income < 50% federal poverty level > 150% federal poverty level
Family receives AFDC yes -----
Family has been homeless in past 12 months or lives in shelter
yes -----
Family moved 2 or more times in last 12 months
yes -----
Family has 4 or more children in home
yes -----
Neighborhood
Probability for success scale low to very low high to very high
Family Supports for Learning/School
Reading/storytelling to child 1-2/wk or almost never daily
Family routines highly disorganized defined as < 46
highly organized defined as > 72
Technical Report 2 - Page 4
Family Challenges Index
A family challenges index was created based on twelve characteristics. These characteristics
included: primary caregiver has less than a high school diploma or GED; primary caregiver has a
chronic health problem; primary caregiver was screened positive for depression; primary caregiver’s
age at child’s kindergarten entry was less than 24 years; family income was less than 50% of poverty;
family receives AFDC; family is homeless or in a shelter; family has moved two or more times in
the past year; four or more children live in the home; family rates the probability for success in the
neighborhood as low to very low (e.g. graduating from high school, attending college); family
member reads infrequently to child (1-2 times per week or almost never); and family routines are
highly disorganized (see Table 1 above). These binary variables were summed to create a family
challenges index, with a possible range of 0 - 12. There were approximately equal numbers of
families who reported one challenge (19%), two challenges (22%), and three challenges (18%).
Somewhat fewer, but still a fair number of families, reported four challenges (14%) or five or more
challenges (14%). More than one out of ten families (13%) reported that they did not have any
challenges. The mean challenge was 2.52 (1.77 SD).
Again, there are some important factors about the family known to affect children about
which we did not have information. These factors include substance abuse and alcoholism, domestic
violence, child abuse and neglect, parental intellectual disability, and incarceration among others.
It is important to note that some of the same characteristics used in the family challenges
index were also used in the family strengths index. The characteristics, however, are not the inverse
of each other; rather they are either the upper or lower limit of the variable (e.g., less than high
school education as a challenge and college degree or higher as a strength). The correlation between
the family strengths and family challenges indices was -0.42 (p<.001).
Family Typology
A series of analyses were conducted to develop a typology of former Head Start families as
the children entered school. The family typology reported in this chapter depicts the diversity within
poverty families and illustrates how a set of standard descriptive variables are interrelated. Also,
these analyses help to set the stage for decision making regarding whether number of challenge
conditions, challenge-to-strength ratios, or clusters will be used as a standard option in looking for
subgroup differences in response to the Transition Demonstration treatment.
Technical Report 2 - Page 5
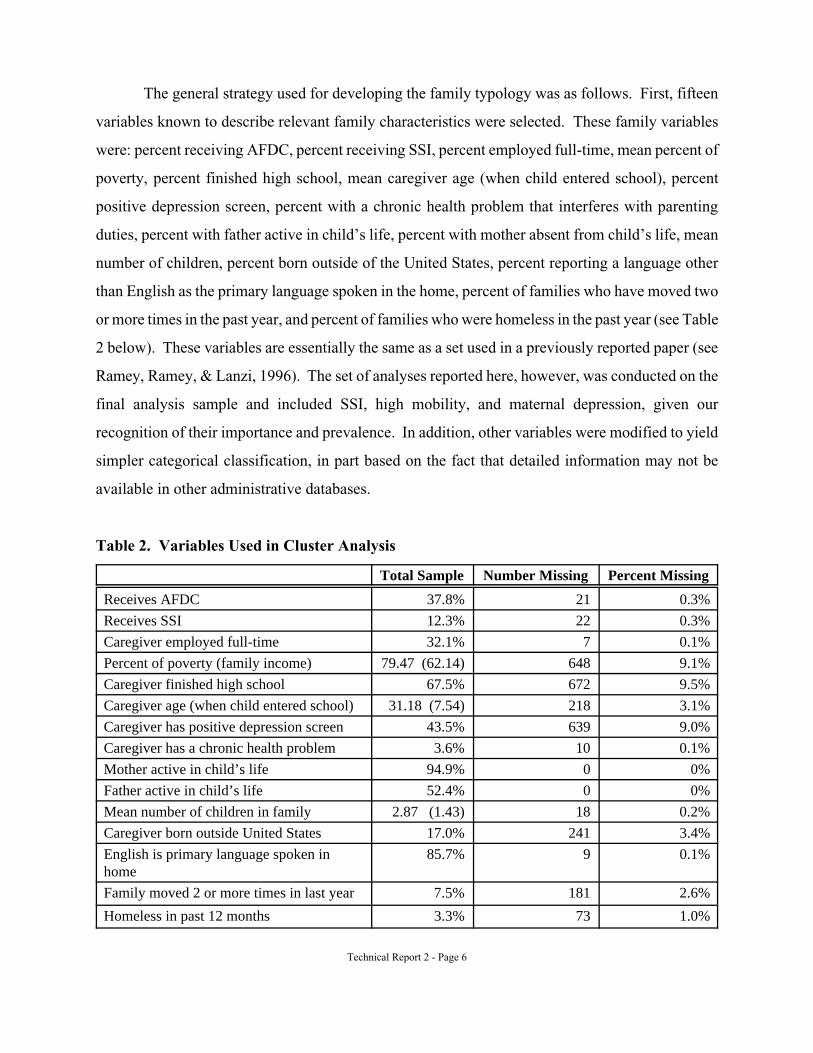
The general strategy used for developing the family typology was as follows. First, fifteen
variables known to describe relevant family characteristics were selected. These family variables
were: percent receiving AFDC, percent receiving SSI, percent employed full-time, mean percent of
poverty, percent finished high school, mean caregiver age (when child entered school), percent
positive depression screen, percent with a chronic health problem that interferes with parenting
duties, percent with father active in child’s life, percent with mother absent from child’s life, mean
number of children, percent born outside of the United States, percent reporting a language other
than English as the primary language spoken in the home, percent of families who have moved two
or more times in the past year, and percent of families who were homeless in the past year (see Table
2 below). These variables are essentially the same as a set used in a previously reported paper (see
Ramey, Ramey, & Lanzi, 1996). The set of analyses reported here, however, was conducted on the
final analysis sample and included SSI, high mobility, and maternal depression, given our
recognition of their importance and prevalence. In addition, other variables were modified to yield
simpler categorical classification, in part based on the fact that detailed information may not be
available in other administrative databases.
Table 2. Variables Used in Cluster Analysis
Total Sample Number Missing Percent Missing
Receives AFDC 37.8% 21 0.3%
Receives SSI 12.3% 22 0.3%
Caregiver employed full-time 32.1% 7 0.1%
Percent of poverty (family income) 79.47 (62.14) 648 9.1%
Caregiver finished high school 67.5% 672 9.5%
Caregiver age (when child entered school) 31.18 (7.54) 218 3.1%
Caregiver has positive depression screen 43.5% 639 9.0%
Caregiver has a chronic health problem 3.6% 10 0.1%
Mother active in child’s life 94.9% 0 0%
Father active in child’s life 52.4% 0 0%
Mean number of children in family 2.87 (1.43) 18 0.2%
Caregiver born outside United States 17.0% 241 3.4%
English is primary language spoken in home
85.7% 9 0.1%
Family moved 2 or more times in last year 7.5% 181 2.6%
Homeless in past 12 months 3.3% 73 1.0%
Technical Report 2 - Page 6

As a group, these 15 variables represent a combination of risk conditions, logistical
challenges, and factors that historically have been associated with non-optimal school outcomes for
children. For this analysis, data from the kindergarten year were used. Whenever possible,
information gathered during the fall (baseline) was used, although for a subset of families,
information was not available until the spring of the kindergarten year. The missing data for any
given variable never exceeded 9 percent.
The correlation coefficient was used as the measure of similarity and Ward’s method as the
clustering criterion. This approach has been used with previous studies (Ramey et al, 1984; Ramey,
Ramey, & Lanzi, 1996). The validity of the cluster analysis solution is an important concern, since
random data can give rise to seemingly appropriate cluster solutions (Dubes & Jain, 1979). Thus,
consideration was given to whether groupings of families were an artifact of the cluster analysis.
Because of the size of the current data set, replication and significance tests were completed for the
independent variables. Hence, the data set was randomly divided into two equal groups. The cluster
procedure was then applied to each data subset, using the fifteen variables listed above to determine
if similar solutions were obtained.
Another critical issue in conducting a cluster analysis is determining the appropriate number
of clusters or groups supported by the data (Milligan & Cooper, 1985). Milligan and Cooper (1985)
list 30 techniques proposed for this problem. The clustering criterion available in SAS was selected.
In applying the SAS criterion in the cluster analysis, seven clusters were identified in both data sets.
There was a one-to-one correspondence between the two sets of clusters. The results obtained from
this replication procedure clearly indicated the existence of seven groupings of families.
To determine a final cluster solution, the clustering procedure was applied to the original full
data set. The findings from this analysis indicate that, among the families participating in this
National Transition Demonstration Study, there are remarkably clear major distinctions. A clear
identification of seven major family types emerged. Table 2 presents the distribution of each of the
15 variables for each family type. A brief characterization of these seven family types is found in
Chapter 3. A central finding, as with the previous cluster analyses, is that all of these family types
occur in all major ethnic/cultural groups studied: White/non-Hispanic, African American,
Hispanic/Latino, Asian/Pacific Islander, and American Indian (see Table 3).
Technical Report 2 - Page 7

1
Tab
le 2
. Fam
ily T
ypes
VA
RIA
BL
ES
USE
D I
N C
LU
STE
R
AN
AL
YSI
S
Tot
al
Sam
ple
FA
MIL
Y T
YP
E
A
Res
ourc
eful
B
Sing
le P
aren
t W
elfa
re
C
For
eign
L
angu
age
D
Hig
hly
Mob
ile
E
Mot
her
Abs
ent
F
Chr
onic
Hea
lth
Pro
blem
R
e H
o
n=25
84
42%
n=
1840
30
%
n=65
6 11
%
n=33
6 6%
n=
280
5%
n=19
8 3%
n
Rec
eive
s A
FDC
38
%
4%
85%
21
%
49%
40
%
50%
Rec
eive
s SS
I 12
% 0
.9%
27
%
5%
14%
21
%
27%
Prim
ary
Car
egiv
er E
mpl
oyed
Ful
l-T
ime
32%
48
%
12%
37
%
31%
40
%
15%
Perc
ent o
f Po
vert
y (F
amily
Inc
ome)
M
= 7
9.4
SD=
(62.
1)
M=
105.
1 SD
=(7
3.6)
M
=49
.7
SD=
(32.
9)
M=
76.6
SD
=(4
6.0)
M
=70
.5
SD=
(49.
2)
M=
93.1
SD
=(6
5.4)
M
= 6
7.7
SD=
(52.
9)
M
SD
Prim
ary
Car
egiv
er F
inis
hed
Hig
h Sc
hool
67
%
79%
64
% 4
2%
68%
63
%
63%
Prim
ary
Car
egiv
er A
ge (
Whe
n C
hild
Ent
ered
Sc
hool
) M
=31
.2
SD=
(7.5
) M
=31
.05
SD=
(6.9
6)
M=
29.3
SD
=(5
.3)
M=
32.0
SD
=(6
.8)
M=
28.1
SD
=(4
.9)
M=
43.
1 SD
=(1
2.1)
M
=34
.3
SD=
(9.7
) M
SD
Prim
ary
Car
egiv
er w
ith D
epre
ssiv
e Si
gns
43%
37
%
48%
40
%
53%
36
%
62%
Prim
ary
Car
egiv
er h
as a
Chr
onic
Hea
lth
Prob
lem
that
Int
erfe
res
with
Par
entin
g D
utie
s 4%
0%
0%
0%
0%
0%
10
0%
Fath
er A
ctiv
e in
Chi
ld’s
Lif
e 52
%
64%
32%
77
%
43%
38
%
51%
Mot
her
Abs
ent f
rom
Chi
ld’s
Lif
e 5%
0%
0%
0%
0%
100
%
8%
Num
ber
of C
hild
ren
in F
amily
M
=2.
9 SD
=(1
.4)
M=
2.6
SD=
(1.1
) M
=3.
0 SD
=(1
.5)
M=
2.9
SD=
(1.5
) M
=2.
8 SD
=(1
.1)
M=
3.0
SD=
(1.8
) M
=2.
7 SD
=(1
.5)
M
SD
Pare
nt(s
) B
orn
Out
side
the
Uni
ted
Stat
es
17%
6%
0.
9%
91%
11
%
6%
14%
Lan
guag
e ot
her
than
Eng
lish
Spok
en in
H
ome
14%
0%
0%
10
0%
8%
4%
9%
Fam
ily M
oved
2 o
r M
ore
Tim
es in
Las
t Yea
r 8%
0%
0%
0%
10
0%
6%
6%
Hom
eles
s in
Pas
t 12
Mon
ths
3%
0%
0%
0%
0%
0%
0%
Tec
hnic
al R
epor
t 2 -
Pag
e 8

Tab
le 3
. Fam
ily T
ype
by E
thni
city
*
ET
HN
IC G
RO
UP
S T
OT
AL
SA
MP
LE
R
esou
rcef
ul
Sing
le P
aren
t W
elfa
re
For
eign
Lan
guag
e H
ighl
y M
obile
M
othe
r A
bsen
t C
hron
ic H
ealt
h P
robl
em
Rec
entl
y H
omel
ess
Whi
te/n
on-H
ispa
nic
2863
47
%
1496
58
%
860
47%
21
3%
17
7 53
%
120
43%
97
49
%
92
47%
Afr
ican
Am
eric
an
1940
32
%
784
30%
80
1 44
%
20
3%
96
29%
11
8 42
%
64
32%
57
29
%
His
pani
c/L
atin
o 79
7 13
%
149
6%
75
4%
480
73%
34
10
%
17
6%
17
9%
25
13%
Asi
an/P
acif
ic
Isla
nder
11
4 2%
16
.6
%
2 .1%
80
12
%
5 1.
5%
1 .4%
7 4%
3 2%
Am
eric
an I
ndia
n 15
6 3%
71
3%
41
2%
4 .6%
10
3%
15
5%
6 3%
9 5%
Oth
er
212
4%
63
3%
60
3%
51
8%
14
4%
9 3%
7 3%
8 4%
Tot
al
6082
10
0%
2579
42
%
1839
30
%
656
11%
33
6 6%
28
0 5%
19
8 3%
19
4 3%
*Per
cent
ages
wit
hin
fam
ily
type
Tec
hnic
al R
epor
t 2 -
Pag
e 9

Technical Report #3
Psychometric Analyses of Instruments Used

PSYCHOMETRIC REVIEW OF SCALES
Scott Snyder M. Lee Van Horn
In this psychometric review we have included all of the scales in the National Transition
Project data set that are being used as measures of the project’s outcomes or predictors of outcomes.
Only instruments for which a summary scale score or subscale scores are available are included in
this review. The review focuses on the development and validation of the scoring methods for each
of the instruments reviewed. With the exception of three nationally developed and standardized
assessments, all of the instruments we review here have been validated on the National Transition
Project data. As part of the psychometric review, the reliabilities of each instrument were also
assessed. Internal reliability (usually Chronbach’s alphas) was computed for all scales or subscales
using National Transition data. Test-retest reliabilities were not available from the Transition data;
these reliabilities from the original development of each instrument are reported when they are
available.
THE ASSESSMENT PROFILE FOR EARLY CHILDHOOD PROGRAMS: RESEARCH VERSION Abbott-Shim & Sibley, 1998
The classroom environment is one of the areas that was targeted for change via the Transition
Demonstration Project. Emphasis was placed on creating classroom environments and implementing
classroom practices that were optimal for children’s social and academic development. The quality
of classroom environments and practices were considered important dependent and mediating
variables in the National Transition Demonstration Project. The Assessment Profile for Early
Childhood Programs: Research Edition (Abbott-Shim & Sibley, 1987, 1992) was selected as the
major tool for documenting classroom practices in this study. Although this tool was originally
designed for use in preschool programs, it had been adapted for use in kindergarten classrooms
(Abbott-Shim, Sibley 1992). This adaptation, the Assessment Profile for Early Childhood
Programs: Research Version served as the foundation instrument for assessment of classroom
practices in this study.
The Assessment Profile consists of a 87 dichotomous judgments (observed, not observed)
made during a single observation within a classroom. Judgments are made in the following areas:
Technical Report 3 - Page 2

Learning Environment (concerning the availability, variety and appropriateness of materials and
learning materials and space), Scheduling (concerning the evidence of a schedule that balances a
variety of activities), Interacting (concerning the quality of teacher-child interactions and the nature
of classroom management), curriculum (concerning the nature of instructional delivery), and
individualizing (concerning the nature and use of assessment).
To establish content validity, the Assessment Profile was cross-referenced with the
Accreditation Criteria of the National Association for the Education of Young Children (NAEYC)
and the Early Childhood Environment Rating Scale (Harms & Clifford, 1980). Reported reliabilities
were in the .90 range and inter-rater reliabilities ranged from .85 to 1.00. Trainers of raters from
each site were trained by the developers of the Assessment Profile to an .85 agreement criterion
before being qualified to train local observers (also to the .85 criterion).
During the second year of the project, several items were added to the instrument in order
to be more sensitive to characteristics and expectations of primary grade classrooms. Preliminary
factor analyses of the Assessment Profile using Headstart Transition data suggested minor to
moderate variations from the initial factor structure across grade levels. These variations reflected
differences in the initial calibration sample and the primary grade classrooms of the Headstart
Transition sample, and a lack of variability for several items, the inclusion of the new field test
items. While the national evaluation team and the developers of the Assessment Profile recognized
such variation as meaningful, there was agreement that for the purposes of longitudinal analysis a
factor structure should be selected that can be used across grade levels. That is, while cross-sectional
analyses reveal moderate differences in factor structures for kindergarten and third grade classrooms,
a common factor solution across grade levels was needed in order to address core research questions.
With approval of the project officer and monitoring by the directors and staff of the transition
study, the developers of the Assessment Profile: Research Version used item response theory
strategies and factor analyses to generate a five factor solution that was applicable to longitudinal
comparisons. The resulting solution preserved the structure of the Assessment Profile: Research
Version. The following text and tables are from the Psychometric Report of the Assessment Profile
for Early Childhood Programs: Research Version for the National Transition Demonstration Project
(Abbott-Shim, Sibley & Neel, 1998).
Technical Report 3 - Page 3
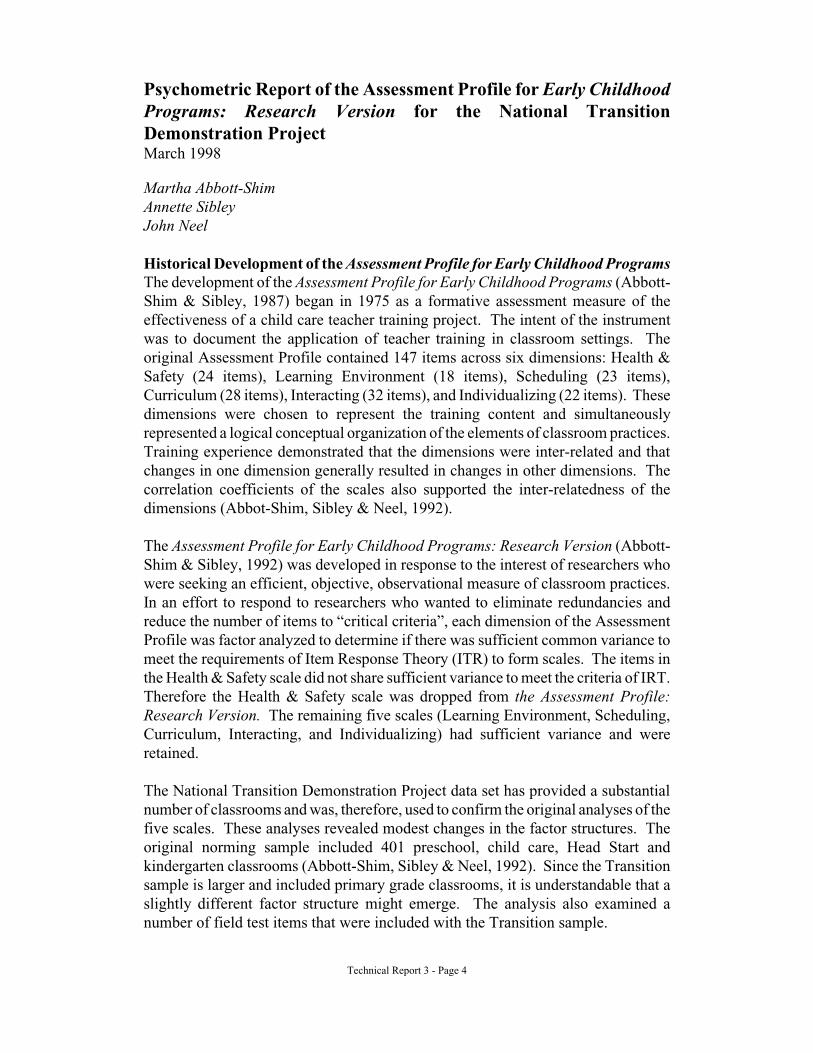
Psychometric Report of the Assessment Profile for Early Childhood Programs: Research Version for the National Transition Demonstration Project March 1998
Martha Abbott-Shim Annette Sibley John Neel
Historical Development of the Assessment Profile for Early Childhood Programs The development of the Assessment Profile for Early Childhood Programs (Abbott-Shim & Sibley, 1987) began in 1975 as a formative assessment measure of the effectiveness of a child care teacher training project. The intent of the instrument was to document the application of teacher training in classroom settings. The original Assessment Profile contained 147 items across six dimensions: Health & Safety (24 items), Learning Environment (18 items), Scheduling (23 items), Curriculum (28 items), Interacting (32 items), and Individualizing (22 items). These dimensions were chosen to represent the training content and simultaneously represented a logical conceptual organization of the elements of classroom practices. Training experience demonstrated that the dimensions were inter-related and that changes in one dimension generally resulted in changes in other dimensions. The correlation coefficients of the scales also supported the inter-relatedness of the dimensions (Abbot-Shim, Sibley & Neel, 1992).
The Assessment Profile for Early Childhood Programs: Research Version (Abbott-Shim & Sibley, 1992) was developed in response to the interest of researchers who were seeking an efficient, objective, observational measure of classroom practices. In an effort to respond to researchers who wanted to eliminate redundancies and reduce the number of items to “critical criteria”, each dimension of the Assessment Profile was factor analyzed to determine if there was sufficient common variance to meet the requirements of Item Response Theory (ITR) to form scales. The items in the Health & Safety scale did not share sufficient variance to meet the criteria of IRT. Therefore the Health & Safety scale was dropped from the Assessment Profile: Research Version. The remaining five scales (Learning Environment, Scheduling, Curriculum, Interacting, and Individualizing) had sufficient variance and were retained.
The National Transition Demonstration Project data set has provided a substantial number of classrooms and was, therefore, used to confirm the original analyses of the five scales. These analyses revealed modest changes in the factor structures. The original norming sample included 401 preschool, child care, Head Start and kindergarten classrooms (Abbott-Shim, Sibley & Neel, 1992). Since the Transition sample is larger and included primary grade classrooms, it is understandable that a slightly different factor structure might emerge. The analysis also examined a number of field test items that were included with the Transition sample.
Technical Report 3 - Page 4

Initial Analyses of Factor Structures of the Assessment Profile: Research Version with Transition Data In conducting the analyses and examining the scales for the Assessment Profile: Research Version, several assumptions were taken into account. First, the authors of the Assessment Profile: Research Version recognize their predisposition to preserve the original scales of the instrument. However, in examining the analyses, the authors utilized objective criteria throughout the scale revision process. Second, the 87 items that were common across the data sets for all grade levels were used in the analyses. Therefore, additional field tests items which had been added to the instrument and collected at some of the data collection periods were eliminated from these analyses because they were not available for kindergarten through third grade data sets. Third, it was decided that there would be the same number of items for each of the revised scales on the Assessment Profile: Research Version. The item pools for each of the scales had differing numbers of items and some scales had greater numbers of items that were more acceptable than other scales. Therefore, a few good items were eliminated from some scales because item selection was needed to obtain an equal number of items for each scale. Finally, IRT was used as the primary selection criterion since IRT scoring is used for the instrument.
The National Transition Assessment Profile: Research Version data included kindergarten, first, second, and third grade classrooms. All factor analyses reported here used tetrachoric correlations. As seen in Table 1, separate factor analyses for kindergarten, first, second, and third grade levels were conducted to determine if there were differences in factor structures across these grade levels. Table 1 reports the findings for 933 kindergarten, 935 first grade, 762 second grade, and 820 third grade classrooms. Factor loadings of .40 and above are reported for the items represented in the first five factors by grade level. The factors and items are fairly stable across the different grade levels with the exception of first grade in which the Interacting and Curriculum items merge into one factor. Although additional factors emerged in these analyses, none of these were stable across the different grade levels.
The results of these factor analyses across grade levels were similar enough that a factor analysis for the combined data set, including 2,630 classrooms across kindergarten, first and second grades, was conducted. Five factors in this analysis accounted for 71% of the variance. These five factors were clearly the five scales of the Assessment Profile: Research Version. The factor structure of the combined groups was similar to the factor structures of the separate groups. In addition to these five factors, there were eight other factors, each factor consisting of one to five items. Items measuring factors other than the five factors of the Assessment Profile: Research Version were prime candidates for removal from the scales. Since we were creating IRT based scales, we decided to use IRT procedures to select items.
Item Response Theory (IRT) Analyses for the Assessment Profile: Research Version
Technical Report 3 - Page 5

We were encouraged by the five factors to try an IRT scaling for the five scales of the Assessment Profile: Research Version for the combined data sets, 2,630 kindergarten, first, and second grade classrooms. First we conducted separate factor analyses on the items for each of the scales and found that the primary factor accounted for 59%, 63%, 41%, 71%, and 45% of the variance of the items on the Learning Environment, Scheduling, Curriculum, Interacting, and Individualizing scales respectively. These percentages substantially exceed Reckase’s (1979) 25% requirement for essential unidimensionality for the creation of an IRT based scale. Unidimensionality was supported and creation of IRT based scales was thus justified.
It was our initial expectation that we would base the scales on a two parameter IRT model because the scores are based on observation and there is not a possibility of guessing. However, there was enough difference in the fit statistics of the items to justify a three-parameter rather than a two-parameter model. The difference in the fit statistics occurred because the lower asymptote for some item characteristic functions was obviously non-zero. Figure 1 illustrates the difference in fit as plotted by the Bilog (Mislevsky, R.J. & Bock, 1990) computer program. Figure 1 shows the fit of a three-parameter model of an item with lower asymptote of .50. In Figure 1 the dots represent the three-parameter item characteristic curve found for this item. The x’s represent found proportions of positive responses to the item, and the asterisks represent what the lower asymptote might look like if the two-parameter model were used with the required lower asymptote of zero. As can be seen from the figure by the greater distance from the x’s to the asterisks than from the x’s to the dots, the lower asymptote of zero does not fit the observed proportion well. It is this lack of fit which leads to a three parameter model rather than a two parameter model. Examination for item fit yielded 12 usable items on each scale. The IRT reliabilities of the Learning Environment, Scheduling, Curriculum, Interacting, and Individualizing scales were .89, .95, .80, .93, and .90, respectively.
We interpreted the non-zero intercepts under the three-parameter model to mean that even for a lower functioning classroom, there was still a positive probability that the item would be observed. For example, in the Scheduling scale item # 12 [Classroom activities reflect variety: There is daily time when Teacher works with a small group of three to eight children.] has an asymptote of .50 while in the curriculum scale, item # 9 [Curriculum is individualized: Activities that involve children of differing skill levels are modified to accommodate variation within the group] in the Curriculum scale has an asymptote of .11. These asymptotes reflect that about half of the lower functioning classrooms were observed to have a teacher working with a small group, while in about one of ten lower functioning classrooms, the teacher was observed to modify activities for different skill levels.
Finally, we conducted separate factor analyses on the 12 items for each of the scales and it was found that the primary factor accounted for 75%, 75%, 55%, and 58% of the variance of the items on the Learning Environment, Scheduling, Curriculum Interacting, and Individualizing scales, respectively. The median factor loadings were .82, .97, .75, .84, and .82, respectively.
Technical Report 3 - Page 6

Factor Structures of the Revised Scales on the Assessment Profile: Research Version Having selected the 12 items with the best fit for each of the five scales, we ran a factor analysis to examine the resulting factor structure. Using the 2,630 classrooms across kindergarten, first and second grades, five factors accounted for 78% of the variance. Table 2 reports the factor loadings of .30 and above for 57 items on the five scales of the Assessment Profile: Research Version. Only three items did not load on the first five factors. However, the IRT analysis was able to use these items in forming the scales, since all items fit well. Since IRT requires only essential unidimensionality, as opposed to strict unidimensionality, for creation of a scale, it’s not surprising that a few items did not load on the five factors.
The five scales of the Assessment Profile: Research Version have met the unidimensionality criteria for IRT creation of scales, shown strong fit to a three-parameter IRT model, and have strong IRT reliability estimates for the sample used. In addition, the factor analysis of the revised scales, which included 60 items, confirmed the factor structure. The Assessment Profile: Research Version is thus shown to be a useful set of scales for measuring developmentally appropriate teaching practices.
References
Abbott-Shim, M.S. & Sibley, A.N. (1987). Assessment Profile for Early Childhood Programs. Atlanta: Quality Assist, Inc.
Abbott-Shim, M.S. & Sibley, A.N. (1992). Assessment Profile for Early Childhood Programs: Research Version. Atlanta: Quality Assist, Inc.
Abbott-Shim, M.S., Sibley, A.N., & Neel, John (1992). Research Manual, Assessment Profile for Early Childhood Programs. Atlanta: Quality Assist, Inc.
Mislevy, R.J., & Bock, R.D. (1990). BILOG 3 [Computer software]. Chicago: Scientific Software.
Reckase, M.D. (1979). Unifactor latent trait models applied to multifactor tests: Results and implications. Journal of Educational Statistics, 4 (3), 207-230.
Technical Report 3 - Page 7

Technical Report 3 - Page 8
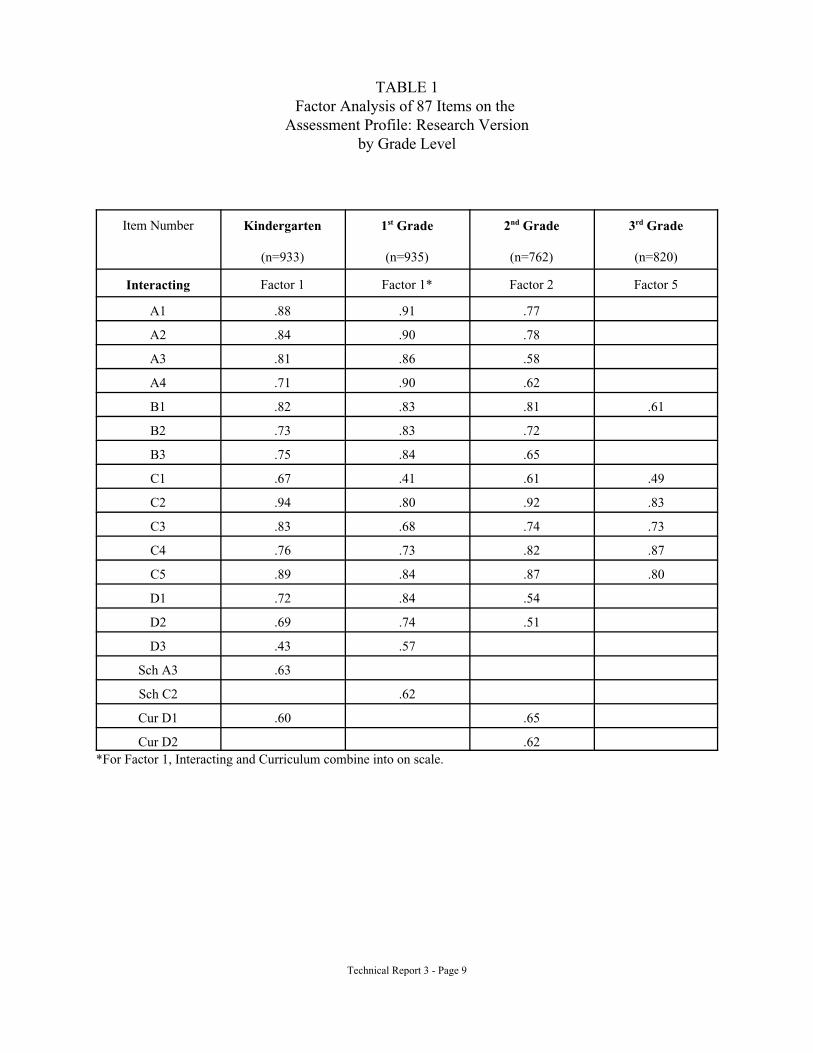
TABLE 1Factor Analysis of 87 Items on the
Assessment Profile: Research Versionby Grade Level
Item Number Kindergarten
(n=933)
1st Grade
(n=935)
2nd Grade
(n=762)
3rd Grade
(n=820)
Interacting Factor 1 Factor 1* Factor 2 Factor 5
A1 .88 .91 .77
A2 .84 .90 .78
A3 .81 .86 .58
A4 .71 .90 .62
B1 .82 .83 .81 .61
B2 .73 .83 .72
B3 .75 .84 .65
C1 .67 .41 .61 .49
C2 .94 .80 .92 .83
C3 .83 .68 .74 .73
C4 .76 .73 .82 .87
C5 .89 .84 .87 .80
D1 .72 .84 .54
D2 .69 .74 .51
D3 .43 .57
Sch A3 .63
Sch C2 .62
Cur D1 .60 .65
Cur D2 .62 *For Factor 1, Interacting and Curriculum combine into on scale.
Technical Report 3 - Page 9
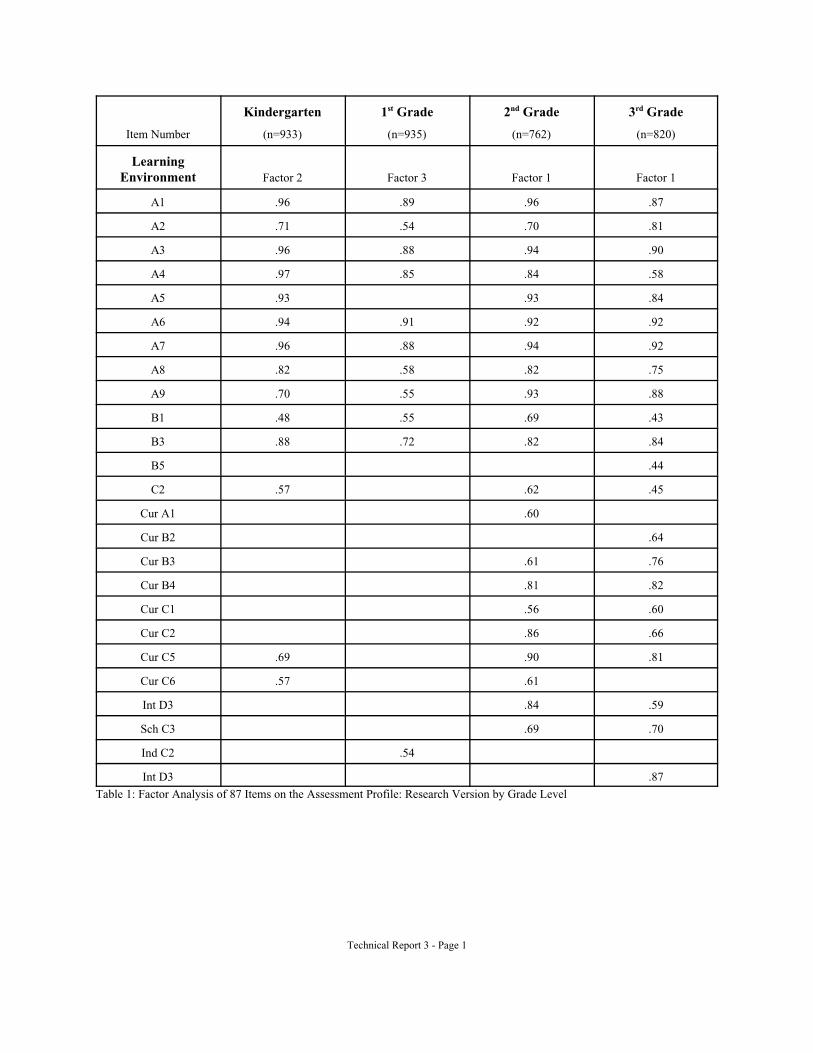
Item Number
Kindergarten
(n=933)
1st Grade
(n=935)
2nd Grade
(n=762)
3rd Grade
(n=820)
Learning Environment Factor 2 Factor 3 Factor 1 Factor 1
A1 .96 .89 .96 .87
A2 .71 .54 .70 .81
A3 .96 .88 .94 .90
A4 .97 .85 .84 .58
A5 .93 .93 .84
A6 .94 .91 .92 .92
A7 .96 .88 .94 .92
A8 .82 .58 .82 .75
A9 .70 .55 .93 .88
B1 .48 .55 .69 .43
B3 .88 .72 .82 .84
B5 .44
C2 .57 .62 .45
Cur A1 .60
Cur B2 .64
Cur B3 .61 .76
Cur B4 .81 .82
Cur C1 .56 .60
Cur C2 .86 .66
Cur C5 .69 .90 .81
Cur C6 .57 .61
Int D3 .84 .59
Sch C3 .69 .70
Ind C2 .54
Int D3 .87
Table 1: Factor Analysis of 87 Items on the Assessment Profile: Research Version by Grade Level
Technical Report 3 - Page 1

Item Number
Kindergarten
(n=933)
1st Grade
(n=935)
2nd Grade
(n=762)
3rd Grade
(n=820)
Curriculum Factor 5 Factor 1 Factor 5 Factor 4
A3 .59
B1 .70 .59
B2 .58 .57
B3 .53 .75
B4 .58 .58
B5 .65 .71 .55 .67
B6 .78 .49
B7 .70 .71
C1 .78 .63
C2 .72 .47
C3 .77 .79 .40
C4 .73 .53
C5 .46
D1 .48 .64
D2 .59
D3 .46
D4 .67 .72
D5 .42 .83
LE A10 .49
Ind D2 .50
Sch A3 .57
Sch C1 .79
Sch C4 .74
* For Factor 1, Curriculum and Interacting combine into one scale
Technical Report 3 - Page 2

Item Number Kindergarten
(n=933)
1st Grade
(n=935)
2nd Grade
(n=762)
3rd Grade
(n=820)
Scheduling Factor 3 Factor 2 Factor 3 Factor 3
A1 .93 .98 .94 .98
A2 .59 .46
B1 .97 .99 .92 .97
B2 .97 .97 .94 .96
B3 .96 .96 .96
B4 .85 .89 .84 .80
B5 .97 .99 .94 .98
B6 .84 .94 .85 .83
B7 .95 .96 .96 .95
B8 .96 .99 .95 .99
C3 .46
LE C2 .52
Cur A1 .52
Item Number Kindergarten
(n=933)
1st Grade
(n=935)
2nd Grade
(n=762)
3rd Grade
(n=820)
Individualizing Factor 4 Factor 4 Factor 4 Factor 2
A1 .76 .72 .72 .73
A2 .69 .75 .65 .59
A3 .79 .66 .81 .79
B1 .90 .80 .79 .73
B2 .92 .87 .92 .89
B3 .86 .79 .90 .95
B4 .90 .89 .92 .94
B5 .59 .67 .67 .75
C1 .44
E4 .64
Cur C4 .49
Cur D5 .40
Cur D6 .87 .71 .76 .89
Cur E4 .52 .64 .60
Technical Report 3 - Page 3

TABLE 2Factor Analysis of 60 Items on the Assessment Profile: Research Version
for Kindergarten, First, and Second Grade Classrooms (n=2630)
Factor 1 Learning Environment
Item Number Loading
A1 .97
A2 .64
A3 .96
A4 .89
A5 .95
A6 .97
A7 .96
A8 .84
A9 .79
B1 .66
B3 .91
C1 .31
*This item loaded on more than one factor.
Factor 3 Interacting
Item Number Loading
A1 .80
A2 .79
A3 .66
A4 .64
B1 .87
B2 .77
B3 .72
C1 .66
C2 .92
C3 .82
C5 .90
.54 Sch A3
Factor 2 Scheduling
Item Number Loading
A1 .96
B1 .98
B2 .98
B3 .97
B4 .89
B5 .98
B6 .91
B7 .97
B8 .98
C3 .41*
*This item loading on more than one factor.
Factor 4 Individualizing
Item Number Loading
A1 .79
A2 .80
A3 .75
B1 .90
B2 .93
B3 .92
B4 .94
B5 .85
E2 .31*
E4 .69
*This item loaded on more than one factor.
Technical Report 3 - Page 4

Factor 1 Learning Environment
Item Number Loading
A1 .97
A2 .64
A3 .96
A4 .89
A5 .95
A6 .97
A7 .96
A8 .84
A9 .79
B1 .66
B3 .91
C1 .31
*This item loaded on more than one factor.
Technical Report 3 - Page 5

To put the synopsis from Quality Assist in perspective, a report by a member of the Transition
Demonstration Project who monitored the work of Quality Assist follows:
SUMMARY FEEDBACK FROM THE MEETING WITH QUALITY ASSIST TO DISCUSS THE LONGITUDINAL REVISION OF THE ASSESSMENT PROFILE
Scott Snyder
The development of the Assessment Profile (2nd revision) by the staff of Quality Assist for use in the longitudinal evaluation of the Headstart Transition project was based on several critical decisions. First, a decision was made to preserve, to the extent possible, the initial five-factor framework of the original Assessment Profile. Second, as the Assessment Profile had undergone revision during the course of the longitudinal study, a decision was made to base longitudinal instrument development only on those 87 items common to all grades and cohorts. Third, in order to avoid interdependencies in the data due to classrooms being used for both cohorts, each classroom is analyzed only once. Fourth, it was decided to generate scales with equal numbers of items. Finally, a decision was made to use item response theory (ITR) as the major analytical procedure for constructing scales and for reporting results. The fourth and fifth decisions are psychometrically related (i.e., it is the use of IRT that enables scales of equal numbers of items to be generated without substantial loss of validity within any single scale).
The research done by Quality Assist appears to conform to technical standards of instrument development. The development of a longitudinal scale presents unique psychometric challenges associated with selecting scale structures that are both reasonably stable across grade levels and also interpretable. Through the use of IRT, factor analysis, qualitative and quantitative examination of item performance and qualitative interpretation of scale composition, the researchers have generated a psychometrically defensible and acceptable instrument for monitoring classroom characteristics at distinct grade levels.
The researchers at Quality Assist acknowledge that an independent group of researchers analyzing the data may, based on different decisions, generate an instrument comprised of different scales or items. However, it appears, based on my review of the analyses presented by Quality Assist, that an alternate structure capable of accommodating longitudinal data would not vary greatly from the proposed measure. It should not be surprising that an approximation of the original 5 factors would emerge from the analysis by Quality Assist, given that the item set that was analyzed was selected to reflect those 5 factors.
Technical Report 3 - Page 6
I have asked for some analyses to be performed before we formally recommend the generation of local and national data using the revised measure. First, I have asked for an investigation of the item variance across grade levels. This analysis is important in validating the stability of the scales across time. Second, I have asked that a quantitative demonstration be developed of the power of IRT to yield approximately equal scores based on 10, 12, or 14 items (or a similar distribution of items) within each scale of the Assessment Profile. Finally, I have asked for an analysis of the unidimensionality of the revised scales within each grade level. As there is sufficient evidence of unidimensionality across grade levels to justify use of the instrument for longitudinal analysis, unidimensionality within grade level would serve to support the use of the IRT scores for analysis within grade level.
It is important for users of the revised measure to examine the items which comprise each of the revised scales. While Quality Assist has elected to preserve the original labels for the factors, the constructs reflected by the remaining items are somewhat different than those in the original instrument.
Two features of the addendum by Dr. Snyder warrant comment. First, it is important to note
that while the work of Quality Assist is psychometrically sound, an independent group of researchers
may, using the available data, generate an alternative and equally defensible factor structure that does
not match the five factor solution proposed by Quality Assist. Second, reductions and transpositions
of items comprising subscales of the instrument alter, to some extent, the constructs represented by
such subscales. Specifically the following changes are notable:
Learning Environment: A disproportionate number of items relating to the arrangement
of classroom space to encourage independence and reflect the individuality of the child have been
removed. Therefore, the Learning Environment subscale now primarily reflects (9 of 12 items) the
nature and accessibility of instructional materials.
Scheduling: The changes in this scale involve the deletion of items concerning the variety
of classroom activities. To some extent such items are implicit in other items, and therefore may not
represent a substantial change in the underlying construct measured by the scale.
Curriculum: All items relating to multicultural sensitivity and appreciation were excluded
due to the misfit of item performance with the expectations of the psychometric model used to
generate the scale. More than half of the items concerning the ability of children to guide their own
learning were eliminated. Half of the items relating to the individualization of curriculum were
removed. Therefore, the Curriculum scale now focuses more on teacher instructional behaviors than
Technical Report 3 - Page 7

previously.
Interacting: Due to their absence from kindergarten observations, all items dealing with the
teacher providing support for student self-regulation were omitted. Furthermore, only one item (out
of four) concerning child engagement within the instructional context was retained. Items
concerning children’s affect were deleted or moved to another subscale.
Individualizing: All three items concerning the inclusion of, and accommodations for,
children with special needs have been omitted. More than half of the items concerning parent-
teacher communication were also omitted. These changes focus the revised scale on assessment
practices.
The aforementioned changes highlight: (a) the need to limit interpretation of the Assessment
Profile: Research Version for the Transition Study to the modified constructs discussed above, and
(b) the need to examine not only scale scores from the Assessment Profile but also the individual
items regarding multicultural sensitivity and inclusive practices for their value in evaluating the
quality of classroom practices and as mediators of child outcomes.
Analyses of internal consistency of the resulting scales yielded coefficient alphas ranging
from .78 to .91 across scales and grades. Moderate intercorrelations were evident amongst the
scales within grade level, suggesting that while the scales are not interdependent, they do tend to co
vary.
A DEVELOPMENTALLY APPROPRIATE PRACTICES TEMPLATE (ADAPT) Gottlieb, 1995
In addition to the Assessment Profile for Early Childhood Programs: Research Version
(Abbott-Shim, 1992) a second measure was developed to evaluate the success of transition services
to influence effective classroom practices and to examine the influence of classroom characteristics
and practices on academic and social outcomes. A group of investigators involved in the Transition
Study was interested in developing a second measure of classroom practice that they felt was more
closely aligned with the guidelines for developmentally appropriate practice proposed by the
National Association for the Education of Young Children (Bredekamp, 1993). The resulting
measure, A Developmentally Appropriate Practice Template (ADAPT) (Gottlieb, 1995), involves
Technical Report 3 - Page 8

observational ratings of eighteen attributes of classrooms. Attributes are nested within three scales:
Curriculum and Instruction, Interaction, and Classroom Management. A composite rubric is also
used to generate an overall rating for each classroom. The scale was initially developed on a sample
of first and second grade classrooms. Exact inter-rater reliability values for an initial subset of 68
classrooms across 21 schools ranged from .69 to .78. This value is somewhat less than the standard
criterion of 85% agreement. However, as this instrument was optional, local sites were not required
to establish higher levels of reliability. It should also be noted that exact agreement is a stringent
criteria for Likert items. Gamma coefficients are often reported as alternative indices of interrater
reliability with such scales.
While the ADAPT was not required, it was administered in a majority of the study sites.
Because the scale was developed and adopted after the first-year of the study, it was not administered
until 1995. Therefore, it was available in first-grade classrooms for the second cohort only. The
ADAPT was administered to 491 first grade classrooms, 1,083 second grade classrooms, and 1,177
third grade classrooms. Factor analyses yielded a two factor solution in first grade (classroom
rules/structure, classroom climate) accounting for 64% of the variance. Only a single factor emerged
for second and third grade (accounting for approximately 60% of the variance). Confirmatory factor
analyses did not reveal that a two factor solution was an improvement over a one factor solution for
any grade level. Given the truncated sample for first grade and the results of the confirmatory factor
analyses, a single factor solution was adopted for this instrument. Coefficient alphas exceeded .95
at each grade level. Therefore, the summated total score will serve as the primary outcome index
for the ADAPT.
Authors of the ADAPT and the Assessment Profile: Research Version are working conjointly
with members of the National Transition Research team to understand the functions of both scales
in describing the status and changes of classroom practices. Based on preliminary cluster analyses
and correlational studies, it appears that the ADAPT may be tapping a general disposition of teachers
toward implementing the guidelines for developmentally appropriate practices proposed by the
National Association for the Education of Young Children while the Assessment Profile may isolate
more discrete classroom components. A number of studies examining the convergent and divergent
validities of these scales will be conducted.
Technical Report 3 - Page 9

FAMILY RESOURCE SCALE (FRS) Dunst & Leet, 1987
The Family Resource Scale (FRS) was used in the transition study as a measure of the
respondent’s perception of the adequacy of their family resources. This measure of family resources
provides a unique assessment of how well-off a family is from their own perspective, which is
potentially very different from more standard comparisons such as poverty status. The FRS also
provides a broader assessment of family resources, including their ability to meet their basic needs,
and an assessment of how much time the family has. This scale assesses families’ perceptions of
their needs with the expectation that families will direct their energies to fulfilling their most basic
needs first. The instrument has been shown to be related to families’ commitment to intervention
(Dunst, Leet, & Trivette, 1988).
The FRS was administered in the fall of kindergarten and again in third grade. Respondents
rank thirty items on a five point scale ranging from ‘not at all adequate’ to ‘almost always adequate,’
with ‘not apply’ being an additional choice. The items are ordered starting with those that are most
basic (e.g. Food for 2 meals a day, and Enough clothes for your family) to those that are the least
basic (Money for family entertainment, and Travel/vacation). The FRS was developed in
consultation with a group of 28 professionals, and was tested on a group of 45 low to middle SES
mothers of preschool-aged children (Dunst & Leet, 1987). The instrument had an internal
consistency of .92 in the development data set, and a test-retest reliability of .52. A principal
components analyses, using varimax rotation, of the development data set yielded an 8 factor
solution which accounted for 75% of the variance of the test. This factor set was not used for further
analyses.
Because a review of the FRS concluded that validity of the subscales was not adequately
demonstrated (McGrew, 1992), further analyses of the FRS subscales were performed for the
Transition study before their use in any analyses. Cohort I data was used in an exploratory principal
components analyses, reserving Cohort II data as a confirmatory sample. The psychometric analyses
began by examining the ‘does not apply’ response. For the item ‘Good job for yourself or spouse,’
N/A responses were recoded as ‘1’ because 90% of those responding ‘N/A’ were not employed. The
remaining items with over 10% ‘N/A’ responses were dropped from the analyses because they
Technical Report 3 - Page 10

Table 1. FRS items and factors on which they load.
clearly were not relevant to a large portion of the sample. One additional item ‘Money to buy special
equipment/supplies for child(ren)’ was also dropped because it applied to only a subset of the
sample. In the remaining 26 items, ‘N/A’ responses were recoded as missing and the items were
entered into a principal components analyses using listwise deletion of all missing values. This
resulted in a sample of 2,321 Cohort I kindergarten families and 1,883 Cohort I third grade families.
A parallel series of principal component analyses (using polychoric correlation matrices and varimax
rotation) were performed on the Cohort I kindergarten and third grade data. Complex items that
loaded on more than one factor at .45 or greater were dropped. This process resulted in a set of three
highly intuitive subscales -- Basics, Money, and Time -- that included 22 of the 30 items on the FRS
(See Table 1).
The principal components analyses were followed by confirmatory factory analyses on
Cohort II family data from kindergarten and third grade. Following listwise deletion of missing data,
2688 kindergarten families and 2101 third grade families were included in the confirmatory analyses.
Using LISREL 8 with a CSM estimation procedure (weighted least squares estimation of the
polychoric matrices (Kaplan, 1990)), the three
correlated factor model was imposed on the two Cohort
II samples. Fit indices were adequate, suggesting that
the three correlated factor model fit the data reasonably
well. Additionally, these fit indices reflected superior
model fit in contrast to competing models.
For further analyses, subscale scores were
computed. This was done by taking the mean of all the
items in each respective subscale to form three new
variables: Basics, Money, and Time. The mean was
used so that the three subscales would be in the same
metric, and would be comparable to the original
responses (i.e., a score of 1.5 is half way between “Not
at all adequate” and “Seldom adequate”). As part of
this process, the “Does not apply” response category
B a s i c N e e d s
M o n e y
T i m e
Food for 2 meals a day X
House or apartment X
Enough clothes for your family X
Heat for your house or apartment X
Indoor plumbing/water X
Medical care for your family X
Furniture for your home or apartment X
Telephone or access to a phone X
Dental care for your family X
Good job for yourself or spouse X
Money to buy things for self X
Money for family entertainment X
Money to save X
Travel/vacation X
Time to get enough sleep/rest X
Technical Report 3 - Page 11
was addressed, and it was decided that for those subjects who had 20% or less n/a responses for a
subscale, the n/a response would be replaced with an imputed value based on their present FRS items
(imputed via an EM algorithm). This method allowed us to include respondents who knew how to
answer most of the items on the subscale. It is the least biased method for dealing with these
responses in that the imputed values have very little effect on any given respondent’s subscale scores,
and many fewer respondents are eliminated from the analyses. Dropping respondents from the
analyses represents decreased statistical power and also a bias in the sample if those respondents who
are dropped are at all different from those who remain.
In summary, as part of our psychometric review of the FRS, the proposed subscales were
found to be inadequate. They were modified through a series of exploratory principal components
analyses and subject to verification with confirmatory factor analyses. This process resulted in three
highly intuitive subscales: Basics, Money, and Time. Scores for these subscales were computed for
all respondents, and for those with a small number of “Does not apply” responses, imputation was
used to replace the “Does not apply.” These subscales were also found to have adequate internal
reliabilities (Chronbach’s Alphas where between .72 and .87).
FAMILY ROUTINE INVENTORY (FRI) Jensen, James, Boyce, & Hartnett, 1983
The family context has been seen as providing order and stability in the lives of children
(Boyce, Jensen, James, & Peacock, 1983). The Family Routine Inventory (FRI) is an instrument that
has been developed to measure differences between families in the ordering of their every day lives.
The presence of routines is expected to be a buffer against stressors that families and children
experience.
The FRI was administered as part of the family interview in the fall of kindergarten and again
as an optional instrument in third grade. Initial examination of the FRI in the Transition data focused
on examining possible subscales. The FRI was examined separately in Cohorts I and II for
kindergarten and third grade using exploratory principal component analyses (with polychoric
correlation matrices and varimax rotation). The results of these analyses were found to be
inconsistent across Cohorts and time periods, and they also failed to show theoretically significant
Technical Report 3 - Page 12

subscales. Consequently, the author’s suggested scoring protocol of using one frequency score (a
summation of the ordinal values) is used for all further analyses.
The FRI was originally validated on a sample of 307 mothers who represented diverse
ethnic and socioeconomic backgrounds (Jensen, James, Boyce, & Hartnett, 1983). The
instrument was found to have acceptable test – retest reliability (.79) and was also validated by
comparison to the subscales of the Family Environment Scale which measure similar constructs.
Scores were found to be moderately related to the Family Environment Subscales, to family
income, and to the age of the oldest child in the family. The FRI scores in the Transition data
where found to have acceptable internal consistency (Cronbach’s alpha’s: kindergarten = .71, and
third grade = .77).
NEIGHBORHOOD SCALES
Furstenberg, Cook, Eccles, Elder, & Sameroff, 1990
The Neighborhood Scales are a measure of positive and negative dimensions of the
neighborhood a family lives in, from the perspective of the respondent (Furstenberg, Cook, Eccles,
Elder, & Sameroff, 1990). This measure allows family units in the National Transition Project to
be placed in the broader context of their neighborhoods. The Neighborhood Scales consist of six
scales which measure: neighborhood cohesiveness; barriers to services; negative effects; social
control in neighborhood, probability of success for children in neighborhood, and a global rating of
neighborhood.
The Neighborhood Scales were administered as part of the family interview in the fall of
kindergarten, and again in first grade. In third grade, one of the six subscales was part of the
National Core and the remaining five subscales were optional, and were administered in 10 sites.
As part of the psychometric review, the six scales of this instrument were tested with two
confirmatory factor analyses (CFA) using kindergarten and first grade data. The CFA (using
polychoric correlations and the WLS estimation procedure) showed strong support for the existence
of six correlated subscales (All fit indices were above .90), and rejected the alternative model that
all items loaded on a single construct. The six subscales were moderately correlated (from -.49 to
Technical Report 3 - Page 13
.67) in each grade. The internal reliability of the scales was adequate (Chronbach’s alphas ranged
from .74 to .87 in kindergarten and .76 to .88 in first grade).
PEABODY PICTURE VOCABULARY TEST-REVISED (PPVT-R) Dunn & Dunn, 1981
Due to the importance of communication and comprehension, receptive language is
considered an important factor in a child’s successful transitions in school. The Peabody Picture
Vocabulary Test-Revised (PPVT-R) was used as the measure of receptive vocabulary. The test is not
considered to be a general test of intelligence, and was not used as a proxy measure of general or
verbal intelligence for this study. It was hypothesized that classroom quality would be related to
PPVT-R scores. Furthermore, because of the importance of verbal comprehension as a factor in
school success, performance on the PPVT-R was expected to be an important predictor of other
academic outcomes.
The PPVT-R is individually administered and requires approximately ten to fifteen minutes
to complete. The scale requires a child to point to a picture that represents the word spoken by the
examiner. The PPVT-R was standardized nationally on a representative sample of 5,028 persons.
One hundred children of each gender at each age level were used in the standardization sample.
Rasch analysis was used to equate the two forms of the scale. A non-technical discussion of Rasch
scaling is provided at the end of this document. Internal consistency values (split-half reliabilities)
for children and youth ranged from .61 to .88. The median test-retest reliability was approximately
.78 for a an interval of 31 days or less indicating adequate short-term stability. It should be noted
that a relatively lower level of stability was found for children between the age of five years and eight
years eleven months than for older children.
While reviewers are generally positive about the technical merits of the PPVT-R, and
researchers use the instrument frequently as a measure of receptive vocabulary, concern has been
expressed about the adequacy of sampling in terms of geographic, linguistic, ethnic, and
socioeconomic representation (Wiig, 1985). A Spanish version of the instrument was made
available and was used as a secondary measure with Spanish-speaking children.
Technical Report 3 - Page 14

SCHOOL CLIMATE SURVEY
Kelley, Glover, Keefe, Halderson, Sorenson, & Speth, 1986
The School Climate Survey (Kelley, Glover, Keefe, Halderson, Sorenson, & Speth, 1986)
was created to measure individuals' perceptions of how the community feels about the school.
Respondents are asked to rate how much ‘most people’ would agree with specific statements.
The statements are meant to be school wide, not specific to a given classroom. The nature of this
instrument is such that it opens the possibility of creating composite ratings for each school,
based on the ratings of all respondents from that school.
The School Climate Survey was administered to parents, teachers, and principals in all
five years of the study. The scale was modified for use in the Transition study, and 9 items of the
original instrument were deleted. This resulted in a 46 item instrument, with 9 subscales
(Teacher-Student Relationships; Security and Maintenance; Administration; Student Academic
Orientation; Student Behavioral Values; Student Peer Relationships; Parent and Community-
School Relationships; Instructional Management; Student Activities). There are six possible
responses to each item ranging from ‘strongly disagree’ to ‘strongly agree,’ and a response of
‘don’t know.’ The psychometric review for this scale focuses on validation of the 9 subscales in
the National Transition Project data set, and on resolving questions about the use of the ‘don’t
know’ response.
Initial validation of the School Climate subscales involved exploratory principle components
analyses using teacher and family responses, with listwise deletion of the ‘don’t know’ responses.
All teacher responses were included in one analysis for this purpose, and family responses were
analyzed by grade level of the child. These analyses were not conclusive. Use of an eigen value of
1 for determining the number of factors to be retained suggested a nine factor solution that was
similar but not identical to that proposed by the authors. However, the amount of variance accounted
for by each factor over 5 was less than 3%, suggesting that these factors were not very useful.
Because no theoretically meaningful solution containing less than 9 factors was found, the decision
was made to use a 9 factor solution. CFA analyses were then conducted using polychoric
correlations and the WLS estimation procedure. These analyses rejected a one factor solution, but
found very few differences between the new 9 factor solution suggested by the principal components
Technical Report 3 - Page 15

analyses and the original one proposed by the authors. Without having a strong reason to modify
the original factor structure, the authors' original factors are used for the rest of the study. The
factors have adequate internal reliability (Chronbach’s alphas range from .73 to .93 in kindergarten),
and are highly correlated (between .73 and .93 for families, and between .58 and .88 for teachers
using the correlations estimates derived from the CFA analyses).
One other issue with the School Climate Survey was also dealt with. A large number of
respondents cited ‘don’t know’ for one or more items. This is especially true of responses to the
family interview, in which some items had over a 25% ‘don’t know’ response. The scoring protocol
for the School Climate Survey calls for treating “don’t know” responses as missing, and then
computing a mean score for each subscale based on the number of responses that were present. This
is mathematically equivalent to replacing “don’t know” responses with the average of all other items
in that subscale for a given subject. We, however, find this option to be problematic because
individual items have different distributions and are conceptually different from one another; thus
replacing a given item with the mean of different items is a poor estimate of the value of the missing
data. This also does not address what happens if a given item has a large “don’t know” response.
In our analyses of the “don’t know” responses, we first looked at the percentage of
respondents in each group that cited “don’t know” for each year. This clearly showed that “don’t
know” is an often cited response for families, although with the exception of one subscale it was
rarely cited by the teachers and principals. Consequently, we recommend not using the one subscale,
Student Activities, that all three groups of respondents tend to answer “don’t know” to. The
remaining eight subscales do not appear to have a problem with teacher or principal scores.
Further review of patterns of “don’t know” responses shows that for the family respondents,
other subscales appear to have large percentages of “don’t know” responses. This appears to be an
indication by the respondents that the questions are difficult for parents to access. We decided that
subscale scores to be used should have on average no more than 10% “don’t know” responses for
all the items on the subscale. Using this criteria, the Administration, Student Behavioral Values,
Parent and Community-School Relationships, and Instructional Management subscales scores would
not be used for the family respondents. That leaves 4 subscales remaining for the families, Teacher-
Student Relationships, Security and Maintenance, Student Academic Orientation, and Student-Peer
Technical Report 3 - Page 16

Relationships.
For the four remaining subscales of the family respondent, we recommend treating the “don’t
know” responses as missing data, and imputing their values using the EM algorithm. We only
recommend using this solution, however, when the respondent answers most (75%) of the items on
a given subscale. So, if a respondent replied “don’t know” to one or two items in the Teacher-
Student subscale, those responses would be replaced with imputed values; however, if they
responded “don’t know” to 3 or more items, their subscale score would remain missing. A review
of the missing data patterns in kindergarten shows that this procedure would greatly increase the
amount of data available for those four subscales in which it is used (with the imputation procedure,
valid data is obtained for 93% to 96% of the subjects).
This recommendation is a conservative response in that it requires respondents to have
answered most of the items before we assign them a score for that subscale. However, some
conceptual issues have been raised with the use of any method of replacing “don’t know” responses
with data. Imputation or any other method of replacing these values is essentially taking a
respondent’s answer, and changing it. That is, the data is not actually missing, consequently
replacing it with other values is not imputation. In our view the approach we are using provides the
most conservative and least biasing method of solving this problem. That is, we are only replacing
“don’t know” responses when a subject did know enough of the items for a subscale that we can be
reasonably confident that we are having little effect on what their subscale score would have been
had they known the answer to it. Also, we are suggesting a technique for replacing the “don’t know”
responses which we expect to provide the best possible estimates of the items that are missing.
SOCIAL SKILLS RATING SYSTEM (SSRS) Gresham & Elliott, 1990
The Social Skills Rating System (SSRS) is an instrument, administered to parents and
teachers, that measures different aspects of children’s social skills. Respondents are asked how often
the child exhibits a behavior, and how important that behavior is. However, the scoring protocol
addresses only the assessments of a child’s behavior. While the teacher and parent forms of the
Technical Report 3 - Page 17

SSRS are different, about half of the items on them are identical. The SSRS was developed on a
nationally representative sample of 4,170 children, and standard scores are available for the different
SSRS scales which are based on population norms taking the sex of the child into account.
In the Transition project, the SSRS is the primary non-academic child outcome. The Social
Skills scale of the SSRS was administered to parents and teachers in kindergarten through third grade
and the problem behavior scale was administered to parents and teachers in second and third grades.
These scales were all found to have adequate internal reliability (Coefficient Alphas from .87 to .94)
and test-retest reliability (Correlations of .87 to .65) in the national sample on which they were
tested, with the caveat that the test-retest reliability for parents' ratings was a little low (.65). Each
of the SSRS scales administered are composed of a number of subscales. The Social Skills scale has
three subscales (Cooperation, Assertion, and Self-control) in the teacher version, and one additional
one (Responsibility) in the Parent version. The Problem Behavior scale has three subscales
(Externalizing, Internalizing, and Hyperactivity) in both versions. Both of the scales and their
subscales had very high factor loadings for both parents and teachers (the lowest being .51).
In summary, the SSRS is a widely used, nationally standardized instrument which measures
children’s social behaviors as rated by multiple observers. Two of the SSRS scales, Social Skills
and Problem Behaviors, were administered in the National Transition Project to parents and teachers.
The testing manual reported adequate internal reliability and test-retest reliability for the scales used.
Because of the rigorous development undergone by the SSRS, no further review was conducted in
the National Transition Project.
WOODCOCK-JOHNSON PSYCHO-EDUCATIONAL BATTERY-REVISED (WJ-R) (Woodcock & Johnson, 1990)
The Woodcock-Johnson Psycho-Educational Battery -Revised is a set of individually
administered tests for assessing a variety of academic and cognitive skills. Two scales from the WJ
R were used as part of the core battery for the Transition Demonstration Study. The Reading and
Mathematics scales of the battery were administered annually to children in order to provide a
standardized measure of individual progress over time in two academic areas viewed as critical
indicators and predictors of children’s success in school.
Technical Report 3 - Page 18

The Reading cluster is comprised of two separate tests, letter-word identification and passage
comprehension. Letter-Word Identification requires the child to identify letters or words that are
presented to them. Passage Comprehension requires the child to identify a picture represented by
a phrase or to provide a word that would appropriately complete a sentence within the context of a
passage. For children between 6 and 9 years old, the Examiner’s Manual (Woodcock & Mather,
1990) reports internal consistency reliabilities of .96 and .94 for Letter-Word Identification and .95
and .88 for Passage Comprehension.
The Mathematics cluster is comprised of two separate tests, calculation and applied
problems. Calculation requires the child to perform basic mathematical computations (addition,
subtraction, multiplication, division). The Applied Problems test requires the child to determine the
appropriate mathematical procedure needed to solve a problem, identify necessary information to
apply, and perform simple calculations. For children between 6 and 9 years old, the Examiner’s
Manual (Woodcock & Mather, 1990) reports internal consistency reliabilities of .93 and .89 for
Calculation and .84 and .90 for Applied Problems.
When the test was restandardized in 1986-1989, a stratified national sampling design
included 3,245 subjects between kindergarten and 12th grade. Sampling and norming procedures
meet high technical standards. Critiques of the instrument support its technical quality (e.g.,
Cummings, 1995). Rasch scaling procedures were used during the norming of the battery. A non
technical discussion of the Rasch approach and its implications for subsequent analysis is provided
at the end of this document. Due to the integrity of sampling procedures and the psychometrics of
the instrument, there was no need for supplemental psychometric analysis of these scales by the
National Transition Project.
RASCH-WRIGHT (W-ABILITY) SCORES: AN INTRODUCTION
A central feature of the proposed analyses of the Woodcock-Johnson Psychodeducational
Battery-Revised (WJ-R) and Peabody Picture Vocabulary Test-Revised (PPVT-R) is the use of the
Rasch-Wright (W-ability) scores as an outcome metric for longitudinal study. The purpose of this
document is to provide a brief and non-technical overview of the Rasch-Wright scores and their
Technical Report 3 - Page 19

applications to the two primary academic measures.
The W-ability scores proposed for use in longitudinal analyses based on the WJ-R and PPVT
R are based on a general measurement model known as latent trait analysis or item response theory.
A specific application of the model is the Rasch-Wright approach, based in the work of George
Rasch and Benjamin Wright. The model is useful in the development of new tests, the analysis of
existing tests, and the interpretation of test performance for individuals or groups. As is explicated
in the examiner's manuals, both the WJ-R and the PPVT-R used latent trait analysis in item selection
and score development. Richard Woodcock (of the WJ-R) was one of the first researchers to apply
Rasch-Wright scaling to the development of an academic achievement test -- the initial 1977 version
of the Woodcock-Johnson. The model provides a cost-efficient tool for: (a) identifying appropriate
items, (b) calibrating item difficulties (that are calculated on the same W scale as person ability) used
to determine item ordering, and (c) generating W-ability scores that were in turn translated to other
normative derived scores (e.g., normal curve equivalents, percentiles, age equivalents).
In the case of both instruments, raw scores (the number of items passed) were first converted
to W-ability scores. The W-ability score associated with each raw score is generated from a
probabalistic model which takes into account the difficulty of items on the test. The W-ability scores
have several critical advantages that make them particularly well-suited to monitoring and analyzing
change of individuals and groups across time. First, W-ability scores represent a unidimensional
continuum (e.g., growth model) that is not referenced to a particular subsample (e.g., age-group).
In other words, improvements in performance along the achievement trait (i.e., learning) are reflected
in gains on W-ability scores. Performance is referenced to the underlying dimension rather than to
a normative comparison group. Low scores reflect the lowest levels of educational attainment in a
given domain (e.g., mathematical calculations) and high scores reflect the highest levels of
educational attainment. Second, W-ability scores maintain equal-interval characteristics. That is,
a gain of 3 W-ability points from 84 to 87 on the PPVT-R represents the same amount of gain as a
3 point gain from 102 to 105 on the same test. This characteristic of interval-level scaling is an
important assumption of parametric inferential statistics. When coupled with the growth continuum
features discussed first, W-ability scores are particularly desirable for longitudinal analyses. Third,
for considerations of individual-level scores, each W-ability score is associated with a unique
Technical Report 3 - Page 20

standard error of measurement. Therefore, separate confidence intervals can be computed for each
W-ability score. Finally, as W-ability scores are the first scores converted from raw scores, they
contain the least amount of unintended error variance contributed by transformations to supplemental
age-based derived scores. For example, the PPVT-R normalized standard scores (with a mean of
100 and standard deviation of 15) are based on area transformations of W-ability scores within each
age group followed by interpolations between the 25 age-groups tested. Such transformations and
interpolations may present a degree of error that would not be present using the W-ability scores
alone. The use of percentile scores or age- or grade-equivalents presents even greater interpretive
and analytical challenges.
The WJ-R and the PPVT-R have generated W-ability scores with different ranges and
centers. For example, the PPVT-R W-ability scale ranges from 20 to 180 (centered on 100), while
the WJ-R scores range from 300 to 700 (centered on 500). These scales are arbitrary and were set
by the developers of the tests. They do, however, retain the properties of unidimensionality and
equal-interval scaling which, as indicated before, makes the ability scores particularly desirable for
longitudinal and comparative analyses.
Another metric commonly computed are logit estimates of item difficulty and person ability.
Logit ability estimates describe performance in terms of natural logarithm units. Such scores have
properties that may be even more desirable for longitudinal research than W-ability scores (e.g.,
ratio-level measurement, unbounded estimates for regression-based analyses). The publishers of the
PPVT-R have made conversion tables for such scores available. Discussion of the problems and
prospects of logits is beyond the scope of this paper.
W-ability scores are not without problems. For example, the meaning of the scores is not
immediately evident to consumers. To understand a W-ability score, the reader/researcher must
understand the possible range of values and the nature of the growth curve. Percentiles, IQ-type
standard scores, normal curve equivalents, and age equivalents are more common metrics in
educational research than are W-ability scores. Furthermore, the relationship between W-ability
scores and age is typically not linear. For example, the latent trait being assessed by the PPVT-R,
hearing vocabulary, is represented by a decelerating curve across the age of the respondent in the
standardization group (Dunn & Dunn, 1981). Therefore, while W-ability is scaled at equal intervals,
Technical Report 3 - Page 21

the actual dimension as expressed within the population may be curvilinear. It should be noted that
the PPVT-R growth curve does not show marked deceleration for the age group of students involved
in the transition study.
The nature of the application of the W-ability scores to the national questions
depends on the validity of two assertions made by the developers of the two tests. First, the
authors of the PPVT-R argue that, due to the properties of the scores, the W-ability estimates of
the L and M forms of the test may be treated as equivalent and therefore directly compared
(whereas the raw scores cannot). This assumes however, appropriate horizontal equating of the
forms. While examinations of the calibrations tables seem to support the validity of the claim,
further inquiry will be made to ensure a valid understanding of the equating procedures and the
consequences. The authors of the WJ-R argue that W-ability scores for subtests within a
common domain can be averaged (yielding a cluster score representing the domain as a whole).
A potential concern about this approach is the implied assumption of equal standard deviations
between the subtests across time. These assertions are important for the analyses of the national
questions. While the Rasch-Wright scores have psychometric properties that make them
desirable for longitudinal research, further inquiry regarding the validity of the aforementioned
assertions is needed before confidence can be placed in the integrity of the resulting analyses.
Technical Report 3 - Page 22

REFERENCES
Abbott-Shim, M., Sibley, A., & Neel, J. (1998). Psychometric report of the Assessment Profile for Early Childhood Programs: Research Version for the National Transition Demonstration Project. Atlanta: Quality Assist, Inc.
Abbott-Shim, M.S. & Sibley, A.N. (1992). Assessment Profile for Early Childhood Programs: Research Version. Atlanta: Quality Assist, Inc.
Abbott-Shim, M.S., Sibley, A.N., & Neel, John (1992). Research Manual, Assessment Profile for Early Childhood Programs. Atlanta: Quality Assist, Inc.
Abbott-Shim, M.S. & Sibley, A.N. (1987). Assessment Profile for Early Childhood Programs. Atlanta: Quality Assist, Inc.
Boyce, W. T., Jensen, E. W., James, S. A., & Peacock, J. L. (1983) The Family Routines Inventory: Theoretical origins. Social Science Medicine, 17, 1983-2000.
Cummings, J. (1995). Review of the Woodcock-Johnson Psycho-Educational Battery-Revised. In J.C. Conoley & J.C. Impara (Eds), The Twelfth Mental Measurement Yearbook (1113-1116). Buros Institute of Mental Measurement: Lincoln, NE.
Dunn, L. M. & Dunn, L. M. (1981). Peabody Picture Vocabulary Test-Revised. Circle Pines, MN: American Guidance Service.
Dunst, C. J., & Leet, H. E. (1987). Measuring the adequacy of resources in households with young children. Child care, health and development, 13, 111-125
Dunst, C. J., Leet, H. E., & Trivette, C. M. (1988). Family resources, personal wellbeing, and early intervention. The Journal of Special Education, 22, 108-116.
Furstenberg, F. F., Cook, T. D., Eccles, J. P., Elder, G. H., & Sameroff, A. J. (1990). Neighborhood Scales. Unpublished Manuscript.
Gottlieb, M. (1995). A Developmentally Appropriate Practice Template (ADAPT).
Gresham, F. M., & Elliott, S. N. (1990). Social Skills Rating System. Circle Pines, MN: American Guidance Service, Inc.
Harms, T. & Clifford, R. M. (1980). Early Childhood Environment Rating Scale. New York: Teachers College Press.
Technical Report 3 - Page 23
Jensen, E. W., James, S. A., Boyce, W.T., & Hartnett, S. A. (1983). The Family Routines Inventory: Development and validation. Social Science Medicine, 17, 201-211.
Kaplan, D. (1990). Evaluationg and modifying covariance structure models: A review and recommendation. Multivariate Behavioral Research, 25, 137-155.
Kelley, E. A., Glover, J. A., Keefe, J. W., Halderson, C., Sorenson, C., & Speth, C. (1986). School Climate Survey (Modified) Form A. National Association of Secondary School Principals. Reston: Virginia.
McGrew, K. S., Gilman, C. J., & Johnson, S. (1992). A review of scales to assess family needs. Journal of Psychoeducational Assessment, 10, 4-26.
Wiig, E. (1985). Review of Peabody Picture Vocabulary Test-Revised. In J. Mitchell, Jr. (Ed.), The Ninth Mental Measurement Yearbook, Vol 2 (1127-1128). Buros Institute of Mental Measurement: Lincoln, NE.
Woodcock, R. & Johnson, M. (1990). Woodcock-Johnson Psycho-Educational Battery-Revised. Allen, TX: DLM Teaching Resources.
Woodcock, R. & Mather, N. (1990). Examiners' Manual: Woodcock-Johnson Tests of Achievement. Allen, TX: DLM Teaching Resources.
Technical Report 3 - Page 24

Technical Report #4
Analyses of School Climate Survey
and Assessment Profile
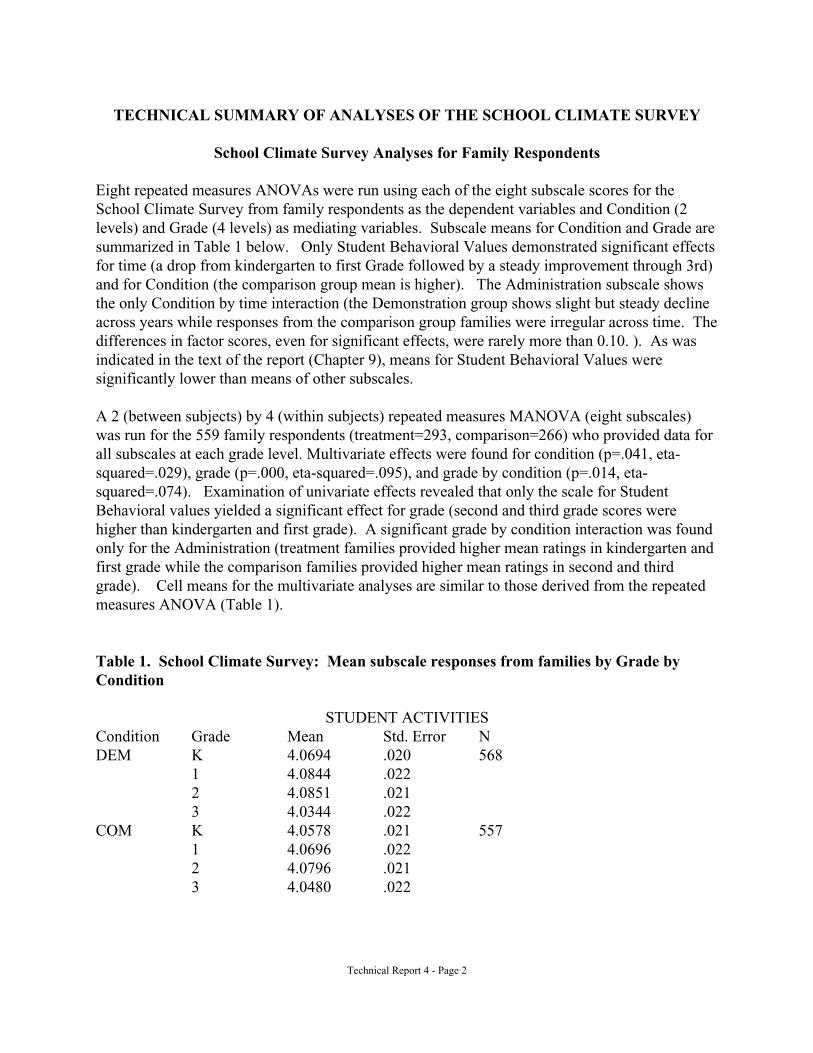
TECHNICAL SUMMARY OF ANALYSES OF THE SCHOOL CLIMATE SURVEY
School Climate Survey Analyses for Family Respondents
Eight repeated measures ANOVAs were run using each of the eight subscale scores for the School Climate Survey from family respondents as the dependent variables and Condition (2 levels) and Grade (4 levels) as mediating variables. Subscale means for Condition and Grade are summarized in Table 1 below. Only Student Behavioral Values demonstrated significant effects for time (a drop from kindergarten to first Grade followed by a steady improvement through 3rd) and for Condition (the comparison group mean is higher). The Administration subscale shows the only Condition by time interaction (the Demonstration group shows slight but steady decline across years while responses from the comparison group families were irregular across time. The differences in factor scores, even for significant effects, were rarely more than 0.10. ). As was indicated in the text of the report (Chapter 9), means for Student Behavioral Values were significantly lower than means of other subscales.
A 2 (between subjects) by 4 (within subjects) repeated measures MANOVA (eight subscales) was run for the 559 family respondents (treatment=293, comparison=266) who provided data for all subscales at each grade level. Multivariate effects were found for condition (p=.041, eta-squared=.029), grade (p=.000, eta-squared=.095), and grade by condition (p=.014, eta-squared=.074). Examination of univariate effects revealed that only the scale for Student Behavioral values yielded a significant effect for grade (second and third grade scores were higher than kindergarten and first grade). A significant grade by condition interaction was found only for the Administration (treatment families provided higher mean ratings in kindergarten and first grade while the comparison families provided higher mean ratings in second and third grade). Cell means for the multivariate analyses are similar to those derived from the repeated measures ANOVA (Table 1).
Table 1. School Climate Survey: Mean subscale responses from families by Grade by Condition
STUDENT ACTIVITIES Condition Grade Mean Std. Error N DEM K 4.0694 .020 568
1 4.0844 .022 2 4.0851 .021 3 4.0344 .022
COM K 4.0578 .021 557 1 4.0696 .022 2 4.0796 .021 3 4.0480 .022
Technical Report 4 - Page 2

INSTRUCTIONAL MANAGEMENT Condition Grade Mean Std. Error N DEM k 3.9026 .023 720
1 3.8849 .025 2 3.8913 .023 3 3.9070 .023
COM k 3.9455 .024 701 1 3.9403 .025 2 3.8987 .023 3 3.9563 .023
STUDENT-PEER INTERACTION Condition Grade Mean Std. Error N DEM k 3.8109 .020 754
1 3.8259 .021 2 3.8222 .020 3 3.8335 .020
COM k 3.8465 .020 727 1 3.8417 .021 2 3.8456 .020 3 3.8676 .020
STUDENT BEHAVIORAL VALUES Condition Grade Mean Std. Error N DEM k 2.7554 .034 570
1 2.7380 .034 2 2.7925 .033 3 2.8136 .033
COM k 2.8463 .035 527 1 2.7982 .036 2 2.8821 .035 3 2.9537 .035
Condition Grade Mean Std. Error N DEM k 4.1393 .017 798
1 4.1507 .017 2 4.1163 .016 3 4.1273 .017
COM k 4.1008 .017 785
STUDENT ACADEMIC ORIENTATION
Technical Report 4 - Page 3

1 4.1241 .017 2 4.1387 .017 3 4.1390 .018
ADMINISTRATION Condition Grade Mean Std. Error N DEM k 4.0124 .029 527
1 4.0106 .031 2 3.9937 .029 3 3.9399 .030
COM k 3.9502 .030 499 1 3.9578 .032 2 4.0452 .029 3 3.9879 .031
SECURITY AND MAINTENANCE Condition Grade Mean Std. Error N DEM k 4.1553 .017 806
1 4.1956 .019 2 4.1762 .018 3 4.2200 .018
COM k 4.1900 .017 799 1 4.1864 .019 2 4.2110 .018 3 4.2213 .018
TEACHER-STUDENT RELATIONSHIPS Condition Grade Mean Std. Error N DEM k 4.0351 .020
1 4.0158 .020 2 4.0085 .020 3 3.9724 .021
COM k 4.0094 .020 1 4.0097 .021 2 4.0135 .02 3 4.0252 .021
Technical Report 4 - Page 4

School Climate Survey Analyses for Principals
Repeated measures multivariate analyses of variance were conducted across sites using principal’s responses to the School Climate Survey in order to determine whether significant changes occurred in principal’s perceptions of school environment during the duration of the study. Principal responses from 1993 were compared with their responses in 1997 across all eight factors of the School Climate Survey. Treatment condition served as the independent variable in the analyses. Repeated measures data was available from approximately 130 principals in each treatment condition (sample sizes varied slightly by factor). No statistically significant main effects were found for time (the repeated measure), treatment condition, or the interaction between time and treatment condition for any subscale of the School Climate Survey. Means for each subscale for 1993 and 1997 are summarized below. While mean differences across time and between groups appear small, the moderately large within-group standard deviations are clearly contributing to the lack of statistical significance. Subsequent analyses will attempt to account for the within group variance.
Year DC Mean SD N Teacher-Student Inter.93 D 4.3954 .4945 130
C 4.4123 .3945 133 97 D 4.4655 .4649 130
C 4.4332 .4207 133
DC Mean SD N Security & Maint. 93 D 4.4240 .5019 130
C 4.3840 .5066 132 97 D 4.3804 .4522 130
C 4.3521 .5199 132
DC Mean SD N Administration 93 D 4.6271 .3873 129
C 4.6124 .4299 132 97 D 4.6526 .3609 129
C .6620 .3512 132
DC Mean SD N Student Academic Orient. 93 D 4.2575 .4935 128
C 4.1622 .5641 131 97 D 4.2159 .5058 128
C 4.2156 .5278 131
Technical Report 4 - Page 5

Student Behavioral Values 93
97
Student-Peer Interact. 93
97
Instructional Management 93
97
Student Activities 93
97
DC Mean SD N D 3.5493 .6966 129 C 3.5205 .7460 131 D 3.7521 .6351 129 C 3.6444 .6781 131
DC Mean SD N D 4.0994 .4701 129 C 4.0132 .4849 133 D 4.2196 .4913 129 C 4.0881 .4845 133
DC Mean SD N D 3.6490 .8954 129 C 3.5738 .8907 133 D 3.6873 .8757 129 C 3.6805 .8058 133
DC Mean SD N D 4.2042 .5487 128 C 4.1727 .5416 132 D 4.2480 .5411 128 C 4.1906 .4942 132
Technical Report 4 - Page 6

School Climate Survey Analysis for Teachers
A multivariate analysis of variance was run across sites (national data) using School Climate Survey factor scores for each subscale as the dependent variables with year (5 levels) and condition (2 levels) as mediating variables. Table 1 below summarizes the means for each subscale by year and condition. The primary hypothesis of interest concerns the interaction of condition and time. A multivariate main effect was not found for condition (significance = .038 based on Pillai’s Trace). The comparison group showed slightly higher means across subscale, but such differences did not meet the criteria for statistical significance set for this study. A significant multivariate main effect was also found for year (significance < .001 based on Pillai’s Trace). The significant effect for time tended to reflect somewhat higher ratings by teachers in 1993 than in subsequent years. However, there were no significant multivariate or univariate interaction effects. As can be seen within Table 1b, while statistically significant, the changes within subscale across time were relatively minor.
It is important to qualify these findings with the reminder that the data for this analysis were cross-sectional in nature. That is, different teachers provided data for each year. Therefore, the significant effect for time and the lack of an interaction effect must be considered in light of the varying sources of information at each time period.
Table 1a: School Climate Survey—Teacher Form: subscale means by condition (DC)
Scale DC Mean Std. Error Teach-Student DEMO 4.37 .014
COMP 4.39 .013 Sec & Maint. DEMO 4.08 .019
COMP 4.12 .018 Admin DEMO 4.09 .021
COMP 4.12 .021 Academic DEMO 3.94 .018
COMP 4.00 .018 Behavioral DEMO 3.03 .023
COMP 3.09 .022 Student-peer DEMO 3.83 .017
COMP 3.87 .016 Instruction DEMO 3.09 .028
COMP 3.20 .027 Student Act. DEMO 3.81 .020
COMP 3.90 .020
Technical Report 4 - Page 7

Table 1b: School Climate Survey—Teacher Form: subscale means by year
Scale Year Mean Std. Error TEACH-STUDENT 93 4.39 .022
94 4.39 .018 95 4.40 .019 96 4.40 .015 97 4.33 .029
SEC. & MAINT. 93 4.13 .030 94 4.04 .024 95 4.09 .026 96 4.12 .021 97 4.11 .040
ADMIN 93 4.16 .034 94 4.05 .028 95 4.05 .029 96 4.13 .023 97 4.12 .046
ACADEMIC 93 4.04 .030 94 3.96 .024 95 3.99 .025 96 3.96 .020 97 3.92 .039
BEHAVIORAL 93 3.09 .037 94 2.99 .030 95 3.03 .032 96 3.06 .025 97 3.10 .049
STUDENT-PEER 93 3.93 .027 94 3.83 .022 95 3.82 .023 96 3.84 .019 97 3.82 .037
INSTRUCTIONAL 93 3.25 .045 94 3.01 .036 95 3.12 .038 96 3.16 .030 97 3.18 .059
STUDENT ACT. 93 3.93 .033 94 3.80 .026 95 3.82 .028 96 3.83 .022 97 3.90 .044
Technical Report 4 - Page 8

Scale DC YEAR Mean Std. Error TEACH-STUDENT DEMO 93 4.41 .031
94 4.38 .026 95 4.37 .027 96 4.41 .021 97 4.27 .043
COMP 93 4.38 .032 94 4.40 .024 95 4.43 .026 96 4.39 .021 97 4.38 .040
SEC. & MAINT. DEMO 93 4.14 .042 94 4.00 .035 95 4.06 .037 96 4.12 .029 97 4.08 .059
COMP 93 4.12 .043 94 4.09 .033 95 4.13 .035 96 4.12 .029 97 4.14 .055
ADMIN DEMO 93 4.15 .048 94 4.01 .040 95 4.01 .042 96 4.17 .033 97 4.09 .067
COMP 93 4.17 .049 94 4.09 .038 95 4.10 .040 96 4.10 .033 97 4.16 .063
ACADEMIC DEMO 93 4.02 .041 94 3.93 .035 95 3.94 .036 96 3.93 .029 97 3.89 .057
COMP 93 4.06 .043 94 3.99 .033 95 4.04 .035 96 3.99 .028 97 3.96 .054
Table 1c: School Climate Survey—Teacher Form: subscale means by condition (DC) by year
Technical Report 4 - Page 9

Scale DC YEAR Mean Std. Error BEHAVIORAL DEMO 93 3.08 .052
94 2.95 .044 95 2.97 .046 96 3.04 .036 97 3.10 .072
COMP 93 3.11 .053 94 3.03 .041 95 3.10 .044 96 3.09 .036 97 3.11 .068
STUDENT-PEER DEMO 93 3.92 .038 94 3.83 .032 95 3.78 .034 96 3.81 .026 97 3.80 .053
COMP 93 3.94 .039 94 3.84 .030 95 3.86 .032 96 3.88 .026 97 3.85 .050
INSTRUCTIONAL DEMO 93 3.18 .062 94 2.96 .052 95 3.12 .055 96 3.09 .043 97 3.07 .087
COMP 93 3.32 .064 94 3.06 .049 95 3.12 .052 96 3.23 .043 97 3.29 .081
STUDENT ACT. DEMO 93 3.90 .046 94 3.74 .039 95 3.75 .040 96 3.79 .032 97 3.86 .064
COMP 93 3.97 .047 94 3.86 .036 95 3.88 .039 96 3.86 .031 97 3.95 .060
Technical Report 4 - Page 10

TECHNICAL REPORT Summary of results from the Assessment Profile and ADAPT
classroom environment observation measures
The Assessment Profile describes classroom practices across five broad dimensions (learning, environment, scheduling, curriculum, interacting, and individualizing). A multivariate analysis of variance (MANOVA) (2 condition by 4 grade levels) was conducted using the five scales as the dependent measures. Significant multivariate effects (< .001) were found for grade and condition main effects. The interaction effect was not significant.
Examination of univariate effects revealed main effects for grade for all scales (p < .001). Main effects for condition were found for the learning environment (p < .001) and scheduling (p = .006) scales. The main effects for condition indicated higher mean scale scores for the demonstration rather than the comparison condition on each scale. The largest, and most significant differences between demonstration and comparison classrooms were found for the Learning Environment scale with a mean difference of approximately 0.9. It should be noted that while statistically significant, effect sizes did not exceed .12. This suggests that such between condition differences may not be practically meaningful.
The nature of the main effects for grade varied as a function of the scale. For example, scaled scores for Learning Environment decreased for every grade (only the loss between second and third grade was not statistically significant). Scaled scores for scheduling showed a statistically significant drop from kindergarten to first grade. Scaled scores then increased for second and third grades. The only non-significant paired comparison was between first and second grade. The Curriculum scale demonstrated a non-significant drop between kindergarten and first grade and a significant increase between first and second and between second and third. The Interacting scale demonstrated significant decreases in scaled scores between kindergarten and first grade and between first and second grade. Statistically significant gains in scaled scores for the Individualizing scale were evident between kindergarten and first and between first and second grades.
Analyses of the ADAPT were also conducted using MANOVA procedures. Significantly lower scores for the Material, Resources, Group, Self-Regulation, Time Spent Learning, and Evidence scales were found in third grade than in first and second grades. Significantly and progressively lower scores for the Space scale were found for all adjacent pairs of grades. The main effect for Condition and the Condition by Grade interaction effect did not attain the level of statistical significance required of this study. The ADAPT was not required by all sites. Therefore, the findings related to the ADAPT should not be generalized across all sites within the national sample.
As can be seen in Table 1 below, all sites yielded significant multivariate (across all five scales) main effects for grade on the Assessment Profile. The direction of the effects was not consistent
Technical Report 4 - Page 11

between sites. Seventeen sites yielded significant multivariate main effects for condition (the direction of the effect was not consistent). A significant grade by condition interaction was found for nine sites. The eta-squared effect sizes for interaction never exceeded .11. This suggests that the interaction of grade and condition does not account for a great deal of the overall variability in Assessment Profile scaled scores. In eleven of the sites, the effect size for Grade accounted for more than 20% of the total variance in scaled scores. Condition accounted for more than 20% of the variance in five of the sites.
Twenty-six sites yielded univariate main effects for grade for the Learning Environment scale of the Assessment Profile. Twelve sites yielded such effects for condition. Only three sites yielded a significant grade by condition interaction for Learning Environment. Eighteen sites yielded univariate main effects for grade on the Scheduling scale. Fourteen sites yielded such effects for condition. Only two sites yielded a significant grade by condition interaction for Scheduling. Nineteen sites yielded univariate main effects for grade on the Curriculum scale. Nine sites yielded such an effect for condition. Six sites yielded significant grade by condition interactions for Curriculum. Twenty-two sites yielded univariate effects for grade on the Individualizing subscale. Five sites yielded such an effect for grade. Five sites yielded grade by condition interaction effects for Individualizing. Thirteen sites yielded main effects for grade on the Interacting scale. Six sites yielded such an effect for condition. Seven sites yielded significant grade by condition interaction effects for the Interacting scale. Findings suggest that the characteristics of classrooms experienced by students in this study changed from kindergarten through third grade across all sites. Differences in classroom characteristics that can be attributed to assignment condition were considerably less evident between sites. Finally, the nature of the changes in classroom characteristics between kindergarten and third grade did not vary greatly depending on the assignment condition of the classroom.
These analyses suggest that classroom climate is a complex and dynamic construct within and across the sites comprising this study. Results indicate that classrooms in the demonstration condition were observed to have somewhat better arrangement and availability of classroom materials and environments as well as somewhat better evidence of scheduling, planning, and variety of classroom activities than were classrooms in the comparison condition. The strong evidence of site-level differences highlight the need to attend to site-specific characteristics when considering the nature and impact of classroom climate.
Technical Report 4 - Page 12

Tab
le 1
. M
AN
OV
A S
umm
ary:
Ass
essm
ent
Pro
file
Sca
led
Scor
es b
y G
rade
by
Con
diti
on
SIT
E
GR
AD
E
CO
ND
ITIO
N
GR
AD
E B
Y C
ON
DIT
ION
Mul
tivar
iate
et
a-sq
uare
d U
niva
riat
e M
ultiv
aria
te
eta-
squa
red
Uni
vari
ate
Mul
tivar
iate
et
a-sq
uare
d U
niva
riat
e
1 .2
75**
* L
E, S
C, C
U, I
T
.14*
**
SC, C
U, I
T
NS
-
2 .1
52**
* L
E, S
C, I
D
.227
***
LE
, SC
, CU
, IT
N
S -
3 .2
27**
* L
E, I
T, I
D
.207
***
LE
, SC
, ID
N
S -
4 .2
14**
* L
E, C
U, I
T
.398
***
LE
, CU
, IT
N
S -
6 .1
12*
LE
, ID
N
S IT
N
S -
7 .1
7***
L
E, S
C, C
U, I
T, I
D
NS
LE
N
S -
8 .2
83**
* L
E, S
C, I
D
NS
-N
S -
9 .1
5***
L
E, S
C, C
U, I
T, I
D
.115
L
E, S
C
.048
* -
10
.165
***
LE
, CU
, ID
.0
93**
* L
E, S
C, I
D
.058
***
LE
, CU
, IT
, ID
11
.111
***
LE
, SC
, IT
, ID
.0
6**
SC
.039
**
SC, C
U, I
T, I
D
12
.225
***
LE
, SC
, CU
, ID
.1
18*
LE
, SC
, CU
N
S IT
13
***
SC, C
U, I
D
NS
-N
S -
14
.177
* L
E, I
D
NS
-N
S -
15
.104
***
LE
, SC
, IT
.1
22**
* L
E, S
C
.09*
**
LE
, SC
16
.114
***
LE
, SC
, CU
, IT
.1
15**
* L
E, C
U, I
D
NS
-
17
.142
***
SC, C
U, I
T, I
D
NS
-N
S -
18
.152
***
LE
, CU
, ID
C
U
NS
-
Tec
hnic
al R
epor
t 4 -
Pag
e 13

SIT
E
GR
AD
E
CO
ND
ITIO
N
GR
AD
E B
Y C
ON
DIT
ION
Mul
tivar
iate
et
a-sq
uare
d U
niva
riat
e M
ultiv
aria
te
eta-
squa
red
Uni
vari
ate
Mul
tivar
iate
et
a-sq
uare
d U
niva
riat
e
19
.142
***
LE
, CU
N
S -
NS
-
21
.279
***
LE
, SC
N
S -
NS
-
22
.206
***
LE
, CU
, IT
, ID
N
S -
NS
-
23
.148
***
LE
, SC
, IT
.0
68**
IT
, ID
N
S -
24
.204
***
LE
, CU
, ID
.1
22*
LE
, SC
, CU
N
S -
25
.112
***
LE
, IT
, ID
N
S SC
.0
32*
LE
, CU
, ID
26
.195
***
SC, C
U
.301
***
LE
, SC
, CU
, IT
.1
03*
CU
, IT
, ID
27
.153
***
LE
, CU
, ID
N
S ID
N
S -
28
.355
***
SC, C
U, I
D
.336
**
SC
NS
-
29
.085
***
LE
, SC
, CU
, ID
.0
32**
ID
N
S C
U, I
T
30
.134
***
LE
, SC
, IT
, ID
.0
45*
LE
, SC
.0
32*
IT
31
.213
***
LE
, SC
, CU
, ID
.0
92**
L
E, S
C, C
U
.068
***
CU
, IT
, ID
32
.203
***
LE
, CU
, IT
, ID
N
S -
.053
**
ID
* p
< .0
5 L
E =
Lea
rnin
g E
nvir
onm
ent
** p
< .0
1 SC
= S
ched
ulin
g **
* p
< .0
01
CU
= C
urri
culu
m
IT =
Int
erac
ting
ID =
Ind
ivid
ualiz
ing
Tec
hnic
al R
epor
t 4 -
Pag
e 14

Technical Report #5
B-Spline Modeling Techniques
Prepared by Charles Katholi, Ph.D.

As illustrated in Chapter 12, figure 12.2 shows the growth patterns of the four Woodcock-Johnson Sub scales utilized in the study for an age range which includes the ages of the study participants. While each of these is monotone increasing and could possibly be reasonably approximated over the range of interest by a low order polynomial model, the degree of the polynomial would necessarily not be the same in all cases. Thus, for example, the curve for the Letter-Word Identification sub scale would require a cubic polynomial because of the apparent inflection points at about 6 and 9 years of age. The curve associated with the Applied Problems could be well approximated by a quadratic curve. The other two sub scales are such that no reference scores are available prior to age 4. Both scales are flat until ages 5.5 and 5.0 respectively and then increase rapidly. Since some of the children in the study are in this age group, a polynomial model based on a single functional form will not adequately describe this data.
Spline models are made up of polynomial pieces joined together at selected points which are
called break points. The pieces are joined together in such a way as to guarantee continuity of the model across the break points. Such models are well suited for modeling the behavior noted above for the two sub scales. The polynomial pieces can be of any order but for purposes of this analysis we have chosen second order polynomials (degree 1) so that the model consists of a sequence of straight line segments. Such models are easily represented mathematically as a linear combination of special spline functions called B-Splines. Thus in its simplest form the
model to be used has the form,
where the are parameters to be estimated , the are the B-Splines which depend both
on t and a set of break points denoted in the equation by the vector parameter and is a random error. It is well known that the exact placement of the break points is not critical and so we have chosen to use values corresponding to the approximate median ages at each grade where testing was carried out. Thus we have taken interior break points at ages 6,7,8 and 9. In addition to these break points, the spline models require the selection of two additional points, one at each end of the range of values of the independent variable. Again the placement of these values is not critical; they need only be well outside of the range of the data. Finally, in specifying the model, it is necessary to specify two end conditions. For the data in this analysis, the left hand break point is taken at 2 and the value of the spline is specified there to be equal to the reference W score for that age. At the right end of the curve several options are available. One is to again set the value of the spline to be equal to the reference W score at this right break point. The alternative and the one we used in our analysis is to require that the slope of the curve be constant across the break point at age 9 . Experiments with the two methods showed no difference in the results of the analysis. In addition, the lack of sensitivity of the analysis to the position of the interior break points was confirmed by simulation.
For the model we have used, the B-Splines are the "hat" functions defined as follows: Let the
break point set be where Then,
Technical Report 5 - Page 2

These functions have the desirable property that,
so that the coefficients are easily interpreted; that is, For our purposes this means that the coefficients will represent the population marginal mean score at each break point. The parameters themselves are actually linear combinations of effect coding variables and so we can fit models to test for differences in sites, the treatment condition, gender and so forth. Because the subjects in the study are of many different ages at each examination point and because the curves indicate that age is a factor in the expected performance of the subject, the spline model adds the
information for each subject into the estimation process through the functions and so each subject's observations effect the population means in an appropriate way (see figures on following two pages).
Technical Report 5 - Page 3

Technical Report 5 - Page 4

Technical Report 5 - Page 5

Finally, the data for analysis are longitudinal and so we cannot assume that the observations within a subject over time are statistically independent. As a result we must assume a model for the error structure in the data which reflects this possible dependence. The sequence of observations on each subject is in the nature of a time series and so a reasonable model for the serial dependence within a subject is the model,
where -1 < <1 , u~Normal(0, ) and the are time points where data is available. This model for the error structure allows for the fact that the time points for each subject are not equally spaced throughout the duration of the study. Finally, it is assumed that the observations are independent
between subjects. The parameters are two nonlinear parameters which must be estimated as part of the estimation process. Estimates of the parameters in the models were calculated and all hypothesis tests were performed using the SAS PROC MIXED procedure.
Technical Report 5 - Page 6

Technical Report #6
Missing Data within the National Transition Demonstration Study

A CONSIDERATION OF MISSING DATA
“... estimation techniques ... assume missing at random data, tests of the assumption would seem necessary. However, an exact test would require the missing values to determine if indeed there was an association between the values of a variable and whether or not it was missing. If this information were available, then, the data would not be missing.”
Rovine, M.J. and Delaney, M., 1990
Introduction
Even in the best designed and most closely monitored study, inadvertent omissions
occur. Individual data points are missing -- children may be absent on the date of testing, a
respondent inadvertently skips a question, an examination booklet may be ruined, or the
subject may be unwilling to respond to a particular item or series of items. What this failure
to follow a subject at all time points means to a repeated measures analysis is that missing
values may arise at any of the cross-sectional time points of measurement. In other words,
missing values arise whenever one or more of the sequences of measurements from study
units are incomplete in the sense that intended measurements are unavailable. The loss of
these intended measures results in an incomplete or unbalanced data matrix with unequal
numbers of measures for each subject. An unbalanced data matrix raises any number of
technical difficulties based on the criteria underlying a particular analysis. Both parameter
estimation and tests of linear hypotheses become more difficult because bias may be
introduced. In addition to the statistical definition of bias, other technical and conceptual
issues must be considered. From a data analysis perspective, any or all of a series of
questions should be asked, such as: what are the patterns of missing data; is this condition
of missingness random or nonrandom; or why are the data missing. We will begin to answer
these questions following some background material.
Background
Until recently, available analytical methods focused on the removal of missing values.
This removal was accomplished in one of two ways. The standard method used by most
statistical packages is complete-case analysis. In this process only those cases where the data
matrix is complete are analyzed, while the remaining cases with missing data values are
discarded (This method is also called listwise deletion). As noted above, bias may be
introduced as a result of those subjects having complete cases not being representative of the
Technical Report 6 - Page 2

sample. More on this will be said later. The alternative procedure is to substitute reasonable
values for the missing items. The classic substitution is that of the mean. This method is
frequently used to complete missing scale items when the items are assumed to be drawn
from a single construct domain. In addition to the mean, regression predictions are often
used. Both these methods have the advantage of easy implementation; however, they have
well known disadvantages (Little& Rubin, 1987). In the case of multivariate analyses using
a large number of variables, complete case analysis’ rejecting incomplete cases could
result in losing an extraordinarily high number of cases. Consider the following examples
where we construct several scenarios. Suppose you have measured 10 variables on 100
subjects, and wish to perform an analysis requiring all 10 variables. If 5 percent of the
sample are missing data for a single variable, we still have 95 percent of the cases with
complete data. On the other hand, if 5 percent of the sample have missing data on each of
the 10 variables, and the pattern of missing data is such that no one subject is missing data
on more than a single variable, then this lack of overlap in missing values causes half the
cases to become candidates for deletion. This appears to be an extreme, with the number of
variables equal to one-tenth the number of subjects; but is it so extreme? What happens
where we are missing only 2 percent of the data, yet we have 20 variables measured on 5,000
subjects? Applying the same condition of mutual exclusivity of missing data in which no
subject is missing data on more than one variable, this minimization of overlap causes the
loss of over 2,000 subjects, or 40 percent of the cases. The following table summarizes these
two extreme facets of the missing data problem. Please note that had the rightmost column
of Table 1. been allowed to reach 5 percent, the entire data sample would have been lost.
Table 1. Impact of Various Rates and Patterns of Missing Data on Sample Size
Initial Sample Size (N)
data missing across a single variable at the indicated rates
1% 2% 5%
data missing independently across 20 variables
1% 2% 3%
1000 990 980 950 800 600 400
3000 2970 2940 2910 2400 1800 1200
5000 4950 4900 4750 4000 3000 2000
7000 6930 6860 6650 5600 4200 2800
9000 8910 8820 8550 7200 5400 3600
Technical Report 6 - Page 3

With these worst case inefficiencies of complete case analysis firmly in mind, let’s look
toward determining the patterns of missing data. First, we will examine formal definitions
of missing data, and their associated mechanisms, and then look at illustrative examples
from the Transition data.
Formal Definitions of Randomly Missing Data
A formal mathematical statement of random missingness has been elegantly made
(Rubin, 1976; Little & Rubin, 1987; Little 1988). The following notation and definitions are
taken from Little(1988). Let y denote a (n x p) data matrix of n observations on p variables,
and r denote an (n x p) missingness indicator matrix such that rij = 1 if yij is missing, and
0 otherwise. The data and missing data mechanism may be explained mathematically. A
complete model for the data and the missing-data-mechanism specifies a distribution f( y |
? ) for y, indexed by unknown parameters ?, and a distribution of f ( r | y, ? ) for r, given y,
indexed by the unknown parameters ? . Write y = ( yobs, ymis) where yobs represents the
observed values of y and ymis represents the missing values. Rubin (1976) defined the
missing data as Missing Completely at Random (MCAR) if f ( r | yobs, ymis, ? ) = f ( r | ? )
for all yobs and ymis; that is, missingness does not depend on the observed or missing values
of y. Rubin also defined a weaker condition for the missing-data-mechanism, calling the
missing data missing at random (MAR) if f ( r | yobs, ymis, ? ) = f ( r | yobs, ? ) for all ymis;
that is missingness does not depend on observed values in the data set.
Patterns of Missing Data
Regression is one of the most powerful tools available to the applied researcher. Given
the prominence of this statistical tool, at least four explicit patterns of missing data have been
identified (Little,1992). Suppose a random sample of N individuals is selected. For each of
these individuals p+1 observations are desired: X1 , X2 , ... , Xp , Y. However, for some of
the individuals, one or more, but not all of the X’s are missing. The following is assumed:
E(Y|X1,X2,...,Xp)=B0+B1X1+B2 X2 +... + BpXp and estimates of Bj and E(Y| X1 , X2 , ... , Xp)
are desired.
It is legitimate to ask is there a pattern to the missing data? Consistent with the
discussion of the lefthand side of Table 1 above, the following pattern of univariate missing
data (see Fig. 1) is offered. In this case, the missing data are confined to a single variable X1
Technical Report 6 - Page 4

. This is a special instance of monotone or
nested data, where the columns can be
arranged so that Xj+1 is observed for every
case where Xj is observed, for all j = 1 , ...,
p.
Figure 3 displays a pattern where two
(possibly more) of the variables are never
observed together. This condition arises
when two different files are merged. A specific Transition example would be where the
Teacher’s Rating of Academic Competence from the Teacher Questionnaire, Part B is
merged into a single file with a child’s
scores for the Woodcock-Johnson’s
Broad Reading and Broad Mathematics.
Finally, Figure 4 is presented. What
you see is a generic pattern with no
apparent structure underlying the
arrangement of the observed and missing
data.
Integral to these notes on missing data patterns is whether missingness is related to the
data values. For example, given the univariate
missing data in Figure 1, the probability that X1
might be missing for a particular case may (a) be
independent of data values, (b) depend on the
value of .X1 for that case, or (c) depend on the
value of X2 , ... , Xp for that case. This list of
possibilities is by no means exhaustive; it is
meant to be illustrative. If the variable were a
test score, the child might have been absent. In
that case, (a) might apply. If the variable
happened to be education level, and persons who dropped out of school are less likely to
respond, then (b) might apply.
At this point, we restate the mathematical definitions in light of the above discussion of
patterns of missing data. Data are missing at random (MAR) when the distribution of
Technical Report 6 - Page 5

missing data indicators depends on the data only through the observed values. Data are
missing completely at random (MCAR) if the distribution of missing data indicators does not
depend on either the observed or missing data. Thus, mechanism (a) is MCAR, while
mechanisms (a) and (c) are MAR. Finally, mechanism (b) is not-MAR since the variable’s
missingness is a result of its value. With a solid grasp of the missing-data mechanism,
attention will now be focused on a review of methods available.
Currently, there are at least four broad categories of methods for handling missing data
(Timm & Mieczkowski, 1997). Three of these are based, in part, on either implicit or
explicit models for the data and missing-data mechanism (Little, 1992). The four broad
classes of method may be summarized as follows:
1. refined least squares methods
2. multiple imputation (MI) techniques
3. methods using maximum likelihood (ML) or restricted maximum likelihood (REML)
4. Bayesian methods
A common theme to the latter three methods is that they are model-based. The approach
taken in the remainder of this report will be one of application to research; a review of the
mathematical theory of these methods would be beyond the scope of this technical report.
With recent advances in software packages and the power of desktop computing, the
applied researcher now has new tools to aid in the analysis of unbalanced longitudinal data.
These tools have only become available since the beginning of the Transition Project. Two
such advanced tools are PROC MIXED (SAS, 1992) and SPSS Missing Value Analysis
(Hill, 1997). They reflect a subtle shift of emphasis in statistical viewpoint. This shift might
be verbalized as: “It used to be missing data was something undesirable to be removed
(listwise or pairwise deletion); now, missing data are actually information that may be
averaged across(expectation maximization).” The SPSS Missing Value Analysis Module
contains multiple ways to deal with missing data. This software module allows the
researcher to perform three distinct tasks. First, it allows the researcher to describe the
patterns of missing data. (The word pattern as used here indicates the dichotomized version
of a random variate -- that is, a binary distribution where each value is missing or present).
Second, estimations of means, standard deviations, covariances, and correlations are
computed within the chosen method of analysis. The estimations of this second step may
be computed using one or more methods: all values, listwise deletion, pairwise deletion,
linear regression, or expectation maximization (EM). Third, imputation of missing values
may be accomplished using either the EM algorithm, or the least squares method. Finally,
Technical Report 6 - Page 6

by following a specific process of least squares regression, the researcher may also emulate
multiple imputation (Hill, 1997). Only recently have new computational algorithms and
software become available to implement multiple imputation in complex multivariate
settings (Schafer & Olsen, 1999).
Description of the Data Set
Two cohorts of former Head Start children and families were recruited at 31 sites to
participate in the study. Cohort I includes 3,540 children and their families, enrolled shortly
before or after entry into kindergarten in the Fall of 1992; Cohort II includes 3,975 children
and their families whose children entered kindergarten in the Fall of 1993.
As noted, the data sets for this study are derived from source documents providing data
on either children or families, or both children and families. Toward this end, there are four
documents used as data sources. These documents are the Family Interview, the Child
Instrument, the School Archival Records Search (SARS), and the Teacher Questionnaire,
Part B. Data from these four sources were merged on a key variable representing the child’s
identification. A single record’s source could be as few as one of these files, or as many as
all four, or any combination of the four sources. This provides a total of 14 component parts
to the analytical construct of a family unit. The family unit may be visualized as a
tetrahedron, i.e., a four-sided closed figure whose faces are equilateral triangles. Further, the
volume of the figure would be the tetrahedron itself. The component parts of the tetrahedron
and their mapping to the pieces of the family unit are shown in Table 2.
Search for Patterns and At-Random Missingness
As a principle, missing values of key variables are reviewed prior to any and all analyses
of data from the National Transition Demonstration Study. These analysis-specific reviews
concentrate on those variables chosen for inclusion in the specific analysis, including both
dependent and independent variables. A more general review of missing data was
undertaken to (1) identify the quantity of missing values on a set of key variables and (2) the
patterns of missing values on those variables. The key variables reviewed included: (1)
child gender (male, female); (2) child has a health condition that interferes with school
Technical Report 6 - Page 7

Table 2. Component Parts of the Former Head Start Family Units
Attribute of Tetrahedron
Source of Data Record Years in School
1 2 3 4 1 and 3 or 4
4 surfaces Child Instrument (ci) 7325 6065 5788 5740 6193
Family Interview (fi) 7078 5493 5284 5196 5903
SARS 6535 5675 5383 5390 5900
Teacher, Part B. (tb) 6501 5331 4821 4572 5445
6 edges child-family 6894 5289 5037 4907 4276
child-SARS 6435 5460 5153 5145 4606
child-teacher b 6412 5188 4714 4484 3854
family-SARS 6253 4945 4616 4583 3901
family-teacher b. 6208 4688 4229 4015 3308
SARS-teacher b. 6054 5037 4620 4438 3800
4 vertices ci-fi-SARS 6154 4859 4539 4452 5200
ci-fi-tb 6124 4609 4177 3962 4886
ci-SARS-tb 5991 4947 4560 4385 5206
fi-SARS-tb 5798 4492 4091 3929 4807
Volume Total Family Units 7515 at Baseline
attendance (yes, no); (3) child’s receptive language ability, as measured by the Peabody
Picture Vocabulary Test (Rasch-Wright score; continuous); (4) child’s social skills, as rated
by the primary caregiver using the Social Skills Rating System (standard score; continuous);
(5) caregiver ethnicity (white/non-Hispanic, African American, Hispanic/Latio, Asian/Pacific
Islander, other); (6) caregiver is high school graduate (yes, no); (7) caregiver is foreign-born
Technical Report 6 - Page 8

(not born in US; yes, no); (8) caregiver reports having a chronic health condition that
interferes with ability to care for the child (yes, no); (9) caregiver employed full-time (yes,
no); (10) father or father figure (male stepparent or grandfather) is present in home (yes, no);
(11) mother is present in home (yes, no); (12) family mobility (0, 1-2, or 2 or more moves
within past year); (13) family receives AFDC (yes, no); (14) family receives SSI (yes, no);
and (15) family speaks a language other than English in the home (yes, no). These variables
were chosen because they were either (1) critical outcome variables for primary analyses or
(2) thought to represent important characteristics of the child, caregiver, or family that could
influence program participation or benefit. They are the same variables utilized in
assessments of differential attrition patterns and to review the comparability of treatment
groups and cohorts at baseline.
Descriptive analyses were completed in two phases. In the first phase, the sources (site,
cohort, treatment condition) of missing interview forms were identified to determine whether
differential patterns of missing forms were evident. In the second phase, individual variables
were reviewed to determine the quantity of missing data in kindergarten and in third grade.
For those variables with more than one percent of the data missing at a given time point,
additional review identified the patterns of missing values across treatment groups, across
sites, and across cohorts. No statistical comparisons were completed.
Results
As can be seen in Table 3, a total of 437 families (5.8%) who were enrolled in the study
as the children entered kindergarten did not complete a family interview in either the fall or
the spring of the kindergarten year. Of these 437 families, 44 percent were enrolled in the
demonstration (treatment) group and 56 percent in the comparison (control) group. Slightly
more than half (53%) of the families were enrolled in Cohort 1. Each of the 30 sites had at
least one family with a missing family interview, but the bulk of the missing family
interviews (40%) were concentrated in four sites, each of which accounted for approximately
10 percent of the missing interviews. Of these four sites, one was Florida, where Hurricane
Andrew seriously disrupted both program and evaluation activities for a period of more than
one year. The other three sites were Nevada, New York, and Virginia. Five additional sites
-- Alabama, Massachusetts, Maryland, Ohio, and Oregon -- account for another 35 percent
of the missing family interviews. Thus, while every site had some families who did not
receive an interview in the kindergarten year, the majority of the missing interviews (75%)
can be attributed to only nine sites.
Technical Report 6 - Page 9

Table 3. Treatment group, cohort, and site affiliation of families missing interviews by type of interview.
n = 7,515 Missing Family Interview
Missing Child Assessment
Missing School Archival Records
Search
Total Missing 437 5.8%
190 2.5%
980 13.1%
Cohort affiliation
Cohort 1 231 52.9%
99 52.1%
495 50.5%
Cohort 2 206 47.1%
91 47.9%
485 49.5%
Treatment Group assignment
Demonstration 194 44.4%
87 45.8%
491 50.1%
Comparison 243 55.6%
103 54.2%
489 49.9%
A total of 190 families (2.5%) did not successfully complete a child assessment in either
fall or spring of kindergarten. Of these families, slightly more than half (54%) were enrolled
in the comparison group, and approximately half (52%) were enrolled in the first cohort.
Nearly 75 percent of the families were located in only five sites -- Alaska (14.2%),
Massachusetts (19.0%), Nevada (13.7%), New Jersey (7.4%), and Virginia (17.9%). In the
majority of those five sites, missing interviews were equally distributed across both treatment
conditions. In two sites (Alaska and Virginia), missing interviews were primarily
comparison children. (Note: Virginia did not administer the academic standard instruments,
but did administer the interview for children. Thus, child assessment forms exist for Virginia
but include a larger percentage of missing data than other sites.) Additionally, in Alaska and
Nevada, missing interviews were predominantly Cohort 1 children, while in Massachusetts
and Virginia missing interviews were primarily Cohort 2 children.
A total of 980 (13.1%) of families did not have a School Archival Records Search form
in kindergarten. These families were equally distributed across treatment condition (50.1%
demonstration, 49.9% comparison) and across cohorts (50.5% Cohort 1, 49.5% Cohort 2).
Approximately half (49.6%) of the missing forms were located in four sites: Massachusetts
(8.4%), New York (17.2%), Texas (18.1%), and Ohio (5.9%). The remainder were
distributed across the remaining 26 sites.
Technical Report 6 - Page 10

Table 4 summarizes the quantity of missing data found for specific variables after taking
into account (deleting from the denominator) the number of observations without a valid
interview or assessment form. As can be seen, nine of the 16 key variables have missing
values for less than one percent of the study participants with valid interview forms.
Further investigation of the seven variables with more than one percent missing values
indicated substantial differences in proportions of missing values between demonstration and
comparison groups for only one variable – i.e., child has current IEP. No apparent
explanation exists for this difference. It is noted that the majority (139 of 238, 58%) of the
missing values for this variable are found in the New York site. Another 14 percent (33) of
the missing values are associated with the Arkansas site, and eight percent (18 values) were
located in the Michigan data. The remaining missing values show no clear pattern of
association with any one site. In both Arkansas and Michigan, the missing values were all
in the comparison group, although there is no obvious explanation for this occurrence.
The majority of the missing values for the Peabody Picture Vocabulary Test (PPVT)
scores are attributable to the Virginia site, in which neither the PPVT or the Woodcock-
Johnson Tests of Achievement were administered in any data collection period. This
circumstance accounts for 344 (96%) of the 358 missing values. Excluding the records from
Virginia, there are only 14 children with missing values for the PPVT score (0.2% of the total
number with existing kindergarten child assessments).
The greatest proportion of missing values was found on the school impairment variable
(child has a health condition that interferes with school attendance). Thirty percent of the
571 missing values were found in three sites (Nevada, New York, and Ohio). Another 13
percent were found in two additional sites (Indiana and Maryland). No specific
circumstances were identified that might explain the omission of these data in any of those
sites. The remaining missing values were distributed across the remaining 24 sites, with no
discernible patterns of loading.
The missing values associated with the social skills rating by the caregiver were also
distributed across a total of 29 sites (only Tennessee had no missing values). Approximately
30 percent of the missing values were found in three sites (Nevada, New York, and Ohio).
Another 22 percent of the missing values were located in four additional sites -- Arizona,
Indiana, Maryland, and Massachusetts -- but no specific explanation of the clustering of
missing values in these seven sites is apparent.
Caregiver ethnicity was missing on nearly three percent of the family interviews.
Missing values were distributed across 27 of the 30 sites. Six sites -- Indiana, New York,
Ohio, Oregon, Wisconsin & Maryland -- accounted for nearly half (49.0%) of the missing
values, and three sites (Illinois, Michigan, and Texas) contributed another 12 percent of the
Technical Report 6 - Page 11
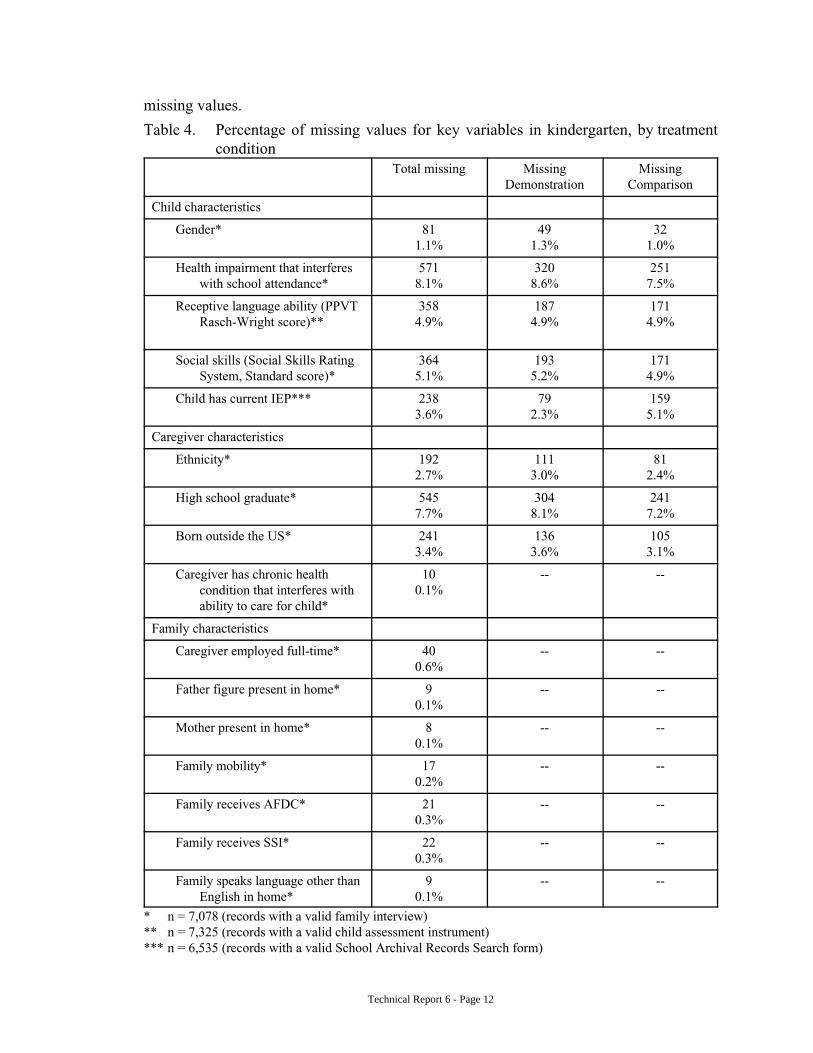
missing values.
Table 4. Percentage of missing values for key variables in kindergarten, by treatment condition
Total missing Missing Demonstration
Missing Comparison
Child characteristics
Gender* 81 1.1%
49 1.3%
32 1.0%
Health impairment that interferes with school attendance*
571 8.1%
320 8.6%
251 7.5%
Receptive language ability (PPVT Rasch-Wright score)**
358 4.9%
187 4.9%
171 4.9%
Social skills (Social Skills Rating System, Standard score)*
364 5.1%
193 5.2%
171 4.9%
Child has current IEP*** 238 3.6%
79 2.3%
159 5.1%
Caregiver characteristics
Ethnicity* 192 2.7%
111 3.0%
81 2.4%
High school graduate* 545 7.7%
304 8.1%
241 7.2%
Born outside the US* 241 3.4%
136 3.6%
105 3.1%
Caregiver has chronic health condition that interferes with ability to care for child*
10 0.1%
-- --
Family characteristics
Caregiver employed full-time* 40 0.6%
-- --
Father figure present in home* 9 0.1%
-- --
Mother present in home* 8 0.1%
-- --
Family mobility* 17 0.2%
-- --
Family receives AFDC* 21 0.3%
-- --
Family receives SSI* 22 0.3%
-- --
Family speaks language other than English in home*
9 0.1%
-- --
* n = 7,078 (records with a valid family interview) ** n = 7,325 (records with a valid child assessment instrument) *** n = 6,535 (records with a valid School Archival Records Search form)
Technical Report 6 - Page 12

Educational level was missing for eight percent (545) of the families. Of those families,
82 percent were interviewed only in the spring, when the educational variable was not
included in the interview. Slightly more than 65 percent of the fall interviews with missing
values were clustered in a single site -- Minnesota -- where there was a large minority
(Hmong) population. Each of those records with missing values for education were
associated with informants who were born outside the U.S. This suggests that these
caregiver informants may have been educated outside of the United States and unable to
answer the question (even though an appropriate response option was available for this
circumstance).
Concerning the immigrant status of the primary caregiver, more than three percent of the
data were missing. Approximately 50 percent of these missing values were clustered in five
sites: Arizona (10.0%), Indiana (15.4%), New York (10.4%), Ohio (6.2%), and Wisconsin
(7.9%). No other patterns of distribution were noted -- i.e., missing values on U.S. births
were not associated with particular ethnic groups or any other characteristic of the family or
caregiver.
Second and third grade data were combined into a single endpoint data set and missing
values of the identified key variables were reviewed in a similar manner. The results of this
review are summarized in Table 5 below.
The results of these variable reviews indicate that, after taking into account (deleting
from the denominator) the number of observations without a valid interview or assessment
form, eight of the 15 variables have missing values for less than one percent of the study
participants with valid interview forms.
Further investigation of the seven variables with more than one percent missing
values indicated that none of the variables had important differences between demonstration
and comparison groups, in terms of the percentages of missing values. The largest
percentages of missing values were noted for the caregiver ethnicity and foreign birth
(approximately 85% of the existing forms had missing values). The largest percentage (90%)
of these missing values are attributable to a defined skip pattern for persons who had been
interviewed previously. Thus, the data are available from previous rounds but are not
available on this single interview form. The remaining 10 percent of the missing values are
also thought to be related to the defined skip pattern, since the “interviewed previously”
variable is missing for those records but all of the variables in the skip pattern also show
missing values. Thus, it is hypothesized that in those 485 records, the interviewer failed to
complete the “previously interviewed” variable but skipped the relevant items because the
Table 5. Percentage of missing values for key variables at endpoint (second/third grade)
Technical Report 6 - Page 13

by treatment condition
Total missing Missing Demonstration
Missing Comparison
Child characteristics
Gender 8 0.1%
5 0.2%
3 0.1%
Health impairment that interferes with school attendance
Receptive language ability (PPVT Rasch-Wright score)*
310 5.0%
153 4.8%
157 5.3%
Social skills (Social Skills Rating System, Standard score)
152 2.6%
88 2.8%
64 2.3%
Child has current IEP** 32 0.5%
19 0.6%
13 0.5%
Caregiver characteristics
Ethnicity 4965 84.1%
Born outside the US 4983 84.4%
Caregiver has chronic health condition that interferes with ability to care for child
4 0.1%
2 0.1%
2 0.1%
Family characteristics
Caregiver employed full-time 41 0.7%
10 0.6%
22 0.8%
Father figure present in home 64 1,1%
38 1.2%
26 0.9%
Mother present in home 63 1.1%
37 1.2%
26 0.9%
Family mobility 17 0.3%
8 0.3%
9 0.3%
Family receives AFDC 3 0.05%
2 0.06%
1 0.04%
Family receives SSI 3 0.05%
2 0.06%
1 0.04%
Family speaks language other than English in home
17 0.3%
7 0.2%
10 0.4%
* n = 5,903 (records with a valid family interview instrument) ** n = 6,193 (records with a valid child assessment instrument) *** n = 5,900 (records with a valid School Archival Records Search form)
respondent had been previously interviewed. Aproximately 60 percent of these “errors” were
Technical Report 6 - Page 14

located in seven sites (Alabama, Illinois, Massachusetts, Maryland, New York, Rhode Island,
and Texas).
The next most commonly missing variable was the receptive language score, with five
percent of the values missing overall. Of the 310 missing values, 270 (87%) were
attributable to the Virginia site, where the Peabody Picture Vocabulary Test was not
administered at all (in any round of data collection). With that site deleted from the dataset,
there were only 40 missing values for the PPVT score (0.7% of the total), and the missing
values were equally distributed across demonstration and comparison conditions (15
demonstration, 0.5%; 25 comparison, 0.9%).
The social skills rating by the caregiver was missing for slightly more than two percent
of the respondents in third grade. The missing values were equally distributed across
demonstration and comparison groups. Some 60 percent of the missing values were located
in four sites -- Rhode Island (23.0%), New York (15.8%), Idaho (13.8%), and Arkansas
(7.9%). Another 4.6 percent of the missing values were associated with the Arizona site.
The remaining 35 percent of the missing values were distributed across the remaining 25
sites.
The variables indicating the presence of the mother and/or a father figure in the home
showed virtually identical patterns of missing values. A total of only slightly over one
percent of the data were missing (1.1% overall), and these missing values were located in a
total of 10 sites. Five sites -- Arizona, Florida, Idaho, South Dakota, and Oregon -
accounted for slightly more than 75% of the missing values, but no differential pattern across
treatment conditions was noted overall or for any one site. There is no apparent explanation
for the clustering of missing values in these sites.
Discussion
The results of these investigations reveal two important points: first, the quantity of
missing data within the National Transition Demonstration Study is well within the
parameters of what might be expected within a complex, multi-site, longitudinal study; and
second, data are clearly not missing at random. Thus, analyses must proceed carefully and
imputation techniques chosen with consideration of the patterns of missing data. For the
statistical analyses reported in this overall report of study findings, no imputed data have
been included. Future analyses will include data imputed using EM algorithm methods and
results compared.
Technical Report 6 - Page 15