HE LANDSCAPE OF RECESSION - Brookings · metro areas had more than twice the number of unemployed...
12
THE LANDSCAPE OF RECESSION: UNEMPLOYMENT AND SAFETY NET SERVICES ACROSS URBAN AND SUBURBAN AMERICA Elizabeth Kneebone and Emily Garr July 2009 In the 20 months since the current recession began it has taken a toll on people and places across the country, whether measured by job losses, unemployment, or increased demand for emergency and safety net services. However, as documented in the first edition of the Brookings Metro Program’s MetroMonitor, the magnitude of these impacts has varied significantly across the nation’s major metropolitan areas. 1 Understanding how different metropolitan areas have been affected by the recession is a critical step toward shaping appropriate regional public- and private-sector responses to promote recovery. Of course, metropolitan areas are collections of communities that may also be experiencing the downturn to varying degrees, especially now that more than half of America’s metropolitan poor live in suburbia. 2 Intra-metropolitan patterns of unemployment and need should thus additionally inform efforts to put metropolitan workers and firms on the road to recovery. To begin documenting the extent to which the recession has affected urban and suburban communities across the country, this analysis looks within the nation’s 100 largest metro areas to examine recent unemployment trends in their cities and suburbs. We then analyze the changing demand for safety net services across urban and suburban counties by tracking: (1) change in Unemployment Insurance claims and (2) change in enrollment in the Supplemental Nutrition Assistance Program. These statistics provide leading indicators of how poverty and need are shifting within the metropolitan landscape. Unemployment 3 In contrast to the last recession, unemployment has increased at nearly equal rates in cities and suburbs during this downturn. City workers were only 0.9 percentage points more likely to be unemployed than suburban workers in May 2009. Unemployment has increased markedly in metropolitan areas over the past year. The total number of unemployed individuals in the 100 largest metro areas increased from 5.3 million in BROOKINGS | July 2009 1
Transcript of HE LANDSCAPE OF RECESSION - Brookings · metro areas had more than twice the number of unemployed...
THE LANDSCAPE OF RECESSION: UNEMPLOYMENT AND SAFETY NET SERVICES ACROSS URBAN AND SUBURBAN
AMERICA Elizabeth Kneebone and Emily Garr July 2009 In the 20 months since the current recession began it has taken a toll on people and places across the country, whether measured by job losses, unemployment, or increased demand for emergency and safety net services. However, as documented in the first edition of the Brookings Metro Program’s MetroMonitor, the magnitude of these impacts has varied significantly across the nation’s major metropolitan areas.1 Understanding how different metropolitan areas have been affected by the recession is a critical step toward shaping appropriate regional public- and private-sector responses to promote recovery. Of course, metropolitan areas are collections of communities that may also be experiencing the downturn to varying degrees, especially now that more than half of America’s metropolitan poor live in suburbia.2 Intra-metropolitan patterns of unemployment and need should thus additionally inform efforts to put metropolitan workers and firms on the road to recovery. To begin documenting the extent to which the recession has affected urban and suburban communities across the country, this analysis looks within the nation’s 100 largest metro areas to examine recent unemployment trends in their cities and suburbs. We then analyze the changing demand for safety net services across urban and suburban counties by tracking: (1) change in Unemployment Insurance claims and (2) change in enrollment in the Supplemental Nutrition Assistance Program. These statistics provide leading indicators of how poverty and need are shifting within the metropolitan landscape. Unemployment 3 In contrast to the last recession, unemployment has increased at nearly equal rates in cities and suburbs during this downturn. City workers were only 0.9 percentage points more likely to be unemployed than suburban workers in May 2009. Unemployment has increased markedly in metropolitan areas over the past year. The total number of unemployed individuals in the 100 largest metro areas increased from 5.3 million in
BROOKINGS | July 2009
1
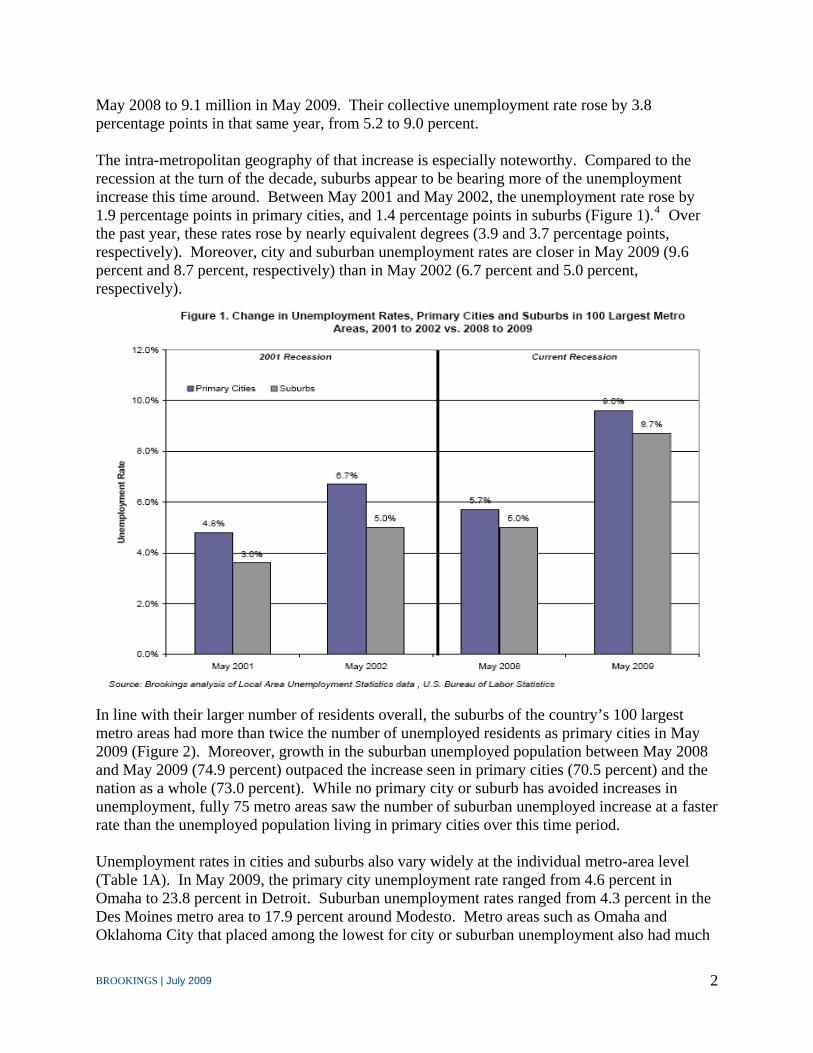
May 2008 to 9.1 million in May 2009. Their collective unemployment rate rose by 3.8 percentage points in that same year, from 5.2 to 9.0 percent. The intra-metropolitan geography of that increase is especially noteworthy. Compared to the recession at the turn of the decade, suburbs appear to be bearing more of the unemployment increase this time around. Between May 2001 and May 2002, the unemployment rate rose by 1.9 percentage points in primary cities, and 1.4 percentage points in suburbs (Figure 1).4 Over the past year, these rates rose by nearly equivalent degrees (3.9 and 3.7 percentage points, respectively). Moreover, city and suburban unemployment rates are closer in May 2009 (9.6 percent and 8.7 percent, respectively) than in May 2002 (6.7 percent and 5.0 percent, respectively).
In line with their larger number of residents overall, the suburbs of the country’s 100 largest metro areas had more than twice the number of unemployed residents as primary cities in May 2009 (Figure 2). Moreover, growth in the suburban unemployed population between May 2008 and May 2009 (74.9 percent) outpaced the increase seen in primary cities (70.5 percent) and the nation as a whole (73.0 percent). While no primary city or suburb has avoided increases in unemployment, fully 75 metro areas saw the number of suburban unemployed increase at a faster rate than the unemployed population living in primary cities over this time period. Unemployment rates in cities and suburbs also vary widely at the individual metro-area level (Table 1A). In May 2009, the primary city unemployment rate ranged from 4.6 percent in Omaha to 23.8 percent in Detroit. Suburban unemployment rates ranged from 4.3 percent in the Des Moines metro area to 17.9 percent around Modesto. Metro areas such as Omaha and Oklahoma City that placed among the lowest for city or suburban unemployment also had much
BROOKINGS | July 2009
2

lower intra-metropolitan disparities between their city and suburban rates, with most reporting a difference of one percentage point or less. In contrast, cities and suburbs that had the highest unemployment rates—like Bakersfield and Columbia—tended to exhibit much greater differences in unemployment within their metro areas.
Notwithstanding these differences in city and suburban rates, cities and suburbs within the same metropolitan areas generally experienced very similar increases in their unemployment rates. Across all 100 metro areas, about half of the increase in suburban rates could be explained by the increases in their respective cities’ rates.5 Of the 10 cities experiencing the smallest unemployment rate increases, 7 had suburbs among the top 10 (Table 1B). In addition, 4 of the cities in the bottom 10 for the largest rate increases were joined by their suburbs on that list (Appendix A contains data for all 100 metro areas). This demonstrates that weak labor demand affects entire regional labor markets, including workers in metropolitan cities and suburbs alike.
BROOKINGS | July 2009
3
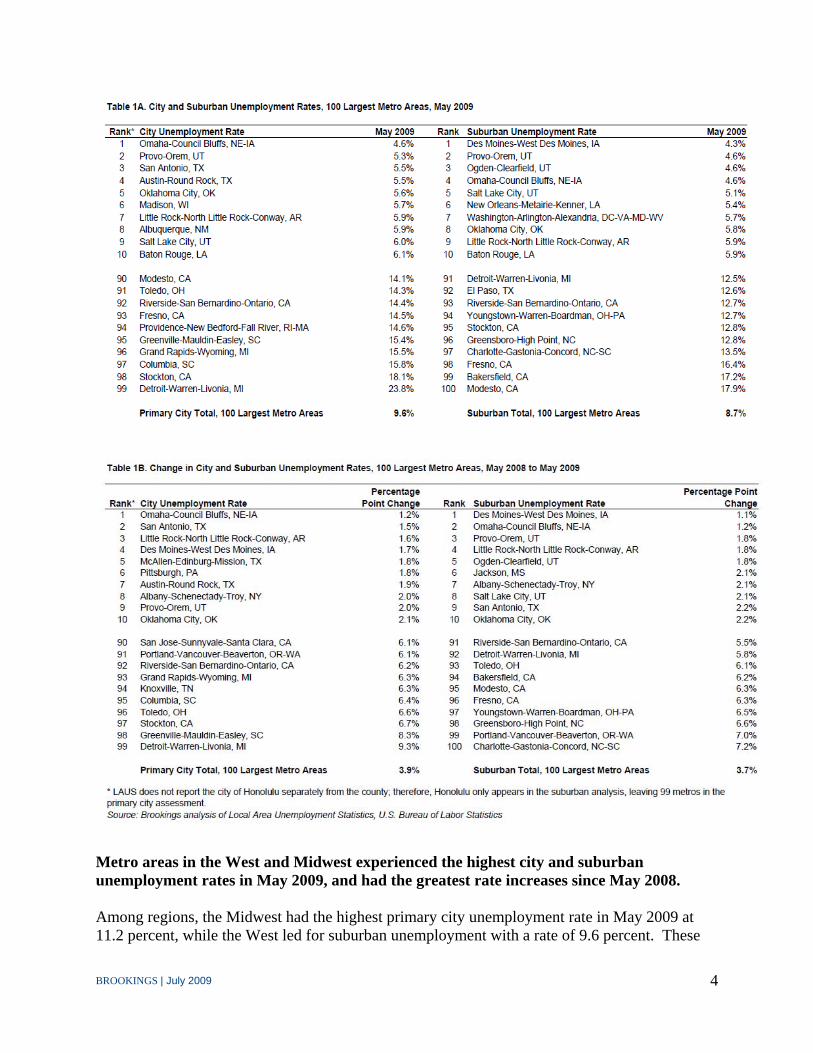
Metro areas in the West and Midwest experienced the highest city and suburban unemployment rates in May 2009, and had the greatest rate increases since May 2008. Among regions, the Midwest had the highest primary city unemployment rate in May 2009 at 11.2 percent, while the West led for suburban unemployment with a rate of 9.6 percent. These
BROOKINGS | July 2009
4

intra-metropolitan trends reflect the economic stress experienced by many manufacturing-oriented metro areas dependent on the ailing auto industry, as well as the inland California and Intermountain West metro areas hit hardest by the housing market collapse. The West outpaced all other regions in terms of growth in the unemployed population in the year ending in May 2009, and experienced the greatest increases in suburban unemployment rates, at 4.3 percentage points, and in city unemployment rates, at 4.4 percentage points (Table 2).
All regions, except for the Northeast, saw their suburban unemployed population grow at a faster rate than in primary cities. This trend is most pronounced in Southern metros, where growth in the suburban unemployed population outpaced primary cities by more than 10 percentage points. Exurbs and emerging suburbs exhibit a higher unemployment rate than other types of suburbs. All types of suburbs studied—older, denser communities as well as newer, lower-density suburbs—saw their unemployed population grow at a faster rate than that of primary cities. However, unemployment rates varied depending on the community type (Figure 3). For instance, older, higher density suburbs actually exhibited a lower unemployment rate than cities and other types of suburbs.
BROOKINGS | July 2009
5
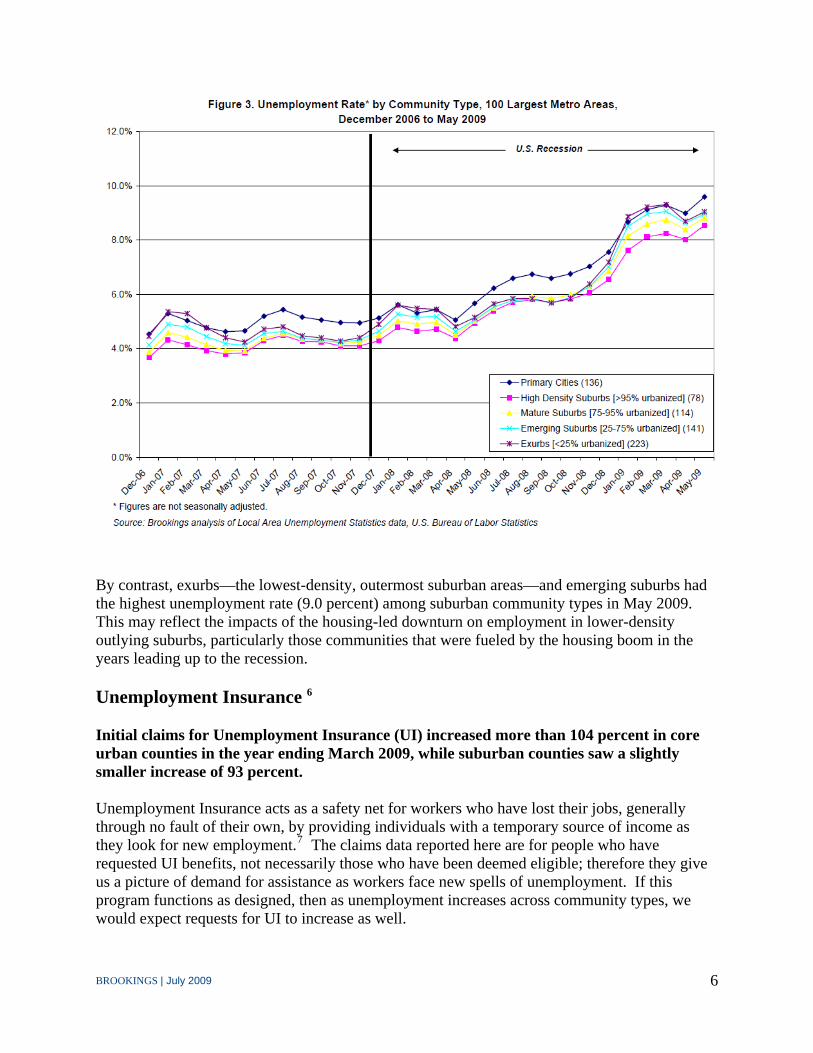
By contrast, exurbs—the lowest-density, outermost suburban areas—and emerging suburbs had the highest unemployment rate (9.0 percent) among suburban community types in May 2009. This may reflect the impacts of the housing-led downturn on employment in lower-density outlying suburbs, particularly those communities that were fueled by the housing boom in the years leading up to the recession. Unemployment Insurance 6 Initial claims for Unemployment Insurance (UI) increased more than 104 percent in core urban counties in the year ending March 2009, while suburban counties saw a slightly smaller increase of 93 percent. Unemployment Insurance acts as a safety net for workers who have lost their jobs, generally through no fault of their own, by providing individuals with a temporary source of income as they look for new employment.7 The claims data reported here are for people who have requested UI benefits, not necessarily those who have been deemed eligible; therefore they give us a picture of demand for assistance as workers face new spells of unemployment. If this program functions as designed, then as unemployment increases across community types, we would expect requests for UI to increase as well.
BROOKINGS | July 2009
6

In March of 2008, initial UI claims were at roughly the same level in urban and suburban counties in the 48 large metro areas studied, with 176,470 claims in core counties and 176,373 in the suburbs (Table 3). By March 2009, the number of core county claims more than doubled to over 360,500 while suburban claims increased by 93 percent, to almost 340,000. This reverses the trend noted above, in which the number of unemployed individuals in suburbs increased slightly faster than in cities.8 This may be attributable to differences in how cities and core urban counties are defined, differing levels of awareness of or access to safety net services acommunity types, or UI eligibility or take-up differences between urban and suburban workers. Nonetheless, the similarity of the overall urban and suburban trends in UI claims further reveals the challenges that both types of places share during the current downturn (Appendix B contains data for all 100 metro areas).
cross
Exurbs outpaced older, denser suburbs as well urban counties for growth in UI claims in the year ending March 2009. Exurban counties experienced a 122 percent increase in UI claims between March 2008 and March 2009—the greatest increase by far across suburban types and core counties (Table 3). Interestingly, higher-density suburban counties—older communities which tend to surround the urban core—have seen UI claims increase at rates well below the metropolitan average. Supplemental Nutrition Assistance Program 9 Though more SNAP recipients live in urban counties, enrollment in suburban counties increased faster between January 2008 and January 2009. The Supplemental Nutrition Assistance Program (SNAP, formerly known as the Food Stamp Program) is a federal benefit program that helps low-income people and families purchase food.10 As the recession has deepened, demand for this safety net program has continued to increase across both urban and suburban communities in the 76 metro areas for which data are available. Enrollment in core urban counties increased 16.0 percent in the year ending January 2009—the most recent month for which we have data—for a total of 9.0 million benefit recipients. While suburban counties have fewer overall recipients—5.3 million in January 2009—they experienced
BROOKINGS | July 2009
7

a steeper 20.5 percent uptick in enrollment than urban counties over the prior year (Table 4). While these increases seem muted in comparison to unemployment or UI, we would not expect growth in SNAP enrollment to reach the same magnitude; eligibility for this program is limited to households near or below the poverty level, while unemployment and the demand for UI affect individuals across the income spectrum.
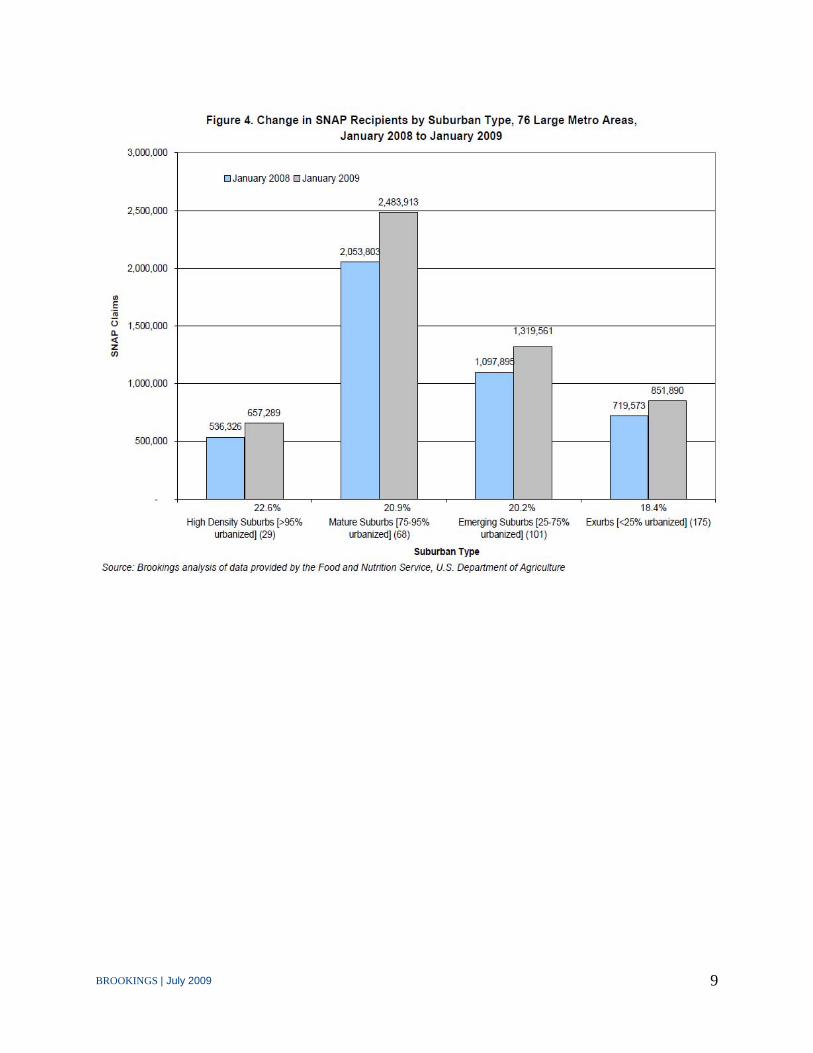
SNAP receipt increased faster in suburban counties regardless of region, especially in the West and Midwest, where rates of enrollment increases in suburbs outpaced those in cities by about 6 percentage points (Table 4). While the South and West led for overall increases in program enrollment, the Northeast showed upticks in enrollment well below average for this time period, at only 8.0 percent in core counties and 12.4 percent in the suburbs (Appendix C contains data for all 100 metro areas). High-density and mature suburbs experienced the greatest increase in SNAP enrollment between January 2008 and January 2009, while exurbs showed below-average growth. Contrary to trends in unemployment and UI claims, SNAP enrollment increased most rapidly in high-density and mature suburbs from January 2008 to January 2009 (Figure 4). 11 Exurbs experienced the smallest (though still considerable at 18.4 percent) increase in SNAP receipt among suburban types during that time. This raises questions about whether the disparity between the unemployment and SNAP trends in both high-density suburbs and exurbs relates to underlying differences in SNAP eligibility across community types (for instance, due to income or family structure differences), or differences in take-up or access to the social safety net (for instance, due to information, level of perceived stigma, or distance to providers).
BROOKINGS | July 2009
8
BROOKINGS | July 2009
9
BROOKINGS | July 2009
10
Conclusion These statistics together belie the notion that big cities have cornered the market on the family and community distress accompanying rising unemployment during this recession. More so than the last recession, suburbs have felt the effects of this downturn alongside primary cities and core urban counties. The trend is fairly consistent across regions, with Western suburbs generally faring the worst. Exurbs have been hit particularly hard by this recession, perhaps owing to their economic reliance on a battered housing market. Lagging enrollment increases in food assistance programs there point to a possible gap in safety net access. The Brookings Metro Program will continue to issue periodic updates on what these indicators suggest about the geography of the downturn and eventual recovery within metropolitan areas nationwide.
1 The Metropolitan Policy Program at Brookings, “MetroMonitor: Tracking Economic Recession and Recovery in America’s 100 Largest Metro Areas” (Washington: 2009). 2 Alan Berube and Elizabeth Kneebone, “Two Steps Back: City and Suburban Poverty Trends 1999-2005” (Washington: Brookings Institution, 2006). 3 Monthly data on the labor force and unemployed population come from the Local Area Unemployment Statistics program at the U.S. Bureau of Labor Statistics. May 2009 preliminary estimates represent the most recent data available at the time of publication. Note that monthly data at the city and county level are not seasonally adjusted; therefore, for the sake of comparison we also use national figures that have not been seasonally adjusted. The metro areas included in this analysis represent the top 100 based on 2007 population estimates. Primary cities include the first city named in the official Office of Management and Budget metropolitan statistical area (MSA) name, and any other city in the MSA name that has a population of 100,000 or more. In the 100 largest metro areas, we identify 137 primary cities. Suburbs represent the remainder of the MSA outside the primary city or cities. In addition, suburban counties are also categorized into suburban type based on the share of the county (net of the primary city or cities) that is urbanized according to Census 2000. 4 Although these two periods (May 2001 to May 2002, and May 2008 to May 2009) do not coincide with the same points in the economic cycle, they do represent the periods of greatest increase in unemployment for each recession (thus far, for the current one), and permit a view of the relative impact of each recession on cities and suburbs in major metro areas. 5 Regressing changes in suburban unemployment on changes in city unemployment yields an R2 of 0.5. 6 We collected monthly county-level data on Unemployment Insurance (UI) claims through telephone interviews with state agencies. The number of claims reported represents any notice of unemployment filed (1) to request a determination of entitlement to and eligibility for compensation or (2) to begin a second or subsequent period of eligibility within a benefit year or period of eligibility. These requests are categorized as “initial” claims. As such, they represent “demand” for UI benefits. They do not, however, represent the actual number of claimants who establish eligibility and ultimately receive UI benefits. Because states use different standards for reporting UI claims by county, not all county data collected are directly comparable. Of the 100 largest metro areas, we include the 48 metros for which we have comparable data.

BROOKINGS | July 2009
11
Because the county-level data do not correspond to city boundaries, we designate “core” counties and compare trends in those counties to their suburban counterparts. Core counties are those that (1) contain a primary city, and (2) either had an urbanization rate of at least 95 percent in 2000, or the primary city (or cities) accounted for at least half the county’s population in 2000. We identify 87 core counties in the 100 largest metro areas, such as San Francisco County, CA; Cook County, IL; and Harris County, TX. Suburban counties are identified by type based on the share of the county that is urbanized according to Census 2000. 7 Note that eligibility typically does not extend to part-time, temporary, or self-employed workers. For more information on Unemployment Insurance, see: http://www.ows.doleta.gov/unemploy/ (accessed June, 2009). 8 Even when the unemployment analysis is restricted to the 48 metro areas for which we have UI claims data, we find the same overall trend described in the previous section; namely, the number of suburban unemployed grew at a faster rate than the unemployed population in primary cities. 9 Data on Supplemental Nutrition Assistance Program (SNAP) participants come from the U.S. Department of Agriculture’s Food and Nutrition Service (FNS). Every six months FNS compiles state-reported data on SNAP recipients at the project area level. Project areas that do not conform to county boundaries are excluded from the analysis, leaving 76 of the top 100 metro areas. Again, because city-level data are not available, we use the same methodology described above to designate “core” and suburban counties within the 76 metro areas. 10 For more information on SNAP, see: http://www.fns.usda.gov/FSP/ (accessed June, 2009). 11 Limiting the unemployment analysis to the 76 metro areas for which we have data produces the same overall trends found for all top 100 metro areas.

BROOKINGS | July 2009
12
Acknowledgments
The authors thank Alan Berube for his guidance on this brief, the many state agencies who generously shared their data on Unemployment Insurance claims, and the USDA Food and Nutrition Service for providing data on county-level SNAP participation. The Metropolitan Policy Program at Brookings thanks the Ford Foundation for its generous support of the program’s research on city and suburban poverty, the Annie E. Casey Foundation for its support of the program’s research on low-income working families, and the John D. and Catherine T. MacArthur Foundation, the George Gund Foundation, and the Heinz Endowments for their general support of the program.
For More Information
Elizabeth Kneebone Senior Research Analyst [email protected]
Emily Garr
Senior Research Assistant [email protected]
About the Metropolitan Policy Program at the Brookings Institution Created in 1996, the Brookings Institution’s Metropolitan Policy Program provides decision makers with cutting-edge research and policy ideas for improving the health and prosperity of cities and metropolitan areas including their component cities, suburbs, and rural areas. To learn more visit: www.brookings.edu/metro