He knows there’s a well out there. - OPEC · He knows there’s a well out there. ... Professor...
75
-
Upload
vuongtuyen -
Category
Documents
-
view
219 -
download
0
Transcript of He knows there’s a well out there. - OPEC · He knows there’s a well out there. ... Professor...


Co
nte
nts
He knows there’s a well out there. So do we.
Why are nine out of ten appraisal wells drilled by OMV Exploration & Production GmbH successful? Just as the camel finds water where others see only sand, we find oil where others can‘t. But it‘s not only us to use the most advanced technology: our colleagues from OMV Gas & Power GmbH do so too when transporting the gas we have produced. OMV is not only a pioneer in the Nabucco Gas Pipeline project, but is also fully committed to being a pro-gressive player in the LNG business. OMV places its competence and knowhow into action for a secured energy supply.
www.omv.com
Move & More.
Kamel_230x280mm.indd 1 13.05.2009 16:07:41 Uhr

Focus on OPEC in Golden Anniversary year
OPEC’s Ministers will be reflecting on the past, the present
and the future when they come to their new headquar-
ters in Vienna for the 156th Meeting of the Conference
on March 17.
This year is the 50th anniversary of OPEC’s birth and
a series of special activities has been arranged to mark
the occasion. These include the launch of a new Website,
the preparation of special publications, the issue of com-
memorative postage stamps, the organization of com-
petitions and — reaching a peak closer to the day itself,
September 14 — the holding of cultural exhibitions and
a high-level symposium.
They will highlight OPEC’s achievements and the
long way it has travelled since its almost unheralded
birth in the very different world of 1960, when the pow-
erful ‘Western’ interests controlled the world oil industry
outside the former Soviet Union, with few returns for the
oil-producing countries themselves. Underlying this will
be the recognition that the Organization’s subsequent el-
evation to the role of a key player in the oil industry has
been due to its steadfast commitment to a sound set of
objectives, in the interests of stability and growth, ben-
efiting all parties. The Third Summit of OPEC Heads of
State and Government in 2007 reaffirmed this commit-
ment, with its three guiding themes of stability of global
energy markets, energy for sustainable development, and
energy and environment.
The Ministers will also be examining the present out-
look for the oil market at a time of continuing uncertainty
in the world economy. There is the growing imbalance be-
tween OECD and non-OECD growth, as countries emerge
from recession. There are fears of double-dip recession
in some cases. There is the gathering debate about the
extent and timing of exit strategies from the stimulus
packages imposed during the crisis. And there is the re-
alization that overheating in some emerging economies
may lead to tougher stands on expansionary policies.
Oil prices themselves have held up well over the past
five months within a range of around $70–80/barrel for
the OPEC Reference Basket. OPEC’s decisions of December
2008 have played a part in this. For now, this price range
seems to provide a practical working balance between
the interests of producers and consumers. At the same
time, however, there is still more talk than action about
the introduction of effective regulatory measures in the
financial sector. This is leaving oil, as well as other com-
modity sectors, exposed to new rounds of severe price
volatility, which is detrimental to both the oil industry
and the world economy at large. As we learned two years
ago, no party gains from this.
Importantly, OPEC’s decisions require the support
of other oil-producers to improve their effectiveness.
The Organization has made no secret of the fact that
it is disappointed by some non-OPEC producers look-
ing to OPEC to act in the market when prices are down,
only to back away from this and take a more laissez faire
approach when the market outlook improves again. All
parties benefit from a stable, healthy oil sector and
so all parties must be prepared to contribute towards
achieving this.
Turning to the future, the March 17 Conference will
be the first one to be held in the Secretariat’s new build-
ing in Vienna’s central district. Indeed, the official open-
ing by OPEC Conference President Germánico Pinto will
take place on that very day, with the Austrian Foreign
Minister, the Mayor of Vienna and other distinguished
guests present. The state-of-the-art premises has been
purpose-built to match the Secretariat’s specific needs.
Clearly, as it stands on the threshold of its second
half-century OPEC is in sound shape to continue its
mission to achieve lasting order and stability in the
international oil market and support steady growth in
the world economy. And the solid, sustained support
of other leading parties in the industry in today’s high-
tech, interdependent energy world will greatly enhance
the effectiveness of this.
Co
mm
en
tary
Co
nte
nts
PublishersOPECOrganization of the Petroleum Exporting Countries
Helferstorferstraße 17
1010 Vienna, Austria
Telephone: +43 1 211 12/0
Telefax: +43 1 216 4320
Contact: The Editor-in-Chief, OPEC Bulletin
Fax: +43 1 211 12/5081
E-mail: [email protected]
Web site: www.opec.orgVisit the OPEC Web site for the latest news and infor-
mation about the Organization and back issues of the
OPEC Bulletin which are also available free of charge
in PDF format.
Hard copy subscription: $70/year
OPEC Membership and aimsOPEC is a permanent, intergovernmental
Organization, established in Baghdad, on September
10–14, 1960, by IR Iran, Iraq, Kuwait, Saudi Arabia
and Venezuela. Its objective — to coordinate
and unify petroleum policies among its Member
Countries, in order to secure fair and stable prices
for petroleum producers; an efficient, economic and
regular supply of petroleum to consuming nations;
and a fair return on capital to those investing in the
industry. The Organization comprises 12 Members:
Qatar joined in 1961; SP Libyan AJ (1962); United
Arab Emirates (Abu Dhabi, 1967); Algeria (1969);
Nigeria (1971); Angola (2007). Ecuador joined OPEC
in 1973, suspended its Membership in 1992, and
rejoined in 2007. Gabon joined in 1975 and left in
1995. Indonesia joined in 1962 and suspended its
Membership on December 31, 2008.
CoverThis month’s cover shows the Organization’s new Headquarters, to be inaugurated by OPEC’s Ministers on March 17 (see story on page 16).Photo: Diana Golpashin.
OP
EC
bu
lle
tin
Vol XLI, No 2, March 2010, ISSN 0474–6279
Farewell 24
Secretariat Meetings 22
New Location 16
Inter view 10
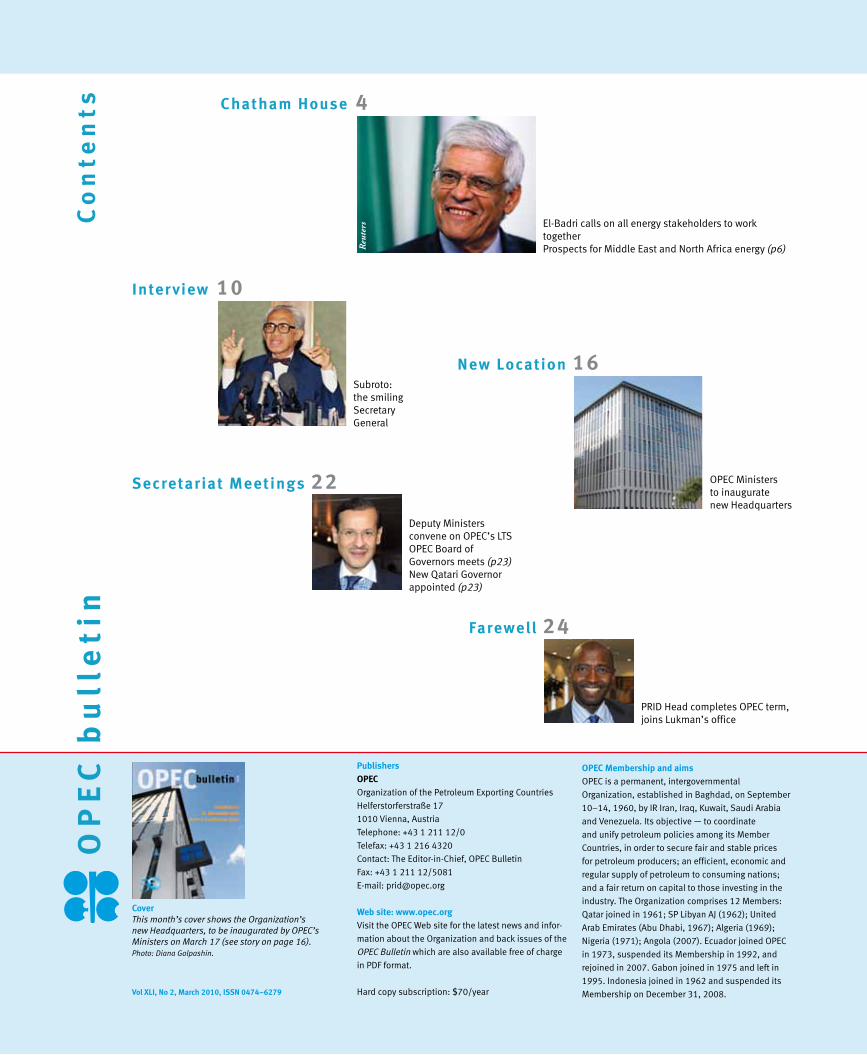
Chatham House 4
El-Badri calls on all energy stakeholders to work togetherProspects for Middle East and North Africa energy (p6)
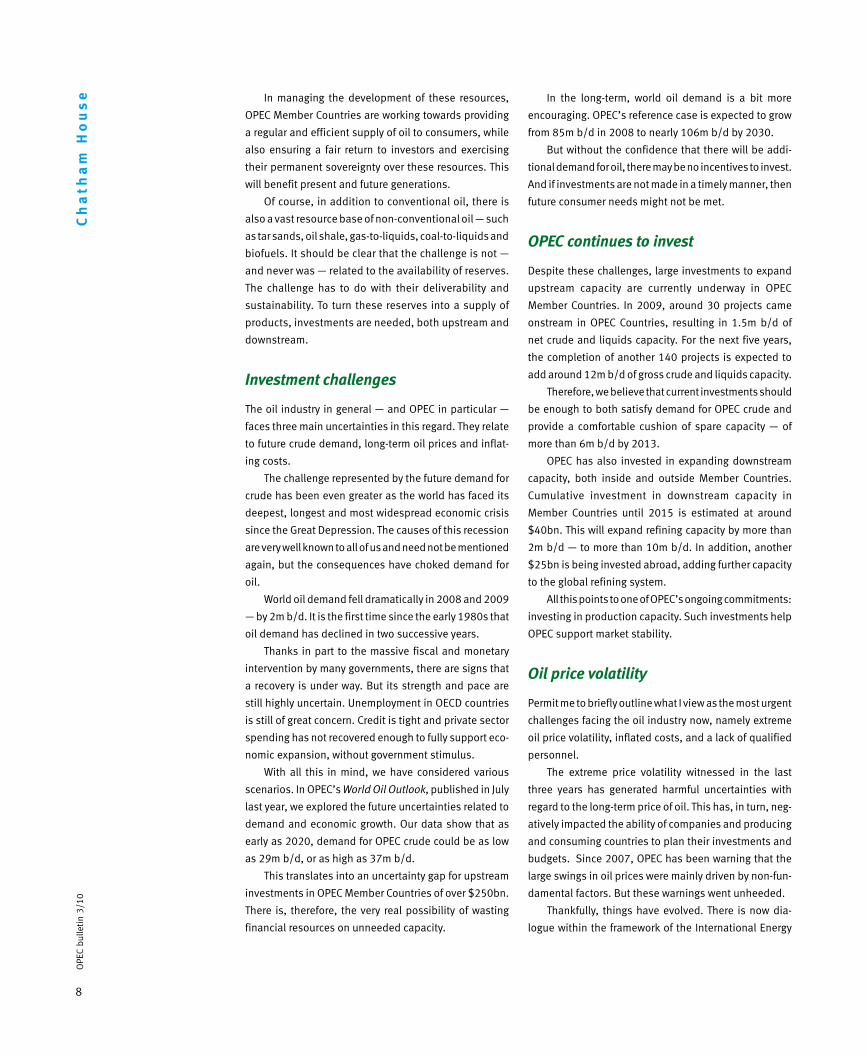
Subroto: the smiling Secretary General
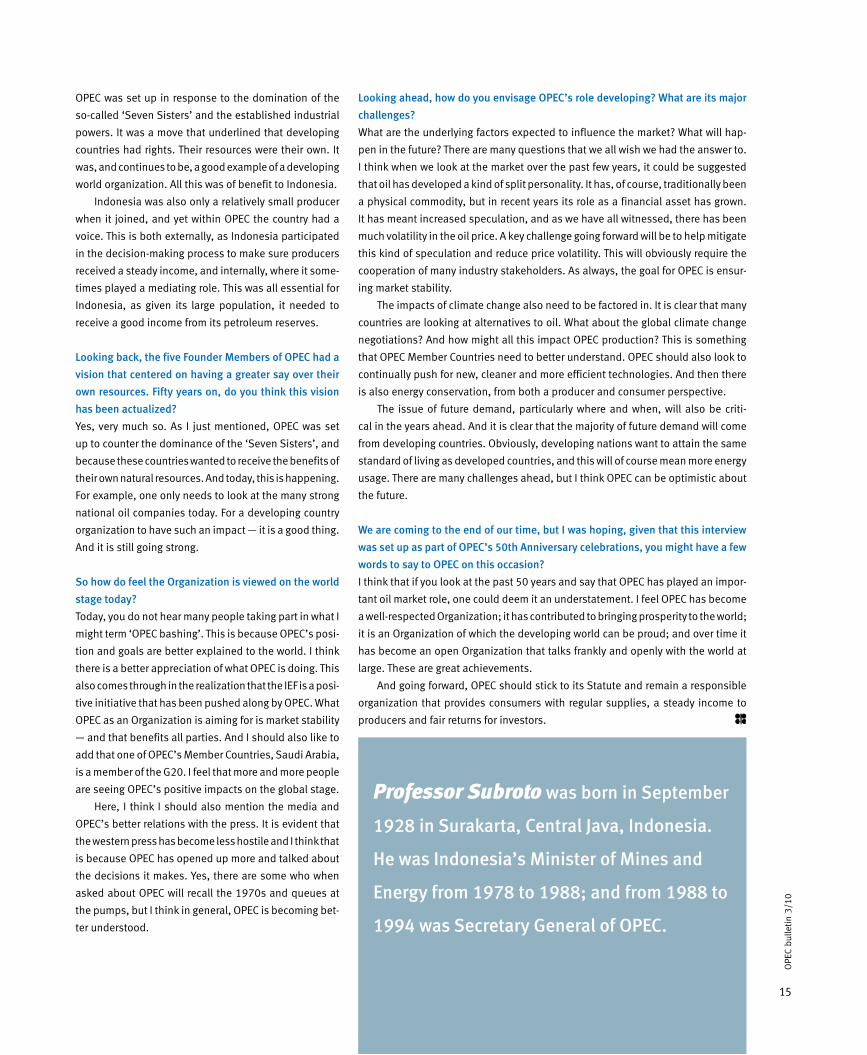
OPEC Ministersto inauguratenew Headquarters
PRID Head completes OPEC term, joins Lukman’s office
Deputy Ministers convene on OPEC’s LTSOPEC Board of Governors meets (p23)New Qatari Governor appointed (p23)
Reu
ters

Market Review 54
Noticeboard 70
Vacancies 71
OPEC Publications 72
OPEC Fund News 50
Newsline 38
Inter view 28
Spotl ight 32
Secretariat officialsSecretary GeneralAbdalla Salem El-BadriDirector, Research DivisionIn charge of Multilateral Relations DepartmentDr Hasan M QabazardHead, Petroleum Studies DepartmentMohammad Alipour-JeddiGeneral Legal CounselDr Ibibia Lucky WorikaHead, Data Services DepartmentFuad Al-ZayerHead, Finance & Human Resources DepartmentIn charge of Administration and IT Services DepartmentAlejandro RodriguezHead, Energy Studies DepartmentOswaldo TapiaHead, Office of the Secretary GeneralAbdullah Al-ShameriOfficer-in-Charge, PR & Information DepartmentUlunma Angela Agoawike
ContributionsThe OPEC Bulletin welcomes original contributions on
the technical, financial and environmental aspects of
all stages of the energy industry, research reports and
project descriptions with supporting illustrations and
photographs.
Editorial policyThe OPEC Bulletin is published by the PR & Informa-
tion Department. The contents do not necessar-
ily reflect the official views of OPEC nor its Member
Countries. Names and boundaries on any maps
should not be regarded as authoritative. No respon-
sibility is taken for claims or contents of advertise-
ments. Editorial material may be freely reproduced
(unless copyrighted), crediting the OPEC Bulletin
as the source. A copy to the Editor would be
appreciated. Printed in Austria by Ueberreuter Print GmbH
Editorial staffEditor-in-Chief/Editorial CoordinatorUlunma Angela AgoawikeEditorJerry HaylinsAssociate EditorsKeith Aylward-Marchant, James Griffin, Alvino-Mario Fantini, Steve HughesProductionDiana LavnickDesign & LayoutElfi PlakolmPhotographs (unless otherwise credited)Diana GolpashinDistributionMahid Al-Saigh
Indexed and abstracted in PAIS International
Light at the end of an Andes tunnel —OFID lends support to Colombia’s ambitious mountain road scheme
Kuwait celebrates national oil successOPEC has “done a good job” in balancing oil market (p40)SP Libyan AJ ploughs more investment into oil expansion plans (p41)Gas expansion schemes boosting Qatar’s economic standing (p42)Venezuela launches ambitious plan to develop Orinoco Oil Belt (p43)China sets the tone as oil demand begins to recover (p44)Energy security a defining issue — BP executive (p48)
Professor Keywan Riahi — IIASA
Why the derivatives market needs to be better regulated
IIA
SA
INV
IAS

4
OPE
C bu
lleti
n 3/
10C
ha
tha
m H
ou
se
OPEC Secretary General, Abdalla Salem El-Badri,
returned to Chatham House, London, in February 2010,
where he was one of the keynote speakers at the insti-
tute’s ‘Prospects for Middle East and North Africa Energy’
conference.
During his week-long stay in the United Kingdom capi-
tal, El-Badri had a busy schedule, holding several televi-
sion interviews — with CNN, BBC Radio, Russia Today, as
well as the Reuters, Bloomberg and Wall Street Journal
video services. He also attended a press conference of the
international media and conducted an extensive interview
with the leading trade magazine, Petroleum Economist.
El-Badri also held meetings with oil industry officials
and dignitaries, including talks with Lord Howell, former
UK Energy Secretary.
With OPEC celebrating its 50th Anniversary this year,
El-Badri’s address to the Chatham House conference,
which he also attended in 2009, highlighted the major
role the Organization plays in meeting the world’s energy
needs and also the enormous growth seen in OPEC’s oil
reserves, since its birth in Baghdad, Iraq, in 1960.
He told conference delegates that, alongside the far
deeper role which OPEC now had on the international oil
platform, there was also far more trust and confidence in
the Organization’s actions.
This, he said, was largely because OPEC had always
worked hard to ensure a steady and reliable supply of oil
OPEC Secretary General spends busy week in London …
El-Badri calls on allenergy stakeholdersto work together
to the consuming countries to support world economic
growth.
By consistently investing in new production capac-
ity, OPEC continued to demonstrate its efforts to support
market stability, El-Badri pointed out.
But he also warned that OPEC and the oil industry as
a whole continued to face several major challenges.
As a result of the global recession, OPEC had encoun-
tered a dramatic fall in world oil demand in 2008 and
2009 and this had created further uncertainties over
future oil use.
Persistent oil price volatility, inflated costs, and a lack
of qualified oil industry personnel, were other pressing
issues that needed to be tackled, El-Badri maintained.
However, the OPEC Secretary General said that on a
more positive note a much-needed dialogue was taking
place within the framework of the International Energy
Forum (IEF), to discuss ways and means of mitigating oil
price volatility.
While recent proposals from the United States
Commodity Futures Trading Commission (CFTC) to limit
excessive speculation in the futures and over-the-counter
markets were also steps in the right direction.
Going forward, El Badri encouraged all energy stake-
holders to continue to work together and to explore new
avenues of cooperation. This, he pointed out, could only
help create a more stable and secure environment.

5
OPE
C bu
lleti
n 3/
10
“We are more mature. We can forecast better. We have accumulated experience and we can contribute positively to the oil market. We can also assure the world that we are capable of supplying the oil for the future.” — Wall Street Journal video interview
A fall in compliance by OPEC Member Countries to their production allocations was “worrying — the risk is you see a lot of oil in the market and no one is buying it. Then the price will come down.”
— BBC’s ‘Business Daily’ radio interview
Policymakers needed to be cautious when removing their economic stimulus pack-ages. “The exit should be very carefully done because it will have an impact on growth itself and on demand. The first and second quarters will be very difficult — demand will pick up in the second half of the year if we are careful to exit at the right time.” On prices: They should remain in a range of $70–80/barrel through 2010.
— interview with CNN’s John Defterious
Although oil prices were in a range OPEC was satisfied with, uncertainty about the outlook for demand still remained a worry. OPEC pro-ducers needed more clarity over long-term oil demand if they were to continue invest-ing in new output capacity. On a positive note, greater certainty over oil prices during recent months meant that the Organization’s pro-ducers had started to revisit stalled upstream projects. On threats by US politicians to reduce their dependency on Arab oil: “If they do not want to buy Arab oil, it is up to them. But I have been hearing this since (the time of) President Nixon.”
— interview with Petroleum Economist
5
OPE
C bu
lleti
n 3/
10
Left: Abdalla Salem El-Badri, OPEC Secretary General.

6
OPE
C bu
lleti
n 3/
10C
ha
tha
m H
ou
se
In 1960, when OPEC was born, the Middle East was
already an important and growing crude supply region,
while North Africa was in the early stages of developing
its newly found oil reserves.
At that time, the five Founding Members of OPEC held
a total of around 200 billion barrels of reserves, or two-
thirds of world deposits. On average, they supplied 7.9
million barrels/day of crude oil to world markets, repre-
senting more than one-third of total world production.
Today, 50 years later, OPEC is even more important.
OPEC Secretary General, Abdalla Salem El-Badri, delivered the following address to the Chatham House conference in London, on February 1, 2010.
Prospects for Middle East and North Africa energy
The Organization’s reserves have multiplied by a factor
of five to reach 1 trillion b and its daily production has mul-
tiplied by nearly four, to reach 29m b/d. However, its pro-
duction capacity reached more than 35.2m b/d in 2009.
Of course, this growth is partly due to the fact that
OPEC went from having five to 12 Members. But even
if we limit the comparison to the five original Founding
Members, the growth is still impressive. Their reserves
are almost four times larger and their production levels
are almost three times greater today than in 1960.
“There is no doubt that the world today has enough oil reserves to satisfy consumers for decades to come.”
Reu
ters
7
OPE
C bu
lleti
n 3/
10
In the downstream sector, the change is even more
dramatic.
The increased importance of OPEC has been accom-
panied by growing recognition of its positive role, and by
more trust and confidence in its actions. This is the result
of several factors. First, OPEC has consistently ensured
supplies to the market in a timely manner. Second, a gen-
uine and forward-looking dialogue has helped improve
the mutual understanding of producers and consumers.
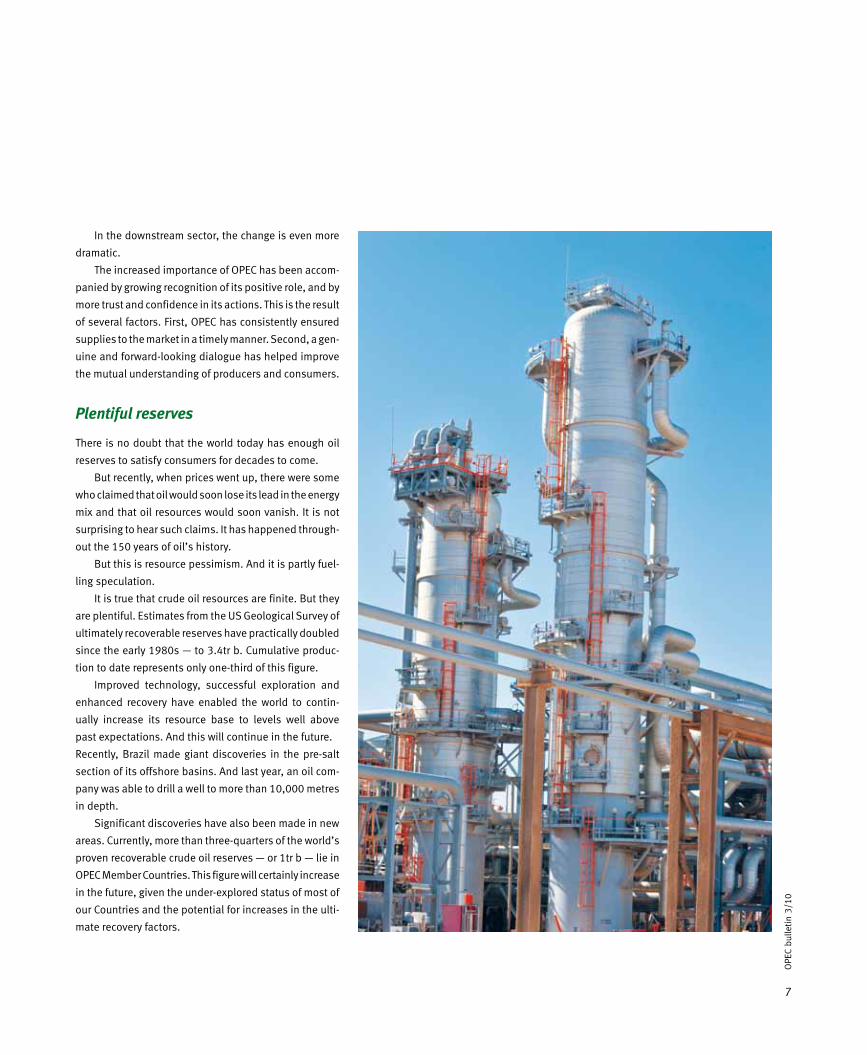
Plentiful reserves
There is no doubt that the world today has enough oil
reserves to satisfy consumers for decades to come.
But recently, when prices went up, there were some
who claimed that oil would soon lose its lead in the energy
mix and that oil resources would soon vanish. It is not
surprising to hear such claims. It has happened through-
out the 150 years of oil’s history.
But this is resource pessimism. And it is partly fuel-
ling speculation.
It is true that crude oil resources are finite. But they
are plentiful. Estimates from the US Geological Survey of
ultimately recoverable reserves have practically doubled
since the early 1980s — to 3.4tr b. Cumulative produc-
tion to date represents only one-third of this figure.
Improved technology, successful exploration and
enhanced recovery have enabled the world to contin-
ually increase its resource base to levels well above
past expectations. And this will continue in the future.
Recently, Brazil made giant discoveries in the pre-salt
section of its offshore basins. And last year, an oil com-
pany was able to drill a well to more than 10,000 metres
in depth.
Significant discoveries have also been made in new
areas. Currently, more than three-quarters of the world’s
proven recoverable crude oil reserves — or 1tr b — lie in
OPEC Member Countries. This figure will certainly increase
in the future, given the under-explored status of most of
our Countries and the potential for increases in the ulti-
mate recovery factors.
8
OPE
C bu
lleti
n 3/
10C
ha
tha
m H
ou
se In the long-term, world oil demand is a bit more
encouraging. OPEC’s reference case is expected to grow
from 85m b/d in 2008 to nearly 106m b/d by 2030.
But without the confidence that there will be addi-
tional demand for oil, there may be no incentives to invest.
And if investments are not made in a timely manner, then
future consumer needs might not be met.
OPEC continues to invest
Despite these challenges, large investments to expand
upstream capacity are currently underway in OPEC
Member Countries. In 2009, around 30 projects came
onstream in OPEC Countries, resulting in 1.5m b/d of
net crude and liquids capacity. For the next five years,
the completion of another 140 projects is expected to
add around 12m b/d of gross crude and liquids capacity.
Therefore, we believe that current investments should
be enough to both satisfy demand for OPEC crude and
provide a comfortable cushion of spare capacity — of
more than 6m b/d by 2013.
OPEC has also invested in expanding downstream
capacity, both inside and outside Member Countries.
Cumulative investment in downstream capacity in
Member Countries until 2015 is estimated at around
$40bn. This will expand refining capacity by more than
2m b/d — to more than 10m b/d. In addition, another
$25bn is being invested abroad, adding further capacity
to the global refining system.
All this points to one of OPEC’s ongoing commitments:
investing in production capacity. Such investments help
OPEC support market stability.
Oil price volatility
Permit me to briefly outline what I view as the most urgent
challenges facing the oil industry now, namely extreme
oil price volatility, inflated costs, and a lack of qualified
personnel.
The extreme price volatility witnessed in the last
three years has generated harmful uncertainties with
regard to the long-term price of oil. This has, in turn, neg-
atively impacted the ability of companies and producing
and consuming countries to plan their investments and
budgets. Since 2007, OPEC has been warning that the
large swings in oil prices were mainly driven by non-fun-
damental factors. But these warnings went unheeded.
Thankfully, things have evolved. There is now dia-
logue within the framework of the International Energy
In managing the development of these resources,
OPEC Member Countries are working towards providing
a regular and efficient supply of oil to consumers, while
also ensuring a fair return to investors and exercising
their permanent sovereignty over these resources. This
will benefit present and future generations.
Of course, in addition to conventional oil, there is
also a vast resource base of non-conventional oil — such
as tar sands, oil shale, gas-to-liquids, coal-to-liquids and
biofuels. It should be clear that the challenge is not —
and never was — related to the availability of reserves.
The challenge has to do with their deliverability and
sustainability. To turn these reserves into a supply of
products, investments are needed, both upstream and
downstream.
Investment challenges
The oil industry in general — and OPEC in particular —
faces three main uncertainties in this regard. They relate
to future crude demand, long-term oil prices and inflat-
ing costs.
The challenge represented by the future demand for
crude has been even greater as the world has faced its
deepest, longest and most widespread economic crisis
since the Great Depression. The causes of this recession
are very well known to all of us and need not be mentioned
again, but the consequences have choked demand for
oil.
World oil demand fell dramatically in 2008 and 2009
— by 2m b/d. It is the first time since the early 1980s that
oil demand has declined in two successive years.
Thanks in part to the massive fiscal and monetary
intervention by many governments, there are signs that
a recovery is under way. But its strength and pace are
still highly uncertain. Unemployment in OECD countries
is still of great concern. Credit is tight and private sector
spending has not recovered enough to fully support eco-
nomic expansion, without government stimulus.
With all this in mind, we have considered various
scenarios. In OPEC’s World Oil Outlook, published in July
last year, we explored the future uncertainties related to
demand and economic growth. Our data show that as
early as 2020, demand for OPEC crude could be as low
as 29m b/d, or as high as 37m b/d.
This translates into an uncertainty gap for upstream
investments in OPEC Member Countries of over $250bn.
There is, therefore, the very real possibility of wasting
financial resources on unneeded capacity.

9
OPE
C bu
lleti
n 3/
10
Forum (IEF) to mitigate this volatility, a dia-
logue we welcome. In addition, we consider
recent proposals from the CFTC in the US to
limit excessive speculation in the futures
and over-the-counter markets are steps in
the right direction.
Inflated costs faced by the oil industry
in upstream and downstream activities are
another obstacle to investments. In addi-
tion, policies in consuming countries add
a further layer of uncertainty.
Finally, we are faced with the lack of
qualified human resources. Global enrol-
ment in geology and petroleum engineer-
ing courses has been dropping for years and
many qualified workers are retiring from our
industry. This has become one of our most
urgent needs.
Crucial time
Clearly, this is a crucial time.
The world has been evolving towards
greater interdependence and more inte-
grated energy markets. And the world will
continue to need more and more energy.
It is true that an increasingly diversified
range of sources will contribute towards sat-
isfying these needs. But oil will remain the
fuel of choice.
Considering the fact that everyone has
faced daunting challenges with the glo-
bal economy recently, I cannot emphasize
enough the need to work together. The
responses of governments to the recent
economic crisis have demonstrated the
importance of coordinated efforts.
OPEC’s Third Summit of Heads of State
in Riyadh in 2007 called for developing
existing and new avenues of cooperation
with all stakeholders. In this spirit, we are
endeavouring to enhance formal and active
dialogues with many producing and con-
suming countries. OPEC is also active within
the IEF, a platform for promoting producer-
consumer dialogue.
It is these joint efforts, about which I
am optimistic, that will lead us all to a more
secure, stable and sustainable world.
“Improved technology, successful exploration
and enhanced recovery have enabled the world
to continually increase its resource base to
levels well above past expectations.”

10
OPE
C bu
lleti
n 3/
10In
terv
iew
Bulletin: Dr Subroto, during your time as OPEC Secretary General there were
a number of key events and significant happenings. What do you recall of
these? And what do you feel was the most important development during
the six years you headed up the OPEC Secretariat?
Subroto: There were, of course, a number of major events, such as the Gulf
Conflict in 1990 that we had to deal with during this period. Reflecting on the
period as a whole, however, I believe that the most important development
was the establishment of cooperation between OPEC and the International
Energy Agency (IEA). For many years prior to 1988 and during the early part
of my time at the Secretariat, the relationship between the two organiza-
tions was one of cat and mouse. It often felt like the two organizations were
crossing swords every time they met.
Gradually, however, the relationship developed and I believe it was in
Paris in 1991 that we sat next to each other for the first time at an event.
There was a coming together and an understanding that in many respects our
interests, particularly in regards to market stability, were similar. Following
this, the understanding between Helga Steeg (then head of the IEA) and I
developed, and a more formal relationship between the two organizations
was built.
At that time the word ‘dialogue’ was seen very much as taboo, but the
organizations were able to sit down together and initiate such a thing. And
this helped in pushing forward the establishment of the International Energy
Forum (IEF); a forum that allows all stakeholders to discuss and deliber-
ate the oil industry’s challenges and opportunities. Often, the problem in
the past was that producers and consumers did not have complete data to
make decisions. I think the IEF and the Joint Oil Data Initiative have helped
provide an improved picture of supply and demand. This has been a good
thing for oil market stability.
I believe this was the most important development during my time as
Subroto:the smiling Secretary General
OPEC Secretary General — and these events have had very
important implications for the global oil industry. The slo-
gan I remember from that time was ‘from confrontation
to cooperation’. And there is clearly a more cooperative
environment today.
So, how did you feel yesterday when you saw the cur-
rent OPEC Secretary General, Abdalla Salem El-Badri, and
the current Executive Director of the IEA, Nobuo Tanaka,
sharing a platform in an open and convivial manner?
It did make me reflect back on how things were in the
1970s and 1980s, and how more cooperative relation-
ships are today. It really is an important change the indus-
try has gone through.
Your time in office also coincided with a greater focus on
the environmental agenda. There was the Rio Summit
of 1992, and in the same year, OPEC held its first envi-
ronmental seminar. How do you remember that this all
played out?
I would like to emphasize that then, as it still does today,
the environmental issue meant different things to differ-
ent people. Here, I am talking about the economic, social
and environmental challenges facing developing and
developed countries. For developing countries, poverty
alleviation, economic development and social progress
were, and remain the priorities.
However, we realized that OPEC needed to play an
active and positive part in any environmental negotia-
In the first of a series of reflective interviews to mark OPEC’s 50th anniversary, the OPEC
Bulletin’s James Griffin talks with Indonesia’s Professor Subroto, who served the
Organization as Secretary General from 1988–94. Subroto offers up his thoughts on
his time at the Secretariat, from both an internal and external perspective, and recalls
some of the major events that marked his term in office.

11
OPE
C bu
lleti
n 3/
10
2009
1986

12
OPE
C bu
lleti
n 3/
10In
terv
iew
1989
1994
1990
Reu
ters

13
OPE
C bu
lleti
n 3/
10
tions, which we did, and the Organization continues to
do so. And we also recognized that we had good ideas in
relation to the environment. It was obviously early days
for negotiations and environmental events, but it was
good that the Organization was part of the process at
this time.
I would also like to take you back to one important event
prior to you taking office. This covers the period follow-
ing the 1986 price collapse when you and colleagues
travelled the world to gather support for initiatives to
bring about price stability. I believe you were called ‘The
Three Wise Men’?
As I remember, ‘The Three Wise Men’ were Rilwanu
Lukman from Nigeria, Arturo Hernandez Grisanti from
Venezuela, and I, obviously from Indonesia. There were a
number of questions that we were confronted with at that
time, but the key one was, how do we go about stabiliz-
ing prices and avoid the crazy fluctuations? We decided
that it was important to better understand the market
players — both producers and consumers. From a pro-
ducer perspective, outside of OPEC, there were countries
like Russia, Mexico, Norway, the Sultanate of Oman and
Angola, which we believed could play a constructive role
in bringing stability to the market. This meant travelling to
these countries and talking to the ministers to reiterate
OPEC’s aim of stabilizing prices, for the benefit of both
producers and consumers. It was a type of global dialogue.
Did it make a difference?
I believe it did. And the most important thing was that
we had frequent visits to non-OPEC producers, which
improved relationships. I should also like to say that at
that time the non-OPEC countries were more or less repre-
sented by Hermann Franssen, then Advisor to the Minister
of Petroleum and Minerals of the Sultanate of Oman. In
many respects, he ended up being my counterpart in
trying to nurture the relationship between the non-OPEC
and OPEC Countries. And today, I do feel that there is a
better understanding between OPEC and non-OPEC pro-
ducers. In fact, Angola has joined the Organization and
there is now a dialogue between Russia and OPEC. We
1991
1992

14
OPE
C bu
lleti
n 3/
10In
terv
iew
wanted to improve relationships back then, and I feel they have certainly improved
over the intervening years.
On a more personal level, what do you remember from your time working at the
OPEC Secretariat? And how would you like to be remembered?
At the time I took up my post at the OPEC Secretariat there was a lot of animos-
ity from consumers, particularly a number of developed western countries, who
thought that the Organization was bad; a kind of secret organization that could not
be trusted. Despite this, I felt we needed to continue to talk with them and discuss
important matters with them. We needed to keep the channels of communication
open. And I remember that a major United States newspaper said that I provided
a face for OPEC and most satisfyingly for me was the comment that it was a gentle
and kindly face. So I would like to be remembered as the smiling Secretary General
who worked hard to improve the Organization and its image.
And what about within the Secretariat?
There are many things. I felt that we were able to strengthen the Economic Commission
Board (ECB). Before we had good Member Country representatives, but it was not
always easy to come together and discuss the important issues. By strengthening
the ECB, we allowed more of this to happen. It became a very effective source of
information to the Secretariat, so that better informed decisions could be taken at
the Ministerial Meeting. And of course there were the Secretariat staff. I enjoyed
meeting new people, working with them, talking about issues that are of common
interest to us, training people so that they can improve themselves in the Secretariat,
and establishing new friendships. And I would like to say that I was also very privi-
leged to have had the opportunity to work for the OPEC Secretariat for six years.
There were obviously many important decisions made during your tenure. With
hindsight — I know this is never easy — do you feel there were any decisions that
could have perhaps been taken differently?
Yes, this is a difficult question. I always make decisions
at the time with good intentions. From the viewpoint of
OPEC, decisions were always taken in the interest of mar-
ket stability and in my honest opinion we did not make
any big mistakes. The only decision I perhaps look back
on with some thought in this regard is the one taken in
Bali in 1980 during tensions between Iran and Iraq. At
that time we took into account the oil market situation
and a decision was taken to fix the official price of the
Marker Crude at the level of $32/b; that prices of OPEC
crudes may be set on the basis of an oil price ceiling for
a deemed Marker Crude of up to $36/b; and to set the
maximum price for OPEC Crudes at $41/b.
The upshot of this decision was that it allowed non-
OPEC producers to find and produce more, new produc-
ers also came into the market, and in turn, OPEC’s mar-
ket share fell. In addition, demand fell. By mid-1987, the
price of oil had dropped to below $10/b. With hindsight,
the decision taken in Bali could have been different. But
it should be remembered that decisions were taken with-
out complete information; it was often like shooting at a
moving target.
I can appreciate that work at the Secretariat filled up a
great deal of your time in Vienna, but I know from talk-
ing to staff who worked with you during this period that
you were also very active in a variety of leisure pursuits.
Is this true?
Yes, very much so. At this time I remember that I felt in the
peak of health. And I particularly enjoyed sports. There
was tennis. I think wherever I went I had a tennis racket
with me! And I also skied quite a bit. As you probably
know, the ski fields are only about one hour from Vienna.
That was great. I had skied before in my early twenties,
in Norway, at the back end of the 1940s. In fact, this was
the first time I saw snow! In Austria, however, I had more
time to enjoy the pursuit. My ski instructor actually still
works at the Secretariat, Siham Alawami. I just did down-
hill skiing and enjoyed it very much. It was something I
really missed when I returned to Jakarta! I also loved the
Opera in Vienna, and this is something I still very much
enjoy in Jakarta.
I know Indonesia recently left the Organization after
more than 40 years as a Member, but I was hoping you
could look back and underscore what the benefits of
OPEC Membership were for your country?
The benefits were political and economic. Looking at it
from a political viewpoint, it should be remembered that
Reu
ters
1997Subroto greets Dr Rilwanu Lukman, Nigeria’s Petroleum Resources Minister. To date, they are the two longest-serving OPEC Secretary Generals.
15
OPE
C bu
lleti
n 3/
10
OPEC was set up in response to the domination of the
so-called ‘Seven Sisters’ and the established industrial
powers. It was a move that underlined that developing
countries had rights. Their resources were their own. It
was, and continues to be, a good example of a developing
world organization. All this was of benefit to Indonesia.
Indonesia was also only a relatively small producer
when it joined, and yet within OPEC the country had a
voice. This is both externally, as Indonesia participated
in the decision-making process to make sure producers
received a steady income, and internally, where it some-
times played a mediating role. This was all essential for
Indonesia, as given its large population, it needed to
receive a good income from its petroleum reserves.
Looking back, the five Founder Members of OPEC had a
vision that centered on having a greater say over their
own resources. Fifty years on, do you think this vision
has been actualized?
Yes, very much so. As I just mentioned, OPEC was set
up to counter the dominance of the ‘Seven Sisters’, and
because these countries wanted to receive the benefits of
their own natural resources. And today, this is happening.
For example, one only needs to look at the many strong
national oil companies today. For a developing country
organization to have such an impact — it is a good thing.
And it is still going strong.
So how do feel the Organization is viewed on the world
stage today?
Today, you do not hear many people taking part in what I
might term ‘OPEC bashing’. This is because OPEC’s posi-
tion and goals are better explained to the world. I think
there is a better appreciation of what OPEC is doing. This
also comes through in the realization that the IEF is a posi-
tive initiative that has been pushed along by OPEC. What
OPEC as an Organization is aiming for is market stability
— and that benefits all parties. And I should also like to
add that one of OPEC’s Member Countries, Saudi Arabia,
is a member of the G20. I feel that more and more people
are seeing OPEC’s positive impacts on the global stage.
Here, I think I should also mention the media and
OPEC’s better relations with the press. It is evident that
the western press has become less hostile and I think that
is because OPEC has opened up more and talked about
the decisions it makes. Yes, there are some who when
asked about OPEC will recall the 1970s and queues at
the pumps, but I think in general, OPEC is becoming bet-
ter understood.
Looking ahead, how do you envisage OPEC’s role developing? What are its major
challenges?
What are the underlying factors expected to influence the market? What will hap-
pen in the future? There are many questions that we all wish we had the answer to.
I think when we look at the market over the past few years, it could be suggested
that oil has developed a kind of split personality. It has, of course, traditionally been
a physical commodity, but in recent years its role as a financial asset has grown.
It has meant increased speculation, and as we have all witnessed, there has been
much volatility in the oil price. A key challenge going forward will be to help mitigate
this kind of speculation and reduce price volatility. This will obviously require the
cooperation of many industry stakeholders. As always, the goal for OPEC is ensur-
ing market stability.
The impacts of climate change also need to be factored in. It is clear that many
countries are looking at alternatives to oil. What about the global climate change
negotiations? And how might all this impact OPEC production? This is something
that OPEC Member Countries need to better understand. OPEC should also look to
continually push for new, cleaner and more efficient technologies. And then there
is also energy conservation, from both a producer and consumer perspective.
The issue of future demand, particularly where and when, will also be criti-
cal in the years ahead. And it is clear that the majority of future demand will come
from developing countries. Obviously, developing nations want to attain the same
standard of living as developed countries, and this will of course mean more energy
usage. There are many challenges ahead, but I think OPEC can be optimistic about
the future.
We are coming to the end of our time, but I was hoping, given that this interview
was set up as part of OPEC’s 50th Anniversary celebrations, you might have a few
words to say to OPEC on this occasion?
I think that if you look at the past 50 years and say that OPEC has played an impor-
tant oil market role, one could deem it an understatement. I feel OPEC has become
a well-respected Organization; it has contributed to bringing prosperity to the world;
it is an Organization of which the developing world can be proud; and over time it
has become an open Organization that talks frankly and openly with the world at
large. These are great achievements.
And going forward, OPEC should stick to its Statute and remain a responsible
organization that provides consumers with regular supplies, a steady income to
producers and fair returns for investors.
Professor Subroto was born in September
1928 in Surakarta, Central Java, Indonesia.
He was Indonesia’s Minister of Mines and
Energy from 1978 to 1988; and from 1988 to
1994 was Secretary General of OPEC.

16
OPE
C bu
lleti
n 3/
10N
ew
Lo
ca
tio
n OPEC Ministersto inaugurate
new Headquarters
By Keith Aylward-Marchant
The official
opening of OPEC’s
new Secretariat
will take place on
March 17, when
the Organization’s
Conference meets
for the first time
in the recently
completed state-
of-the-art building.

17
OPE
C bu
lleti
n 3/
10
July 7, 2008
July 7, 2008
Cutting the ribbon at the opening will be OPEC
Conference President, Germánico Pinto, at a cer-
emony whose guests will include dignitaries from
inside and outside the Organization. Among them will
be Austrian Foreign Minister, Michael Spindelegger,
and the Mayor of Vienna, Dr Michael Häupl.
And this is happening in the year of OPEC’s
Golden Anniversary.
The Secretariat moved into the new premises in
Vienna’s central first district on November 30, 2009.
This has allowed a big build-up to the mid-March
event where there will be an opportunity to reflect
upon OPEC’s past, present and future.
The inauguration has been planned to take place
on the day that OPEC’s Oil and Energy Ministers visit
Vienna for the 156th Meeting of the Conference, with
Pinto, Ecuador’s Minister of Non-Renewable Natural
Resources, as Conference President for the first time.
Remarkable transformation
The Ministers will examine the oil market outlook at a
time of continuing uncertainty in the world economy.
They will note that the price of the OPEC Reference
Basket has stayed within a range of $70–80/barrel
over the past five months. And they are expected to
discuss whether any changes will be needed to the
Organization’s market-stabilization measures for the
second quarter of the year and beyond.
However, underlying all this will be the signifi-
cance of the third quarter, which will see OPEC turn
50 on September 14.
The Ministers will reflect upon OPEC’s remarkable
transformation from humble beginnings in Baghdad,
Iraq, in 1960 to its present role as a major player on
the world energy stage.
At the same time, they will recognize the need
to keep building for the future, in accordance with
the three guiding themes defined by the Third
Summit of OPEC Heads of State and Government in
Riyadh in 2007: stability of global energy markets;
energy for sustainable development; and energy
and environment.
Hence the importance of the Secretariat’s
move into its new premises on the corner of
January 30, 2008
Captured on film ... the next few pages give an idea as to how the construction of the new OPEC headquarters progressed from just a hole in the ground.
Kei
th M
arch
ant
Kei
th M
arch
ant
Kei
th M
arch
ant

18
OPE
C bu
lleti
n 3/
10N
ew
Lo
ca
tio
n
October 20, 2008
December 11, 2008
Helferstorferstrasse and Wipplingerstrasse, between
the old Stock Exchange and Vienna University’s modern
Faculty of Law.
The state-of-the-art facilities have been tailored to
OPEC’s requirements to better equip it to meet the many
challenges facing the industry in the new decade.
The new building has eight upper floors, a ground
floor and a four-tier basement, with car parks and stor-
age facilities. Its total usable area of about 9,000 square
metres is ample for the Secretariat’s 138 staff members
and allows for expansion in the future.
Work began on the project in January 2007 with the
demolition of the old building, which had previously
housed the Austrian Association of Trade Unions. The
lease agreement between OPEC and the owner, Euro-
PRISA, was signed on September 18 of the same year.
Special signing ceremony
The OPEC Headquarters Agreement between the Republic
of Austria and OPEC was amended at a special signing
ceremony of the Protocol in the country’s Federal Ministry
for European and International Affairs in Vienna on
September 30 this year. Signatories were OPEC Secretary
General, Abdalla Salem El-Badri and the Austrian Foreign
Minister, who described the venture as opening a new
chapter in relations between Austria and OPEC. Also
present was Ambassador Ernst-Peter Brezovszky, Head of
the Ministry’s Department for International Conferences
and International Organizations, who led the Austrian
side of the venture.
OPEC formally took possession of the building on
October 20, 2008
OPEC Secretary General, Abdalla Salem El-Badri (c), reviews progress on the new building. Pictured with members of the Office Layout Task Force. K
eith
Mar
chan
t

19
OPE
C bu
lleti
n 3/
10
December 11, 2008
March 3, 2009
May 13, 2009
October 30, 2009. Under the leadership of the Secretary
General, various committees and teams were set up in the
Secretariat to plan the move, oversee its execution and
coordinate with the numerous outside parties involved
in it. Their work has been both intensive and extensive
throughout the project and, indeed, continues today to
address any issue that may arise as staff members con-
tinue to settle into their new working environment.
In the final build-up to the relocation, ‘move coordi-
nators’ were appointed for each office and department
of the Secretariat, to liaise with the staff at a more direct,
localized level. Presentations on the new building were
made to all the staff on November 5, and everyone was
provided with a handbook containing important details
about the move.
Kei
th M
arch
ant
Kei
th M
arch
ant
Kei
th M
arch
ant

20
OPE
C bu
lleti
n 3/
10N
ew
Lo
ca
tio
n
September 22, 2009
September 30, 2009
Throughout the venture, count-
less meetings have been held between
the Secretariat and the outside par-
ties involved in the move, including the
Austrian Foreign Ministry, the City of
Vienna and the local police authorities.
For example, a total of 46 regular meet-
ings have taken place between OPEC and
EuroPRISA since the signing of the lease
contract, and there have been numerous
ad hoc ones on top of these.
The architects were Atelier Hayde
Architekten from Vienna’s 15th district
and a consortium carried out the con-
struction. Bene Consulting were respon-
sible for the interior design and logis-
tics of the move, ACP for the IT work and
several companies for the audio-visual
arrangements. The removal of goods and
furniture from the old to the new building
was undertaken by Spedition Fuchs and
its distinctive orange and white packing
boxes became a familiar sight to staff
members during the move.
Kei
th M
arch
ant
At the signing cermoney of the New Headquarters agreement, OPEC Secretary General, Abdalla Salem El-Badri (l) and Austrian Foreign Minister, Michael Spindelegger.

21
OPE
C bu
lleti
n 3/
10
Demolition work on the old Secretariat building at Obere Donaustrasse 93, alongside the Danube Canal in Vienna’s second district, began early in February. Pictured below, a man looks on while the specialist equipment tears away at walls, floors and ceilings. The whole of the front of the building had
been pulled down by the time this picture was taken on February 22. Demolition work is expected to continue into April, leav-ing a large gap between the multi-storey office blocks of the Raiffeisenbank on its left and IBM on its right. It will be replaced by a 78-metre high skyscraper belonging to the bank , which bought the old Secretariat building in 2007.
Breaking with the past
Kei
th M
arch
ant
D L
avni
ck
Kei
th M
arch
ant

22
Several meetings are planned throughout the year
to discuss the LTS, which carries OPEC’s overall objec-
tives, its major challenges and possible future scenarios.
Incorporating extensive research and analysis, it was the
culmination of two-and-a-half years of work.
This year’s first meeting of the Deputy
Ministers — held on January 8 — was chaired
by Prince Abdulaziz Bin Salman, Head of the
Saudi Arabian Delegation, together with co-
chair, Dr Bernard Mommer, Venezuela’s OPEC
Governor.
The 137th Meeting of the OPEC Conference,
which endorsed the LTS, recommended that
it be reviewed every five years.
In September 2009, OPEC’s Ministers
decided to commence the review of the
LTS under the supervision of the Deputy
Ministers.
Deputy Ministers convene to reviewOPEC’s Long-Term StrategyOPEC Deputy Ministers of Petroleum and Energy met in
Vienna, in early January, to review OPEC’s Long-Term
Strategy (LTS), which was first adopted by the Conference
in September 2005.
Above: Prince Abdulaziz Bin Salman (c), Head of the Saudi Arabian Delegation, chaired the First Meeting of Deputy Ministers of Petroleum and Energy. He is seen here with Abdalla Salem El-Badri (l), OPEC Secretary General, and Dr Hasan M Qabazard (r), Director of the OPEC Research Division.
Above: OPEC Secretariat officials at the meeting — (l–r) Mohamed Hamel, Senior Adviser to the OPEC Secretary General; Fuad Al-Zayer, Head, Data Services Department; Angela Agoawike, Officer-in-Charge, Public Relations and Information Department; Alejandro Rodriguez, Head, Finance and Human Resources Department; Oswaldo Tapia, Head, Energy Studies Department; Safar Ali Keramati, Senior Refinery & Products Analyst; Dr Fuad Siala, Senior Alternative Sources of Energy Analyst; Nadir Guerer, Research Analyst.
Above: Delegates assembled for the first Meeting of the Deputy Ministers on January 8.
Se
cre
tari
at
Me
eti
ng
sO
PEC
bulle
tin
3/10

OPE
C bu
lleti
n 3/
10
2323
OPE
C bu
lleti
n 3/
10
The 133rd Meeting of the OPEC Board of Governors took place at the new Headquarters on February 23–24, 2010. Assembled here after their deliberations (l–r): Dr Hasan M Qabazard, Director, OPEC Research Division; Hamid Dahmani, Algeria’s Governor for OPEC; Dr Diego Stacey, Ecuador’s Governor for OPEC; Dr Omar Farouk Ibrahim, Nigeria’s ad hoc Governor for OPEC; Ahmed Mohamed Elghaber, SP Libyan AJ’s Governor for OPEC and Chairman of the Board of Governors; Abdalla Salem El-Badri, OPEC Secretary General; Siham Abdulrazzak Razzouqi, Kuwait’s Governor for OPEC; Dr Falah J Alamri, Iraq’s Governor for OPEC; Issa Shahin Al Ghanim, Qatar’s Governor for OPEC; Félix Manuel Ferreira, Angola’s Governor for OPEC; Seyed Mohammad Ali Khatibi Tabatabai, Iran’s Governor for OPEC; Dr Majid A Al-Moneef, Saudi Arabia’s Governor for OPEC; Dr Bernard Mommer, Venezuela’s Governor for OPEC. Ali Obaid Al Yabhouni, the UAE’s Governor for OPEC, was not present for the photo-shoot.
Issa Shahin Al Ghanim (pictured right), who has over 30
years of experience in the oil and gas industry, has been
appointed Qatar’s OPEC Governor.
Currently Director of Strategic Planning and Policy
at the national oil company, Qatar Petroleum (QP), Al
Ghanim received a BA in Political Science from Portland
State University, Oregon, in 1979 and then attained his
Master’s in Economics from the American University,
Washington DC, in 1987.
He joined the Ministry of Finance and Petroleum’s
Department of Petroleum Affairs in 1979 as an econo-
mist researcher and progressed to become Head of the
department’s Economic Section. His main responsibili-
ties comprised the appraisal of major oil and gas projects,
representing his government in negotiations with interna-
tional oil companies, and representing Qatar in various
OPEC and international forums and meetings.
Al Ghanim joined QP in 1990 as a Senior Economist
in the Corporate Planning Department and assumed the
responsibility of the department from 1993. His main
responsibilities were setting up the ‘Strategic Planning
System’ for the Corporation and advising the Managing
Director and the Board on business
strategies, plans, performance moni-
toring, as well as investment portfolios.
He was appointed Director for
Strategic Planning and Policy in charge
of the same responsibilities, plus alter-
native energies (nuclear and renewa-
bles), energy policy and trade in 2009.
A member of various QP senior
management committees, from 2003
to 2009 he served as Vice Chairman
of the Board of Directors (and Chief
Executive Officer) for the Qatar General
Electricity and Water Corporation
(Kahramaa), the sole buyer and distributor of power and water in Qatar.
He is currently Board Vice Chairman of the Qatar Electricity and Water Company,
the main power and water producing company in Qatar and a joint-venture partner in
all the Independent Power Producer (IPP) firms operating in the country.
Al Ghanim has published various papers in scholarly journals on oil and gas, as
well as on the economy of Qatar and other economies of the regional Gulf Cooperation
Council (GCC). In addition, he serves on the advisory council of the College of Business
and Economics at the University of Qatar.
New Qatari Governor appointed
First OPEC Board of Governors meeting at new Headquarters

24
Fa
rew
ell
After seven years of meritorious service at the OPEC
Secretariat in Vienna, Austria, Dr Omar Farouk Ibrahim
in February returned home to Abuja in his native Nigeria.
This followed the completion of his tenure as Head of
the Public Relations and Information Department (PRID).
Shortly before his departure, Ibrahim, in an interview
granted to the OPEC Webcast team, reflected on his time
at the Secretariat, describing his seven years there as a
“very challenging experience.”
He told moderator, Eithne Treanor: “Coming to OPEC,
meeting with the international press, organizing press
conferences, and attending to issues on oil, the oil mar-
ket and other matters affecting Member Countries … it
has been challenging, and very rewarding.”
Webcast service
Asked about the improvement in openness shown by
OPEC over the years, he said improving transparency was
one of the key issues he felt he needed to work on when
he came to the Organization.
“It has been a gradual process, but it has been decid-
edly conducted. The fact is, if we really want to be trusted,
we need to be seen to be saying the right thing and at the
right time. I am happy to say that we have really opened
up in the last seven years.
“Today, journalists come to OPEC because they
believe that what we say is right. We have no cause to
keep information from them,” he affirmed.
One of the activities Ibrahim said he was proud to
have initiated during his time at OPEC was the Webcast
service. This had proven to be extremely successful.
PRID Head completes OPEC term, joins Lukman’s office
Transparency,trust, key tomedia relations
Dr Omar Farouk Ibrahim, Head of OPEC’s PR & Information from February 2003 to February 2010.
OPE
C bu
lleti
n 3/
10

25
OPE
C bu
lleti
n 3/
10
“One of the key things we set out to do from 2003 was
to recognize that in the information age we really cannot
do without the technology that is available. We have to
harness the latest technology to enable us to efficiently
disseminate our message.”
And going by the response to this initiative, Ibrahim
has every reason to be proud of its introduction and addi-
tion as yet another valuable tool of information dissemi-
nation now at the Secretariat’s disposal.
He said that while OPEC now had its Webcast facility,
as well as its videos on demand service, it was not just
the electronic side that was important. There was also the
printing of publications, such as the OPEC Bulletin, which,
in recent years, had seen a high level of improvement in
quality, content and regularity, in addition to the aca-
demic journal, the OPEC Energy Review, which, in 2008,
was re-launched to enhance its profile and international
standing.
Improved dissemination
These, added Ibrahim, were in addition to a number of
other regular and special publications that came out of
the Secretariat every year.
“Putting all this together, you will find that we really
have changed in how we disseminate our information,”
he commented.
In referring to another example, Ibrahim noted that,
two years ago, the Secretariat launched its World Oil
Outlook publication. “Today, it is already one of the most
prestigious publications in the oil industry which peo-
ple in the business look up to. We used to have a report
long before that which was limited to the Secretariat and
Member Countries and, in line with our desire for open-
ness, we said that if it is that important, let us share it
with everyone. When we did that, people were initially
surprised, but I hope the Secretariat continues in this
vain in the future,” he said.
Ibrahim paid tribute to the work of the Secretariat,
stating that the kind of research it carried out was com-
parable with that of a number of key universities and
research institutes worldwide.
“We do not have as many staff and we do not have
as much in resources, but the way we run the Secretariat,
and particularly the Research Division, has enabled us to
come up with researches that compete favourably with
the other institutions and universities across the world.
We are really proud of that,” he said.
Asked about the oil market in general, Ibrahim said
Top: Ibrahim in his office at the new OPEC Headquarters in Vienna.
Above: Ibrahim during an OPEC press conference in 2005.
Left: Ibrahim in 2003 with Dr Rilwanu Lukman, Nigeria’s Petroleum Resources Minister.
26
OPE
C bu
lleti
n 3/
10
OPEC believed that stabilizing the oil market was not a
job that any one person, or organization, or country, could
do — it was a collective effort, an effort of the producers,
the consumers, the investors and even the press.
“At the end of the day, you can do everything, but if
some misinformation goes out, investors will react. If we
really want to stabilize the global oil market, then all the
parties that have an interest in it must consciously work
to do just that,” he stressed.
Importance of the press
Ibrahim also paid tribute to the press and media with
whom he had interacted with during his years at OPEC,
describing them as extremely important in getting the
Organization’s message across.
“In all seriousness, the press makes or does not
make the market. Decisions are made based on informa-
tion and that information is disseminated by the press.
One cannot run the oil market today without the press.
It performs a positive role, although it can also perform
a negative role.
“But how the reporting is made does determine how
the market reacts, positively or negatively. We talk about
speculation — the press plays a role in this whether we
like it or not. At the end of the day, we keep saying that if
various parties within the industry play roles that under-
mine the stability of the oil market, all of us will suffer,
including the press.”
Ibrahim used as another example the situation in
2009 when some members of the press could not attend
conferences and seminars because their firms had no
money in the budget.
“When the global economy goes into recession, it
affects everyone. Therefore, we have to understand that
we all have a stake in working to ensure that we do the
right thing and we report the right thing, which means
that we do not sensationalize when we should not,” he
added.
In this regard, he maintained that the members of
the press carried themselves well and took their respon-
sibilities very seriously.
So what of life after OPEC? Well, Ibrahim was happy
to report that his rubbing shoulders with the Organization
would not be ending any time soon.
He now has the responsibility of bringing his wealth
of experience to bear on the activities of Nigeria’s oil
industry as Communications Adviser to his country’s
Petroleum Resources Minister, Dr Rilwanu Lukman,
a former Secretary General of OPEC and Conference
President. That responsibility will surely bring him into
contact with OPEC affairs and future meetings.
Acknowledging the huge task ahead in his new
capacity, Ibrahim said: “I believe this will be a very big
challenge. The Nigerian oil and gas industry is going
through fundamental changes at the moment, changes
that we believe are necessary if the country is to move
ahead. We have some of the best personnel running
the industry, but we also feel we need to build a team
that can steer us through the restructuring that has just
been started.”
Going by his activities as Head of PRID, where he
restructured the department into three distinct teams —
Public Relations; Design and Production; and Editorial
and Publication — for the central purpose of achieving
the Secretariat’s objective of establishing and promot-
ing effective information gathering and dissemination,
it would be fair to say that team and capacity-building
are two of his strong points.
And it is this detail for organization, as well as his
leadership skills, that will stand him in good stead in
making a success of his new responsibility. His sense of
fairness and commitment to subordinates will also be an
asset in conducting his day-to-day affairs.
Away from practicalities, Ibrahim is grounded in the
Fa
rew
ell
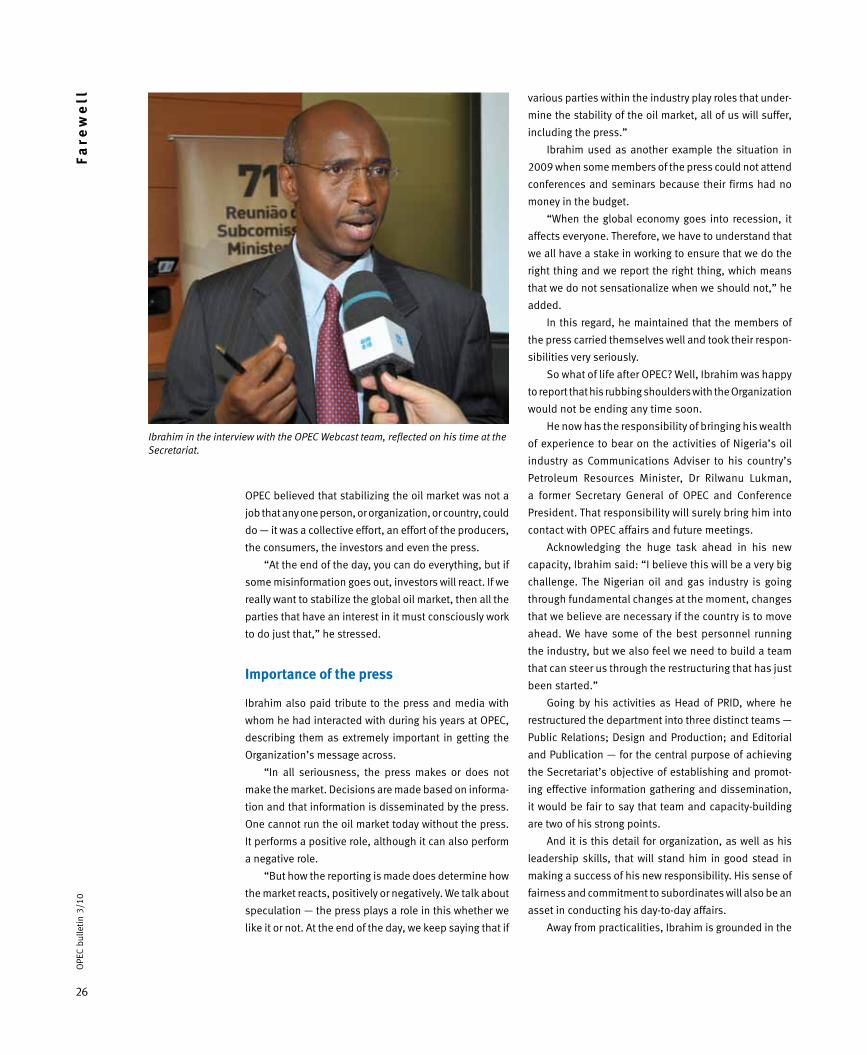
Ibrahim in the interview with the OPEC Webcast team, reflected on his time at the Secretariat.

27
OPE
C bu
lleti
n 3/
10
world of academics and journalism. He holds a PhD in
Political Science from the University of Rutgers in New
Jersey, in the United States, and taught for 19 years at
the Bayero University, Kano, Nigeria, before joining the
country’s oldest media establishment, the Daily Times
of Nigeria (DTN). At the DTN, he served variously as a
Member of the Editorial Board and General Manager of
its Northern Operations.
Before joining the OPEC Secretariat in 2003, Ibrahim
was the Managing Director of the New Nigeria Newspapers
and had also served on various Federal Government com-
mittees in different capacities.
Ibrahim is a devoted husband and father. All the
staff in PRID and those that knew him at the OPEC
Secretariat wish him well and even greater success in
his new assignment.
Left: Ibrahim with members of his team in the PR & Information Department (l–r): Diana Golpashin, Alaa Al-Saigh, Elfi Plakolm, Jerry Haylins, Martha Fischer, Siham Alawami, Andrea Birnbach, Angela Agoawike, Sally Jones, Keith Aylward-Marchant, James Griffin, Diana Lavnick, Ghada Sahab.
Above: OPEC officials bid farewell to Ibrahim. L–r: Oswaldo Tapia, Head, Energy Studies Department; Mohamed Hamel, Senior Adviser to the Secretary General; Angela Agoawike, Officer-in-Charge, PR & Information Department; Abdullah Al-Shameri, Head, Office of the Secretary General; Fuad Al-Zayer, Head, Data Services Department; Alejandro Rodriguez Rivas, Head, Finance & Human Resources Department; Dr Nimat Abu Al-Soof, Senior Upstream Oil Industry Analyst; Abdalla Salem El-Badri, Secretary General; Mohammad Alipour-Jeddi, Head, Petroleum Studies Department; Dr Ibibia Lucky Worika, General Legal Counsel.

28
OPE
C bu
lleti
n 3/
10In
terv
iew A bite with the Bulletin …
Professor Keywan Riahi — IIASA
This, the first in a series of
interviews with energy industry
professionals based in and
around Vienna, Austria, sees the
International Institute for Applied
Systems Analysis’ Professor
Keywan Riahi (pictured), tell the
OPEC Bulletin’s Steve Hughes
that there is still just about time
for us to ensure that our energy
future is sustainable.
t is a dank, miserable December morning when
Professor Keywan Riahi of the International Institute
for Applied Systems Analysis (IIASA) steps into Café
Schottenring — a capacious, elaborately ceilinged,
Viennese institution that has served Großer Brauner cof-
fees and more on the city’s ring since 1879 — for our inter-
view. His heavy schedule has not allowed for a lunch meet-
ing, so we have settled for a late morning coffee instead.
But it is not only the winter weather that is damp-
ening spirits — news journalists are doing what they do
best too; casting doom and gloom. Websites across the
world are reporting that the Copenhagen climate talks
are in disarray after leaked documents appear to show
world leaders will be asked to sign an agreement hand-
ing more power to rich countries, and sidelining the UN’s
role in all future climate change negotiations.
Professor Riahi seems to be in good enough spirits
though, as he hangs up his coat, brushes off a few drops
of rain and sits down across the table from me. He is off
to Copenhagen himself in just a few days to present a
paper on how to make short-term policies fit with long-
term climate change objectives: “Basically what needs to
be done over the next decades and how to achieve those
goals,” he explains.
Riahi joined IIASA in 1996 — “time passes fast”,
he tells me. He now leads its energy programme, which
focuses on figuring out how the world’s energy system
needs to evolve to meet future needs — and all this with-
out destroying the planet in the process. Currently, he is
working on a global energy assessment that examines
energy security, energy access and climate.
I ask if he is trying to predict the future. He does not
seem to like the word predict. “Okay, the best term might
be that we project possible changes in the future and
I
IIA
SA

29
OPE
C bu
lleti
n 3/
10
try to understand uncertainties and involved risks,” he
says, with heavy emphasis on the word ‘project’. “Then
we identify what sort of measures you can take to reduce
the risks and uncertainties,” he adds. “My work focuses
on the mitigation side — basically how do you restruc-
ture the energy system? Do you do it via efficiency? Do
you need carbon capture and sequestration? How about
renewables? What is the potential?”
A lot of his job, Riahi says, is about understanding
the inertia of the energy system when responding to the
need for reducing greenhouse gasses. This, he explains,
is due mainly to the long-lift capital stock: “Think about
power plants, think about transmission infrastructure —
they all have lifetimes of 40 to 60 years. We have to have
a better understanding of innovation processes and tech-
nology diffusion. You can conceptualize that with systems
and models and then you can describe the future.”
Monumental task
Riahi’s work has global implications; the energy pro-
gramme often advises national experts that, in turn,
advise their national governments: “We have collabo-
rations with India and with China who are very big play-
ers when you think about the climate change problem.
And they are, of course, interested to know what their
place is — what their strategic advantage is — given
the short-term need for reducing emissions and long-
term prospects.”
I am struck by the monumental task of his job and
ask if the responsibility weighs heavy on his shoulders.
“It does sometimes,” he says. “Sometimes the scientific
work is exposed to interpretations that you really do not
want, so you have to be very careful. Selected quotations
can be used again out of context and they get misunder-
stood. You want to avoid that in a field where how fast
we can address a problem actually depends a lot on the
perceptions of decision-makers.”
I ask what the global energy mix in 2050 needs to
look like. “It has to be much, much more efficient than
today,” he affirms. “Compared with today, per value
added of product that you produce, you would have to
use less than half of the energy.” I must frown, subcon-
sciously. “That is something that can be achieved,” he
says quickly. “Efficiency potentials are very, very big —
even in OECD countries.”
If intelligent design is used, new buildings should
not need to consume any energy at all. And they can be
built at no more expense than those constructed using
more traditional techniques, he contends. “You need
standards — strict standards about energy consumption
in new buildings. And you need to retrofit old buildings
so you do not have so much waste heat.”
It also has to do with lifestyles, he says. “There has
to be a change in people’s minds, so they understand ‘if
I take the bike or take the subway this has co-benefits —
important benefits’.”
I ask Riahi if he practices what he preaches.
“Sometimes,” he says, sheepishly. “I am travelling too
much. But of course I try.”
The headquarters of the International Institute for Applied Systems Analysis in Laxenburg, just outside of Vienna.
IIA
SA
30
OPE
C bu
lleti
n 3/
10In
terv
iew Unlike some scientists, Riahi does not try to bam-
boozle his audience with techno speak, even though he
has the obvious capacity. He stops himself once or twice:
“Sorry, that is probably too technical,” he says. Neither
does he pretend to have all the answers. When I ask him
about sustainability, for example, he admits that it is a
“very broad concept”.
Paradigm shift
He says it is difficult to identify what is really sustaina-
ble. “I think it has to do with how we use our resources
at the moment, how much we keep for future generations
and what transformations we do for the environment.”
To make the global energy system truly sustainable, he
says, there is a need to have a “real paradigm shift” that
includes lifestyle and behaviour changes that result in
reduced consumption, more efficient energies and new
types of technologies.
According to Riahi, this last point about new tech-
nologies is one of the key elements that will allow devel-
oping countries to increase the living standards of their
people without necessarily contradicting the global goal
of reduced emissions. He is a great believer that develop-
ing countries should do just that: develop. He talks about
‘equitable solutions’ to the climate change problem on
more than one occasion.
Development should be based on clean energy, he
maintains. “I think many of the emissions cuts, while
they create short-term costs, have long-term benefits,” he
explains. To get the ball rolling, the industrialized world
“will have to think about creating incentives in those
[developing] countries”.
But while he acknowledges a role for both financial
and technological transfers from rich countries to poor,
he also argues that the potential of the developing world
to help itself should not be overlooked: “There is a lot of
innovation going on in China that we have to acknowl-
edge.”
Striking the correct balance mostly boils down to effi-
ciency, he says. China, for example, “is very far away from
the efficiency frontier” and major improvements could
be readily realized by getting closer to this frontier. But
these improvements are capital intensive, and so they
are rarely implemented, he points out.
“So you could think about providing financial incen-
tives in Europe, the United States and Japan to pay for
some of those efficiency improvements, or to pay for
specific projects that would increase the deployment of
renewables, or carbon capture and storage (CCS), and
projects like that.”
Riahi sees CCS as a “bridging technology” that will
allow mankind to extend the period for which fossil fuels
can be used.
I ask him whether he would agree with OPEC’s view
that fossil fuels will remain an essential element in the
energy mix for the foreseeable future. “Yes,” he says.
“They will remain.” But to what extent depends on how
successfully alternative forms of energy are harnessed,
he says: “I think it would be very naïve to say, ok, we can
switch within 10 to 20 years to completely different sys-
tems.”
Whatever happens, CCS is vital, he says, but we
should not be supine about it: “The main question is
whether there will be sufficient research and develop-
ment (R&D) and deployment investment,” he argues.
Developments in OPEC Member Countries — the In Salah
project in Algeria, for example — are encouraging, but
we must prepare ourselves for something on an entirely
different scale.
He says: “CCS, large-scale, requires probably the man-
agement of the largest mass flow that has ever been seen
on earth,” his tone somewhere between a warning and a
threat. “You have to move gigatonnes; billions of tonnes
of materials through pipelines and then sequestrate it
somewhere. You need more than just Sleipner, Weyburn
and In Salah, and these few demonstration plants. This
needs to be massive to make a difference.”
And then there is the problem of public perception:
“The moment this is seen as waste management, I think
it will be almost impossible”.
Riahi orders a mélange coffee, and I order a mineral
water. I tell him I like the definition that his organiza-
tion gives of itself on its website. “Founded in 1972,” it
states, “IIASA is an international scientific institute that
conducts policy-oriented research into problems that
are too large or complex to be solved by a single country
or academic discipline.” I ask him whether an issue like
climate change can really be solved at all, and if so, how
far away we are from a solution.
He ponders for a moment. Dressed in a brown cordu-
roy jacket, with a blue shirt and striped tie, Riahi looks
more like a friendly schoolteacher than the workaholic
scientist that he admits to being. But since he holds a
part-time post as Visiting Professor of Energy Systems
Analysis at Graz University of Technology, Austria, per-
haps this is no surprise.
Unruffled by the scope of the question, he answers
31
OPE
C bu
lleti
n 3/
10
that in terms of understanding the climate change phe-
nomena and assessing the risks and potential conse-
quences, we have come a long way. It has become “more
and more clear that there are enormous risks of irrevers-
ible impacts,” he says.
Unfortunately, Riahi does not quite have the same
faith in the progress that has been made when it comes
to addressing the problem. “We are just at the beginning,”
he says. While he allows that some countries — he men-
tions Germany and Brazil specifically — have taken real
steps to introduce low-emissions technologies, others
have not.
He says that if the pace of change continues at its
present speed, the world is on a very dangerous path-
way. I start to ask if he thinks there is still scope to pre-
vent some of the more potentially calamitous effects of
climate change if the world gets it right in Copenhagen.
“Of course there is scope,” he says, before I can finish.
“But there is not much time left for real drastic measures.”
Riahi, who since 1998 has served as lead author
to various Intergovernmental Panel on Climate Change
assessment reports, argues that climate change is not
the only — nor even the most pressing — issue on the
energy agenda. “If you asked me about the ranking of
the priorities, I would say energy access might have the
highest priority,” he says.
Smoke signals
While carbon emissions continue to generate global head-
lines, energy poverty, in comparison, is the poor relation
in terms of exposure; the elephant in the room that peo-
ple keep walking around. “There are two billion people
relying on traditional biomass with all its health conse-
quences. That is a problem that needs to be solved very
rapidly, very short-term,” he says.
A recent article in the New Yorker magazine elucidates
his concerns, rhapsodically: “Wood smoke, as sweet as
it smells, is a caustic swirl of chemical agents, including
benzene, butadiene, styrene, formaldehyde, dioxin, and
methylene chloride. Every leaf or husk adds its own com-
pounds to the fire, producing a fume so corrosive that it
can consume a piece of untreated steel in less than a
year. The effect on the body is similar.”
One of the article’s interviewees claims that a map
of the world’s poor is easy to draw up: “Just follow the
smoke,” he says.
Energy poverty results in more than 1.5 million pre-
mature deaths annually, mainly for women and young
children, who receive the highest exposure, says Riahi:
“If you compare in financial terms what it requires to cre-
ate access [to energy], the money that you need is very,
very small compared with fundamental changes to the
system that you need for climate change.”
I ask Riahi what he thinks the biggest obstacle to tack-
ling the energy access problem is. “It is not a technology
issue,” he says. “We are not calling for high-tech tech-
nologies. Mostly even, the technological knowledge is in
the countries.” Rather, he says, it is an attention issue.
An attention issue
Policies have to be introduced, he explains, that some-
how enable poor people to afford fuel and appliances
to cook on — micro financing perhaps. While there is a
role to play for energy aid and the international com-
munity — “What you probably would need is some lev-
erage funding, some seed funding from the developed
world to initiate the process,” — Riahi believes that
things really need to start happening on the ground in
the countries where the problem exists: “It is absolutely
an attention issue.”
We are fast approaching the end of our interview. Riahi
says he needs to be away by 12.30 pm and the increas-
ingly cacophonous babble of fellow customers signifies
the lunchtime rush has already begun. The café’s impres-
sive tank-like coffee machine has begun to steam and hiss
almost incessantly. But I feel the need to ask a closing
question — one that tries to make sense of all the discon-
nected threads of our conversation so far. What should
we do to make the future sustainable, I ask.
“We need massive changes in investment flows,” he
answers. “The up-scaling of R&D expenditure and more
innovation. Almost all of the projections suggest that
you have to double energy investment over the next few
decades. And we have to address the attention problem
too.”
So, if we have the will and focus on a global scale,
we can still do it, I say.
“Right,” he says. “Science even shows us that the
cost of doing it is relatively modest, particularly compared
with the long-term benefits. But the challenge is that we
need to do it comprehensively, basically everywhere in
the world.”
If we get it all wrong, do the possible resulting sce-
narios frighten him, I wonder.
“I think frighten is the wrong word,” he says. “We are
worried, but not afraid.”
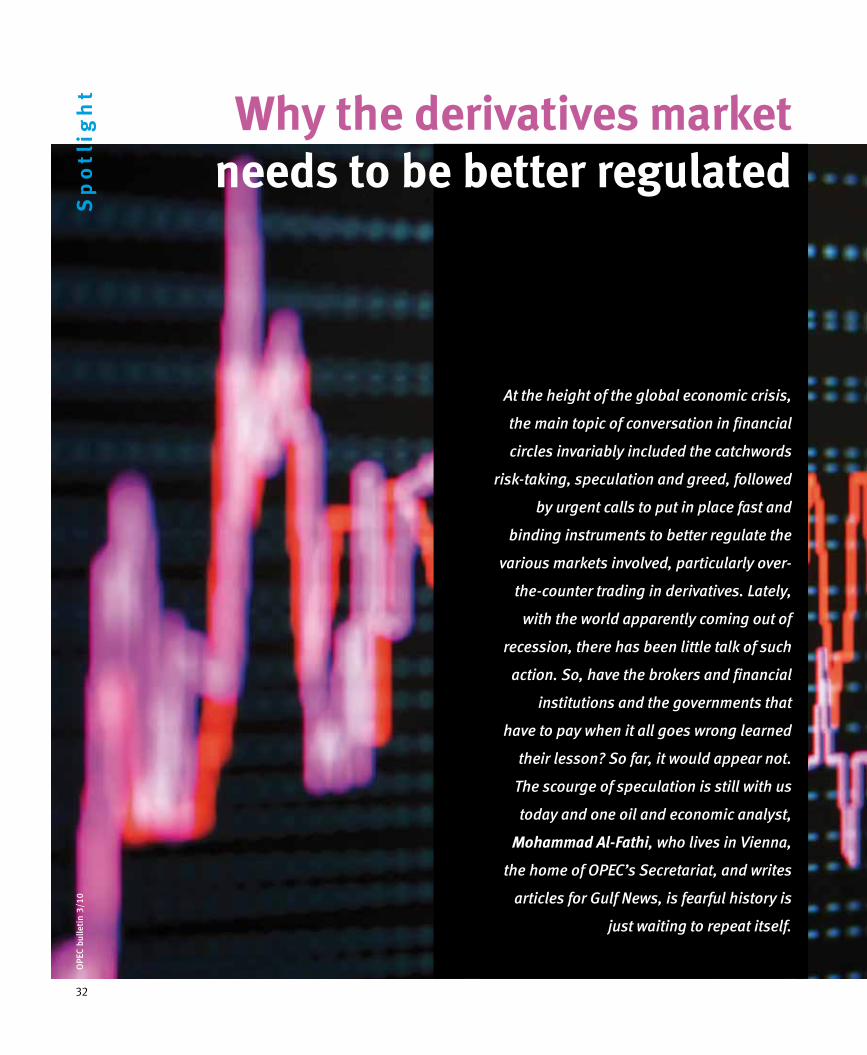
32
OPE
C bu
lleti
n 3/
10S
po
tlig
ht
At the height of the global economic crisis,
the main topic of conversation in financial
circles invariably included the catchwords
risk-taking, speculation and greed, followed
by urgent calls to put in place fast and
binding instruments to better regulate the
various markets involved, particularly over-
the-counter trading in derivatives. Lately,
with the world apparently coming out of
recession, there has been little talk of such
action. So, have the brokers and financial
institutions and the governments that
have to pay when it all goes wrong learned
their lesson? So far, it would appear not.
The scourge of speculation is still with us
today and one oil and economic analyst,
Mohammad Al-Fathi, who lives in Vienna,
the home of OPEC’s Secretariat, and writes
articles for Gulf News, is fearful history is
just waiting to repeat itself.
Why the derivatives marketneeds to be better regulated
OPE
C bu
lleti
n 3/
10
33
OPE
C bu
lleti
n 3/
10
As a child, I always disliked the story of ‘The Emperor
has no clothes’, simply because I could not understand
how any king would believe in seeing something in noth-
ing and why it would take a child to state the obvious.
Little did I know that the questions I thought of then, I
would ask again now to better understand the causes
of a financial crisis.
Unfortunately, there are still so many disagreements
concerning what actually needs to be done now that we
have seen the results of lax regulations. It is difficult to
see how anything will change anytime soon. For instance,
speculation driving up oil prices for some is a clear cut
case, but others might beg to differ.
It has been more than a year since the world’s finan-
cial and economic problems reached a crescendo, but
until now no meaningful regulation has been introduced
to regulate over-the-counter (OTC) derivatives trading,
which was thought to be a main contributing factor to
the crisis.
In truth, there were a number of causes for the eco-
nomic troubles. However, it is safe to say that the deriva-
tives market was one of the main contributing factors to
the crisis, or at the very least exacerbated it. It is also a
fact that this market needs to be regulated, yet the talk
about bonuses has trumped and deflected that of regu-
lating speculation in OTC derivatives.
It should be noted that OTC derivatives cover a whole
range of financial products, most notably subprime
mortgages, so the financial system as a whole needs
to be looked at, since so many sectors are involved.
Unfortunately, the proposals that are being presented
seem to be more about blaming bankers, rather than
making sure that what happened between 2007 and
2008 does not occur again.
There are a number of reasons why there has been
so little change in the regulatory framework, but there
is one in particular that should be always borne in mind.
Government tax revenues have fallen and should the
financial sector and especially speculation be properly
regulated they would slump even further. And at a time
when governments have chosen to increase their debt
commitments to unprecedented levels to pay for eco-
nomic stimulus packages, tax revenues have become
more crucial than ever. How much of a loss in revenue
politicians are willing to stomach will probably end up
defining the regulations that do eventually get imple-
mented.
One of the stumbling blocks concerning the workings
of OTC markets and how better to regulate them, is that
it is difficult to get a straight answer from market partici-
pants. This is especially the case when considering value
at risk (VaR) and mark-to-market (MtM) calculations, since
the individuals involved show a great amount of creativity
in valuing their deals before the actual end date and final
value. Nothing is written in stone. It is up to the individ-
ual risk management teams of every company to define
how they will use VaR and MtM and this will vary greatly,
especially when considering different types of derivatives.
Whether this is true or not is irrelevant since the facts
speak for themselves. OTC deals were meant to help com-
panies hedge against price fluctuations in, for example,
oil prices, or shipping rate movements. But, in practice,
they became a way to make enormous amounts of money
with little effort. Some of the deals were not being dealt
on an exchange and did not need to be registered with
the Securities and Exchange Commission and no one
realized how much risk they were actually holding.
Pool of money created
Since the late 1990s, low interest rates and little or no
regulation helped create a pool of money the financial
institutions, especially hedge funds, were more than
willing to tap into and speculate with. To make mat-
ters worse, the internet brought in a huge amount of
money through broking accounts held by private indi-
viduals, which professional brokers were able to take
advantage of.
Now that the crisis has somehow passed, or at least
abated, these same companies are back doing what they
did before and the respective governments, who talked
about the need to regulate their activities, are seemingly
more than happy about the prospect of increasing tax rev-
enues through this avenue. Of course, activity in finan-
cial markets has dropped markedly. Some banks have
chosen to reduce speculative activity and concentrate on
traditional bank services, and some of the hedge funds
no longer exist, but that is not as a result of regulation.
Instead of concentrating on what actually happened
and what could be done to minimize future fluctuations,
discussions always seem to be about the role of ‘evil’
bankers, even though the central banks and their gov-
ernments played a crucial role as well. While things were
going well the latter two were more than happy to take

34
OPE
C bu
lleti
n 3/
10S
po
tlig
ht the credit for the good economic times without looking
at the obvious signs that the economy was overheating
and the banks were overleveraged. Instead of looking for
solutions to the problems, they have chosen instead to
look for scapegoats. A perfect example of this is when
oil prices reached record levels and they began to blame
OPEC, rather than the speculative activity affecting the
oil market.
Indeed, OPEC was a target at the time when many com-
modity prices were rising, because it was easy to point
the finger at a group of developing nations. Interestingly,
it was not possible to blame anyone for the higher prices
seen in other commodities because no large grouping
existed that represented a significant amount of produc-
tion for any one of them.
In the past year, govern-
ments have begun to take
heed of what OPEC has been
saying. But this situation
could very quickly change
should crude prices rise
again. For example, instead
of commending OPEC for its
actions in preventing a total
collapse in the price of oil,
which would obviously hurt consuming nations as well
as the producers, and affect environmental efforts, they
would blame OPEC by pointing to its lower than potential
production by Member Countries.
It is unnecessary to understand the complexities of a
particular market when you can blame an organization of
wrong doing every time prices rise. And it is easier to do
this than confront the real problem and try to introduce
regulation that could alleviate some of the price volatility.
Had OPEC Member Countries earned more through
higher oil prices than the oil-consuming countries through
the taxation of both paper and physical markets for oil
and oil products, then those same governments would
surely have moved quickly to crack down on speculation.
It is now obvious for everyone to see that the emperor
really does not have any clothes. Governments and insti-
tutions have done their best to protect a sector they have
learned to depend on for the past ten years — and should
they choose to make any fundamental changes it would
put further pressure on economic growth and, as a con-
sequence, growth in government revenues.
The recent gains made in the major indices, such as
the S&P 500, were mainly due to banks’ share prices ris-
ing again because of the recent profits they made partly
with speculative trading activity. These same banks, some
of whom would not exist today if it had not been for their
respective governments coming to their rescue, actually
handed out more bonuses than at the same time last year.
They have justified their actions by saying that they
would lose their best people if they were not to make the
payments. But this beggars the question how talented
can these people be when they effectively managed to
lose so much money and needed government help just
a few months ago to bail them out?
In 2007, British Prime Minister, Gordon Brown, made
a speech in which he declared: “It’s the golden age of
London.” Until then, he had been Chancellor of the
Exchequer for about ten years and this statement accu-
rately describes the kind of mindset he had while making
decisions about future spending plans. Government tax
revenues had been rising steadily every year, mainly as
a result of the financial sector in London, and he had
been spending generously to ensure the Labour Party’s
popularity.
Unfortunately, he also took these revenues as being
part of the permanent financial landscape and even sold
the United Kingdom’s gold reserves. In the immediate
aftermath of the financial crisis, tax revenues dropped
by 25 per cent and, to make matters worse, the country’s
debt levels rose to record highs.
The national debt rose to £845 billion in November
2009 from £706bn a year earlier and equivalent to 60.2
per cent of the UK’s gross domestic product. With such
huge levels of debt and a massive drop in revenues, it is
crucial for the government to get the financial sector mov-
ing again. Whatever announcements they may make about
regulation, the fact is that while the going was good they
encouraged banks to lend more and take greater risks.
Misleading
Some governments, such as those in the UK and the
United States, argue that regulation needs time to be
enacted and it should not be done in haste. However,
this is a misleading statement. It is true that it takes time
to conceive and shape new laws, but a big chunk of the
work was already done before most people had woken
up to the dangers of OTC deals.
Under the leadership of Brooksley Born between 1996
and 1999, the Commodity Futures Trading Commission
(CFTC), the US federal agency which oversees the futures
and commodity options markets, tried to introduce a set
of laws to govern OTC derivatives trading.
“OPEC was a target at the time when many commodity prices were rising, because
it was easy to point the finger at a group of
developing nations.”
35
OPE
C bu
lleti
n 3/
10
But Born’s concerns were dismissed, the draft pro-
posals for new laws shelved and the US government, with
the support of congress, opted for self-governance.
In 1999, the government and congress took one step
further and repealed the Glass-Steagall act, which was
introduced after the Great Depression to limit the conflicts
of interest created when commercial banks are permitted
to underwrite stocks or bonds.
The new creed was “the markets will take care of them-
selves” and even after the financial crisis this mentality
will still be difficult to change.
Cheap money
The financial sector played a crucial role in the economic
growth we saw in the past ten years. You could say that
the central banks provided the cheap money, while the
banks lent it out. Even in the bailout we got to see this
again with the central banks providing money at zero per
cent interest, which the banks then lent out at three to
four per cent interest. There is a symbiotic relationship
between banks, central banks and governments that can-
not be undone because economic growth, private and
public spending, depend on it.
This might have always been the case, but this rela-
tionship became much more crucial in the recent past
because of the way economic growth was fuelled with
cheap money from central banks. And some of this cheap
money helped speculation reach the magnitude it did.
The oil market is a good example of the kind of price
movement speculation can create. The average price of
the OPEC Reference Basket in 2004 was $36.05/barrel
and increased to well over $140/b in July 2008. Although
economic growth was strong at the time, supply was more
than adequate to meet demand, so fundamentals alone
cannot explain such a large increase in price.
When oil futures became part of the New York
Mercantile Exchange (NYMEX) in the mid-1980s, WTI pro-
duction was about 1.5 million barrels/day and the traded
paper volume reached 10m b/d. This increased to 100m
b/d by 2003 and 600m b/d by 2008. When one considers
that total oil demand at the time was about 83m b/d, it
puts into perspective how much speculative activity there
was when oil prices reached record highs.
In theory, US President Barack Obama’s administra-
tion has all it needs to move forward. The CFTC presented
a proposal for limiting speculative deals on commodities
on January 14, but these limits are close to what trading
volumes are right now, so they will not make much of a
difference. The problem with introducing more vigorous
laws is that the same arguments that brought about dereg-
ulation in the first place are being presented once again.
The banking lobbyists in Washington have been
trying to put a stop to any new regulations, or at least
make them irrelevant. Regulation, we are told, will sty-
mie economic growth and the current recovery is too
fragile to be introducing new laws. These arguments do
have some merit, but there are problems that need to
be addressed before another financial crisis is created.
It is in times of crisis when meaningful new laws can
be put into effect because by the time conditions improve
the need for more regulation becomes less immediate.
There is also another dimension that most people fail
to consider which is that
economic tools, such
as interest rates, are
blunt instruments that
are more about sending a
signal, rather than man-
aging the economy with
precision.
For example, it takes
two years for the effect of
an interest rate change
to filter through to the
economy, but it has an immediate effect by letting peo-
ple know what the central bank is thinking.
According to this then, should governments make
it clear that they are planning to and will regulate the
financial markets more thoroughly, then before the laws
are even introduced market participants will know they
should temper their trading activities?
However, this did not happen in the past 12 months
and only now has President Obama finally come out and
said exactly what he wants to do. But House Financial
Services Committee Chairman, Barney Frank, said it
would probably take three to five years to enact these
proposals, if at all. Not only that but Obama’s announce-
ment was about proprietary trading done by the largest
banks, which includes stocks, bonds, options, commodi-
ties and derivatives. However, what the direct trading
banks do for themselves is insignificant when looked at
in a larger context because everyone else will be able to
continue with their activities, including smaller banks
and hedge funds. As things stand right now, the largest
banks might have to stop proprietary trading, but will
still be able to service their customers and continue to
act as deal makers.
“The bonus culture encourages traders to take risks with other people’s money and if, in any case, governments come to the rescue, as they have done, then why not?”
36
OPE
C bu
lleti
n 3/
10S
po
tlig
ht In 1998, Long-Term Capital Management (LTCM) was
a US hedge fund which needed a massive bailout, similar
to the ones we saw recently. The Federal Reserve helped
broker a deal whereby 14 banks would contribute the
monies needed to save the fund.
LTCM survived until 2000, but for years before it
was one of the most sought after funds. Its annualized
returns were much higher than other funds when it first
began trading until, in 1998, it steadily declined and lost
$4.6bn in less than four months, following the Russian
financial crisis.
In the aftermath of LTCM, there were some calls to
regulate the derivatives market the fund was engaged in,
but nothing was done as economic growth quickly recov-
ered. The thinking became
— why tamper with some-
thing that is working so
well? But if one was to read
the articles about LTCM,
one could easily change
the dates and names and
use them to write about
the financial crisis in 2008.
There is nothing new in
what happened two years
ago — it was just much big-
ger and faster than what we
have seen before.
If those in the financial
sector had truly believed
that major changes would be put into effect then they
would not have handed out the bonuses they did in the
current economic climate. But they have shown no signs
of caution, which goes to show they do not believe they
have anything to be wary of.
Bonuses are a major contributing factor to specula-
tive activity — and wrong-doing in general in the financial
sector — because they are based on the transactions the
traders make. Why should traders care if the deals they
reach cause economic troubles down the line if they can
collect a 10–20 per cent bonus at the end of every year?
The bonus culture encourages traders to take risks
with other people’s money and if, in any case, govern-
ments come to the rescue, as they have done, then
why not?
Of course, some firms have changed their bonus poli-
cies, but they have made it clear that, with or without reg-
ulation, they will still find a way to pay their employees
what they deem is appropriate and necessary.
In some of the cases we have learned about there
was seemingly no risk management team operating. In
theory, a trading company, arm or department would have
a risk management team that monitors the exposure of
the company to keep it within a certain limit it can afford
to lose.
But AIG, for example, was engaged in bets that
dwarfed its reserves. In fact, the standard way of operating
since the bankruptcy of Barings Bank in 1995, whereby
the middle office would watch the front office and the
back office would watch everyone, seemed non-existent
in the US.
To make matters worse, the VaR analysis and MtM
valuations, which were supposed to help companies
monitor their positions masked a huge amount of risk.
Speculative activity had reached such an extent by
the end of 2008 that it blurred the lines of who was who
and what was what. Shipping firms, insurance companies,
supermarkets, airlines, to name just a few, created trad-
ing arms and began trading in OTC derivatives because
they were the most lucrative.
Trading strategies
These deals had absolutely nothing to do with hedging
and, in certain ways, these companies had little or no
knowledge about the markets they were speculating in.
There activities were more about trading strategies backed
up by software enabling automated transactions, trig-
gered by particular price points and movements, rather
than analyzing the fundamentals of a particular market.
Unfortunately, this sort of behaviour began spread-
ing to other sectors, most notably the housing market.
The collapse of Freddie Mae and Freddie Mac in 2007
should have sent warning signals to everyone that there
were multiple bubbles operating at the same time and
something had to give.
It is no coincidence that the rogue financial adviser
and former NASDAQ chairman, Bernard Madoff, began
preparing to turn himself in at the beginning of 2008,
anticipating that his clients would have to liquidate
their assets.
These blurred lines are now making it very difficult
to define new regulations. Because so many companies
are involved in speculative activity, it is difficult to devise
a ‘one-fits-all’ policy. For example, airlines deserve an
exemption and should be allowed to speculate.
In retrospect, the collapse of LTCM and the efforts
of the CFTC in the 1990s is a microcosm for what is hap-
“... there needs to be a genuine concerted effort by all major
governments around the world to curb speculative
activity because any regulatory framework set up by only one
country will drive companies to other nations and undermine
the competitive position.”
37
OPE
C bu
lleti
n 3/
10
pening now. History seems to be repeating itself and, as
stated above, should oil prices rise again, then instead
of blaming speculative activity, governments would
probably use OPEC as the rationale for why prices have
risen again.
The fact is there needs to be a genuine concerted
effort by all major governments around the world to curb
speculative activity because any regulatory framework
set up by only one country will drive companies to other
nations and undermine the competitive position. If coun-
tries come together to agree on regulating OTC derivates,
then that is the only way it can work.
Until now, all that the various G7, G8 and G20 meet-
ings have proven is that every country is pursuing its own
national interests. The French and German governments
are keener on more regulation, because they have less
to lose than the Americans and British.
But by not even being able to agree on a common
policy regarding bonuses, it is hard to imagine how they
can agree on laws that would satisfy everyone. As long
as the derivatives market is allowed to operate under the
current regulatory framework no one should be surprised
when another financial crisis comes around.
President Obama has said that introducing new regu-
lations regarding the financial system is his top domes-
tic priority. Yet it remains to be seen what legislation will
actually be enacted.
In truth, he may have missed his window of opportu-
nity, especially when one considers all the other issues
he has been trying to work on.
Congressional hearings about regulating the finan-
cial sector have begun in the US, but it will take a year for
these to be completed and their recommendations to be
handed in. So, regarding laws that these hearings might
produce, the earliest they could be formulated is 2011,
and the burning question is, will any be enacted at all?
At the same time, another worrying factor is there
still seems to be disagreement concerning the effects of
speculation, not only amongst the media and analysts,
but also amongst lawmakers.
Although the CFTC wants to curb trading regarding
oil and other energy futures, its economic team does not
believe there is a relationship between speculation and
high commodity prices.
A review of this particular work was done to make sure
it was not politically motivated since it had been done
under the previous administration, but it was not found
to be wanting.
It is not just the CFTC’s economic team that does not
think speculation can drive up prices — its British equiva-
lent is saying similar things. So what if speculation does
not cause high prices, but helps to trigger them? This is
something akin to having a small wave in the water that
just gets bigger and bigger.
For example, the people who do not believe that
speculation causes high prices say: “Speculators follow
prices, but do not set them.” That is actually true because
that is how speculative traders’ strategies work.
Speculative activity
Then let us say that physical oil traders are following
the news and the supply situation in the Middle East
and they happen upon a development that, potentially,
could result in oil prices moving higher. Speculators
jump in to take advantage and the development gets
more pronounced than justified. As a result, prices soar.
So, even if you limit the speculation, it will still not have
the desired effect, since the trading volumes needed to
cause a frenzy are small.
There is also another way to look at it. What if specu-
lation in commodities is not what is driving up oil prices?
What if it is speculation in other markets that make the
price of oil go up, even though the supply and demand
fundamentals do not justify it?
For example, if there is intense trading activity else-
where people begin to think that there is real economic
activity and, as a result, the price of oil goes up. So
here again you could say, within reason, that specula-
tion did not cause prices to rise. There is a big divide
between people who believe speculation is responsi-
ble for high oil prices and those who do not — and it
needs to be bridged.
Whichever way one decides to look at it, or define it,
the derivatives market is having a destabilizing effect in
one way, or another. Unfortunately, it is difficult to see
how heads of government and agencies responsible for
introducing the necessary regulation can convince law-
makers to adopt more stringent regulations when their
own economic teams do not believe in them.
The limits the CFTC proposed are a start, but they are
not as stringent as many had hoped for. It is also unwise
to let out a sigh of relief just because action is being
taken for commodities and nothing else. The regulatory
framework, as a whole, for the financial sector needs
to be updated to accommodate the arrival of derivative
speculation backed up by huge sums of money, complex
software and very powerful IT infrastructure.

38
OPE
C bu
lleti
n 3/
10N
ew
sli
ne
Kuwait, one of the Founder Members
of OPEC, has celebrated two signifi-
cant anniversaries in its oil sector in
as many months.
In the third week of January, the
Kuwait Petroleum Corporation (KPC)
chalked up its 30th anniversary,
while almost exactly one month
earlier, its subsidiary, the Kuwait
Oil Company (KOC), celebrated 75
years of operations.
The two milestones are signif-
icant for a country that has seen
its oil sector boom over the years
with even greater things promised
in the future, in line with Kuwait’s
ambitious development plans. Oil
is regarded as the pulse of the
national economy and both KPC
and KOC play vital roles at the heart
of the country’s operations.
“Since its establishment, KPC
has embraced the slogan ‘per-
formance through integration’,
fulfilling integration, while carry-
ing out its operations,” Saad Ali
Al-Shuwaib, the state firm’s Chief Executive Officer,
commented in marking the anniversary.
“It has shouldered the responsibility of developing
the oil industries in Kuwait through a series of operations
aimed at adding value at every stage, commencing from
drilling and refining oil, all the way up to the process
of selling to customers,” he wrote in a dialogue in the
Corporation’s monthly newsletter, KPC News.
In his comments, Al-Shuwaib paid tribute to
KPC’s workers, stating that the international fame the
Corporation had gained over the past three decades was
the result of their tremendous efforts, while confronting
the challenges.
“We have managed to accomplish several achieve-
ments; however, we look forward to fulfilling more accom-
plishments since we will confront challenges that will
require us to devote and double our efforts, in order to
put KPC’s status in its rightful high regard among inter-
national oil companies,” he added.
Kuwait celebrates national oil success Al-Shuwaib disclosed that through the efforts of the
Corporation, Kuwait was now capable of producing 3.15
million barrels/day of crude oil, in accordance with the
needs of the market.
KPC was established on January 21, 1980, five years
after the nationalization of the Kuwaiti oil sector.
As Al-Shuwaib pointed out, its incorporation was
aimed at unifying the activities of the oil sector, as well
as “confronting and surmounting any international chal-
lenges and facing necessary changes.”
KPC today effectively acts as an umbrella organiza-
tion, managing all aspects of the country’s oil and gas
operations, including onshore and offshore upstream
exploration, production and refining, marketing, retail-
ing, petrochemicals, as well as marine transportation.
It strategically coordinates and supervises the various
group subsidiaries, finances their operations and over-
sees the marketing of crude oil, refined products and gas
in foreign markets.
The Corporation also provides significant support
to the Kuwait Ministry of Oil in its dealings with other
Member Countries of OPEC.
To support its international business interests, KPC
has several regional marketing offices that are strategi-
cally located across the globe. These offices effectively
Sheikh Ahmad Al-Abdullah AI-Ahmad Al-Sabah, Kuwait’s Minister of Oil.
The Emir of Kuwait, Sheikh Sabah Al-Ahmad Al-Sabah.
Reu
ters

39
OPE
C bu
lleti
n 3/
10
contribute to the sales and marketing operations of KPC
and its subsidiaries, in line with its short-term and long-
term strategies.
Their scope of work includes regional market analy-
sis, establishing and maintaining relations with other key
oil players, increasing KPC’s share in existing markets,
as well as entering new areas.
Meanwhile, during KOC’s celebrations on December
22, 2009, which were led by the Emir of Kuwait, Sheikh
Sabah Al-Ahmad Al-Sabah, the company’s Chairman and
Managing Director, Sami Fahad Al-Rushaid, told a press
conference that the founding of the company in 1934 was
a turning point in the modern history of Kuwait.
He pointed out that the firm had been the driving
force behind many significant events that resulted in the
transformation of the country. Any mention of the con-
temporary history of Kuwait inevitably involved KOC, he
affirmed.
Al-Rushaid said it was difficult to sum up the compa-
ny’s long history in just a few words as its contributions
were numerous and diverse. It was suffice to say that the
firm contributed to 90 per cent of the national economy.
He added that KOC still faced challenges and difficul-
ties, but such obstacles had not hindered it from making
achievements, due to the dedication of its management
and staff.
He highlighted the determination of the company to
press ahead with the implementation of its ambitious
strategy which involved boosting the country’s oil pro-
duction capability to 4m b/d of crude and two billion
cubic feet of gas daily.
Minister of Oil, Sheikh Ahmad Al-Abdullah AI-Ahmad
Al-Sabah, said KOC was distinguished by the pivotal role
it played in increasing prosperity and contributing effec-
tively towards the country’s rapid development.
Thanks to KOC, he said, the country had gained prom-
inence, both regionally and internationally, adding that
the country’s oil wealth and the remarkable transforma-
tion that followed had encompassed all aspects of life.
KOC’s celebrations were held in the Ahmadi district
of the country, where the company was established. They
included the staging of a national operetta and the release
of a documentary film, which depicted historical events
that took place in the country from 1911 to the present.
The film shows the signing of the first exploration
agreement in 1934, the subsequent
discovery of oil in the Burgan field
four years later, and the export of
Kuwait’s first crude shipment in
1946.
KOC is responsible for explora-
tion, drilling, and production of oil
and gas in Kuwait, as well as the stor-
age of crude and delivery to tankers
for export. It was set up by the then
Anglo-Persian Oil Company (now
British Petroleum), and the Gulf Oil
Corporation (now Chevron).
The Kuwaiti Government took
over the running of KOC in 1975, dur-
ing nationalization, and five years
later it came under the umbrella of
KPC.
Under its ‘2020 Strategy’, KOC
is mandated to further develop
Kuwait’s hydrocarbon reserves,
infrastructure and operational capa-
bility to best meet market opportu-
nities.
Emphasis is being given to
the more technically challenging
reserves located in the north and
west of Kuwait, while maintaining
the production capacity already
established in the southern and
eastern areas.
Kuwaiti authorities have stipu-
lated that given the demand scenar-
ios forecast for the future, the coun-
try must increase its oil production
capacity to maintain market share.
It is also felt that the company
must maximize the exploration,
development and production of eco-
nomic non-associated gas to meet
its growing energy requirements.
This would also provide an environ-
mentally friendlier source of energy,
while reducing dependency on gas
imports.Sami Fahad Al-Rushaid,Chairman and Managing Director of KOC.
Saad Ali Al-Shuwaib, KPC’s Chief Executive Officer.
KO
C
Reu
ters
40
OPE
C bu
lleti
n 3/
10
OPEC has been praised for its policy actions in helping to
stabilize the international oil market and reducing global
petroleum stocks.
Marco Dunand, Chief Executive Officer and founder
of the Swiss-based Mercuria Energy Group, was quoted
as saying that the Organization had “done a good job”
in balancing the oil market over the last 18 months.
By reducing production, it had helped to reduce oil
stocks.
In 2008, OPEC decided to cut its output ceiling by
4.2 million barrels/day to help mop up excess supplies
in the marketplace that had forced crude prices down to
a low of below $33/b.
“Global oil stocks around the world have started to
reduce since OPEC took that decision to reduce produc-
tion. Stocks are lower now than they were three or four
months ago and contangos are shallower,” Dunand said
in the interview with Reuters.
“We believe that situation will run through 2010. So,
while we still anticipate the contango will last for this year,
we expect it to narrow to where it will not be wide enough
to justify ships storing oil,” he maintained.
Stocks decreasing
Dunand was first quoted in June last year as saying that
the December 2008 move by OPEC to cut production had
helped reduce the demand-supply imbalance, although
the impact on the market had been slow.
“It takes time to feed through the system,” he said at
the time. “The contangos of today ... are nowhere near as
OPEC has “done a good job” in balancing oil market
wide as they were at the back end of last year when we
had massive excess. So that means we are working our
way through the inventories.”
Dunand predicted that as demand picked up “you
are going to see those stocks gradually decreasing. And
unless OPEC increases its production very quickly, we are
going, eventually — coming into the fourth quarter and
first quarter of 2010 — to start eating into those stocks
quite aggressively.”
In his latest comments, Dunand said the volume of
crude oil stored at sea had fallen considerably since the
middle of last year when as much as 150m b — almost
two days of global oil supply — was in floating storage,
much of it off the coasts of the United Kingdom and the
United States.
“It is obvious that it has diminished a lot versus four
to five months ago,” Dunand noted. “I would think that at
least half and possibly up to three-quarters of the crude
previously held on ships has disappeared and has been
absorbed by the market.”
Dunand forecast that prompt oil prices were likely
to keep their discount to futures until 2011, but the gap
should narrow and traders could consider locking in cur-
rent spreads.
“Like most people we are medium to long-term con-
structive towards prices,” he added.
The Mercuria group of companies is one of the world’s
five largest independent energy traders. It is active over a
wide spectrum of global energy markets, including crude
oil and refined products, natural gas, power, coal, biodie-
sel, vegetable oils and carbon emissions.
Ne
ws
lin
e

41
OPE
C bu
lleti
n 3/
10
The SP Libyan AJ has earmarked up to $6 billion in spend-
ing in 2010 as part of efforts to expand the country’s oil
production capability to at least 2.5 million barrels/day
in five years’ time.
The budget is around $1bn more than that agreed
for the last financial year, due to the fact that new fields
need to be developed.
Dr Shokri M Ghanem, Chairman of the Management
Committee of the National Oil Corporation (NOC), was
quoted as saying that his country aimed to have the 2.5m
b/d capacity in place by 2015.
He said that at the end of 2010, the capacity figure
for the North African OPEC Member Country should stand
at a little over 2m b/d.
However, despite the programme to boost the
country’s oil capacity, Ghanem stressed that domestic
crude production would remain in line with OPEC out-
put allocations.
Future bright
According to the February edition of OPEC’s Monthly Oil
Market Report, quoting secondary sources, the SP Libyan
AJ Libya produced 1.54m b/d of crude oil in January, the
same as in December 2009.
The future looks bright for the country, which joined
OPEC in 1962.
The country occupies first place in Africa, above
Nigeria, Angola, and Gabon, in the upstream business
environment rating published by Business Monitor
International (BMI), which points out that it scores ben-
SP Libyan AJ ploughs more investment intooil expansion plans
efits from its proven oil reserves and reserves to produc-
tion ratio.
BMI also forecasts that between 2009 and 2019, the
SP Libyan AJ will see a 46 per cent rise in its domestic oil
and gas liquids production, with volumes rising steadily
to 2.5m b/d.
Gas production is estimated to grow to 55bn cu m.
In 2008, the country’s marketed production of gas was
gauged at 16bn cu m.
The latest BMI report also says that the SP
Libyan AJ will account for 7.76 per cent of African
regional oil demand by 2014, while providing 16.77 per
cent of supply.
All this is backed by a BMI forecast that the country’s
GDP growth will increase by an average of 6.5 per cent in
2010–14.
There is no doubting that the country has the reserves
to back its ambitious programme.
According to the latest OPEC Annual Statistical
Bulletin (ASB), the SP Libyan AJ has seen its crude oil
reserves increase from 22.8bn b in 1988 to 44.3bn b
in 2008, the highest in Africa, when its output stood at
1.72m b/d. In 1988, the country’s production stood at
just over 1m b/d.
The nation’s gas reserves have also expanded over the
years — from 827bn standard cu m in 1988 to 1,540bn
cu m two decades later.
The state-owned NOC oversees all petroleum activi-
ties in Libya, including oil and gas exploration, drilling
and production, as well as marketing and distribution of
petroleum products and petrochemicals.
Dr Shokri M Ghanem.
Reu
ters

42
OPE
C bu
lleti
n 3/
10N
ew
sli
ne
Qatar’s “significant” and growing hydrocarbons posi-
tion could result in the country attaining real economic
growth of 16 per cent in 2010, following the nine per cent
expansion recorded in 2009, according to Central Bank
Governor, Sheikh Abdullah bin Saud Al-Thani.
He pointed out that Qatar, the world’s largest natu-
ral gas producer, was due to perform well in line with the
massive expansion of its gas facilities.
Economically, things are picking up for the Gulf region
as a whole — but Qatar in particular — with oil prices
returning to reasonable levels in recent months.
Sheikh Al-Thani was also quoted at a projects con-
ference organized by the Middle East Economic Digest
(MEED) as saying that inflation in Qatar declined by 5.2
per cent from January to November last year and stood
at comfortable levels.
“After increasing during 2008, due to an upturn in
rental prices, inflation has since declined to more com-
fortable levels and is expected to remain moderate going
forward,” he said, adding that Qatar’s financial system
was “sound and resilient”.
Royal Dutch Shell’s $21 billion energy investment in
Qatar over the next couple of years will result in the com-
pletion of the world’s largest gas-to-liquids (GTL) plant, as
well as the last production train in the current Qatargas
expansion programme.
The move is making Shell the largest private inves-
tor in the country, according to Gerrit-Jan Smitskamp, the
company’s Regional Vice President for Finance.
Shell expects to complete construction of the $19bn
GTL plant by the end of this year. The Pearl facility will
have two production lines.
Seventh train for Qatargas
In addition to the GTL investment, Shell is ploughing $2bn
into building a new liquefied natural gas (LNG) plant in
Qatar that will see first production in 2011.
Smitskamp was quoted at the MEED projects con-
ference as saying that the new LNG production train,
the seventh for Qatargas, would have a capacity of 7.8
Gas expansion schemes boosting Qatar’s economic standing
million tonnes/year of gas. It would represent the last
of the trains planned under Qatar’s existing expansion
programme.
The train would take capacity at the world’s largest
LNG exporter to 77m t/yr.
Shell has a 30 per cent interest in the LNG plant,
with the remainder belonging to state oil firm Qatar
Petroleum (QP).
Project still profitable
Following concerns over the viability of the 140,000 b/d
GTL project, Smitskamp said the project would still be
profitable. The company had actually taken a final invest-
ment decision when the price of crude oil was lying at
around $40/b.
“We envisaged the project would run there, so at
$70/b to $80/b we are seeing today, it is probably the
same,” he was quoted as saying.
The situation would also be helped by the free gas
supplies the plant would receive from the host country.
Smitskamp pointed out that the free feedstock formed
part of the original agreement with Qatar to build the
plant.
He explained that, unlike a crude oil refinery that
had to pay for crude oil as a feedstock, gas was free for
Shell. It meant the company only had the operating costs
to consider.
Smitskamp noted that most of the fuel produced at
the plant would be sold into Shell’s global supply sys-
tem, rather than contracted out to individual buyers on
a long-term basis.
Some of the jet fuel produced may go to QP, while
some gas oil may be mixed with Shell’s current blend,
he added.
Refined fuel products of the plant will comprise fuel
oil, naphtha and paraffin, kerosene, gas oil, base oil, as
well as ethane, LPG and condensates.
Of interest, and to gauge the size of the GTL facility,
Smitskamp revealed that the Pearl scheme, was employ-
ing around 50,000 people.

43
OPE
C bu
lleti
n 3/
10
Venezuela has embarked on a comprehensive plan to
develop its extensive Orinoco Oil Belt, the largest deposit
of liquid hydrocarbons in the world, which, according to
government figures, contains at least 100 billion barrels
of proved heavy crude reserves.
In what represents the biggest oil investment of
President Hugo Chávez’s 11-year administration, inter-
national oil majors have committed tens of billions of dol-
lars of foreign finance to develop the belt, which occupies
a southern strip of land along the eastern Orinoco River
Basin in Venezuela.
“This international investment is absolutely neces-
sary for us. We could not develop the Orinoco Belt alone,”
Chavez was quoted as telling oil company officials during
a ceremony held at the Miraflores presidential palace in
Caracas.
Vast oil deposit
“This is mutually beneficial. You are here because you
need to be here. These are relationships of equals — of
friendship,” he stated.
After extensive evaluation, Venezuelan authorities
announced that the vast oil deposit contained around
98bn b of proved heavy crude, but the likelihood was
that the real figure was more in the region of 270bn b.
Other organizations and agencies have cited even
higher guesstimates with the most recent coming from the
United States government, stating that the belt contained
over 500bn b of oil that, technically, could be recovered
if cost was not an issue.
In what was the largest ever crude assessment made
by the US Geological Survey, its report said the estimate
was based on the amount of oil that could be recovered
using existing drilling technology and industry practices,
whether at a profit or a loss. The actual range in the agen-
cy’s estimate was 380bn to 652bn b.
The belt, which covers an area of over 55,300 sq km,
has been divided into four exploration and production
areas — Boyacá, Junín, Ayacucho and Carabobo.
It was announced in February that international con-
sortiums, led by Chevron of the United States
and Repsol of Spain, had been successful in
bidding for two development projects in the
Carabobo blocks. Four schemes were also
granted to partners in the Junin area.
The projects, to be operated by state oil
company, Petroleos de Venezuela SA, which
has a stake of 60 per cent in the schemes,
are expected to begin producing oil by 2013.
Total investment will be around $80 billion.
Upgraders for turning the oil tar into lighter synthetic
oil will be ready by 2017.
Venezuela is set to receive financing and bonuses
from its partners in the belt amounting to almost $6bn.
It eventually hopes to sustain output of 2.1 million
b/d from the giant oil reserve.
Venezuela’s President, Hugo Chávez, addressing a press
conference in Caracas.
An aerial view of the Orinoco River in Santa Maria del Orinoco.
Venezuela launches ambitious planto develop Orinoco Oil Belt
Reu
ters
Reu
ters
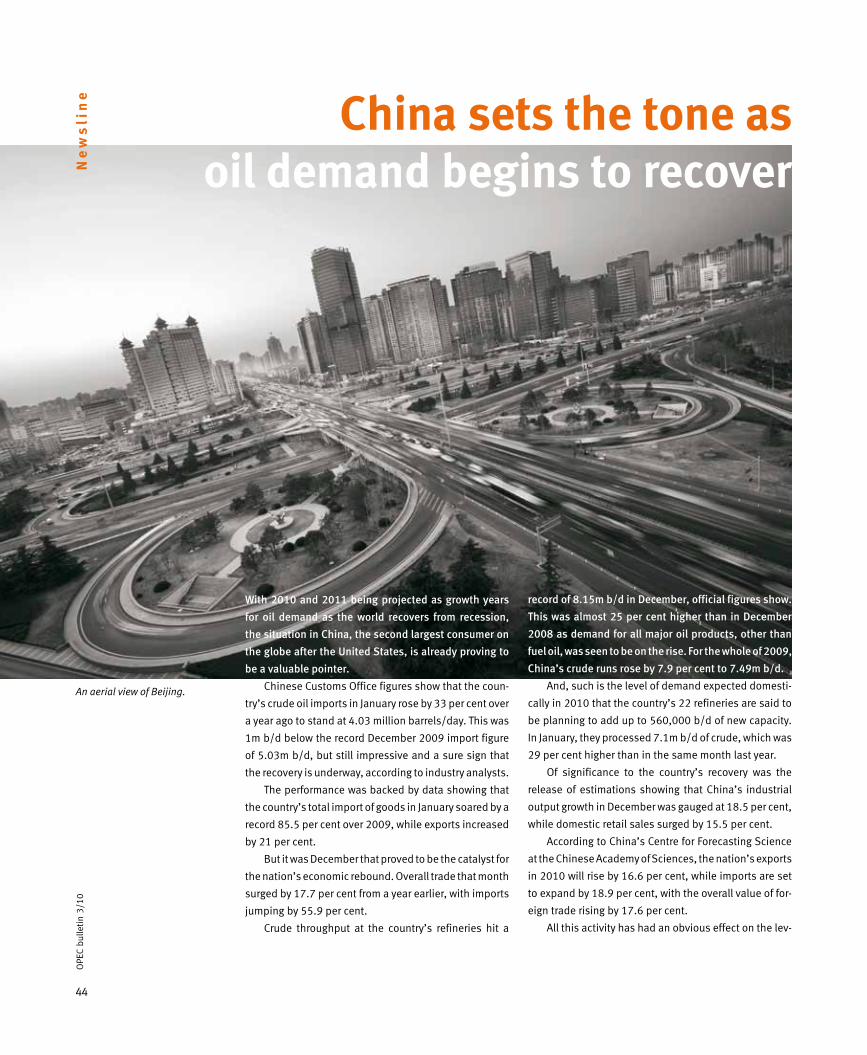
44
OPE
C bu
lleti
n 3/
10
China sets the tone asoil demand begins to recover
With 2010 and 2011 being projected as growth years
for oil demand as the world recovers from recession,
the situation in China, the second largest consumer on
the globe after the United States, is already proving to
be a valuable pointer.
Chinese Customs Office figures show that the coun-
try’s crude oil imports in January rose by 33 per cent over
a year ago to stand at 4.03 million barrels/day. This was
1m b/d below the record December 2009 import figure
of 5.03m b/d, but still impressive and a sure sign that
the recovery is underway, according to industry analysts.
The performance was backed by data showing that
the country’s total import of goods in January soared by a
record 85.5 per cent over 2009, while exports increased
by 21 per cent.
But it was December that proved to be the catalyst for
the nation’s economic rebound. Overall trade that month
surged by 17.7 per cent from a year earlier, with imports
jumping by 55.9 per cent.
Crude throughput at the country’s refineries hit a
record of 8.15m b/d in December, official figures show.
This was almost 25 per cent higher than in December
2008 as demand for all major oil products, other than
fuel oil, was seen to be on the rise. For the whole of 2009,
China’s crude runs rose by 7.9 per cent to 7.49m b/d.
And, such is the level of demand expected domesti-
cally in 2010 that the country’s 22 refineries are said to
be planning to add up to 560,000 b/d of new capacity.
In January, they processed 7.1m b/d of crude, which was
29 per cent higher than in the same month last year.
Of significance to the country’s recovery was the
release of estimations showing that China’s industrial
output growth in December was gauged at 18.5 per cent,
while domestic retail sales surged by 15.5 per cent.
According to China’s Centre for Forecasting Science
at the Chinese Academy of Sciences, the nation’s exports
in 2010 will rise by 16.6 per cent, while imports are set
to expand by 18.9 per cent, with the overall value of for-
eign trade rising by 17.6 per cent.
All this activity has had an obvious effect on the lev-
Ne
ws
lin
e
An aerial view of Beijing.

45
OPE
C bu
lleti
n 3/
10
els of oil demand. China’s oil imports in December were
48 per cent higher than in the same month the previous
year and were up on the previous record of 4.64m b/d,
set in July 2009, according to Customs Office figures.
Total imports in 2009 were put to 4.09m b/d, 14 per cent
higher than in 2008. This enabled the country to overtake
Japan as Asia’s largest crude importer.
The record increases in December were of little sur-
prise after the government announced that Chinese eco-
nomic growth in the fourth quarter of 2009 was the fast-
est of any quarter over the last two years.
GDP expansion was pegged at 10.7 per cent, which
led to full-year growth of 8.7 per cent. Economists now
estimate that China’s GDP growth will remain at an aver-
age of nine to ten per cent throughout 2010 and will be
sustained at a level of around nine per cent in 2011.
According to China’s State Information Centre, GDP
growth in the first three months of 2010 will likely reach
11.5 per cent.
Imports rising
With Japan failing to respond as positively to the glo-
bal economic downturn, analysts say that with the type
of growth levels being projected for China, the country
is set to overtake Japan as the second largest economy
in the world.
The higher crude imports seen in China in December
were required to satisfy an overall 6.3 per cent increase
in apparent Chinese oil demand in 2009.
And in 2010, the picture is set to get rosier still.
Latest forecasts from the China National Petroleum
Corporation (CNPC) state that the country’s crude oil
imports will likely total 4.24m b/d this year, up by over
nine per cent from 2009.
Data from the Research Institute of Economics and
Technology, a CNPC subsidiary, said net imports of both
crude and oil products were in line to rise by 8.3 per cent
in 2010 to 4.7m b/d.
The institute predicts that apparent oil demand in
China will expand by over five per cent to 8.54m b/d this
year. Refining capacity is expected to total 10.3m b/d
by the end of 2010, up by 633,000 b/d from the 2009
figure.
In addition, China’s domestic gas production is slated
to increase to close to 9.67 billion cubic feet/day in 2010,
as against 8.03bn cu ft/d last year. Natural gas imports
are forecast to top 967m cu ft/d this year, accounting for
some nine per cent of total demand.
The economic and petroleum growth figures for China
are in line with overall projections made by OPEC and
other global institutions.
OPEC, in its February Monthly Oil Market Report, fore-
casts China’s oil demand in 2010 reaching 8.57m b/d,
up from 8.21m b/d in 2009, an increase of 4.5 per cent,
or 370,000 b/d.
Looking at a breakdown, in the first three months of
2010, Chinese oil demand is expected to surge by 6.24
per cent to 8.08m b/d, compared with 7.61m b/d in the
same quarter of 2009.
In the second quarter, demand is slated to rise to
8.69m b/d, compared with 8.38m b/d in the same period
of 2009, while demand is expected to peak in the third
quarter at around 8.91m b/d, which would compare with
8.56m b/d for the same month the previous year. Fourth-
quarter oil demand in China is currently put at 8.61m b/d,
340,000 b/d more than in the same period of 2009.
The OPEC report points to the fact that things started
to pick up in China as early as the second quarter of 2009,
when oil demand improved by 2.7 per cent to 8.38m b/d.
The momentum improved strongly into the third quarter
when it rose by 450,000 b/d to 8.56m b/d. There was
then a strong surge in the final three months of 2009
when demand increased by 620,000 b/d to 8.11m b/d.
In December alone, the country’s oil demand hit
record growth of 17 per cent. But not only was oil demand
high, but also refinery runs, due to the introduction of a
new Chinese pricing system, guaranteeing a certain mar-
gin to refiners. This development led to the country’s oil
imports growing by 1.4m b/d in December, compared
with the previous year.
Stimulus plan
“Strong economic growth in China, India, the Middle
East and Latin America is pushing the world to consume
more oil in 2010 in comparison with the previous year,”
OPEC observed in its report for January.
It pointed out that China’s stimulus plan had contrib-
uted positively to the country’s growth in many sectors,
including energy demand, and the downward risk to oil
demand forecast for China was minimal.
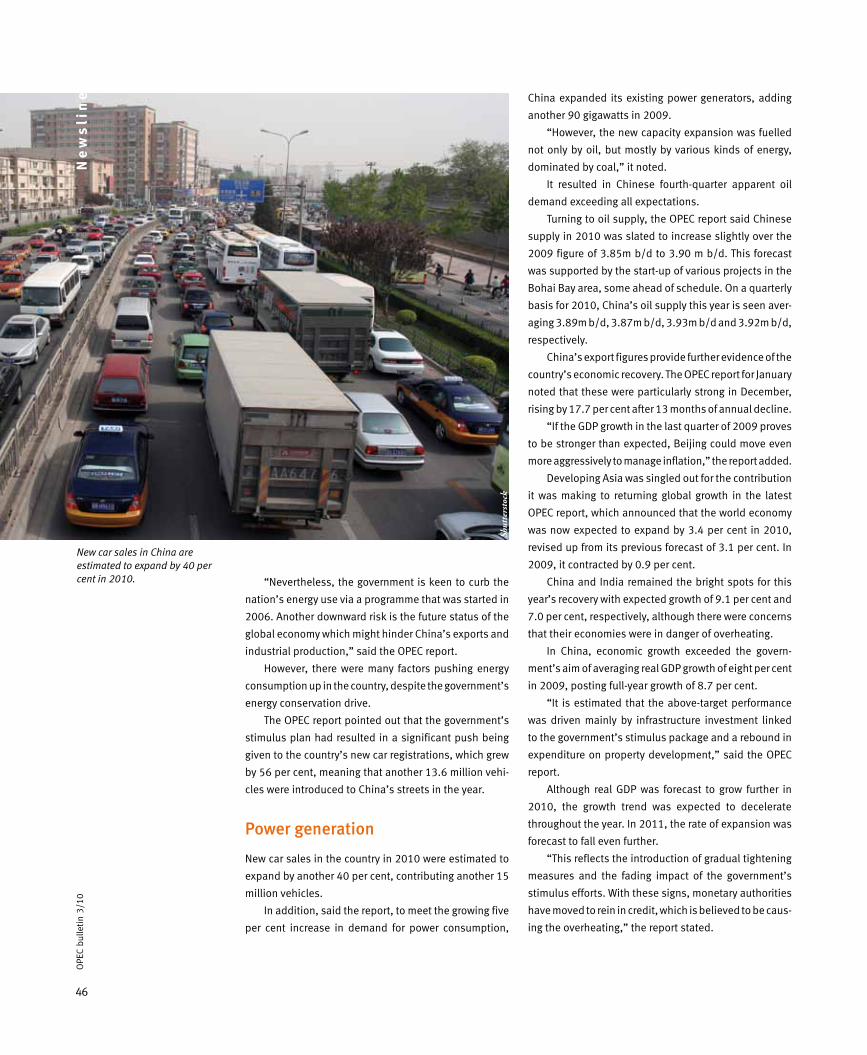
46
OPE
C bu
lleti
n 3/
10N
ew
sli
ne China expanded its existing power generators, adding
another 90 gigawatts in 2009.
“However, the new capacity expansion was fuelled
not only by oil, but mostly by various kinds of energy,
dominated by coal,” it noted.
It resulted in Chinese fourth-quarter apparent oil
demand exceeding all expectations.
Turning to oil supply, the OPEC report said Chinese
supply in 2010 was slated to increase slightly over the
2009 figure of 3.85m b/d to 3.90 m b/d. This forecast
was supported by the start-up of various projects in the
Bohai Bay area, some ahead of schedule. On a quarterly
basis for 2010, China’s oil supply this year is seen aver-
aging 3.89m b/d, 3.87m b/d, 3.93m b/d and 3.92m b/d,
respectively.
China’s export figures provide further evidence of the
country’s economic recovery. The OPEC report for January
noted that these were particularly strong in December,
rising by 17.7 per cent after 13 months of annual decline.
“If the GDP growth in the last quarter of 2009 proves
to be stronger than expected, Beijing could move even
more aggressively to manage inflation,” the report added.
Developing Asia was singled out for the contribution
it was making to returning global growth in the latest
OPEC report, which announced that the world economy
was now expected to expand by 3.4 per cent in 2010,
revised up from its previous forecast of 3.1 per cent. In
2009, it contracted by 0.9 per cent.
China and India remained the bright spots for this
year’s recovery with expected growth of 9.1 per cent and
7.0 per cent, respectively, although there were concerns
that their economies were in danger of overheating.
In China, economic growth exceeded the govern-
ment’s aim of averaging real GDP growth of eight per cent
in 2009, posting full-year growth of 8.7 per cent.
“It is estimated that the above-target performance
was driven mainly by infrastructure investment linked
to the government’s stimulus package and a rebound in
expenditure on property development,” said the OPEC
report.
Although real GDP was forecast to grow further in
2010, the growth trend was expected to decelerate
throughout the year. In 2011, the rate of expansion was
forecast to fall even further.
“This reflects the introduction of gradual tightening
measures and the fading impact of the government’s
stimulus efforts. With these signs, monetary authorities
have moved to rein in credit, which is believed to be caus-
ing the overheating,” the report stated.
“Nevertheless, the government is keen to curb the
nation’s energy use via a programme that was started in
2006. Another downward risk is the future status of the
global economy which might hinder China’s exports and
industrial production,” said the OPEC report.
However, there were many factors pushing energy
consumption up in the country, despite the government’s
energy conservation drive.
The OPEC report pointed out that the government’s
stimulus plan had resulted in a significant push being
given to the country’s new car registrations, which grew
by 56 per cent, meaning that another 13.6 million vehi-
cles were introduced to China’s streets in the year.
Power generation
New car sales in the country in 2010 were estimated to
expand by another 40 per cent, contributing another 15
million vehicles.
In addition, said the report, to meet the growing five
per cent increase in demand for power consumption,
Ne
ws
lin
e
Shut
ters
tock
New car sales in China are estimated to expand by 40 per cent in 2010.

47
OPE
C bu
lleti
n 3/
10
Concerning other world regions, growth in the OECD,
which was still dependent on government-led support,
was pegged at 1.7 per cent for 2010, with the US likely
to show the best performance with growth of 2.5 per
cent. Japan was expected to expand by only 1.1 per cent,
despite the recent stimulus package, while the Euro-zone
forecast for growth was put at 0.6 per cent.
“Growth in 2010 continues to be challenged by con-
cerns about the level of public debt in almost all OECD
regions, still record high unemployment levels across the
globe, and government efforts in China to prevent the
economy from overheating,” commented the OPEC report.
Looking at global oil demand, the OPEC report said
that following a decline of 1.4m b/d in 2009, a cold win-
ter, the economic recovery and a low base for the previous
year would push demand up by 810,000 b/d to average
85.12m b/d in 2010.
Recovery in oil demand
“The slow pace of the recovery in the world economy in
2010 is putting pressure on oil demand. As a result, US
demand is a key uncertainty,” the report noted.
Non-OECD countries were forecast to grow at a higher
rate of 1m b/d, compared with 500,000 b/d in 2009, bol-
stered by 2.1 per cent growth in the group of developing
countries.
In the OECD region in 2010, oil demand was forecast
to bounce back, reducing its decline by more than 90 per
cent. Most of the recovery was tied to the US.
Demand for OPEC crude in 2010 was expected to aver-
age 28.8m b/d, virtually the same level as in 2009, but
around 2.3m b/d lower than that seen in the preceding
year.
Other institutions also see global oil demand recover-
ing, although their projections are somewhat more opti-
mistic than OPEC’s, which has tended to err on the side
of caution.
The Paris based International Energy Agency (IEA)
maintains that global oil demand in 2010 will attain its
highest level since 2007. An increase in consumption
would be led by faster growth in Asia’s emerging econ-
omies. In its February 11 report, the IEA forecasts oil
demand to rise by 1.6m b/d in 2010 to 86.5m b/d.
Meanwhile, in the US, the Energy Information
Administration (EIA) maintains that the decline in oil
demand seen over the past two years had reached a trough
in mid-2009 and began to recover over the following six
months, in line with the global economic recovery.
In its short-term energy outlook, issued on February
10, it said it expected the economic recovery to continue
in 2010, contributing to global oil demand growth of 1.2m
b/d this year and 1.6m b/d in 2011.
The EIA said that countries outside the OECD were
expected to account for most of the growth forecast in
both 2010 and 2011, although US demand for petroleum
products was projected to increase by 180,000 b/d this
year and by 210,000 b/d in 2011 after a very weak 2009.
As with the OPEC report, it maintained that China’s
economic stimulus package was continuing to help push
up both oil usage and economic growth.
“The world oil market should gradually tighten in
2010 and 2011, as the global economic recovery con-
tinues and world oil demand begins to grow,” it said.
The EIA maintained that a continuation of the pro-
duction strategies set by OPEC, as well as lower overall
growth in non-OPEC supply over the 2010–11 forecast
period, would also contribute to a firming of crude oil
prices to above $80/b in the summer.
“However, the combination of high commercial inven-
tories among OECD countries, together with ample OPEC
surplus production capacity, should help dampen the
likelihood of any large upward swings in prices,” said
the report.
Shut
ters
tock
Chinese refineries are planning to add 560,000 b/d of new capacity in 2010 to help cope with the surge in transportation demand.

48
OPE
C bu
lleti
n 3/
10
Energy security a defining issue — BP executive
International crude oil prices need to stay “relatively
close” to a level of $76/barrel, in order for new supplies to
be exploited and developed, according to Tony Hayward,
Chief Executive Officer of British Petroleum.
He pointed out in an interview with BBC Radio 4 that
this level of price would also provide sufficient income
for the oil-exporting countries.
Support investment
Hayward maintained that among the non-OPEC produc-
ers, where deepwater oil was more expensive to develop,
an oil price of $60/b or more was required to support the
necessary investment and to enable a return on capital
to be made.
“In the OPEC world, it turns out the oil is a lot easier
to get out, so it is less expensive. But they have got the
challenge of balancing their domestic budgets, so they
also need prices of $60–70/b,” he professed.
In a separate speech delivered in London, Hayward said
energy security was a defining issue for the 21st century.
He called on policymakers to encourage investment,
whether in low-carbon energy or fossil fuels, to ensure
that there was enough capacity to meet future needs.
Without adequate investment, he continued, the risk
was that spare capacity would dwindle and “we will return
to the price volatility we saw in 2008.”
Hayward estimated investment needed to meet a
projected doubling of energy use by 2050 at $1 trillion
per year until then.
His company expected hydrocarbons to remain dom-
inant in a more diverse energy mix in the years ahead.
Ne
ws
lin
e
Reu
ters

49
OPE
C bu
lleti
n 3/
10
Estimated current proven crude reserves were sufficient
for 40 years, while gas, at today’s consumption rates,
would last for 60 years, he said.
Technology and access to resources would be key to
meeting future energy needs. Hayward pointed to BP’s
Rumaila contract in Iraq as a “very good example” of how
the two could be combined effectively.
Oil demand peak
“Iraq has the potential to contribute 10 million barrels/
day to global energy supplies in the next 10–15 years.
That is a big piece of the additional resource we need,”
he stated.
Hayward predicted that global oil demand would peak
at a maximum of around 110m b/d after 2020.
He maintained in his radio interview that demand for
some key fuels may have reached a high point already in
certain developed markets, adding that the oil industry
would never sell more gasoline in the United States or
Europe than it had during the boom in 2007.
Some believed oil demand may have already peaked
in OECD countries because of fuel efficiency and the use
of alternatives, he added.
“World oil demand will peak before its supply peaks
because there is plenty of oil in the world, there really
is,” Hayward contended.
“There are some challenges getting it out in some
places … but there is plenty of oil in the world,” he added.
Turning to the United Kingdom, Hayward pointed out
that the recent panic about energy security and rising gas
imports was misplaced.
The range of import sources, including Algeria, Qatar,
Trinidad and Egypt, was no cause for concern.
“We should embrace this. It is an opportunity. It is low
carbon, much lower than coal, and it is a very sensible
way to bridge between where we are today and where we
want to be in 20 or 30 years’ time,” Hayward affirmed.
The problem at the present time was distribution,
due to a lack of storage facilities and infrastructure.
Hayward said the UK government could also help
with a more responsive fiscal policy to support activity
on the UK continental shelf, where, according to BP data,
an estimated 20–25bn b of oil and gas deposits could
still be produced.
Left: Chief Executive Officer, Tony Hayward (second right), seen with BP colleagues during a news conference in London.
The Rumaila oil field, in southern Iraq — a “very good example” of combining technology and access to resources.
Reu
ters

50
Light at the end of an Andes tunnelOFID lends support to Colombia’s ambitious
mountain road scheme
OPE
C bu
lleti
n 3/
10
Walking the tunnel … ‘La Linea’ represents Colombia’s most difficult engineering challenge to date.
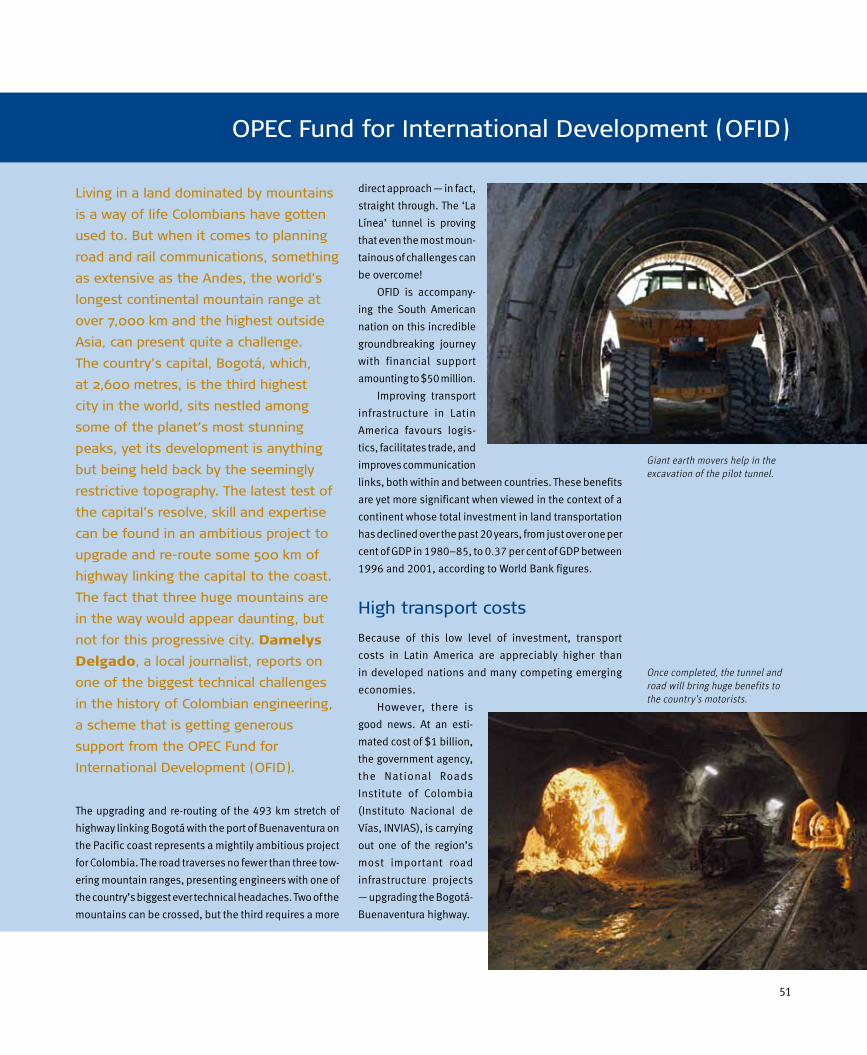
51
OPE
C bu
lleti
n 3/
10
OPEC Fund for International Development (OFID)
The upgrading and re-routing of the 493 km stretch of
highway linking Bogotá with the port of Buenaventura on
the Pacific coast represents a mightily ambitious project
for Colombia. The road traverses no fewer than three tow-
ering mountain ranges, presenting engineers with one of
the country’s biggest ever technical headaches. Two of the
mountains can be crossed, but the third requires a more
direct approach — in fact,
straight through. The ‘La
Línea’ tunnel is proving
that even the most moun-
tainous of challenges can
be overcome!
OFID is accompany-
ing the South American
nation on this incredible
groundbreaking journey
with financial support
amounting to $50 million.
Improving transport
infrastructure in Latin
America favours logis-
tics, facilitates trade, and
improves communication
links, both within and between countries. These benefits
are yet more significant when viewed in the context of a
continent whose total investment in land transportation
has declined over the past 20 years, from just over one per
cent of GDP in 1980–85, to 0.37 per cent of GDP between
1996 and 2001, according to World Bank figures.
High transport costsBecause of this low level of investment, transport
costs in Latin America are appreciably higher than
in developed nations and many competing emerging
economies.
However, there is
good news. At an esti-
mated cost of $1 billion,
the government agency,
the National Roads
Institute of Colombia
(Instituto Nacional de
Vías, INVIAS), is carrying
out one of the region’s
most important road
infrastructure projects
— upgrading the Bogotá-
Buenaventura highway.
Living in a land dominated by mountains is a way of life Colombians have gotten used to. But when it comes to planning road and rail communications, something as extensive as the Andes, the world’s longest continental mountain range at over 7,000 km and the highest outside Asia, can present quite a challenge. The country’s capital, Bogotá, which, at 2,600 metres, is the third highest city in the world, sits nestled among some of the planet’s most stunning peaks, yet its development is anything but being held back by the seemingly restrictive topography. The latest test of the capital’s resolve, skill and expertise can be found in an ambitious project to upgrade and re-route some 500 km of highway linking the capital to the coast. The fact that three huge mountains are in the way would appear daunting, but not for this progressive city. Damelys Delgado, a local journalist, reports on one of the biggest technical challenges in the history of Colombian engineering, a scheme that is getting generous support from the OPEC Fund for International Development (OFID).
Giant earth movers help in the excavation of the pilot tunnel.
Once completed, the tunnel and road will bring huge benefits to the country’s motorists.

52
OPE
C bu
lleti
n 3/
10
riageway, which will reduce the accident rate by an esti-
mated 75 per cent.
The highway project is progressing steadily in the
heart of Colombia. The most complex section is the pass
through the Andes Central Cordillera range, which con-
nects the departments of Quindío and Tolima.
Traversing the mountains requires the excavation of
the ‘La Línea’ tunnel at a site that cast more doubts than
certainties when the idea first surfaced.
Main tunnelThe job was tendered three times and on each occa-
sion the process was unsuccessful. The reason? No one
was willing to risk building a road on such geologically
unstable terrain.
Finally, the government stepped in and started the
construction of a pilot tunnel to allow for an evaluation
of the area’s geology, geo-mechanics and hydrogeology.
Today, in spite of geological fault lines, construction
of the main tunnel is underway, the national dream is
gradually becoming a reality.
Construction of the main tunnel began in late October
last year and is due for completion in 2013, at a cost of
$270m. Once it is finished, a second tunnel will be put
through, giving a two-way highway in line with the increasing
demands being made on land transportation in the coun-
try. The entire project is scheduled to be finished in 2016.
Juan Esteban Gil, Manager of Large Projects for INVIAS,
said one of the project’s main benefits was that, with the
pass being lowered to a height of 2,400 metres, road
users would no longer have to climb 3,300 m to cross
the mountains.
He explained: “The Andes Cordillera that comes from
southern Chile is divided into three ranges in Colombia
— eastern, central and western. To get from Bogotá to
Buenaventura you have to cross all three mountain
ranges. Starting at 2,600 m above sea level on the plateau
Cundiboyacense, the road descends to the Magdalena
River, then climbs the central ridge to slowly descend
again to the Cauca River valley. It then goes up the west-
ern ridge and finally falls back down to sea level.
“Of the three crossings, the most complicated con-
nection is the passage through the central mountains,
Preliminary studies for the scheme actually started in the late
20th century, but today progress is visible for all to see.
It is a work of great national importance and one that that will
allow free-flowing traffic through four of the country’s so-called
departments: Antioquia, Tolima, Quindío and Valle del Cauca.
Most of Colombia’s roads are simple, two-lane affairs — a situ-
ation that has a detrimental impact on traffic flow, especially since
some 85 per cent of cargo transportation is made by huge articu-
lated trucks. This inevitably causes bottlenecks and damage to road
surfaces.
The Bogotá-Buenaventura highway transports more than 45 per
cent of the cargo coming from Asia, but is, on average, only seven
metres wide, with vehicles travelling in both directions. Some sec-
tions are even narrower.
This, along with difficult curves, steep slopes, landslides in rainy
weather and reckless driving, give rise to an accident rate four times
the national average.
In this regard, official figures are quite alarming. According to
Pamela Cox, World Bank Vice President for Latin America and the
Caribbean, both regions had the highest fatality rate per capita in
the world, due to accidents.
Addressing a conference on road safety for Latin America and the
Caribbean in 2009, she said the figure currently stood at 26 fatali-
ties per 100,000 people and was likely to rise to over 30 deaths per
100,000 people by 2020.
The comparable figure among the safest countries in the world,
including New Zealand, Sweden and France, was five fatalities per
100,000 people, and declining.
The good news for Colombians lies in the fact that the expanded
and upgraded Bogotá-Buenaventura road will feature a dual car-
An OFID loan of $30m is supporting the construction of the tunnel.

53
OPEC Fund for International Development (OFID)
where the old road climbs over 3,000 m above sea level,
with poor visibility and the most complex topographical
and geological conditions in Colombia,” he said.
Gil stressed that a reduction in operating costs, a
shorter travel time, environmental advantages, accident
reduction and local employment generation, were just
some of the additional benefits offered by the project.
Regarding operating costs, Gil pointed out that
the savings were derived from the difference between
traveling the 22 km stretch of the mountain at 3,300 m
above sea level, compared with the 11.9 km on flat ground
and at an average altitude of 2,463 m.
These savings were estimated at $40m annually, due
to lower fuel and supply costs and reduced equipment
maintenance.
In addition, the tunnel had an expected traffic volume
and rate of 5,000 vehicles a day, which would increase
by three per cent yearly until 2012 when it was expected
to be nine per cent higher.
Also, said Gil, there would be time savings, due to
both the shorter distance and the greater travel speed,
which would increase from an average of 18.2 km per hour
to 60 km/hour. This translated to a reduction of about
80 minutes for trucks and 40 minutes for light vehicles.
The savings may also be reflected in lower freight costs.
The tunnel forms part of the Calarcá-Cajamarca sec-
tion, located between the departments of Tolima and
Quindío. This road stretched 45 km, which, upon com-
pletion of the works, will be reduced to 33 km.
Another significant benefit mentioned by Gil relates
to local employment generation, which is estimated to
peak at 1,500 jobs as the scheme progresses.
Ecological benefitsThe project also had huge ecological benefits. It was esti-
mated that the transit improvements mentioned would
reduce emissions of carbon monoxide by 20 tons/year,
carbon dioxide by about 1,000 tons/year, and lead by
18 tons/year.
Gil reported that environmental investments total-
ling $20m had been made along the river adjacent to
the project. In this regard, 620 hectares of land had been
reforested by planting 350,000 trees.
The tunnel will have an initial traffic volume of 5,000 vehicles a day, rising by three per cent a year.
OPE
C bu
lleti
n 3/
10
In a second phase, that would culminate in 2012,
an additional 700 hectares would be reforested, which,
according to Gil, was “something never seen in Colombia.”
Other environmental measures included water
resource management. “Leakage from the tunnel will
supply water at a rate of 300 litres per second to a popu-
lation of 200,000 people in the department of Quindío,”
disclosed Gil.
A $30m loan provided by OFID is being used to co-
finance the phase that corresponds to the construction
of the tunnel. Another OFID loan of $20m is supporting
the Loboguerrero-Buenaventura section of the same
highway. This 48 km stretch is also under construction
and includes a 580 m bridge and six additional viaducts,
whose lengths range between 90 m and 350 m.
In the Valle del Cauca department, where this work is
being carried out, environmental investments are total-
ling $25m, including compensation to ethnic minorities,
reforestation, watershed protection, and water and basic
sanitation provision.
Gil noted that OFID’s cooperation had been aimed
at key project components that would support the
development of Colombia and improve the welfare of
its people.
All photographs courtesy INVIAS.
54
OPE
C bu
lleti
n 3/
10
This section includes highlights from the OPEC Monthly Oil Market
Report (MOMR) for February 2010, published by the Petroleum
Studies Department of the Secretariat, with additional graphs and
tables. The publication may be downloaded in PDF format from our
Website (www.opec.org), provided OPEC is credited as the source for
any usage.
Ma
rke
t R
ev
iew
1. An average of Saharan Blend (Algeria), Girassol (Angola), Oriente (Ecuador), Iran Heavy (IR Iran), Basra Light (Iraq), Kuwait Export (Kuwait), Es Sider (SP Libyan AJ), Bonny Light (Nigeria), Qatar Marine (Qatar), Arab Light (Saudi Arabia), Murban (UAE) and Merey (Venezuela).
Crude oil price movementsCold weather and increased investment flows
helped oil futures improve and the OPEC
Reference Basket continue its upward trend in
the first weeks of 2010. After ten consecutive
sessions of gains, the Basket hit $80.29/bar-
rel on January 11, the highest level since early
October 2008.
However, the bullish momentum came to
an end just after temperatures in the northern
hemisphere increased and concerns about glo-
bal economic growth emerged once again. A
stronger US dollar and downward corrections
in the equity markets also contributed to the
decline in prices. As a result, the OPEC Basket
declined to settle at $71.01/b on January 29 —
the last business day of the month — implying
a loss of more than $9/b, or 11.6 per cent, in
14 days. Over this period, the Basket increased
in just one session, on January 14.
All the Basket components fell within
that period, particularly Ecuador’s Oriente
and the Middle Eastern crudes. Oriente lost
around $10.50/b, while Middle Eastern crude
saw losses ranging between $9.15/b for Arab
Light and $9.70/b for Iran Heavy. Brent-related
crudes and Venezuelan Merey declined by a
near $8.50/b.
Higher demand for distillate-rich crudes in
Europe and the Asia Pacific, following improv-
ing distillate margins, helped Middle Eastern
crudes to strengthen in early January. Abu Dhabi
reduced allocations from its contractual supply
by as much as 13 per cent, lifting Murban values
for March cargoes to a small premium to the
ADNOC OSP after three months of discounts.
However, as temperatures retreated from
unusually low levels, demand for middle distil-
late-rich grades fell along with refining margins,
leading to bearish sentiment for Middle Eastern
crudes in most of the second half of January.
The heavy crude market was the most
affected. It was sluggish over almost the whole
month on a supply glut before it received some
support at the end of January after Abu Dhabi
deepened its supply curbs on the heavy Upper
Zakum grade for March.
Increased Russian offers of its new ESPO
blend also put downward pressure on the
medium-heavy crude market.
However, despite the strong decline in the
second half of the month, the OPEC Basket
gained $2/b, or 2.7 per cent, from December
to average January at $76.01/b.
Among the components, Oriente gained
$4.01/b, followed by Basrah Light ($2.71/b),
Merey ($2.64/b), Girassol ($2.25/b) and Arab
Light ($2.08/b). The remaining components
increased by less than $2/b.
In the oil futures market, West Texas
Intermediate, the American benchmark crude,
averaged the month under review at $79.34/b,
up $4.74/b, or 6.4 per cent, from December, after
starting the month strongly, before falling back.
In Europe, ICE North Sea Brent crude fol-
lowed almost the same trading trend as WTI.
For the month, it averaged $77.91/b, compared
with $75.21/b in December.
Commodity markets
Looking at trends in selected commodity mar-
kets, the OPEC report stated that, at the begin-
ning of 2010, there were two key factors driving
commodity markets, namely the colder-than-
expected weather and China’s economic mon-
etary policy.
Trading sentiment was dampened by
China’s move to impose higher reserve ratios
for selected banks. “It is feared that tighter
monetary policy in the world’s second largest
oil consumer could hamper the global economic
recovery,” it said.
The World Bank energy price commodity
index (crude oil, natural gas and coal) jumped
by 4.2 per cent in January from minus 2.4 per
cent in December 2009 on the back of a 16.7
per cent, 8.2 per cent and 3.0 per cent rise
in coal, crude oil and Henry Hub natural gas,
respectively. Natural gas was positively influ-
enced by colder-than-normal temperatures,
although later news of milder weather in the
first half of February weighed on prices.
The World Bank index for non-energy com-
modity prices grew at the same pace in January
as the previous month, by around 2.8 per cent.
The recovery in some items was counterbal-
Febru
ary
10

55
OPE
C bu
lleti
n 3/
10
anced by the decline in others, like grains, some
industrial metals and gold, which lost ground.
A weaker trend in industrial metal prices
in January was driven by macro uncertain-
ties related to European sovereign debt
and announcements by the United States
Administration on banking sector regulation
and monetary tightening in China.
“Price trends will remain macro-driven
and volatility could intensify until sentiment
becomes more confident,” said the report.
Aluminium showed a slower pace of growth
of 2.5 per cent in January, compared with 11.8
per cent the previous month, which was related
to lower Chinese imports in December — down
by three per cent from November — and a weak
global market. Inventories at the London Metal
Exchange (LME) kept inflating in January.
Copper prices expanded by 5.8 per cent in
January, compared with 4.6 per cent the previ-
ous month.
Nickel prices recovered in the month to
increase by 8.0 per cent, compared with just
0.4 per cent in December.
The price of zinc followed a bearish trend,
increasing by only 2.5 per cent in January, com-
pared with 8.0 per cent the previous month.
Gold prices dropped by 1.5 per cent in Jan-
uary on the back of a rise in US bond yields and
real interest rates, as well as a stronger dollar.
The World Bank agricultural price index
reported the same growth in January as in
December at 2.9 per cent. Grain prices declined
by 1.4 per cent.
Highlights of the world economy
In looking at developments in the global econ-
omy, the OPEC report said that in the US, the
economy continued to improve from its recent
trough levels. The fourth quarter of last year
saw real GDP growth at a seasonally-adjusted
annualized rate (saar) of 5.7 per cent.
“Although this number indicates a solid
recovery, a closer review of the details indi-
cates a more mixed picture,” it observed.
It said personal expenditure expanded by
2.0 per cent in the quarter, after rising by 2.8
per cent in the third quarter.
“This is a positive sign indicating that
households probably have again the means to
spend and are willing to do so.”
The report said that this was particularly
important as government expenditure had
declined by 0.2 per cent in the fourth quarter,
after growth peaked in the second quarter at
6.7 per cent and was still increasing by 2.6 per
cent in the third quarter.
“So, while most areas of GDP have improved
for the better, the main question with regard
to the 2010 forecast is what is coming next,
especially as 3.3 per cent of the GDP growth
recorded in the fourth quarter was due to inven-
tory replenishing. This could potentially push
growth in the next quarter to a much lower level,
once the inventory replenishment is over,” the
report contended.
The US labour market remained weak by
historical standards, even though the unem-
ployment rate fell to 9.7 per cent in January,
compared with 10.0 per cent in December. The
question remained if this improvement could
be sustained.
Business sentiment also continued to
improve. Both the ISM indices were moving
up, reflecting the positive growth trend. ISM
manufacturing improved to 58.4 in January,
the highest level since the recession started
two years ago.
The ISM non-manufacturing index, which
was only slightly above the 50 level in December
2009, rose in January to 50.5.
“At this level, it is just about indicating small
growth in the services sector, which accounts
for more than 70 per cent of US GDP. It remains
to be seen whether the leading manufacturing
sector can pull the service sector significantly
above the 50 level,” said the report.
It stressed that the uncertainty about
the pace of the economic recovery was being
reflected in the equity markets as well. The
two positive data releases — the relatively high
fourth-quarter 2009 GDP numbers and the
surprising improvement in the unemployment
numbers for January were widely ignored by
the stock market. “The current level of the S&P
500, as a major benchmark for the US equity
markets, is around seven to eight per cent lower
in the past two weeks. There could be a realiza-
tion that equity markets might have risen too
far too fast on exaggerated expectations and
that the economic recovery might take longer
than expected.”
The report continued: “So while there are
signs for a continuation of the recovery, an ele-
ment of caution is still required. The forecast
for GDP growth has been revised up to 2.5 per
cent for 2010, while the estimate for 2009 was
for a contraction of 2.4 per cent.”
Turning to Japan, the report said the coun-
try’s economic growth was still being chal-
lenged by deflation and declining retail sales
and remained dependent on government-led
support and its relative success in exports,
mainly to Asia and particularly to China.
Real retail sales were estimated to have
declined for the third consecutive month in
December 2009 by 0.5 per cent. This followed
a decline in November and October of 0.3 per
cent and 0.4 per cent, respectively.
The downtrend reflected a drop in con-
sumer confidence, led by continuing uncer-
tainty in the employment market, falling wages,
deflationary pressures, and the tapering off of
governmental support for car and electronic
purchases.
In nominal terms, the December decline in
retail sales was at 1.2 per cent from November
and 0.3 per cent on an annual basis.
The unemployment rate in Japan unexpect-
edly declined by 0.1 per cent in December and
was back to October levels.
“Price trends will remain
macro-driven and volatility
could intensify until
sentiment becomes more
confident.”
56
OPE
C bu
lleti
n 3/
10M
ark
et
Re
vie
w Consumer prices remained under pressure
and the consumer price index (CPI), excluding
energy and food, declined by 1.2 per cent in
December from the previous year, the sharp-
est drop since 1971 when records began.
Japan’s industrial production grew by 2.2
per cent in December from November, but the
Ministry of Economic Trade and Industry (METI)
was projecting much lower levels for the first
half of 2010.
Significant support for the increase in
industrial production in December came from
exports. Real exports were up by 2.6 per cent
in December, after a 5.1 per cent increase in
November and 5.2 percent in October.
“While exports to China are the main
driver for this trend, exports to the US are
starting to decline again, pointing to the
uncertain pace of recovery in the US econ-
omy,” the report noted.
Real exports to the US in December fell by
2.3 per cent, after a sharp increase in October
of 5.0 per cent and 0.6 per cent in November.
The trend of exports to the European Union
has not been much better. Exports rose by a
mere 0.2 per cent in December after strong
growth in October of 9.3 per cent and a decline
in November of 4.0 per cent.
Exports to Asia were the main positive
development in December, rising by 3.1 per
cent, after a gain of 6.7 per cent in October and
a 1.8 per cent decline in November.
China, which currently constitutes the
main export market for Japan, is showing the
steadiest development. Exports to China grew
constantly in the course of the fourth quarter
of last year. In December, exports were 2.5 per
cent higher, compared with a 2.0 per cent gain
in November and 3.0 per cent in October.
“While, so far, this certainly is a solid trend,
the main question is whether this can continue.
Recent moves to slow down growth in China
by curbing lending and other measures might
have an impact on Japanese exports,” the report
stated.
In addition to the relatively muted fore-
cast for 2010, the debt situation of Japan was
adding concern for the economy. According to
International Monetary Fund (IMF) projections,
the debt/GDP ratio of Japan was expected to
reach 250 per cent by 2014.
Standard & Poor’s recently sounded alarm
bells over the Japanese debt-level and warned
that it might lower the country’s AA-credit rating.
“Despite the current crisis in Japan, house-
hold savings are rising again. The widespread
complacency about Japanese debt levels seems
to be a major driver for the success of the
Japanese government bond market and a sup-
porting factor for the government to continue
its debt spending,” the report observed.
It said that, in the light of the challenges for
2010, the forecast for Japan’s growth remained
unchanged at 1.1 per cent, following the minus
5.3 per cent recorded for 2009.
In the Euro-zone, economic conditions as
a whole had been mostly steady over the last
months. However, the situation in some parts
of the region had worsened, particularly in
Greece and Spain, while the main economies
— Germany and France — had continued their
slight improvement. But even there, the first
signs of potential worries were emerging.
Industrial production in Germany surpris-
ingly declined by 2.6 per cent in December
2009, following growth of 0.7 per cent in
November. Industrial orders declined by 2.3
per cent in December, after increasing by 2.7
per cent in November.
The Euro-zone unemployment rate reached
ten per cent in December, compared with 9.9
per cent in November. Germany was the most
successful of the bigger Euro-zone economies
in fighting unemployment, which came in at 7.5
per cent for the third consecutive month.
Business sentiment has improved in the
Euro-zone. The Markit Euro-zone manufactur-
ing purchasing managers’ index rose to 52.4 in
January, compared with 51.6 in December 2009,
and above an earlier ‘flash’ estimate of 52.0. The
increase was driven by France, with Germany
and Italy also contributing to the improvement.
The OPEC report stated that a major prob-
lem in the Euro-zone was the mounting public
debt of some of its member countries, particu-
larly Greece.
“This weakening financial situation of many
Euro-zone countries might push up the interest
rates investors are demanding for financing this
debt and this might put public finances in some
of the Euro-zone countries under considerable
pressure,” it warned.
Euro-zone countries had borrowed a record
110 billion euros already this year from financial
markets, pushing up the cost of debt and forc-
ing nations with the weakest public finances to
pay a higher price for the increased deficits.
“The many uncertainties in the real
economy in the Euro-zone and in the public
finances led to the forecast for 2010 remaining
unchanged at expected growth of 0.6 per cent,
following a decline of 3.9 per cent last year,”
said the report.
In Russia, the National Statistics Office,
announced in preliminary data that the econ-
omy shrank by 7.9 per cent in 2009, after grow-
ing by 5.6 per cent a year earlier. The Russian
economy recovered in the third quarter, but
improvements were still rather weak and its
sustainability uncertain.
Russia’s manufacturing sector showed
signs of recovery at the start of 2010. Output
rose for the sixth straight month and at a faster
rate, as new orders increased for the first time
since last October. Employment continued to
fall, but at a much slower rate than the trend
pace recorded over late 2008 and 2009.
Inflationary pressures strengthened, but
remained relatively weak. The forecast of 3.0
per cent growth in Russia’s GDP was based on
the effect of the delayed impact of the gov-
ernment’s large stimulus package, an upturn
in external demand and lower interest rates.
Private consumption was predicted to recover
at a healthy pace, while the danger of non-per-
forming loans might represent a big challenge
to the financial sector.
The report staid that, in the group of
Developing Countries, inflation was appear-
ing as a growing risk across most of developing
Asia. The rise of inflationary pressure in recent
months was due to the rapid economic recovery
in the region after the recession in early 2009.
“While rising demand is welcomed to stim-
ulate growth, it has exposed those countries to
price instability, pushing policymakers to take
a tougher stand on expansionary policies.”
57
OPE
C bu
lleti
n 3/
10
Economic growth in China exceeded the
government’s aim of average real GDP growth
of 8.0 per cent in 2009, posting full-year growth
of 8.7 per cent.
“It is estimated that the above-target per-
formance was driven mainly by infrastructure
investment linked to the government’s stimu-
lus package and a rebound in expenditure on
property development.”
Although real GDP was forecast to grow
by 9.1 per cent in 2010, the growth trend was
predicted to decelerate throughout the year. In
2011, the rate of expansion was forecast to fall
even further.
“This reflects the introduction of gradual
tightening measures and furthermore the fading
impact of the government’s stimulus efforts.”
In India, the IMF had projected economic
growth for fiscal 2010–11 at 8.0 per cent
and 6.7 per cent for the current fiscal year. It
attributed India’s prompt fiscal and monetary
easing to the speedy recovery from the global
meltdown.
Recent data showed that the industrial sec-
tor continued to strengthen in November 2009,
as year-on-year output growth hit a two-year
high of 11.7 per cent. This followed a 10.3 per
cent expansion in October.
Although agricultural output for the cur-
rent fiscal year was estimated to decline by
1.0 per cent, due to a drought, non-agricultural
GDP growth was likely to increase. Job growth
was expected to support private consumption.
Investments were likely to improve against a
background of booming corporate profits, ris-
ing business confidence and favorable financ-
ing conditions.
In OPEC Member Countries, recent data
published by the Central Department of
Statistics and Information in Saudi Arabia
showed that annualized inflation in the Kingdom
had accelerated for the second consecutive
month in December 2009 to 4.2 per cent from
4.0 per cent the previous month.
Consumer prices increased by 0.4 per cent
in December, compared with 0.3 per cent in
November.
The Kingdom’s annual inflation came down
from a record high of 11.1 per cent in July 2008
to a two-year low of 3.5 per cent in October
2009.
World oil demand
In its review of the market, the OPEC report
said that “with 2009 behind us and the eco-
nomic recovery ongoing, the uncertainties
impacting oil demand are expected to remain
for some time.”
It pointed out that oil demand in 2009
plunged heavily as a result of the world finan-
cial crisis. Demand continued its downward
slide from the year before last, bottoming out
in the first quarter of 2009 with a deficit of 3.0
million barrels/day.
Demand for OPEC crude in 2009 had been
revised up by around 130,000 b/d to stand at
28.8m b/d, driven by an upward revision to the
fourth quarter amounting to 400,000 b/d.
“This change resulted from an upward
revision in world oil demand combined with
a downward revision in non-OPEC supply and
OPEC NGLs as some up-to-date data has become
available for Member Countries. Demand for
OPEC crude in 2009 still represents a consid-
erable decline of 2.2m b/d from the previous
year,” the report stated.
It said the first half of the year experi-
enced negative growth of around 3.0m b/d,
compared with the same period the previous
year. However, the decline was seen narrowing
in the second half to show a loss of only 1.1m
b/d in the fourth quarter.
Non-OECD regions managed to recover
quickly in 2009, registering 500,000 b/d
growth in the second quarter and hitting 1.3m
b/d growth in the last three months of the year.
However, this strong recovery could not
offset the massive slide in OECD oil demand,
which bottomed out in the second quarter at
minus 2.9m b/d, resulting from a partial halt in
the region’s industrial production.
Cold weather in December, improved eco-
nomic activity, and a low base line in 2008
pushed oil demand up in the OECD, which
reduced the region’s oil demand decline to only
300,000 b/d.
Given the negative impact of the global
financial crisis, world oil demand was estimated
to have declined by 1.4m b/d, or 1.6 per cent,
in 2009, unchanged from the previous report.
In looking at a regional breakdown for last
year, the report said North America oil demand
was forecast to have declined by 900,000 b/d
in 2009 to an average of 23.3m b/d.
In OECD Europe, oil demand was forecast
to have declined by 700,000 b/d in 2009 to
average 14.7m b/d.
In the OECD Pacific region, oil demand was
forecast to have declined by 400,000 b/d in
2009 to average 7.7m b/d.
In the group of Developing Countries, and
as a consequence of strong Asian demand, oil
demand growth was forecast at 500,000 b/d
in 2009, averaging 25.8m b/d.
Turning to oil demand in 2010, the OPEC
report said the slow pace of recovery in the
world economy was putting pressure on oil
demand.
Growth in 2010 would be completely due
to non-OECD regions. “World oil demand is
forecast to grow by 800,000 b/d from 2009 to
average 85.1m b/d in 2010, broadly unchanged
from the previous month’s report.”
Demand for OPEC crude in 2010 was pro-
jected to average 28.8m b/d, following an
upward revision of 150,000 b/d from the pre-
vious assessment with OPEC NGLs experienc-
ing a downward revision. However, world oil
demand and non-OPEC supply remained almost
unchanged.
“World oil demand is
forecast to grow by 800,000
b/d from 2009 to average
85.1m b/d in 2010, broadly
unchanged from the
previous month’s report.”
58
OPE
C bu
lleti
n 3/
10M
ark
et
Re
vie
w On a quarterly basis, with the exception of
the third quarter, all quarters saw an upward
revision.
Required demand for OPEC crude was fore-
cast to remain almost at the same level as last
year, following two consecutive annual declines.
“The first half of the year is still showing
a drop of 300,000 b/d, while the second half
is estimated to see positive growth of around
300,000 b/d in the third quarter and 200,000
b/d in the fourth,” said the report
It stressed that US demand was a key
uncertainty for this year. Having a low base
for oil consumption, as a result of the decline
in consumption over the last two years, was a
positive factor; however, this could be easily
undermined by a continuation of the low oil
demand seen in most all sectors.
It reported that cold weather did manage
to strengthen heating and fuel oil demand in
the US, but declining consumption in the indus-
trial sector had pushed the country’s total oil
demand into the negative so far this year.
“It is expected that the recovery will
strengthen in the second half of the year;
however the risk is high that the country’s oil
demand will slide back further.”
The 1.0 per cent forecast growth in US oil
demand this year was facing a set of obstacles
that could prevent it from materializing.
“If this happens, then US oil demand might
come in flat, if not negative, for the total year. It
is all connected to the pace of recovery, which,
in turn, depends on how much the government
is able to stimulate the economy and tackle
unemployment.”
It was forecast that the expected economic
recovery this year would minimize the loss in
OECD oil demand by over 90 per cent; hence,
this was tied to the recovery of the US economy.
“The US, which consumes less than one-
fourth of the total oil consumed worldwide, is
a key country to world oil demand changes,”
the report observed.
It stated that the January cold winter
weather within the OECD region did not offset
the decline in oil use experienced in other sec-
tors of the economy.
The two largest auto manufacturers in the
US (GM and Ford) reported an increase in sales
of 14 per cent and 25 per cent, respectively, in
January. In addition, two airlines reported an
increase in air travel.
“However, this did not stop the country’s
oil demand from seeing a 1.9 per cent decline
in January,” observed the report.
Industrial oil use was very low, result-
ing from low manufacturing activities. Initial
January data indicated a continued decline in
US oil demand, despite the increase in heating
oil use. Distillate fuel oil use hit bottom with
more than an 8.0 per cent decline.
“The use of other products, such as gaso-
line, is sliding into the negative as well. Should
this early weekly data materialize and continue
in the second month of the year, then the coun-
try’s total oil demand growth forecast will be
revised down.”
In total, US oil consumption was 400,000
b/d less in January than a year ago. “US oil
demand is the wild card to the total world oil
demand growth forecast. Should the country’s
oil use continue its decline for the first quarter,
despite the cold winter, then oil demand in the
second quarter will be lower as well.”
The report said the country’s economy was
still recovering, industrial production was low
and new car registrations were below normal,
indicating that oil demand was not likely to
return to its normal trend.
In Europe, oil demand in the ‘big four’ was
forecast to shrink by more than 2.0 per cent in
2010.
Germany’s oil demand was expected to
decline by 50,000 b/d this year; however this
was half of what was seen last year. France, on
the other hand, was slated to experience the
same decline as last year.
Other countries within the region were
experiencing a slowdown in new car sales, due
to the economic turmoil.
OECD Europe oil demand was anticipated
to decline by 200,000 b/d in 2010, up from a
700,000 b/d decline in 2009.
The OPEC report said that, in the Asia
Pacific, the two largest oil-consuming coun-
tries were contradicting each other in the oil-
consumption trend for this year.
It was expected that Japan would reduce
its oil use by more than 4.0 per cent in 2010,
while South Korea was forecast to increase its
oil use by 1.0 per cent.
Industrial and transport fuel use were the
two sectors expected to positively affect South
Korea’s total oil demand for 2010.
“The year has started with a cold winter
in the Pacific, causing the region’s heating oil
usage to slightly increase; however some heat-
ing demand was met by other fuels,” said the
report.
Given the hope for a positive US oil demand
trend, OECD oil demand was forecast to dip
below the line by only 0.3 per cent in 2010 to
average 45.5m b/d.
Turning to the non-OECD region, the
report said healthy economic growth in China,
India, the Middle East, and Latin America was
expected to contribute to higher demand growth
in 2010 in comparison with last year.
Non-OECD new vehicle sales, especially
in China, were expected to be strong, result-
ing from the stimulus plans that were started
last year.
It said the economic boom in the Middle
East had continued to bolster regional oil
demand. It was expected that Middle East oil
demand would grow by 3.2 per cent in 2010.
“Given its sturdy economy, there is an
upward risk for the region’s oil demand forecast.
It is expected that the oil demand quarterly dis-
tribution growth will follow normal seasonality,
peaking in the third quarter,” said the report.
Other Asia oil demand was forecast to
also grow, led by strong consumption in India.
India’s oil demand was expected to be in line
with last year’s level. The industrial, transpor-
tation and agricultural sectors were forecast to
show a healthy performance, stimulating the
country’s oil demand to grow by 5.0 per cent
in 2010.
In China, following a bumpy 2009, oil
demand was expected to grow the most in 2010
— reaching 4.5 per cent and adding another
370,000 b/d to the country’s oil consumption
pool. First quarter oil demand was expected to
increase by 500,000 b/d with a strong trend
throughout the year.
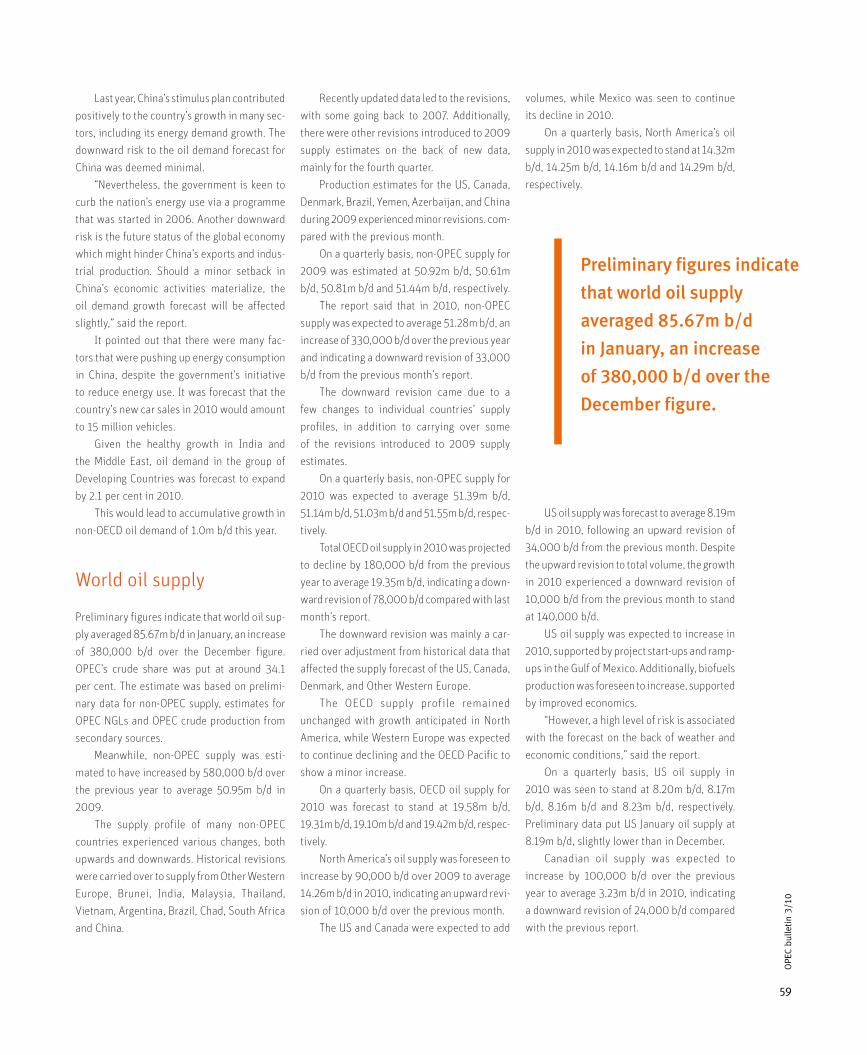
59
OPE
C bu
lleti
n 3/
10
Last year, China’s stimulus plan contributed
positively to the country’s growth in many sec-
tors, including its energy demand growth. The
downward risk to the oil demand forecast for
China was deemed minimal.
“Nevertheless, the government is keen to
curb the nation’s energy use via a programme
that was started in 2006. Another downward
risk is the future status of the global economy
which might hinder China’s exports and indus-
trial production. Should a minor setback in
China’s economic activities materialize, the
oil demand growth forecast will be affected
slightly,” said the report.
It pointed out that there were many fac-
tors that were pushing up energy consumption
in China, despite the government’s initiative
to reduce energy use. It was forecast that the
country’s new car sales in 2010 would amount
to 15 million vehicles.
Given the healthy growth in India and
the Middle East, oil demand in the group of
Developing Countries was forecast to expand
by 2.1 per cent in 2010.
This would lead to accumulative growth in
non-OECD oil demand of 1.0m b/d this year.
World oil supply
Preliminary figures indicate that world oil sup-
ply averaged 85.67m b/d in January, an increase
of 380,000 b/d over the December figure.
OPEC’s crude share was put at around 34.1
per cent. The estimate was based on prelimi-
nary data for non-OPEC supply, estimates for
OPEC NGLs and OPEC crude production from
secondary sources.
Meanwhile, non-OPEC supply was esti-
mated to have increased by 580,000 b/d over
the previous year to average 50.95m b/d in
2009.
The supply profile of many non-OPEC
countries experienced various changes, both
upwards and downwards. Historical revisions
were carried over to supply from Other Western
Europe, Brunei, India, Malaysia, Thailand,
Vietnam, Argentina, Brazil, Chad, South Africa
and China.
Recently updated data led to the revisions,
with some going back to 2007. Additionally,
there were other revisions introduced to 2009
supply estimates on the back of new data,
mainly for the fourth quarter.
Production estimates for the US, Canada,
Denmark, Brazil, Yemen, Azerbaijan, and China
during 2009 experienced minor revisions. com-
pared with the previous month.
On a quarterly basis, non-OPEC supply for
2009 was estimated at 50.92m b/d, 50.61m
b/d, 50.81m b/d and 51.44m b/d, respectively.
The report said that in 2010, non-OPEC
supply was expected to average 51.28m b/d, an
increase of 330,000 b/d over the previous year
and indicating a downward revision of 33,000
b/d from the previous month’s report.
The downward revision came due to a
few changes to individual countries’ supply
profiles, in addition to carrying over some
of the revisions introduced to 2009 supply
estimates.
On a quarterly basis, non-OPEC supply for
2010 was expected to average 51.39m b/d,
51.14m b/d, 51.03m b/d and 51.55m b/d, respec-
tively.
Total OECD oil supply in 2010 was projected
to decline by 180,000 b/d from the previous
year to average 19.35m b/d, indicating a down-
ward revision of 78,000 b/d compared with last
month’s report.
The downward revision was mainly a car-
ried over adjustment from historical data that
affected the supply forecast of the US, Canada,
Denmark, and Other Western Europe.
The OECD supply profile remained
unchanged with growth anticipated in North
America, while Western Europe was expected
to continue declining and the OECD Pacific to
show a minor increase.
On a quarterly basis, OECD oil supply for
2010 was forecast to stand at 19.58m b/d,
19.31m b/d, 19.10m b/d and 19.42m b/d, respec-
tively.
North America’s oil supply was foreseen to
increase by 90,000 b/d over 2009 to average
14.26m b/d in 2010, indicating an upward revi-
sion of 10,000 b/d over the previous month.
The US and Canada were expected to add
volumes, while Mexico was seen to continue
its decline in 2010.
On a quarterly basis, North America’s oil
supply in 2010 was expected to stand at 14.32m
b/d, 14.25m b/d, 14.16m b/d and 14.29m b/d,
respectively.
US oil supply was forecast to average 8.19m
b/d in 2010, following an upward revision of
34,000 b/d from the previous month. Despite
the upward revision to total volume, the growth
in 2010 experienced a downward revision of
10,000 b/d from the previous month to stand
at 140,000 b/d.
US oil supply was expected to increase in
2010, supported by project start-ups and ramp-
ups in the Gulf of Mexico. Additionally, biofuels
production was foreseen to increase, supported
by improved economics.
“However, a high level of risk is associated
with the forecast on the back of weather and
economic conditions,” said the report.
On a quarterly basis, US oil supply in
2010 was seen to stand at 8.20m b/d, 8.17m
b/d, 8.16m b/d and 8.23m b/d, respectively.
Preliminary data put US January oil supply at
8.19m b/d, slightly lower than in December.
Canadian oil supply was expected to
increase by 100,000 b/d over the previous
year to average 3.23m b/d in 2010, indicating
a downward revision of 24,000 b/d compared
with the previous report.
Preliminary figures indicate
that world oil supply
averaged 85.67m b/d
in January, an increase
of 380,000 b/d over the
December figure.
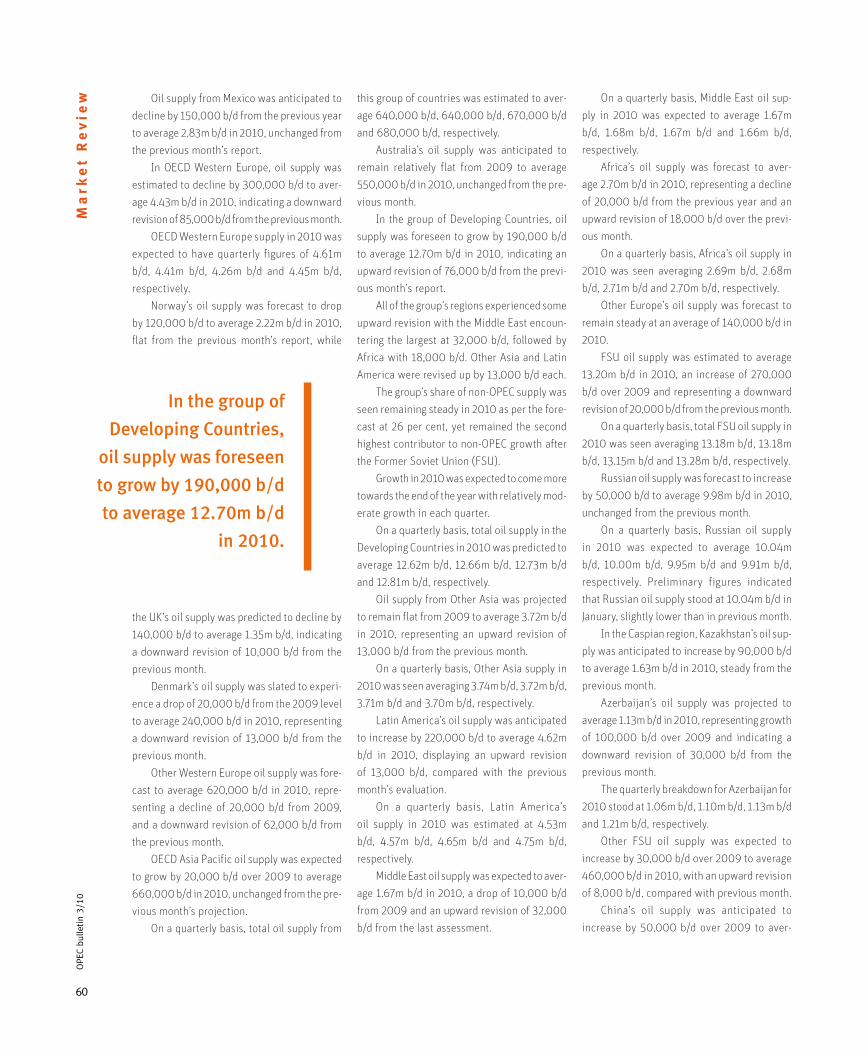
60
OPE
C bu
lleti
n 3/
10M
ark
et
Re
vie
w Oil supply from Mexico was anticipated to
decline by 150,000 b/d from the previous year
to average 2.83m b/d in 2010, unchanged from
the previous month’s report.
In OECD Western Europe, oil supply was
estimated to decline by 300,000 b/d to aver-
age 4.43m b/d in 2010, indicating a downward
revision of 85,000 b/d from the previous month.
OECD Western Europe supply in 2010 was
expected to have quarterly figures of 4.61m
b/d, 4.41m b/d, 4.26m b/d and 4.45m b/d,
respectively.
Norway’s oil supply was forecast to drop
by 120,000 b/d to average 2.22m b/d in 2010,
flat from the previous month’s report, while
the UK’s oil supply was predicted to decline by
140,000 b/d to average 1.35m b/d, indicating
a downward revision of 10,000 b/d from the
previous month.
Denmark’s oil supply was slated to experi-
ence a drop of 20,000 b/d from the 2009 level
to average 240,000 b/d in 2010, representing
a downward revision of 13,000 b/d from the
previous month.
Other Western Europe oil supply was fore-
cast to average 620,000 b/d in 2010, repre-
senting a decline of 20,000 b/d from 2009,
and a downward revision of 62,000 b/d from
the previous month.
OECD Asia Pacific oil supply was expected
to grow by 20,000 b/d over 2009 to average
660,000 b/d in 2010, unchanged from the pre-
vious month’s projection.
On a quarterly basis, total oil supply from
this group of countries was estimated to aver-
age 640,000 b/d, 640,000 b/d, 670,000 b/d
and 680,000 b/d, respectively.
Australia’s oil supply was anticipated to
remain relatively flat from 2009 to average
550,000 b/d in 2010, unchanged from the pre-
vious month.
In the group of Developing Countries, oil
supply was foreseen to grow by 190,000 b/d
to average 12.70m b/d in 2010, indicating an
upward revision of 76,000 b/d from the previ-
ous month’s report.
All of the group’s regions experienced some
upward revision with the Middle East encoun-
tering the largest at 32,000 b/d, followed by
Africa with 18,000 b/d. Other Asia and Latin
America were revised up by 13,000 b/d each.
The group’s share of non-OPEC supply was
seen remaining steady in 2010 as per the fore-
cast at 26 per cent, yet remained the second
highest contributor to non-OPEC growth after
the Former Soviet Union (FSU).
Growth in 2010 was expected to come more
towards the end of the year with relatively mod-
erate growth in each quarter.
On a quarterly basis, total oil supply in the
Developing Countries in 2010 was predicted to
average 12.62m b/d, 12.66m b/d, 12.73m b/d
and 12.81m b/d, respectively.
Oil supply from Other Asia was projected
to remain flat from 2009 to average 3.72m b/d
in 2010, representing an upward revision of
13,000 b/d from the previous month.
On a quarterly basis, Other Asia supply in
2010 was seen averaging 3.74m b/d, 3.72m b/d,
3.71m b/d and 3.70m b/d, respectively.
Latin America’s oil supply was anticipated
to increase by 220,000 b/d to average 4.62m
b/d in 2010, displaying an upward revision
of 13,000 b/d, compared with the previous
month’s evaluation.
On a quarterly basis, Latin America’s
oil supply in 2010 was estimated at 4.53m
b/d, 4.57m b/d, 4.65m b/d and 4.75m b/d,
respectively.
Middle East oil supply was expected to aver-
age 1.67m b/d in 2010, a drop of 10,000 b/d
from 2009 and an upward revision of 32,000
b/d from the last assessment.
On a quarterly basis, Middle East oil sup-
ply in 2010 was expected to average 1.67m
b/d, 1.68m b/d, 1.67m b/d and 1.66m b/d,
respectively.
Africa’s oil supply was forecast to aver-
age 2.70m b/d in 2010, representing a decline
of 20,000 b/d from the previous year and an
upward revision of 18,000 b/d over the previ-
ous month.
On a quarterly basis, Africa’s oil supply in
2010 was seen averaging 2.69m b/d, 2.68m
b/d, 2.71m b/d and 2.70m b/d, respectively.
Other Europe’s oil supply was forecast to
remain steady at an average of 140,000 b/d in
2010.
FSU oil supply was estimated to average
13.20m b/d in 2010, an increase of 270,000
b/d over 2009 and representing a downward
revision of 20,000 b/d from the previous month.
On a quarterly basis, total FSU oil supply in
2010 was seen averaging 13.18m b/d, 13.18m
b/d, 13.15m b/d and 13.28m b/d, respectively.
Russian oil supply was forecast to increase
by 50,000 b/d to average 9.98m b/d in 2010,
unchanged from the previous month.
On a quarterly basis, Russian oil supply
in 2010 was expected to average 10.04m
b/d, 10.00m b/d, 9.95m b/d and 9.91m b/d,
respectively. Preliminary figures indicated
that Russian oil supply stood at 10.04m b/d in
January, slightly lower than in previous month.
In the Caspian region, Kazakhstan’s oil sup-
ply was anticipated to increase by 90,000 b/d
to average 1.63m b/d in 2010, steady from the
previous month.
Azerbaijan’s oil supply was projected to
average 1.13m b/d in 2010, representing growth
of 100,000 b/d over 2009 and indicating a
downward revision of 30,000 b/d from the
previous month.
The quarterly breakdown for Azerbaijan for
2010 stood at 1.06m b/d, 1.10m b/d, 1.13m b/d
and 1.21m b/d, respectively.
Other FSU oil supply was expected to
increase by 30,000 b/d over 2009 to average
460,000 b/d in 2010, with an upward revision
of 8,000 b/d, compared with previous month.
China’s oil supply was anticipated to
increase by 50,000 b/d over 2009 to aver-
In the group of
Developing Countries,
oil supply was foreseen
to grow by 190,000 b/d
to average 12.70m b/d
in 2010.

61
OPE
C bu
lleti
n 3/
10
age 3.90m b/d in 2010, indicating a down-
ward revision of 11,000 b/d from the previous
month.
The quarterly figures for China’s oil sup-
ply for 2010 were put at 3.89m b/d, 3.87m b/d,
3.93m b/d and 3.92m b/d, respectively.
OPEC oil production
Total OPEC crude oil production in January
averaged 29.19m b/d, an increase of 63,000
b/d over the previous month, according to sec-
ondary sources.
OPEC production, not including Iraq, aver-
aged 26.80m b/d, up by 148,000 b/d from
December. Declines of 124,000 b/d and 85,000
b/d were recorded for Nigeria and Iraq, while
Angola and Venezuela indicated increases of
133,000 b/d and 105,000 b/d, respectively.
OPEC’s output of NGLs and non-conven-
tional oils was forecast to average 5.10m b/d
in 2010, representing growth of 510,000 b/d
over the previous year.
In 2009, production of OPEC NGLs was esti-
mated to have averaged 4.59m b/d, an increase
of 260,000 b/d over 2008.
Downstream activity
Looking downstream, the OPEC report stated
that a cautious and strategic operational
approach by refiners, coupled with higher sea-
sonal demand, led to improving product market
fundamentals in January.
However, mild weather in the latter part of
the month adversely affected the earlier bull-
ishness of the product market and capped the
improvements in refining margins seen.
“Recent heavy snow in the US may trig-
ger another bullish development in the prod-
uct market, but may not be sufficient to sup-
port products and crude in the short-term, as
the market continues to suffer from sluggish
demand growth,” it observed.
Refining margins in the US extended their
upward trend, with margins for WTI crude oil
on the US Gulf Coast rising by 73¢ to reach
$5.30/b in January from $4.57/b the previous
month.
In Europe, the refining industry’s perform-
ance was weak and the cold weather there
could not boost product market sentiment, as
end users relied on tertiary stocks, rather than
spot market purchases.
Refining margins for Brent crude oil in
Rotterdam fell by 42¢ to $1.17/b in January from
$1.59/b in December.
In Asia, due to higher regional demand and
export opportunities to other markets, refining
economics improved from the previous month,
but remained unhealthy.
Refining margins for Dubai crude oil in
Singapore rose by $1.40/b to minus 24¢/b in
January from minus $1.64/b a month earlier.
“Looking ahead, with the approaching end
of the winter season and the slow recovery of
demand in the developed countries, as well as
comfortable product stocks and idle refining
capacity, product market sentiment is expected
to remain subdued and will not be able to lift
crude prices in the future,” the report main-
tained.
It said that disappointing reports about
downstream performance in the last quarter
of 2009, amid the huge product stocks both
onshore and offshore, had forced integrated and
independent refinery companies to revisit their
operational plans and to remove the imbalance
in the product market.
“This situation has encouraged many major
oil companies to change their business plans
in the refining industry. They will either con-
tinue closing down their less profitable units,
or switch their refining businesses to devel-
oping countries. Under such circumstances,
refiners, especially in the US and Europe, have
taken a very cautious and strategic operational
approach and are not maintaining typical opera-
tion levels in January,” the report observed.
Refinery utilization rates in the US slid by
1.2 per cent to reach 79.1 per cent in January
from 80.3 per cent in December, whereas typi-
cally they should be at around the 90 per cent
mark.
Slow recovery of demand and huge prod-
uct stocks also negatively affected European
refinery utilization rates, which fell by 0.8 per
cent to 81.5 per cent in January from 82.3 per
cent the previous month.
In Asia, there was still mixed developments
in the refining industry and throughput levels.
On the one hand, Chinese refiners were running
at maximum capacity, but on the other, the rest
were running at much lower-than-typical sea-
sonal levels.
Refinery utilization rates in Japan rose mar-
ginally by 0.1 per cent in January to 85.5 per
cent from 83.4 per cent in December.
“With the end of the winter season
approaching and the start of the spring refinery
season, especially in the Atlantic Basin, refin-
ery utilization rates are expected to remain
low in the coming months. Comfortable prod-
uct stocks and a persistently slow recovery in
demand will contribute to a pessimistic out-
look for refinery utilization rates in the future,”
the report said.
Oil trade
In the US, crude oil imports averaged 8.43m b/d
in January, higher by 450,000 b/d than in the
previous month, but 14 per cent, or 1.41m b/d,
down from the same month in 2009.
US product imports in January rose by
11.2 per cent, or 280,000 b/d, compared with
December, to average 2.80m b/d, but showed
a decline of 16 per cent, or 540,000 b/d, from
the same month a year ago.
Total OPEC crude oil
production in January
averaged 29.19m b/d, an
increase of 63,000 b/d
over the previous month,
according to secondary
sources.

62
OPE
C bu
lleti
n 3/
10M
ark
et
Re
vie
w Finished motor gasoline imports were
put at 214,000 b/d in January, compared
with 201,000 b/d in December, and were
3.8 per cent lower than the same month
in 2009.
Distillate imports in January were recorded
at 476,000 b/d, compared with 264,000
b/d the previous month, and 249,000 b/d a
year earlier.
Meanwhile, US oil product exports fell in
January, compared with the previous month,
averaging 1.75m b/d. On an annual basis, prod-
uct exports were 18 per cent, or 264,000 b/d,
higher.
As a result, US net oil imports in January
were 11 per cent, or 930,000 b/d, higher, com-
pared the the previous month to average 9.44m
b/d. This was the result of a 450,000 b/d rise
in net crude oil imports and 480,000 b/d in
net product imports, both compared with the
previous month.
January net oil imports were 19 per cent
lower than a year earlier. Average net oil imports
in 2009 were put at 10.02m b/d, representing
a loss of ten per cent, or 1.13m b/d, from the
preceding year.
According to latest official data, Japan’s
crude oil imports in December 2009 increased
by 14 per cent, or 518,000 b/d, to average
4.19m b/d. This was slightly higher than the
same month a year ago.
Japan’s product imports were slightly
higher in December, compared with the previ-
ous month, at about 1.06m b/d and displayed
an annual decline of 4.6 per cent.
Naphtha and LPG imports accounted for
most of the country’s total monthly product
imports in December. Fuel oil imports in the
month averaged 41,000 b/d, compared with
17,000 b/d the previous month and 68,000
b/d a year ago.
In annual terms, Japan’s product imports
averaged 1.02m b/d in 2009, representing a
decline of 120,000 b/d, or 11 per cent, from
the previous year.
Japan’s product exports averaged 594,000
b/d in December, 5.0 per cent, or 27,000 b/d,
higher than in the previous month, but 19 per
cent lower than in the same month a year ago.
Gasoil (39 per cent), fuel oil (30 per cent)
and jet fuel (22 per cent), the country’s main
product exports, accounted for about 92
per cent of Japan’s total product exports in
December.
Average product exports stood at 636,000
b/d in 2009, 58,000 b/d lower than in the pre-
vious year.
As a result, Japan’s net oil imports in
December were put at 4.65m b/d, an increase
of 503,000 b/d, or 12 per cent, compared with
the previous month and steady compared with
a year earlier.
Net crude imports were higher by 518,000
b/d, while net product imports were up by
52,000 b/d.
Japan’s net oil imports during 2009 were
put at 4.0m b/d, representing a drop of 14 per
cent, or 636,000 b/d, over 2008.
Saudi Arabia was Japan’s top crude oil sup-
plier in December with 1.17m b/d, or 29 per
cent, of Japan’s total crude oil imports, down
from 1.24m b/d in the previous month.
The Kingdom was followed by the UAE,
which supplied Japan with 860,000 b/d, up
from 740,000 b/d a month earlier. Iran sup-
plied 500,000 b/d, compared with 310,000
b/d in December 2009.
Altogether, OPEC Member Countries sup-
plied 3.54m b/d, or 87.4 per cent, of Japan’s
crude oil imports in December, up from 3.07m
b/d the previous month.
On the product side, with the exclusion
of LPG imports, preliminary data indicated
that Saudi Arabia was Japan’s top supplier in
December with 210,000 b/d, up from 187,000
b/d the previous month.
It was again followed by the UAE, with
137,000 b/d, down from 121,000 b/d.
Altogether, OPEC Member Countries sup-
plied 480,000 b/d, or 70 per cent, of Japan’s
product imports in December, down from
550,000 b/d a month earlier.
According to official data, China’s crude
oil imports reached a monthly record high in
December 2009 of 5.02m b/d with annual crude
oil imports averaging 4.10m b/d in 2009 for the
first time.
Imports of oil products for the full year
stood at 1.0m b/d, 4.4 per cent higher than in
2008.
Crude oil imports in 2009 exceeded local
crude production with a share of 56 per cent
of apparent demand.
In December 2009, China became a net
exporter of gasoline for the first time in 15 years
with a volume of 270,000 b/d. Exports of gaso-
line in 2009 on average stood at 115,000 b/d,
compared with 48,000 b/d the previous year.
Average imports of diesel declined to
450,000 b/d for 2009, compared with a
year earlier.
Due to increased activity in the petrochem-
icals sector, China become a net importer of
naphtha for the first time, reaching 42,000 b/d
in 2009, compared with net exports of 18,000
b/d a year earlier.
Imports of fuel oil increased by 75,000
b/d in December, compared with the previous
month to average 108,000 b/d, based on grow-
ing demand from local refineries.
Despite the increase of naphtha and fuel
oil imports, the surge in exports of gaso-
line and diesel reduced the country’s total
net product imports by 24 per cent on an
annual basis.
With the increase in imports of crude oil and
other products, China’s net oil imports rose by
8.0 per cent to 4.39m b/d in 2009, compared
with a year earlier.
In 2009, Saudi Arabia was China’s top
crude oil supplier with 840,000 b/d, followed
In December 2009,
China became a net
exporter of gasoline
for the first time in 15
years with a volume of
270,000 b/d.

63
OPE
C bu
lleti
n 3/
10
by Angola with 650,000 b/d and Iran with
460,000 b/d. OPEC Member Countries together
supplied 2.65m b/d of crude oil to China in
2009, which represented a 64.7 per cent share
of total crude oil imports to the country.
According to preliminary data, India’s
crude oil imports were slightly lower in
December, compared with the previous month,
at 2.47m b/d.
December’s crude imports were 9,700 b/d
lower, compared with the same month a year
ago, while India’s crude oil imports for 2009
averaged 2.58m b/d, virtually unchanged from
a year earlier.
India’s product imports increased in
December by 12,000 b/d, compared with the
previous month, to average 240,000 b/d, which
was 40 per cent lower than in the same month
a year earlier.
For 2009, India imported an average of
280,000 b/d of oil products, compared with
420,000 b/d a year earlier, indicating a 34 per
cent annual decline.
The lower import figure was due to a decline
in exports in 2009, which came on the back of
reduced margins and overall sluggish global
market conditions.
India’s total product exports of 592,000
b/d in December were 43,000 b/d, or 7.0 per
cent, lower than in the previous month and 6.6
per cent down from a year earlier.
Gasoil exports in December averaged
118,000 b/d, down from 206,000 b/d the pre-
vious month and 272,000 b/d a year earlier.
As a result, India’s net oil imports in
December averaged 2.11m b/d, indicating a
decrease of 2.0 per cent, or 40,000 b/d, from
the previous month and 5.0 per cent lower
than a year earlier. Net product imports rose
by 55,000 b/d.
India’s net oil imports for the year aver-
aged 2.30m b/d, an increase of 4.0 per cent,
or 87,000 b/d, over 2008.
According to preliminary data, FSU crude
oil exports in December increased by 169,000
b/d, or 2.5 per cent, over the previous month to
average 6.85m b/d.
Russian crude oil exports in December
averaged 3.98m b/d, 170,000 b/d higher than
in the previous month, but 73,000 b/d lower
than a year earlier.
FSU product exports increased in December
by 151,000 b/d to average 2.91m b/d, from
2.76m b/d in the previous month.
In total, FSU crude oil and product exports
averaged 9.75m b/d in December, 322,000 b/d,
or 3.4 per cent, higher than in the previous
month.
Total FSU exports for the month were put
at 550,000 b/d, or 5.9 per cent, higher than a
year ago.
In annual terms, total FSU crude and prod-
uct exports averaged 9.50m b/d in 2009, indi-
cating an increase of 880,000 b/d, or 10.1 per
cent, over the previous year. The increase was
attributable to both products and crude.
Alternative fuels
Assessing the alternative fuels market, the
OPEC report said that biofuels production
had been negatively affecting food prices as
output required the use of a large quantity of
various foods; in addition, farmers were using
more land to supply biofuel needs at the cost
of producing food.
It said US authorities were mandating
the use of one million plug-in hybrid vehicles
by 2015. This move would reduce the use of
gasoline by 150,000 b/d annually, as claimed
by the US; however it would not be as green
as it claimed, as emissions would result from
the use of electric power plants instead.
The positive side of such an initiative was
that the industry would work on designing more
efficient trucks in the future.
The report noted that the Philippines was
having problems because the cost of imported
ethanol and sugarcane was soaring, as a result
of excessive production of biofuels worldwide.
Currently, the country was planning to
increase its mandated ethanol blend from five
per cent to ten per cent by 2011. Only heavy
subsidies and enforced rules would make such
a blend likely to materialize.
In Brazil, bad weather, along with the slow
world economy, had hurt the nation’s ethanol
industry. Low oil prices in 2009 had exposed
the unfeasibility of the biofuels industry.
The Brazilian government was worried that
a price drop during 2010 would put the indus-
try under extreme pressure, as was the case in
early 2009. The biofuels industry had enjoyed
a time of high oil prices which made it feasible
for its operations to continue.
The report noted that Argentina was due
to implement a five per cent biodiesel blend,
starting in April 2010. This would amount to
17,500 b/d.
“Of course, this will reduce export quanti-
ties and incur some subsidy costs for the gov-
ernment,” added the report.
In Italy, economic pressure had forced the
government to reduce its biofuel subsidies
this year. Doing so would result in no growth
in Italy’s production for the year.
Massive biofuel subsidies within the EU had
led to the biofuels industry to grow quickly; how-
ever governments were rethinking this policy,
not only due to the cost, but also the negative
environmental effects. The result would be that
the EU did not achieve its mandate of 5.75 per
cent in 2010.
Stock movements
Concerning stock movements, the OPEC report
said US commercial oil inventories at the end
of January fell for the fourth consecutive month
— by 3.0m b. However, the drop was well below
the decline experienced in recent months and
also much smaller than the seasonal draw of
about 18m b.
The fall in US commercial oil stocks was
driven by products, which outpaced the build
in crude oil inventories. At 1,046m b, total
commercial oil inventories stood at 32m
b, or 4.7 per cent, above a year earlier and
remained at comfortable levels with a surplus
of 61m b, or 6.2 per cent, above the five-year
average.
After showing a substantial draw in
December, US crude commercial stocks in
January observed a contra-seasonal build
of 1.7m b to 329.0m b. The build could be

64
OPE
C bu
lleti
n 3/
10M
ark
et
Re
vie
w attributed to the rise in crude oil imports, which
increased by 450,000 b/d to 8.4m b/d after a
sharp decline in the previous month.
The decline in US crude oil refinery input
below the December level also contributed
to the build. At 13.73m b/d, US crude runs
corresponded to a refinery utilization rate of
79 per cent.
“It is worth noting that during the week
ended January 29, refineries operated at 77.7
per cent of capacity, the lowest level since the
1990s, excluding hurricane-related losses. This
has resulted from a deterioration in US product
demand. Refineries are not ready to increase
their operations just for the sake of building
more inventories.
“This situation is likely to continue in the
coming months as there is no clear sign of
demand for US products to pick up, along with
more upcoming refinery maintenance and
companies shutting down due to very weak
demand,” observed the report.
In January, crude oil commercial invento-
ries stood at a 28.7m b, or 9.5 per cent, above
the five-year average. However, they remained
24m b, or 7.0 per cent, below the same period
in 2009.
In days of forward cover, US crude oil
inventories stood at 23.8 days, 2.3 days, or 11
per cent, more than the average of last year.
In contrast to the build in crude oil stocks,
US total product inventories declined by 4.7m b
in January, versus December, to stand at 717.0m
b. The draw came for the fourth consecutive
month.
Within products, the picture was mixed.
Gasoline stocks rose by 8.4m b to 228.1m b to
start the year with a comfortable level of 10.4m
b, or 4.8 per cent, above a year ago, widening
the surplus with the five-year average to 6.0m
b, or 2.5 per cent.
“The continued build in gasoline stocks for
the last three months of 2009 could be attrib-
uted to lower demand. In fact, gasoline con-
sumption decreased in January by 3.4 per cent,
or 300,000 b/d, versus the previous month, to
average 8.4m b/d.
“Even compared with the same period last
year, which was considered a low base for oil
consumption, gasoline demand was lower by
0.5 per cent.”
Distillate stocks, which contain heating oil
and diesel, fell by 2.5m b in January to 156.6m
b, driven by a drop in heating oil, as diesel oil
showed a build.
Despite the draw, total distillate inven-
tories remained at healthy levels, indicating
a surplus of 13.1m b, or 9.1 per cent, above a
year ago and 26m b, or 20 per cent, higher
than the seasonal norm.
“The surplus in middle distillates is unlikely
to narrow as demand for diesel is not expected
to rise, given that consumption in January
dropped by more than 9.0 per cent, versus a
year earlier, which was considered a very low
base year for diesel demand as a result of slug-
gish industrial production.”
Residual fuel and jet fuel oil stocks
increased by 2.5m b and 1.5m b to 39.7m b and
43.2m b, respectively, mainly due to a decline
in demand. Both products remained at healthy
levels above a year ago.
The US Strategic Petroleum Reserve (SPR)
at the end of January remained unchanged at
727m b and approaching capacity. The US
administration decided to cancel plans for
the SPR’s expansion, claiming that the cur-
rent emergency oil stockpile reserve was large
enough to handle any disruption in petroleum
supplies, and that current petroleum reserves
were adequate.
Indeed, the SPR could meet above 82 days
of US imports, expected to average 8.9m b/d in
2010. With the cancellation of the expansion
plan, the US administration would save $71m.
In Japan, preliminary indications, based
on weekly data published by the Petroleum
Association of Japan, showed that at the end
of January, the country’s commercial oil inven-
tories reversed the downward trend observed
during the last two months, increasing by 4.8m
b to 169.0m b.
Despite this build, Japanese oil invento-
ries remained 5.5m b, or 3.3 per cent, below
last year’s level. The build estimated in
January was split between crude and prod-
ucts, showing increases of 2.3m b and 2.5m
b, respectively.
At 94.8m b, crude oil inventories were 7.9m
b, or 8.0 per cent, below the seasonal norm.
For the week ending January 30, refiners
were operating at 82.2 per cent of capacity, 0.5
per cent lower than in the previous week, which
corresponded to crude runs of 4.64m b/d.
On the product side, the picture was mixed
among components with gasoline and fuel oil
stocks improving by 2.3m b and 1.5m b, respec-
tively, while distillates and naphtha inventories
experiencing a drop of 1.1m b and 300,000 b,
respectively.
In Singapore, preliminary data for the end
of January indicated that product inventories
stood at 43.7m b, around 1.3m b below the pre-
vious month, but 5.0m b above the same month
a year earlier.
Fuel oil stocks fell by 310,000 b for the
second consecutive month to stand at 18.7m
b, driven by stronger regional demand, com-
bined with lower imports. However, stocks
remained more than 6.3 per cent above a
year earlier.
Middle distillate inventories in Singapore
in January dropped by 600,000 b to stand
at 14.5m b, while light distillates declined by
300,000 b to 10.5m b, supported by higher
demand from Indonesia.
Preliminary data for product stocks in
ARA at the end of January showed a drop of
3.0m b versus December 2009 to stand at
39m b, or 7.0 per cent above the same month
a year earlier.
All products saw a decline with fuel oil
stocks falling by 1.4m b. The drop in fuel oil
stocks was driven by higher demand from
Northwest Europe and the Mediterranean,
which outpaced imports coming mainly from
Canada and Russia.
Gasoil inventories dropped by around 1.0m
b, but remained 16 per cent above a year ear-
lier as some volumes from floating storage went
into storage onland.
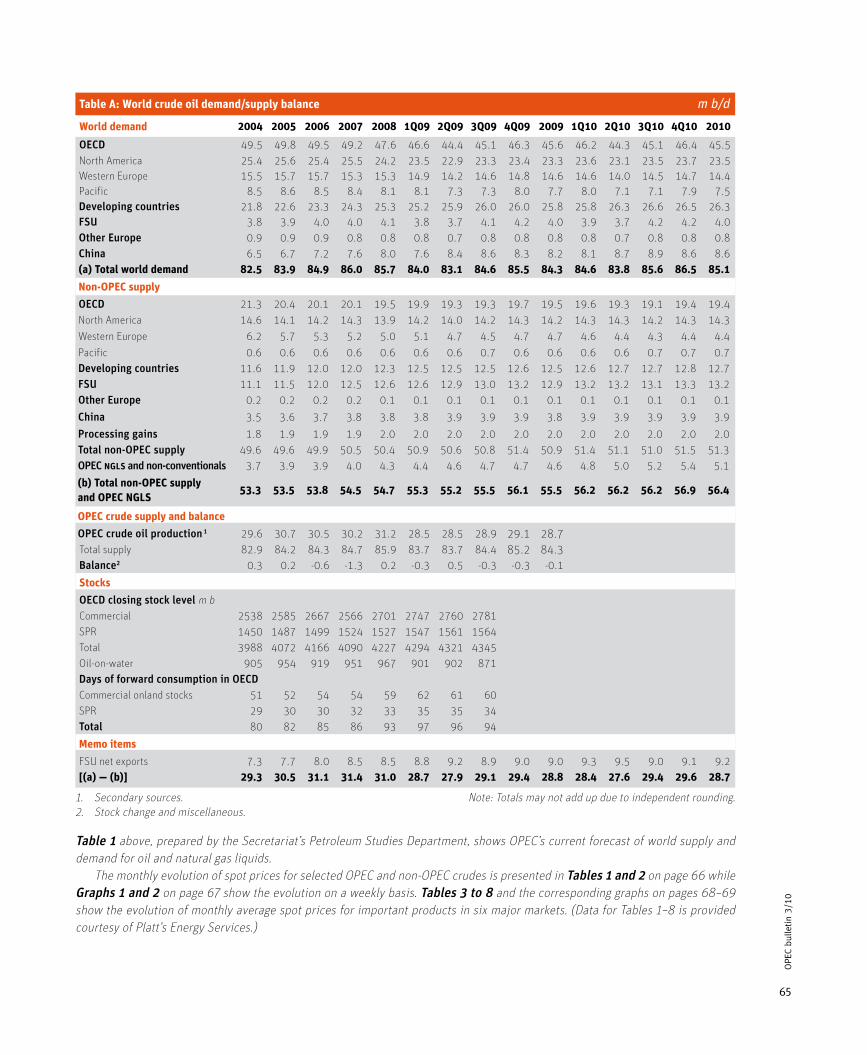
65
OPE
C bu
lleti
n 3/
10
Table A: World crude oil demand/supply balance m b/d
1. Secondary sources. Note: Totals may not add up due to independent rounding.2. Stock change and miscellaneous.
Table 1 above, prepared by the Secretariat’s Petroleum Studies Department, shows OPEC’s current forecast of world supply and demand for oil and natural gas liquids. The monthly evolution of spot prices for selected OPEC and non-OPEC crudes is presented in Tables 1 and 2 on page 66 while Graphs 1 and 2 on page 67 show the evolution on a weekly basis. Tables 3 to 8 and the corresponding graphs on pages 68–69 show the evolution of monthly average spot prices for important products in six major markets. (Data for Tables 1–8 is provided courtesy of Platt’s Energy Services.)
World demand 2004 2005 2006 2007 2008 1Q09 2Q09 3Q09 4Q09 2009 1Q10 2Q10 3Q10 4Q10 2010
OECD 49.5 49.8 49.5 49.2 47.6 46.6 44.4 45.1 46.3 45.6 46.2 44.3 45.1 46.4 45.5North America 25.4 25.6 25.4 25.5 24.2 23.5 22.9 23.3 23.4 23.3 23.6 23.1 23.5 23.7 23.5Western Europe 15.5 15.7 15.7 15.3 15.3 14.9 14.2 14.6 14.8 14.6 14.6 14.0 14.5 14.7 14.4Pacific 8.5 8.6 8.5 8.4 8.1 8.1 7.3 7.3 8.0 7.7 8.0 7.1 7.1 7.9 7.5Developing countries 21.8 22.6 23.3 24.3 25.3 25.2 25.9 26.0 26.0 25.8 25.8 26.3 26.6 26.5 26.3FSU 3.8 3.9 4.0 4.0 4.1 3.8 3.7 4.1 4.2 4.0 3.9 3.7 4.2 4.2 4.0Other Europe 0.9 0.9 0.9 0.8 0.8 0.8 0.7 0.8 0.8 0.8 0.8 0.7 0.8 0.8 0.8China 6.5 6.7 7.2 7.6 8.0 7.6 8.4 8.6 8.3 8.2 8.1 8.7 8.9 8.6 8.6(a) Total world demand 82.5 83.9 84.9 86.0 85.7 84.0 83.1 84.6 85.5 84.3 84.6 83.8 85.6 86.5 85.1
Non-OPEC supply
OECD 21.3 20.4 20.1 20.1 19.5 19.9 19.3 19.3 19.7 19.5 19.6 19.3 19.1 19.4 19.4North America 14.6 14.1 14.2 14.3 13.9 14.2 14.0 14.2 14.3 14.2 14.3 14.3 14.2 14.3 14.3Western Europe 6.2 5.7 5.3 5.2 5.0 5.1 4.7 4.5 4.7 4.7 4.6 4.4 4.3 4.4 4.4Pacific 0.6 0.6 0.6 0.6 0.6 0.6 0.6 0.7 0.6 0.6 0.6 0.6 0.7 0.7 0.7Developing countries 11.6 11.9 12.0 12.0 12.3 12.5 12.5 12.5 12.6 12.5 12.6 12.7 12.7 12.8 12.7FSU 11.1 11.5 12.0 12.5 12.6 12.6 12.9 13.0 13.2 12.9 13.2 13.2 13.1 13.3 13.2Other Europe 0.2 0.2 0.2 0.2 0.1 0.1 0.1 0.1 0.1 0.1 0.1 0.1 0.1 0.1 0.1China 3.5 3.6 3.7 3.8 3.8 3.8 3.9 3.9 3.9 3.8 3.9 3.9 3.9 3.9 3.9Processing gains 1.8 1.9 1.9 1.9 2.0 2.0 2.0 2.0 2.0 2.0 2.0 2.0 2.0 2.0 2.0Total non-OPEC supply 49.6 49.6 49.9 50.5 50.4 50.9 50.6 50.8 51.4 50.9 51.4 51.1 51.0 51.5 51.3OPEC ngls and non-conventionals 3.7 3.9 3.9 4.0 4.3 4.4 4.6 4.7 4.7 4.6 4.8 5.0 5.2 5.4 5.1
(b) Total non-OPEC supply and OPEC ngls
53.3 53.5 53.8 54.5 54.7 55.3 55.2 55.5 56.1 55.5 56.2 56.2 56.2 56.9 56.4
OPEC crude supply and balance
OPEC crude oil production 1 29.6 30.7 30.5 30.2 31.2 28.5 28.5 28.9 29.1 28.7 Total supply 82.9 84.2 84.3 84.7 85.9 83.7 83.7 84.4 85.2 84.3 Balance2 0.3 0.2 -0.6 -1.3 0.2 -0.3 0.5 -0.3 -0.3 -0.1
Stocks
OECD closing stock level m bCommercial 2538 2585 2667 2566 2701 2747 2760 2781SPR 1450 1487 1499 1524 1527 1547 1561 1564Total 3988 4072 4166 4090 4227 4294 4321 4345Oil-on-water 905 954 919 951 967 901 902 871Days of forward consumption in OECDCommercial onland stocks 51 52 54 54 59 62 61 60SPR 29 30 30 32 33 35 35 34Total 80 82 85 86 93 97 96 94
Memo items
FSU net exports 7.3 7.7 8.0 8.5 8.5 8.8 9.2 8.9 9.0 9.0 9.3 9.5 9.0 9.1 9.2[(a) — (b)] 29.3 30.5 31.1 31.4 31.0 28.7 27.9 29.1 29.4 28.8 28.4 27.6 29.4 29.6 28.7
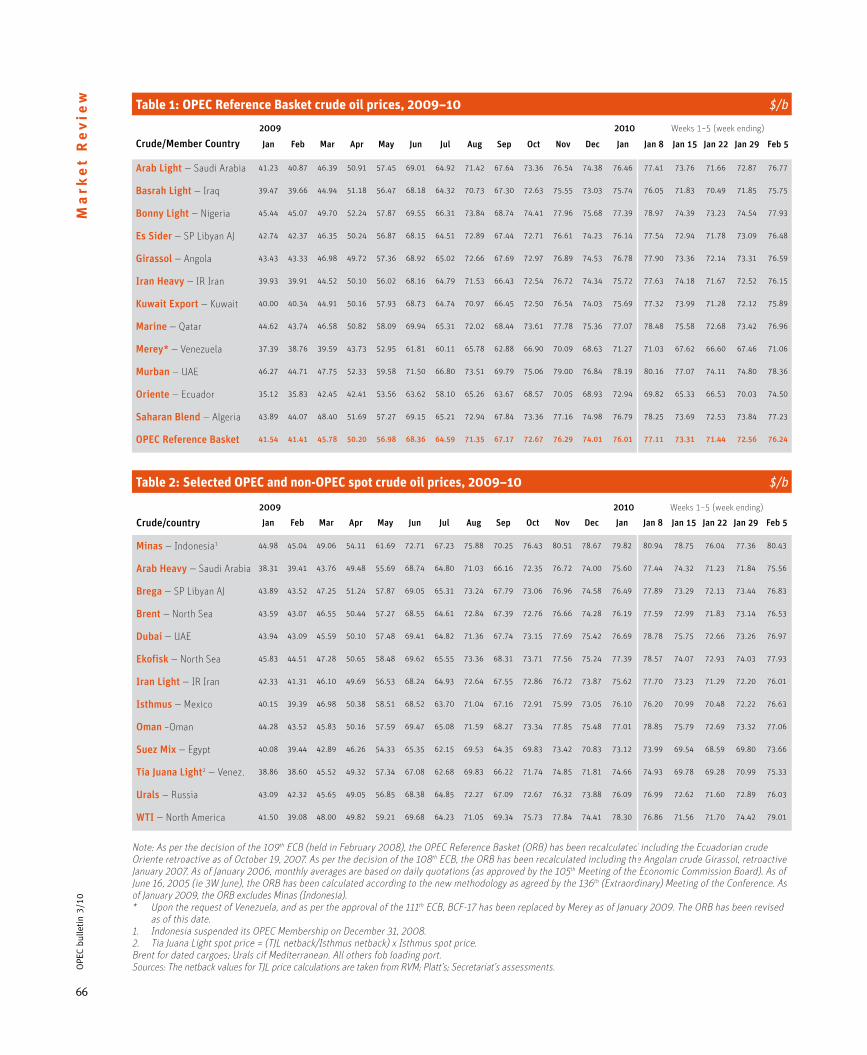
66
OPE
C bu
lleti
n 3/
10M
ark
et
Re
vie
w
Note: As per the decision of the 109th ECB (held in February 2008), the OPEC Reference Basket (ORB) has been recalculated including the Ecuadorian crude Oriente retroactive as of October 19, 2007. As per the decision of the 108th ECB, the ORB has been recalculated including the Angolan crude Girassol, retroactive January 2007. As of January 2006, monthly averages are based on daily quotations (as approved by the 105th Meeting of the Economic Commission Board). As of June 16, 2005 (ie 3W June), the ORB has been calculated according to the new methodology as agreed by the 136th (Extraordinary) Meeting of the Conference. As of January 2009, the ORB excludes Minas (Indonesia).* Upon the request of Venezuela, and as per the approval of the 111th ECB, BCF-17 has been replaced by Merey as of January 2009. The ORB has been revised
as of this date.1. Indonesia suspended its OPEC Membership on December 31, 2008.2. Tia Juana Light spot price = (TJL netback/Isthmus netback) x Isthmus spot price.Brent for dated cargoes; Urals cif Mediterranean. All others fob loading port.Sources: The netback values for TJL price calculations are taken from RVM; Platt’s; Secretariat’s assessments.
Table 2: Selected OPEC and non-OPEC spot crude oil prices, 2009–10 $/b
2009 2010 Weeks 1–5 (week ending)
Crude/Member Country Jan Feb Mar Apr May Jun Jul Aug Sep Oct Nov Dec Jan Jan 8 Jan 15 Jan 22 Jan 29 Feb 5
Arab Light — Saudi Arabia 41.23 40.87 46.39 50.91 57.45 69.01 64.92 71.42 67.64 73.36 76.54 74.38 76.46 77.41 73.76 71.66 72.87 76.77
Basrah Light — Iraq 39.47 39.66 44.94 51.18 56.47 68.18 64.32 70.73 67.30 72.63 75.55 73.03 75.74 76.05 71.83 70.49 71.85 75.75
Bonny Light — Nigeria 45.44 45.07 49.70 52.24 57.87 69.55 66.31 73.84 68.74 74.41 77.96 75.68 77.39 78.97 74.39 73.23 74.54 77.93
Es Sider — SP Libyan AJ 42.74 42.37 46.35 50.24 56.87 68.15 64.51 72.89 67.44 72.71 76.61 74.23 76.14 77.54 72.94 71.78 73.09 76.48
Girassol — Angola 43.43 43.33 46.98 49.72 57.36 68.92 65.02 72.66 67.69 72.97 76.89 74.53 76.78 77.90 73.36 72.14 73.31 76.59
Iran Heavy — IR Iran 39.93 39.91 44.52 50.10 56.02 68.16 64.79 71.53 66.43 72.54 76.72 74.34 75.72 77.63 74.18 71.67 72.52 76.15
Kuwait Export — Kuwait 40.00 40.34 44.91 50.16 57.93 68.73 64.74 70.97 66.45 72.50 76.54 74.03 75.69 77.32 73.99 71.28 72.12 75.89
Marine — Qatar 44.62 43.74 46.58 50.82 58.09 69.94 65.31 72.02 68.44 73.61 77.78 75.36 77.07 78.48 75.58 72.68 73.42 76.96
Merey* — Venezuela 37.39 38.76 39.59 43.73 52.95 61.81 60.11 65.78 62.88 66.90 70.09 68.63 71.27 71.03 67.62 66.60 67.46 71.06
Murban — UAE 46.27 44.71 47.75 52.33 59.58 71.50 66.80 73.51 69.79 75.06 79.00 76.84 78.19 80.16 77.07 74.11 74.80 78.36
Oriente — Ecuador 35.12 35.83 42.45 42.41 53.56 63.62 58.10 65.26 63.67 68.57 70.05 68.93 72.94 69.82 65.33 66.53 70.03 74.50
Saharan Blend — Algeria 43.89 44.07 48.40 51.69 57.27 69.15 65.21 72.94 67.84 73.36 77.16 74.98 76.79 78.25 73.69 72.53 73.84 77.23
OPEC Reference Basket 41.54 41.41 45.78 50.20 56.98 68.36 64.59 71.35 67.17 72.67 76.29 74.01 76.01 77.11 73.31 71.44 72.56 76.24
Table 1: OPEC Reference Basket crude oil prices, 2009–10 $/b
2009 2010 Weeks 1–5 (week ending)
Crude/country Jan Feb Mar Apr May Jun Jul Aug Sep Oct Nov Dec Jan Jan 8 Jan 15 Jan 22 Jan 29 Feb 5
Minas — Indonesia1 44.98 45.04 49.06 54.11 61.69 72.71 67.23 75.88 70.25 76.43 80.51 78.67 79.82 80.94 78.75 76.04 77.36 80.43
Arab Heavy — Saudi Arabia 38.31 39.41 43.76 49.48 55.69 68.74 64.80 71.03 66.16 72.35 76.72 74.00 75.60 77.44 74.32 71.23 71.84 75.56
Brega — SP Libyan AJ 43.89 43.52 47.25 51.24 57.87 69.05 65.31 73.24 67.79 73.06 76.96 74.58 76.49 77.89 73.29 72.13 73.44 76.83
Brent — North Sea 43.59 43.07 46.55 50.44 57.27 68.55 64.61 72.84 67.39 72.76 76.66 74.28 76.19 77.59 72.99 71.83 73.14 76.53
Dubai — UAE 43.94 43.09 45.59 50.10 57.48 69.41 64.82 71.36 67.74 73.15 77.69 75.42 76.69 78.78 75.75 72.66 73.26 76.97
Ekofisk — North Sea 45.83 44.51 47.28 50.65 58.48 69.62 65.55 73.36 68.31 73.71 77.56 75.24 77.39 78.57 74.07 72.93 74.03 77.93
Iran Light — IR Iran 42.33 41.31 46.10 49.69 56.53 68.24 64.93 72.64 67.55 72.86 76.72 73.87 75.62 77.70 73.23 71.29 72.20 76.01
Isthmus — Mexico 40.15 39.39 46.98 50.38 58.51 68.52 63.70 71.04 67.16 72.91 75.99 73.05 76.10 76.20 70.99 70.48 72.22 76.63
Oman –Oman 44.28 43.52 45.83 50.16 57.59 69.47 65.08 71.59 68.27 73.34 77.85 75.48 77.01 78.85 75.79 72.69 73.32 77.06
Suez Mix — Egypt 40.08 39.44 42.89 46.26 54.33 65.35 62.15 69.53 64.35 69.83 73.42 70.83 73.12 73.99 69.54 68.59 69.80 73.66
Tia Juana Light2 — Venez. 38.86 38.60 45.52 49.32 57.34 67.08 62.68 69.83 66.22 71.74 74.85 71.81 74.66 74.93 69.78 69.28 70.99 75.33
Urals — Russia 43.09 42.32 45.65 49.05 56.85 68.38 64.85 72.27 67.09 72.67 76.32 73.88 76.09 76.99 72.62 71.60 72.89 76.03
WTI — North America 41.50 39.08 48.00 49.82 59.21 69.68 64.23 71.05 69.34 75.73 77.84 74.41 78.30 76.86 71.56 71.70 74.42 79.01
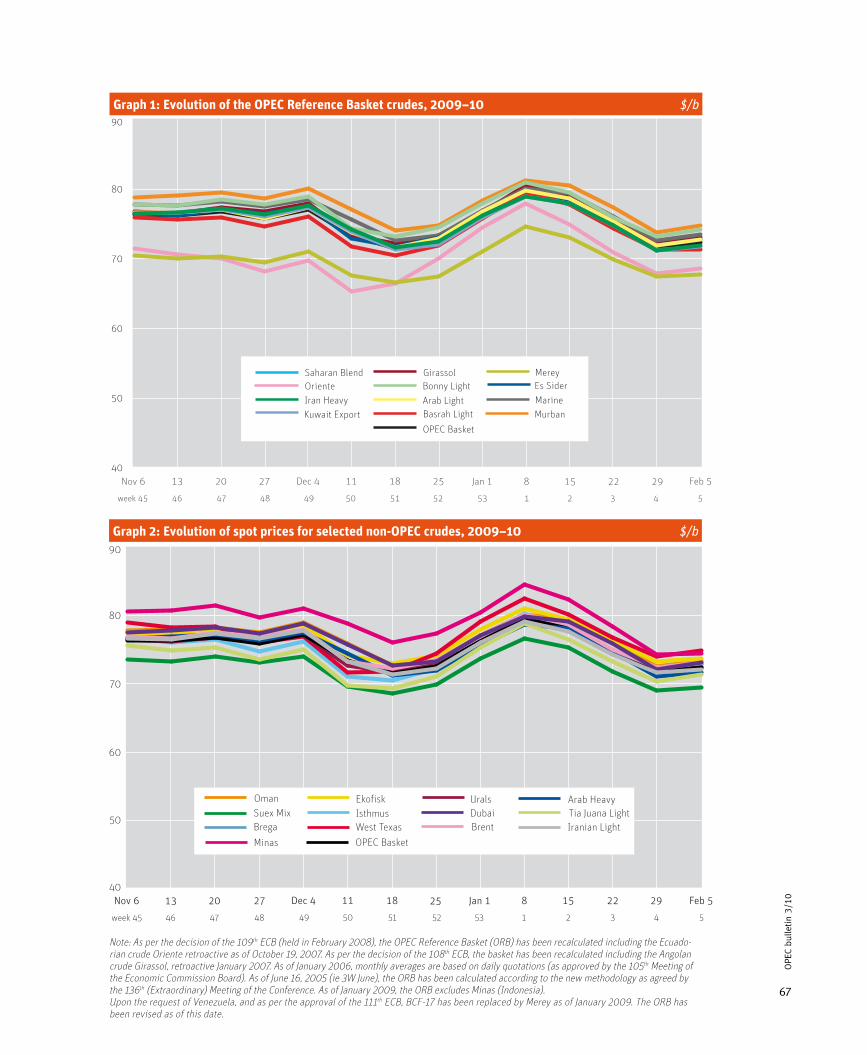
67
OPE
C bu
lleti
n 3/
10
40
50
60
70
80
90
Oriente
OPEC Basket
Girassol
MurbanMarineEs SiderMerey
Basrah LightArab LightBonny Light
Kuwait ExportIran Heavy
Saharan Blend
543215352515049484746week 45
18Nov 6 13 20 27 11 25 Jan 1Dec 4 158 22 29 Feb 5
40
50
60
70
80
90
5432153 52515049484746week 45
Minas
Iranian LightTia Juana LightDubai
Brega
Arab Heavy
OPEC Basket
Urals
West TexasIsthmusEkofisk
BrentSuex MixOman
18Nov 6 Feb 513 20 Dec 427 11 25 8Jan 1 15 2922
Note: As per the decision of the 109th ECB (held in February 2008), the OPEC Reference Basket (ORB) has been recalculated including the Ecuado-rian crude Oriente retroactive as of October 19, 2007. As per the decision of the 108th ECB, the basket has been recalculated including the Angolan crude Girassol, retroactive January 2007. As of January 2006, monthly averages are based on daily quotations (as approved by the 105th Meeting of the Economic Commission Board). As of June 16, 2005 (ie 3W June), the ORB has been calculated according to the new methodology as agreed by the 136th (Extraordinary) Meeting of the Conference. As of January 2009, the ORB excludes Minas (Indonesia).Upon the request of Venezuela, and as per the approval of the 111th ECB, BCF-17 has been replaced by Merey as of January 2009. The ORB has been revised as of this date.
Graph 1: Evolution of the OPEC Reference Basket crudes, 2009–10 $/b
Graph 2: Evolution of spot prices for selected non-OPEC crudes, 2009–10 $/b

68
naphtharegular
gasolineunleaded
premium gasoline 50ppm
dieselultra light jet kero fuel oil
1%Sfuel oil3.5%S
2009 January 44.54 41.40 45.98 59.72 61.48 34.38 33.08
February 52.70 45.39 46.48 55.32 51.13 41.82 36.50
March 43.82 48.36 52.02 55.90 55.33 36.43 37.29
April 46.84 48.77 57.85 59.72 60.25 43.80 42.35
May 52.58 59.66 70.76 64.03 64.87 50.34 51.19
June 62.74 71.18 81.07 75.69 78.47 59.46 59.14
July 43.75 42.79 48.83 55.32 53.89 35.81 36.50
August 70.85 72.78 83.06 79.99 79.89 67.78 66.21
September 65.82 65.55 74.81 74.77 76.57 64.52 62.96
October 69.17 68.89 79.16 81.60 82.53 68.35 66.93
November 74.60 72.67 83.50 83.25 85.40 73.68 71.03
December 75.35 70.59 79.68 81.62 83.56 69.02 68.36
2010 January 79.05 71.54 84.65 84.11 86.46 72.55 71.29
naphtha
premium gasoline50ppm
diesel ultra light
fuel oil1%S
fuel oil3.5%S
2009 January 36.11 44.30 59.14 36.58 32.11
February 45.21 28.66 38.26 38.63 35.42
March 42.05 26.66 35.59 39.37 36.74
April 45.57 27.46 35.69 44.42 42.54
May 50.74 32.51 42.25 52.93 50.93
June 61.16 36.23 47.09 60.64 59.47
July 41.92 24.42 31.74 38.63 35.42
August 69.32 24.55 31.98 68.04 66.86
September 64.30 22.77 29.66 64.92 63.10
October 67.57 24.32 31.68 68.18 67.11
November 72.83 26.21 34.15 72.97 71.00
December 73.04 26.29 34.25 69.92 68.20
2010 January 76.30 27.10 35.18 72.10 70.82
naphtha
regular gasoline
unleaded 87 gasoil jet kerofuel oil0.3%S
fuel oil2.2%S
2009 January 45.51 48.74 61.15 64.91 49.59 35.21
February 47.88 51.61 53.68 53.98 44.37 37.55
March 51.79 53.83 53.69 55.86 48.64 37.70
April 52.45 58.24 57.00 58.98 50.05 42.10
May 65.60 73.39 61.98 63.68 55.14 51.77
June 74.77 82.83 73.45 77.05 63.67 58.85
July 70.12 49.78 53.68 54.79 47.82 37.52
August 75.27 86.58 78.49 80.62 69.05 37.71
September 68.97 76.22 72.67 73.89 64.55 35.63
October 75.66 79.71 81.17 82.95 73.56 39.80
November 78.12 82.30 83.42 84.31 78.34 42.29
December 76.81 80.13 82.73 84.44 75.70 41.59
2010 January 77.79 85.54 86.11 88.23 76.17 42.55
Source: Platts. Prices are average of available days.
Table and Graph 5: US East Coast market — spot cargoes, New York $/b, duties and fees included
Table and Graph 3: North European market — spot barges, fob Rotterdam $/b
Table and Graph 4: South European market — spot cargoes, fob Italy $/b
0
10
20
30
40
50
60
70
80
90
100
110
JanDecNovOctSepAugJulJunMayAprMarFebJan
fuel oil 3.5%Sfuel oil 1%S
jet kerodiesel
premium 50ppmregular unleaded
naphtha
Graph 3 Rotterdam
2009 2010
0
10
20
30
40
50
60
70
80
90
100
110
JanDecNovOctSepAugJulJunMayAprMarFebJan
fuel oil 3.5%Sfuel oil 1.0%S
dieselprem 50ppm
naphtha
Graph 4 South European Market
2009 2010
20102010
0
10
20
30
40
50
60
70
80
90
100
110
JanDecNovOctSepAugJulJunMayAprMarFebJan
fuel oil 2.2%Sfuel oil 0.3%S LPjet kero
gasoilreg unl 87
Graph 5 US East Coast Market
20092009
naphtha
Note: Prices of premium gasoline and diesel from January 1, 2008, are with 10 ppm sulphur content.
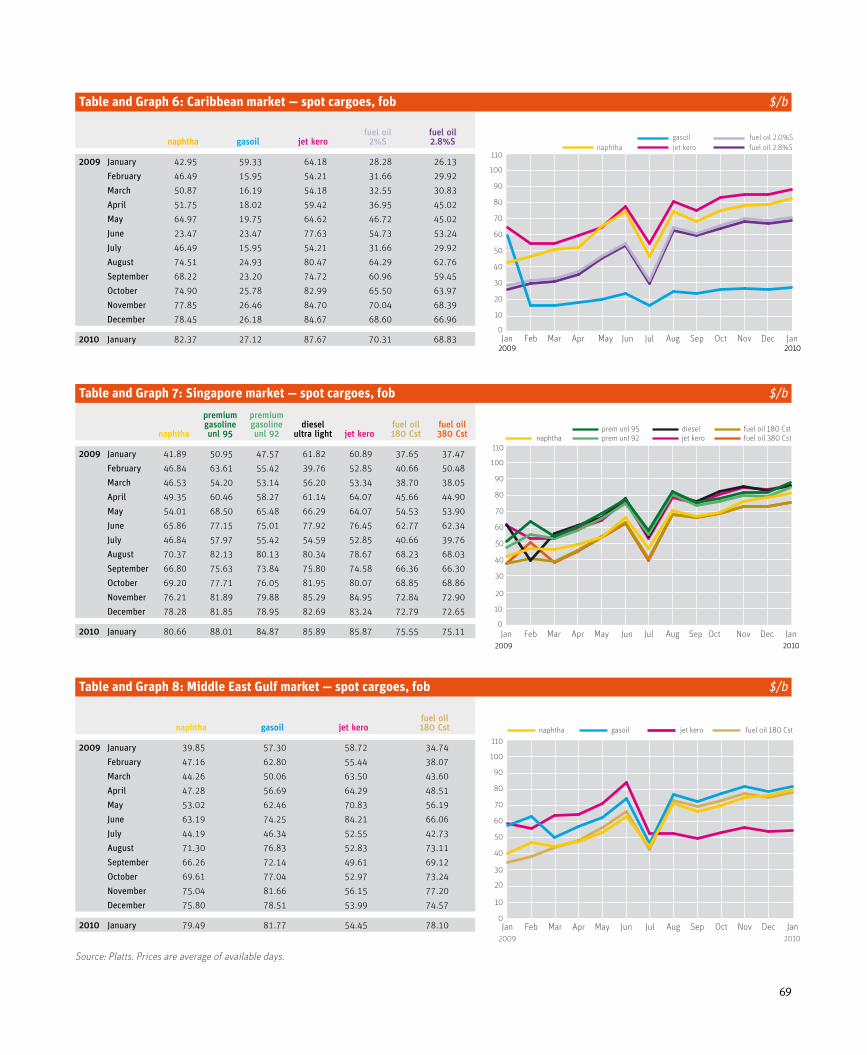
69
naphtha gasoil jet kerofuel oil
2%Sfuel oil2.8%S
2009 January 42.95 59.33 64.18 28.28 26.13
February 46.49 15.95 54.21 31.66 29.92
March 50.87 16.19 54.18 32.55 30.83
April 51.75 18.02 59.42 36.95 45.02
May 64.97 19.75 64.62 46.72 45.02
June 23.47 23.47 77.63 54.73 53.24
July 46.49 15.95 54.21 31.66 29.92
August 74.51 24.93 80.47 64.29 62.76
September 68.22 23.20 74.72 60.96 59.45
October 74.90 25.78 82.99 65.50 63.97
November 77.85 26.46 84.70 70.04 68.39
December 78.45 26.18 84.67 68.60 66.96
2010 January 82.37 27.12 87.67 70.31 68.83
naphtha
premium gasoline unl 95
premium gasoline unl 92
dieselultra light jet kero
fuel oil180 Cst
fuel oil380 Cst
2009 January 41.89 50.95 47.57 61.82 60.89 37.65 37.47
February 46.84 63.61 55.42 39.76 52.85 40.66 50.48
March 46.53 54.20 53.14 56.20 53.34 38.70 38.05
April 49.35 60.46 58.27 61.14 64.07 45.66 44.90
May 54.01 68.50 65.48 66.29 64.07 54.53 53.90
June 65.86 77.15 75.01 77.92 76.45 62.77 62.34
July 46.84 57.97 55.42 54.59 52.85 40.66 39.76
August 70.37 82.13 80.13 80.34 78.67 68.23 68.03
September 66.80 75.63 73.84 75.80 74.58 66.36 66.30
October 69.20 77.71 76.05 81.95 80.07 68.85 68.86
November 76.21 81.89 79.88 85.29 84.95 72.84 72.90
December 78.28 81.85 78.95 82.69 83.24 72.79 72.65
2010 January 80.66 88.01 84.87 85.89 85.87 75.55 75.11
naphtha gasoil jet kerofuel oil180 Cst
2009 January 39.85 57.30 58.72 34.74
February 47.16 62.80 55.44 38.07
March 44.26 50.06 63.50 43.60
April 47.28 56.69 64.29 48.51
May 53.02 62.46 70.83 56.19
June 63.19 74.25 84.21 66.06
July 44.19 46.34 52.55 42.73
August 71.30 76.83 52.83 73.11
September 66.26 72.14 49.61 69.12
October 69.61 77.04 52.97 73.24
November 75.04 81.66 56.15 77.20
December 75.80 78.51 53.99 74.57
2010 January 79.49 81.77 54.45 78.10
Source: Platts. Prices are average of available days.
Table and Graph 6: Caribbean market — spot cargoes, fob $/b
Table and Graph 7: Singapore market — spot cargoes, fob $/b
Table and Graph 8: Middle East Gulf market — spot cargoes, fob $/b
20092009
0
10
20
30
40
50
60
70
80
90
100
110
JanDecNovOctSepAugJulJunMayAprMarFebJan
fuel oil 2.0%Sfuel oil 2.8%S
gasoiljet keronaphtha
Graph 6 Caribbean Market
20102010
20102010
0
10
20
30
40
50
60
70
80
90
100
110
JanDecNovOctSepAugJulJunMayAprMarFebJan
fuel oil 380 Cstfuel oil 180 Cst
jet kerodiesel
prem unl 92prem unl 95
naphtha
Graph 7 Singapore
20092009
2009
0
10
20
30
40
50
60
70
80
90
100
110
JanDecNovOctSepAugJulJunMayAprMarFebJan
fuel oil 180 Cstgasoilnaphtha jet kero
Graph 8 Middle East Gulf Market
2010

70
OPE
C bu
lleti
n 3/
10N
oti
ce
bo
ard
No
tic
eb
oa
rd Forthcoming events
Intelligent energy conference and exhibition, March 23–25, 2010, Utrecht, The Netherlands. Details: Society of Petroleum Engineers, Part Third Floor East, Portland House, 4 Great Portland Street, London W1W 8QJ, UK. Tel: +44 207 299 3300; fax: +44 207 299 3309; e-mail: [email protected]; website: www.spe.org.
9th Georgian international oil, gas, energy and infrastructure conference and showcase (GIOGIE), March 24–25, 2010, Tbilisi, Georgia. Details: ITE Group plc, Oil and Gas Division, 105 Salusbury Road, London NW6 6RG, UK. Tel: +44 207 596 5233; fax: +44 207 596 5106; e-mail: [email protected]; website: ite-exhibitions.com.
Oil and gas satellite communications, March 24–25, 2010, London, UK. Details: SMi Group Ltd, Unit 122, Great Guildford Business Square, 30 Great Guildford Street, London SE1 0HS, UK. Tel: +44 207 827 6000; fax: +44 207 827 6001; e-mail: [email protected]; web-site: www.smi-online.co.uk.
ERTC FCC training course, March 24–26, 2010, London, UK. Details: Global Technology Forum, Highview House, Tattenham Crescent, Epsom Downs, Surrey KT18 5QJ, UK. Tel: +44 1737 365100; fax: +44 1737 365101; e-mail: [email protected]; website: www.gtforum.com.
ERTC sulphur recovery processes, March 24–26, 2010, London, UK. Details: Global Technology Forum, Highview House, Tattenham Crescent, Epsom Downs, Surrey KT18 5QJ, UK. Tel: +44 1737 365100; fax: +44 1737 365101; e-mail: [email protected]; website: www.gtforum.com.
Mastering global LNG, March 24–26, 2010, London, UK. Details: International Faculty of Finance, 8th Floor, 29 Bressenden Place, London SW1E 5DR, UK. Tel: +44 207 017 7190; fax: +44 207 017 7802; e-mail: [email protected]; website: www.iff-training.com.
Smart electricity world Asia congress 2010, April 5–8, 2010, Singapore. Details: Terrapinn Holdings Ltd, First Floor, Modular Place, Turnberry Office Park, 48 Grosvenor Road, Bryanston 2021, South Africa. Tel: +27 11 516 4000; fax: +27 11 463 6000; e-mail: enquiry.za@ terrapinn.com; website: www.terrapinn.com.
Power and electricity world Asia 2010, April 5–9, 2010, Singapore. Details: Terrapinn Holdings Ltd, First Floor, Modular Place, Turnberry Office Park, 48 Grosvenor Road, Bryanston 2021, South Africa. Tel: +27 11 516 4000; fax: +27 11 463 6000; e-mail: [email protected]; website: www.terrapinn.com.
Power and electricity awards 2010, April 6, 2010, Singapore. Details: Terrapinn Holdings Ltd, First Floor, Modular Place, Turnberry Office Park, 48 Grosvenor Road, Bryanston 2021, South Africa. Tel: +27 11 516 4000; fax: +27 11 463 6000; e-mail: [email protected]; website: www.terrapinn.com.
OilTech Kazakhstan, April 6–7, 2010, Atyrau, Kazakhstan. Details: ITE Group plc, Oil and Gas Division, 105 Salusbury Road, London NW6 6RG, UK. Tel: +44 207 596 5233; fax: +44 207 596 5106; e-mail: [email protected]; website: ite-exhibitions.com.
Atyrau oil and gas, April 6–8, 2010, Atyrau, Kazakhstan. Details: ITE Group plc, Oil and Gas Division, 105 Salusbury Road, London NW6 6RG, UK. Tel: +44 207 596 5233; fax: +44 207 596 5106; e-mail: [email protected];, website: ite-exhibitions.com.
Oil and gas outlook Africa 2010, April 6–9, 2010, Cape Town,
South Africa. Details: Terrapinn Holdings Ltd, First Floor, Modular Place, Turnberry Office Park, 48 Grosvenor Road, Bryanston 2021, South Africa. Tel: +27 11 516 4000; fax: +27 11 463 6000; e-mail: enquiry.za@ terrapinn.com; website: www.terrapinn.com.
Africa oil forum, April 7, 2010, Casablanca, Morocco. Details: Platts, 20 Canada Square, Canary Wharf, London E14 5LH, UK. Tel: +44 207 1766142; fax: +44 207 176 8512; e-mail: [email protected]; web-site: www.events.platts.com.
North American oil trade and compliance forum, April 8–9, 2010, Houston, TX, USA. Details: Platts, 20 Canada Square, Canary Wharf, London E14 5LH, UK. Tel: +44 207 1766142; fax: +44 207 176 8512; e-mail: [email protected]; website: www.events.platts.com.
25th Annual global power market conference, April 11–13, 2010, Las Vegas, NV, USA. Details: Platts, 20 Canada Square, Canary Wharf, London E14 5LH, UK. Tel: +44 207 1766142; fax: +44 207 176 8512; e-mail: [email protected]; website: www.events.platts.com.
EOR conference at oil and gas West Asia, April 11–13, 2010, Muscat, Oman. Details: Society of Petroleum Engineers, Dubai Knowledge Village, Block 17, Offices S07-S09, PO Box 502217, Dubai, UAE. Tel: +971 4 390 3540; fax: +971 4 366 4648; e-mail: [email protected]; website: www.spe.org.
7th African petroleum forum, April 12–13, 2010, London, UK. Details: Global Pacific Partners, Suite 7, 4 Montpelier Street, Knightsbridge, London SW7 1EE, UK. Tel: +44 207 589 7804; fax: +44 207 589 7814; e-mail: [email protected]; website: www.petro21.com.
ERTC introduction to refining, April 12–14, 2010, London, UK. Details: Global Technology Forum, Highview House, Tattenham Crescent, Epsom Downs, Surrey KT18 5QJ, UK. Tel: +44 1737 365100; fax: +44 1737 365101; e-mail: [email protected]; website: www.gtforum.com.
International conference on health, safety and environment in oil and gas exploration and production, April 12–14, 2010, Rio de Janeiro, Brazil. Details: Society of Petroleum Engineers, PO Box 833836, Richardson, TX 75083–3836, USA. Tel: +1 972 952 393; fax: +1 972 952 9435; e-mail: [email protected]; website: www.spe.org.
Developments in CCS technology, April 13, 2010, London, UK. Details: SMi Group Ltd, Unit 122, Great Guildford Business Square, 30 Great Guildford Street, London, SE1 0HS, UK. Tel: +44 207 827 6000; fax: +44 207 827 6001; e-mail: [email protected]; web-site: www.smi-online.co.uk.
Drilling automation, April 13–14, 2010, Galveston, TX, USA. Details: Society of Petroleum Engineers, PO Box 833836, Richardson, TX 75083-3836, USA. Tel: +1 972 952 393; fax: +1 972 952 9435; e-mail: [email protected]; website: www.spe.org.
Oil and gas outlook Brazil 2010, April 13–15, 2010, Rio de Janeiro, Brazil. Details: Terrapinn Holdings Ltd, First Floor, Modular Place, Turnberry Office Park, 48 Grosvenor Road, Bryanston 2021, South Africa. Tel: +27 11 516 4000; fax: +27 11 463 6000; e-mail: enquiry.za@ terrapinn.com; website: www.terrapinn.com.
European bunker fuel, April 14–15, 2010, Rotterdam, the Netherlands. Details: Platts, 20 Canada Square, Canary Wharf, London E14 5LH, UK. Tel: +44 207 1766142; fax: +44 207 176 8512; e-mail: [email protected]; website: www.events.platts.com.
71
OPE
C bu
lleti
n 3/
10
V a c a n c y a n n o u n c e m e n t s
Petroleum Trade &Transport AnalystApplication deadline: April 19, 2010
Job description:Within the Research Division, the Petroleum Studies Department is responsible for providing pertinent and reliable information and analyses in support of decision-making and policy-making in Member Countries. It carries out research programmes and studies on short-term petroleum market developments with the aim of issuing reports on a regular, as well as ad-hoc basis, highlighting important issues for their use and consideration. It conducts regular forecasts, elaborates and analyzes oil market scenarios and prepares and publishes reports on these findings. It promotes OPEC’s views and technical analysis on short-term oil market developments to the industry at large and the gen-eral public via the OPEC Monthly Oil Market Report, as well as other reports, presentations and related podcasts. And it pre-pares and contributes to reports to be submitted to the Economic Commission Board, the Board of Governors, the Ministerial Monitoring Sub-Committee, as well as papers for various OPEC publications. The Petroleum Trade & Transport Analyst studies and analyzes pertinent dimensions of international and regional trade in crude oil and oil products, and assesses the short-term impact of movements of freight rates. Furthermore, he/she moni-tors and analyzes developments in oil transportation and pre-pares consolidated reports thereon to the Governing Bodies.
Required competencies and qualifications:– University degree (advanced degree preferred) in Economics
or energy-related fields;– A minimum of eight years (six years in case of an advanced
degree) of related work experience;– Training/specialization in energy analysis, oil and product
transportation and knowledge of oil market developments;– Analytical, communication and presentation skills.
Status and benefits:Members of the Secretariat are international employees whose responsibilities are not national but exclusively international. In carrying out their functions they have to demonstrate the personal qualities expected of international employees such as integrity, independence and impartiality. The post is at grade E reporting to the Head, Petroleum Studies Department. The compensation package, including expatriate benefits, is commensurate with the level of the post.
Applications:Applicants must be nationals of Member Countries of OPEC and should not be older than 58 years. OPEC has a policy of non-dis-crimination which encourages all qualified candidates to apply. Applicants are requested to fill in a résumé and an applica-tion form which can be received from their country’s Governor for OPEC. In order for applications to be considered, they must reach the OPEC Secretariat through the relevant Governor not later than April 19, 2010.
Head, PR & Information Department
Application deadline: March 27, 2010
Job description:The PR & Information Department is responsible for present-ing OPEC’s objectives, decisions and actions in their true and most desirable perspective. It disseminates news of general interest regarding the Organization and the Member Countries on energy and related matters and it carries out a central infor-mation programme and identifies areas for the promotion of the Organization’s aims and image. The Head plans, organ-izes, coordinates, manages and evaluates the work of PR & Information Department in accordance with the work programme and the Department’s budget so as to optimize its support to the Secretariat in achieving its objectives. The work aims at creating and maintaining a positive image of the Organization and at ensuring the dissemination of publications and journals at highest professional standard.
Required competencies and qualifications:– Advanced University degree (PhD preferred) in Media Studies,
Journalism, Public Relations, International Relations or rele-vant Social Sciences;
– A minimum of 12 years (ten years in case of a PhD degree) in journalism, information management and/or public rela-tions in the media or in an energy-related establishment with a minimum of four years in a managerial position, preferably at large national, regional, or international institutions;
– Training/specialization in modern information practice and techniques; professional management and leadership; knowledge of energy development issues is an asset and Membership of a professional body (PR or Journalism) is an advantage;
– Excellent communication and analytical skills, strategic think-ing, motivation/planning skills, problem solving skills.
Status and benefits:Members of the Secretariat are international employees whose responsibilities are not national but exclusively international. In carrying out their functions they have to demonstrate the personal qualities expected of international employees such as integrity, independence and impartiality. The post is at grade B reporting to the Director, Support Services Division. The compensation package, including expa-triate benefits, is commensurate with the level of the post.
Applications:Applicants must be nationals of Member Countries of OPEC and should not be older than 58 years. OPEC has a policy of non-dis-crimination which encourages all qualified candidates to apply. Applicants are requested to fill in a résumé and an applica-tion form which can be received from their country’s Governor for OPEC. In order for applications to be considered, they must reach the OPEC Secretariat through the relevant Governor not later than March 27, 2010.
Va
ca
nc
ies
72
OPE
C bu
lleti
n 3/
10O
rde
r F
orm OPEC Bulletin
is published ten times/year and a subscription costs $70. Subscription commences with the current issue (unless otherwise requested) after receipt of
payment.
I wish to subscribe to the OPEC Bulletin for a one-year period
OPEC Monthly Oil Market ReportPublished monthly, this source of key information about OPEC Member Country output also contains the Secretariat’s analyses of oil and product
price movements, futures markets, the energy supply/demand balance, stock movements and global economic trends. $525 for an annual subscription
of 12 issues.
I wish to subscribe to the MOMR for a one-year period Please send me a sample copy
OPEC Annual Statistical Bulletin 2008This 144-page book, including colour graphs and tables, comes with a CD-ROM featuring all the data in the book and more (for Microsoft Windows only).
The book with CD-ROM package costs $85.
Please send me ................. copies of the OPEC Annual Statistical Bulletin 2007 (book plus CD-ROM)
OPEC Energy Reviewcontains research papers by international experts on energy, the oil market, economic development and the environment.
Available quarterly only from the commercial publisher.
For details contact: Blackwell Publishing Ltd, 9600 Garsington Road, Oxford OX4 2DQ, UK. Tel: +44 (0)1865 776868; fax: +44 (0)1865 714591;
e-mail: [email protected]; www.blackwellpublishing.com. Subscription rates for 2009: UK/Europe: individual £143, institutional £350;
The Americas: individual $159, institutional $589; Rest of world: individual £95, institutional £350.
Shipping address (please print in block letters): Invoicing address (if different from shipping address):
Name: Name:Address: Address:
How to pay:Invoice me Credit card (Visa, Eurocard/MasterCard and Diners Club)Credit card company: Credit card no: Expiry date:
Holder: Signature:
Please mail this form to:PR & Information Department or telefax to:OPEC Secretariat PR & Information DepartmentHelferstorferstrasse 17, A-1010 Vienna, Austria +43 1 211 12/5081
All prices include airmail delivery.

73
OPE
C bu
lleti
n 3/
10
To order, please fill in the form
OPEC BulletinAnnual subscription $70
Annual Report 2008Free of charge
World Oil Outlook 2009Free of charge
(published quarterly) annual sub-scription rates for 2009:UK/Europe: individual €143 institutional £350The Americas: individual $159 institutional $589Rest of world: individual £95 institutional £350Orders and enquiries: Blackwell Publishing Journals, 9600 Garsington Road, Oxford OX4 2DQ, UK.Tel: +44 (0)1865 776868Fax: +44 (0)1865 714591E-mail: jnlinfo@ blackwellpublishers.co.ukwww.blackwellpublishing.com
144-page book with CDSingle issue $85The CD (for MicrosoftWindows only) contains all the data in the book and much more.• Easy to install and display• Easy to manipulate and
query• Easy to export to spread-
sheets such as Excel
• Crude oil and product prices analysis
• Member Country output figures
• Stocks and supply/ demand analysis
Annual subscription $525 (12 issues)
OPEC offers a range of publications that reflect its activities. Single copies and subscriptions can be obtained by contacting this Department, which regular readers should also notify in the event of a change of address:
PR & Information Department, OPEC SecretariatHelferstorferstrasse 17, A-1010 Vienna, Austria
Tel: +43 1 211 12-0; fax: +43 1 211 12/5081; e-mail: [email protected]
OP
EC
Pu
bli
ca
tio
ns
OPEC Energy Review
Vol. XXXII, No. 4 December 2008
Energy indicators
Energy relations between Russia and EU with emphasis
on natural gas
Modelling aviation fuel demand: the case of the United States and China
On the influence of oil prices on economic activity and
other macroeconomic and financial variables
OPEC Secretariat
Yuri Yegorov and Franz Wirl
Mohammad Mazraati and Yasser O. Faquih
François Lescaroux and Valérie Mignon
Organization of the Petroleum Exporting Countries
Published and distributed on behalf of the Organization of the Petroleum Exporting Countries, Vienna
Printed in Singapore by Markono Print Media Pte Ltd.
OP
EC
Energy R
eview
Vol. X
XX
II, No. 4
Decem
ber 2008
opec_v32_i4_cover_3.3mm.indd 1 3/10/2009 5:32:31 PM
OPEC Energy ReviewOPEC Monthly Oil Market Report
OPEC Annual StatisticalBulletin 2008
Indonesia
GDPmiles
February 2010
Feature Article:Slower demand in the coming quarters
Oil market highlights
Feature article
Crude oil price movements
Commodity markets
Highlights of the world economy
World oil demand
World oil supply
Product markets and refinery operations
The tanker market
Oil trade
Stock movements
Balance of supply and demand
1
3
5
9
14
20
30
38
43
46
54
58
OPECOrganization of the Petroleum Exporting Countries
Monthly Oil Market Report
Tel +43 1 21112 Fax +43 1 2164320 E-mail: [email protected] Web site: www.opec.orgHelferstorferstrasse 17, A-1010 Vienna, Austria

![Piano Solo] the World God Only Knows OP - God Only Knows](https://static.fdocuments.us/doc/165x107/577d22cf1a28ab4e1e984a78/piano-solo-the-world-god-only-knows-op-god-only-knows.jpg)