HE CASE OF THE - Memorial University of...
20
HE CASE OF THE Labour CANNOT price itself out of the World Market By EMIL B..JARNASON
Transcript of HE CASE OF THE - Memorial University of...

HE CASE OF THE
Labour CANNOT price itself out of
the World Market By
EMIL B..JARNASON

--

-
!r1 THE CASE OF THE TEARFUL TYCOON
A REPLY TO J. V. CLYNE
,SE.P 3 0 196
BY
EMIL BJARNASON
PUBLISHED BY
TRADE UNION RESEARCH BUREAU
339 \V. Pender Street Vancouver, B. C.
MU 1-5831 ~1

-

--
The Honorable Mr. Justice Clyne, who re·cently forsook the Supreme
Court Bench to take up a higher calling, selling lumber and pulp, has delivered
himself of a m·ost profound thought: WAGES ARE TOO HlG:t-I.
Mr. Clyne (who is no'\v chairman of MacMillan, Bloedel & Powell
River Lin1ited) is distressed by the fact that "public opinion still tolerates
the continuing claims of labour leaders for higher wages". These claims, he
feels, cause a serious disparity in production costs between this continent
and other parts of the world and are responsible for our higher level of
unemployment.
Original? Hardly. This thought has been the common refrain of
money-grubbers for centuries. Wilberforce, speaking for the Manchester
wool trade, in opposition to the Shearmen's Union, put it this way:
"The least of the evils to be apprehended (though an evil in itself abund
antly sufficient to accomplish the ruin, not only of an~ particular branch
of Trade. but even of the whole commercial greatness of our country) is. the
progressive rise of wages which among all the classes of workmen must be
the inevitable, though gradual result of such a Society's operations."
In 1806, when the above words were written, textile workers in Man
chester were being paid a shilling and a half for a sixteen hour day. Since
that sum was obviously insufficient to feed them and keep them in condi
tion to work, they were allowed under the "Speenhamland Act" to
supplement their wages with poor relief to make up the price of five gallon
loaves of bread weekly for a family of four.
Eighty years later, the New York World rephrased the thought some
what more elegantly:
"Men must be contented to work for less wages. In this way the
workingmen will be nearer to that station in life to which it has pleased
God to call them."
Amen.
J

.. Having regard to the very large capital
investment of this Company, the profits
are not large, in fact, they are compara
tively meagre. and the shareholder is not
receiving more than a reasonable return. ••
Hon. /. V. Clyne. April 24. 1960.
Let the woodworkers consider.
Should they, by their "selfishness"
continue to price lumber out of the
market, or should they accept, say, a
ten percent cut in wages to make our
lumber competitive.
Last year, MacMillan, Bloedel &
Powell River Limited sold $305,000,-
000 worth of products and paid out
$74,369,957 in salaries, wages and
fringe benefits. Thus if all employees,
including of course, Mr. Oyne himself,
wen~ to take a ten percent wage cut,
the price of lumber could be reduced
by something less than 20 percent.
Even so, would Clyne and Com
pany voluntarily take the 20 per·cent
off the price of the product? If Clyne's
reference to "meagre"' profits means
anything, it is simply that the company
would take advantage of any reduction
in costs to raise the rate of profit, and
the sacrifice by the workers would
thus be futile.
What is a meagre profit? At the
beginning of 1960, the shareholders' equity in MacMillan & Co. amounted
to $221,000,()(X) practically all of which represented accumulated profits of
J?ast years, rather than money actually paid in by shareholders. On that in
vestnlent, the profit for 1960 (after setting aside enough depreciation to
4
-

-
replace all factories, mills, ships and forest lands in 80 years) was $52,578, .. 196. This amounts to a rate of profit of 24 percent before tax, 11 percent after tax. That 11 percent rate does not include any of the high salaries, bonuses, directors' fees or stock options received by the top management. It is merely the rate of return that an ordinary stockholder receives by putting his money into the company*. And for the most part it is tax free. Meagre?
Fifteen years ago, the total assets of the MacMillan company amounted to $20,123,473. By the end of 1960, they had grown to $309,173,192 -fifteen hundred percent growth in fifteen years. Meagre?
"The exodus of capital from North America will bring in its wa/re social and economic problems of great magnitude. I hope that labour leaders, who are responsible in many cases for its occurrence will ta/re note of this arithmetic of the contemporary world."
Hon. /. V. Cl~ne, April 25, 1961."
There it is. Labour is responsible. If only labour would take note of this gem of judicial wisdom, and stop asking for more money.
History can teach us some lessons in this regard: From 1939 to 1945, wages were frozen by order-in-council, and labour was not allowed to ask for more wages. During those years, the lumber industry doubled the export price of Douglas fir. In the first two years after wage controls ended, wages went up 32 percent, and the price of fir was nearly doubled again, making it $74.75 per thousand feet, or 382 pereent of the pre-war price.
It required no stimulus of wage increases to boost the price of lumber and paper. It required nothing, except the greed of the lumber operators.
Since 194_§_, the unions have been winning wage increases every year or two, and the basic wage for sawmill workers has doubled. If we were to follow Clyne's reasoning, this should have doubled the price of lun1ber. In fact it did not. The 1960 export price of Douglas Fir was lower than the 1948 price.
Yet profits soared. This is apparently because, although the industry employs fewer workers than it did thirteen years ago, its output has increased enormously. The industry has been able to increase wages, and simultaneously increase profits, without price increases, by virtue of the rise in the productivity of labour.
*For instance, Mr. Cly1te's personal share of the net profit (arising from his ownership of 45,000 shares) was roughly $56,000. In addition, the press reports that he receives a salary of $75,000.
s

PRICES SOARED WHEN WAGES WERE CONTROLLED
Lut11.ber Basic Wage Rate
per hour
1939 ... -------------.-----.---.--------- .. -- ·---.-- ----. . 50
1945 ..... -- -·-- ------- .. --- .. -- ... -... -. -- ... ----------- .67
Increase during \Vartin1e wage "freeze'' --·------------------ __ 3-l-o/o
1947 ·····--··-···············--·----------------------·- 880
Increase, first two postwar years -------------------------- 32%
Average Export Price Douglas Fir Lum.ber
per 1,000 ft.
$19.57
38.40
96%
74.75
95%
AND FELL WHEN WAGES DOUBLED
19()() -------------- ----------------------------------- --- 1. 87 $68.29
Increase 1947 -ffi -------------------------------- Ill% -9%
Source of Price Figures: D. B. S. Trade of Canada.
Note: The 1947 and 19()() wage rates quoted are average for the calendar year.

ELECTRICITY TOO
There was a time when the B.C. Electric \-vould sell you a bus ticket
for ten cents, and 300 kilowatt hours of electricity for $5.74. That was in
1950. Since then the bus fare has increased to 15 cents (50 percent) and the
price of electricity to $9.16 (60 percent increase).
If we follow Clyne, we n1ust blame these increases on the high cost
of wages. After all, has not the B.C. Electric been faced \Vith ''continuing
claims" from the Street Railwaytnen, the I.B.E.W ~ the Office Employees
and others? Let us see how it has worked out:
1950 1960
B.C.E. Total Revenue .................... $43,200,000 $105,500,000
B.C.E. Wage Bill including Fringe Benefits ................ 18,020,000 24,300,000
Net Profit before Tax -------------------- 6,140,000 34,900,000
The workers-, it appears, have gouged $6,000,000 in vvage increases out
of the Company during this ten year period. Who can blatne the B.C.
Electric .for getting even by adding $28,000,000 to their profits?
Seriously, here is an instance of a group of workers who dropped their
share of the revenue dollar from 42 cents in 1950 to 23 cents in 1960. Who
benefited from this? The consumer, or the pow'er-using export industries?
Obviously not the consum·er since the price of electricity went up 60 percent.
In fact, the 19 cents dropped by the workers was simply appropriated by the
shareholders, whose profit per revenue dollar went up fron1 14 cents to 33 cents.
As Oyne says, "I hope that labour leaders "vill take note of this
arithmetic of the contemporary world.·'
7
A:t{D-FISH
-:;- -::::....
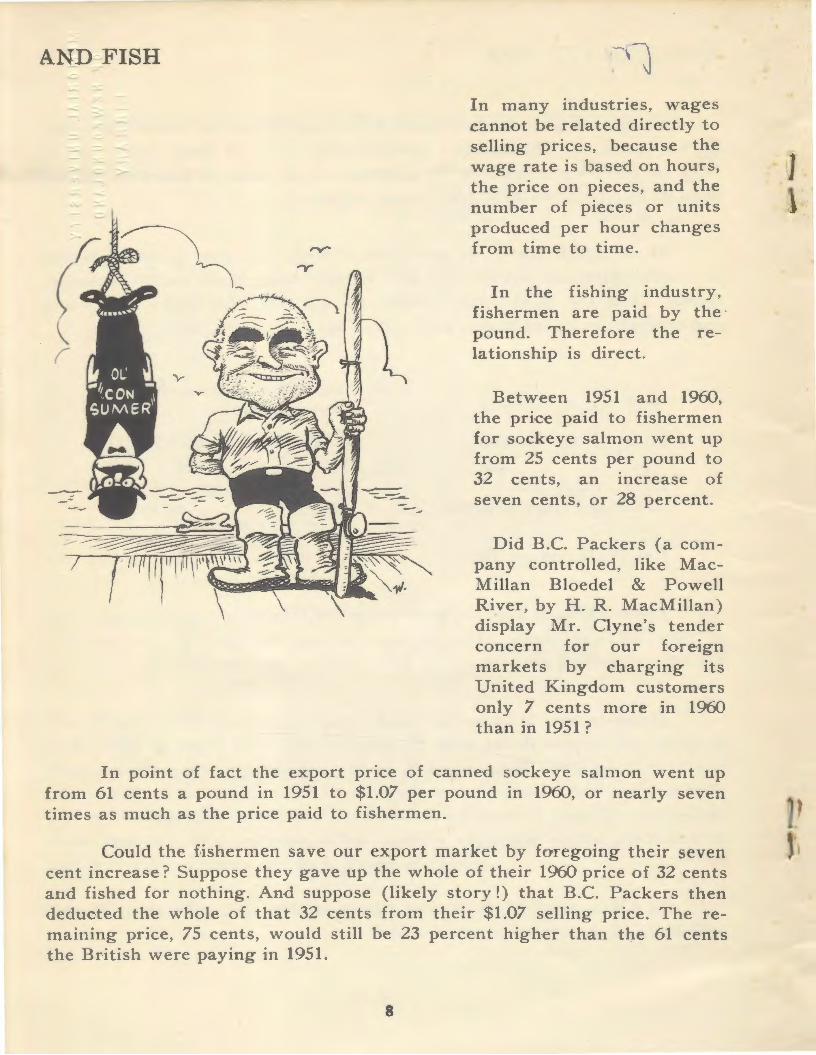
In many industries, wages cann-ot be related directly to selling prices, because the wage rate is based on hours, the price on pieces, and the number of pieces or units produced per hour changes from time to time.
In the fishing indus try, fishermen are paid by the · pound. Therefore the relationship is direct.
Between 1951 and 1960, the pric·e paid to fishermen for sockeye salmon went up from 25 cents per pound to 32 cents, an increase of seven cents, or 28 percent.
Did B.C. Packers (a company controlled, like MacMillan Bloedel & Powell River, by H. R. MacMillan) display Mr. Oyne's tender concern for our foreign markets by charging its United Kingdom customers only 7 cents more in 1960 than in 1951?
In point of fact the export pnce of canned sockeye salmon went up from 61 cents a pound in 1951 to $1.07 per pound in 1960, or nearly seven times as much as the price paid to fishermen.
Could the f·ishermen save our export market by foregoing their seven cent increase? Suppose they gave up the whole of their 1960 price of 32 cents and fished for nothing. And suppose (likely story!) that B.C. Packers then deducted the whole of that 32 cents from their $1.07 selling price. The remaining price, 75 cents , would still be 23 percent higher than the 61 cents the British were paying in 1951.
8
1

YOU CAN'T PRICE YOURSELF OUT OF THE WORLD MARKET
It is a fact that has been known to e·conomists for 150 years at least,
that the general level of wages and prices in a given country has no effect
whatsoever on its ability to export its goods.
Anvone. can satisfy himself of the theoretical truth of that statement
by checking the arithmetic of the following transactions.
Let cameras cost fifteen times as much, and pens ten tin1es as tnuch in
Canada as in Japan. Then let Mr. Moneybags buy 1,000 ten dollar fountain
pens in Canada for $10,000, ship then1 to Japan and there sell them at the
Japanese price of $1.00, receiving therefore, $1,000. With this, let hitn buy
five hundred $2.00 Japanese cameras and ship these to Canada where he will
sell them at the Canadian price of $30.00, realizing a total of $15,000. Thus he
has made a $5,000 profit by exporting goods to a country whose price level
is one tenth of ours.
In practice, it doesn't happen that way. If Japanese prices were on the
average one tenth of Canadian prices, there would be so n1uch detnand for
Japanese currency to take advantage of such bargains, that Canadians would
have to pay ten Canadian dollars for one Japanese yen. This would cancel
out the difference in prices, and leave the two countries competing on an
equal footing (with some prices being lower in Canada, son1e lower in
Japan, and the average price about equal).
This levelling out of av·erage pn·ces through exchange rates does not
always happen automatically or instantaneously. Sometimes governments
J use their gold or foreign exchange reserves to maintain an artificially high
exchange rate for their currency, but they cannot do this for long, or their
reserves would become exhausted. At other times, large inflows of foreign
capital will keep the currency above par and thereby discourage exports.
This has been the case in Canada for several years now. It is, however, the
influx of capital, and not the level of our prices, that has tnade our dollar and
therefore our exports, costly, at least until the Flen1ing budget.
9
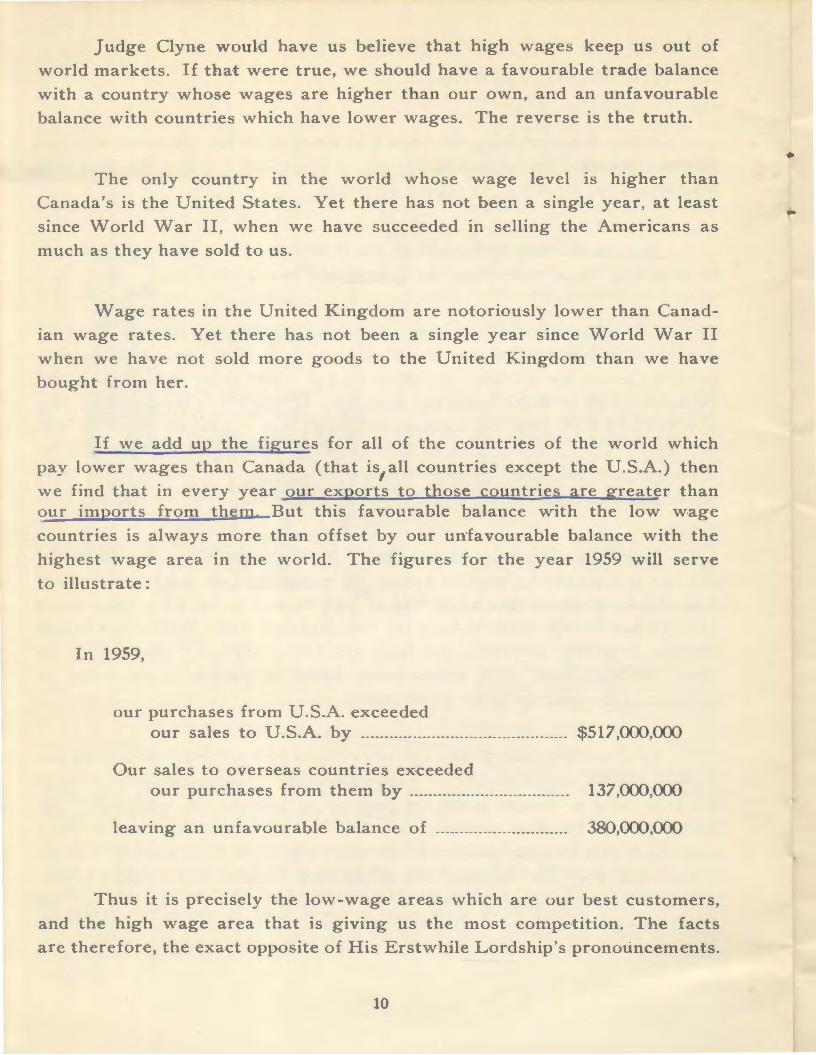
Judge Clyne would have us believe that high wages keep us out of
world markets. If that were true, we should have a favourable trade balance
with a country whose wages are higher than our own, and an unfavourable
balance \vith countries which have lower wages. The reverse is the truth.
The only country in the world whose wage level is higher than
Canada's is the United States. Yet there has not been a single year, at least
since World War II, when we have succeeded in selling the Americans as
much as they have sold to us.
Wage rates in the United Kingdom are notoriously lower than Canad
Ian wage rates. Yet there has not been a single year since World War II
when we have not sold n1ore goods to the United Kingdom than we have
bought from her.
If we add up the figures for all of the countries of the world which
pay lower \vages than Canada (that is1
all countries except the U.S.A.) then
\Ve find that in every year our exports to those countries are greater than our imports fron1 then1 But this favourable balance with the low wage
countries is always more than offset by our un·favourable balance with the
highest ·wage area in the world. The figures for the year 1959 will serve
to illustrate:
In 1959,
our purchases from U.S.A. exceeded our sales to U.S.A. by ............................................ $517,000,(XX)
Our sales to overseas countries exceeded our purchases from them by ·············----------------··--· 137,000,000
leaving an unfavourable balance of ·-·--------··-·------------- 380,000,000
Thus it is precisely the low-wage areas \vhich are our best customers,
and the high wage area that is giving us the n1ost con1petition. The facts
are therefore, the exact opposite of His Erstwhile Lordship's pronotincen1ents.
10

...
ARE CANADIAN COSTS HIGH?
"This pattern of in'Vestment is of course entirely natural. smce capital flows
instinctively to areas where it can be used most profitably. I draw ,Your attention
to it because it illustrates just how serious is the disparit.Y now existing in some
fields of manufacture between production costs on this continent and elsewhere
in the world." Hon ]. V. Clyne, April 25, 1961.
One would judge fron1 the above staten1ent that someho·w Canadian
costs and prices had gotten out of line ·with those in other parts of the world.
Other parts of his statement suggest that this is due to the "continuing
claims" of workers for higher wages.
It is a typical statement of the \Videspread belief that Canada is suf
fering from rampant inflation caused by wage increases. What is the truth
of the matter?
On page 12 appears a table showing the \vholesale pnce indexes of 29
countries. These are all of the countries for which the United Nations
publishes continuous price index senes for the past 25 years.
Note from the table, thrat of all the countries of the world only two,
Switzerl,and and Venezuela, have held their prices closer to prewar levels
than Canada.
If the Clyne version of economics were correct, we should nO\\' be so
overwhelmed with orders from abroad that we could not hope to fill then1.
Instead, the air is filled with moans about competition fron1 countries whose
prices have increased anywhere from forty titnes (France) to 250 titnes
(Japan) as much as ours.
How could it happen that Japan's pnces could increase by 25.000
percent, and still threaten us \Vith their con1petition? The sitnple truth is,
as we have said before, that our costs and prices have n'othing whatsoever
to do with out ability to sell con1petitively in the world n1arket. Our exports
I can be made uncon1petitive by rigid exchange rates, or by excessive inflows
of foreign capital, but you can't price yourself out of the "World market.
11

INCREASE IN WHOLESALE PRICES OF PRINCIPAL COUNTRIES: 1937 - 1959
I ncr ease in Wholesale Price Index from 1937
to December, 1959
Percent V en ezu ela __________________________ . ______________ ......... __ . ___ .... ___ . ------ 7 4
Switzer land ... ___ . _____ . ________________ . ___________________________ . _______ . _ _ 106
CAN ADA _____ ...... ___ . _______ .. __ . _______ ....... ____ .... _____________ . ___ ____ _ _ 112
United States ------------------------------------------------------------------ 112 United Kingdom :
Finished Goods ---------------------------------------------------------- 112 Basic Mate rials ______________ . ___________ . ______ ...... __ ... ____ ... .. . . . . . 151
West Germany -------------------------------------------------------------- 133 Costa Rica . __________ .. _________ ........ _________ .. _ ................... _ ... ___ .. 134*
New Zealand ---------------------------·-------------------------------------- 172 Portugal _________________ .... _ ....... _____ ........ _ ............. ________________ .. 180 S w ede11 ______________ . ____________ . __ . ______ .. ________ ... ________ . ________ .. _____ .. 182
Union of South Africa ------------------------------------------------ 192 Norway .......... _ .. _. ____ . _. __ . _ .. _ .... _ .................. _ .... __ ...... _ .. ______ .. 203 Denmark . __ ...... _. _. _ ... ____ ................ _ .... __ ..... _ ... _. _. _ .. _............. 203
Australia ----····-·--·-··········-················································· 234 Phillippi n e s . _ .. . . . .. . . .. .. . . . .... ......... .... ... . .. . ......... .... ........ ..... 253 Nether 1 and s .... __ . ___ .. _ .. _ .. __ .... _ ........................... _. __ ............ 269 Belgium . _. _ .. ___________ ... ___ .. _. ______________ . ______ .. _ ... ___ .. ____ ...... _ .... __ 296 Egypt . _ .. _____ . __ .. _____ .. ___________ . _ .... _ . ___ .. _ . ____ .. _______ . __ .... _____ . . . . . . 3()4. India __ . ___ ........ ___ . ___ . ________ . ______ ........ ________ ..... ___ ...... _______ .. .... 318 Mexico ... _ ... _. ____ . ______ .... ___ ... _______ ..... _ .. _ ..... _____ ... __ ............. __ 500 I ran .................. _____ ........... _ ...... _ ... _. ___ .... __ ...... ____ . _____ ... _ ..... _ 7 66 Spa in _______ .............. _ ... __ ... _ ....... _ ....... _ ... ___ ..... _____ ___ _ ______ _ _ __ __ _ 970 Israel ______ . ___ ... ___ . _. _______ .... ___ .......... _______________ .... ___________ . 1 ,390 Fin 1 and .................. _ .... _ ......... _ . _ ..... _ ........ _ .... _ ....... __ .. . . . . . 1 , 671 Peru __________ ........... __ .... ____ .. _. __ . _____ ...... _________ .... __ . _ ..... ___ _ _ 1 ,720 Fran·ce ... __________ .... __ .... ____ .............. _________ ... ______ .... ___ ... __ . 4,233 Italy __ ......... __ ...... ___ . __ . _ ...... ____ . ___ ...... ____ ...................... _. _ 4,850 Chile . _ ......... __ ......... _______ .......... ___________ . .. . . . . .. ........ ... . ... . . 10,120 Japan .......................... _______ .. __ ..... __________ .. ____ . ____ .. __ . _____ . 25.150 Greece ........................................................................ 64,400
SOURCE: U.N. Statistical Y'earbook 1958
U.N. Monthly Bulletin of Statistics, April 1960.
* from 1938
12

YOU CAN'T PRICE YOURSELF OUT OF THE HOME MARKET EITHER
There will be those
who will argue that
while you may not be
able to price yourself
out of the world mark
et, this will not be true
of the home market.
Inside the country they
will say, where every
one is using the same
currency, an tncrease
in the wages of one
group of workers will
raise the price of their
product and cause un
employment through
high prices.
This too is nonsense. Wages of production
workers account for
only about a guarter
of the total value of
production. Even if we
include the salaries of
white collar workers
and management, wages and salaries still account for only about half of the
total values produced. {\.11 industries have a wide margin to manoeuvre in, be
tween wages and prices. If it should happen, as it sometimes does, that wages
rise to more than half the total price, the employer does not have to add the
increase to the price, and in point of fa-ct, he more often tries to cancel it out
by raising productivity. Otherwise, it would not have been possible for wage
rates to rise eighty percent while living costs rose only 30 percent in the
period since 1949. This is progress, but it is progress of a kind that the Clynes
of this world bitterly resent.
13

A good illustration of the fact that wage Increases do not automatic
ally raise the price is to be seen in the following comparison of building
trades wage rates and building costs in various cities. The wage rates are
those of carpenters, the basic building craft, and the price is the cost per
square foot of a standard bungalow computed by the Canadian Mortgage and
Housing Corporation from actual building contracts.
Hourly Wage
Rate of
Carpenters
St. ] ohn's --------------------------------------------$1.82
Quebec ------------------------------------------------ 1.98
Tor on to __ _ ______ __ __ _ ___ _ ______ _ _ _ __ _ _ ___ _ _ _ __ __ _ ____ __ 2.~
Cost per Square
Foot of Sta1rdard
Bungalow
$10.87
10.55
9.74
The city ·with the lowest wage rate has the highest cost, and the city
with the highest wage rate has the lowest cost. Surely there could be no 1nore
graphic illustration of the fact that high prices are not caused by high wages.
It is sad, but true, that some labour leaders have S\vallowed the Clyne
theory and agreed to abandon the negotiating policies which have in the
past kept our living standards slowly but steadily improving.
All organized \¥orkers should bear in mind that in good years and bad,
their output per hour is rising by two, three or four percent per year, and
that if their wages do not follow, they are being swindled.
14

..
THEY CRIED ALL THE WAY TO THE BANK
19-+6
MacMillan Co. Statement of Conditions
··continued high pnces of Pacific Coast lutnber and the growing scarcity of dollars combine to force overseas buyers to Increase the use of substitutes"
H. R. MacMillan, 1946 Annual Report-
1947 "The scarcity of dollars is very rap-idly closing or greatly restricting many of the above named historical markets for lumber from the Canadian Douglas Fir regton Although the United States is an itnportant market for British Columbia, the statement below shows it to be an insuffic-ient outlet for our surplus. Other markets must also be maintained or a disastrous collapse will result."
H. R. MacMillan, Annual Report, 1947-
1953 .. It is serious for the Province that cost of producing an export comtnodity should be rising while sales prices~ governed solely by world conditions, are falling.''
H. R. MacMillan, Annual Report, 1953-
1957 .. The year 1956-57 has been dif-ficult. Costs have risen steadily while sale pnces were falling. Wages have risen without an offsetting increase in hourly production. Prices of supplies and machinery we buy climb steadily. Concurrently \<Ve sell 70% or more of our products outside Canada in competitive world markets where pnces of most of our commodities have fallen throughout the year.'' R. M. Shaw, President,
Annual Report, 1957-
15
MacMillan, Co. MacMillan Co. Sales Profits
$31 ,201 ,292 $5,319,780
63,129,300 14,632,410
127,492,956 22,878,582
171,181,460 20,229,731

MacMillan Co. Statement of Conditions
1960 "I draw your attention to it because it illustrates just how serious is the disparity now existing in some fields o f manufacture between production costs in the world ... The exodus of capital from North America will bring in its wake social and economic problems of
great magnitude. I hope that labour leaders, who are responsible in many cases for its occurrence will take note of this arithmetic of the contemporary world."
]. V. Clyne, Annual Report, 1960-
MacMillan Co. MacMillan Co. Sales Profits
305,291,437 52,578,296
NOTE: The above statements and sales and profit figures are takett, fro11t the annual reports for the years indicated, of the H. R. MacMillan Export Company and its successors, MacM.illan & Bloedel and MacMillan, Bloedel and Powell River Company.
16
..