HDFC Standard Life Insurance Company Limited is the sole and exclusive property of HDFC Life....
23
This is the sole and exclusive property of HDFC Life. October 26, 2016 HDFC Standard Life Insurance Company Limited Business presentation – H1 FY17
Transcript of HDFC Standard Life Insurance Company Limited is the sole and exclusive property of HDFC Life....
This is the sole and exclusive property of HDFC Life. October 26, 2016
HDFC Standard Life Insurance Company Limited
Business presentation – H1 FY17
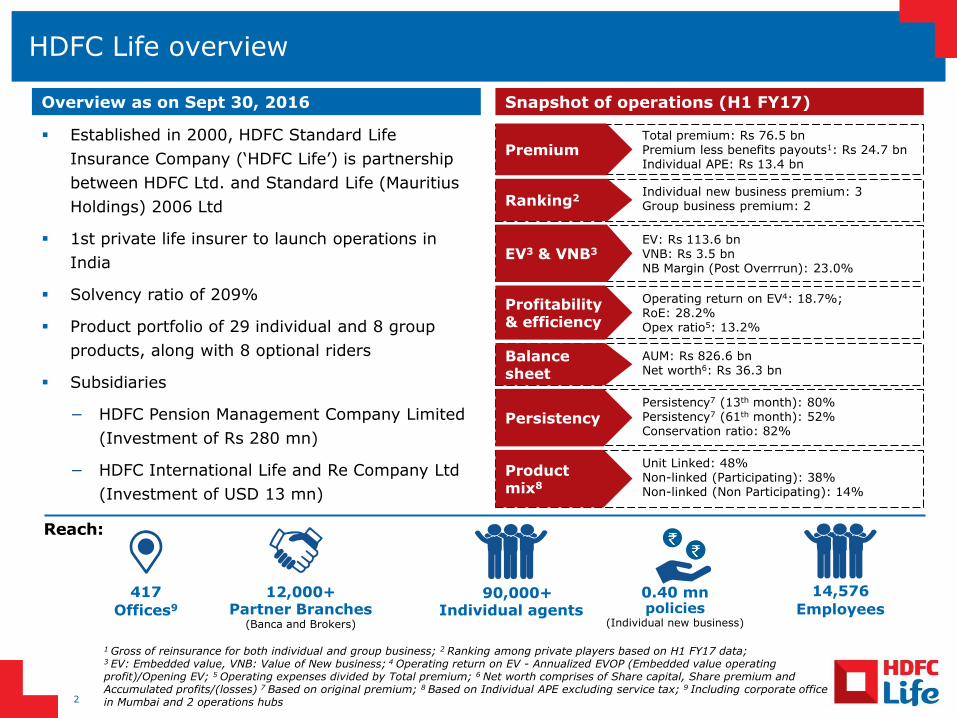
HDFC Life overview
Reach:
Employees
14,576
Partner Branches (Banca and Brokers)
12,000+
Offices9
417
Persistency7 (13th month): 80% Persistency7 (61th month): 52% Conservation ratio: 82% Persistency
AUM: Rs 826.6 bn Net worth6: Rs 36.3 bn Balance sheet
Total premium: Rs 76.5 bn Premium less benefits payouts1: Rs 24.7 bn Individual APE: Rs 13.4 bn Premium
Operating return on EV4: 18.7%; RoE: 28.2% Opex ratio5: 13.2%
Profitability & efficiency
EV: Rs 113.6 bn VNB: Rs 3.5 bn NB Margin (Post Overrrun): 23.0% EV3 & VNB3
Established in 2000, HDFC Standard Life
Insurance Company (‘HDFC Life’) is partnership
between HDFC Ltd. and Standard Life (Mauritius
Holdings) 2006 Ltd
1st private life insurer to launch operations in
India
Solvency ratio of 209%
Product portfolio of 29 individual and 8 group
products, along with 8 optional riders
Subsidiaries
− HDFC Pension Management Company Limited
(Investment of Rs 280 mn)
− HDFC International Life and Re Company Ltd
(Investment of USD 13 mn)
Snapshot of operations (H1 FY17) Overview as on Sept 30, 2016
Unit Linked: 48% Non-linked (Participating): 38% Non-linked (Non Participating): 14%
Product mix8
Individual new business premium: 3 Group business premium: 2 Ranking2
Individual agents
90,000+
1 Gross of reinsurance for both individual and group business; 2 Ranking among private players based on H1 FY17 data; 3 EV: Embedded value, VNB: Value of New business; 4 Operating return on EV - Annualized EVOP (Embedded value operating profit)/Opening EV; 5 Operating expenses divided by Total premium; 6 Net worth comprises of Share capital, Share premium and Accumulated profits/(losses) 7 Based on original premium; 8 Based on Individual APE excluding service tax; 9 Including corporate office in Mumbai and 2 operations hubs 2
policies (Individual new business)
0.40 mn
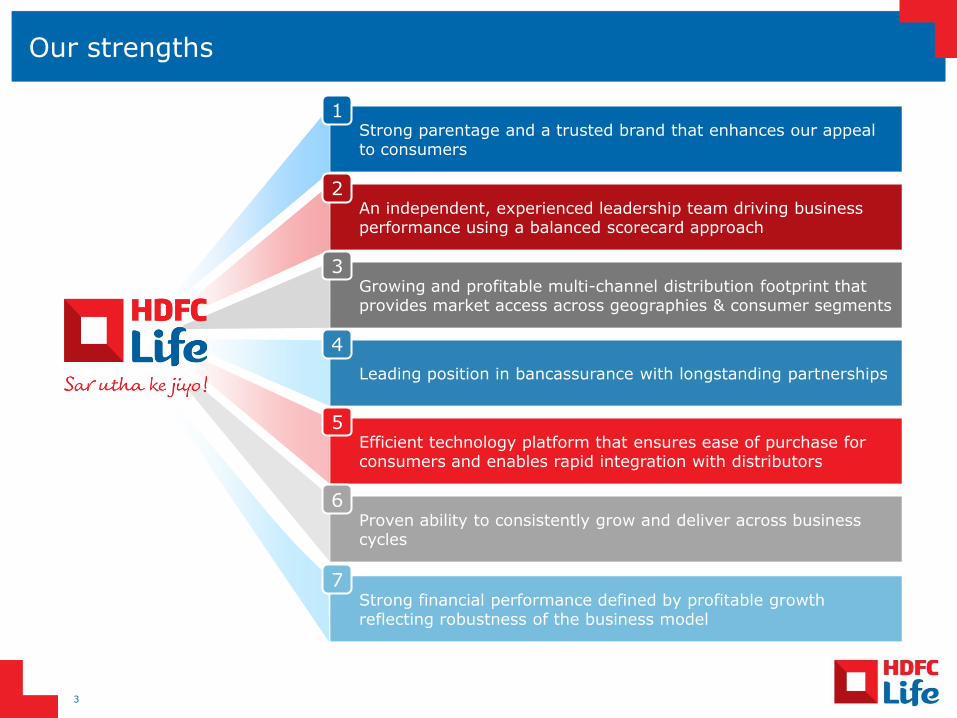
Our strengths
Strong parentage and a trusted brand that enhances our appeal to consumers
An independent, experienced leadership team driving business performance using a balanced scorecard approach
Growing and profitable multi-channel distribution footprint that provides market access across geographies & consumer segments
Leading position in bancassurance with longstanding partnerships
Efficient technology platform that ensures ease of purchase for consumers and enables rapid integration with distributors
Proven ability to consistently grow and deliver across business cycles
1
2
3
4
5
6
Strong financial performance defined by profitable growth reflecting robustness of the business model
7
3
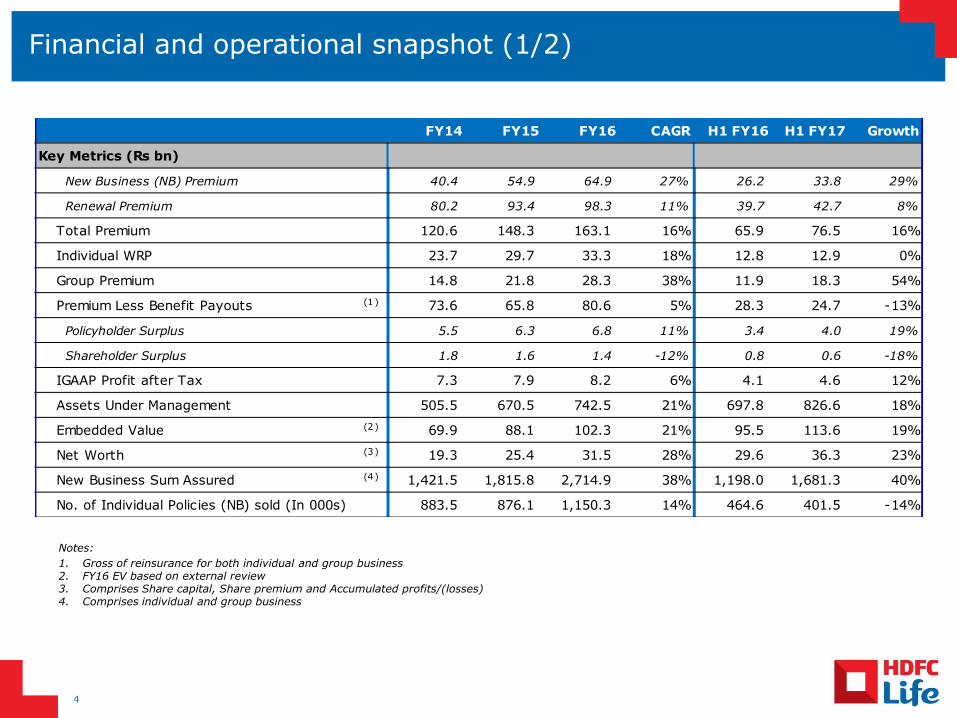
Financial and operational snapshot (1/2)
Notes:
1. Gross of reinsurance for both individual and group business 2. FY16 EV based on external review 3. Comprises Share capital, Share premium and Accumulated profits/(losses) 4. Comprises individual and group business
4
FY14 FY15 FY16 CAGR H1 FY16 H1 FY17 Growth
Key Metrics (Rs bn)
New Business (NB) Premium 40.4 54.9 64.9 27% 26.2 33.8 29%
Renewal Premium 80.2 93.4 98.3 11% 39.7 42.7 8%
Total Premium 120.6 148.3 163.1 16% 65.9 76.5 16%
Individual WRP 23.7 29.7 33.3 18% 12.8 12.9 0%
Group Premium 14.8 21.8 28.3 38% 11.9 18.3 54%
Premium Less Benefit Payouts (1) 73.6 65.8 80.6 5% 28.3 24.7 -13%
Policyholder Surplus 5.5 6.3 6.8 11% 3.4 4.0 19%
Shareholder Surplus 1.8 1.6 1.4 -12% 0.8 0.6 -18%
IGAAP Profit after Tax 7.3 7.9 8.2 6% 4.1 4.6 12%
Assets Under Management 505.5 670.5 742.5 21% 697.8 826.6 18%
Embedded Value (2) 69.9 88.1 102.3 21% 95.5 113.6 19%
Net Worth (3) 19.3 25.4 31.5 28% 29.6 36.3 23%
New Business Sum Assured (4) 1,421.5 1,815.8 2,714.9 38% 1,198.0 1,681.3 40%
No. of Individual Policies (NB) sold (In 000s) 883.5 876.1 1,150.3 14% 464.6 401.5 -14%
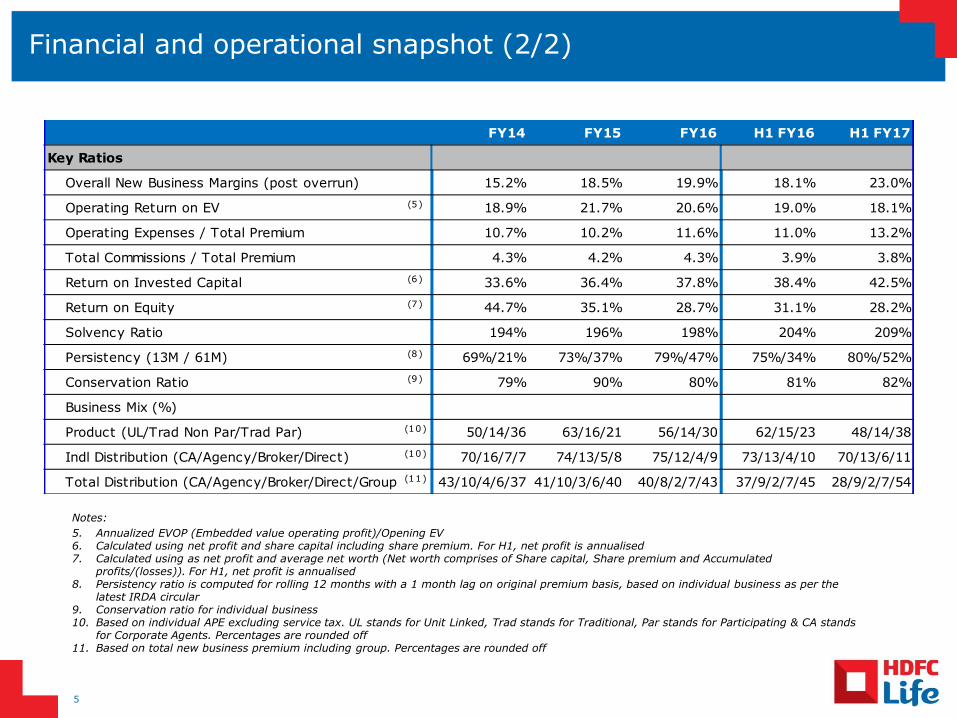
Financial and operational snapshot (2/2)
Notes:
5. Annualized EVOP (Embedded value operating profit)/Opening EV 6. Calculated using net profit and share capital including share premium. For H1, net profit is annualised 7. Calculated using as net profit and average net worth (Net worth comprises of Share capital, Share premium and Accumulated
profits/(losses)). For H1, net profit is annualised 8. Persistency ratio is computed for rolling 12 months with a 1 month lag on original premium basis, based on individual business as per the
latest IRDA circular 9. Conservation ratio for individual business 10. Based on individual APE excluding service tax. UL stands for Unit Linked, Trad stands for Traditional, Par stands for Participating & CA stands
for Corporate Agents. Percentages are rounded off 11. Based on total new business premium including group. Percentages are rounded off
5
FY14 FY15 FY16 H1 FY16 H1 FY17
Key Ratios
Overall New Business Margins (post overrun) 15.2% 18.5% 19.9% 18.1% 23.0%
Operating Return on EV (5) 18.9% 21.7% 20.6% 19.0% 18.1%
Operating Expenses / Total Premium 10.7% 10.2% 11.6% 11.0% 13.2%
Total Commissions / Total Premium 4.3% 4.2% 4.3% 3.9% 3.8%
Return on Invested Capital (6) 33.6% 36.4% 37.8% 38.4% 42.5%
Return on Equity (7) 44.7% 35.1% 28.7% 31.1% 28.2%
Solvency Ratio 194% 196% 198% 204% 209%
Persistency (13M / 61M) (8) 69%/21% 73%/37% 79%/47% 75%/34% 80%/52%
Conservation Ratio (9) 79% 90% 80% 81% 82%
Business Mix (%)
Product (UL/Trad Non Par/Trad Par) (10) 50/14/36 63/16/21 56/14/30 62/15/23 48/14/38
Indl Distribution (CA/Agency/Broker/Direct) (10) 70/16/7/7 74/13/5/8 75/12/4/9 73/13/4/10 70/13/6/11
Total Distribution (CA/Agency/Broker/Direct/Group) (11) 43/10/4/6/37 41/10/3/6/40 40/8/2/7/43 37/9/2/7/45 28/9/2/7/54
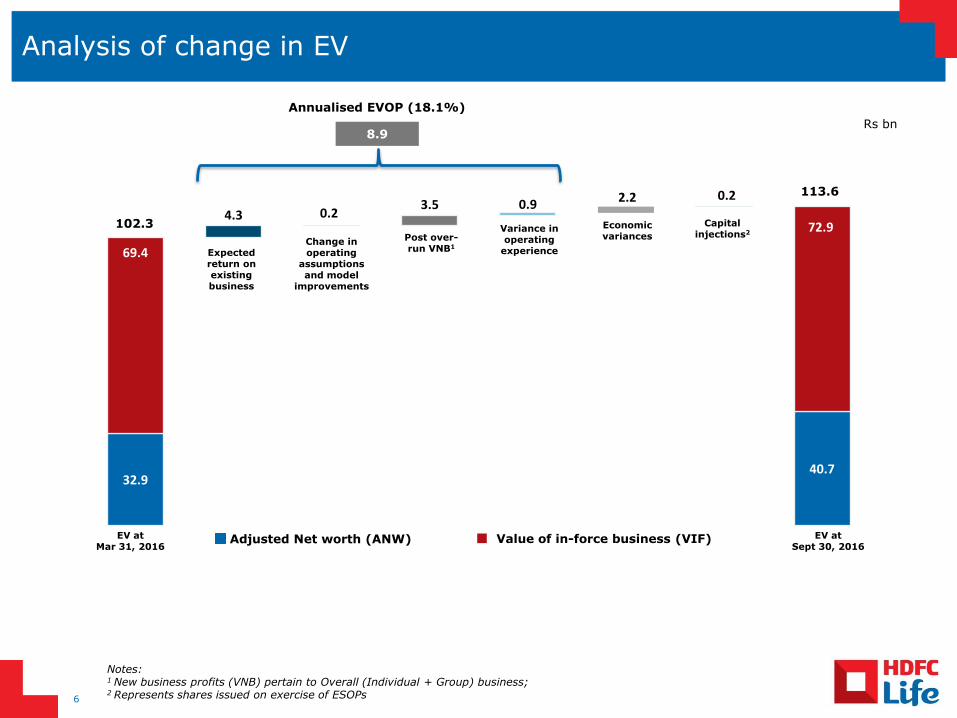
Analysis of change in EV
32.9 40.7
69.4
4.3 0.2 3.5 0.9
2.2 0.2
72.9
Annualised EVOP (18.1%)
8.9
EV at Mar 31, 2016
EV at Sept 30, 2016
Expected return on existing business
Capital injections2
Change in operating
assumptions and model
improvements
Post over-run VNB1
Variance in operating
experience
Economic variances
Rs bn
102.3
113.6
Notes: 1 New business profits (VNB) pertain to Overall (Individual + Group) business; 2 Represents shares issued on exercise of ESOPs
Value of in-force business (VIF) Adjusted Net worth (ANW)
6
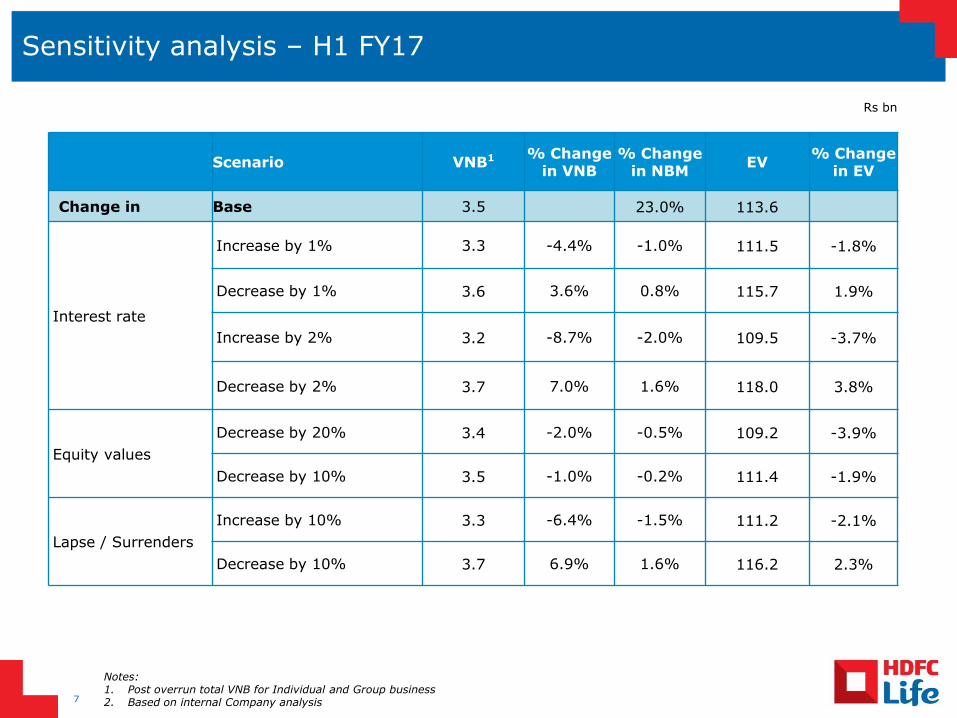
Sensitivity analysis – H1 FY17
Notes: 1. Post overrun total VNB for Individual and Group business 2. Based on internal Company analysis 7
Scenario VNB1 % Change in VNB
% Change in NBM
EV % Change
in EV
Change in Base 3.5 23.0% 113.6
Interest rate
Increase by 1% 3.3 -4.4% -1.0% 111.5 -1.8%
Decrease by 1% 3.6 3.6% 0.8% 115.7 1.9%
Increase by 2% 3.2 -8.7% -2.0% 109.5 -3.7%
Decrease by 2% 3.7 7.0% 1.6% 118.0 3.8%
Equity values
Decrease by 20% 3.4 -2.0% -0.5% 109.2 -3.9%
Decrease by 10% 3.5 -1.0% -0.2% 111.4 -1.9%
Lapse / Surrenders
Increase by 10% 3.3 -6.4% -1.5% 111.2 -2.1%
Decrease by 10% 3.7 6.9% 1.6% 116.2 2.3%
Rs bn
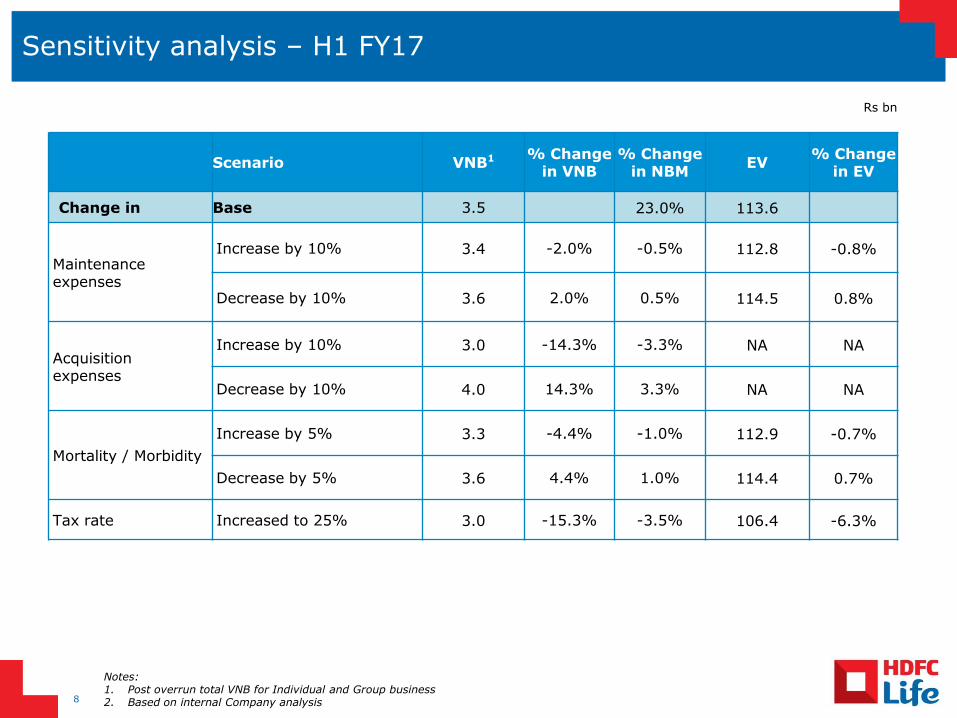
Sensitivity analysis – H1 FY17
Notes: 1. Post overrun total VNB for Individual and Group business 2. Based on internal Company analysis 8
Scenario VNB1 % Change in VNB
% Change in NBM
EV % Change
in EV
Change in Base 3.5 23.0% 113.6
Maintenance expenses
Increase by 10% 3.4 -2.0% -0.5% 112.8 -0.8%
Decrease by 10% 3.6 2.0% 0.5% 114.5 0.8%
Acquisition expenses
Increase by 10% 3.0 -14.3% -3.3% NA NA
Decrease by 10% 4.0 14.3% 3.3% NA NA
Mortality / Morbidity
Increase by 5% 3.3 -4.4% -1.0% 112.9 -0.7%
Decrease by 5% 3.6 4.4% 1.0% 114.4 0.7%
Tax rate Increased to 25% 3.0 -15.3% -3.5% 106.4 -6.3%
Rs bn
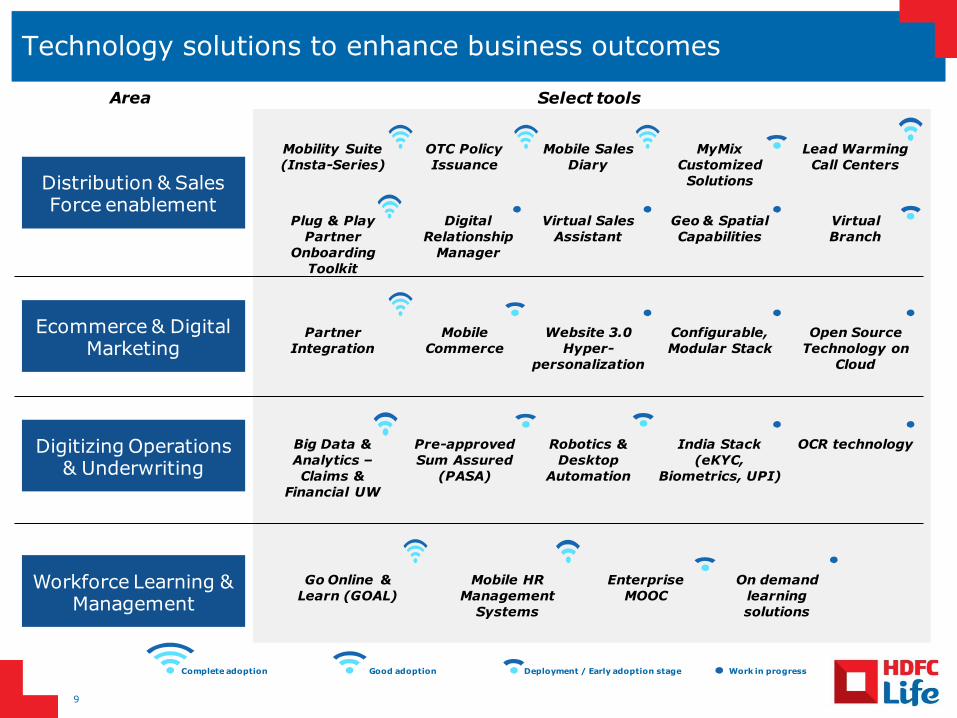
Technology solutions to enhance business outcomes
9
Distribution & Sales Force enablement
Ecommerce & Digital Marketing
Digitizing Operations & Underwriting
Workforce Learning & Management
Work in progressDeployment / Early adoption stageGood adoptionComplete adoption
Big Data &
Analytics –
Claims &
Financial UW
Pre-approved
Sum Assured
(PASA)
Robotics &
Desktop
Automation
India Stack
(eKYC,
Biometrics, UPI)
Go Online &
Learn (GOAL)
Mobile HR
Management
Systems
Enterprise
MOOC
On demand
learning
solutions
Mobility Suite
(Insta-Series)
OTC Policy
Issuance
Mobile Sales
Diary
MyMix
Customized
Solutions
Lead Warming
Call Centers
Virtual Sales
Assistant
Geo & Spatial
Capabilities
Virtual
Branch
Mobile
Commerce
Partner
Integration
Configurable,
Modular Stack
Open Source
Technology on
Cloud
Select toolsArea
Website 3.0
Hyper-
personalization
Digital
Relationship
Manager
Plug & Play
Partner
Onboarding
Toolkit
OCR technology
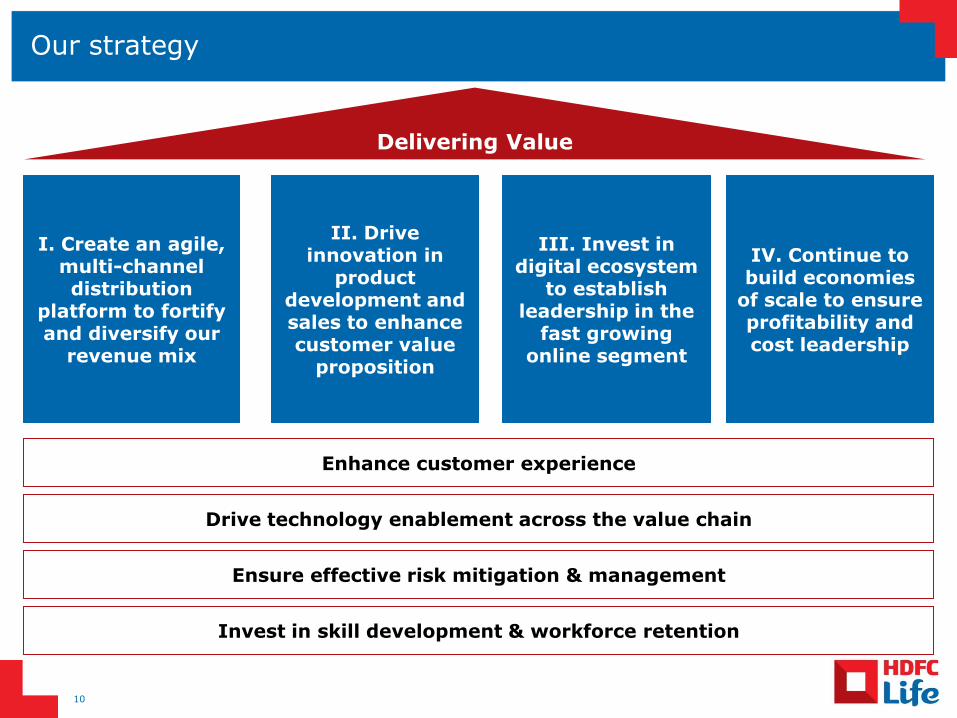
Our strategy
Drive technology enablement across the value chain
I. Create an agile, multi-channel distribution
platform to fortify and diversify our
revenue mix
II. Drive innovation in
product development and sales to enhance customer value
proposition
III. Invest in digital ecosystem
to establish leadership in the
fast growing online segment
IV. Continue to build economies
of scale to ensure profitability and cost leadership
Invest in skill development & workforce retention
Delivering Value
Ensure effective risk mitigation & management
Enhance customer experience
10
This is the sole and exclusive property of HDFC Life. October 26, 2016
Merger Update
11
Summary – Key transaction details
12 Note: 1.Indicative based on shareholding as of Jun 30, 2016 for respective companies
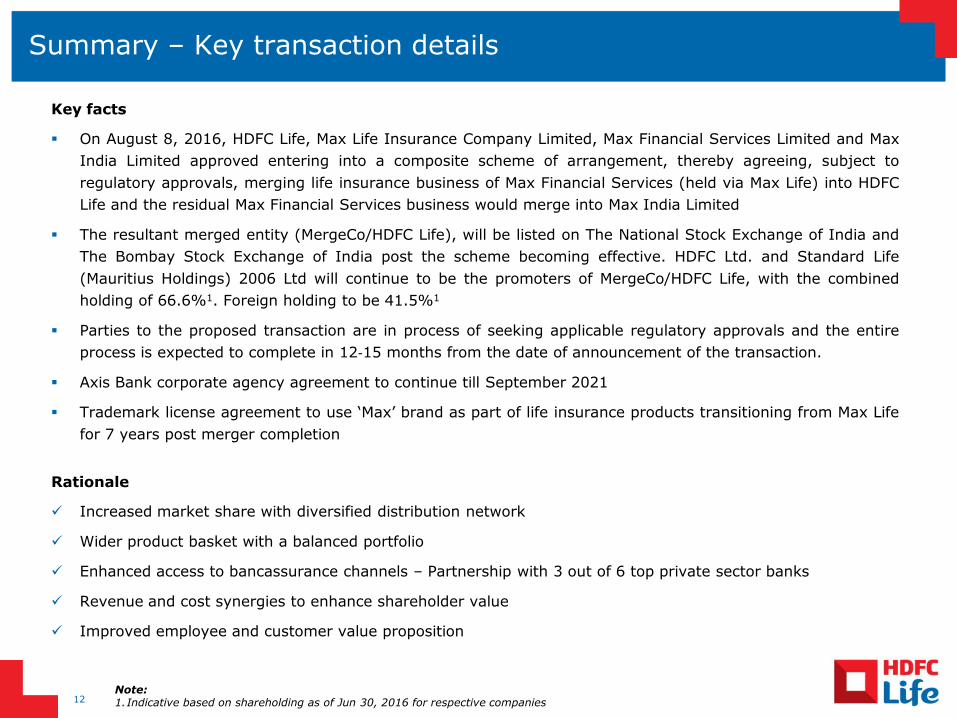
Key facts
On August 8, 2016, HDFC Life, Max Life Insurance Company Limited, Max Financial Services Limited and Max
India Limited approved entering into a composite scheme of arrangement, thereby agreeing, subject to
regulatory approvals, merging life insurance business of Max Financial Services (held via Max Life) into HDFC
Life and the residual Max Financial Services business would merge into Max India Limited
The resultant merged entity (MergeCo/HDFC Life), will be listed on The National Stock Exchange of India and
The Bombay Stock Exchange of India post the scheme becoming effective. HDFC Ltd. and Standard Life
(Mauritius Holdings) 2006 Ltd will continue to be the promoters of MergeCo/HDFC Life, with the combined
holding of 66.6%1. Foreign holding to be 41.5%1
Parties to the proposed transaction are in process of seeking applicable regulatory approvals and the entire
process is expected to complete in 12‐15 months from the date of announcement of the transaction.
Axis Bank corporate agency agreement to continue till September 2021
Trademark license agreement to use ‘Max’ brand as part of life insurance products transitioning from Max Life
for 7 years post merger completion
Rationale
Increased market share with diversified distribution network
Wider product basket with a balanced portfolio
Enhanced access to bancassurance channels – Partnership with 3 out of 6 top private sector banks
Revenue and cost synergies to enhance shareholder value
Improved employee and customer value proposition
Regulatory and integration update
13
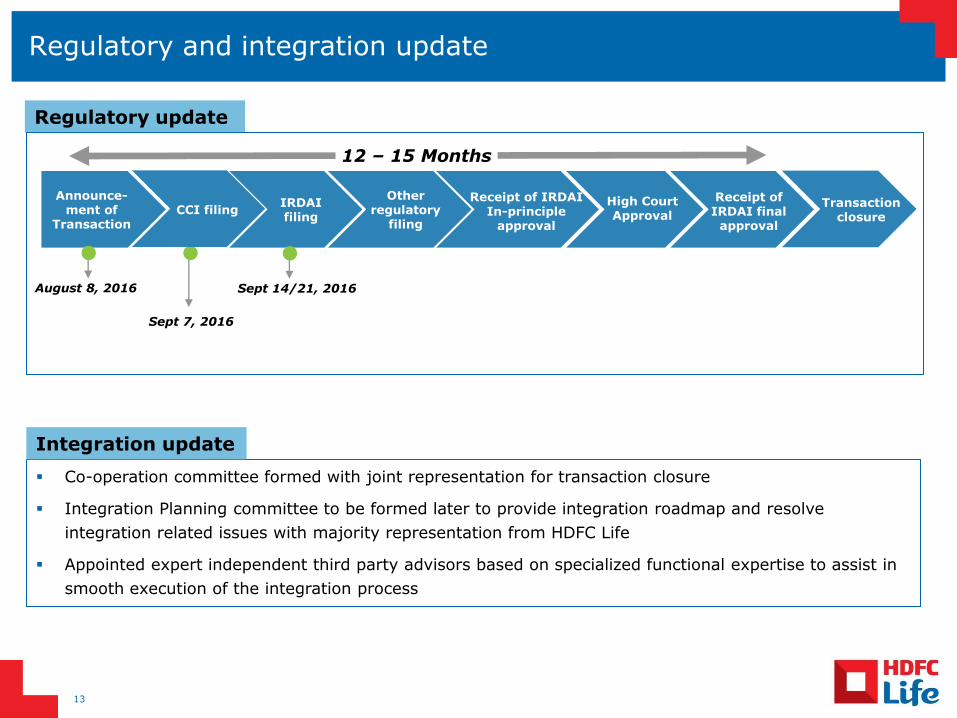
IRDAI filing
Other regulatory
filing
Receipt of IRDAI In-principle
approval
High Court Approval
Receipt of IRDAI final
approval
12 – 15 Months
Sept 7, 2016
Co-operation committee formed with joint representation for transaction closure
Integration Planning committee to be formed later to provide integration roadmap and resolve
integration related issues with majority representation from HDFC Life
Appointed expert independent third party advisors based on specialized functional expertise to assist in
smooth execution of the integration process
Regulatory update
Integration update
Sept 14/21, 2016
CCI filing Announce-
ment of Transaction
Transaction closure
August 8, 2016
This is the sole and exclusive property of HDFC Life. October 26, 2016
Annexures
14
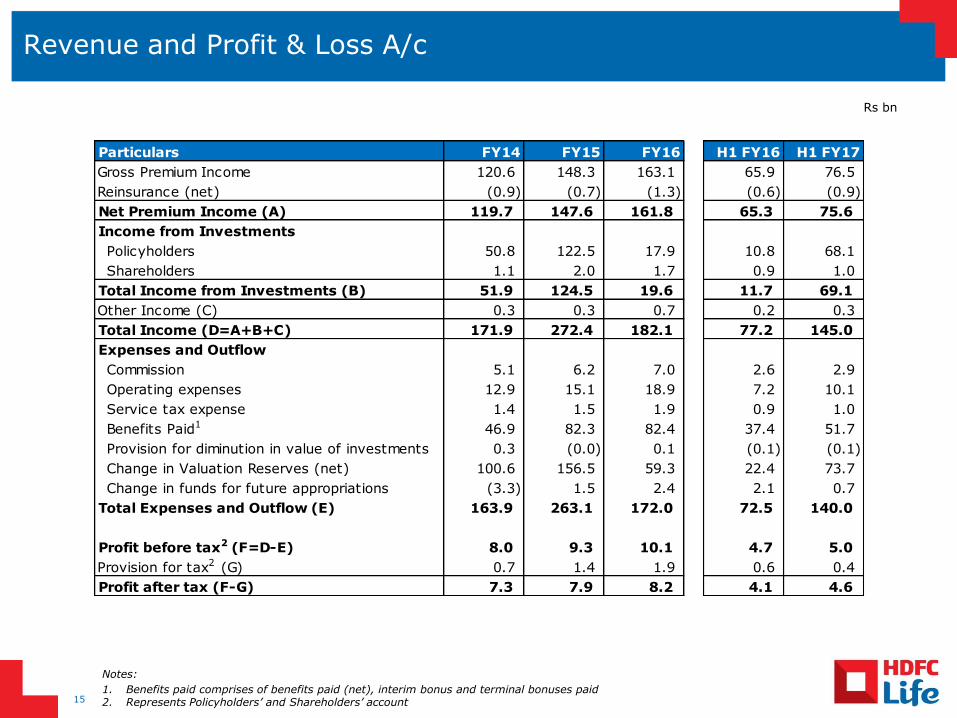
Revenue and Profit & Loss A/c
Notes:
1. Benefits paid comprises of benefits paid (net), interim bonus and terminal bonuses paid 2. Represents Policyholders’ and Shareholders’ account 15
Rs bn
Particulars FY14 FY15 FY16 H1 FY16 H1 FY17
Gross Premium Income 120.6 148.3 163.1 65.9 76.5
Reinsurance (net) (0.9) (0.7) (1.3) (0.6) (0.9)
Net Premium Income (A) 119.7 147.6 161.8 65.3 75.6
Income from Investments
Policyholders 50.8 122.5 17.9 10.8 68.1
Shareholders 1.1 2.0 1.7 0.9 1.0
Total Income from Investments (B) 51.9 124.5 19.6 11.7 69.1
Other Income (C) 0.3 0.3 0.7 0.2 0.3
Total Income (D=A+B+C) 171.9 272.4 182.1 77.2 145.0
Expenses and Outflow
Commission 5.1 6.2 7.0 2.6 2.9
Operating expenses 12.9 15.1 18.9 7.2 10.1
Service tax expense 1.4 1.5 1.9 0.9 1.0
Benefits Paid1 46.9 82.3 82.4 37.4 51.7
Provision for diminution in value of investments 0.3 (0.0) 0.1 (0.1) (0.1)
Change in Valuation Reserves (net) 100.6 156.5 59.3 22.4 73.7
Change in funds for future appropriations (3.3) 1.5 2.4 2.1 0.7
Total Expenses and Outflow (E) 163.9 263.1 172.0 72.5 140.0
Profit before tax2 (F=D-E) 8.0 9.3 10.1 4.7 5.0
Provision for tax2 (G) 0.7 1.4 1.9 0.6 0.4
Profit after tax (F-G) 7.3 7.9 8.2 4.1 4.6
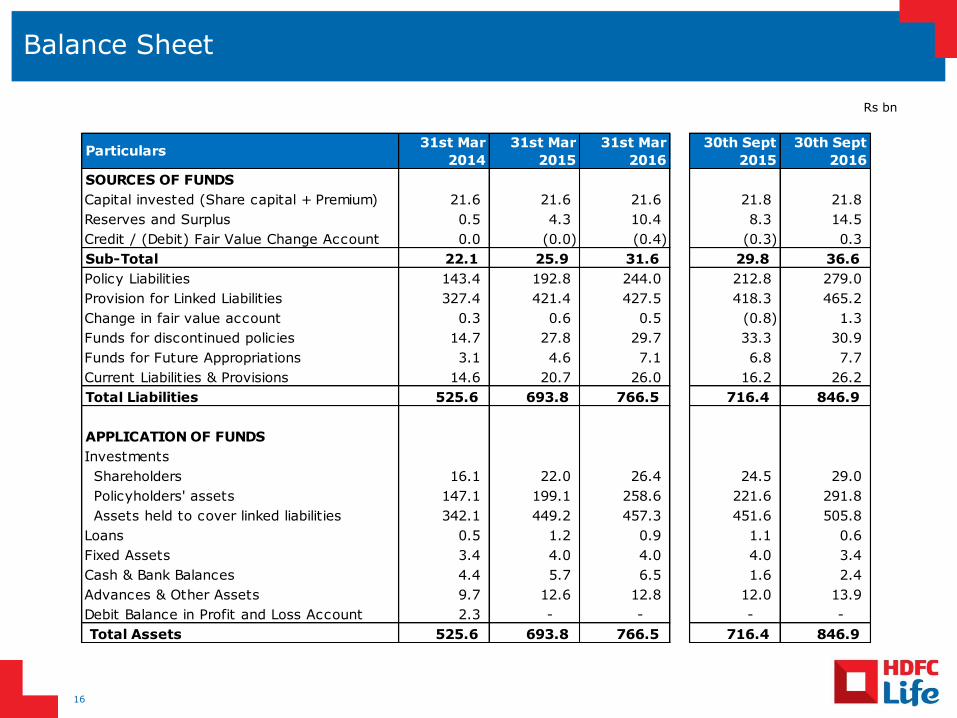
Balance Sheet
16
Particulars31st Mar
2014
31st Mar
2015
31st Mar
2016
30th Sept
2015
30th Sept
2016
SOURCES OF FUNDS
Capital invested (Share capital + Premium) 21.6 21.6 21.6 21.8 21.8
Reserves and Surplus 0.5 4.3 10.4 8.3 14.5
Credit / (Debit) Fair Value Change Account 0.0 (0.0) (0.4) (0.3) 0.3
Sub-Total 22.1 25.9 31.6 29.8 36.6
Policy Liabilities 143.4 192.8 244.0 212.8 279.0
Provision for Linked Liabilities 327.4 421.4 427.5 418.3 465.2
Change in fair value account 0.3 0.6 0.5 (0.8) 1.3
Funds for discontinued policies 14.7 27.8 29.7 33.3 30.9
Funds for Future Appropriations 3.1 4.6 7.1 6.8 7.7
Current Liabilities & Provisions 14.6 20.7 26.0 16.2 26.2
Total Liabilities 525.6 693.8 766.5 716.4 846.9
APPLICATION OF FUNDS
Investments
Shareholders 16.1 22.0 26.4 24.5 29.0
Policyholders' assets 147.1 199.1 258.6 221.6 291.8
Assets held to cover linked liabilities 342.1 449.2 457.3 451.6 505.8
Loans 0.5 1.2 0.9 1.1 0.6
Fixed Assets 3.4 4.0 4.0 4.0 3.4
Cash & Bank Balances 4.4 5.7 6.5 1.6 2.4
Advances & Other Assets 9.7 12.6 12.8 12.0 13.9
Debit Balance in Profit and Loss Account 2.3 - - - -
Total Assets 525.6 693.8 766.5 716.4 846.9
Rs bn
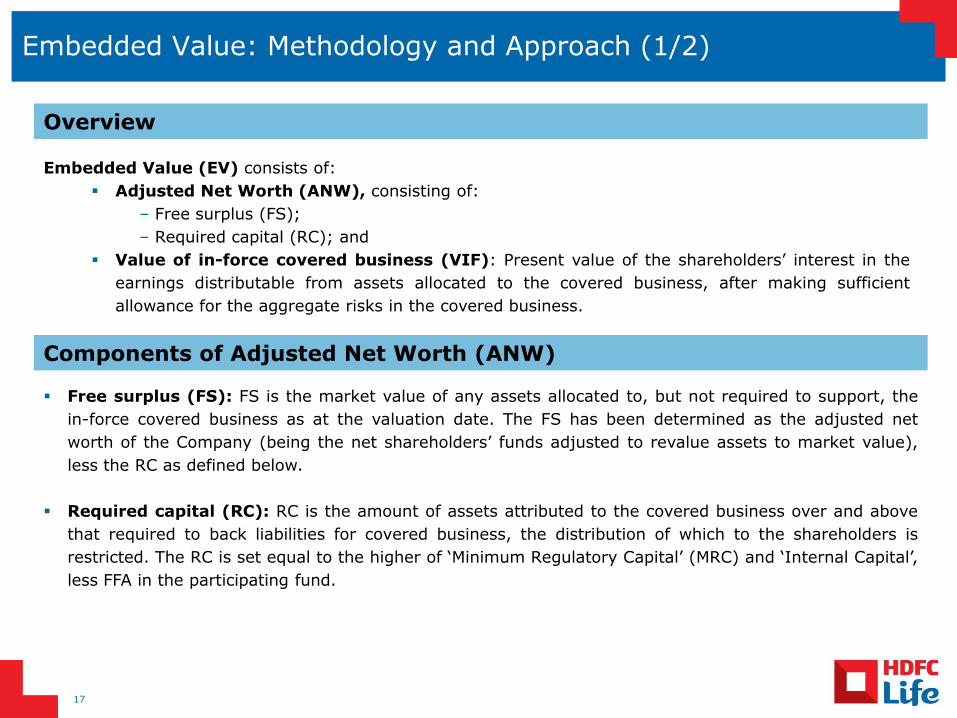
Embedded Value: Methodology and Approach (1/2)
17
Overview
Embedded Value (EV) consists of:
Adjusted Net Worth (ANW), consisting of:
– Free surplus (FS);
– Required capital (RC); and
Value of in-force covered business (VIF): Present value of the shareholders’ interest in the
earnings distributable from assets allocated to the covered business, after making sufficient
allowance for the aggregate risks in the covered business.
Free surplus (FS): FS is the market value of any assets allocated to, but not required to support, the
in-force covered business as at the valuation date. The FS has been determined as the adjusted net
worth of the Company (being the net shareholders’ funds adjusted to revalue assets to market value),
less the RC as defined below.
Required capital (RC): RC is the amount of assets attributed to the covered business over and above
that required to back liabilities for covered business, the distribution of which to the shareholders is
restricted. The RC is set equal to the higher of ‘Minimum Regulatory Capital’ (MRC) and ‘Internal Capital’,
less FFA in the participating fund.
Components of Adjusted Net Worth (ANW)
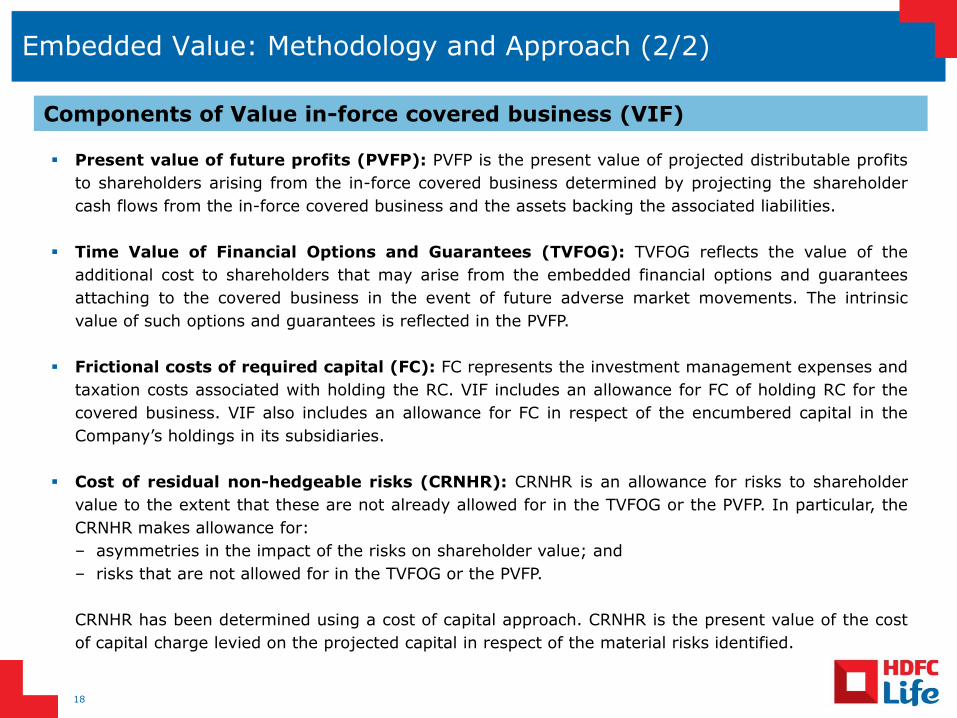
Embedded Value: Methodology and Approach (2/2)
Present value of future profits (PVFP): PVFP is the present value of projected distributable profits
to shareholders arising from the in-force covered business determined by projecting the shareholder
cash flows from the in-force covered business and the assets backing the associated liabilities.
Time Value of Financial Options and Guarantees (TVFOG): TVFOG reflects the value of the
additional cost to shareholders that may arise from the embedded financial options and guarantees
attaching to the covered business in the event of future adverse market movements. The intrinsic
value of such options and guarantees is reflected in the PVFP.
Frictional costs of required capital (FC): FC represents the investment management expenses and
taxation costs associated with holding the RC. VIF includes an allowance for FC of holding RC for the
covered business. VIF also includes an allowance for FC in respect of the encumbered capital in the
Company’s holdings in its subsidiaries.
Cost of residual non-hedgeable risks (CRNHR): CRNHR is an allowance for risks to shareholder
value to the extent that these are not already allowed for in the TVFOG or the PVFP. In particular, the
CRNHR makes allowance for:
– asymmetries in the impact of the risks on shareholder value; and
– risks that are not allowed for in the TVFOG or the PVFP.
CRNHR has been determined using a cost of capital approach. CRNHR is the present value of the cost
of capital charge levied on the projected capital in respect of the material risks identified.
18
Components of Value in-force covered business (VIF)
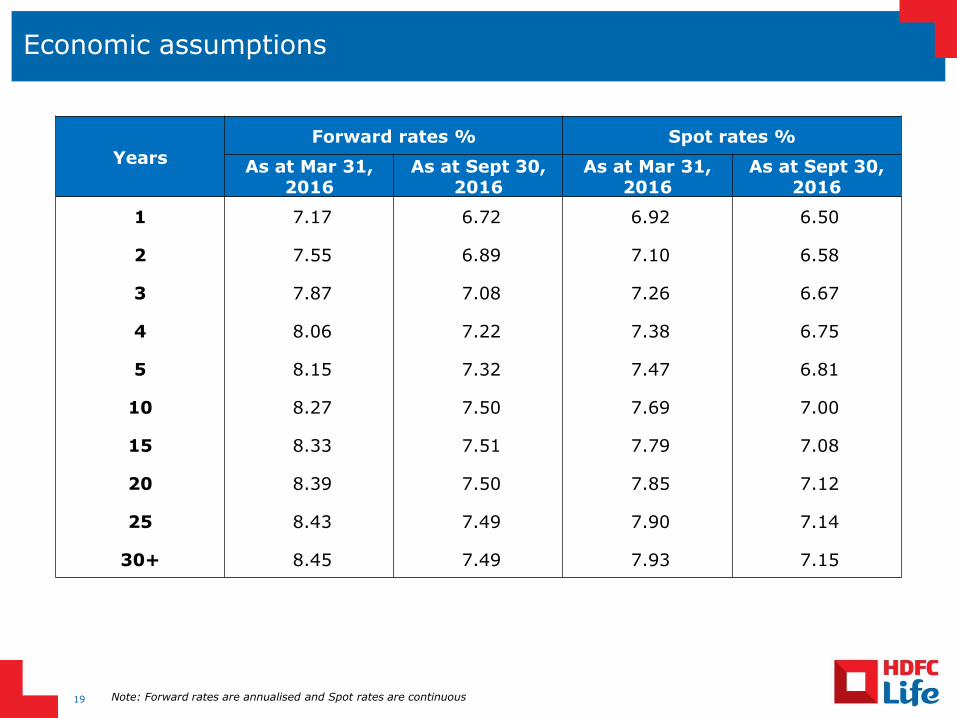
Economic assumptions
Years
Forward rates % Spot rates %
As at Mar 31, 2016
As at Sept 30, 2016
As at Mar 31, 2016
As at Sept 30, 2016
1 7.17 6.72 6.92 6.50
2 7.55 6.89 7.10 6.58
3 7.87 7.08 7.26 6.67
4 8.06 7.22 7.38 6.75
5 8.15 7.32 7.47 6.81
10 8.27 7.50 7.69 7.00
15 8.33 7.51 7.79 7.08
20 8.39 7.50 7.85 7.12
25 8.43 7.49 7.90 7.14
30+ 8.45 7.49 7.93 7.15
19 Note: Forward rates are annualised and Spot rates are continuous
Awards and accolades
20
Indian Insurance Awards for Best innovative
product – Life and Health insurance
DL Shah Award - Platinum Award for Enterprise Mobility Project
Intelligent Enterprise Awards for Mobility
Global Awards for Excellence in Quality Management &
Leadership
Asia BFSI Awards for Best Customer Service Organization
7th Asia's Best Employer Brand Awards was awarded to HDFC Life for 5 different categories
DMA Asia Echo Awards for ‘Memories.HDFCLife.com’ and its
campaign
Best Quality Circle Award for faster claims payout,
promoting GO Green concept and supporting
Digitization
Glossary
APE (Annualized Premium Equivalent) - The sum of annualized first year regular premiums and 10%
weighted single premiums and single premium top-ups
Conservation ratio - Ratio of current year renewal premiums to previous year's renewal premium and
first year premium
First year premiums - Regular premiums received during the year for all modes of payments chosen by
the customer which are still in the first year. For example, for a monthly mode policy sold in March 2016,
the first instalment would fall into first year premiums for 2015-16 and the remaining 11 instalments in
the first year would be first year premiums in 2016-17
New business received premium - The sum of first year premium and single premium.
Operating expense - All expenses of management excluding service tax. It does not include
commission
Operating expense ratio - Ratio of operating expenses (excluding service tax) to total premiums
Renewal premiums - Regular recurring premiums received after the first year
Solvency ratio - Ratio of available solvency margin to required solvency margins
Total premiums - Total received premiums during the year including first year, single and renewal
premiums for individual and group business
Weighted received premium (WRP) - The sum of first year premium and 10% weighted single
premiums and single premium top-ups
13th month persistency - Percentage of contracts measured by premium, still in force, 13 months after
they have been issued, based on reducing balance approach
21
Disclaimer
This presentation is for information purposes only and does not constitute an offer or invitation to sell or the solicitation of an offer or invitation to purchase any securities (“Securities”) of HDFC Standard Life Insurance Company Limited (“HDFC Life” or the “Company”) in India, the United States, Canada, the People’s Republic of China, Japan or any other jurisdiction. This presentation is not for publication or distribution, directly or indirectly, in or into the United States (including its territories and possessions, any state of the United States and the District of Columbia). The securities of the Company may not be offered or sold in the United States absent registration or an exemption from registration under the U.S. Securities Act of 1933, as amended. The Company does not intend to register any securities in the United States. You confirm that you are either: (i) a “qualified institutional buyer” as defined in Rule 144A under the U.S. Securities Act of 1933, as amended, or (ii) outside the United States. By receiving this presentation, you are agreeing to be bound by the foregoing and below restrictions. Any failure to comply with these restrictions may constitute a violation of applicable securities laws. This presentation should not, nor should anything contained in it, form the basis of, or be relied upon in any connection with any contract or commitment whatsoever. The information contained in this presentation is strictly confidential and is intended solely for your reference and shall not be reproduced (in whole or in part), retransmitted, summarized or distributed to any other persons without Company’s prior written permission. The Company may alter, modify or otherwise change in any manner the contents of this presentation, without obligation to notify a any person of such revision or changes. This presentation may contain forward‐looking statements that involve risks and uncertainties. Forward‐looking statements are based on certain assumptions and expectations of future events. Actual future performance, outcomes and results may differ materially from those expressed in forward‐looking statements as a result of a number of risks, uncertainties and assumptions. Although Company believes that such forward‐looking statements are based on reasonable assumptions, it can give no assurance that such expectations will be met. Representative examples of factors that could affect the accuracy of forward-looking statements include (without limitation) the condition of and changes in India’s political and economic status, government policies, applicable laws, the insurance sector in India, and international and domestic events having a bearing on Company’s business, particularly in regard to the progress of changes in the regulation of the life insurance sector in India, and such other factors beyond our control. You are cautioned not to place undue reliance on these forward-looking statements, which are based on current view of Company’s management on future events. The data herein with respect to HDFC Life is based on a number of assumptions, and is subject to a number of known and unknown risks, which may cause HDFC Life’s actual results or performance to differ materially from any projected future results or performance expressed or implied by such statements. This presentation has been prepared by the Company. No representation, warranty, express or implied, is made as to, and no reliance should be placed on, the fairness, accuracy , completeness or correctness of the information and opinions in this presentation. None of Company or any of its directors, officers, employees, agents or advisers, or any of their respective affiliates, advisers or representatives, undertake to update or revise any forward-looking statements, whether as a result of new information, future events or otherwise and none of them shall have any liability (in negligence or otherwise) for any loss howsoever arising from any use of this presentation or its contents or otherwise arising in connection with this presentation. Further, nothing in this presentation should be construed as constituting legal, business, tax or financial advice or a recommendation regarding the securities.
22

This is the sole and exclusive property of HDFC Life
Thank you