
HCUP Methods Series · • Naessens and colleagues (1991), noted above, c onducted a small...
24
HCUP Methods Series
Transcript of HCUP Methods Series · • Naessens and colleagues (1991), noted above, c onducted a small...
HCUP Methods Series
kbr33831

Contact Information:
Healthcare Cost and Utilization Project (HCUP) Agency for Healthcare Research and Quality
540 Gaither Road Rockville, MD 20850
http://www.hcup-us.ahrq.gov
For Technical Assistance with HCUP Products:
Email: [email protected]
or
Phone: 1-866-290-HCUP
Recommended Citation: Coffey R, Milenkovic M, Andrews RM. The Case for the Present-on-Admission (POA) Indicator. 2006. HCUP Methods Series Report # 2006-01 Online. June 26, 2006. U.S. Agency for Healthcare Research and Quality. Available :http://www.hcup-us.ahrq.gov/reports/methods.jsp.

Table of Contents EXECUTIVE SUMMARY.....................................................................................................................................I
BACKGROUND....................................................................................................................................................I RESULTS ...........................................................................................................................................................I CONCLUSION ................................................................................................................................................... III
INTRODUCTION ................................................................................................................................................1 PURPOSE ..........................................................................................................................................................3 METHODS..........................................................................................................................................................3 RESULTS ...........................................................................................................................................................3 CONCLUSION....................................................................................................................................................9 ACKNOWLEDGEMENTS ................................................................................................................................10 REFERENCES .................................................................................................................................................11 APPENDIX A: NUBC PRESENT ON ADMISSION GUIDELINES..................................................................14 APPENDIX B: HUGHES ET AL. (2006) EDIT CHECKS FOR PRESENT-ON-ADMISSION (POA) INDICATORS IN CALIFORNIA........................................................................................................................16 APPENDIX C: ANALYSIS OF CALIFORNIA DISCHARGE DIAGNOSES AND QUALITY OF PRESENT-ON-ADMISSION INDICATOR..........................................................................................................................18

HCUP (06/26/2006) i The Case for the POA Indicator
Executive Summary
Background
The Agency for Healthcare Research and Quality (AHRQ) has assembled evidence on the usefulness and reliability of the present-on-admission (POA) indicator to assist the National Uniform Billing Committee (NUBC) in planning to include this type of element on the latest uniform bill (UB-04). The information also should help state-wide data organizations in justifying collection of POA in states. The Centers for Medicare and Medicaid Services (CMS) is mandated under the Deficit Reduction Act of 2005 to implement a requirement that hospitals report POA-type information for secondary diagnoses on Medicare claims starting October 1, 2007. This will allow Medicare to devise payment rules for at least two DRGs that will not pay higher rates for post-admission infections. CMS has issued a notice of proposed rulemaking to solicit input from the public on how to implement this requirement (CMS, 2006).
This document summarizes rationales and evidence for the value of the POA indicator and recounts experiences of implementation in California and New York—the only two states currently collecting this variable.
Results Rationale: The main arguments for the use of the POA indicator are that it would:
• Add precision to ICD-9-CM coding in administrative data because it would distinguish between pre-existing conditions and complications
• Increase efficiency of hospital quality assurance activities by reducing the number of false positives that hospitals with patient safety programs need to investigate further
• Improve accuracy of safety and quality-of-care measures, including the AHRQ Patient Safety Indicators (PSIs), Iezzoni and colleagues’ Complications Screening Program (CSP), and the new 3M Potentially Preventable Complications (PPCs)
• Increase validity of hospital report cards
• Improve accuracy of results in mortality risk assessment and outcomes research
• Improve design and fairness of pay-for-performance programs.
Evidence: Evidence of the value and validity of the POA indicator was found in 23 U.S. and Canadian studies. While the metrics of evaluation vary among the studies, all the studies indicated substantial benefit from the addition of POA information. For example:
• A recent Canadian study of patients receiving coronary artery bypass graft (CABG) surgery between 1992 and 1996 found that between 13% and 35% of certain normally presumed pre-existing conditions were not pre-existing based on POA information (Ghali et al., 2001).
• A study of California discharge data from 2000 found that the POA indicator significantly improved the ability of two comorbidity algorithms—Dartmouth/Charlson and Elixhauser—to accurately map ICD-9-CM diagnoses to comorbidity categories (Glance et al., 2005).
• Two other California studies of data years 1996-1999 examined two different situations (aspiration pneumonia and volume of lung cancer surgery) and both concluded that POA

HCUP (06/26/2006) ii The Case for the POA Indicator
indicators significantly improve the accuracy of identifying comorbidities and predicting mortality (Stukenborg et al., 2004 and 2005).
• An analysis (in progress) of the AHRQ Patient Safety Indicators (PSIs) using California and New York data for 2002 shows substantial value of POA in improving some of the PSI algorithms (Houchens and Elixhauser, 2006).
• For a new classification system—Potentially Preventable Complications (PPC)—based on All-Patient Refined Diagnosis Related Groups (APR-DRGs), a study of California 1999-2000 data found that 84% of secondary diagnoses that might represent complications actually represent comorbidities when the POA indicator is considered and should be screened out of complications-of-care algorithms (Hughes et al., 2006a).
• The PPC analysis above (Hughes et al., 2006a) also validates California data for 1999-2000 by showing that POA-adjusted complications are associated with higher hospital charges, longer lengths of stay, and increased mortality, as would be expected. Furthermore, those hospital complication rates tend to be stable over time, suggesting inherent, rather than random, quality problems at particular hospitals over time.
• A study of 18 of the condition-specific algorithms of the Complications Screening Program showed the software performed poorly when POA indicators were ignored (Naessens and Huschka, 2004).
Implementation: The California Office of Statewide Health Planning and Development (OSHPD) implemented POA fully in 1996, and because of an early study that showed POA data quality problems (Haas et al., 2000), OSHPD staff has worked diligently to improve coding. As a result, later years of California data show excellent face validity for POA, as indicated by studies mentioned above.
The New York State Department of Health (NYSDOH), through its bureau of Statewide Planning and Research Cooperative System (SPARCS), implemented POA data collection in 1994. NYSDOH staff knows that the POA indicator was coded inaccurately in early years, and that because of that POA indicators were largely ignored by researchers. Recently, however, New York has been focusing efforts on communicating the flag’s value to hospitals and coders, and providing training.
Neither California nor New York experienced serious opposition to the collection of POA by their hospitals. In fact, hospitals in California insisted that the POA be added when they understood its value for California hospital outcomes reports. In addition, a special POA data collection at Mayo Clinic hospitals in Minnesota showed that the time needed to add the information was minimal—2 minutes per record on average (Naessens et al., 1991).
POA indicators were not requested for External Cause of Injury (E-codes) in California and they are not consistently provided in New York. OSHPD staff indicated that this was an oversight in the planning and implementation of POA in California and they recommend that E-codes be included in any national standard for the POA.
California and New York staff shared their experiences on education needed for implementation of POA. The key is communication of value, training, and feedback. Guidelines for coding developed in California are being tailored for use in New York. Training in collaboration with regional health information associations is essential. Broader information campaigns must reach hospital administrators and practicing physicians. Feedback to hospitals on the quality of POA indicators is

HCUP (06/26/2006) iii The Case for the POA Indicator
crucial. Coders need guidelines for coding POA in different situations. Researchers have begun to develop checks for the internal consistency of POA and diagnosis coding.
Conclusion The POA indicator, as planned by the NUBC, is a valuable clinical data element that two U.S. states and Canada have added to their data collection systems, and that researchers have shown to have tremendous value. POA significantly reduces false positives in identifying cases for quality assurance review in hospitals. POA improves risk-adjustment for comparisons that involve such important metrics as in-hospital mortality, patient safety, and pay-for-performance. POA enhances the accuracy of comorbidity and complications classification systems. New York and California experiences in implementing POA make clear that attention must be given to implementation.
HCUP (06/26/2006) 1 The Case for the POA Indicator
Introduction
Since the early 1990s, health care researchers have argued that differentiating between diseases that are present on admission (i.e., comorbidities or pre-existing conditions) and those that first occur during the hospital stay (i.e., complications or in-hospital adverse events) is essential in hospital administrative data. That ability would significantly increase the efficiency of quality assurance activities in hospitals and improve the accuracy of risk adjustment methodologies, case-mix indices, quality-of-care indicators, and hospital comparisons in general. In order to address these needs, researchers have been recommending that a present-on-admission (POA) indicator be added to standard formats for hospital administrative data since the early 1990s (Naessens et al., 1991; Iezzoni et al., 1992; Romano et al., 1994; Hannan et al., 1997; Iezzoni, 1997; Pine et al., 1997; Lawthers et al., 2000; Ghali et al., 2001; Naessens and Huschka, 2004; Naessens et al., 2004; Stukenborg et al., 2004; Stukenborg et al., 2005; Glance et al., 2005 and 2006). They recommended a single-character flag for each diagnosis that a patient receives where 1 denotes the diagnosis was present at admission to the hospital and 2 denotes the diagnosis was not present at admission, in which case it would be a hospital-acquired condition. In the two states that currently collect the indicator, they also designate a third value to denote “uncertain or unknown.”
Considerable official effort also has been expended to promote the POA for more than 10 years. The National Committee on Vital and Health Statistics (NCVHS) first recommended inclusion of a qualifier for other diagnoses in its 1992 recommendations on proposed revision to the Uniform Hospital Discharge Data Set (NCVHS, 1992). In 1996, this recommendation was also included in the Committee’s recommendations on Core Health Data Elements (NCVHS, 1996). In 2003, the Consumer-Purchaser Disclosure Project, a group of employer, consumer, and labor organizations working toward publicly reported health care performance information, proposed adding the POA indicator to the UB-04 (CPDP, 2003). In May 2004, the NCVHS Quality Workgroup revisited the topic in a report on Measuring Health Care Quality: Obstacles and Opportunities (NCVHS, 2004a).
In November 2004, following additional hearings, the NCVHS sent a letter to the Secretary of Health and Human Services recommending that the next version of the Uniform Bill for Hospitals (UB-04) and the ANSI ASC X12N 837 Implementation Guide be revised to facilitate reporting of a diagnosis indicator to flag diagnoses that were present on admission in secondary diagnosis fields for all inpatient claims transactions (NCVHS, 2004b). The letter further recommended that the NUBC and ASC X12N work together to specify the code set, reporting conditions and use cases for the indicator. (In the late 1990s, the ASC X12N had easily found consensus for approval of collection of POA because it aided determination of medical necessity for health plans.) In 2005, the Medicare Payment Advisory Commission recommended collection of the POA in its Report to Congress (MedPAC, 2005).
In April 2006, the 5010 version of the ANSI ASC X12N 837 Implementation Guide was approved to include four categories for POA designation. The 5010 Implementation Guide (which includes POA) must still be set in motion by the Secretary of the U.S. Department of Health and Human Services through the rule-making process before it is established as a HIPAA-approved standard. The NUBC advises the Secretary on such standards.
The POA indicator will also likely be driven by Medicare in the future. The Deficit Reduction Act (DRA) of 2005 requires CMS to implement the collection of POA-like indicators on Medicare claims

HCUP (06/26/2006) 2 The Case for the POA Indicator
beginning in October 1, 2007 (U.S. Congress, 2006),1 so that Medicare can pay for at least two DRGs without incurring higher payments when the patient develops an infection after admission. CMS is currently soliciting public input on the addition of POA-type information on Medicare claims (CMS, 2006). The DRA requires that CMS designate in FY 2009 at least two types of post-admission infectious complications that will no longer affect DRG assignment. This gives CMS the authority to begin to reverse Medicare’s perverse incentives of paying for poor quality care.
In an effort to initiate the accurate and consistent collection of the POA indicator, the National Uniform Billing Committee (NUBC) formed a work group of experts from stakeholder groups to provide recommended guidelines for the use and reporting of POA on the hospital uniform bill (UB). Based on these recommendations the NUBC approved guidelines at its February and May 2006 meetings. The guidelines (described more fully in Appendix A) indicate that:2
• The POA Indicator applies to the diagnosis codes for claims involving inpatient admissions to general acute-care hospitals or other facilities, as required by law or regulation for public health reporting.
• The POA Indicator is based not only on the conditions known at the time of admission, but also include those conditions that were clearly present, but not diagnosed, until after the admission took place.
• Present on admission is defined as present at the time the order for inpatient admission occurs -- conditions that develop during an outpatient encounter, including emergency department, are considered as present on admission.
• The POA Indicator is applied to the principal diagnosis as well as all secondary diagnoses that are reported.
• The five reporting options for all diagnosis reporting are as follows:
Code Definition Y Yes
N No U No information in the record W Clinically undetermined
Unreported/Not Used Exempt from POA reporting
• The POA Indicator should also be reported for all E (External Cause) codes. “E-code” categories for which the POA Indicator is not applicable would not be reported.
• Health plans that receive POA information on the claim should not reject the claim if their claims processing systems have no use for any of the POA information.
• Coding professionals should follow the comprehensive guidelines on POA as published in
1The Deficit Reduction Act of 2005, Section 5001(c) on “Hospital Quality Improvement” states: (iii) As part of the information required to be reported by a hospital with respect to a discharge of an individual in order for payment to be made under this subsection, for discharges occurring on or after October 1, 2007, the information shall include the secondary diagnosis of the individual at admission. (http://frwebgate.access.gpo.gov/cgi-bin/getdoc.cgi?dbname=109_cong_bills&docid=f:s1932enr.txt.pdf). 2See Appendix A for complete list of guidelines and associated rationale (NUBC, 2006). Accessed on the Web site of the National Association of State Data Organizations (NAHDO) April 3, 2006 at: http://www.nahdo.org/project/matrix%20docs/POA_recommendations%20for%20NUBC1105.pdf, and edited by Marjorie Greenberg and Donna Pickett to reflect most recent definitions established in May 2006.

HCUP (06/26/2006) 3 The Case for the POA Indicator
the ICD-9-CM Official Guidelines for Coding and Reporting to further assist coding professionals in accurate and consistent reporting of all POA data. These guidelines will be updated as needed to address identified coding errors or areas of confusion.
Following the February meeting, the NUBC Chair asked the National Committee on Vital and Health Statistics (NCVHS) to support a formal study in either California or New York – the only states that currently require submission of the indicator by their hospitals – to verify its reliability. The Agency for Healthcare Research and Quality (AHRQ) offered to assemble for the NUBC the substantial evidence that already exists on the value of the POA indicator and the arguments for its use.
Purpose
The purpose of this document is to present evidence from studies that already exist, or are underway, on the case for (or against) inclusion and collection of the POA indicator in hospital administrative data of the uniform billing system in the United States. This report also reviews what is known about educational programs needed to implement the indicator in a way that will make the POA data element valid and reliable for improving case-mix, quality-of-care, and other measures, as well as for risk-adjustment for many comparative purposes.
Note that throughout this document, we use the terminology of the NUBC for indicators that discriminate between comorbidities and complications—that is, “Present on Admission (POA).” In California the label for the same concept is “Condition Present at Admission (CPAA).” In New York, the label was originally “Other Diagnosis Emergent Indicator,” and is now known as the “Present on Admission Indicator.” In Canada, the label is “Diagnosis Type Indicator.” Some researchers also refer to the POA as a “date stamp" or the "6th digit" of the diagnosis code. They all represent the same concept.
Methods
This information was gathered from published literature, work in progress, and discussions with a number of experts on POA indicators—most notably those in California and New York, the only states that collect POA indicators in the United States.
The literature review examined the need for POA, the usefulness of POA, and results from POA use. PubMed and Google were searched for articles that either directly studied the impact of the POA indicator on a particular measure, or that discussed the potential value of the POA. Twenty-one articles were found that related to the POA indicator. AHRQ staff and interviewees provided additional leads on completed studies or work in progress. Discussions with experts focused on education and training needed to help hospitals implement POA and experiences with such efforts.
Results
The results are organized into three sections: 1) arguments for the use of POA indicator cited in health policy research literature, 2) evidence showing the impact that POA would have on research and policymaking, and 3) efforts that should be undertaken to enhance POA coding accuracy.
Rationale for POA: Researchers have argued for inclusion of POA indicators on the UB because the policy-relevant information generated from research with POA would be much more accurate. Two sets of researchers have gone so far as to say that hospital administrative data should not be

HCUP (06/26/2006) 4 The Case for the POA Indicator
used for assessing complications of care without POA indicators (Lawthers et al., 2000 and Haas et al., 2000). Specific arguments for adding POA have included the following:
• The clinical context and value of hospital administrative data, overall, would be improved if hospitals made a distinction between pre-existing conditions and in-hospital complications, especially in cases where comorbidities also can be complications (Elixhauser et al., 1998; Ghali et al., 2001). The specificity of ICD-9-CM coding for any use would be enhanced with POA companion indicators for each diagnosis code.
• Hospital quality assurance activities that investigate complaints against hospitals and that promote quality health care would be more efficient with POA indicators. False positives of using ICD-9-CM diagnoses as screens for complications of care would be reduced substantially, allowing quality assurance staff to use billing records to track potential quality-of-care problems more reliably and more efficiently (Naessens et al., 1991).
• The Patient Safety Indicators (PSIs), Inpatient Quality Indicators (IQIs), the Complications Screening Program (CSP), or any quality measures set would be more accurate and would make for more meaningful analyses of patient safety and quality of care (Houchens and Elixhauser, 2006; Lawthers et al., 2000; Naessens et al., 1991; Naessens and Huschka., 2004).
• The validity of results presented on hospital report cards would be improved, because the clinical data underlying them would be more precise and reliable (Ghali et al. 2001; Glance et al., 2005 and 2006).
• A large body of literature argues that mortality risk assessment, risk adjustment, and outcomes research generally would produce significantly more dependable results if POA flags were available (Hannan et al., 1997; Hughes et al., 2006a; Iezzoni et al., 1992; Iezzoni, 1997; Pine et al., 1997; Quan et al., 2004; Romano et al., 1994; Romano and Chan, 2000; Southern et al., 2004; Stukenborg et al., 2004; Stukenborg et al., 2005).
Evidence on the Value of POA: Studies that tested the effects of POA indicators looked at two different dimensions that POA is designed to distinguish—comorbidities and complications. For both uses, all authors concluded that POA significantly enhanced the accuracy of their models.
Comorbidities: • Ghali and colleagues (2001) found that between 13 and 35% of certain conditions that
might be assumed, based on the diagnosis, to be comorbidities present at admission were not. The conditions studied were renal disease, recent myocardial infarction, peptic ulcer disease, congestive heart failure, cerebrovascular disease, hemiplegia, and severe liver disease. These were comorbidities or complications of 57,357 patients receiving coronary artery bypass graft (CABG) procedures performed in Canada between 1992 and 1996.
• Ghali and colleagues (2001) also found that risk adjustments for comparing in-hospital mortality rates following CABG were affected by ignoring the POA indication for two diseases in particular—recent myocardial infarction and cerebrovascular disease. These two diseases were complications enough of the time, that the odds of dying in the 23 hospitals studied following CABG were strongly and statistically affected when their POA indicator was ignored. Ten of the 23 hospitals had higher mortality rankings when POA was taken into account, while 9 had lower mortality rankings, and only 4 remained the same.
• Romano and Chan (2000) describe similar findings for risk-adjustment for 30-day inpatient mortality for acute myocardial infarction admissions using the All-Patient Refined Diagnosis

HCUP (06/26/2006) 5 The Case for the POA Indicator
Related Groups (APR-DRG) Risk of Mortality approach. Using specially abstracted data from medical records in 30 California hospitals, they found only fair agreement in classifying hospitals using all diagnoses compared to only those that were POA. Of the 6 hospitals that were classified as having high risk-adjusted mortality using diagnoses that were POA, only one was so classified using all diagnoses. Of the 7 hospitals classified as having low risk-adjusted mortality using diagnoses that were POA, only 4 were so classified using all diagnoses.
• Glance and others (2005) found that the POA indicator would significantly enhance the ability of two comorbidity algorithms to accurately map ICD-9-CM diagnoses to comorbidity categories. Using year 2000 California discharge data with POA indicators, they showed that the Dartmouth/Charlson Index and the Elixhauser algorithm (the AHRQ Comorbidity Software), which were developed before the POA indicator became available on state discharge data, produced different results when combined with POA information. The Dartmouth/Charlson Index underestimated prevalence of certain conditions in 34 to 70% of the cases when the POA was ignored; the Elixhauser algorithm misclassified complications as pre-existing conditions in 9 to 43% of the cases when the POA was ignored. Improved accuracy for these two comorbidity algorithms is important because they are widely used in health services research and policy analyses.
• Stukenborg et al. (2004) also evaluated the Charlson and Elixhauser algorithms but took a different tack—defining an alternative algorithm based on the POA combined with physician judgment about complications of aspiration pneumonia. Using 1996-1999 California discharge data, they found that combining POA indicators and physician judgments to discriminate between comorbidities and complications in predicting mortality among patients with aspiration pneumonia had better predictive results than either the Deyo/Charlson or Elixhauser algorithms as originally defined without POA (C-statistics of 0.732, 0.610, and 0.657, respectively). The risk-adjustment method based on more direct POA indications of comorbidities (i.e., not counting complications as comorbidities for risk adjustment) produced a lowered predicted mortality for all age groups and nearly all racial groups than the other two methods.
Complications: • An analysis (in progress) of the AHRQ Patient Safety Indicators (PSIs) using California and
New York data for 2002 shows the potential value of POA in improving the PSI algorithms (Houchens and Elixhauser, 2006). Of 9 PSIs evaluated (such as decubitus ulcers, infection due to medical care, post-operative hemorrhage or hematoma), the percent of cases that remained as potential safety events after those present on admission were eliminated varied from 11 to 80% across the PSIs, and the percentages eliminated within each PSI were consistent between the two states.
• A new classification system, Potentially Preventable Complications (PPC) based on All-Patient Refined Diagnosis Related Groups (APR-DRGs), incorporated POA indicators to distinguish pre-existing from acquired conditions (Hughes et al., 2006a). That work found that a large majority (84%) of secondary diagnoses that might represent complications actually represent comorbidities that should be screened out of complications-of-care algorithms such as the PPC.
• Another study of California POA-enhanced data explores the usefulness of the PPC for pay-for-performance (Averill et al., 2006). The authors discussed the potential that hospitals would game the POA indicators and suggested that “counter balances” would exist to discourage POA gaming. For example, over-coding of POA would artificially inflate the
HCUP (06/26/2006) 6 The Case for the POA Indicator
hospital’s record on performing risky surgeries, which could provide legal arguments against the hospital in court cases on poor surgical outcomes. Likewise for medical patients, questions could be raised about the appropriateness and timing of treatments for patients with “apparent” serious comorbidities.
• Naessens and colleagues (1991) modified the abstracting methods at the Mayo Clinic-affiliated hospitals to classify secondary diagnoses into three categories—present-on-admission, acquired, and uncertain—in order to identify pre-existing conditions and thus improve their quality assurance (QA) monitoring. They found that nearly 74% of complications (ICD-9-CM codes 996-999) were coded as present-on-admission for the assignment of Diagnoses Related Groups (DRGs). More importantly, they discovered that the additional coding required to apply the flag to the diagnoses was less than two minutes, on average, per discharge. In other words, clinical information could be acquired at a fraction of the time coders normally spend on abstracting discharge records.
• Naessens and Huschka (2004) analyzed condition-specific algorithms of the Complication Screening Program (CSP), developed by Iezzoni et al. (1994) against POA indicators that had been collected on 84,438 discharge records of three Mayo Clinic hospitals for 1998 and 1999. They assessed the effectiveness of CSP algorithms in identifying complications accurately when POA-type information is unavailable in administrative data systems. Ideally, the CSP would detect 100% of cases that the POA identified as acquired in the hospital and the POA would verify 100% of the cases identified by the CSP. However, in 13 of 18 algorithms with sufficient data, the CSP detected less than 50% of the POA-identified cases. And, in 10 of the 18 algorithms, the POA verified less than 50% of the CSP-identified cases. The authors considered this poor performance to be a strong impetus for including a POA flag in administrative data.
Face Validity of POA: Neither California nor New York has performed systematic validation studies of the accuracy of the POA indicator. A few researchers have done studies that include assessments of face validity or small-scale reabstraction studies to verify the coding of the POA indicator.
• Naessens and colleagues (1991), noted above, conducted a small re-abstraction study that showed coders were able to collect POA indicators reliably.
• The Houchens and Elixhauser study on the PSIs, with California and New York data for 2002, judged face validity of POA indicators by hospital by noting whether the hospital coded every non-missing POA flag the same—i.e., whether the hospital’s coders set POA=yes for all diagnosis in every record, or POA=no for all diagnoses in every record—or whether more than 10% of the POA flags were uncertain or not coded. These hospitals were then eliminated from study along with any records in remaining hospitals that had any diagnosis without a companion POA. In California, 97% of hospitals and 98% of all discharges in the state passed these screens for reasonableness. In New York, 82% of hospitals and 83% of discharges passed these screens. E-codes were not included in this assessment; E-code diagnoses typically did not include POA flags (i.e., 100 and 83% of the time in California and New York, respectively).
• In the Hughes and colleagues’ study (2006a) of Potentially Preventable Complications (PPCs), which was based on California data for 1999-2000, about 80% of California hospitals passed strict edit checks on their coding of POA indicators. The lower proportion of hospitals with good quality data in this study compared to Houchens and Elixhauser can be explained partly by the fact that Hughes used older data (see bullet below on improving

HCUP (06/26/2006) 7 The Case for the POA Indicator
California data quality), but the main reason was most likely the more stringent edit checks used by Hughes et al. (2006b) (see Appendix B).
• The PPC analysis further validates the use of POA in California by examining the POA-enhanced PPCs in relation to other hospital stay characteristics (Hughes et al., 2006a). The analysis shows that POA-specified complications in the PPCs were associated with higher hospital charges, longer lengths of stay, and increased mortality rates as would be expected. Furthermore, with the POA information, hospital complication rates tended to be stable over time, suggesting inherent quality problems that hospitals should be able to explore more accurately, and address via, enhanced clinical knowledge of the POA in administrative databases.
• In two separate studies, Stukenborg et al. (2004, 2005) assessed the validity of the POA indicator by comparing secondary diagnoses that were predominantly reported as POA in the 1996-1999 California discharge data against clinical algorithms developed to identify comorbidities from the ICD-9-CM coding system (the Deyo/Charlson, the Elixhauser method, and other literature that identified iatrogenic conditions related to surgery). Both Stukenborg studies indicated that the POA in California agreed with the two comorbidity algorithms 86-95% of the time. Comorbid diagnoses from other approaches agreed only 11-14% of the time. This suggests 1) that the Deyo/Charlson and Elixhauser methods defined comorbidities more conservatively than other researchers, and 2) that the POA indicator performs consistently with the widely used comorbidity algorithms. This does not imply that those algorithms would not be improved by incorporating POA information, as noted above.
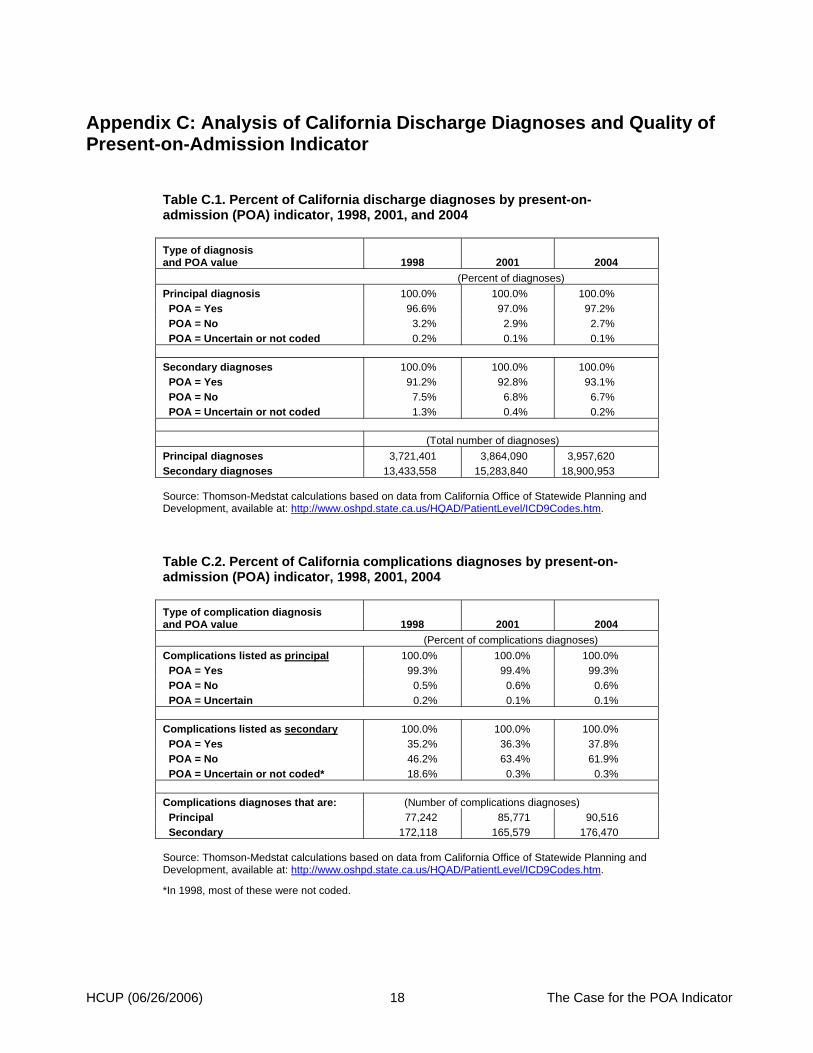
• Analysis of California OSHPD inpatient discharge data3 for all types of diagnoses for three years (1998, 2001, and 2004) shows improving data quality for the POA indicator as California has worked with hospitals on how to code POA (Appendix C, Table 1).
o Principal diagnoses should always be present on admission because the principal diagnosis should be coded as the reason for the admission. Since OSHPD collects POA indicators for principal diagnoses, the values of POA for principal diagnoses can be used to test the face validity of the POA flag. By 2004 for principal diagnoses, only 2.7% of POA indicators were coded as not present-on-admission and only 0.1% were coded as uncertain; both of those rates declined from 1998 to 2004.
o Secondary diagnoses can be either present or not present at admission but the number of uncertain or not coded indicators should decline over time if coding is improving. For secondary diagnoses, the percent uncertain or not coded indicators declined from 1.3 to 0.2 from 1998 to 2004.
• Analysis of California OSHPD inpatient discharges with complications coded (ICD-9-CM codes = 996–999) for 1998–2004 shows improving data quality for the POA indicator for those complications, especially the decline in uncertain or not coded POA flags (Appendix C, Table 2).
o Again, principal diagnoses of complications should nearly always be present on admission, and over the entire period they were at 99%. The uncertain share declined from 0.2 to 0.1% between 1998 and 2004.
o For secondary diagnoses of complications, they can be present at admission or not, but a substantially lower proportion (than principal diagnoses) should be present on
3These are Thomson-Medstat calculations from California OSHPD ICD-9-CM frequency data available on the Web at: http://www.oshpd.cahwnet.gov/HQAD/PatientLevel/ICD9Codes.htm.

HCUP (06/26/2006) 8 The Case for the POA Indicator
admission. Of secondary diagnoses, 35.2 to 37.8% between 1998 and 2004 were flagged as present-on-admission. The uncertain or not coded category declined greatly from 18.6 to 0.3% over the period.
Educational Issues: Both states have taken steps to improve the coding of the indicator over time; California for a longer period than New York. Both state data organizations—OSHPD and SPARCS—indicate that the success of those efforts depends on the involvement of the regional health information management associations.
In California, according to the staff from OSHPD, the hospitals and coders were generally positive about coding the POA flag because of their history with outcomes reporting by hospital in California. OSHPD compiled guidelines on coding POA with the help of health care leaders, including Patrick Romano, Norbert Goldfield, Richard Averill, Harold Luft, Dexter Jung, Pam Voight, Vickie Howe, and Sue Wilner. When the initial quality of the collected data was not high (Haas et al., 2000), OSHPD teamed with the California Health Information Association and over the next several years provided training. California also devoted considerable effort to providing feedback to hospitals that had unreasonable POA indicator distributions.
New York hospitals did not overtly resist the implementation of the POA indicator when it was introduced in 1994. The staff from New York State Department of Health (NYSDOH) had initially provided hospital coders with basic coding instructions, but without the support of the local health information management association, and without the pressure to code the indicator correctly, it was coded poorly in many hospitals from the start. Because it was known to be of poor quality, it was ignored by researchers. Finally, in late 1990s, when researchers communicated to the NYSDOH that the indicator had problems but that it was needed, there was a renewed focus on helping hospitals code more accurately.
Recently, New York began collaborating with the New York Health Information Management Association (NYHIMA) to provide coder training activities. The NYSDOH now participates in that training by focusing on the value of the data element in the context of hospital reports based on the Potentially Preventable Complications (PPCs). In addition, NYSDOH has found that the POA indicator creates a significant difference in the distribution of the All-Patient Refined Diagnosis Group (APR DRGs) severity of illness (SOI) scores, developed by 3M. The percentage of all hospital discharges classified as SOI level 1 – the lowest severity level – increases from 46% to 53% when the POA was used.4
In order to address the issues associated with POA collection in New York, NYSDOH:
• Has contacted problem hospitals and provided informal guidance on the collection of the POA indicator
• Has fostered statewide training sessions through the NYHIMA to emphasize the importance of coding accurately key variables (i.e., diagnoses, procedures, POA, and patient demographics)
• Is providing edit reports to hospitals on a secure Web site, so that they can see where their hospitals do not measure up to NYSDOH edit checks on POA
• Is developing reporting guidelines, in collaboration with 3M, based on California’s approach for the POA indicator.
4Information provided by Harold Kilburn of NYSDOH.

HCUP (06/26/2006) 9 The Case for the POA Indicator
Why do some hospitals in New York have POA quality issues? A significant number of hospitals reported the indicator as a constant—100% of discharge diagnoses were either present on admission, occurred during the stay, or were unknown. NYSDOH found that in some instances this problem was caused by vendor software systems that could not capture the POA properly before the data were transmitted to SPARCS. NYSDOH is working with hospitals and vendors to remedy this situation.
Conclusion
The NUBC recently requested that additional research be undertaken to verify the POA flag’s usefulness and reliability. With NUBC plans to add POA to the UB-04, and potential interest by CMS to use the POA indicator to implement some requirements under the Deficit Reduction Act, a synthesis of the evidence on the value of POA and implementation issues should be helpful to those who will be involved in planning for state or nationwide reporting of POA on the UB.
Through a review of literature and discussions with health care experts, this summary demonstrates that the benefits of the present-on-admission (POA) indicator significantly outweigh any presumed barriers to its collection. In fact, California and New York health agencies have not been pressured by complaints about the burden of coding POA for each diagnosis, but have been encouraged to collect the information because of the increased accuracy it brings to administrative data, especially in recent years as its value has become apparent. A number of studies, domestic and Canadian, have demonstrated that this single flag brings marked improvement to hospital quality assurance activities, as well as broader quality improvement and patient safety efforts, and adds power and precision to risk adjustment and systems that classify comorbidities and complications. While there have been no systematic re-abstracting studies of POA state-wide for California and New York, the literature has repeatedly demonstrated that, with the reasonable efforts California has expended to improve data collection with hospitals, this indicator is a major contribution to many important purposes in health care measurement and quality improvement.
In the U.S., California and New York have been collecting the POA indicator since the mid-1990s. Experiences with the variable have differed between the two states. While the hospitals in California pushed for the POA indicator so that quality-of-care report cards would reflect quality accurately, New York hospitals committed little effort to accurate coding for many years. The level of hospital and coder commitment to accurate collection depended on the support and involvement of regional health information management associations, the amount of education provided by the state, and the availability of clearly defined coding guidelines.

HCUP (06/26/2006) 10 The Case for the POA Indicator
Acknowledgements Agency for Healthcare Research and Quality (AHRQ) gratefully acknowledges the experts who have provided valuable input to this report: Marjorie Greenberg and Donna Pickett from the CDC/NCHS; Ginger Cox, Starla Ledbetter and Joseph Parker from the California Office of Statewide Health Planning and Development (OSHPD); Robert Barnett, Laura Dellehunt and Harold Kilburn from the New York State Department of Health; Robert Davis of the National Association of Health Data Organizations (NAHDO); Dr. Edward Hannan from the State University of New York at Albany School of Public Health; Richard Averill of 3M Health Information Systems, and Dr. John Hughes of the Yale University School of Medicine.

HCUP (06/26/2006) 11 The Case for the POA Indicator
References
Averill RF, Vertrees JC, McCullough EC, Hughes JS, Goldfield NI. Redesigning Medicare Inpatients PPS to Adjust Payment for Post-Admission Complications. Health Care Financing Review. 2006 Spring; 27(3): 83-93.
Centers for Medicare and Medicaid Services (CMS, 2006). 42 Federal Register. 71(79): 24095-24100. April 25, 2006. (Search for at: http://www.gpoaccess.gov/fr/.)
Consumer-Purchaser Disclosure Project (CPDP). “Refined proposal for additional data elements to supplement the UB-02 [sic].” Memorandum from CPDP to NUBC, September 9, 2003.
Elixhauser A, Steiner C, Harris DR, Coffey RM. Comorbidity measures for use with administrative data. Medical Care. 1998 Jan; 36(1):8-27.
Ghali WA, Quan H, Brant R. Risk adjustment using administrative data: impact of a diagnosis-type indicator. Journal of General Internal Medicine. 2001 Aug; 16(8):519-24.
Glance LG, Dick AW, Osler TM, Mukamel DB. Does date stamping ICD-9-CM codes increase the value of clinical information in administrative data? Health Services Research, 2005 Feb; 41(1):231-51.
Glance LG, Dick AW, Osler TM, Mukamel DB. Accuracy of Hospital Report Cards Based on Administrative Data. Health Services Research. 2006 May; 0(0):???-??? doi:10.1111/j.1475-6773.2006.00554.x, May 2006. (Early online abstract accessed May 15, 2006 at: http://www.blackwell-synergy.com/doi/abs/10.1111/j.1475-6773.2006.00554.x?prevSearch=allfield%3A%28Glance%29)
Hannan EL, Racz MJ, Jollis JG, Peterson ED. Using Medicare claims data to assess provider quality for CABG surgery: does it work well enough? Health Services Research. 1997 Feb; 31(6):659-78.
Haas J, Luft H, Romano P, Dean M, Hung Y, Bacchetti P. Report for the California Hospital Outcomes Project, Community-Acquired Pneumonia, 1996: Model Development and Validation. Sacramento, CA: Office of Statewide Health Planning and Development, 2000.
Houchens R, Elixhauser A. How Often Are Potential “Patient Safety Events” Present on Admission? Deliverable under AHRQ HCUP Contract No. 290-00-0004. Santa Barbara, CA: Thomson Medstat, March 19, 2006 (draft).
Hughes JS, Averill RF, Goldfield NI, Gay JC, Muldoon J, McCullough EC, Xiang J. (2006a) Identifying Potentially Preventable Complications Using a Present on Admission Indicator. Health Care Financing Review. 2006 Spring; 27(3): 63-82.
Hughes JS. Personal communication. 3M Health Information Systems, May 15, 2006b.
Iezzoni LI, Foley SM, Daley J, Hughes J, Fisher ES, Heeren T. Comorbidities, complications, and coding bias. Does the number of diagnosis codes matter in predicting in-hospital mortality? Journal of the American Medical Association. 1992 Apr 22-29; 267(16):2197-203.
HCUP (06/26/2006) 12 The Case for the POA Indicator
Iezzoni LI, Daley J, Heeren T, et al. Identifying complications of care using administrative data. Medical Care. 1994; 32:700–715.
Iezzoni L. Assessing quality using administrative data. Annals of Internal Medicine. 1997 Oct 15; 127(8 Pt 2):666-74.
Lawthers AG, McCarthy EP, Davis RB, Peterson LE, Palmer RH, Iezzoni LI. Identification of in-hospital complications from claims data. Is it valid? Medical Care. 2000 Aug; 38(8):785-95.
Medicare Payment Advisory Commission (MedPAC, 2005). Report to Congress of the Medicare Payment Advisory Commission, p. 191. Washington D.C.: MedPAC (Accessed May 15, 2006 at: http://www.medpac.gov/publications/congressional_reports/Mar05_EntireReport.pdf.)
Naessens JM, Brennan MD, Boberg CJ, Amadio PC, Karver PJ, Podratz RO. Acquired conditions: an improvement to hospital discharge abstracts. Quality Assurance in Health Care. 1991; 3(4):257-62.
Naessens JM, Huschka TR. Distinguishing hospital complications of care from pre-existing conditions. International Journal of Quality Health Care. 2004 Apr; 16 Supplement 1:i27-35.
Naessens JM, Scott CG, Huschka TR, Schutt DC. Do complication screening programs detect complications present at admission? Joint Commission Journal on Quality and Patient Safety. 2004 Mar; 30(3):133-42.
National Committee on Vital and Health Statistics (NCVHS, 1992). Proposed Revision to the Uniform Hospital Discharge Data Set. National Committee on Vital and Health Statistics Annual Report, 1992. Washington D.C.: U.S. Department of Health and Human Services.
National Committee on Vital and Health Statistics (NCVHS, 1996). Core Health Data Elements - Report of the National Committee on Vital and Health Statistics. Washington D.C.: U.S. Department of Health and Human Services. (Accessed May 12, 2006 at: http://www.ncvhs.hhs.gov/ncvhsr1.htm)
National Committee on Vital and Health Statistics (NCVHS, 2004a). Measuring Health Care Quality: Obstacles and Opportunities. Washington D.C.: U.S. Department of Health and Human Services. (Accessed May 12, 2006 at: http://www.ncvhs.hhs.gov/040531rp.pdf)
National Committee on Vital and Health Statistics (NCVHS, 2004b). Letter to the Secretary of Health and Human Services. Washington D.C.: U.S. Department of Health and Human Services. (Accessed May 12, 2006 at: http://www.ncvhs.hhs.gov/041105lt.htm)
National Uniform Billing Committee (NUBC) Work Group (2006). Summary of Recommendation on the Present-on-Admission Indicator. Available at the Web site of the National Association of State Data Organizations (NAHDO). (Accessed on April 3, 2006 at: http://www.nahdo.org/project/matrix%20docs/POA_recommendations%20for%20NUBC1105.pdf.)
Pine M, Norusis M, Jones B, Rosenthal GE. Predictions of hospital mortality rates: a comparison of data sources. Annals of Internal Medicine. 1997 Mar 1; 126(5):347-54.
Quan H, Parsons GA, Ghali WA. Assessing accuracy of diagnosis-type indicators for flagging complications in administrative data. Journal of Clinical Epidemiology. 2004 Apr; 57(4):366-72.
HCUP (06/26/2006) 13 The Case for the POA Indicator
Romano PS, Chan BK. Risk-adjusting acute myocardial infarction mortality: Are the APR-DRGs the Right Tool? Health Services Research: 2000 March; 34(7):1469-1489.
Romano PS, Roos LL, Luft HS, Jollis JG, Doliszny K. A comparison of administrative versus clinical data: coronary artery bypass surgery as an example. Journal of Clinical Epidemiology. 1994 Mar; 47(3):249-60.
Southern DA, Quan H, Ghali WA. Comparison of the Elixhauser and Charlson/Deyo Methods of Comorbidity Measurement in Administrative Data. Medical Care. 2004 April; 42(4): 355-360.
Stukenborg GJ, Kilbridge KL, Wagner DP, Harrell FE Jr, Oliver MN, Lyman JA, Einbinder JS, Connors AF Jr. Present-at-admission diagnoses improve mortality risk adjustment and allow more accurate assessment of the relationship between volume of lung cancer operations and mortality risk. Surgery. 2005 Sep; 138(3):498-507.
Stukenborg GJ, Wagner DP, Harrell FE Jr, Oliver MN, Kilbridge KL, Lyman J, Einbinder J, Connors AF Jr. Hospital discharge abstract data on comorbidity improved the prediction of death among patients hospitalized with aspiration pneumonia. Journal of Clinical Epidemiology. 2004 May; 57(5):522-32.
109th U.S. Congress. (January 3, 2006) S.1932, Deficit Reduction Act of 2005 (Enrolled as Agreed to or Passed by Both House and Senate), Sec. 5001 (c). pp. 25-27. Government Printing Office (Accessed May 12, 2006 at: http://frwebgate.access.gpo.gov/cgi-bin/getdoc.cgi?dbname=109_cong_bills&docid=f:s1932enr.txt.pdf).

HCUP (06/26/2006) 14 The Case for the POA Indicator
Appendix A: NUBC Present on Admission Guidelines [The information on the NUBC approved guidelines was provided by Donna Pickett, NCHS. The information on the rationale was obtained from the recommendations provided to the NUBC by the NUBC Present on Admission Work Group (NUBC Work Group, 2006). The Work Group, facilitated by Donna Pickett (NCHS) and Sue Bowman (AHIMA), was made up of experts from stakeholder groups, including medical information management professionals, researchers, and representatives of state and federal governments, health plans and hospitals.]
• The POA Indicator applies to the diagnosis codes for claims involving inpatient admissions to general acute-care hospitals or other facilities, as required by law or regulation for public health reporting. Rationale: Since there are many types of facilities that provide “inpatient” care, such as SNFs, rehabilitation hospitals, psychiatric hospitals, etc., it is necessary to define the facilities that the POA data element applies to.
• The POA Indicator is based not only on the conditions known at the time of admission, but also include those conditions that were clearly present, but not diagnosed, until after the admission took place. Rationale: Conditions that have not yet been diagnosed at the time of admission, but clearly did not develop after admission, should be considered to be present on admission even though they are not identified on the emergency room record, history and physical, or other documents created at the time of admission. For example, if a patient presents with a lump and it is diagnosed as a malignant neoplasm during the hospitalization, the malignant neoplasm should be considered to be present on admission. Also, conditions that are suspected at the time of admission and subsequently confirmed during the hospitalization, should be considered to be present on admission (e.g., patient presents with chest pain and the physician confirms after admission that the patient has a myocardial infarction).
• "Present on admission" is defined as present at the time the order for inpatient admission occurs – conditions that develop during an outpatient encounter, including emergency department, are considered as present on admission. Rationale: The purpose of collecting this data element is to differentiate between conditions present at admission and conditions that developed during an inpatient admission. The work group discussed “present on admission” vs. “present on arrival” extensively and concluded that variable payer requirements regarding the inclusion of outpatient services on the inpatient claim, and issues with the multiple types of outpatient encounter that can lead to inpatient admission (emergency department, observation, outpatient surgery, hospital-owned physician practices or clinics, etc.), would cause a “present on arrival” approach difficult to implement and would result in data inconsistency. “Present on admission” would result in more accurate and comparable data and would be consistent with the current reporting practices in California and New York.
• The POA Indicator is applied to the principal diagnosis as well as all secondary diagnoses that are reported. Rationale: There are a few ICD-9-CM coding conventions that result in a condition not present at the time of admission being reported as the principal diagnosis. Therefore, because of these special situations, it is important to indicate whether or not the principal diagnosis is present on admission.

HCUP (06/26/2006) 15 The Case for the POA Indicator
• The five reporting options for all diagnosis reporting are as follows: Code Definition Y Yes
N No U No information in the record W Clinically undetermined
Unreported/Not Used Exempt from POA reporting
The American Health Information Management Association, American Hospital Association, and National Center for Health Statistics will develop a list of ICD-9-CM codes for which POA is exempt from reporting. The POA field may only be left blank for the codes on this “POA-exempt“ list. This list will be included in the POA guidelines published in the ICD-9-CM Official Guidelines for Coding and Reporting and updated as needed.
Rationale: There are certain codes, particularly in the “Supplementary Classification of Factors Influencing Health Status” chapter (“V” codes), to which the POA concept is not applicable. The use of the POA flag for these categories of codes would result in confusion as to the appropriate POA option, increased coding errors, and unnecessary work. For example, “personal history of malignant neoplasm” cannot develop after admission.
• The POA Indicator should also be reported for all E (External Cause) codes. “E–code” categories for which the POA indicator is not applicable would not be reported. Rationale: Reporting this information for E codes would provide valuable information regarding whether a patient safety event or medical error occurred during inpatient hospitalization.
• Health plans that receive POA information on the claim should not reject the claim if their claims processing systems have no use for any of the POA information. Rationale: Hospitals should be permitted to submit POA data to any payer, regardless of whether that payer is currently using this information.
• Coding professionals should follow the comprehensive guidelines on POA as published in the ICD-9-CM Official Guidelines for Coding and Reporting to further assist coding professionals in accurate and consistent reporting of all POA data. These guidelines will be updated as needed to address identified coding errors or areas of confusion. Rationale: Coders are used to relying on the official coding guidelines as a resource during the coding process, so this would be an appropriate place to include the POA coding guidelines.
HCUP (06/26/2006) 16 The Case for the POA Indicator
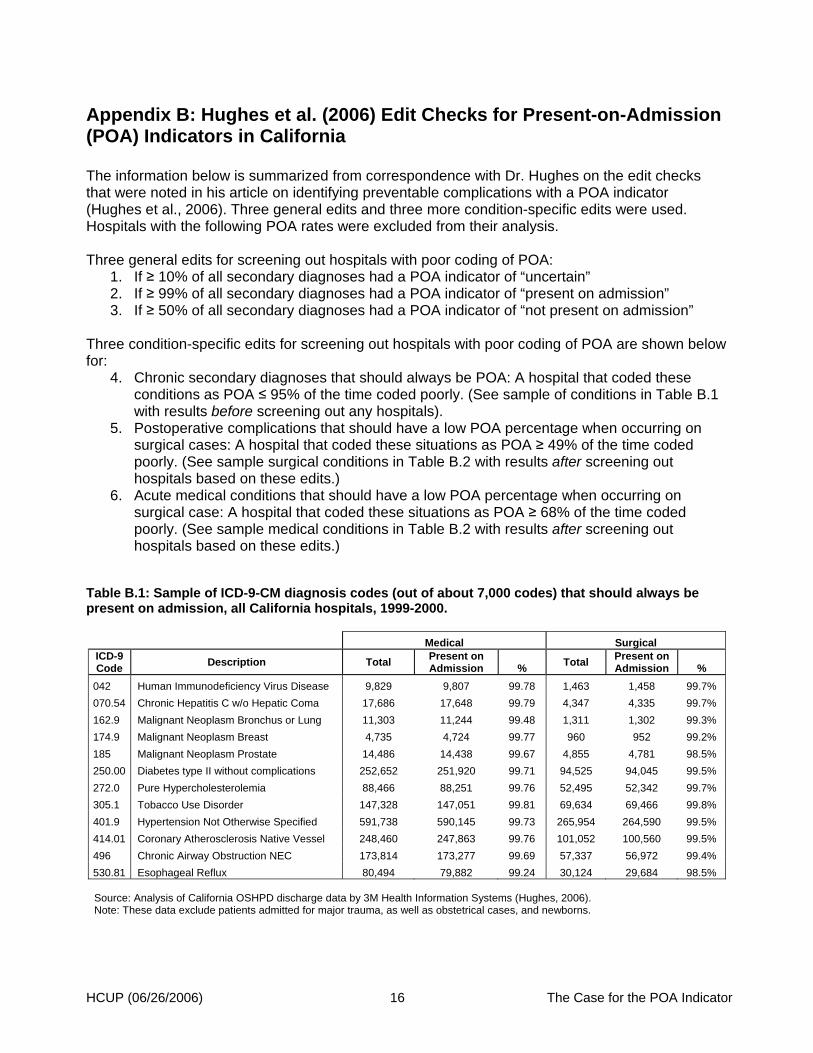
Appendix B: Hughes et al. (2006) Edit Checks for Present-on-Admission (POA) Indicators in California The information below is summarized from correspondence with Dr. Hughes on the edit checks that were noted in his article on identifying preventable complications with a POA indicator (Hughes et al., 2006). Three general edits and three more condition-specific edits were used. Hospitals with the following POA rates were excluded from their analysis. Three general edits for screening out hospitals with poor coding of POA:
1. If ≥ 10% of all secondary diagnoses had a POA indicator of “uncertain” 2. If ≥ 99% of all secondary diagnoses had a POA indicator of “present on admission” 3. If ≥ 50% of all secondary diagnoses had a POA indicator of “not present on admission”
Three condition-specific edits for screening out hospitals with poor coding of POA are shown below for:
4. Chronic secondary diagnoses that should always be POA: A hospital that coded these conditions as POA ≤ 95% of the time coded poorly. (See sample of conditions in Table B.1 with results before screening out any hospitals).
5. Postoperative complications that should have a low POA percentage when occurring on surgical cases: A hospital that coded these situations as POA ≥ 49% of the time coded poorly. (See sample surgical conditions in Table B.2 with results after screening out hospitals based on these edits.)
6. Acute medical conditions that should have a low POA percentage when occurring on surgical case: A hospital that coded these situations as POA ≥ 68% of the time coded poorly. (See sample medical conditions in Table B.2 with results after screening out hospitals based on these edits.)
Table B.1: Sample of ICD-9-CM diagnosis codes (out of about 7,000 codes) that should always be present on admission, all California hospitals, 1999-2000. Medical Surgical
ICD-9 Code Description Total Present on
Admission % Total Present on Admission %
042 Human Immunodeficiency Virus Disease 9,829 9,807 99.78 1,463 1,458 99.7% 070.54 Chronic Hepatitis C w/o Hepatic Coma 17,686 17,648 99.79 4,347 4,335 99.7% 162.9 Malignant Neoplasm Bronchus or Lung 11,303 11,244 99.48 1,311 1,302 99.3% 174.9 Malignant Neoplasm Breast 4,735 4,724 99.77 960 952 99.2% 185 Malignant Neoplasm Prostate 14,486 14,438 99.67 4,855 4,781 98.5% 250.00 Diabetes type II without complications 252,652 251,920 99.71 94,525 94,045 99.5% 272.0 Pure Hypercholesterolemia 88,466 88,251 99.76 52,495 52,342 99.7% 305.1 Tobacco Use Disorder 147,328 147,051 99.81 69,634 69,466 99.8% 401.9 Hypertension Not Otherwise Specified 591,738 590,145 99.73 265,954 264,590 99.5% 414.01 Coronary Atherosclerosis Native Vessel 248,460 247,863 99.76 101,052 100,560 99.5% 496 Chronic Airway Obstruction NEC 173,814 173,277 99.69 57,337 56,972 99.4% 530.81 Esophageal Reflux 80,494 79,882 99.24 30,124 29,684 98.5% Source: Analysis of California OSHPD discharge data by 3M Health Information Systems (Hughes, 2006). Note: These data exclude patients admitted for major trauma, as well as obstetrical cases, and newborns.

HCUP (06/26/2006) 17 The Case for the POA Indicator
Table B.2: Sample of ICD-9-CM diagnosis codes that would not be expected to be present on admission for the majority of surgical admissions*, California hospitals excluding those with poor POA coding according to screening criteria, 1999-2000. Medical Surgical
ICD-9 Code Description Total Present on
Admission % Total Present on Admission %
276.6 Fluid Overload 5,377 4,004 74.4 4,074 1,200 29.5 285.1 Acute Posthemorrhagic Anemia 36,031 30,030 83.3 55,093 17,833 32.4 293.0 Acute Delirium 8,518 6,924 81.3 3,656 1,126 30.8 458.2 Iatrogenic Hypotension 1,488 664 44.6 5,905 959 16.2 507.0 Pneumonitis due to Food or Vomitus 15,641 9,619 61.5 6,965 2,241 32.2 512.1 Iatrogenic Pneumothorax 2,346 659 28.1 4,471 663 14.8 518.5 Post-Surgical Pulmonary Insufficiency 2,021 1,470 72.7 11,110 3,765 33.9 560.1 Paralytic Ileus 12,950 10,410 80.4 21,170 4,243 20.0 997.1 Surgical Complication-Heart 977 295 30.2 18,831 1,689 9.0 997.3 Surgical Complication–Respiratory System 964 493 51.1 16,655 1,769 10.6 997.4 Surgical Complication–Digestive System 1,211 807 66.6 18,388 2,679 14.6 998.11 Hemorrhage Complication of a Procedure 1,706 669 39.2 11,267 1,544 13.7 998.2 Accidental Operative Laceration 595 168 28.2 10,065 1,443 14.3 999.2 Vascular Complication of Medical Care NEC 1,163 281 24.2 790 108 13.7 999.8 Transfusion Reaction NEC 1,103 277 25.1 720 93 12.9 Source: Analysis of California OSHPD discharge data by 3M Health Information Systems (Hughes, 2006). *In total, there were 16 surgical diagnosis codes and 31 medical diagnosis codes which would not be expected to be present on admission; 15 are shown above.
HCUP (06/26/2006) 18 The Case for the POA Indicator
Appendix C: Analysis of California Discharge Diagnoses and Quality of Present-on-Admission Indicator
Table C.1. Percent of California discharge diagnoses by present-on-admission (POA) indicator, 1998, 2001, and 2004 Type of diagnosis and POA value 1998 2001 2004 (Percent of diagnoses) Principal diagnosis 100.0% 100.0% 100.0% POA = Yes 96.6% 97.0% 97.2% POA = No 3.2% 2.9% 2.7% POA = Uncertain or not coded 0.2% 0.1% 0.1% Secondary diagnoses 100.0% 100.0% 100.0% POA = Yes 91.2% 92.8% 93.1% POA = No 7.5% 6.8% 6.7% POA = Uncertain or not coded 1.3% 0.4% 0.2% (Total number of diagnoses) Principal diagnoses 3,721,401 3,864,090 3,957,620 Secondary diagnoses 13,433,558 15,283,840 18,900,953 Source: Thomson-Medstat calculations based on data from California Office of Statewide Planning and Development, available at: http://www.oshpd.state.ca.us/HQAD/PatientLevel/ICD9Codes.htm.
Table C.2. Percent of California complications diagnoses by present-on-admission (POA) indicator, 1998, 2001, 2004 Type of complication diagnosis and POA value 1998 2001 2004 (Percent of complications diagnoses) Complications listed as principal 100.0% 100.0% 100.0% POA = Yes 99.3% 99.4% 99.3% POA = No 0.5% 0.6% 0.6% POA = Uncertain 0.2% 0.1% 0.1% Complications listed as secondary 100.0% 100.0% 100.0% POA = Yes 35.2% 36.3% 37.8% POA = No 46.2% 63.4% 61.9% POA = Uncertain or not coded* 18.6% 0.3% 0.3% Complications diagnoses that are: (Number of complications diagnoses) Principal 77,242 85,771 90,516 Secondary 172,118 165,579 176,470 Source: Thomson-Medstat calculations based on data from California Office of Statewide Planning and Development, available at: http://www.oshpd.state.ca.us/HQAD/PatientLevel/ICD9Codes.htm.
*In 1998, most of these were not coded.