
HCCI Engines Fueled with Ethanol
7
Modeling Operation of HCCI Engines Fueled with Ethanol Faming Sun, Xiang Chen, David S-K Ting and Andrzej Sobiesiak Abstract--A mathematical engine model is developed to study the operation process in Homogeneous Charge Compression Ignition (HCCI) engines. Ethanol is used as an alternative fuel for testing in this model. Two-step reaction mechanisms are implemented to model combustion process for which Arrhenius reaction rates are used and heat transfer process is also included. The simulation results are then compared with experimental data from a modified heavy-duty diesel engine which is used to imitate HCCI operation. Results from this model show good correlation with experiment with respect to combustion phasing, pressure rise and peak pressure. Some control strategies could be potentially developed to stabilize HCCI combustion based on this model. I. INTRODUCTION Homogeneous Charge Compression Ignition (HCCI) is an alternative piston-engine combustion process that could potentially provide efficiencies as high as direct-injection diesel engines while, unlike diesel engines, producing ultra-low oxides of nitrogen (NOx) and particulate matter emissions. HCCI engines operate on the principle of having a diluted and premixed charge that reacts and burns volumetrically when the cylinder is compressed by the piston. In some regards, HCCI incorporates the best features of both spark ignition (SI) and compression ignition (CI). As in an SI engine, the charge is well mixed, which minimizes particulate emissions, and as in a CI engines, the charge is compression ignited so there is no throttling losses, which leads to higher efficiency of HCCI engines. However, unlike either of those conventional engines, the combustion occurs simultaneously throughout the volume rather than in a flame front. This important attribute of HCCI allows combustion to occur at a much lower temperature, dramatically reducing engine-out emission of NOx. Significant improvement is necessary before an HCCI engine could compete with SI and CI engines in the market. Expanding the controlled operation of an HCCI engine over a wide range of speeds and loads is probably the most difficult hurdle facing HCCI engines. HCCI combustion is determined by the charge mixture composition and its temperature history. Changing the power output of an HCCI engine requires change in the fuel injection rate and, hence, the charge mixture. As a result, the temperature history must be adjusted to maintain proper combustion timing. Similarly, changing the engine speed changes the time required for the This research is supported in part by NSERC--the Network of the Centre of Excellences-Automobile in 21 st Century. Faming Sun, David Ting and Andrzej Sobiesiak are with Department of Mechanical, Automotive and Materials Engineering, University of Windsor. Xiang Chen (correspondence author) is with Department of Electrical and Computer Engineering, University of Windsor, Windsor, Ontariao, Canada N9B 3P4. E-Mail: [email protected] auto-ignition chemical reaction to occur. Again, the temperature history of the mixture must be adjusted to maintain proper combustion timing. These control issues become particularly challenging during rapid transients. Recently models with different resolution have been developed as a means to understand fundamental concepts underlying HCCI combustion in real engine geometries. The simplest approach to model HCCI follows a thermo-kinetic, zero-dimensional formulation in a single homogeneous zone. Najt & Foster [1983] first developed this type of model to help analyze experiment work on a premixed-charge, compression-ignited CFR engine. Recent examples of zero-dimensional models use more sophisticated and detailed chemical kinetics [e.g., Smith et al. 1997; Christensen & Johansson, 1998; Wong and Karim 2000; Dec 2002]. In general, these models have been successful in exploring the effects of fuel composition, compression ratio, A/F ratio, EGR rates and other operating parameters, as well as the lean limits of HCCI operation. In most cases, these models do not calculate the dynamic breathing process, but instead rely on idealized charging calculations or estimates made from experiments to define the initial conditions at the start of compression. Fiveland & Assanis [2000], Ogink & Golovitchev [2002] and others have combined the single zone approach with existing zero-dimensional engine models to provide accurate estimates of the effects of the gas exchange process and have used the resulting simulations to evaluate unconventional engine concepts or variable valve timing strategies. However, most of these models involve either detailed chemical kinetics or high-order equations, which make it difficult to synthesize controllers based on them. Shaver et al. [2003] introduced a HCCI engine model with two-step combustion mechanisms to investigate control strategies. However, heat transfer effects are assumed to have no implications on the combustion events within their model. Besides single-zone models, other sophisticated and comprehensive HCCI engine models have also been developed in recent years. For example, several authors have added computational zones corresponding to different physical regions in the chamber [Noda et al. 2001]. In order to obtain some of the zonal resolution afforded by CFD models and yet reduce the computational time required by detailed kinetics calculations, a segregated, sequential multi-zone modeling approach has been developed [Aceves et al. 2000, 2001]. Attempts have been made to use three-dimensional computational fluid dynamic (CFD) models coupled directly with chemical kinetics to study compression ignition under HCCI-like conditions [Miyamoto et al. 1999; Kong & Reitz [2002]. Current computing capability makes it possible to simulate homogeneous chemically-reacting systems (at the cost of computing time), but detailed chemical kinetic calculations coupled with CFD simulations of chemically reacting flows are still unrealistic as the basis for a parametric simulation tool [Zhao et al. 2003]. Therefore, it is unrealistic to 2005 American Control Conference June 8-10, 2005. Portland, OR, USA 0-7803-9098-9/05/$25.00 ©2005 AACC WeB14.3 1003
-
Upload
alilimam2 -
Category
Technology
-
view
861 -
download
3
Transcript of HCCI Engines Fueled with Ethanol
Modeling Operation of HCCI Engines Fueled with Ethanol Faming Sun, Xiang Chen, David S-K Ting and Andrzej Sobiesiak
Abstract--A mathematical engine model is developed to study the operation process in Homogeneous Charge Compression Ignition (HCCI) engines. Ethanol is used as an alternative fuel for testing in this model. Two-step reaction mechanisms are implemented to model combustion process for which Arrhenius reaction rates are used and heat transfer process is also included. The simulation results are then compared with experimental data from a modified heavy-duty diesel engine which is used to imitate HCCI operation. Results from this model show good correlation with experiment with respect to combustion phasing, pressure rise and peak pressure. Some control strategies could be potentially developed to stabilize HCCI combustion based on this model.
I. INTRODUCTION Homogeneous Charge Compression Ignition (HCCI) is an
alternative piston-engine combustion process that could potentially provide efficiencies as high as direct-injection diesel engines while, unlike diesel engines, producing ultra-low oxides of nitrogen (NOx) and particulate matter emissions. HCCI engines operate on the principle of having a diluted and premixed charge that reacts and burns volumetrically when the cylinder is compressed by the piston. In some regards, HCCI incorporates the best features of both spark ignition (SI) and compression ignition (CI). As in an SI engine, the charge is well mixed, which minimizes particulate emissions, and as in a CI engines, the charge is compression ignited so there is no throttling losses, which leads to higher efficiency of HCCI engines. However, unlike either of those conventional engines, the combustion occurs simultaneously throughout the volume rather than in a flame front. This important attribute of HCCI allows combustion to occur at a much lower temperature, dramatically reducing engine-out emission of NOx. Significant improvement is necessary before an HCCI engine could compete with SI and CI engines in the market. Expanding the controlled operation of an HCCI engine over a wide range of speeds and loads is probably the most difficult hurdle facing HCCI engines. HCCI combustion is determined by the charge mixture composition and its temperature history. Changing the power output of an HCCI engine requires change in the fuel injection rate and, hence, the charge mixture. As a result, the temperature history must be adjusted to maintain proper combustion timing. Similarly, changing the engine speed changes the time required for the
This research is supported in part by NSERC--the Network of the Centre of Excellences-Automobile in 21st Century.
Faming Sun, David Ting and Andrzej Sobiesiak are with Department of Mechanical, Automotive and Materials Engineering, University of Windsor. Xiang Chen (correspondence author) is with Department of Electrical and Computer Engineering, University of Windsor, Windsor, Ontariao, Canada N9B 3P4. E-Mail: [email protected]
auto-ignition chemical reaction to occur. Again, the temperature history of the mixture must be adjusted to maintain proper combustion timing. These control issues become particularly challenging during rapid transients.
Recently models with different resolution have been developed as a means to understand fundamental concepts underlying HCCI combustion in real engine geometries. The simplest approach to model HCCI follows a thermo-kinetic, zero-dimensional formulation in a single homogeneous zone. Najt & Foster [1983] first developed this type of model to help analyze experiment work on a premixed-charge, compression-ignited CFR engine. Recent examples of zero-dimensional models use more sophisticated and detailed chemical kinetics [e.g., Smith et al. 1997; Christensen & Johansson, 1998; Wong and Karim 2000; Dec 2002]. In general, these models have been successful in exploring the effects of fuel composition, compression ratio, A/F ratio, EGR rates and other operating parameters, as well as the lean limits of HCCI operation. In most cases, these models do not calculate the dynamic breathing process, but instead rely on idealized charging calculations or estimates made from experiments to define the initial conditions at the start of compression. Fiveland & Assanis [2000], Ogink & Golovitchev [2002] and others have combined the single zone approach with existing zero-dimensional engine models to provide accurate estimates of the effects of the gas exchange process and have used the resulting simulations to evaluate unconventional engine concepts or variable valve timing strategies. However, most of these models involve either detailed chemical kinetics or high-order equations, which make it difficult to synthesize controllers based on them. Shaver etal. [2003] introduced a HCCI engine model with two-step combustion mechanisms to investigate control strategies. However, heat transfer effects are assumed to have no implications on the combustion events within their model. Besides single-zone models, other sophisticated and comprehensive HCCI engine models have also been developed in recent years. For example, several authors have added computational zones corresponding to different physical regions in the chamber [Noda et al. 2001]. In order to obtain some of the zonal resolution afforded by CFD models and yet reduce the computational time required by detailed kinetics calculations, a segregated, sequential multi-zone modeling approach has been developed [Aceves et al. 2000, 2001]. Attempts have been made to use three-dimensional computational fluid dynamic (CFD) models coupled directly with chemical kinetics to study compression ignition under HCCI-like conditions [Miyamoto et al. 1999; Kong & Reitz [2002]. Current computing capability makes it possible to simulate homogeneous chemically-reacting systems (at the cost of computing time), but detailed chemical kinetic calculations coupled with CFD simulations of chemically reacting flows are still unrealistic as the basis for a parametric simulation tool [Zhao et al. 2003]. Therefore, it is unrealistic to
2005 American Control ConferenceJune 8-10, 2005. Portland, OR, USA
0-7803-9098-9/05/$25.00 ©2005 AACC
WeB14.3
1003
synthesize controllers based on these complicated models to stable HCCI combustion for application. In this paper, an ordinary differential equation based model is proposed for HCCI engine operation. Wall heat transfer process is included in the model. Simulation results indicate that this ODE model yields good match with experimental data published by Christensen & Johansson [1998]. Hence, this model is a good candidate to be used for future model based HCCI engine control design.
II. MODEL OF HCCI OPERATION The model described here is a single-zone model which is
based on the first law of thermodynamics and mass balances in an open system. Steady-state compressible flow relations are used to model the valve flow during the induction and exhaust stages of the cycle. Two-step reaction mechanisms with Arrhenius reaction rates are implemented in combustion chemistry modeling. Cylinder wall heat transfer is modeled with Woschni’s heat transfer correction.
Cylinder Volume Change RateThe cylinder volume change rate is
2 2
2 2 2
sin cos( sin )4 sinB a
V al a
,
where V is the cylinder volume, B is the cylinder bore, isthe crank angle, a is half of the stroke length, l is the connecting rod length, and t , where is the rotating speed of the crankshaft and is assumed to be constant.
Mass Flow Rate The mass flow through the valves consists of flow from intake manifold to cylinder and flow from cylinder to exhaust manifold. Flow from exhaust manifold to cylinder is not considered here, but can be included in future work. Equations for these mass flow rates are developed using compressible, steady state, one-dimensional, isentropic flow analysis for a restriction. The actual mass flow rate through a partly or fully opened poppet valve can now be estimated by the equations below [Heywood 1988]. For the intake mass flow:
1 11 1 1
1 11 1
111
1 0 1
0 1 0 0 1
11
2 1 111 0 21
1 0 1
2 21 ,1 1
.
2 2,1 1
D
in
D
in
c A p p p pp p pRT
m
c A p ppRT
whereas for the exhaust mass flow:
2 22 2 2
2 22 2
111
2 0 2 0 0
2 2
21
2 1 112 022
2 2
2 21 ,1 1
.
2 2,1 1
D
D
c A p p p pp p pR T
m
c A p ppR T
where 0p is the intake manifold pressure, assumed to be atmospheric, and p is the cylinder pressure.
inT is the intake manifold temperature, and T is the cylinder temperature. R is
the gas constant. A is the cross-sectional area of the valves. is the ratio of specific heats.
DC is the discharge coefficient. For a fully opened poppet valve the discharge coefficient is usually around 0.7 [Stiesch 2003].
Species Concentration Rate The concentration of species i in the cylinder can be
expressed as ii
NX
V, where
iN is moles of species i in the
cylinder, V is the cylinder volume. The rate of change of
concentration for species i ,iX is ii
i
X VNX
V V,
where iNV
is the rate of change of moles of species i per unit
volume and ,, i gxi rxniNNN
V V V, where ,i rxnN
Vand ,i gxN
V are
the rate of change of moles of species i per unit volume due to the combustion reactions, and due to flow through the inlet and exhaust valves (gas exchange processes). The combustion
reaction rate, ,i rxnN
V, is determined through the use of two-step
combustion chemistry mechanism, which will be outlined later.
Given the mass flow rates described previously, ,i gxN
V can be
found using the species mass fractions: , ,1 ,2i gx i iN N N
V V V,
where ,1 1,1
ii
i
N mY
V MW V, ,2 2
,2i
ii
N mY
V MW V.
Here 1m is the mass flow rate from intake manifold to cylinder, 2m is the mass flow rate from cylinder to exhaust manifold,
,1iY and ,2iY are the mass fractions of species i in
the inlet manifold and exhaust manifold, respectively, iMW is
the molar weight of species i . It is assumed that a homogeneous mixture is present in the intake manifold with air/fuel equivalence ratio known. Further, if using two-step reaction mechanisms, there are five species in the combustion products: 2CO , CO ,
2H O , 2N and 2O . It is assumed no fuel of C2H6O left after combustion.
Wall Heat Transfer Rate Wall heat transfer effect is considered in this model compared with previous works by other researchers [Shaver et al. 2003]. The heat transfer rate between the gas in the cylinder and the cylinder wall can be described by
w wQ hA T T , where h is the heat transfer coefficient,
wA is the wall surface area, wT is the mean wall
temperature, T is the cylinder gas temperature. The heat transfer coefficient is described by Woschni [1967]:
1 0.75 1.62m m m mh CB p v T , where C is a constant, B is the cylinder bore, v is the average cylinder gas velocity. The average cylinder gas velocity v is determined by Woschni as
1004

1 2d r
p mr r
V Tv C S C p p
p V, where
dV is the displaced
volume, pS is the mean piston speed ( 2LN , L is the stroke
and N is the engine rotation speed), p is the instantaneous cylinder pressure,
rp ,rV ,
rT are the working-fluid pressure, volume, and temperature at some reference state (say inlet valve closing or start of combustion),
mp is the motored cylinder pressure at the same crank angle as p,
1C and 2C are constants. The constant C in heat transfer coefficient equation is taken as 127.93 according to Stiesch [2003]. With the exponent, m, equals to 0.8, the wall heat transfer coefficient can be summarized as: 0.2 0.8 0.8 0.55127.93h B p v T , with vdefined above.
Conservations of Mass and Energy The first law of thermodynamics for an open system and the ideal gas law are combined to describe mass and energy balances in the engine cylinder. The change of mass contained within the cylinder is equal to the difference between all entering and exiting mass flows,
inm and exm respectively:
in exin ex
dmm m
dt.
The energy balance for the cylinder becomes
in in ex exin ex
dEQ W m h m h
dt,
where Q is the rate of heat transferred to the system (mixture in the cylinder), W is the rate of mechanical work done by the system,
inh is the enthalpy of species in the intake manifold, and
exh is the enthalpy of species in the exhaust manifold. The heat transfer rate Q is described in the section of wall heat transfer rate. The work rate done by the system,W , can be expressed as W mpv , where v is the specific volume of the gases in the cylinder. A differential equation for the temperature of the gas inside the cylinder can be derived according to conservations of mass and energy.
Chemical Model of Combustion Process Westbrook & Dryer [1981] derived two-step reaction mechanisms with hydrocarbon fuels. The two-step mechanisms for ethanol/air mixture combustion can be expressed as
2 6 2 2 2 22 3.773 2 3 7.546C H O O N CO H O N
2 212
C O O C O .
The rate of 2 6C H O and CO reactions are expressed by three-parameter Arrehenius functional form, as
2 6 2 6 2
0.15 1.610 303.32 10 expC H O C H O Ou
X X XR T
2 2
2
0.5 0.25114.6
18
401.0 10 exp
405 10 exp .
CO CO H O Ou
COu
X X X XR T
XR T
The reaction rates of other species concentration can be derived by inspection of the two-step mechanism equations for ethanol/air combustion. As the combustion speed in HCCI engines is very fast and normally happens in several crank degrees, the cylinder volume can be assumed constant during
combustion period. Then ,,
i rxni rxn
NX
V.
III. RESULTS AND DISCUSSION
Experimental Work by Other Researchers Christensen & Johansson [1998] investigated the effect of mixture quality on HCCI combustion. One of the fuels they used in their experiments is ethanol, with three different fuel flow rates. They measured the cylinder pressure for all operating conditions with and without EGR. The cylinder pressure was recorded for 100 cycles, every 0.2 degrees of crank angle with a pressure transducer mounted on the cylinder head. The HCCI engine used in experiments was converted from a Volvo TD100 series diesel engine. The key engine parameters are summarized in Table 1.
Table 1: Geometric properties of the VOLVO TD100 engine
Displaced Volume 1600 cm3
Bore 120.65 mm
Stroke 140 mm
Connecting Rod 260 mm
Inlet Valve Diameter 50 mm
Exhaust Valve Diameter 46 mm
Swirl Number 2.8
Exhaust Valve Open 39 BBDC
Exhaust Valve Close 10 BTDC
Inlet Valve Open 5 ATDC
Inlet Valve Close 13 ABDC
Table 2 summarizes conditions of engine operation at three different fuel flow rates. The air/fuel ratio with Case C is a calculated result. In the real engine test, the air/fuel ratio at the fuel flow rate of 64.3 mg/cycle is 1.5 with 30% EGR. To get an equivalent air/fuel ratio without EGR at this fuel flow rate, it is assumed that the fuel is completely combusted to CO2 and H2O,Further assumed that 30% of combusted product, CO2, H2O, O2and N2, is taken as more inducted air when calculating the air/fuel ratio. As the air/fuel ratio in the real engine test may be
1005
a little different with the calculated one based on above assumptions, it is suggested that the simulated results from the model with the fuel flow rate of 64.3 mg/cycle should be taken as reference. The HCCI engine model described in this paper adopted all of engine parameters and operation conditions from
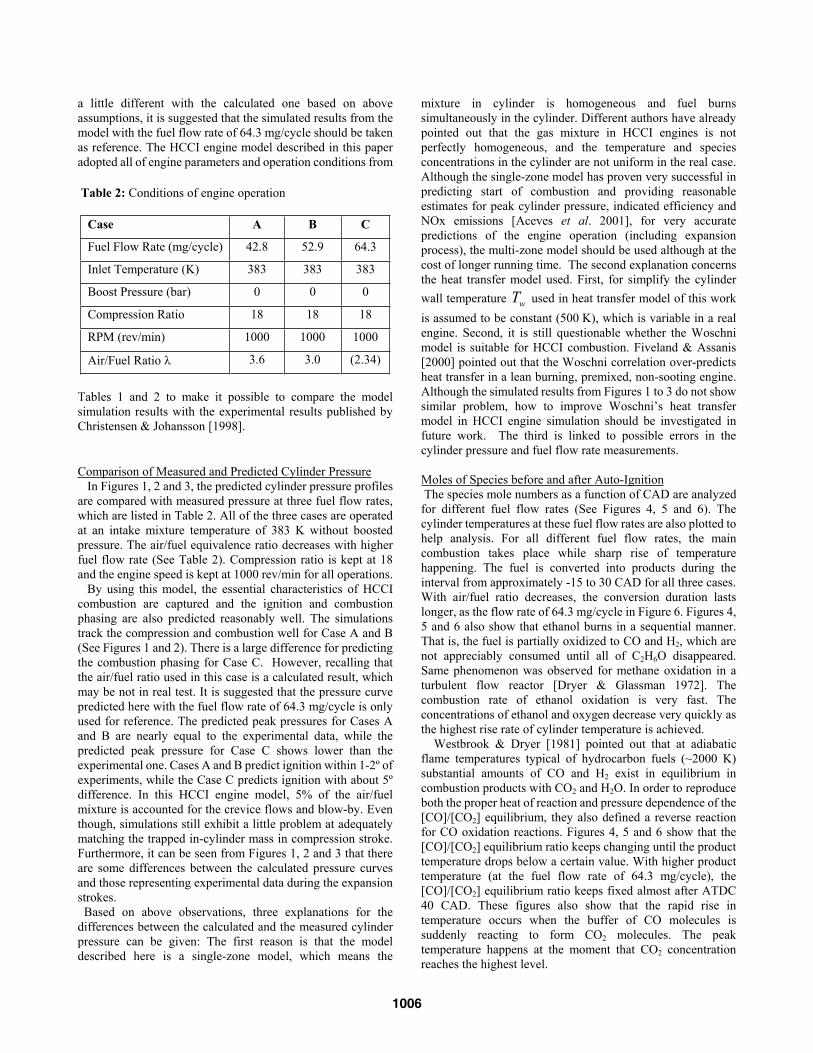
Table 2: Conditions of engine operation
Case A B C
Fuel Flow Rate (mg/cycle) 42.8 52.9 64.3
Inlet Temperature (K) 383 383 383
Boost Pressure (bar) 0 0 0
Compression Ratio 18 18 18
RPM (rev/min) 1000 1000 1000
Air/Fuel Ratio 3.6 3.0 (2.34)
Tables 1 and 2 to make it possible to compare the model simulation results with the experimental results published by Christensen & Johansson [1998].
Comparison of Measured and Predicted Cylinder Pressure In Figures 1, 2 and 3, the predicted cylinder pressure profiles are compared with measured pressure at three fuel flow rates, which are listed in Table 2. All of the three cases are operated at an intake mixture temperature of 383 K without boosted pressure. The air/fuel equivalence ratio decreases with higher fuel flow rate (See Table 2). Compression ratio is kept at 18 and the engine speed is kept at 1000 rev/min for all operations. By using this model, the essential characteristics of HCCI combustion are captured and the ignition and combustion phasing are also predicted reasonably well. The simulations track the compression and combustion well for Case A and B (See Figures 1 and 2). There is a large difference for predicting the combustion phasing for Case C. However, recalling that the air/fuel ratio used in this case is a calculated result, which may be not in real test. It is suggested that the pressure curve predicted here with the fuel flow rate of 64.3 mg/cycle is only used for reference. The predicted peak pressures for Cases A and B are nearly equal to the experimental data, while the predicted peak pressure for Case C shows lower than the experimental one. Cases A and B predict ignition within 1-2º of experiments, while the Case C predicts ignition with about 5º difference. In this HCCI engine model, 5% of the air/fuel mixture is accounted for the crevice flows and blow-by. Even though, simulations still exhibit a little problem at adequately matching the trapped in-cylinder mass in compression stroke. Furthermore, it can be seen from Figures 1, 2 and 3 that there are some differences between the calculated pressure curves and those representing experimental data during the expansion strokes. Based on above observations, three explanations for the
differences between the calculated and the measured cylinder pressure can be given: The first reason is that the model described here is a single-zone model, which means the
mixture in cylinder is homogeneous and fuel burns simultaneously in the cylinder. Different authors have already pointed out that the gas mixture in HCCI engines is not perfectly homogeneous, and the temperature and species concentrations in the cylinder are not uniform in the real case. Although the single-zone model has proven very successful in predicting start of combustion and providing reasonable estimates for peak cylinder pressure, indicated efficiency and NOx emissions [Aceves et al. 2001], for very accurate predictions of the engine operation (including expansion process), the multi-zone model should be used although at the cost of longer running time. The second explanation concerns the heat transfer model used. First, for simplify the cylinder wall temperature wT used in heat transfer model of this work is assumed to be constant (500 K), which is variable in a real engine. Second, it is still questionable whether the Woschni model is suitable for HCCI combustion. Fiveland & Assanis [2000] pointed out that the Woschni correlation over-predicts heat transfer in a lean burning, premixed, non-sooting engine. Although the simulated results from Figures 1 to 3 do not show similar problem, how to improve Woschni’s heat transfer model in HCCI engine simulation should be investigated in future work. The third is linked to possible errors in the cylinder pressure and fuel flow rate measurements.
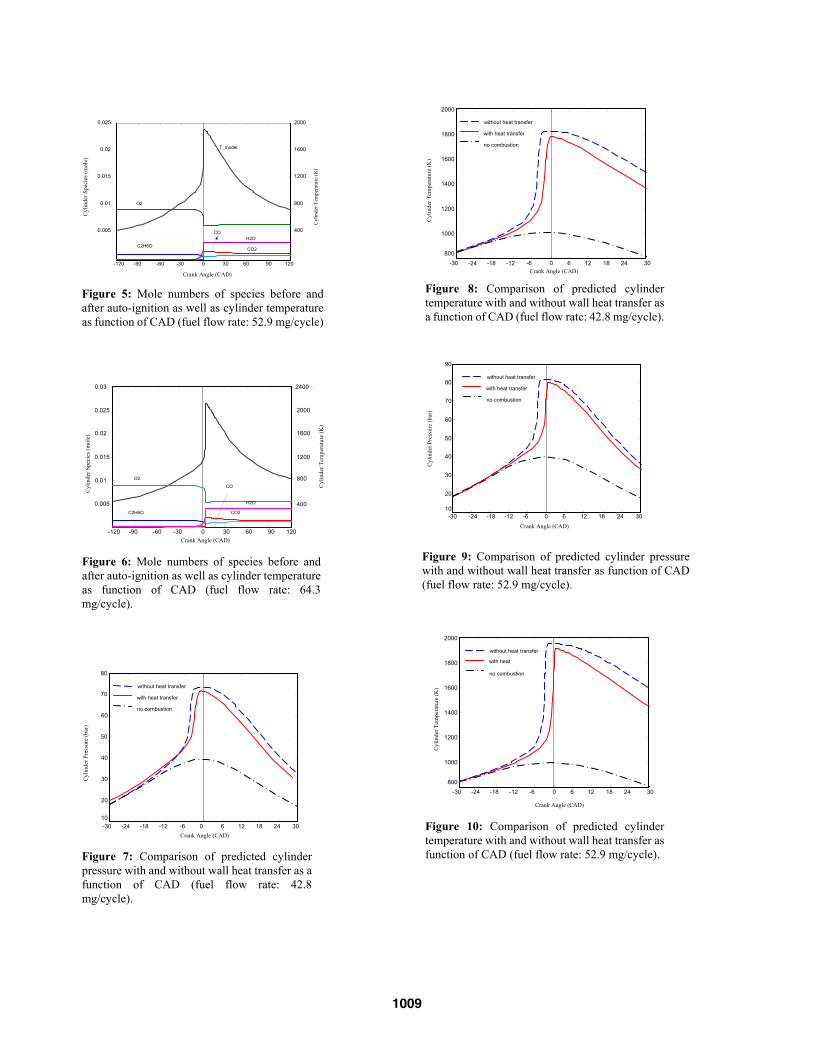
Moles of Species before and after Auto-Ignition The species mole numbers as a function of CAD are analyzed for different fuel flow rates (See Figures 4, 5 and 6). The cylinder temperatures at these fuel flow rates are also plotted to help analysis. For all different fuel flow rates, the main combustion takes place while sharp rise of temperature happening. The fuel is converted into products during the interval from approximately -15 to 30 CAD for all three cases. With air/fuel ratio decreases, the conversion duration lasts longer, as the flow rate of 64.3 mg/cycle in Figure 6. Figures 4, 5 and 6 also show that ethanol burns in a sequential manner. That is, the fuel is partially oxidized to CO and H2, which are not appreciably consumed until all of C2H6O disappeared. Same phenomenon was observed for methane oxidation in a turbulent flow reactor [Dryer & Glassman 1972]. The combustion rate of ethanol oxidation is very fast. The concentrations of ethanol and oxygen decrease very quickly as the highest rise rate of cylinder temperature is achieved. Westbrook & Dryer [1981] pointed out that at adiabatic flame temperatures typical of hydrocarbon fuels (~2000 K) substantial amounts of CO and H2 exist in equilibrium in combustion products with CO2 and H2O. In order to reproduce both the proper heat of reaction and pressure dependence of the [CO]/[CO2] equilibrium, they also defined a reverse reaction for CO oxidation reactions. Figures 4, 5 and 6 show that the [CO]/[CO2] equilibrium ratio keeps changing until the product temperature drops below a certain value. With higher product temperature (at the fuel flow rate of 64.3 mg/cycle), the [CO]/[CO2] equilibrium ratio keeps fixed almost after ATDC 40 CAD. These figures also show that the rapid rise in temperature occurs when the buffer of CO molecules is suddenly reacting to form CO2 molecules. The peak temperature happens at the moment that CO2 concentration reaches the highest level.
1006
Predicted Results with and without Heat Transfer The Woschni’s heat transfer coefficient is implemented in the HCCI engine model. The effects of heat transfer model on predicted pressure and temperature are discussed in this section.The in-cylinder gas temperature and pressure with and without heat transfer for the fuel flow rate of 42.8 mg/cycle are shown in Figures 7 and 8. Without heat transfer model, the ignition timing is advanced 3-4º CAD with higher peak pressure and peak temperature. The predicted cylinder pressure and temperature without heat transfer during expansion stroke are also higher than those with heat transfer. In Figure 7, it can be seen that the pressure without heat transfer is about 2-3 bar higher than that with heat transfer at 30º ATDC. It is known in Figure 1 that even with heat transfer the predicted pressure is still higher than the experimental pressure by about 4-5 bar at 30º ATDC. Similarly in Figure 8, the predicted cylinder temperature without heat transfer is more than 100 K higher than that with heat transfer at 30º ATDC, which leads to higher predicted exhaust temperature. Similar effects can be found in Figures 9 and 10 for the fuel flow rate of 52.9 mg/cycle. The predicted temperature without heat transfer in Figure 10 is almost 200K higher than that with heat transfer.
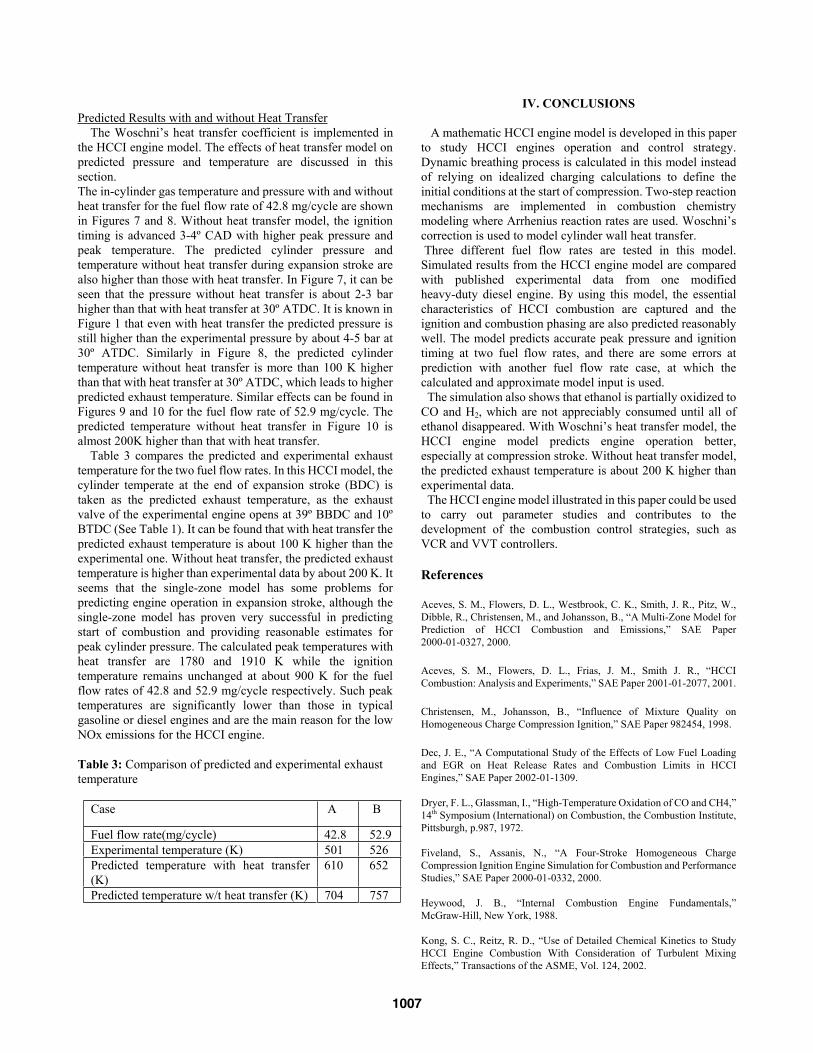
Table 3 compares the predicted and experimental exhaust temperature for the two fuel flow rates. In this HCCI model, the cylinder temperate at the end of expansion stroke (BDC) is taken as the predicted exhaust temperature, as the exhaust valve of the experimental engine opens at 39º BBDC and 10º BTDC (See Table 1). It can be found that with heat transfer the predicted exhaust temperature is about 100 K higher than the experimental one. Without heat transfer, the predicted exhaust temperature is higher than experimental data by about 200 K. It seems that the single-zone model has some problems for predicting engine operation in expansion stroke, although the single-zone model has proven very successful in predicting start of combustion and providing reasonable estimates for peak cylinder pressure. The calculated peak temperatures with heat transfer are 1780 and 1910 K while the ignition temperature remains unchanged at about 900 K for the fuel flow rates of 42.8 and 52.9 mg/cycle respectively. Such peak temperatures are significantly lower than those in typical gasoline or diesel engines and are the main reason for the low NOx emissions for the HCCI engine.
Table 3: Comparison of predicted and experimental exhaust temperature
Case A B
Fuel flow rate(mg/cycle) 42.8 52.9 Experimental temperature (K) 501 526 Predicted temperature with heat transfer (K)
610 652
Predicted temperature w/t heat transfer (K) 704 757
IV. CONCLUSIONS
A mathematic HCCI engine model is developed in this paper to study HCCI engines operation and control strategy. Dynamic breathing process is calculated in this model instead of relying on idealized charging calculations to define the initial conditions at the start of compression. Two-step reaction mechanisms are implemented in combustion chemistry modeling where Arrhenius reaction rates are used. Woschni’s correction is used to model cylinder wall heat transfer. Three different fuel flow rates are tested in this model. Simulated results from the HCCI engine model are compared with published experimental data from one modified heavy-duty diesel engine. By using this model, the essential characteristics of HCCI combustion are captured and the ignition and combustion phasing are also predicted reasonably well. The model predicts accurate peak pressure and ignition timing at two fuel flow rates, and there are some errors at prediction with another fuel flow rate case, at which the calculated and approximate model input is used. The simulation also shows that ethanol is partially oxidized to
CO and H2, which are not appreciably consumed until all of ethanol disappeared. With Woschni’s heat transfer model, the HCCI engine model predicts engine operation better, especially at compression stroke. Without heat transfer model, the predicted exhaust temperature is about 200 K higher than experimental data. The HCCI engine model illustrated in this paper could be used
to carry out parameter studies and contributes to the development of the combustion control strategies, such as VCR and VVT controllers.
References
Aceves, S. M., Flowers, D. L., Westbrook, C. K., Smith, J. R., Pitz, W., Dibble, R., Christensen, M., and Johansson, B., “A Multi-Zone Model for Prediction of HCCI Combustion and Emissions,” SAE Paper 2000-01-0327, 2000.
Aceves, S. M., Flowers, D. L., Frias, J. M., Smith J. R., “HCCI Combustion: Analysis and Experiments,” SAE Paper 2001-01-2077, 2001.
Christensen, M., Johansson, B., “Influence of Mixture Quality on Homogeneous Charge Compression Ignition,” SAE Paper 982454, 1998.
Dec, J. E., “A Computational Study of the Effects of Low Fuel Loading and EGR on Heat Release Rates and Combustion Limits in HCCI Engines,” SAE Paper 2002-01-1309.
Dryer, F. L., Glassman, I., “High-Temperature Oxidation of CO and CH4,” 14th Symposium (International) on Combustion, the Combustion Institute, Pittsburgh, p.987, 1972.
Fiveland, S., Assanis, N., “A Four-Stroke Homogeneous Charge Compression Ignition Engine Simulation for Combustion and Performance Studies,” SAE Paper 2000-01-0332, 2000.
Heywood, J. B., “Internal Combustion Engine Fundamentals,” McGraw-Hill, New York, 1988.
Kong, S. C., Reitz, R. D., “Use of Detailed Chemical Kinetics to Study HCCI Engine Combustion With Consideration of Turbulent Mixing Effects,” Transactions of the ASME, Vol. 124, 2002.
1007

Miyamoto, T., et al., “Numerical Simulation of Fuel Sprays and Combustion in a Premixed Lean Diesel Engine,” Proceedings of the JSAE Convention, No. 976, 1999.
Najt, P. M., Foster, D. E., “Compression-Ignited Homogeneous Charge Combusiton,” SAE Paper 830264, 1983.
Noda, T., Foster, D. E., “A Numerical Study to Control Combustion Duration of Hydrogen-Fueled HCCI by Using Multi-Zone Chemical Kinetics Simulation,” SAE Paper 2001-01-0250, 2001.
Ogink, R., Golovitchev, V., “Gasoline HCCI Modeling: An Engine Cycle Simulation Code with a Multi-Zone Combustion Model,” SAE Paper 2002-01-1745, 2002.
Shaver, G. M., Gerdes, J. C., Jain P., Caton, P. A., Edwards, C. F., “Modeling for Control of HCCI Engines,” Proceedings of the American Control Conference, 2003.
Smith, J. R., Aceves, S. M., Westbrook, C., Pitz, W., “Modeling of Homogeneous Charge Compression Ignition of Methane,” ASME 1997-ICE-68, ICE-Vol. 29-3, 1997.
Stiesch, G., “Modeling Engine Spray and Combustion Processes,” Springer-Verlag, 2003.
Turns, S. R., “An Introduction to Combustion: Concepts and Applications,” 2nd edition, McGraw-Hill, 2000.
Westbrook, C. K., Dryer F. L., “Simplified Reaction Mechanisms for The Oxidation of Hydrocarbon Fuels in Flames,” Combustion Science and Technology, 1981, Vol. 27, pp.31-43, 1981.
Wong, Y. K., Karim, G. A., “A Kinetic Examination of the Effects of Recycled Exhaust Gases on the Auto-Ignition of Homogeneous N-Heptane-Air Mixtures in Engines,” SAE Paper 2000-01-2037.
Woschni, G., “A Universally Applicable Equation for the Instantaneous Heat Transfer Coefficient in the Internal Combustion Engines,” SAE Paper 670931, 1967.
Zhao, F., Asmus, T. W., Assanis, D. N. Dec, J. E., Eng, J. A., Najt, P. M., “Homogeneous Charge Compression Ignition (HCCI) Engines,” SAE International, 2003.
T_model
O2
C2H6O H2O
CO2
CO0.005
0.01
0.015
0.02
0.025
400
800
1200
1600
2000
Cyl
inde
r Tem
pera
ture
(K)
-120 -90 -60 -30 0 30 60 90 120
Crank Angle (CAD)
Cyl
inde
r Spe
cies
(mol
e)
Figure 4: Mole numbers of species before and after auto-ignition as well as cylinder temperature as function of CAD (fuel flow rate: 42.8 mg/cycle).
10
20
30
40
50
60
70
80
Cyl
inde
r Pre
ssur
e (b
ar)
Figure 1: Comparison of predicted cylinder pressure with measured data as function of CAD (fuel flow rate: 42.8 mg/cycle).
-120 -90 -60 -30 0 30 60 90 120
Crank Angle (CAD)
model
experiment
-120 -90 -60 -30 0 30 60 90 120
10
20
30
40
50
60
70
80
90
Cyl
inde
r Pre
ssur
e (b
ar)
Crank Angle (CAD)
model
experiment
Figure 3: Comparison of predicted cylinder pressure with measured data as function of CAD (fuel flow rate: 64.3 mg/cycle).
10
20
30
40
50
60
70
80
90
-120 -90 -60 -30 0 30 60 90 120
Crank Angle (CAD)
Cyl
inde
r Pre
ssur
e (b
ar)
model
experiment
Figure 2: Comparison of predicted cylinder pressure with measured data as function of CAD (fuel flow rate: 52.9 mg/cycle).
1008
10
20
30
40
50
60
70
80
90
Cyl
inde
r Pre
ssur
e (b
ar)
0 6 12 18 24 30-6
without heat transfer
with heat transfer
no combustion
-30 -24 -18 -12Crank Angle (CAD)
-30 -24 -18 -12 -6 0 6 12 18 24 30800
1000
1200
1400
1600
1800
2000
Crank Angle (CAD)
Cyl
inde
r Tem
pera
ture
(K)
without heat transfer
with heat f
no combustion
Figure 10: Comparison of predicted cylinder temperature with and without wall heat transfer as function of CAD (fuel flow rate: 52.9 mg/cycle).
-30 -24 -18 -12 -6 0 6 12 18 24 3010
20
30
40
50
60
70
80
Cyl
inde
r Pre
ssur
e (b
ar)
Crank Angle (CAD)
without heat transfer
with heat transfer
no combustion
Figure 7: Comparison of predicted cylinder pressure with and without wall heat transfer as a function of CAD (fuel flow rate: 42.8 mg/cycle).
T_model
O2
C2H6O H2O
CO2
CO0.005
0.01
0.015
0.02
0.025
-120 -90 -60 -30 0 30 60 90 120
Crank Angle (CAD)
400
800
1200
1600
2000
Cyl
inde
r Tem
pera
ture
(K)
Cyl
inde
r Spe
cies
(mol
e)
Figure 5: Mole numbers of species before and after auto-ignition as well as cylinder temperature as function of CAD (fuel flow rate: 52.9 mg/cycle)
-30 -24 -18 -12 -6 0 6 12 18 24 30800
1000
1200
1400
1600
1800
2000
Cyl
inde
r Tem
pera
ture
(K)
Crank Angle (CAD)
without heat transfer
with heat transfer
no combustion
Figure 8: Comparison of predicted cylinder temperature with and without wall heat transfer as a function of CAD (fuel flow rate: 42.8 mg/cycle).
-120 -90 -60 -30 0 30 60 90 120
0.005
0.01
0.015
0.02
0.025
0.03
Cyl
inde
r Spe
cies
(mol
e)
Crank Angle (CAD)
800
1200
1600
2000
2400
400
Cyl
inde
r Tem
pera
ture
(K)
O2
C2H6O
H2O
CO2
CO
Figure 6: Mole numbers of species before and after auto-ignition as well as cylinder temperature as function of CAD (fuel flow rate: 64.3 mg/cycle).
Figure 9: Comparison of predicted cylinder pressure with and without wall heat transfer as function of CAD (fuel flow rate: 52.9 mg/cycle).
1009


