HBCUs Make America Strong - cdn.uncf.org
92
HBCU HBCU Underwritten by Citi Foundation Terry College of Business Selig Center for Economic Growth HBCUs Make America Strong: THE POSITIVE ECONOMIC IMPACT OF HISTORICALLY BLACK COLLEGES AND UNIVERSITIES #HBCUStrong TECHNICAL REPORT
Transcript of HBCUs Make America Strong - cdn.uncf.org

HBCUHBCU
Underwritten by Citi Foundation
Terry College of BusinessSelig Center for Economic Growth
HBCUs Make America Strong:THE POSITIVE ECONOMIC IMPACT OF HISTORICALLY
BLACK COLLEGES AND UNIVERSITIES
#HBCUStrong
T E C H N I C A L R E P O R T

AcknowledgmentsThe report documents the economic impact of HBCUs on their regional economies and the lifetime earnings of the class of 2014
A Study Commissioned by The United Negro College Fund
1805 7th Street N.W.Washington, DC 20001T: 202.810.0246www.uncf.org
© 2017 UNCF
Dr. Jeffrey M. Humphreys, DirectorSelig Center for Economic GrowthTerry College of BusinessThe University of Georgiawww.selig.uga.edu
About the AuthorJeffrey M. Humphreys, Ph.D., is the Director of the Selig Center for Economic Growth at the University of Georgia’s Terry College of Business. Since 2003, Dr. Humphreys has served as a member of the Governor’s Council of Economic Advisors. Dr. Humphreys has published over 250 applied and academic studies regarding economic impact, economic forecasting, multicultural marketing, transportation, and economic development. In Georgia, Dr. Humphreys is known for his economic forecasts, but nationally he is best known for his detailed estimates of the spending power of African Americans, Latinos and Asian-Americans.
Created to convey economic expertise to Georgia businesses and entrepreneurs, the Simon S. Selig, Jr. Center for Economic Growth is an endowed economic forecasting and market research center primarily responsible for conducting research on economic, demographic and social issues related to Georgia’s current and future growth. Through its range of projects, the center’s efforts help guide business decisions and public policy directions.
Suggested citation: Humphreys, J. (2017). HBCUs Make America Strong: The Positive Economic Impact of Historically Black Colleges and Universities. Washington, DC: UNCF Frederick D. Patterson Research Institute.

T E C H N I C A L R E P O R T
3#HBCUStrong UNCF.org/HBCUsMakeAmericaStrong
TABLE OF CONTENTS
List of Figures................................................................................................................ 4List of Tables ................................................................................................................. 5Executive Summary ....................................................................................................... 6
Introduction: The History and Educational Contributions of HBCUs ............................. 8
Part 1: The Economic Impact of HBCUs on their Regional Economies ......................... 9 Total Initial Spending ...................................................................................... 10 Total Output Impact ........................................................................................ 10 Total Value-Added Impact ............................................................................... 11 Labor Income Impact ...................................................................................... 12 Employment Impact ........................................................................................ 13 Comparisons to Previous Estimates ................................................................ 14 Summary ........................................................................................................ 14 Methodology: Estimating the Economic Impacts ............................................. 15 Analytic Approach ........................................................................................... 16 Identifying the Nation’s HBCUs ........................................................................ 18 Initial Spending by the Institutions ................................................................. 18 Students’ Personal Expenditures ..................................................................... 18
Part 2: The Lifetime Earnings of the Class of 2014 .................................................... 19 Results ........................................................................................................... 20 Methodology: Estimating Work-Life Earnings .................................................. 20
Appendix A: Figures ..................................................................................................... 23Appendix B: Tables ...................................................................................................... 31Appendix C: HBCU Regional Economies ...................................................................... 84References ................................................................................................................... 87

4 A STUDY COMMISSIONED BY UNCF
HBCUHBCU
HBCUs MAKE AMERICA STRONG: THE POSITIVE ECONOMIC IMPACT OF HISTORICALLY BLACK COLLEGES AND UNIVERSITIES
LIST OF FIGURES
Appendix A
Figure 1. Schematic Representation of Impact Relationships ....................................... 23
Figure 2. How Multipliers Capture the Impact of Respending Initial Impacts ................ 24
Figure 3. Initial Spending Distribution: All HBCUs ....................................................... 25
Figure 4. Initial Spending and Related Impacts: All HBCUs ......................................... 25
Figure 5. Initial Spending Distribution: Public HBCUs ................................................. 26
Figure 6. Initial Spending and Related Impacts: Public HBCUs ................................... 26
Figure 7. Initial Spending Distribution: Private HBCUs ................................................ 27
Figure 8. Initial Spending and Related Impacts: Private HBCUs .................................... 27
Figure 9. Employment Impact of HBCU, by Institutional Control ................................... 28
Figure 10. Total Work-Life Earnings per Award ............................................................. 29
Figure 11. Percent Distribution of Total Awards, 2014 .................................................. 30

5#HBCUStrong UNCF.org/HBCUsMakeAmericaStrong
UNCF PUBLIC POLICY PRIORITIES FOR THE 114TH CONGRESSHBCUs MAKE AMERICA STRONG: THE POSITIVE ECONOMIC IMPACT OF HISTORICALLY BLACK COLLEGES AND UNIVERSITIES T E C H N I C A L R E P O R T
LIST OF TABLES
Appendix B
Table 1. Combined Economic Impact of the Nation’s HBCUs on their Regional Economies in 2014 ..........31
Table 2. Economic Impact of Individual Public and Private HBCUs on their Regional Economies in 2014 ....................................................................................................................32
Table 3. Combined Economic Impact of the Nation’s HBCUs on their Regional Economies in 2014 including the Output Multiplier ...................................................................................................44
Table 4. Economic Impact of Individual HBCUs on their Regional Economies in 2014 including the Output Multiplier ................................................................................................................45
Table 5. On-Campus and Off-Campus Jobs that Exist Due to HBCU-Related Spending, 2014 ..................57
Table 6. Synthetic Work-Life Earnings by Educational Attainment, 2014 ..................................................61
Table 7. Synthetic Estimates of Work-Life Earnings of 2014 HBCU Graduates (2014 dollars) ...................62

EXECUTIVE SUMMARY
Historically black colleges and universities (HBCUs) make substantial contributions to the economic development of the nation and to the economic success of their graduates. This study quantifies how much HBCUs are interwoven into the business fabric of the regional economy of each institution and how much graduates benefit in terms of increased earnings over a working lifetime.
The Higher Education Act of 1965, as amended, defines an HBCU as “… any historically black* college or university that was established prior to 1964, whose principal mission was, and is, the education of black Americans.” According to the President’s Board of Advisors on Historically Black Colleges and Universities (2005), many HBCUs were formed to eliminate the adverse residual effects of slavery, plus a century of legally sanctioned discrimination against American citizens of African descent. In 2014, there were 101 accredited HBCUs operating in the 50 states, the District of Columbia, and the U.S. Virgin Islands. (Only 100 HBCUs are covered by this report due to data limitations.) Most are located in the Southeast and are near areas with low levels of prosperity and well-being, where the generation of economic activity is particularly important.
Major Findings
HBCUs are pillars of their host communities, generating economic impacts year after year. In 2014, nationwide, the economic impact of HBCUs on their regional economies included:
• Total initial spending by the nation’s 100 HBCUs was $10.3 billion. Initial spending is the combination of three types of spending – spending by the institution for personnel services (wages, salaries, and benefits), spending by the institution for operating expenses, and spending by students.
• The total economic impact on output (sales) is $14.8 billion. Total output impacts are the most inclusive, largest measures of economic impact; are the most frequently cited measure of economic impact; and are typically emphasized in press releases and other communications. Conceptualized as the equivalent of business revenue, sales, or gross receipts, total output is the value of production by all industries, including intermediate inputs.
• Public HBCUs account for $9.6 billion of the output impact, or 65 percent of the total amount. Private, non-profit, HBCUs account for $5.2 billion of the output impact, or 35 percent of the total amount.
• Dividing the total output impact ($14.8 billion) by initial spending ($10.3 billion) yields a multiplier of 1.44. In other words, every dollar in initial spending generates an additional 44 cents for the regional economy. The multiplier captures the regional economic repercussions of the flows of respending that take place throughout the region until initial spending has completely leaked to other regions. In short, it measures the response of the regional economy to a change in spending.
• The economic impact of an HBCU is most easily understood in terms of its effects on employment. Collectively, the employment impact of the nation’s HBCUs on their regional economies was 134,090 jobs. Approximately 43 percent (57,868) were on-campus jobs at the HBCUs, and 57 percent (76,222)
*”African American” and “black” are used interchangeably throughout this report.
6 A STUDY COMMISSIONED BY UNCF
HBCUs MAKE AMERICA STRONG: THE POSITIVE ECONOMIC IMPACT OF HISTORICALLY BLACK COLLEGES AND UNIVERSITIES
HBCUHBCU

were off-campus jobs. For each job created on campus, there were 1.3 off-campus jobs that existed because of spending related to the HBCU. To provide perspective, the rolled-up employment impact of the nation’s HBCUs exceeded the number of jobs at Oracle (132,000), Convergys (130,000), and Honeywell International (129,000), the nation’s 48th, 49th, and 50th largest private employers, respectively.
• In terms of value-added (gross regional product), HBCUs generated $10.1 billion. Gross regional product, like output, is a measure of the value of production of all industries, but does not include the value of intermediate inputs. Gross regional product equals output less intermediate purchases.
• The economic impact of the nation’s HBCUs expressed in terms of labor income was $7.3 billion. Labor income includes all forms of employment income, such as wages, salaries, benefits, and proprietors’ income.
• The $3.9 billion that HBCUs spent on wages, salaries, and benefits generated $7.9 billion in output, $6.3 billion in regional product, $5.2 billion in labor income, and 88,315 jobs. The $2.7 billion that HBCUs spent on operations generated $2.6 billion in output, $1.4 billion in regional product, $813 million in labor income, and 18,209 jobs. The $3.7 billion in spending by HBCU students generated $4.3 billion in output, $2.4 billion in regional product, $1.3 billion in labor income, and 27,566 jobs.
• The economic success of the graduates of HBCUs can be measured in terms of higher earnings over a working lifetime. The 50,037 HBCU graduates in the Class of 2014 can expect work-life earnings of $130 billion; that is 56 percent ($46 billion) more than they could expect to earn without their 2014 certificates or degrees. That amounts to an additional $926,666 in work-life earnings per graduate. On average, a certificate is worth $204,464 more than a high school diploma, an associate’s degree is worth $463,112 more than a high school diploma, and a bachelor’s degree is worth $1,101,200 more than a high school diploma. A master’s degree is worth $431,679 more than a bachelor’s degree, a doctoral degree is worth $724,005 more than a master’s degree, and a professional degree is worth $1,819,966 more than a bachelor’s degree.
These recurring annual benefits permeate the private and public sectors of the communities that host HBCUs. These economic impacts demonstrate that continued emphasis on HBCUs as pillars of the economy translates into jobs, higher incomes, and greater production of goods and services. The analysis also shows that the economic worth of an HBCU education over the course of a graduate’s working lifetime is considerable.
Methodology
The short-term economic impact of an HBCU is defined as the change in overall economic activity that is associated with HBCU-related spending. For each HBCU, economic impacts were estimated, in 2014 dollars, for the three most important categories of college- and university-related expenditures: (1) spending by the institutions for wages, salaries and fringe benefits, (2) spending by the institutions for operating expenses, and (3) spending by students who attend the institutions. Most of the data used to estimate HBCU-related spending was obtained from the National Center for Education Statistics (NCES) Integrated Postsecondary Education Data System (IPEDS). Other data sources were the College Board’s
UNCF PUBLIC POLICY PRIORITIES FOR THE 114TH CONGRESS
7#HBCUStrong UNCF.org/HBCUsMakeAmericaStrong
HBCUs MAKE AMERICA STRONG: THE POSITIVE ECONOMIC IMPACT OF HISTORICALLY BLACK COLLEGES AND UNIVERSITIES T E C H N I C A L R E P O R T

Annual Survey of Colleges, various annual Consumer Expenditure Surveys conducted by the U.S. Bureau of Labor Statistics (BLS), and a special BLS study of expenditures of college-age students. The economic impact estimates are based on regional input-output models of each HBCU’s regional economy. The Impact Analysis for Planning (IMPLAN)-Online input-output modeling system was applied to the HBCU-related spending estimates to calculate four indicators of impact: output (sales), value-added (gross regional product), labor income (wages, salaries, benefits, and proprietors’ income), and employment.
The synthetic work-life estimates for each HBCU are derived from synthetic estimates of work-life earnings by educational attainment obtained from the Census Bureau’s analysis of data from the American Community Survey. These earnings are “expected average amounts” based on cross-sectional earnings data for all persons aged 25-64 who maintain full-time, year-round employment for the entire time. U.S.-level data was used rather than data specific to each HBCU’s regional economy, and the synthetic estimates are based on median earnings data. The resulting totals represent what individuals with the same education level could expect to earn, on average, in 2014 dollars, during a hypothetical 40-year working life of full-time, year-round employment. The estimates therefore are illustrative and do not predict actual future earnings, especially for those who do not anticipate full-time, year-round employment.
INTRODUCTION: THE HISTORY AND EDUCATIONAL CONTRIBUTIONS OF HBCUs
The Higher Education Act of 1965, as amended, defines an HBCU as “… any historically black college or university that was established prior to 1964, whose principal mission was, and is, the education of black Americans.” According to the President’s Board of Advisors on Historically Black Colleges and Universities (2005), many HBCUs were formed to eliminate the adverse residual effects of slavery, plus a century of legally sanctioned discrimination against American citizens of African descent.
Only a few colleges dedicated to educating African American students were in existence before the Civil War. After the war, through the efforts of missionary societies, the Freedmen’s Bureau and African American churches, these institutions began to proliferate.
It would take decades, and new federal law—most notably, the Morrill Land-Grant Act of 1890—before states were required to provide African Americans, as well as whites, with access to higher education. Instead of integrating white-only institutions, many southern states responded by creating separate colleges and universities for African American students.
Today, there are 101 accredited HBCUs, public and private, concentrated in 19 states, the District of Columbia and the U.S. Virgin Islands. They enroll almost 300,000 students, approximately 80 percent of whom are African American, and 70 percent are from low-income families.
The value of HBCUs is not confined to economic impacts; consider, too, their disproportionate success at helping African American college students earn bachelor’s degrees and more. In 2014, for example, while HBCUs accounted for only 3 percent of public and not-for-profit private institutions receiving federal
8 A STUDY COMMISSIONED BY UNCF
HBCUs MAKE AMERICA STRONG: THE POSITIVE ECONOMIC IMPACT OF HISTORICALLY BLACK COLLEGES AND UNIVERSITIES
HBCUHBCU

student aid, they enrolled 10 percent of African American college students nationwide. And those 10 percent, in turn, accounted for 17 percent of the bachelor’s degrees earned by African Americans—and 24 percent of the degrees earned by African Americans in “STEM” fields: science, technology, engineering and math. HBCUs also provide a solid foundation for even higher academic achievement. According to the National Science Foundation, the top eight institutions where African American Ph.D.s in science and engineering earned their bachelor’s degrees from 2002 to 2011 were all HBCUs.
HBCUs achieve these positive outcomes with fewer resources. The cost of attending an HBCU in 2014 was 27 percent less, on average, than for a non-HBCU. Even more remarkable is that these outcomes are achieved while working with a high proportion of low-income students who often require more support to navigate the college experience.
A 2015 Gallup poll sponsored by USA Funds shows HBCUs provide black graduates with a better college experience than they would get at non-HBCUs. The Gallup-USA Funds study concludes that, “Black HBCU graduates are more likely to be thriving in purpose and financial well-being than black graduates who did not receive their degrees from HBCUs.” In essence, black HBCU graduates were more prepared for life and more likely to be engaged at work than black graduates of non-HBCUs. HBCU graduates flourish relative to black graduates of non-HBCUs.
PART 1: THE ECONOMIC IMPACT OF HBCUs ON THEIR REGIONAL ECONOMIES
How much does a region benefit economically from hosting an HBCU? Traditionally, the benefits are discussed in broad, qualitative terms that often fail to satisfy those who demand tangible evidence of the economic links between the academic community and the community as a whole. By contrast, this report quantifies the economic benefits that the nation’s HBCUs convey to their regional locations.
The benefits are estimated for the three most important categories of HBCU-related expenditures: (1) spending by the institutions for salaries, wages, and fringe benefits, (2) other institutional spending, such as operating expenses; and (3) spending by the students. The economic impact estimates are based on input-output models of each institution’s regional economy, certain necessary assumptions, and available data on annual spending in the specified categories. Moreover, the emphasis is on funds received by residents in the region that hosts each HBCU. The study reports expenditures and impacts for 2014 in inflation-adjusted dollars.
Results
The economic benefits that the nation’s HBCUs conveyed to their host communities in 2014 are substantial. The IMPLAN model calculated four indicators of impact—total output, total value-added, total labor income, and total employment—for each category of initial spending. In addition to providing estimates for the total impact of all HBCUs, the results are presented by institution control (public versus private), as well as for individual HBCUs.
UNCF PUBLIC POLICY PRIORITIES FOR THE 114TH CONGRESS
9#HBCUStrong UNCF.org/HBCUsMakeAmericaStrong
HBCUs MAKE AMERICA STRONG: THE POSITIVE ECONOMIC IMPACT OF HISTORICALLY BLACK COLLEGES AND UNIVERSITIES T E C H N I C A L R E P O R T

Total Initial Spending
For each institution, total initial spending accruing to the institution’s regional economy is the combination of three types of spending: spending by the institution for personnel services (wages, salaries, and benefits), spending by the institution for operating expenses, and spending by that institution’s students. Estimates of initial spending for 2014 are reported in Tables 1, 2, 3, and 4.
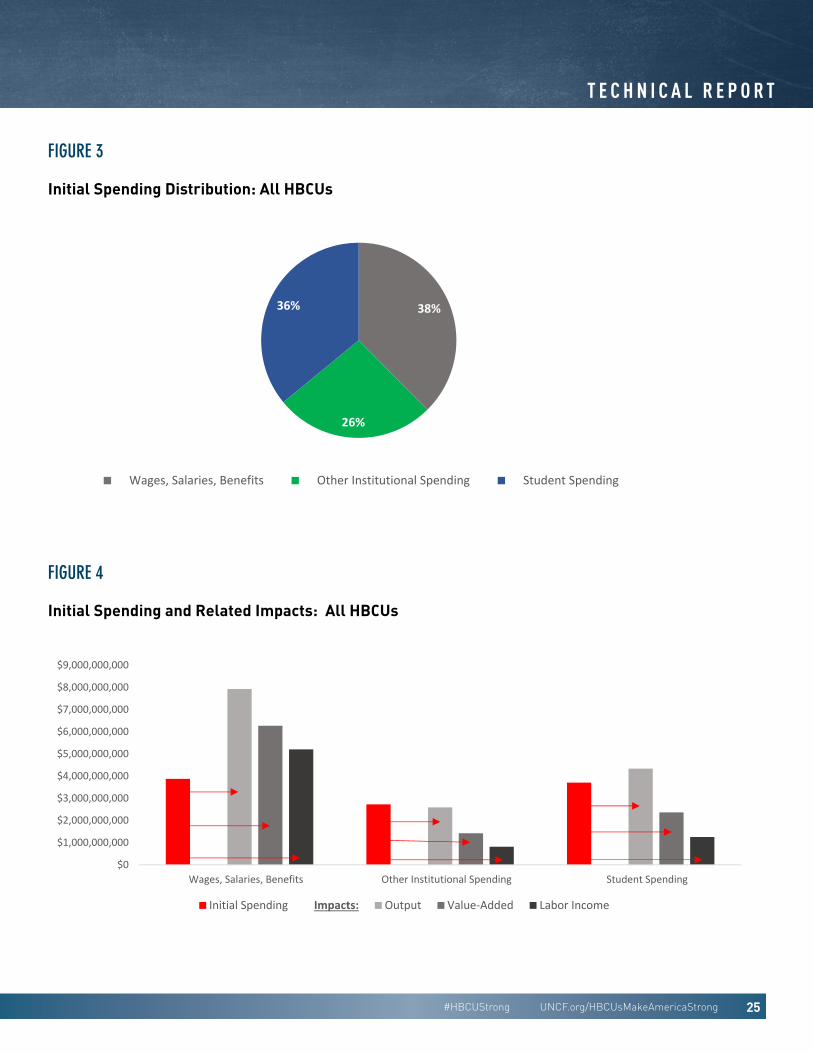
For 2014, the initial spending associated with the nation’s 100 HBCUs was $10.3 billion. Spending originating from personnel services accounted for 38 percent ($3.9 billion) of initial spending, spending due to operating expenses accounted for 26 percent ($2.7 billion), and students’ personal expenditures accounted for 36 percent ($3.7 billion). Of all the HBCUs (public and private), Howard University’s $959 million in initial spending was by far the largest in the nation.
Public HBCUs accounted for $6.8 billion in initial spending, or 66 percent of the total amount. In order, the top 10 public HBCUs ranked by the amount of their initial spending were:
1. Florida A&M University ($408 million)
2. Texas Southern University ($354 million)
3. North Carolina A&T State University ($327 million)
4. Morgan State University ($282 million)
5. Jackson State University ($275 million)
6. Prairie View A&M University ($266 million)
7. Tennessee State University ($264 million)
8. North Carolina Central University ($248 million)
9. Alabama State University ($215 million)
10. The University of the District of Columbia ($202 million)
Private, non-profit HBCUs accounted for $3.5 billion in initial spending, or 34 percent of the total amount. Ranked by the amount of their initial spending, the top 10 private, nonprofit HBCUs were:
1. Howard University ($959 million)
2. Hampton University ($201 million)
3. Tuskegee University ($188 million)
4. Meharry Medical College ($147 million)
5. Morehouse School of Medicine ($146 million)
6. Xavier University of Louisiana ($127 million)
7. Clark Atlanta University ($119 million)
8. Spelman College ($117 million)
9. Morehouse College ($115 million)
10. Bethune-Cookman University ($111 million)
Total Output Impact
The output impact was calculated for each category of initial spending, based on the impacts of the first round of spending and the respending of these amounts—the multiplier effect. Total output impacts are the most inclusive, largest measures of economic impact. Output impacts are also the most frequently cited measure of economic impact and are typically emphasized in press releases and other communications. Essentially the equivalent of business revenue, sales, or gross receipts, total output is the value of production by all industries, including households. Output impacts are reported in Tables 1, 2, 3, and 4.
10 A STUDY COMMISSIONED BY UNCF
HBCUs MAKE AMERICA STRONG: THE POSITIVE ECONOMIC IMPACT OF HISTORICALLY BLACK COLLEGES AND UNIVERSITIES
HBCUHBCU
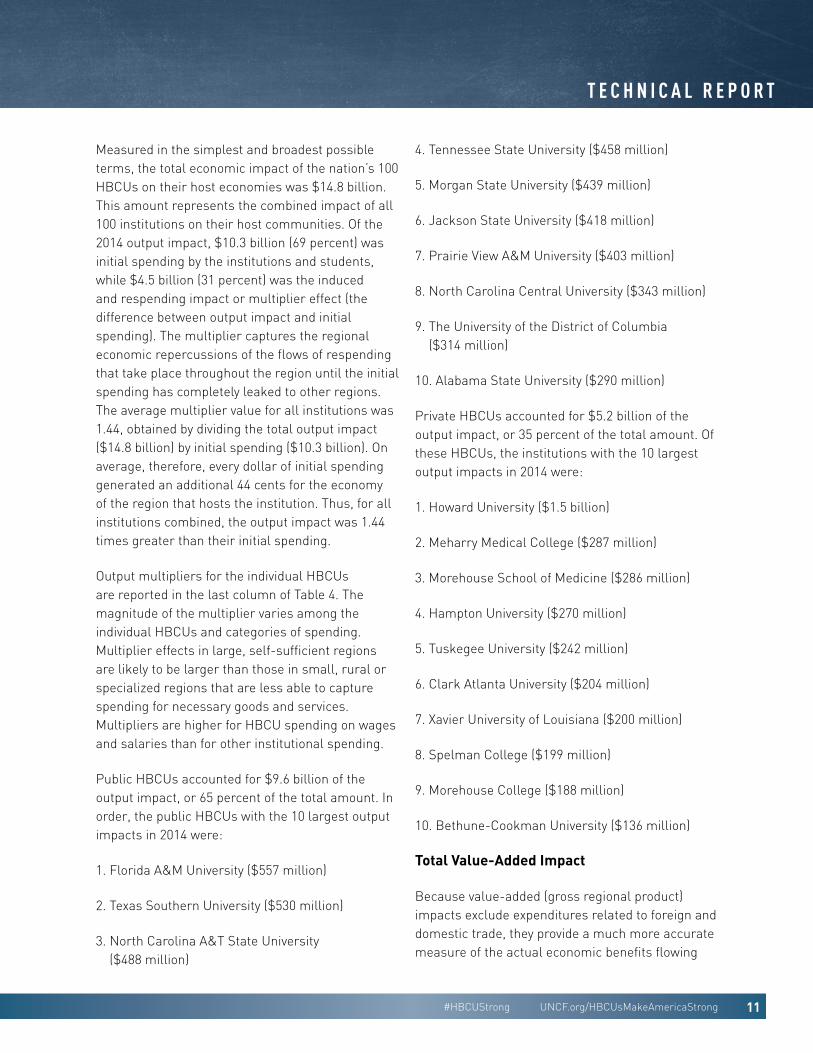
Measured in the simplest and broadest possible terms, the total economic impact of the nation’s 100 HBCUs on their host economies was $14.8 billion. This amount represents the combined impact of all 100 institutions on their host communities. Of the 2014 output impact, $10.3 billion (69 percent) was initial spending by the institutions and students, while $4.5 billion (31 percent) was the induced and respending impact or multiplier effect (the difference between output impact and initial spending). The multiplier captures the regional economic repercussions of the flows of respending that take place throughout the region until the initial spending has completely leaked to other regions. The average multiplier value for all institutions was 1.44, obtained by dividing the total output impact ($14.8 billion) by initial spending ($10.3 billion). On average, therefore, every dollar of initial spending generated an additional 44 cents for the economy of the region that hosts the institution. Thus, for all institutions combined, the output impact was 1.44 times greater than their initial spending.
Output multipliers for the individual HBCUs are reported in the last column of Table 4. The magnitude of the multiplier varies among the individual HBCUs and categories of spending. Multiplier effects in large, self-sufficient regions are likely to be larger than those in small, rural or specialized regions that are less able to capture spending for necessary goods and services. Multipliers are higher for HBCU spending on wages and salaries than for other institutional spending.
Public HBCUs accounted for $9.6 billion of the output impact, or 65 percent of the total amount. In order, the public HBCUs with the 10 largest output impacts in 2014 were:
1. Florida A&M University ($557 million)
2. Texas Southern University ($530 million)
3. North Carolina A&T State University ($488 million)
4. Tennessee State University ($458 million)
5. Morgan State University ($439 million)
6. Jackson State University ($418 million)
7. Prairie View A&M University ($403 million)
8. North Carolina Central University ($343 million)
9. The University of the District of Columbia ($314 million)
10. Alabama State University ($290 million)
Private HBCUs accounted for $5.2 billion of the output impact, or 35 percent of the total amount. Of these HBCUs, the institutions with the 10 largest output impacts in 2014 were:
1. Howard University ($1.5 billion)
2. Meharry Medical College ($287 million)
3. Morehouse School of Medicine ($286 million)
4. Hampton University ($270 million)
5. Tuskegee University ($242 million)
6. Clark Atlanta University ($204 million)
7. Xavier University of Louisiana ($200 million)
8. Spelman College ($199 million)
9. Morehouse College ($188 million)
10. Bethune-Cookman University ($136 million)
Total Value-Added Impact
Because value-added (gross regional product) impacts exclude expenditures related to foreign and domestic trade, they provide a much more accurate measure of the actual economic benefits flowing
UNCF PUBLIC POLICY PRIORITIES FOR THE 114TH CONGRESS
11#HBCUStrong UNCF.org/HBCUsMakeAmericaStrong
HBCUs MAKE AMERICA STRONG: THE POSITIVE ECONOMIC IMPACT OF HISTORICALLY BLACK COLLEGES AND UNIVERSITIES T E C H N I C A L R E P O R T
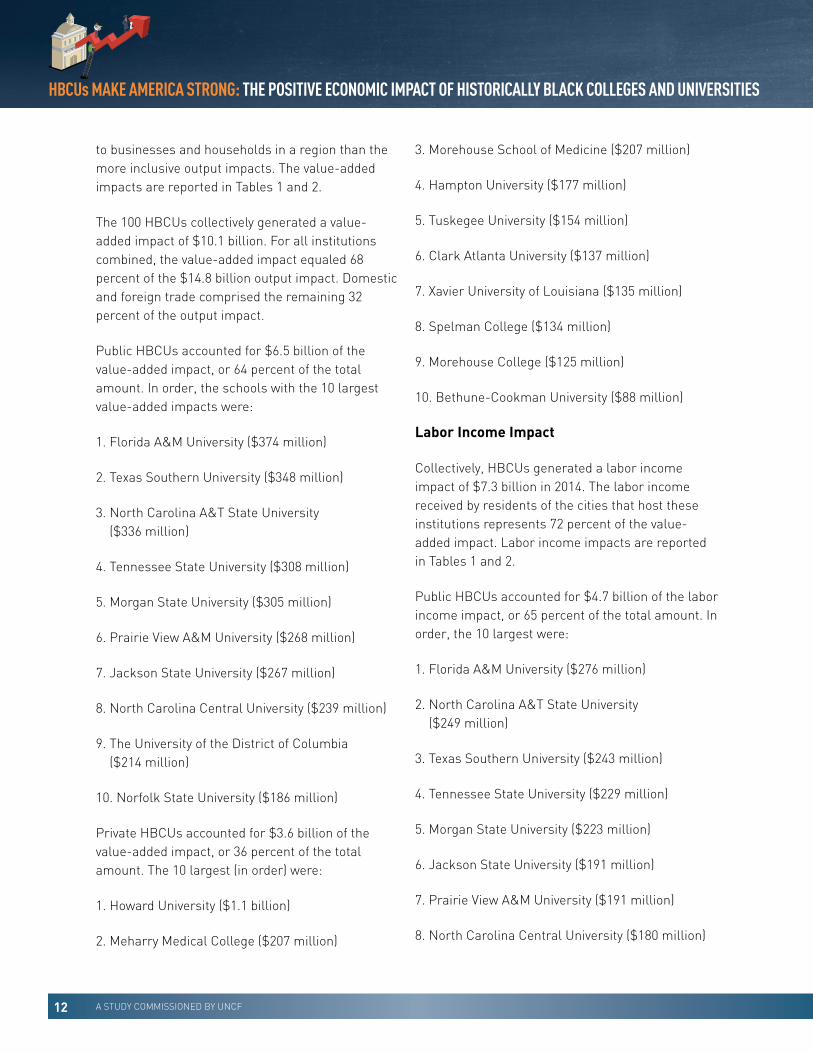
to businesses and households in a region than the more inclusive output impacts. The value-added impacts are reported in Tables 1 and 2.
The 100 HBCUs collectively generated a value-added impact of $10.1 billion. For all institutions combined, the value-added impact equaled 68 percent of the $14.8 billion output impact. Domestic and foreign trade comprised the remaining 32 percent of the output impact.
Public HBCUs accounted for $6.5 billion of the value-added impact, or 64 percent of the total amount. In order, the schools with the 10 largest value-added impacts were:
1. Florida A&M University ($374 million)
2. Texas Southern University ($348 million)
3. North Carolina A&T State University ($336 million)
4. Tennessee State University ($308 million)
5. Morgan State University ($305 million)
6. Prairie View A&M University ($268 million)
7. Jackson State University ($267 million)
8. North Carolina Central University ($239 million)
9. The University of the District of Columbia ($214 million)
10. Norfolk State University ($186 million)
Private HBCUs accounted for $3.6 billion of the value-added impact, or 36 percent of the total amount. The 10 largest (in order) were:
1. Howard University ($1.1 billion)
2. Meharry Medical College ($207 million)
3. Morehouse School of Medicine ($207 million)
4. Hampton University ($177 million)
5. Tuskegee University ($154 million)
6. Clark Atlanta University ($137 million)
7. Xavier University of Louisiana ($135 million)
8. Spelman College ($134 million)
9. Morehouse College ($125 million)
10. Bethune-Cookman University ($88 million)
Labor Income Impact
Collectively, HBCUs generated a labor income impact of $7.3 billion in 2014. The labor income received by residents of the cities that host these institutions represents 72 percent of the value-added impact. Labor income impacts are reported in Tables 1 and 2.
Public HBCUs accounted for $4.7 billion of the labor income impact, or 65 percent of the total amount. In order, the 10 largest were:
1. Florida A&M University ($276 million)
2. North Carolina A&T State University ($249 million)
3. Texas Southern University ($243 million)
4. Tennessee State University ($229 million)
5. Morgan State University ($223 million)
6. Jackson State University ($191 million)
7. Prairie View A&M University ($191 million)
8. North Carolina Central University ($180 million)
12 A STUDY COMMISSIONED BY UNCF
HBCUs MAKE AMERICA STRONG: THE POSITIVE ECONOMIC IMPACT OF HISTORICALLY BLACK COLLEGES AND UNIVERSITIES
HBCUHBCU

9. The University of the District of Columbia ($156 million)
10. Southern University and A&M College ($137 million)
Private HBCUs accounted for $2.5 billion of the labor income impact, or 35 percent of the total amount. The 10 largest were:
1. Howard University ($816 million)
2. Meharry Medical College ($158 million)
3. Morehouse School of Medicine ($153 million)
4. Hampton University ($115 million)
5. Tuskegee University ($104 million)
6. Xavier University of Louisiana ($95 million)
7. Clark Atlanta University ($94 million)
8. Spelman College ($92 million)
9. Morehouse College ($83 million)
10. Bethune-Cookman University ($59 million)
Employment Impact
The economic impact of having an HBCU in town is most easily understood in terms of its effects on employment. Collectively, the 100 HBCUs generated an employment impact of 134,090 jobs in 2014. To provide perspective, the rolled-up employment impact of the nation’s HBCUs exceeded the number of jobs at Oracle (132,000 jobs), Convergys (130,000 jobs), and Honeywell International (129,000 jobs), the nation’s 48th, 49th, and 50th largest private employers, respectively (Fortune 500).
Approximately 43 percent (57,868 jobs) of the 134,090 jobs were on-campus jobs at one of the HBCUs and 57 percent (76,222 jobs) were off-
campus jobs in the private and public sectors. On average, for each job created on campus there were 1.3 off-campus jobs that existed because of spending related to the HBCU. For all institutions combined, 13 jobs were generated for each million dollars of initial spending in 2014. A multiplier of 13 jobs for each million dollars of initial spending is reasonable for the higher education industry. It is lower than found in many labor-intensive, low-wage industries such as childcare or home healthcare. It is higher than found in many capital-intensive, high-wage industries such as manufacturing or electric utilities.
Collectively, the employment impacts of the 100 HBCUs are reported in Table 1. Employment impacts for the individual institutions are reported in Table 2. For each institution, a break out of on-campus and off-campus jobs that exist due to institution-related spending is reported in Table 5.
Public HBCUs accounted for 89,932 jobs out of a total employment impact of 134,090 jobs, or 67 percent of the total amount. In order, the 10 largest were:
1. Florida A&M University (5,104 jobs)
2. North Carolina A&T State University (4,325 jobs)
3. Texas Southern University (4,023 jobs)
4. Morgan State University (3,960 jobs)
5. Jackson State University (3,818 jobs)
6. Tennessee State University (3,699 jobs)
7. Prairie View A&M University (3,178 jobs)
8. North Carolina Central University (3,085 jobs)
9. Alabama State University (2,791 jobs)
10. Southern University and A&M College (2,765 jobs)
UNCF PUBLIC POLICY PRIORITIES FOR THE 114TH CONGRESS
13#HBCUStrong UNCF.org/HBCUsMakeAmericaStrong
HBCUs MAKE AMERICA STRONG: THE POSITIVE ECONOMIC IMPACT OF HISTORICALLY BLACK COLLEGES AND UNIVERSITIES T E C H N I C A L R E P O R T

Private HBCUs accounted for 44,158 jobs out of a total employment impact of 134,090 jobs, or 33 percent of the total amount. The 10 largest in 2014 were:
1. Howard University (9,591 jobs)
2. Morehouse School of Medicine (2,372 jobs)
3. Hampton University (2,249 jobs)
4. Meharry Medical College (2,207 jobs)
5. Tuskegee University (2,081 jobs)
6. Xavier University of Louisiana (1,715 jobs)
7. Clark Atlanta University (1,708 jobs)
8. Spelman College (1,625 jobs)
9. Morehouse College (1,580 jobs)
10. Bethune-Cookman University (1,469 jobs).
Comparisons to Previous Estimates
In 2006, the NCES published a study by the author (Humphreys, 2006) that estimated the economic impact of the nation’s HBCUs on their regional economies. The estimates were for 2001, but the methodology was not the same as that used in this study. This was particularly obvious in the overestimated employment impacts.
The combined initial spending of the nation’s HBCUs (101 institutions in 2001) was $6.6 billion. The total output impact was $10.2 billion in 2001. The 101 HBCUs collectively generated a value-added impact of $6 billion, a labor income impact of $4 billion, and a total employment impact of 180,142 full- and part-time jobs.
With the exception of the employment impact, the 2014 impact estimates are significantly higher.
Specifically, on an inflation-adjusted basis, initial spending is 23 percent higher, the output impact is 12 percent higher, the value-added impact is 34 percent higher, and the labor income impact is 33 percent higher. The employment impact is 26 percent lower, however, due to methodological differences.
Summary
This analysis utilizes data from several sources to determine the short-term economic impact of HBCUs on their regional economies. The short-term economic impact of an HBCU is defined as the change in overall economic activity that is associated with HBCU-related spending. For each HBCU, impacts were estimated for the three most important categories of HBCU-related spending detailed in the introduction to Part 1 of this paper.
The fundamental finding is that each of the nation’s HBCUs creates substantial recurring, annual economic impacts for its regional economy in terms of output, value-added, labor income, and employment. In 2014, the total economic impact of the nation’s 100 HBCUs on their host communities was $14.8 billion. Of the total, $10.3 billion (69 percent) was initial spending by the institutions and students; $4.5 billion (31 percent) was the induced or respending (multiplier) impact. Dividing the total output by initial spending yields an average multiplier value of 1.44, meaning that, on average, every dollar of initial spending generates an additional 44 cents for an HBCU’s regional economy.
Value-added comprised $10.1 billion (68 percent) of the $14.8 billion output impact, with domestic and foreign trade comprising the remaining $4.8 billion (32 percent). Labor income received by residents of the communities that host one or more institutions equals $7.3 billion and represents 72 percent of the value-added impact.
14 A STUDY COMMISSIONED BY UNCF
HBCUs MAKE AMERICA STRONG: THE POSITIVE ECONOMIC IMPACT OF HISTORICALLY BLACK COLLEGES AND UNIVERSITIES
HBCUHBCU

The collective or rolled-up employment impact of all HBCUs on their host communities, including multiplier effects, was 134,090 full- and part-time jobs. Approximately 43 percent of these positions were on campus (57,868 HBCU employees) and 57 percent (76,222 jobs) were off-campus positions in the private and public sectors. On average, for each job created on campus there were 1.3 off-campus jobs that existed because of spending related to the institution.
These economic impacts are significant and are generated year after year. For example, in terms of output (revenues), the nation’s HBCUs would rank 191 on the Fortune 500 list of America’s largest companies. This is roughly equal to the revenues of CarMax and slightly larger than the revenues of familiar corporations such as Marriott International and Office Depot.
The economic impact estimates demonstrate quantitatively rather than intuitively that HBCUs are enduring pillars of the regional economy, generating jobs, higher incomes, and greater production of goods and services for local households and businesses.
Methodology: Estimating the Economic Impacts
Estimating the economic impact of the nation’s HBCUs on their regional economies involved five basic steps. First, the nation’s HBCUs were identified. Second, spending by each HBCU was estimated. Third, spending by students was estimated. Fourth, economic models were built for each HBCU’s regional economy. Finally, the regional economic models were used to estimate the total economic impacts of spending by each HBCU and its students.
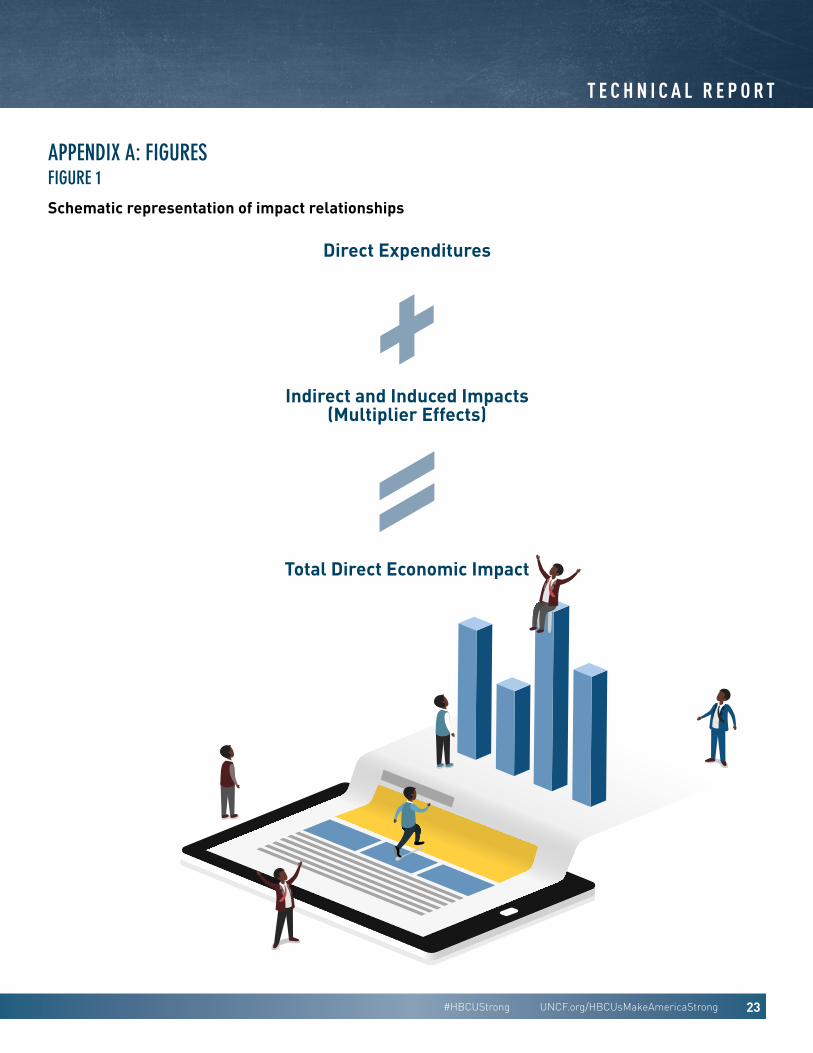
The total annual economic impact of HBCU-related spending consists of the net changes in regional output, value-added, labor income, and employment that are due to initial spending by the institution and its students. The total economic impact includes the impact of the initial round of spending and the secondary, or indirect and induced, spending—the multiplier effect—that occurs when the initial expenditures are respent. Figure 1 provides a schematic representation of impact relationships.
Indirect spending refers to the changes in inter-industry purchases as a region’s industries respond to the additional demands triggered by spending by the HBCU, its faculty and staff, and its students. It consists of the ripples of activity that are created when an institution, its employees, and its students purchase goods or services from other industries located in the host community.
Induced spending is similar to indirect spending except that it refers to the additional demand triggered by spending by the region’s households as their income increases due to changes in production. Basically, the induced impact captures the ripples of activity that are created when households spend more due to increases in their earnings caused by direct and indirect spending.
The sum of the direct, indirect, and induced economic impacts is the total economic impact, which is expressed in terms of output (sales, plus or minus inventory), value-added (gross regional product), labor income, or employment. Total industry output is gross receipts or sales, plus or minus inventory, or the value of production by industry (including households) for a given period.
UNCF PUBLIC POLICY PRIORITIES FOR THE 114TH CONGRESS
15#HBCUStrong UNCF.org/HBCUsMakeAmericaStrong
HBCUs MAKE AMERICA STRONG: THE POSITIVE ECONOMIC IMPACT OF HISTORICALLY BLACK COLLEGES AND UNIVERSITIES T E C H N I C A L R E P O R T
Total output impacts are the most inclusive, largest measures of economic impact. Because of their size, these impacts typically are emphasized in economic impact studies and receive much media attention. One problem with output as a measure of economic impact, however, is that it includes the value of inputs produced by other industries, which means that there inevitably is some double counting of economic activity. The other measures of economic activity (value-added, labor income, and employment) are free from double counting. They provide a much more realistic measure of the true economic impact of a college or university on its regional economy.
The regional economic areas are the host communities and include surrounding counties to account for employee and student commutes. The effects of expenditures that go to people, businesses, or governments located outside the regions are not included in the output, value-added, labor income, and employment impact estimates.
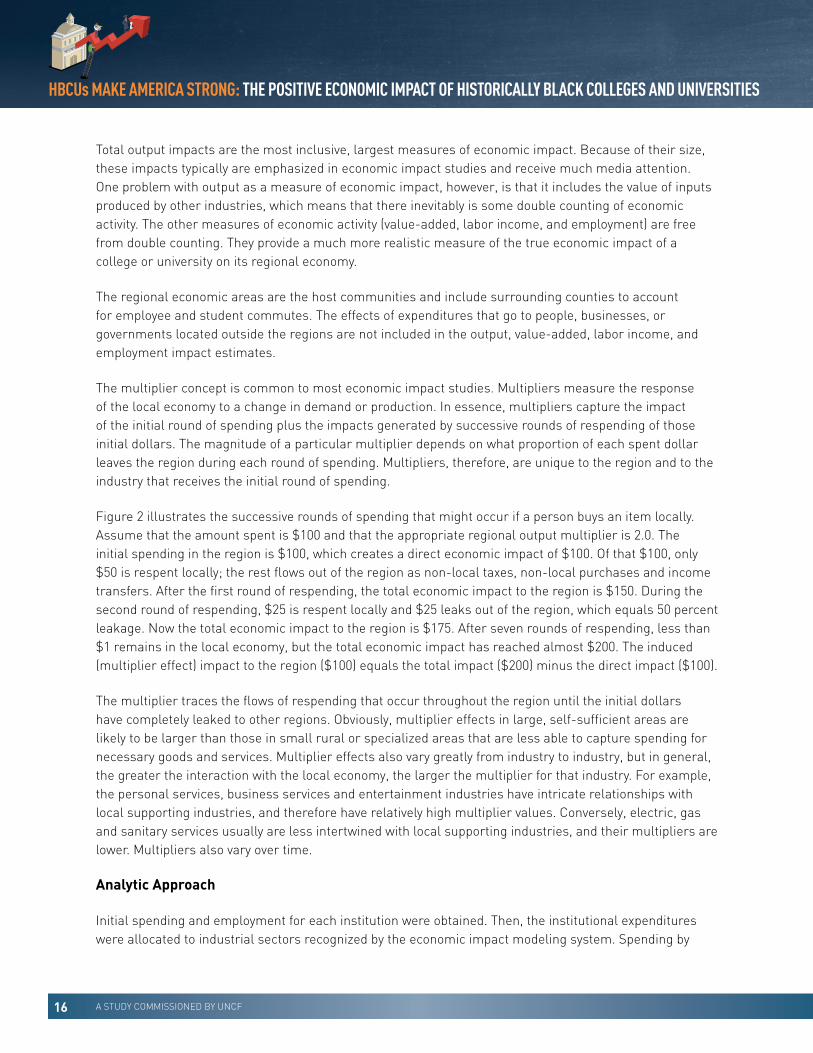
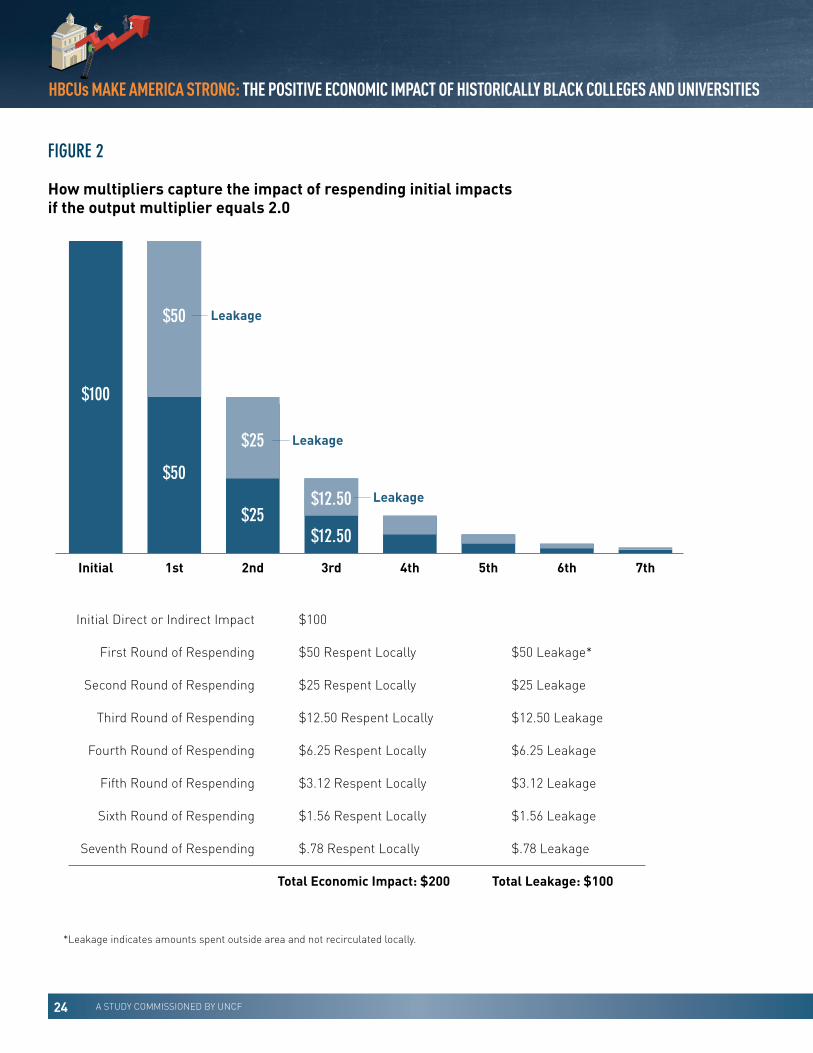
The multiplier concept is common to most economic impact studies. Multipliers measure the response of the local economy to a change in demand or production. In essence, multipliers capture the impact of the initial round of spending plus the impacts generated by successive rounds of respending of those initial dollars. The magnitude of a particular multiplier depends on what proportion of each spent dollar leaves the region during each round of spending. Multipliers, therefore, are unique to the region and to the industry that receives the initial round of spending.
Figure 2 illustrates the successive rounds of spending that might occur if a person buys an item locally. Assume that the amount spent is $100 and that the appropriate regional output multiplier is 2.0. The initial spending in the region is $100, which creates a direct economic impact of $100. Of that $100, only $50 is respent locally; the rest flows out of the region as non-local taxes, non-local purchases and income transfers. After the first round of respending, the total economic impact to the region is $150. During the second round of respending, $25 is respent locally and $25 leaks out of the region, which equals 50 percent leakage. Now the total economic impact to the region is $175. After seven rounds of respending, less than $1 remains in the local economy, but the total economic impact has reached almost $200. The induced (multiplier effect) impact to the region ($100) equals the total impact ($200) minus the direct impact ($100).
The multiplier traces the flows of respending that occur throughout the region until the initial dollars have completely leaked to other regions. Obviously, multiplier effects in large, self-sufficient areas are likely to be larger than those in small rural or specialized areas that are less able to capture spending for necessary goods and services. Multiplier effects also vary greatly from industry to industry, but in general, the greater the interaction with the local economy, the larger the multiplier for that industry. For example, the personal services, business services and entertainment industries have intricate relationships with local supporting industries, and therefore have relatively high multiplier values. Conversely, electric, gas and sanitary services usually are less intertwined with local supporting industries, and their multipliers are lower. Multipliers also vary over time.
Analytic Approach
Initial spending and employment for each institution were obtained. Then, the institutional expenditures were allocated to industrial sectors recognized by the economic impact modeling system. Spending by
16 A STUDY COMMISSIONED BY UNCF
HBCUs MAKE AMERICA STRONG: THE POSITIVE ECONOMIC IMPACT OF HISTORICALLY BLACK COLLEGES AND UNIVERSITIES
HBCUHBCU

students was estimated and then allocated to industrial sectors. Finally, regional economic models that are specific to each institution were built with the IMPLAN-Online input-output modeling system using data collected for the local region, not national averages.
It should be noted that IMPLAN and other modeling systems measure the total economic impact of college- or university-related spending on its host community, but if an HBCU were to close or otherwise cease to exist, economic activity might not drop as much as the model indicates. This is because some spending might be directed toward other activities in the region. In some communities, for instance, some of the displaced students might transfer to other colleges in the region. Since it is extraordinarily difficult to predict such adjustments, the total rather than net economic impacts of HBCU-related spending are reported. Thus, the economic impact estimates should be considered the upper bounds on the true economic impact of college- or university-related spending.
Appendix C reports the geographic areas that correspond to the regional models built for each institution, which include the labor force directly involved in their economic spheres. In most cases, these geographic areas are based on the standard metropolitan and micropolitan statistical area definitions released by the Office of Management and Budget in 2013. The geographic area of the regional model for each institution also considers population and commuting patterns.
Type SAM (social accounting matrices) multipliers from the IMPLAN system were used to estimate the economic impacts associated with all categories of spending. These multipliers capture the original expenditures that resulted from the impact, the indirect effects of industries buying from industries, and the induced effects of household expenditures based on information in the SAM. The multipliers account for Social Security and income tax leakage, institutional savings, commuting, inter-institutional transfers, and people-to-people transfers.
Whenever appropriate, the IMPLAN software applied margins to convert purchaser prices to producer prices. In input-output models, all expenditures are in terms of producer prices, which allow all spending to be allocated to the industries that actually produce the good or service. The margins are derived from U.S. Bureau of Economic Analysis data. Moreover, margins were selected according to type of consumer. For example, households pay transportation, wholesale, and full-retail margins. By contrast, institutions of higher education may pay little or no retail margin as they have typically more buying power than a household. In addition, many sectors of the model do not have margins. For instance, because there usually are no wholesalers or retailers involved when someone rents a room, hotels and other lodging do not have margins.
The IMPLAN model’s default estimates of the local economy’s regional purchase coefficients were used to derive the ratio of locally purchased to imported goods. The regional purchase coefficient represents the proportion of the total demands for a given commodity that the region supplies to itself. The regional purchase coefficients were estimated with an econometric equation that predicts local purchases based on each region’s unique characteristics. In addition, to avoid aggregation bias, the entire analysis was conducted using the full range of industrial sectors.
All dollar amounts were converted to inflation-adjusted dollars. The amounts in this report are expressed in 2014 dollars.
UNCF PUBLIC POLICY PRIORITIES FOR THE 114TH CONGRESS
17#HBCUStrong UNCF.org/HBCUsMakeAmericaStrong
HBCUs MAKE AMERICA STRONG: THE POSITIVE ECONOMIC IMPACT OF HISTORICALLY BLACK COLLEGES AND UNIVERSITIES T E C H N I C A L R E P O R T

Identifying the Nation’s HBCUs
For analytical purposes, this study defines HBCUs to be accredited Title IV eligible institutions of higher education established prior to 1964 with the principal mission of educating black Americans. Institutions for which NCES neither reports nor imputes the required data are not included (e.g., the Utica Campus of Hinds Community College is not covered). Also, institutions that were not recognized by IPEDS as an HBCU at the time of this analysis (May 2016) were not covered (e.g., American Baptist College is not covered). Based on these criteria, the NCES provided the author with its list of active HBCUs that are located in the 50 states, the District of Columbia, and the U.S. Virgin Islands.
Initial Spending by the Institutions
The data source for spending by the institutions was the NCES Integrated Postsecondary Education Data System (IPEDS) survey, which consists of 11 survey components, corresponding to three seasonal reporting periods. Specifically, the components used to obtain institutional spending data included finance and human resources. The most recent finance data that was available at the time of this analysis (May 2016) was the provisional release data for 2013-14. The human resources component of the IPEDS survey provided corresponding employment data. The survey also provided all institution-level data related to spending for wages, salaries and benefits as well as other operating expenses.
The amounts for wages, salaries and benefits were allocated to various economic sectors recognized by the IMPLAN model. For private HBCUs, the amounts for institutional spending other than wages, salaries, and benefits were allocated to various economic sectors recognized by the IMPLAN software based on the typical expenditure patterns for junior colleges, colleges, universities, and professional schools. Similarly, for public HBCUs, these amounts were allocated to economic sectors based on the typical expenditure patterns for state and local government education. The distinction between public and private nonprofit HBCUs is important when using the regional models because private colleges are included in a different industry than public colleges due to differences in inputs and costs.
To avoid double counting, the estimates of initial spending by the institutions exclude some types of expenditures, the largest of which is auxiliary enterprises. Auxiliary enterprises are essentially self-supporting institutional operations that furnish a service to students, faculty or staff and that charge a fee that is directly related to, although not necessarily equal to, the cost of services. Spending for auxiliary enterprises, therefore, is largely accounted for in the spending amounts attributed to faculty, staff, and students.
Initial expenditure amounts for wages, salaries, benefits and other institutional spending are reported for each HBCU in Tables 2 and 4.
Students’ Personal Expenditures
College students spend significant amounts of money in the local economy as a part of their living expenses, so the dollar value of this spending was estimated. Since a detailed survey of student spending habits at each institution was not practical, the estimated cost of attendance prepared by each HBCU was
18 A STUDY COMMISSIONED BY UNCF
HBCUs MAKE AMERICA STRONG: THE POSITIVE ECONOMIC IMPACT OF HISTORICALLY BLACK COLLEGES AND UNIVERSITIES
HBCUHBCU

used as a proxy for each institution’s average expenditure level per full-time equivalent (FTE) student. The source of the cost of attendance data was the NCES IPEDS website for the 2013-14 academic year.
Student spending includes spending on books and supplies, room and board, and other expenses. The average student attending an HBCU spent $13,821, which is similar to the average spending levels for all colleges and universities surveyed in the Annual Survey of Colleges produced by the College Board. These expenditures are $13,933 for public colleges and universities and $14,556 for private nonprofit colleges and universities. The student spending estimates do not include tuition and fees, however. The economic impact of activities supported by spending on tuition and fees is already captured in the impact estimates attributed to spending by the institutions.
As expected, the estimates of student spending varied widely from one institution to another, generally higher in large metropolitan areas and lower in small metropolitan, small micropolitan, or rural areas. Of course, student spending includes items that were purchased for them by others (e.g., parents who pay landlords directly for their children’s apartment rent).
Student spending was allocated to the model’s sectors based on three sources:
• Various annual Consumer Expenditure Surveys conducted by the U.S. Bureau of Labor Statistics (BLS)
• A special BLS study in the July 2001 issue of the Monthly Labor Review that examined the expenditures of college-age students and non-students
• The College Board’s Annual Survey of Colleges
The final step in estimating students’ personal expenditures was to multiply the number of FTE students by average spending per student. Each institution’s 12-month FTE enrollment (all levels) for 2013-2014 was obtained from the NCES IPEDS website, which was the most recent data available for this analysis. Prior to multiplying the number of FTE students by average spending per student, enrollment was reduced to account for students exclusively enrolled in online courses. Initial spending by students is reported in Tables 1, 2, 3, and 4.
PART 2: THE LIFETIME EARNINGS OF THE CLASS OF 2014
One of the most important long-term benefits of higher education is the additional work-life earnings that can be associated with degrees granted by colleges and universities. A college degree opens doors to economic prosperity by improving the skills of its graduates, thereby increasing their productivity and consequently their lifetime earnings. Certainly, from the perspectives of the students and their families, the most relevant measure of the economic value of an HBCU education is increased earnings over a working lifetime.
The increase in earnings associated with a degree obviously will vary from one individual to another, over time, geographically, and by field of study. A rough approximation of the aggregate benefits to graduates of
UNCF PUBLIC POLICY PRIORITIES FOR THE 114TH CONGRESS
19#HBCUStrong UNCF.org/HBCUsMakeAmericaStrong
HBCUs MAKE AMERICA STRONG: THE POSITIVE ECONOMIC IMPACT OF HISTORICALLY BLACK COLLEGES AND UNIVERSITIES T E C H N I C A L R E P O R T

the nation’s HBCUs in a given year is possible, however, along with benefits accruing to the average degree holder. This section presents rough estimates for HBCU graduates who received professional, doctoral, master’s, bachelor’s, associate’s degrees, and certificates in 2014.
Results
The analysis shows that the 50,037 HBCU graduates in 2014 can expect work-life earnings of $130 billion, which is 56 percent more than they could expect to earn had they not earned their 2014 certificates or degrees. So, in terms of extra or incremental work-life earnings, the collective worth of the certificates or degrees granted by HBCUs is $46 billion, or $926,666 per graduate. Obviously, the economic worth of an HBCU education over the course of a graduate’s working life is considerable and demonstrates the real value of advanced education.
The 2,131 students who received a certificate from an HBCU will account for 1 percent of the collective increase in work-life earnings. On average, the work-life earnings of graduates with a certificate will be $204,464 more than for persons with a high school diploma. The 4,099 students who received an associate’s degree will account for 4 percent of the collective increase in work-life earnings. Their work-life earnings, on average, will be $463,112 more than for high school graduates. The 33,544 students who earned a bachelor’s degree will account for 80 percent of the collective increase in work-life earnings. On average, their work-life earnings will be $1,101,200 more than for persons with a high school diploma.
The 7,840 students who received a master’s degree will account for 7 percent of the collective increase in work-life earnings. They will earn $431,679 more than those who only have a bachelor’s degree. The 638 students who received doctorals will account for 1 percent of the collective increase in work-life earnings, and will earn $724,005 more than those with a master’s. The 1,785 students with a professional degree will account for 7 percent of the collective increase in work-life earnings. On average, they will earn the most: $1,819,966 more than those who hold a bachelor’s degree.
Although average earnings rise considerably with educational attainment, individual earnings in each specific education level can vary substantially due to field of study, occupational choice, labor force experience, and location. Nonetheless, most graduates of the nation’s HBCUs will realize significantly higher work-life earnings when they have a college degree. For example, work-life earnings for people with a bachelor’s degree will be 77 percent higher than for those who only complete high school.
Methodology: Estimating Work-Life Earnings
The synthetic work-life estimates for each HBCU are derived from synthetic estimates of work-life earnings by educational attainment and were obtained from the Census Bureau’s American Community Survey brief, “Work-Life Earnings by Field of Degree and Occupation for People With a Bachelor’s Degree: 2011,” (October 2012). The estimates of synthetic work-life earnings for certificates (less than 4 academic years) were based on data obtained from the Census Bureau’s “What It’s Worth: Field of Training and Economic Status in 2009,” (February 2012).
20 A STUDY COMMISSIONED BY UNCF
HBCUs MAKE AMERICA STRONG: THE POSITIVE ECONOMIC IMPACT OF HISTORICALLY BLACK COLLEGES AND UNIVERSITIES
HBCUHBCU
These synthetic work-life earnings are “expected average amounts” based on cross-sectional earnings data for all persons aged 25-64 who maintain full-time, year-round employment for the entire time. The estimates are based on U.S.-level data rather than data specific to each HBCU’s regional economy.
The synthetic estimates are based on median earnings data. Although the dollar amounts were originally reported in 2011 dollars, or 2009 dollars in the case of certificates, they were adjusted to 2014 dollars using the consumer price index for all urban consumers obtained from the BLS. The totals that resulted represent what individuals with the same education level could expect to earn, on average, in 2014 dollars, during a hypothetical 40-year working life for those who maintain full-time, year-round employment. The estimates therefore are illustrative and do not predict actual future earnings. They especially are not likely to apply to those who do not anticipate full-time, year-round employment.
As expected, work-life earnings increase dramatically with education level (Table 6). Over a working lifetime, a high school graduate can expect to earn $1,436,484. By contrast, the average person with a certificate (less than four academic years) earns $1,640,949, the average person with an associate’s degree earns $1,899,596, and the average bachelor’s degree holder earns $2,537,683. The average person with a master’s earns $2,969,363, the average person with a doctoral degree will earn $3,693,368 and the average person with a professional degree earns $4,357,650, the highest estimate for all degrees and certificates.
Incremental or extra work-life earnings per degree also are reported in Table 6. Incremental work-life earnings are defined for the different levels of certificates and degrees as follows:
• For graduates with a certificate (of less than four academic years), their incremental earnings ($204,464) are the difference between their synthetic work-life earnings and those of people with a high school diploma.
• For people with an associate’s degree, their incremental earnings ($463,112) are the difference between their synthetic work-life earnings and those of people with a high school diploma.
• For graduates with a bachelor’s degree, their incremental earnings ($1,101,200) are the difference between their synthetic work-life earnings and those of people with a high school diploma.
• For graduates with a master’s degree, their incremental earnings ($431,679) are the difference between their synthetic work-life earnings and those of people with a bachelor’s degree.
• For graduates with a doctoral degree, their incremental earnings ($724,005) are the difference between their synthetic work-life earnings and those of people with a master’s degree.
• For graduates with a professional degree, their incremental earnings ($1,819,966) are the difference between their synthetic work-life earnings and those of people with a bachelor’s degree.
UNCF PUBLIC POLICY PRIORITIES FOR THE 114TH CONGRESS
21#HBCUStrong UNCF.org/HBCUsMakeAmericaStrong
HBCUs MAKE AMERICA STRONG: THE POSITIVE ECONOMIC IMPACT OF HISTORICALLY BLACK COLLEGES AND UNIVERSITIES T E C H N I C A L R E P O R T

The NCES IPEDS provided counts of the number of students who earned degrees or certificates in 2014. (These are not unduplicated counts, implying there is a slight potential for double counting of persons who earned multiple degrees in 2014.) It’s also important to note that this report does not include lifetime earnings estimates for graduates who received post-baccalaureate or post-master’s certificates, which is less than 0.5 percent of total degrees and awards granted by HBCUs in 2014.
According to the data, 50,037 students received a degree or certificate from an HBCU in 2014. Two-thirds of the students received undergraduate degrees, 16 percent received a master’s degree, 8 percent received an associate’s degree, 4 percent received a professional degree, 4 percent received a certificate, and 1 percent received a doctoral degree.
For each HBCU, the synthetic work-life earnings of all graduates were estimated by multiplying the number of students who received a degree by the synthetic work-life earnings per degree. These amounts are reported in Table 7. Similarly, incremental work-life earnings of all graduates can be estimated by multiplying the number of students who received a degree by estimated incremental work-life earnings per degree.
22 A STUDY COMMISSIONED BY UNCF
HBCUs MAKE AMERICA STRONG: THE POSITIVE ECONOMIC IMPACT OF HISTORICALLY BLACK COLLEGES AND UNIVERSITIES
HBCUHBCU
UNCF PUBLIC POLICY PRIORITIES FOR THE 114TH CONGRESS
23#HBCUStrong UNCF.org/HBCUsMakeAmericaStrong
HBCUs MAKE AMERICA STRONG: THE POSITIVE ECONOMIC IMPACT OF HISTORICALLY BLACK COLLEGES AND UNIVERSITIES T E C H N I C A L R E P O R T
APPENDIX A: FIGURESFIGURE 1
Schematic representation of impact relationships
Direct Expenditures
Indirect and Induced Impacts(Multiplier Effects)
Total Direct Economic Impact
24 A STUDY COMMISSIONED BY UNCF
HBCUs MAKE AMERICA STRONG: THE POSITIVE ECONOMIC IMPACT OF HISTORICALLY BLACK COLLEGES AND UNIVERSITIES
38%
26%
36%
Initial Spending Distribution: All HBCUs
Wages, Salaries, Benefits Other Institutional Spending Student Spending
$0
$1,000,000,000
$2,000,000,000
$3,000,000,000
$4,000,000,000
$5,000,000,000
$6,000,000,000
$7,000,000,000
$8,000,000,000
$9,000,000,000
Wages, Salaries, Benefits Other Institutional Spending Student Spending
Initial Spending and Related Impacts (All HBCUs)
Initial Spending Impacts: Output Value‐Added Labor Income
FIGURE 2
How multipliers capture the impact of respending initial impactsif the output multiplier equals 2.0
Initial 1st 2nd 3rd 4th 5th 6th 7th
Initial Direct or Indirect Impact $100
First Round of Respending $50 Respent Locally $50 Leakage*
Second Round of Respending $25 Respent Locally $25 Leakage
Third Round of Respending $12.50 Respent Locally $12.50 Leakage
Fourth Round of Respending $6.25 Respent Locally $6.25 Leakage
Fifth Round of Respending $3.12 Respent Locally $3.12 Leakage
Sixth Round of Respending $1.56 Respent Locally $1.56 Leakage
Seventh Round of Respending $.78 Respent Locally $.78 Leakage
Total Economic Impact: $200 Total Leakage: $100
*Leakage indicates amounts spent outside area and not recirculated locally.
$100
$12.50
$50
$50
$25
$25
Leakage
Leakage
Leakage$12.50
HBCUHBCU
UNCF PUBLIC POLICY PRIORITIES FOR THE 114TH CONGRESS
25#HBCUStrong UNCF.org/HBCUsMakeAmericaStrong
HBCUs MAKE AMERICA STRONG: THE POSITIVE ECONOMIC IMPACT OF HISTORICALLY BLACK COLLEGES AND UNIVERSITIES T E C H N I C A L R E P O R T
38%
26%
36%
Initial Spending Distribution: All HBCUs
Wages, Salaries, Benefits Other Institutional Spending Student Spending
$0
$1,000,000,000
$2,000,000,000
$3,000,000,000
$4,000,000,000
$5,000,000,000
$6,000,000,000
$7,000,000,000
$8,000,000,000
$9,000,000,000
Wages, Salaries, Benefits Other Institutional Spending Student Spending
Initial Spending and Related Impacts (All HBCUs)
Initial Spending Impacts: Output Value‐Added Labor Income
FIGURE 3
Initial Spending Distribution: All HBCUs
FIGURE 4
Initial Spending and Related Impacts: All HBCUs

26 A STUDY COMMISSIONED BY UNCF
HBCUs MAKE AMERICA STRONG: THE POSITIVE ECONOMIC IMPACT OF HISTORICALLY BLACK COLLEGES AND UNIVERSITIES
37%
24%
39%
Initial Spending: Public HBCUs
Wages, Salaries, Benefits Other Institutional Spending Student Spending
$0
$1,000,000,000
$2,000,000,000
$3,000,000,000
$4,000,000,000
$5,000,000,000
$6,000,000,000
Wages, Salaries, Benefits Other Institutional Spending Student Spending
Initial Spending and Related Impacts: Public HBCUs
Initial Spending Impacts: Output Value‐Added Labor Income
FIGURE 5
Initial Spending Distribution: Public HBCUs
FIGURE 6
Initial Spending and Related Impacts: Public HBCUs
HBCUHBCU

UNCF PUBLIC POLICY PRIORITIES FOR THE 114TH CONGRESS
27#HBCUStrong UNCF.org/HBCUsMakeAmericaStrong
HBCUs MAKE AMERICA STRONG: THE POSITIVE ECONOMIC IMPACT OF HISTORICALLY BLACK COLLEGES AND UNIVERSITIES T E C H N I C A L R E P O R T
39%
31%
30%
Initital Spending Distribution: Private HBCUs
Wages, Salaries, Benefits Other Institutional Spending Student Spending
$0
$500,000,000
$1,000,000,000
$1,500,000,000
$2,000,000,000
$2,500,000,000
$3,000,000,000
Wages, Salaries, Benefits Other Institutional Spending Student Spending
Initial Spending and Related Impacts: Private HBCUs
Initial Spending Impacts: Output Value‐Added Labor Income
FIGURE 7
Initial Spending Distribution: Private HBCUs
FIGURE 8
Initial Spending and Related Impacts: Private HBCUs

28 A STUDY COMMISSIONED BY UNCF
HBCUs MAKE AMERICA STRONG: THE POSITIVE ECONOMIC IMPACT OF HISTORICALLY BLACK COLLEGES AND UNIVERSITIES
57,868
39,344
18,524
76,222
50,588
25,634
0
10,000
20,000
30,000
40,000
50,000
60,000
70,000
80,000
90,000
Total, HBCUs Public HBCUs Private HBCUs
Employment Impact of HBCU, by Type of Ownership(Number of Jobs)
On‐Campus Jobs HBCU‐Related Off‐Campus Jobs
FIGURE 9
Employment Impact of HBCUs, by Institutional Control(Number of Jobs)
HBCUHBCU

UNCF PUBLIC POLICY PRIORITIES FOR THE 114TH CONGRESS
29#HBCUStrong UNCF.org/HBCUsMakeAmericaStrong
HBCUs MAKE AMERICA STRONG: THE POSITIVE ECONOMIC IMPACT OF HISTORICALLY BLACK COLLEGES AND UNIVERSITIES T E C H N I C A L R E P O R T
$2,594,519
$4,357,650
$3,693,368
$2,969,363
$2,537,684
$1,899,596$1,640,949
$0
$500,000
$1,000,000
$1,500,000
$2,000,000
$2,500,000
$3,000,000
$3,500,000
$4,000,000
$4,500,000
$5,000,000
HBCU Total Professional Doctoral Master's Bachelor's Associate's Certificates
Total Work‐Life Earnings per Per Award
FIGURE 10
Total Work-Life Earnings Per Degrees and Certificates

30 A STUDY COMMISSIONED BY UNCF
HBCUs MAKE AMERICA STRONG: THE POSITIVE ECONOMIC IMPACT OF HISTORICALLY BLACK COLLEGES AND UNIVERSITIES
4% 1%
16%
67%
8%4%
0%
10%
20%
30%
40%
50%
60%
70%
80%
Professional Doctoral Master's Bachelor's Associate's Certificates
Percent Distribution of Total Awards, 2014
FIGURE 11
Percent Distribution of Total Degrees and Certificates, 2014
HBCUHBCU

UNCF PUBLIC POLICY PRIORITIES FOR THE 114TH CONGRESS
31#HBCUStrong UNCF.org/HBCUsMakeAmericaStrong
HBCUs MAKE AMERICA STRONG: THE POSITIVE ECONOMIC IMPACT OF HISTORICALLY BLACK COLLEGES AND UNIVERSITIES T E C H N I C A L R E P O R T
APPENDIX B: TABLESTABLE 1
Combined Economic Impact of the Nation’s HBCUs on Their Regional Economies in 2014
Notes:
Initial spending for wages, salaries, and benefits and other institutional spending was obtained from the U.S. Department of Education, National Center for Educational Statistics, Integrated Postsecondary Education Data System (IPEDS), Finance Data, 2013-14. Initial spending by students was estimated by the author, based on data obtained from IPEDS, 12-month full-time equivalent (FTE) enrollment (adjusted for students enrolled exclusively in distance education), and each HBCU’s estimated cost of attendance (room and board, books and supplies, and other expenses). The IPEDS data was extracted on March 22, 2016.
The economic impacts of initial spending on output, value-added, labor income, and employment were estimated using the IMPLAN Online regional economic modeling system and production functions provided by IMPLAN Group, LLC.
Output refers to the value of total production, including domestic and foreign trade. Value-added includes employee compensation, proprietary income, other property income, and indirect business taxes. Labor income includes both the total payroll costs (including fringe benefits) of workers who are paid by employers, and payments received by self-employed individuals. Employment includes both full- and part-time jobs. All dollar amounts are expressed in 2014 dollars.
Source: Estimated for the United Negro College Fund by Dr. Jeffrey M Humphreys, Director of the Selig Center for Economic Growth, Terry College of Business, University of Georgia, 2016.
Total for all HBCUs 10,299,999,444 14,847,773,829 10,052,549,621 7,270,851,981 134,090
Wages, Salaries, Benefits 3,873,117,744 7,923,106,136 6,265,846,866 5,205,295,367 88,315
Other Institutional Spending 2,724,185,250 2,589,104,982 1,422,732,940 812,991,742 18,209
Student Spending 3,702,696,450 4,335,562,711 2,363,969,816 1,252,564,872 27,566
Initial Spending (2014 dollars)
Output Impact (2014 dollars)
Value-Added Impact
(2014 dollars)
Labor IncomeImpact
(2014 dollars)
Employment Impact(jobs)

32 A STUDY COMMISSIONED BY UNCF
HBCUs MAKE AMERICA STRONG: THE POSITIVE ECONOMIC IMPACT OF HISTORICALLY BLACK COLLEGES AND UNIVERSITIES
Public HBCU Total 6,827,645,636 9,629,915,083 6,462,642,708 4,743,735,464 89,932
Wages, Salaries, Benefits 2,532,808,473 5,079,924,997 4,032,124,784 3,362,202,300 59,132
Other Institutional Spending 1,629,268,429 1,433,273,890 741,844,520 488,031,029 10,876
Student Spending 2,665,568,734 3,098,716,196 1,688,673,404 893,502,135 19,924
Alabama A&M University 187,979,171 237,428,123 166,279,035 123,792,512 2,620
Wages, Salaries, Benefits 66,107,993 115,830,612 94,384,937 81,005,004 1,264
Other Institutional Spending 57,388,050 41,425,365 20,122,853 14,175,019 353
Student Spending 64,483,128 80,172,146 51,771,245 28,612,489 1,003
Alabama State University 214,855,399 290,154,278 183,725,042 134,454,929 2,791
Wages, Salaries, Benefits 69,068,789 136,801,655 106,820,923 89,337,595 1,669
Other Institutional Spending 76,236,527 71,573,572 33,143,827 22,039,780 584
Student Spending 69,550,083 81,779,051 43,760,292 23,077,554 538
Albany State University 105,133,891 142,978,890 91,875,770 66,800,941 1,493
Wages, Salaries, Benefits 37,397,791 71,021,889 55,821,017 47,336,035 975
Other Institutional Spending 17,054,501 10,870,338 4,919,750 3,069,788 106
Student Spending 50,681,599 61,086,663 31,135,003 16,395,118 412
Alcorn State University 125,301,834 145,835,963 96,622,447 72,759,637 1,534
Wages, Salaries, Benefits 43,762,655 75,833,742 61,322,996 53,152,088 1,031
Other Institutional Spending 30,931,733 17,234,030 7,654,284 5,240,139 149
Student Spending 50,607,446 52,768,191 27,645,167 14,367,410 354
Bishop State Community College 58,728,263 83,203,625 54,430,657 39,821,469 866
Wages, Salaries, Benefits 21,628,161 42,945,544 33,718,479 28,105,633 571
Other Institutional Spending 14,653,683 12,916,851 6,161,069 4,079,086 115
Student Spending 22,446,419 27,341,230 14,551,109 7,636,750 180
Bluefield State College 38,514,812 47,485,795 31,470,444 23,526,939 490
Wages, Salaries, Benefits 13,992,076 24,447,750 19,871,798 17,135,601 336
Other Institutional Spending 7,036,806 4,296,979 1,960,995 1,364,528 36
Student Spending 17,485,930 18,741,066 9,637,651 5,026,810 118
Bowie State University 155,988,164 233,690,603 158,077,018 112,959,404 1,968
Wages, Salaries, Benefits 52,883,392 113,107,522 90,321,613 74,311,915 1,263
Other Institutional Spending 26,188,698 29,415,424 16,566,808 11,090,212 179
Student Spending 76,916,074 91,167,657 51,188,597 27,557,277 526
Institution - Public HBCUs Initial Spending (2014 dollars)
Output Impact (2014 dollars)
Value-Added Impact
(2014 dollars)
Labor IncomeImpact
(2014 dollars)
Impact(jobs)
TABLE 2
Economic Impact of Individual Public and Private HBCUs on Their Regional Economies in 2014
HBCUHBCU

UNCF PUBLIC POLICY PRIORITIES FOR THE 114TH CONGRESS
33#HBCUStrong UNCF.org/HBCUsMakeAmericaStrong
HBCUs MAKE AMERICA STRONG: THE POSITIVE ECONOMIC IMPACT OF HISTORICALLY BLACK COLLEGES AND UNIVERSITIES T E C H N I C A L R E P O R T
Central State University 66,552,937 96,900,537 65,783,775 48,958,122 940
Wages, Salaries, Benefits 26,785,622 55,222,275 43,328,492 36,174,818 654
Other Institutional Spending 14,998,851 13,233,894 6,955,669 4,604,126 106
Student Spending 24,768,464 28,444,368 15,499,614 8,179,178 180
Cheyney University of Pennsylvania 53,565,586 91,235,510 63,175,203 46,745,535 704
Wages, Salaries, Benefits 22,794,575 53,683,994 41,850,863 33,822,063 477
Other Institutional Spending 15,799,390 19,229,926 10,931,338 7,365,027 122
Student Spending 14,971,621 18,321,590 10,393,002 5,558,445 105
Coahoma Community College 49,079,365 54,201,659 36,239,387 26,617,188 557
Wages, Salaries, Benefits 15,692,965 28,130,532 22,763,247 19,201,675 361
Other Institutional Spending 16,779,806 11,322,839 4,929,186 3,160,342 95
Student Spending 16,606,594 14,748,288 8,546,954 4,255,171 101
Coppin State University 100,683,360 157,901,999 110,667,893 81,662,242 1,431
Wages, Salaries, Benefits 43,566,730 96,186,499 75,769,087 61,684,300 1,044
Other Institutional Spending 22,267,558 19,595,026 11,353,987 7,485,484 137
Student Spending 34,849,072 42,120,474 23,544,819 12,492,458 250
Delaware State University 185,257,592 243,177,508 168,317,402 125,801,311 2,235
Wages, Salaries, Benefits 74,131,225 134,618,091 110,160,616 93,761,157 1,531
Other Institutional Spending 33,371,522 26,486,407 13,320,870 9,139,642 191
Student Spending 77,754,845 82,073,010 44,835,916 22,900,512 513
Denmark Technical College 34,554,810 32,274,789 19,695,847 13,983,316 374
Wages, Salaries, Benefits 7,646,665 11,449,554 9,560,078 8,514,817 215
Other Institutional Spending 9,322,577 3,557,094 1,477,442 989,238 44
Student Spending 17,585,568 17,268,141 8,658,327 4,479,261 115
Elizabeth City State University 75,331,621 99,681,360 70,526,407 55,910,446 941
Wages, Salaries, Benefits 38,641,730 66,124,976 54,030,228 46,720,878 689
Other Institutional Spending 17,003,841 11,666,385 5,157,862 3,219,345 103
Student Spending 19,686,050 21,889,999 11,338,317 5,970,223 149
Fayetteville State University 134,826,884 168,758,867 120,114,686 93,612,616 1,737
Wages, Salaries, Benefits 63,836,855 107,688,653 88,523,201 76,471,145 1,286
Other Institutional Spending 25,112,775 13,871,709 6,517,582 4,153,539 133
Student Spending 45,877,254 47,198,505 25,073,903 12,987,932 318
Florida A&M University 408,071,056 557,368,544 373,556,307 276,272,164 5,104
Wages, Salaries, Benefits 157,914,911 305,718,893 242,496,996 202,716,506 3,219
Other Institutional Spending 102,309,701 78,027,637 38,886,889 25,110,184 726
Student Spending 147,846,444 173,622,014 92,172,422 48,445,474 1,159
Institution - Public HBCUs Initial Spending (2014 dollars)
Output Impact (2014 dollars)
Value-Added Impact
(2014 dollars)
Labor IncomeImpact
(2014 dollars)
Impact(jobs)

34 A STUDY COMMISSIONED BY UNCF
HBCUs MAKE AMERICA STRONG: THE POSITIVE ECONOMIC IMPACT OF HISTORICALLY BLACK COLLEGES AND UNIVERSITIES
Fort Valley State University 96,420,545 108,686,387 73,980,494 56,586,836 1,125
Wages, Salaries, Benefits 37,516,787 59,645,408 49,561,462 43,290,832 740
Other Institutional Spending 21,145,511 9,410,201 4,166,929 2,739,792 110
Student Spending 37,758,247 39,630,778 20,252,103 10,556,212 275
Gadsden State Community College 89,173,830 113,160,310 77,032,580 59,143,399 1,321
Wages, Salaries, Benefits 34,610,274 63,358,541 50,642,059 43,845,672 959
Other Institutional Spending 18,835,449 12,579,433 5,998,678 4,232,222 100
Student Spending 35,728,107 37,222,336 20,391,843 11,065,505 262
Grambling State University 154,931,236 172,554,575 109,707,615 78,429,265 1,524
Wages, Salaries, Benefits 40,175,662 69,398,744 56,714,664 49,025,189 828
Other Institutional Spending 39,243,003 25,347,349 11,167,234 7,531,560 201
Student Spending 75,512,571 77,808,482 41,825,717 21,872,516 495
H. Councill Trenholm State Tech. College 30,503,559 43,576,265 28,496,282 20,972,473 440
Wages, Salaries, Benefits 11,586,685 22,949,261 17,919,822 14,986,893 294
Other Institutional Spending 6,818,802 6,401,734 2,964,462 1,971,295 52
Student Spending 12,098,072 14,225,270 7,611,998 4,014,285 94
Harris-Stowe State University 38,216,063 64,536,442 41,624,633 29,531,328 674
Wages, Salaries, Benefits 13,518,395 32,318,685 24,284,225 19,586,109 473
Other Institutional Spending 8,895,450 11,351,933 5,985,926 3,868,201 74
Student Spending 15,802,218 20,865,824 11,354,482 6,077,018 127
J. F. Drake State Comm. & Tech. College 22,890,273 27,516,938 18,247,200 13,644,745 331
Wages, Salaries, Benefits 7,590,973 13,316,756 10,838,574 9,315,524 228
Other Institutional Spending 6,157,050 4,444,442 2,158,942 1,520,808 38
Student Spending 9,142,250 9,755,740 5,249,684 2,808,413 65
Jackson State University 275,295,983 417,555,763 266,756,955 191,447,021 3,818
Wages, Salaries, Benefits 93,821,580 206,591,382 157,474,682 128,984,176 2,352
Other Institutional Spending 76,945,122 82,902,842 40,675,653 26,213,021 653
Student Spending 104,529,281 128,061,539 68,606,620 36,249,824 813
Kentucky State University 89,636,135 101,633,628 69,665,540 55,211,669 1,114
Wages, Salaries, Benefits 36,133,985 60,735,009 49,614,899 43,243,668 782
Other Institutional Spending 31,100,499 18,100,763 7,835,276 5,511,038 173
Student Spending 22,401,651 22,797,856 12,215,365 6,456,963 159
Langston University 80,841,379 128,995,806 83,366,245 60,510,471 1,035
Wages, Salaries, Benefits 28,123,306 63,618,326 48,323,545 39,703,347 613
Other Institutional Spending 27,261,664 33,316,514 17,815,808 11,578,610 226
Student Spending 25,456,409 32,060,966 17,226,892 9,228,514 196
Institution - Public HBCUs Initial Spending (2014 dollars)
Output Impact (2014 dollars)
Value-Added Impact
(2014 dollars)
Labor IncomeImpact
(2014 dollars)
Impact(jobs)
TABLE 2 continued
HBCUHBCU

UNCF PUBLIC POLICY PRIORITIES FOR THE 114TH CONGRESS
35#HBCUStrong UNCF.org/HBCUsMakeAmericaStrong
HBCUs MAKE AMERICA STRONG: THE POSITIVE ECONOMIC IMPACT OF HISTORICALLY BLACK COLLEGES AND UNIVERSITIES T E C H N I C A L R E P O R T
Lawson State Comm. College-Birmingham 65,986,802 99,144,121 63,626,652 44,466,954 930
Wages, Salaries, Benefits 19,646,655 43,490,571 33,641,423 27,460,156 578
Other Institutional Spending 13,186,870 14,576,078 7,541,994 5,026,669 102
Student Spending 33,153,277 41,077,472 22,443,235 11,980,129 250
Lincoln University (MO) 68,930,426 94,760,650 64,106,881 48,965,516 996
Wages, Salaries, Benefits 30,281,038 56,704,253 44,596,698 37,970,587 741
Other Institutional Spending 14,886,997 10,843,908 5,165,551 3,437,973 81
Student Spending 23,762,391 27,212,489 14,344,632 7,556,956 174
Lincoln University (PA) 69,922,847 114,940,992 78,252,560 56,449,551 956
Wages, Salaries, Benefits 26,054,785 61,362,185 47,836,612 38,659,488 638
Other Institutional Spending 15,842,652 19,282,581 10,961,264 7,385,196 122
Student Spending 28,025,410 34,296,226 19,454,684 10,404,867 196
Mississippi Valley State University 74,090,739 83,176,806 55,523,156 42,062,633 965
Wages, Salaries, Benefits 27,295,171 45,096,923 37,005,318 31,955,553 698
Other Institutional Spending 21,068,411 12,614,436 5,177,525 3,350,441 104
Student Spending 25,727,157 25,465,447 13,340,313 6,756,639 163
Morgan State University 282,238,495 439,397,758 305,205,790 222,706,411 3,960
Wages, Salaries, Benefits 116,072,540 256,264,613 201,867,580 164,342,234 2,822
Other Institutional Spending 53,865,134 47,400,294 27,465,248 18,107,346 333
Student Spending 112,300,821 135,732,851 75,872,962 40,256,831 805
Norfolk State University 196,038,604 279,710,741 186,403,976 134,923,576 2,541
Wages, Salaries, Benefits 72,178,354 146,350,708 115,311,198 95,282,448 1,679
Other Institutional Spending 46,371,907 44,413,149 22,856,287 14,671,483 316
Student Spending 77,488,343 88,946,884 48,236,491 24,969,645 546
North Carolina A&T State University 327,203,546 488,175,815 336,255,709 248,553,578 4,325
Wages, Salaries, Benefits 144,408,440 299,124,501 234,961,302 192,946,822 3,026
Other Institutional Spending 65,666,852 53,599,810 27,570,444 17,491,810 451
Student Spending 117,128,254 135,451,504 73,723,963 38,114,946 848
North Carolina Central University 247,613,245 342,519,578 238,619,691 180,260,078 3,085
Wages, Salaries, Benefits 105,719,489 206,216,010 165,427,049 139,545,847 2,178
Other Institutional Spending 45,517,118 34,238,680 17,173,933 11,144,353 273
Student Spending 96,376,638 102,064,888 56,018,709 29,569,878 634
Prairie View A&M University 266,062,342 402,765,630 267,726,639 190,776,673 3,178
Wages, Salaries, Benefits 82,238,459 183,129,443 142,708,662 116,843,662 1,863
Other Institutional Spending 82,036,286 95,510,500 55,911,262 36,629,270 587
Student Spending 101,787,597 124,125,687 69,106,715 37,303,741 728
Institution - Public HBCUs Initial Spending (2014 dollars)
Output Impact (2014 dollars)
Value-Added Impact
(2014 dollars)
Labor IncomeImpact
(2014 dollars)
Impact(jobs)

36 A STUDY COMMISSIONED BY UNCF
HBCUs MAKE AMERICA STRONG: THE POSITIVE ECONOMIC IMPACT OF HISTORICALLY BLACK COLLEGES AND UNIVERSITIES
Savannah State University 113,301,184 149,343,773 98,470,343 71,515,887 1,589
Wages, Salaries, Benefits 37,811,431 73,966,991 58,540,405 49,343,101 1,044
Other Institutional Spending 22,222,937 13,407,545 7,001,058 4,541,416 130
Student Spending 53,266,816 61,969,237 32,928,880 17,631,370 415
Shelton State Community College 91,080,018 110,023,911 70,955,890 49,794,903 1,152
Wages, Salaries, Benefits 26,177,116 46,411,880 37,801,205 31,912,539 716
Other Institutional Spending 19,205,422 12,787,417 6,106,669 4,021,307 110
Student Spending 45,697,480 50,824,614 27,048,016 13,861,057 326
South Carolina State University 149,825,341 145,323,105 101,197,142 77,066,513 1,546
Wages, Salaries, Benefits 50,497,293 79,596,129 66,905,567 58,649,742 1,035
Other Institutional Spending 43,539,588 12,216,454 5,790,012 3,810,160 153
Student Spending 55,788,460 53,510,522 28,501,563 14,606,611 358
Southern University and A&M College 191,758,210 277,337,668 185,049,858 136,897,472 2,765
Wages, Salaries, Benefits 76,092,348 154,500,123 120,392,104 100,349,792 1,934
Other Institutional Spending 44,750,556 37,414,858 18,750,274 12,340,853 300
Student Spending 70,915,306 85,422,687 45,907,480 24,206,827 531
Southern University at New Orleans 70,721,775 104,864,135 68,228,064 48,254,976 895
Wages, Salaries, Benefits 22,746,169 49,593,057 38,365,973 31,395,600 533
Other Institutional Spending 16,954,895 17,116,011 8,975,738 5,843,874 126
Student Spending 31,020,711 38,155,067 20,886,353 11,015,502 236
Southern University at Shreveport 63,695,471 86,272,286 52,996,235 36,325,869 777
Wages, Salaries, Benefits 16,364,307 34,003,777 26,187,262 21,697,243 436
Other Institutional Spending 15,388,248 14,429,557 6,883,542 4,347,474 104
Student Spending 31,942,916 37,838,952 19,925,431 10,281,152 237
St. Philip’s College 133,869,202 203,840,782 127,057,158 89,530,066 2,546
Wages, Salaries, Benefits 37,619,336 84,408,061 64,091,869 52,845,081 1,751
Other Institutional Spending 34,776,805 41,076,576 20,962,068 13,963,477 295
Student Spending 61,473,061 78,356,145 42,003,221 22,721,508 500
Tennessee State University 264,146,970 457,784,931 308,216,430 229,167,930 3,699
Wages, Salaries, Benefits 106,295,381 254,672,686 196,798,304 162,179,576 2,408
Other Institutional Spending 63,399,832 81,933,540 44,055,651 29,698,857 556
Student Spending 94,451,757 121,178,705 67,362,475 37,289,497 735
Texas Southern University 353,916,644 530,134,200 348,288,788 243,458,517 4,023
Wages, Salaries, Benefits 102,049,257 227,244,331 177,087,119 144,990,666 2,224
Other Institutional Spending 77,010,199 89,658,897 52,485,770 34,385,119 548
Student Spending 174,857,188 213,230,972 118,715,899 64,082,732 1,251
Institution - Public HBCUs Initial Spending (2014 dollars)
Output Impact (2014 dollars)
Value-Added Impact
(2014 dollars)
Labor IncomeImpact
(2014 dollars)
Impact(jobs)
TABLE 2 continued
HBCUHBCU

UNCF PUBLIC POLICY PRIORITIES FOR THE 114TH CONGRESS
37#HBCUStrong UNCF.org/HBCUsMakeAmericaStrong
HBCUs MAKE AMERICA STRONG: THE POSITIVE ECONOMIC IMPACT OF HISTORICALLY BLACK COLLEGES AND UNIVERSITIES T E C H N I C A L R E P O R T
University of Arkansas at Pine Bluff 86,112,103 99,552,299 69,393,118 53,105,520 1,120
Wages, Salaries, Benefits 35,913,479 60,328,789 49,789,803 42,867,207 847
Other Institutional Spending 25,037,156 13,147,550 6,106,204 3,415,675 105
Student Spending 25,161,468 26,075,960 13,497,111 6,822,638 168
University of Maryland Eastern Shore 146,010,099 210,889,564 142,748,846 104,012,826 1,968
Wages, Salaries, Benefits 60,652,909 120,427,678 95,263,684 78,871,911 1,378
Other Institutional Spending 22,348,599 18,721,396 8,766,734 5,850,746 142
Student Spending 63,008,591 71,740,490 38,718,428 19,290,169 448
University of the District of Columbia 201,874,345 313,391,597 213,941,676 156,097,169 2,526
Wages, Salaries, Benefits 73,998,647 161,399,707 128,288,198 105,145,584 1,628
Other Institutional Spending 55,730,367 65,244,088 36,863,851 24,646,973 399
Student Spending 72,145,331 86,747,802 48,789,627 26,304,612 499
University of the Virgin Islands 97,646,490 139,501,971 94,575,052 68,219,077 1,461
Wages, Salaries, Benefits 38,925,131 77,850,262 62,280,210 50,602,670 1,047
Other Institutional Spending 29,379,738 26,441,764 14,689,869 8,813,921 194
Student Spending 29,341,621 35,209,945 17,604,973 8,802,486 220
Virginia State University 167,376,513 269,509,913 177,647,350 126,463,097 2,644
Wages, Salaries, Benefits 62,137,805 141,049,143 108,383,440 87,697,608 1,828
Other Institutional Spending 33,975,021 36,982,050 19,143,542 12,172,592 263
Student Spending 71,263,687 91,478,720 50,120,368 26,592,897 553
West Virginia State University 67,191,813 94,311,196 64,700,783 48,210,388 876
Wages, Salaries, Benefits 25,472,781 51,736,394 41,585,802 34,663,042 605
Other Institutional Spending 15,807,427 13,942,006 7,256,171 5,088,801 99
Student Spending 25,911,605 28,632,796 15,858,810 8,458,545 172
Winston-Salem State University 158,698,664 232,747,495 164,020,057 127,294,306 2,239
Wages, Salaries, Benefits 77,230,370 152,252,489 120,889,494 102,551,501 1,641
Other Institutional Spending 28,440,843 17,696,056 9,354,540 6,393,217 174
Student Spending 53,027,451 62,798,950 33,776,023 18,349,588 424
Institution - Public HBCUs Initial Spending (2014 dollars)
Output Impact (2014 dollars)
Value-Added Impact
(2014 dollars)
Labor IncomeImpact
(2014 dollars)
Impact(jobs)

38 A STUDY COMMISSIONED BY UNCF
HBCUs MAKE AMERICA STRONG: THE POSITIVE ECONOMIC IMPACT OF HISTORICALLY BLACK COLLEGES AND UNIVERSITIES
Private HBCU Total 3,472,353,808 5,217,858,747 3,589,906,914 2,527,116,517 44,158
Wages, Salaries, Benefits 1,340,309,271 2,825,181,139 2,233,722,082 1,843,093,067 29,183
Other Institutional Spending 1,094,916,821 1,155,831,093 680,888,420 324,960,713 7,333
Student Spending 1,037,127,716 1,236,846,515 675,296,412 359,062,737 7,642
Allen University 17,014,730 22,199,075 13,940,236 8,878,173 229
Wages, Salaries, Benefits 3,934,465 8,158,886 6,300,377 5,196,484 136
Other Institutional Spending 7,194,825 6,936,495 3,871,242 1,714,478 48
Student Spending 5,885,440 7,103,694 3,768,617 1,967,211 45
Arkansas Baptist College 24,274,808 35,125,920 23,274,500 15,483,078 360
Wages, Salaries, Benefits 7,586,401 16,281,255 12,733,907 10,307,891 241
Other Institutional Spending 5,810,325 6,151,851 3,597,273 1,589,610 40
Student Spending 10,878,082 12,692,814 6,943,320 3,585,577 79
Benedict College 95,116,349 129,742,625 81,353,150 52,991,703 1,218
Wages, Salaries, Benefits 23,750,255 49,250,819 38,031,997 31,368,385 695
Other Institutional Spending 23,250,916 22,416,093 12,510,371 5,540,536 157
Student Spending 48,115,178 58,075,713 30,810,782 16,082,782 366
Bennett College 25,316,731 35,989,023 24,702,680 16,894,348 369
Wages, Salaries, Benefits 9,321,425 19,308,197 15,166,525 12,454,531 262
Other Institutional Spending 7,212,746 6,524,345 4,008,155 1,581,867 43
Student Spending 8,782,560 10,156,481 5,528,000 2,857,950 64
Bethune-Cookman University 110,656,616 136,347,128 87,887,063 59,359,998 1,469
Wages, Salaries, Benefits 30,478,097 56,039,293 45,176,076 38,168,825 912
Other Institutional Spending 25,626,760 18,729,775 10,082,943 4,294,165 150
Student Spending 54,551,759 61,578,060 32,628,044 16,897,008 407
Claflin University 75,899,766 79,172,028 53,205,674 37,874,310 835
Wages, Salaries, Benefits 22,690,259 35,765,418 30,063,090 26,353,449 531
Other Institutional Spending 14,305,678 6,091,290 3,267,148 1,335,007 54
Student Spending 38,903,829 37,315,320 19,875,436 10,185,854 250
Clark Atlanta University 119,350,845 203,928,911 137,033,094 94,119,643 1,708
Wages, Salaries, Benefits 45,400,045 106,320,740 81,677,992 65,521,264 1,107
Other Institutional Spending 28,239,165 36,599,605 21,583,913 10,412,424 230
Student Spending 45,711,635 61,008,566 33,771,189 18,185,955 371
Clinton College 4,957,946 8,256,727 5,685,825 3,983,314 107
Wages, Salaries, Benefits 2,128,254 4,695,831 3,661,997 2,967,838 86
Other Institutional Spending 978,392 1,169,692 704,093 315,631 7
Student Spending 1,851,300 2,391,204 1,319,735 699,845 14
Institution - Private HBCUs Initial Spending (2014 dollars)
Output Impact (2014 dollars)
Value-Added Impact
(2014 dollars)
Labor IncomeImpact
(2014 dollars)
Impact(jobs)
TABLE 2 continued
HBCUHBCU

UNCF PUBLIC POLICY PRIORITIES FOR THE 114TH CONGRESS
39#HBCUStrong UNCF.org/HBCUsMakeAmericaStrong
HBCUs MAKE AMERICA STRONG: THE POSITIVE ECONOMIC IMPACT OF HISTORICALLY BLACK COLLEGES AND UNIVERSITIES T E C H N I C A L R E P O R T
Concordia College Alabama 15,329,641 14,270,656 8,913,470 6,211,155 185
Wages, Salaries, Benefits 3,299,150 5,465,681 4,501,008 3,940,592 123
Other Institutional Spending 5,769,391 2,598,567 1,166,597 572,297 20
Student Spending 6,261,100 6,206,408 3,245,865 1,698,266 42
Dillard University 56,145,956 82,528,098 54,204,831 36,479,283 778
Wages, Salaries, Benefits 17,071,030 37,219,655 28,793,714 23,562,440 488
Other Institutional Spending 21,915,334 24,202,372 13,857,505 6,823,446 160
Student Spending 17,159,592 21,106,071 11,553,612 6,093,397 130
Edward Waters College 32,187,789 46,994,260 29,814,514 19,703,471 497
Wages, Salaries, Benefits 8,152,032 18,599,110 14,165,472 11,565,180 299
Other Institutional Spending 12,109,745 12,957,871 7,297,226 3,630,927 98
Student Spending 11,926,012 15,437,279 8,351,816 4,507,364 100
Fisk University 30,504,124 52,395,879 35,638,626 25,445,810 483
Wages, Salaries, Benefits 11,838,192 28,363,077 21,917,567 18,062,054 335
Other Institutional Spending 9,119,506 11,785,026 6,912,598 3,614,831 74
Student Spending 9,546,426 12,247,776 6,808,461 3,768,925 74
Florida Memorial University 56,886,166 92,729,535 58,672,761 38,482,424 747
Wages, Salaries, Benefits 15,399,153 36,927,418 27,879,543 22,469,031 384
Other Institutional Spending 16,951,513 23,017,134 12,907,910 6,385,842 158
Student Spending 24,535,500 32,784,983 17,885,308 9,627,551 205
Hampton University 200,898,406 270,018,328 177,087,938 114,658,457 2,249
Wages, Salaries, Benefits 54,631,084 110,771,867 87,277,908 72,118,344 1,254
Other Institutional Spending 80,200,143 83,409,635 48,683,211 21,250,794 530
Student Spending 66,067,179 75,836,826 41,126,819 21,289,319 465
Howard University 959,031,236 1,512,415,071 1,114,257,939 816,112,520 9,591
Wages, Salaries, Benefits 473,065,000 967,149,435 783,692,153 650,261,077 6,582
Other Institutional Spending 306,427,000 338,112,538 214,066,470 103,026,844 1,829
Student Spending 179,539,236 207,153,098 116,499,316 62,824,599 1,180
Huston-Tillotson University 29,423,777 46,667,154 30,305,095 20,457,419 427
Wages, Salaries, Benefits 9,244,655 20,644,803 15,942,348 12,975,372 264
Other Institutional Spending 7,257,176 9,323,587 5,273,391 2,621,978 61
Student Spending 12,921,946 16,698,764 9,089,356 4,860,069 102
Institution - Public HBCUs Initial Spending (2014 dollars)
Output Impact (2014 dollars)
Value-Added Impact
(2014 dollars)
Labor IncomeImpact
(2014 dollars)
Impact(jobs)

40 A STUDY COMMISSIONED BY UNCF
HBCUs MAKE AMERICA STRONG: THE POSITIVE ECONOMIC IMPACT OF HISTORICALLY BLACK COLLEGES AND UNIVERSITIES
Interdenominational Theological Center 9,648,611 16,644,336 11,392,777 7,797,538 148
Wages, Salaries, Benefits 3,913,111 9,163,972 7,039,972 5,647,395 102
Other Institutional Spending 4,522,125 5,860,939 3,456,375 1,667,411 36
Student Spending 1,213,375 1,619,425 896,430 482,732 10
Jarvis Christian College 16,983,528 21,563,176 13,698,022 9,960,629 267
Wages, Salaries, Benefits 5,293,628 10,759,246 8,292,948 7,042,493 192
Other Institutional Spending 7,969,304 6,399,037 3,107,976 1,673,790 47
Student Spending 3,720,596 4,404,893 2,297,098 1,244,346 28
Johnson C. Smith University 55,279,343 89,164,804 60,606,390 41,378,607 824
Wages, Salaries, Benefits 20,938,383 46,198,953 36,027,798 29,198,451 566
Other Institutional Spending 14,463,960 17,292,024 10,408,889 4,666,077 104
Student Spending 19,877,000 25,673,827 14,169,703 7,514,079 154
Lane College 29,925,452 36,428,355 23,997,933 17,827,714 475
Wages, Salaries, Benefits 9,589,326 17,455,622 14,016,321 12,226,825 337
Other Institutional Spending 6,008,846 3,751,422 1,886,320 1,165,879 33
Student Spending 14,327,280 15,221,311 8,095,292 4,435,010 105
LeMoyne-Owen College 26,025,209 39,667,669 26,656,776 18,694,601 425
Wages, Salaries, Benefits 9,128,068 20,298,629 15,664,108 12,981,021 302
Other Institutional Spending 6,481,637 6,887,342 4,162,641 2,010,696 45
Student Spending 10,415,504 12,481,698 6,830,027 3,702,884 78
Livingstone College 37,204,648 56,322,944 37,236,034 23,983,452 512
Wages, Salaries, Benefits 10,535,398 23,245,556 18,127,818 14,691,550 312
Other Institutional Spending 14,249,770 17,035,954 10,254,750 4,596,980 104
Student Spending 12,419,480 16,041,434 8,853,466 4,694,922 96
Meharry Medical College 146,844,452 287,196,872 207,329,666 158,026,210 2,207
Wages, Salaries, Benefits 88,405,950 211,811,468 163,677,301 134,884,878 1,735
Other Institutional Spending 44,063,351 56,942,529 33,400,087 17,466,032 360
Student Spending 14,375,151 18,442,875 10,252,278 5,675,300 112
Miles College 45,334,758 67,307,882 43,243,374 28,652,841 730
Wages, Salaries, Benefits 12,267,349 27,155,463 21,005,666 17,146,090 483
Other Institutional Spending 9,204,185 10,585,487 6,083,413 2,883,638 67
Student Spending 23,863,224 29,566,932 16,154,295 8,623,113 180
Morehouse College 115,114,805 188,251,910 124,544,666 83,092,436 1,580
Wages, Salaries, Benefits 36,522,347 84,530,377 65,706,366 52,708,986 940
Other Institutional Spending 30,353,673 39,340,133 23,200,084 11,192,091 249
Student Spending 48,238,785 64,381,400 35,638,216 19,191,359 391
Institution - Private HBCUs Initial Spending (2014 dollars)
Output Impact (2014 dollars)
Value-Added Impact
(2014 dollars)
Labor IncomeImpact
(2014 dollars)
Impact(jobs)
TABLE 2 continued
HBCUHBCU
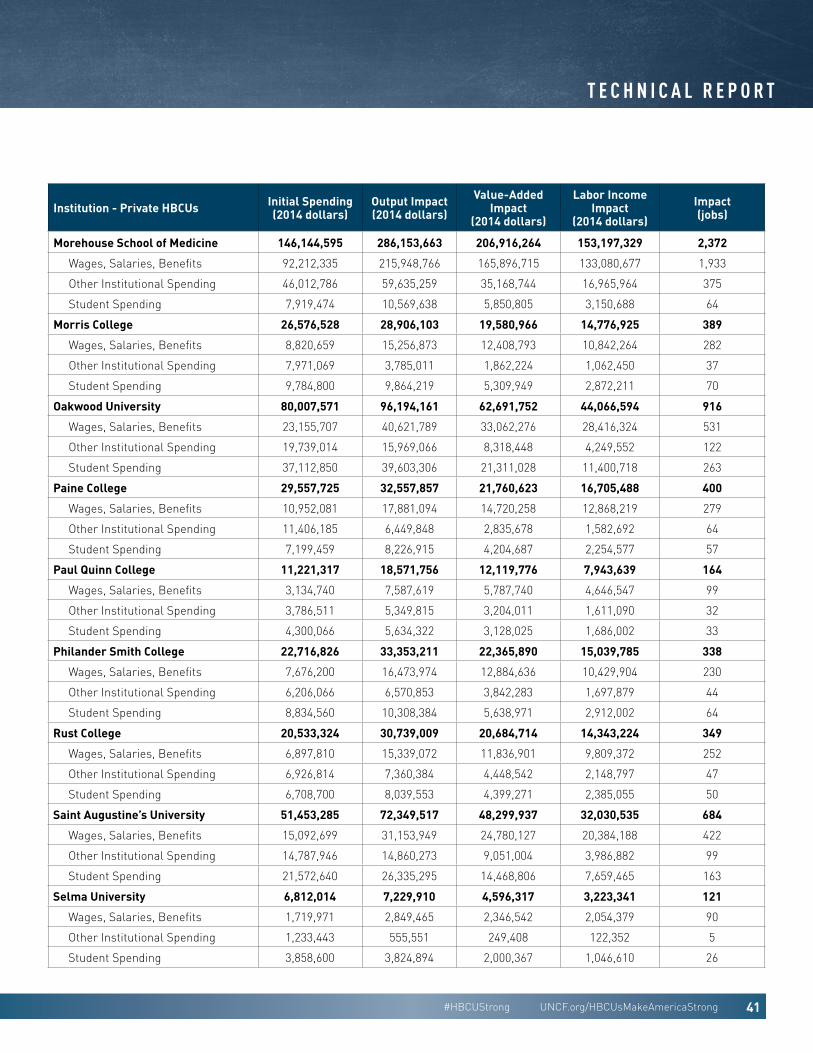
UNCF PUBLIC POLICY PRIORITIES FOR THE 114TH CONGRESS
41#HBCUStrong UNCF.org/HBCUsMakeAmericaStrong
HBCUs MAKE AMERICA STRONG: THE POSITIVE ECONOMIC IMPACT OF HISTORICALLY BLACK COLLEGES AND UNIVERSITIES T E C H N I C A L R E P O R T
Morehouse School of Medicine 146,144,595 286,153,663 206,916,264 153,197,329 2,372
Wages, Salaries, Benefits 92,212,335 215,948,766 165,896,715 133,080,677 1,933
Other Institutional Spending 46,012,786 59,635,259 35,168,744 16,965,964 375
Student Spending 7,919,474 10,569,638 5,850,805 3,150,688 64
Morris College 26,576,528 28,906,103 19,580,966 14,776,925 389
Wages, Salaries, Benefits 8,820,659 15,256,873 12,408,793 10,842,264 282
Other Institutional Spending 7,971,069 3,785,011 1,862,224 1,062,450 37
Student Spending 9,784,800 9,864,219 5,309,949 2,872,211 70
Oakwood University 80,007,571 96,194,161 62,691,752 44,066,594 916
Wages, Salaries, Benefits 23,155,707 40,621,789 33,062,276 28,416,324 531
Other Institutional Spending 19,739,014 15,969,066 8,318,448 4,249,552 122
Student Spending 37,112,850 39,603,306 21,311,028 11,400,718 263
Paine College 29,557,725 32,557,857 21,760,623 16,705,488 400
Wages, Salaries, Benefits 10,952,081 17,881,094 14,720,258 12,868,219 279
Other Institutional Spending 11,406,185 6,449,848 2,835,678 1,582,692 64
Student Spending 7,199,459 8,226,915 4,204,687 2,254,577 57
Paul Quinn College 11,221,317 18,571,756 12,119,776 7,943,639 164
Wages, Salaries, Benefits 3,134,740 7,587,619 5,787,740 4,646,547 99
Other Institutional Spending 3,786,511 5,349,815 3,204,011 1,611,090 32
Student Spending 4,300,066 5,634,322 3,128,025 1,686,002 33
Philander Smith College 22,716,826 33,353,211 22,365,890 15,039,785 338
Wages, Salaries, Benefits 7,676,200 16,473,974 12,884,636 10,429,904 230
Other Institutional Spending 6,206,066 6,570,853 3,842,283 1,697,879 44
Student Spending 8,834,560 10,308,384 5,638,971 2,912,002 64
Rust College 20,533,324 30,739,009 20,684,714 14,343,224 349
Wages, Salaries, Benefits 6,897,810 15,339,072 11,836,901 9,809,372 252
Other Institutional Spending 6,926,814 7,360,384 4,448,542 2,148,797 47
Student Spending 6,708,700 8,039,553 4,399,271 2,385,055 50
Saint Augustine’s University 51,453,285 72,349,517 48,299,937 32,030,535 684
Wages, Salaries, Benefits 15,092,699 31,153,949 24,780,127 20,384,188 422
Other Institutional Spending 14,787,946 14,860,273 9,051,004 3,986,882 99
Student Spending 21,572,640 26,335,295 14,468,806 7,659,465 163
Selma University 6,812,014 7,229,910 4,596,317 3,223,341 121
Wages, Salaries, Benefits 1,719,971 2,849,465 2,346,542 2,054,379 90
Other Institutional Spending 1,233,443 555,551 249,408 122,352 5
Student Spending 3,858,600 3,824,894 2,000,367 1,046,610 26
Institution - Private HBCUs Initial Spending (2014 dollars)
Output Impact (2014 dollars)
Value-Added Impact
(2014 dollars)
Labor IncomeImpact
(2014 dollars)
Impact(jobs)

42 A STUDY COMMISSIONED BY UNCF
HBCUs MAKE AMERICA STRONG: THE POSITIVE ECONOMIC IMPACT OF HISTORICALLY BLACK COLLEGES AND UNIVERSITIES
Shaw University 64,587,103 88,386,596 59,067,989 38,441,415 847
Wages, Salaries, Benefits 17,731,638 36,601,177 29,112,901 23,948,338 514
Other Institutional Spending 25,080,652 25,203,320 15,350,686 6,761,831 169
Student Spending 21,774,813 26,582,099 14,604,402 7,731,246 164
Shorter College 8,127,987 10,724,831 6,590,692 4,034,033 102
Wages, Salaries, Benefits 1,364,768 2,928,943 2,290,787 1,854,355 53
Other Institutional Spending 884,894 936,907 547,853 242,093 6
Student Spending 5,878,325 6,858,981 3,752,052 1,937,585 43
Simmons College of Kentucky 2,133,885 3,178,582 2,089,646 1,381,497 72
Wages, Salaries, Benefits 627,391 1,412,114 1,083,468 889,589 60
Other Institutional Spending 935,260 1,058,794 621,071 286,104 8
Student Spending 571,234 707,674 385,107 205,804 4
Southwestern Christian College 6,909,692 11,708,235 7,757,438 5,071,224 127
Wages, Salaries, Benefits 2,055,311 4,974,867 3,794,766 3,046,537 89
Other Institutional Spending 3,633,515 5,133,653 3,074,553 1,545,992 29
Student Spending 1,220,866 1,599,715 888,119 478,695 9
Spelman College 116,969,347 199,396,751 133,879,523 91,772,320 1,625
Wages, Salaries, Benefits 44,073,924 103,215,145 79,292,203 63,607,408 1,033
Other Institutional Spending 28,706,033 37,204,696 21,940,751 10,584,570 233
Student Spending 44,189,390 58,976,910 32,646,569 17,580,342 359
Stillman College 22,633,559 28,179,206 19,717,149 13,799,368 346
Wages, Salaries, Benefits 8,814,237 15,627,593 12,728,246 10,745,442 261
Other Institutional Spending 9,000,858 7,192,535 4,136,891 1,592,380 51
Student Spending 4,818,464 5,359,078 2,852,012 1,461,546 34
Talladega College 18,238,353 17,429,851 11,943,324 9,347,071 232
Wages, Salaries, Benefits 6,547,593 10,239,440 8,510,139 7,497,135 180
Other Institutional Spending 7,690,728 3,139,273 1,349,842 756,298 26
Student Spending 4,000,032 4,051,138 2,083,343 1,093,638 26
Texas College 19,374,707 24,530,170 15,285,071 10,624,053 282
Wages, Salaries, Benefits 4,875,974 9,871,490 7,655,773 6,512,638 180
Other Institutional Spending 4,997,433 3,862,877 1,907,888 1,011,858 30
Student Spending 9,501,300 10,795,803 5,721,410 3,099,557 72
Tougaloo College 29,769,905 42,104,058 26,933,950 17,547,617 552
Wages, Salaries, Benefits 7,891,175 17,376,058 13,244,933 10,848,643 390
Other Institutional Spending 12,443,850 13,169,075 7,496,535 3,427,040 89
Student Spending 9,434,880 11,558,925 6,192,482 3,271,934 73
Institution - Private HBCUs Initial Spending (2014 dollars)
Output Impact (2014 dollars)
Value-Added Impact
(2014 dollars)
Labor IncomeImpact
(2014 dollars)
Impact(jobs)
TABLE 2 continued
HBCUHBCU

UNCF PUBLIC POLICY PRIORITIES FOR THE 114TH CONGRESS
43#HBCUStrong UNCF.org/HBCUsMakeAmericaStrong
HBCUs MAKE AMERICA STRONG: THE POSITIVE ECONOMIC IMPACT OF HISTORICALLY BLACK COLLEGES AND UNIVERSITIES T E C H N I C A L R E P O R T
Tuskegee University 187,969,151 241,850,750 154,419,865 104,359,268 2,081
Wages, Salaries, Benefits 52,391,984 104,336,857 81,484,177 68,157,751 1,114
Other Institutional Spending 94,025,133 89,100,605 47,256,726 22,632,877 654
Student Spending 41,552,034 48,413,288 25,678,962 13,568,640 313
Virginia Union University 56,500,385 83,612,691 52,865,613 33,779,195 842
Wages, Salaries, Benefits 13,112,488 29,764,583 22,871,373 18,506,190 512
Other Institutional Spending 13,569,097 15,620,722 9,022,403 4,145,755 98
Student Spending 29,818,800 38,227,386 20,971,837 11,127,250 232
Virginia University of Lynchburg 9,192,886 10,007,351 6,036,857 3,963,543 128
Wages, Salaries, Benefits 1,639,351 3,027,421 2,412,182 2,064,382 75
Other Institutional Spending 3,737,652 2,594,261 1,289,592 650,640 23
Student Spending 3,815,883 4,385,669 2,335,083 1,248,521 30
Voorhees College 18,678,954 17,397,012 12,066,658 8,965,127 287
Wages, Salaries, Benefits 6,050,567 9,561,263 8,000,550 7,023,466 229
Other Institutional Spending 7,971,235 3,233,477 1,677,081 711,821 28
Student Spending 4,657,152 4,602,272 2,389,027 1,229,840 30
Wilberforce University 19,972,193 26,901,113 17,792,367 12,353,485 294
Wages, Salaries, Benefits 6,001,014 12,371,927 9,707,258 8,104,558 199
Other Institutional Spending 6,921,179 6,432,882 3,673,354 1,920,835 44
Student Spending 7,050,000 8,096,304 4,411,755 2,328,092 51
Wiley College 33,510,213 35,304,929 24,297,532 18,394,552 476
Wages, Salaries, Benefits 12,224,400 18,720,991 15,817,396 14,007,359 364
Other Institutional Spending 7,051,605 2,550,991 1,195,444 615,949 23
Student Spending 14,234,208 14,032,947 7,284,692 3,771,244 89
Xavier University of Louisiana 127,406,611 199,763,066 135,463,966 95,406,756 1,715
Wages, Salaries, Benefits 50,662,197 110,457,898 85,451,970 69,926,956 1,144
Other Institutional Spending 40,512,397 44,740,220 25,616,826 12,613,742 296
Student Spending 36,232,017 44,564,948 24,395,170 12,866,058 275
Institution - Private HBCUs Initial Spending (2014 dollars)
Output Impact (2014 dollars)
Value-Added Impact
(2014 dollars)
Labor IncomeImpact
(2014 dollars)
Impact(jobs)
Notes:Initial spending for wages, salaries, and benefits and other institutional spending was obtained from the U.S. Department of Education, National Center for Educational Statistics, Integrated Postsecondary Education Data System (IPEDS), Finance Data, 2013-14. Initial spending by students was estimated by the author, based on data obtained from IPEDS, 12-month full-time equivalent (FTE) enrollment (adjusted for students enrolled exclusively in distance education), and each HBCU’s estimated cost of attendance (room and board, books and supplies, and other expenses). The IPEDS data was extracted on March 22, 2016.
The economic impacts of initial spending on output, value-added, labor income, and employment were estimated using the IMPLAN Online regional economic modeling system and production functions provided by IMPLAN Group, LLC.
Output refers to the value of total production, including domestic and foreign trade. Value-added includes employee compensation, proprietary income, other property income, and indirect business taxes. Labor income includes both the total payroll costs (including fringe benefits) of workers who are paid by employers, and payments received by self-employed individuals. Employment includes both full- and part-time jobs. All dollar amounts are expressed in 2014 dollars.
Source: Estimated for the United Negro College Fund by Dr. Jeffrey M Humphreys, Director of the Selig Center for Economic Growth, Terry College of Business, University of Georgia, 2016.

44 A STUDY COMMISSIONED BY UNCF
HBCUs MAKE AMERICA STRONG: THE POSITIVE ECONOMIC IMPACT OF HISTORICALLY BLACK COLLEGES AND UNIVERSITIES
All HBCUs 10,299,999,444 14,847,773,829 1.4
Wages, salaries, benefits 3,873,117,744 7,923,106,136 2.0
Other institutional spending 2,724,185,250 2,589,104,982 1.0
Student spending 3,702,696,450 4,335,562,711 1.2
Total for All Institutions in 2014 Initial Spending (2014 dollars)
Output Impact (2014 dollars)
OutputMultiplier
TABLE 3
Combined Economic Impact of the Nation’s HBCUs on Their Regional Economies in 2014
Notes:
Initial spending for wages, salaries, and benefits and other institutional spending was obtained from the U.S. Department of Education, National Center for Educational Statistics, Integrated Postsecondary Education Data System (IPEDS), Finance Data, 2013-14. Initial spending by students was estimated by the author, based on data obtained from IPEDS, 12-month full-time equivalent (FTE) enrollment (adjusted for students enrolled exclusively in distance education), and each HBCU’s estimated cost of attendance (room and board, books and supplies, and other expenses). The IPEDS data was extracted on March 22, 2016.
The economic impacts of initial spending on output, value-added, labor income, and employment were estimated using the IMPLAN Online regional economic modeling system and production functions provided by IMPLAN Group, LLC.
Output refers to the value of total production, including domestic and foreign trade. Value-added includes employeecompensation, proprietary income, other property income, and indirect business taxes. Labor income includes boththe total payroll costs (including fringe benefits) of workers who are paid by employers, and payments received by self-employed individuals. Employment includes both full- and part-time jobs. All dollar amounts are expressed in 2014 dollars.
Source: Estimated for the United Negro College Fund by Dr. Jeffrey M Humphreys, Director of the Selig Center for Economic Growth, Terry College of Business, University of Georgia, 2016.
HBCUHBCU
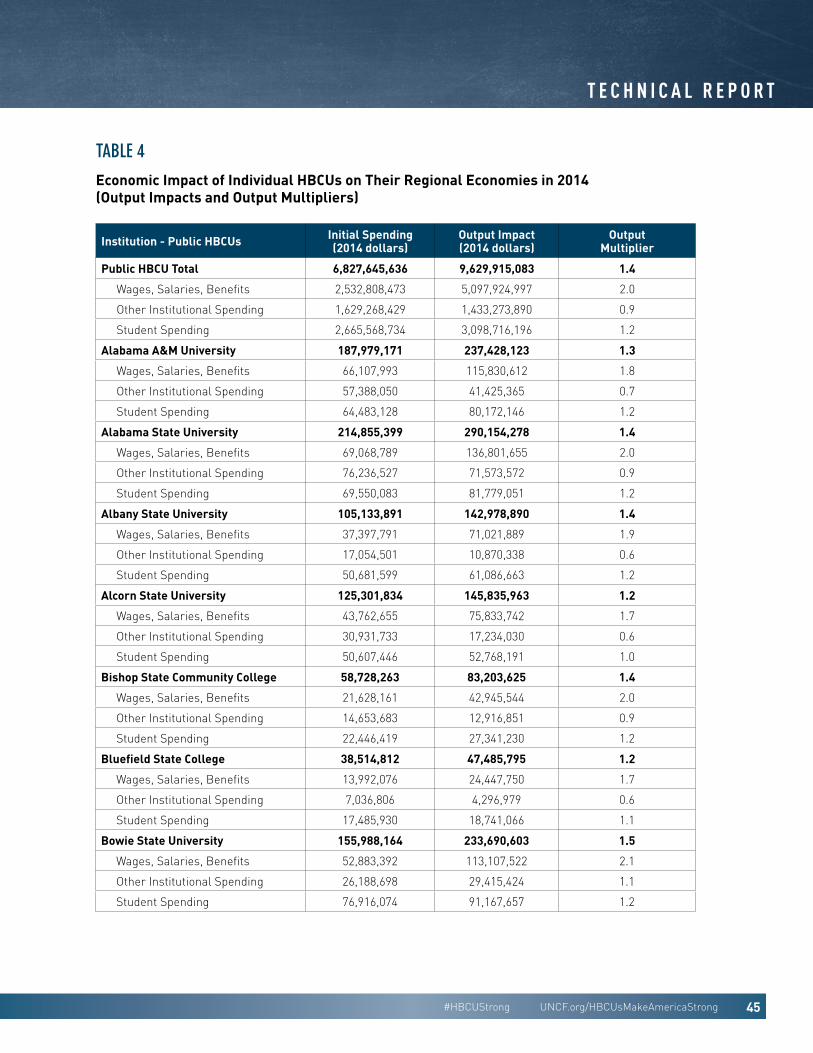
UNCF PUBLIC POLICY PRIORITIES FOR THE 114TH CONGRESS
45#HBCUStrong UNCF.org/HBCUsMakeAmericaStrong
HBCUs MAKE AMERICA STRONG: THE POSITIVE ECONOMIC IMPACT OF HISTORICALLY BLACK COLLEGES AND UNIVERSITIES T E C H N I C A L R E P O R T
Public HBCU Total 6,827,645,636 9,629,915,083 1.4
Wages, Salaries, Benefits 2,532,808,473 5,097,924,997 2.0
Other Institutional Spending 1,629,268,429 1,433,273,890 0.9
Student Spending 2,665,568,734 3,098,716,196 1.2
Alabama A&M University 187,979,171 237,428,123 1.3
Wages, Salaries, Benefits 66,107,993 115,830,612 1.8
Other Institutional Spending 57,388,050 41,425,365 0.7
Student Spending 64,483,128 80,172,146 1.2
Alabama State University 214,855,399 290,154,278 1.4
Wages, Salaries, Benefits 69,068,789 136,801,655 2.0
Other Institutional Spending 76,236,527 71,573,572 0.9
Student Spending 69,550,083 81,779,051 1.2
Albany State University 105,133,891 142,978,890 1.4
Wages, Salaries, Benefits 37,397,791 71,021,889 1.9
Other Institutional Spending 17,054,501 10,870,338 0.6
Student Spending 50,681,599 61,086,663 1.2
Alcorn State University 125,301,834 145,835,963 1.2
Wages, Salaries, Benefits 43,762,655 75,833,742 1.7
Other Institutional Spending 30,931,733 17,234,030 0.6
Student Spending 50,607,446 52,768,191 1.0
Bishop State Community College 58,728,263 83,203,625 1.4
Wages, Salaries, Benefits 21,628,161 42,945,544 2.0
Other Institutional Spending 14,653,683 12,916,851 0.9
Student Spending 22,446,419 27,341,230 1.2
Bluefield State College 38,514,812 47,485,795 1.2
Wages, Salaries, Benefits 13,992,076 24,447,750 1.7
Other Institutional Spending 7,036,806 4,296,979 0.6
Student Spending 17,485,930 18,741,066 1.1
Bowie State University 155,988,164 233,690,603 1.5
Wages, Salaries, Benefits 52,883,392 113,107,522 2.1
Other Institutional Spending 26,188,698 29,415,424 1.1
Student Spending 76,916,074 91,167,657 1.2
Institution - Public HBCUs Initial Spending (2014 dollars)
Output Impact (2014 dollars)
OutputMultiplier
TABLE 4
Economic Impact of Individual HBCUs on Their Regional Economies in 2014(Output Impacts and Output Multipliers)

46 A STUDY COMMISSIONED BY UNCF
HBCUs MAKE AMERICA STRONG: THE POSITIVE ECONOMIC IMPACT OF HISTORICALLY BLACK COLLEGES AND UNIVERSITIES
Central State University 66,552,937 96,900,537 1.5
Wages, Salaries, Benefits 26,785,622 55,222,275 2.1
Other Institutional Spending 14,998,851 13,233,894 0.9
Student Spending 24,768,464 28,444,368 1.1
Cheyney University of Pennsylvania 53,565,586 91,235,510 1.7
Wages, Salaries, Benefits 22,794,575 53,683,994 2.4
Other Institutional Spending 15,799,390 19,229,926 1.2
Student Spending 14,971,621 18,321,590 1.2
Coahoma Community College 49,079,365 54,201,659 1.1
Wages, Salaries, Benefits 15,692,965 28,130,532 1.8
Other Institutional Spending 16,779,806 11,322,839 0.7
Student Spending 16,606,594 14,748,288 0.9
Coppin State University 100,683,360 157,901,999 1.6
Wages, Salaries, Benefits 43,566,730 96,186,499 2.2
Other Institutional Spending 22,267,558 19,595,026 0.9
Student Spending 34,849,072 42,120,474 1.2
Delaware State University 185,257,592 243,177,508 1.3
Wages, Salaries, Benefits 74,131,225 134,618,091 1.8
Other Institutional Spending 33,371,522 26,486,407 0.8
Student Spending 77,754,845 82,073,010 1.1
Denmark Technical College 34,554,810 32,274,789 0.9
Wages, Salaries, Benefits 7,646,665 11,449,554 1.5
Other Institutional Spending 9,322,577 3,557,094 0.4
Student Spending 17,585,568 17,268,141 1.0
Elizabeth City State University 75,331,621 99,681,360 1.3
Wages, Salaries, Benefits 38,641,730 66,124,976 1.7
Other Institutional Spending 17,003,841 11,666,385 0.7
Student Spending 19,686,050 21,889,999 1.1
Fayetteville State University 134,826,884 168,758,867 1.3
Wages, Salaries, Benefits 63,836,855 107,688,653 1.7
Other Institutional Spending 25,112,775 13,871,709 0.6
Student Spending 45,877,254 47,198,505 1.0
Florida A&M University 408,071,056 557,368,544 1.4
Wages, Salaries, Benefits 157,914,911 305,718,893 1.9
Other Institutional Spending 102,309,701 78,027,637 0.8
Student Spending 147,846,444 173,622,014 1.2
Institution - Public HBCUs Initial Spending (2014 dollars)
Output Impact (2014 dollars)
OutputMultiplier
TABLE 4 continued
HBCUHBCU

UNCF PUBLIC POLICY PRIORITIES FOR THE 114TH CONGRESS
47#HBCUStrong UNCF.org/HBCUsMakeAmericaStrong
HBCUs MAKE AMERICA STRONG: THE POSITIVE ECONOMIC IMPACT OF HISTORICALLY BLACK COLLEGES AND UNIVERSITIES T E C H N I C A L R E P O R T
Fort Valley State University 96,420,545 108,686,387 1.1
Wages, Salaries, Benefits 37,516,787 59,645,408 1.6
Other Institutional Spending 21,145,511 9,410,201 0.4
Student Spending 37,758,247 39,630,778 1.0
Gadsden State Community College 89,173,830 113,160,310 1.3
Wages, Salaries, Benefits 34,610,274 63,358,541 1.8
Other Institutional Spending 18,835,449 12,579,433 0.7
Student Spending 35,728,107 37,222,336 1.0
Grambling State University 154,931,236 172,554,575 1.1
Wages, Salaries, Benefits 40,175,662 69,398,744 1.7
Other Institutional Spending 39,243,003 25,347,349 0.6
Student Spending 75,512,571 77,808,482 1.0
H. Councill Trenholm State Tech. College 30,503,559 43,576,265 1.4
Wages, Salaries, Benefits 11,586,685 22,949,261 2.0
Other Institutional Spending 6,818,802 6,401,734 0.9
Student Spending 12,098,072 14,225,270 1.2
Harris-Stowe State University 38,216,063 64,536,442 1.7
Wages, Salaries, Benefits 13,518,395 32,318,685 2.4
Other Institutional Spending 8,895,450 11,351,933 1.3
Student Spending 15,802,218 20,865,824 1.3
J. F. Drake State Comm. and Tech. College 22,890,273 27,516,938 1.2
Wages, Salaries, Benefits 7,590,973 13,316,756 1.8
Other Institutional Spending 6,157,050 4,444,442 0.7
Student Spending 9,142,250 9,755,740 1.1
Jackson State University 275,295,983 417,555,763 1.5
Wages, Salaries, Benefits 93,821,580 206,591,382 2.2
Other Institutional Spending 76,945,122 82,902,842 1.1
Student Spending 104,529,281 128,061,539 1.2
Kentucky State University 89,636,135 101,633,628 1.1
Wages, Salaries, Benefits 36,133,985 60,735,009 1.7
Other Institutional Spending 31,100,499 18,100,763 0.6
Student Spending 22,401,651 22,797,856 1.0
Langston University 80,841,379 128,995,806 1.6
Wages, Salaries, Benefits 28,123,306 63,618,326 2.3
Other Institutional Spending 27,261,664 33,316,514 1.2
Student Spending 25,456,409 32,060,966 1.3
Institution - Public HBCUs Initial Spending (2014 dollars)
Output Impact (2014 dollars)
OutputMultiplier
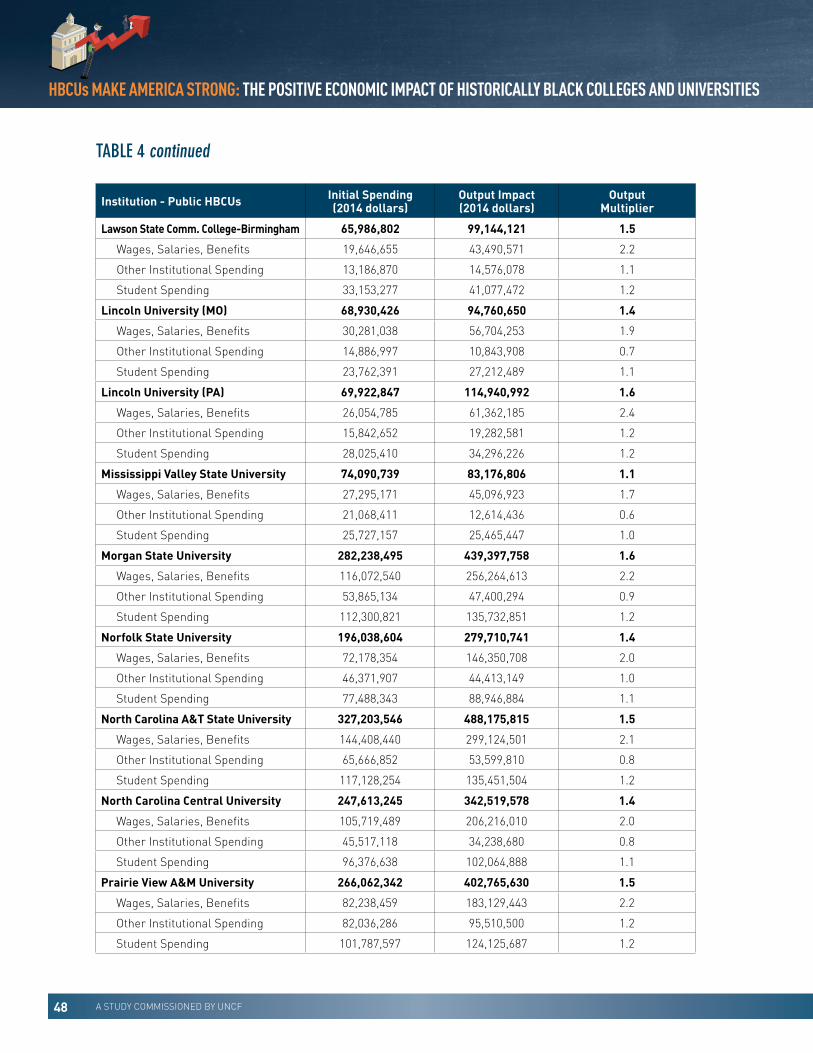
48 A STUDY COMMISSIONED BY UNCF
HBCUs MAKE AMERICA STRONG: THE POSITIVE ECONOMIC IMPACT OF HISTORICALLY BLACK COLLEGES AND UNIVERSITIES
Lawson State Comm. College-Birmingham 65,986,802 99,144,121 1.5
Wages, Salaries, Benefits 19,646,655 43,490,571 2.2
Other Institutional Spending 13,186,870 14,576,078 1.1
Student Spending 33,153,277 41,077,472 1.2
Lincoln University (MO) 68,930,426 94,760,650 1.4
Wages, Salaries, Benefits 30,281,038 56,704,253 1.9
Other Institutional Spending 14,886,997 10,843,908 0.7
Student Spending 23,762,391 27,212,489 1.1
Lincoln University (PA) 69,922,847 114,940,992 1.6
Wages, Salaries, Benefits 26,054,785 61,362,185 2.4
Other Institutional Spending 15,842,652 19,282,581 1.2
Student Spending 28,025,410 34,296,226 1.2
Mississippi Valley State University 74,090,739 83,176,806 1.1
Wages, Salaries, Benefits 27,295,171 45,096,923 1.7
Other Institutional Spending 21,068,411 12,614,436 0.6
Student Spending 25,727,157 25,465,447 1.0
Morgan State University 282,238,495 439,397,758 1.6
Wages, Salaries, Benefits 116,072,540 256,264,613 2.2
Other Institutional Spending 53,865,134 47,400,294 0.9
Student Spending 112,300,821 135,732,851 1.2
Norfolk State University 196,038,604 279,710,741 1.4
Wages, Salaries, Benefits 72,178,354 146,350,708 2.0
Other Institutional Spending 46,371,907 44,413,149 1.0
Student Spending 77,488,343 88,946,884 1.1
North Carolina A&T State University 327,203,546 488,175,815 1.5
Wages, Salaries, Benefits 144,408,440 299,124,501 2.1
Other Institutional Spending 65,666,852 53,599,810 0.8
Student Spending 117,128,254 135,451,504 1.2
North Carolina Central University 247,613,245 342,519,578 1.4
Wages, Salaries, Benefits 105,719,489 206,216,010 2.0
Other Institutional Spending 45,517,118 34,238,680 0.8
Student Spending 96,376,638 102,064,888 1.1
Prairie View A&M University 266,062,342 402,765,630 1.5
Wages, Salaries, Benefits 82,238,459 183,129,443 2.2
Other Institutional Spending 82,036,286 95,510,500 1.2
Student Spending 101,787,597 124,125,687 1.2
Institution - Public HBCUs Initial Spending (2014 dollars)
Output Impact (2014 dollars)
OutputMultiplier
TABLE 4 continued
HBCUHBCU
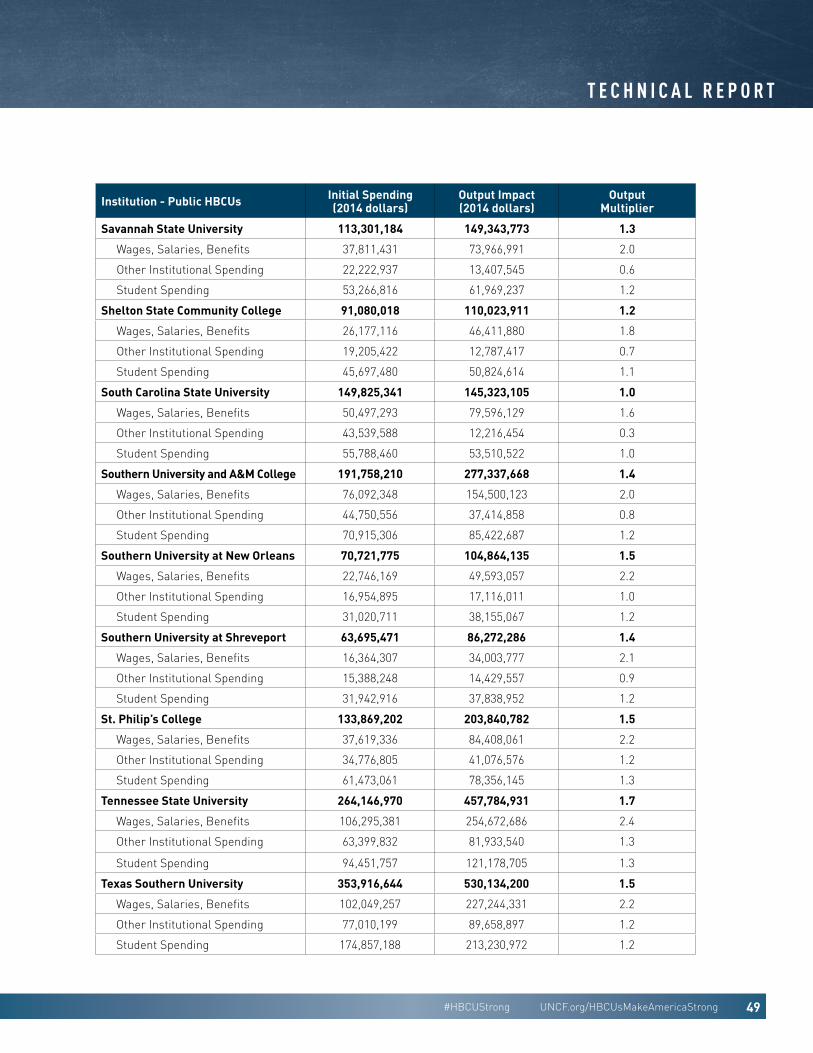
UNCF PUBLIC POLICY PRIORITIES FOR THE 114TH CONGRESS
49#HBCUStrong UNCF.org/HBCUsMakeAmericaStrong
HBCUs MAKE AMERICA STRONG: THE POSITIVE ECONOMIC IMPACT OF HISTORICALLY BLACK COLLEGES AND UNIVERSITIES T E C H N I C A L R E P O R T
Savannah State University 113,301,184 149,343,773 1.3
Wages, Salaries, Benefits 37,811,431 73,966,991 2.0
Other Institutional Spending 22,222,937 13,407,545 0.6
Student Spending 53,266,816 61,969,237 1.2
Shelton State Community College 91,080,018 110,023,911 1.2
Wages, Salaries, Benefits 26,177,116 46,411,880 1.8
Other Institutional Spending 19,205,422 12,787,417 0.7
Student Spending 45,697,480 50,824,614 1.1
South Carolina State University 149,825,341 145,323,105 1.0
Wages, Salaries, Benefits 50,497,293 79,596,129 1.6
Other Institutional Spending 43,539,588 12,216,454 0.3
Student Spending 55,788,460 53,510,522 1.0
Southern University and A&M College 191,758,210 277,337,668 1.4
Wages, Salaries, Benefits 76,092,348 154,500,123 2.0
Other Institutional Spending 44,750,556 37,414,858 0.8
Student Spending 70,915,306 85,422,687 1.2
Southern University at New Orleans 70,721,775 104,864,135 1.5
Wages, Salaries, Benefits 22,746,169 49,593,057 2.2
Other Institutional Spending 16,954,895 17,116,011 1.0
Student Spending 31,020,711 38,155,067 1.2
Southern University at Shreveport 63,695,471 86,272,286 1.4
Wages, Salaries, Benefits 16,364,307 34,003,777 2.1
Other Institutional Spending 15,388,248 14,429,557 0.9
Student Spending 31,942,916 37,838,952 1.2
St. Philip’s College 133,869,202 203,840,782 1.5
Wages, Salaries, Benefits 37,619,336 84,408,061 2.2
Other Institutional Spending 34,776,805 41,076,576 1.2
Student Spending 61,473,061 78,356,145 1.3
Tennessee State University 264,146,970 457,784,931 1.7
Wages, Salaries, Benefits 106,295,381 254,672,686 2.4
Other Institutional Spending 63,399,832 81,933,540 1.3
Student Spending 94,451,757 121,178,705 1.3
Texas Southern University 353,916,644 530,134,200 1.5
Wages, Salaries, Benefits 102,049,257 227,244,331 2.2
Other Institutional Spending 77,010,199 89,658,897 1.2
Student Spending 174,857,188 213,230,972 1.2
Institution - Public HBCUs Initial Spending (2014 dollars)
Output Impact (2014 dollars)
OutputMultiplier

50 A STUDY COMMISSIONED BY UNCF
HBCUs MAKE AMERICA STRONG: THE POSITIVE ECONOMIC IMPACT OF HISTORICALLY BLACK COLLEGES AND UNIVERSITIES
University of Arkansas at Pine Bluff 86,112,103 99,552,299 1.2
Wages, Salaries, Benefits 35,913,479 60,328,789 1.7
Other Institutional Spending 25,037,156 13,147,550 0.5
Student Spending 25,161,468 26,075,960 1.0
University of Maryland Eastern Shore 146,010,099 210,889,564 1.4
Wages, Salaries, Benefits 60,652,909 120,427,678 2.0
Other Institutional Spending 22,348,599 18,721,396 0.8
Student Spending 63,008,591 71,740,490 1.1
University of the District of Columbia 201,874,345 313,391,597 1.6
Wages, Salaries, Benefits 73,998,647 161,399,707 2.2
Other Institutional Spending 55,730,367 65,244,088 1.2
Student Spending 72,145,331 86,747,802 1.2
University of the Virgin Islands 97,646,490 139,501,971 1.4
Wages, Salaries, Benefits 38,925,131 77,850,262 2.0
Other Institutional Spending 29,379,738 26,441,764 0.9
Student Spending 29,341,621 35,209,945 1.2
Virginia State University 167,376,513 269,509,913 1.6
Wages, Salaries, Benefits 62,137,805 141,049,143 2.3
Other Institutional Spending 33,975,021 36,982,050 1.1
Student Spending 71,263,687 91,478,720 1.3
West Virginia State University 67,191,813 94,311,196 1.4
Wages, Salaries, Benefits 25,472,781 51,736,394 2.0
Other Institutional Spending 15,807,427 13,942,006 0.9
Student Spending 25,911,605 28,632,796 1.1
Winston-Salem State University 158,698,664 232,747,495 1.5
Wages, Salaries, Benefits 77,230,370 152,252,489 2.0
Other Institutional Spending 28,440,843 17,696,056 0.6
Student Spending 53,027,451 62,798,950 1.2
Institution - Public HBCUs Initial Spending (2014 dollars)
Output Impact (2014 dollars)
OutputMultiplier
TABLE 4 continued
HBCUHBCU

UNCF PUBLIC POLICY PRIORITIES FOR THE 114TH CONGRESS
51#HBCUStrong UNCF.org/HBCUsMakeAmericaStrong
HBCUs MAKE AMERICA STRONG: THE POSITIVE ECONOMIC IMPACT OF HISTORICALLY BLACK COLLEGES AND UNIVERSITIES T E C H N I C A L R E P O R T
Private HBCU Total 3,472,353,808 5,217,858,747 1.5
Wages, Salaries, Benefits 1,340,309,271 2,825,181,139 2.1
Other Institutional Spending 1,094,916,821 1,155,831,093 1.1
Student Spending 1,037,127,716 1,236,846,515 1.2
Allen University 17,014,730 22,199,075 1.3
Wages, Salaries, Benefits 3,934,465 8,158,886 2.1
Other Institutional Spending 7,194,825 6,936,495 1.0
Student Spending 5,885,440 7,103,694 1.2
Arkansas Baptist College 24,274,808 35,125,920 1.4
Wages, Salaries, Benefits 7,586,401 16,281,255 2.1
Other Institutional Spending 5,810,325 6,151,851 1.1
Student Spending 10,878,082 12,692,814 1.2
Benedict College 95,116,349 129,742,625 1.4
Wages, Salaries, Benefits 23,750,255 49,250,819 2.1
Other Institutional Spending 23,250,916 22,416,093 1.0
Student Spending 48,115,178 58,075,713 1.2
Bennett College 25,316,731 35,989,023 1.4
Wages, Salaries, Benefits 9,321,425 19,308,197 2.1
Other Institutional Spending 7,212,746 6,524,345 0.9
Student Spending 8,782,560 10,156,481 1.2
Bethune-Cookman University 110,656,616 136,347,128 1.2
Wages, Salaries, Benefits 30,478,097 56,039,293 1.8
Other Institutional Spending 25,626,760 18,729,775 0.7
Student Spending 54,551,759 61,578,060 1.1
Claflin University 75,899,766 79,172,028 1.0
Wages, Salaries, Benefits 22,690,259 35,765,418 1.6
Other Institutional Spending 14,305,678 6,091,290 0.4
Student Spending 38,903,829 37,315,320 1.0
Clark Atlanta University 119,350,845 203,928,911 1.7
Wages, Salaries, Benefits 45,400,045 106,320,740 2.3
Other Institutional Spending 28,239,165 36,599,605 1.3
Student Spending 45,711,635 61,008,566 1.3
Clinton College 4,957,946 8,256,727 1.7
Wages, Salaries, Benefits 2,128,254 4,695,831 2.2
Other Institutional Spending 978,392 1,169,692 1.2
Student Spending 1,851,300 2,391,204 1.3
Institution - Private HBCUs Initial Spending (2014 dollars)
Output Impact (2014 dollars)
OutputMultiplier

52 A STUDY COMMISSIONED BY UNCF
HBCUs MAKE AMERICA STRONG: THE POSITIVE ECONOMIC IMPACT OF HISTORICALLY BLACK COLLEGES AND UNIVERSITIES
Concordia College Alabama 15,329,641 14,270,656 0.9
Wages, Salaries, Benefits 3,299,150 5,465,681 1.7
Other Institutional Spending 5,769,391 2,598,567 0.5
Student Spending 6,261,100 6,206,408 1.0
Dillard University 56,145,956 82,528,098 1.5
Wages, Salaries, Benefits 17,071,030 37,219,655 2.2
Other Institutional Spending 21,915,334 24,202,372 1.1
Student Spending 17,159,592 21,106,071 1.2
Edward Waters College 32,187,789 46,994,260 1.5
Wages, Salaries, Benefits 8,152,032 18,599,110 2.3
Other Institutional Spending 12,109,745 12,957,871 1.1
Student Spending 11,926,012 15,437,279 1.3
Fisk University 30,504,124 52,395,879 1.7
Wages, Salaries, Benefits 11,838,192 28,363,077 2.4
Other Institutional Spending 9,119,506 11,785,026 1.3
Student Spending 9,546,426 12,247,776 1.3
Florida Memorial University 56,886,166 92,729,535 1.6
Wages, Salaries, Benefits 15,399,153 36,927,418 2.4
Other Institutional Spending 16,951,513 23,017,134 1.4
Student Spending 24,535,500 32,784,983 1.3
Hampton University 200,898,406 270,018,328 1.3
Wages, Salaries, Benefits 54,631,084 110,771,867 2.0
Other Institutional Spending 80,200,143 83,409,635 1.0
Student Spending 66,067,179 75,836,826 1.1
Howard University 959,031,236 1,512,415,071 1.6
Wages, Salaries, Benefits 473,065,000 967,149,435 2.0
Other Institutional Spending 306,427,000 338,112,538 1.1
Student Spending 179,539,236 207,153,098 1.2
Huston-Tillotson University 29,423,777 46,667,154 1.6
Wages, Salaries, Benefits 9,244,655 20,644,803 2.2
Other Institutional Spending 7,257,176 9,323,587 1.3
Student Spending 12,921,946 16,698,764 1.3
Interdenominational Theological Center 9,648,611 16,644,336 1.7
Wages, Salaries, Benefits 3,913,111 9,163,972 2.3
Other Institutional Spending 4,522,125 5,860,939 1.3
Student Spending 1,213,375 1,619,425 1.3
Institution - Private HBCUs Initial Spending (2014 dollars)
Output Impact (2014 dollars)
OutputMultiplier
TABLE 4 continued
HBCUHBCU
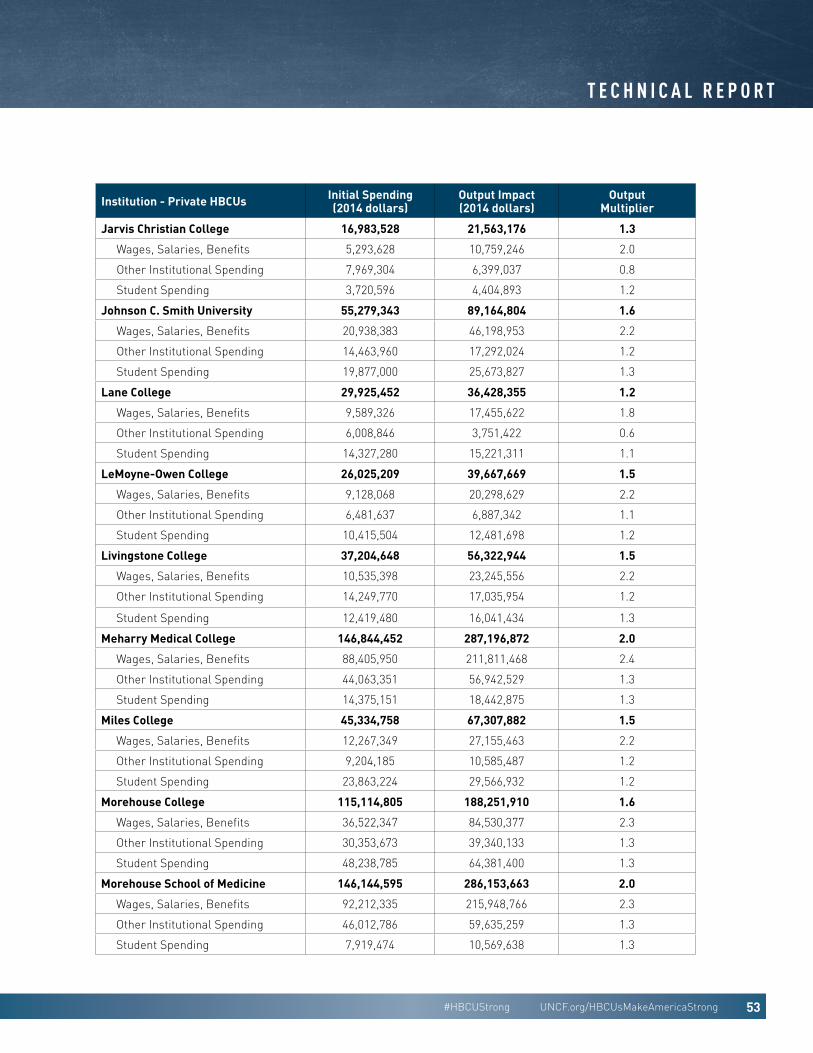
UNCF PUBLIC POLICY PRIORITIES FOR THE 114TH CONGRESS
53#HBCUStrong UNCF.org/HBCUsMakeAmericaStrong
HBCUs MAKE AMERICA STRONG: THE POSITIVE ECONOMIC IMPACT OF HISTORICALLY BLACK COLLEGES AND UNIVERSITIES T E C H N I C A L R E P O R T
Jarvis Christian College 16,983,528 21,563,176 1.3
Wages, Salaries, Benefits 5,293,628 10,759,246 2.0
Other Institutional Spending 7,969,304 6,399,037 0.8
Student Spending 3,720,596 4,404,893 1.2
Johnson C. Smith University 55,279,343 89,164,804 1.6
Wages, Salaries, Benefits 20,938,383 46,198,953 2.2
Other Institutional Spending 14,463,960 17,292,024 1.2
Student Spending 19,877,000 25,673,827 1.3
Lane College 29,925,452 36,428,355 1.2
Wages, Salaries, Benefits 9,589,326 17,455,622 1.8
Other Institutional Spending 6,008,846 3,751,422 0.6
Student Spending 14,327,280 15,221,311 1.1
LeMoyne-Owen College 26,025,209 39,667,669 1.5
Wages, Salaries, Benefits 9,128,068 20,298,629 2.2
Other Institutional Spending 6,481,637 6,887,342 1.1
Student Spending 10,415,504 12,481,698 1.2
Livingstone College 37,204,648 56,322,944 1.5
Wages, Salaries, Benefits 10,535,398 23,245,556 2.2
Other Institutional Spending 14,249,770 17,035,954 1.2
Student Spending 12,419,480 16,041,434 1.3
Meharry Medical College 146,844,452 287,196,872 2.0
Wages, Salaries, Benefits 88,405,950 211,811,468 2.4
Other Institutional Spending 44,063,351 56,942,529 1.3
Student Spending 14,375,151 18,442,875 1.3
Miles College 45,334,758 67,307,882 1.5
Wages, Salaries, Benefits 12,267,349 27,155,463 2.2
Other Institutional Spending 9,204,185 10,585,487 1.2
Student Spending 23,863,224 29,566,932 1.2
Morehouse College 115,114,805 188,251,910 1.6
Wages, Salaries, Benefits 36,522,347 84,530,377 2.3
Other Institutional Spending 30,353,673 39,340,133 1.3
Student Spending 48,238,785 64,381,400 1.3
Morehouse School of Medicine 146,144,595 286,153,663 2.0
Wages, Salaries, Benefits 92,212,335 215,948,766 2.3
Other Institutional Spending 46,012,786 59,635,259 1.3
Student Spending 7,919,474 10,569,638 1.3
Institution - Private HBCUs Initial Spending (2014 dollars)
Output Impact (2014 dollars)
OutputMultiplier

54 A STUDY COMMISSIONED BY UNCF
HBCUs MAKE AMERICA STRONG: THE POSITIVE ECONOMIC IMPACT OF HISTORICALLY BLACK COLLEGES AND UNIVERSITIES
Morris College 26,576,528 28,906,103 1.1
Wages, Salaries, Benefits 8,820,659 15,256,873 1.7
Other Institutional Spending 7,971,069 3,785,011 0.5
Student Spending 9,784,800 9,864,219 1.0
Oakwood University 80,007,571 96,194,161 1.2
Wages, Salaries, Benefits 23,155,707 40,621,789 1.8
Other Institutional Spending 19,739,014 15,969,066 0.8
Student Spending 37,112,850 39,603,306 1.1
Paine College 29,557,725 32,557,857 1.1
Wages, Salaries, Benefits 10,952,081 17,881,094 1.6
Other Institutional Spending 11,406,185 6,449,848 0.6
Student Spending 7,199,459 8,226,915 1.1
Paul Quinn College 11,221,317 18,571,756 1.7
Wages, Salaries, Benefits 3,134,740 7,587,619 2.4
Other Institutional Spending 3,786,511 5,349,815 1.4
Student Spending 4,300,066 5,634,322 1.3
Philander Smith College 22,716,826 33,353,211 1.5
Wages, Salaries, Benefits 7,676,200 16,473,974 2.1
Other Institutional Spending 6,206,066 6,570,853 1.1
Student Spending 8,834,560 10,308,384 1.2
Rust College 20,533,324 30,739,009 1.5
Wages, Salaries, Benefits 6,897,810 15,339,072 2.2
Other Institutional Spending 6,926,814 7,360,384 1.1
Student Spending 6,708,700 8,039,553 1.2
Saint Augustine’s University 51,453,285 72,349,517 1.4
Wages, Salaries, Benefits 15,092,699 31,153,949 2.1
Other Institutional Spending 14,787,946 14,860,273 1.0
Student Spending 21,572,640 26,335,295 1.2
Selma University 6,812,014 7,229,910 1.1
Wages, Salaries, Benefits 1,719,971 2,849,465 1.7
Other Institutional Spending 1,233,443 555,551 0.5
Student Spending 3,858,600 3,824,894 1.0
Shaw University 64,587,103 88,386,596 1.4
Wages, Salaries, Benefits 17,731,638 36,601,177 2.1
Other Institutional Spending 25,080,652 25,203,320 1.0
Student Spending 21,774,813 26,582,099 1.2
Institution - Private HBCUs Initial Spending (2014 dollars)
Output Impact (2014 dollars)
OutputMultiplier
TABLE 4 continued
HBCUHBCU
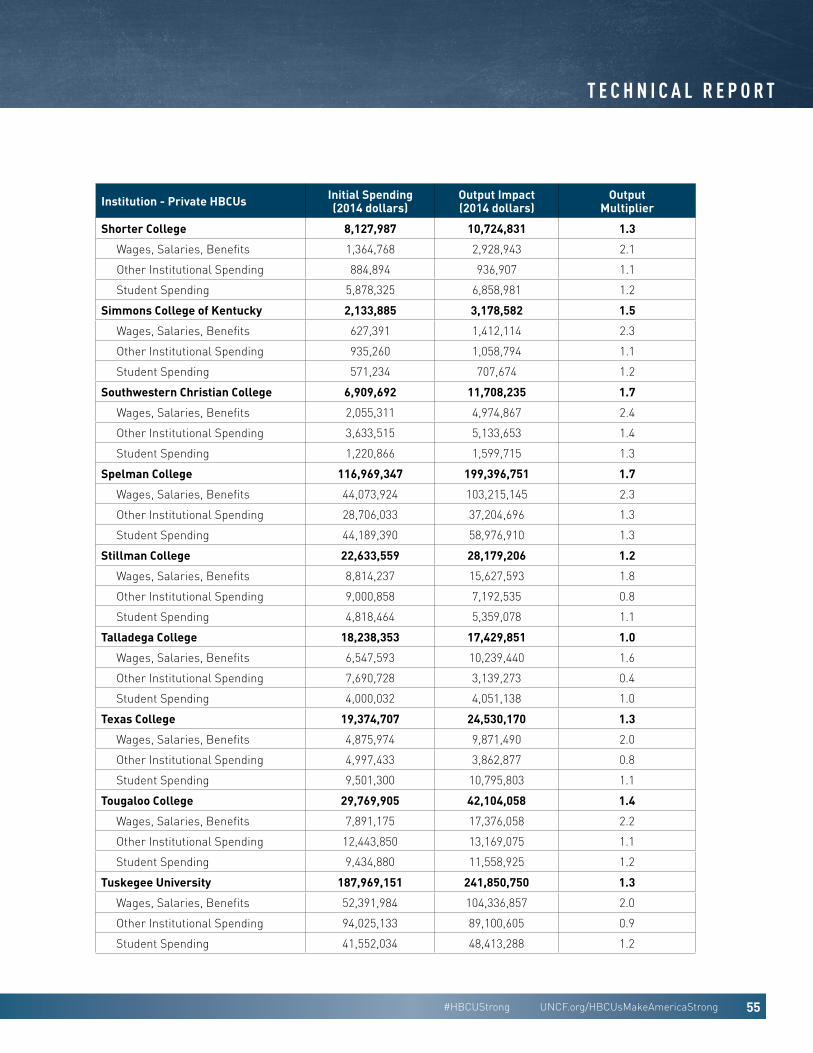
UNCF PUBLIC POLICY PRIORITIES FOR THE 114TH CONGRESS
55#HBCUStrong UNCF.org/HBCUsMakeAmericaStrong
HBCUs MAKE AMERICA STRONG: THE POSITIVE ECONOMIC IMPACT OF HISTORICALLY BLACK COLLEGES AND UNIVERSITIES T E C H N I C A L R E P O R T
Shorter College 8,127,987 10,724,831 1.3
Wages, Salaries, Benefits 1,364,768 2,928,943 2.1
Other Institutional Spending 884,894 936,907 1.1
Student Spending 5,878,325 6,858,981 1.2
Simmons College of Kentucky 2,133,885 3,178,582 1.5
Wages, Salaries, Benefits 627,391 1,412,114 2.3
Other Institutional Spending 935,260 1,058,794 1.1
Student Spending 571,234 707,674 1.2
Southwestern Christian College 6,909,692 11,708,235 1.7
Wages, Salaries, Benefits 2,055,311 4,974,867 2.4
Other Institutional Spending 3,633,515 5,133,653 1.4
Student Spending 1,220,866 1,599,715 1.3
Spelman College 116,969,347 199,396,751 1.7
Wages, Salaries, Benefits 44,073,924 103,215,145 2.3
Other Institutional Spending 28,706,033 37,204,696 1.3
Student Spending 44,189,390 58,976,910 1.3
Stillman College 22,633,559 28,179,206 1.2
Wages, Salaries, Benefits 8,814,237 15,627,593 1.8
Other Institutional Spending 9,000,858 7,192,535 0.8
Student Spending 4,818,464 5,359,078 1.1
Talladega College 18,238,353 17,429,851 1.0
Wages, Salaries, Benefits 6,547,593 10,239,440 1.6
Other Institutional Spending 7,690,728 3,139,273 0.4
Student Spending 4,000,032 4,051,138 1.0
Texas College 19,374,707 24,530,170 1.3
Wages, Salaries, Benefits 4,875,974 9,871,490 2.0
Other Institutional Spending 4,997,433 3,862,877 0.8
Student Spending 9,501,300 10,795,803 1.1
Tougaloo College 29,769,905 42,104,058 1.4
Wages, Salaries, Benefits 7,891,175 17,376,058 2.2
Other Institutional Spending 12,443,850 13,169,075 1.1
Student Spending 9,434,880 11,558,925 1.2
Tuskegee University 187,969,151 241,850,750 1.3
Wages, Salaries, Benefits 52,391,984 104,336,857 2.0
Other Institutional Spending 94,025,133 89,100,605 0.9
Student Spending 41,552,034 48,413,288 1.2
Institution - Private HBCUs Initial Spending (2014 dollars)
Output Impact (2014 dollars)
OutputMultiplier

56 A STUDY COMMISSIONED BY UNCF
HBCUs MAKE AMERICA STRONG: THE POSITIVE ECONOMIC IMPACT OF HISTORICALLY BLACK COLLEGES AND UNIVERSITIES
Virginia Union University 56,500,385 83,612,691 1.5
Wages, Salaries, Benefits 13,112,488 29,764,583 2.3
Other Institutional Spending 13,569,097 15,620,722 1.2
Student Spending 29,818,800 38,227,386 1.3
Virginia University of Lynchburg 9,192,886 10,007,351 1.1
Wages, Salaries, Benefits 1,639,351 3,027,421 1.8
Other Institutional Spending 3,737,652 2,594,261 0.7
Student Spending 3,815,883 4,385,669 1.1
Voorhees College 18,678,954 17,397,012 0.9
Wages, Salaries, Benefits 6,050,567 9,561,263 1.6
Other Institutional Spending 7,971,235 3,233,477 0.4
Student Spending 4,657,152 4,602,272 1.0
Wilberforce University 19,972,193 26,901,113 1.3
Wages, Salaries, Benefits 6,001,014 12,371,927 2.1
Other Institutional Spending 6,921,179 6,432,882 0.9
Student Spending 7,050,000 8,096,304 1.1
Wiley College 33,510,213 35,304,929 1.1
Wages, Salaries, Benefits 12,224,400 18,720,991 1.5
Other Institutional Spending 7,051,605 2,550,991 0.4
Student Spending 14,234,208 14,032,947 1.0
Xavier University of Louisiana 127,406,611 199,763,066 1.6
Wages, Salaries, Benefits 50,662,197 110,457,898 2.2
Other Institutional Spending 40,512,397 44,740,220 1.1
Student Spending 36,232,017 44,564,948 1.2
Institution - Private HBCUs Initial Spending (2014 dollars)
Output Impact (2014 dollars)
OutputMultiplier
TABLE 4 continued
Notes:
Initial spending for wages, salaries, and benefits and other institutional spending was obtained from the U.S. Department of Education, National Center for Educational Statistics, Integrated Postsecondary Education Data System (IPEDS), Finance Data, 2013-14. Initial spending by students was estimated by the author, based on data obtained from IPEDS, 12-month full-time equivalent (FTE) enrollment (adjusted for students enrolled exclusively in distance education), and each HBCU’s estimated cost of attendance (room and board, books and supplies, and other expenses). The IPEDS data was extracted on March 22, 2016.
The economic impacts of initial spending on output, value-added, labor income, and employment were estimated using theIMPLAN Online regional economic modeling system and production functions provided by IMPLAN Group, LLC.
Output refers to the value of total production, including domestic and foreign trade. Value-added includes employee compensation, proprietary income, other property income, and indirect business taxes. Labor income includes both the total payroll costs (including fringe benefits) of workers who are paid by employers, and payments received by self-employed individuals. Employment includes both full- and part-time jobs. All dollar amounts are expressed in 2014 dollars.
Source: Estimated for the United Negro College Fund by Dr. Jeffrey M Humphreys, Director of the Selig Center for Economic Growth, Terry College of Business, University of Georgia, 2016.
HBCUHBCU

UNCF PUBLIC POLICY PRIORITIES FOR THE 114TH CONGRESS
57#HBCUStrong UNCF.org/HBCUsMakeAmericaStrong
HBCUs MAKE AMERICA STRONG: THE POSITIVE ECONOMIC IMPACT OF HISTORICALLY BLACK COLLEGES AND UNIVERSITIES T E C H N I C A L R E P O R T
Total, HBCUs 134,090 57,868 76,222 1.3
Total, Public HBCUs 89,932 39,344 50,588 1.3
Alabama A&M University 2,620 860 1,760 2.0
Alabama State University 2,791 1,121 1,670 1.5
Albany State University 1,493 675 818 1.2
Alcorn State University 1,534 749 785 1.0
Bishop State Community College 866 385 481 1.2
Bluefield State College 490 247 243 1.0
Bowie State University 1,968 858 1,110 1.3
Central State University 940 425 515 1.2
Cheyney University of Pennsylvania 704 276 428 1.5
Coahoma Community College 557 246 311 1.3
Coppin State University 1,431 676 755 1.1
Delaware State University 2,235 1,035 1,200 1.2
Denmark Technical College 374 182 192 1.1
Elizabeth City State University 941 444 497 1.1
Fayetteville State University 1,737 874 863 1.0
Florida A&M University 5,104 1,957 3,147 1.6
Fort Valley State University 1,125 533 592 1.1
Gadsden State Community College 1,321 713 608 0.9
Grambling State University 1,524 589 935 1.6
H. Councill Trenholm State Tech College 440 202 238 1.2
Harris-Stowe State University 674 337 337 1.0
J. F. Drake State Comm. and Tech. College 331 182 149 0.8
Jackson State University 3,818 1,470 2,348 1.6
Kentucky State University 1,114 553 561 1.0
Langston University 1,035 353 682 1.9
Lawson State Comm. College - Birmingham 930 408 522 1.3
Lincoln University (MO) 996 531 465 0.9
Lincoln University (PA) 956 408 548 1.3
Mississippi Valley State University 965 546 419 0.8
Morgan State University 3,960 1,842 2,118 1.2
Norfolk State University 2,541 1,113 1,428 1.3
Institution - Public HBCUs Employment Impact (jobs)
On-CampusJobs
Off-CampusJobs
Off-Campus Job Multiplier
TABLE 5
On-Campus and Off-Campus Jobs That Exist Due to HBCU-Related Spending, 2014

58 A STUDY COMMISSIONED BY UNCF
HBCUs MAKE AMERICA STRONG: THE POSITIVE ECONOMIC IMPACT OF HISTORICALLY BLACK COLLEGES AND UNIVERSITIES
North Carolina A&T State University 4,325 1,805 2,520 1.4
North Carolina Central University 3,085 1,397 1,688 1.2
Prairie View A&M University 3,178 1,182 1,996 1.7
Savannah State University 1,589 734 855 1.2
Shelton State Community College 1,152 551 601 1.1
South Carolina State University 1,546 756 790 1.0
Southern University and A&M College 2,765 1,318 1,447 1.1
Southern University at New Orleans 895 333 562 1.7
Southern University at Shreveport 777 301 476 1.6
St. Philip’s College 2,546 1,392 1,154 0.8
Tennessee State University 3,699 1,396 2,303 1.6
Texas Southern University 4,023 1,379 2,644 1.9
University of Arkansas at Pine Bluff 1,120 640 480 0.7
University of Maryland Eastern Shore 1,968 912 1,056 1.2
University of the District of Columbia 2,526 1,044 1,482 1.4
University of the Virgin Islands 1,461 744 717 1.0
Virginia State University 2,644 1,257 1,387 1.1
West Virginia State University 876 407 469 1.2
Winston-Salem State University 2,239 1,006 1,233 1.2
Institution - Public HBCUs Employment Impact (jobs)
On-CampusJobs
Off-CampusJobs
Off-Campus Job Multiplier
TABLE 5 continued
HBCUHBCU

UNCF PUBLIC POLICY PRIORITIES FOR THE 114TH CONGRESS
59#HBCUStrong UNCF.org/HBCUsMakeAmericaStrong
HBCUs MAKE AMERICA STRONG: THE POSITIVE ECONOMIC IMPACT OF HISTORICALLY BLACK COLLEGES AND UNIVERSITIES T E C H N I C A L R E P O R T
Total, Private HBCUs 44,158 18,524 25,634 1.4
Allen University 229 103 126 1.2
Arkansas Baptist College 360 175 185 1.1
Benedict College 1,218 496 722 1.5
Bennett College 369 183 186 1.0
Bethune-Cookman University 1,469 689 780 1.1
Claflin University 835 406 429 1.1
Clark Atlanta University 1,708 676 1,032 1.5
Clinton College 107 68 39 0.6
Concordia College Alabama 185 104 81 0.8
Dillard University 778 338 440 1.3
Edward Waters College 497 217 280 1.3
Fisk University 483 222 261 1.2
Florida Memorial University 747 225 522 2.3
Hampton University 2,249 825 1,424 1.7
Howard University 9,591 3,301 6,290 1.9
Huston-Tillotson University 427 182 245 1.3
Interdenominational Theological Center 148 65 83 1.3
Jarvis Christian College 267 148 119 0.8
Johnson C. Smith University 824 386 438 1.1
Lane College 475 266 209 0.8
LeMoyne-Owen College 425 217 208 1.0
Livingstone College 512 222 290 1.3
Meharry Medical College 2,207 893 1,314 1.5
Miles College 730 377 353 0.9
Morehouse College 1,580 593 987 1.7
Morehouse School of Medicine 2,372 1,057 1,315 1.2
Morris College 389 221 168 0.8
Oakwood University 916 389 527 1.4
Paine College 400 216 184 0.9
Paul Quinn College 164 70 94 1.3
Philander Smith College 338 163 175 1.1
Rust College 349 188 161 0.9
Saint Augustine’s University 684 301 383 1.3
Institution - Private HBCUs Employment Impact (jobs)
On-CampusJobs
Off-CampusJobs
Off-Campus Job Multiplier

60 A STUDY COMMISSIONED BY UNCF
HBCUs MAKE AMERICA STRONG: THE POSITIVE ECONOMIC IMPACT OF HISTORICALLY BLACK COLLEGES AND UNIVERSITIES
Selma University 121 80 41 0.5
Shaw University 847 371 476 1.3
Shorter College 102 41 61 1.5
Simmons College of Kentucky 72 54 18 0.3
Southwestern Christian College 127 70 57 0.8
Spelman College 1,625 614 1,011 1.6
Stillman College 346 205 141 0.7
Talladega College 232 150 82 0.5
Texas College 282 139 143 1.0
Tougaloo College 552 316 236 0.7
Tuskegee University 2,081 694 1,387 2.0
Virginia Union University 842 392 450 1.1
Virginia University of Lynchburg 128 63 65 1.0
Voorhees College 287 196 91 0.5
Wilberforce University 294 148 146 1.0
Wiley College 476 310 166 0.5
Xavier University of Louisiana 1,715 699 1,016 1.5
Institution - Private HBCUs Employment Impact (jobs)
On-CampusJobs
Off-CampusJobs
Off-Campus Job Multiplier
TABLE 5 continued
Notes:
On-campus employment was obtained from the U.S. Department of Education, National Center for Educational Statistics, Integrated Postsecondary Education System (IPEDS), 2013-14. The IPEDS data was extracted on March 23, 2016.
The total employment impact, the number of off-campus jobs, and the off-campus job multiplier were estimated by the author using the IMPLAN-Online regional economic modeling system and production functions provided by IMPLAN Group, LLC.
The off-campus job multiplier equals the number of off-campus jobs divided by the number of on-campus jobs. Employment includes both full-time and part-time jobs.
Source: Estimated for the United Negro College Fund by Dr. Jeffrey M Humphreys, Director of the Selig Center for Economic Growth, Terry College of Business, University of Georgia, 2016.
HBCUHBCU

UNCF PUBLIC POLICY PRIORITIES FOR THE 114TH CONGRESS
61#HBCUStrong UNCF.org/HBCUsMakeAmericaStrong
HBCUs MAKE AMERICA STRONG: THE POSITIVE ECONOMIC IMPACT OF HISTORICALLY BLACK COLLEGES AND UNIVERSITIES T E C H N I C A L R E P O R T
Professional 4,357,650 1,819,966
Doctoral 3,693,368 724,005
Master’s 2,969,363 431,679
Bachelor’s 2,537,684 1,101,200
Associate’s 1,899,596 463,112
Certificate 1,640,949 204,464
High School 1,436,484 0
Average, All HBCUs 2,594,519 926,666
Degree/Award Synthetic Work-Life Earnings (2014 dollars, per graduate)
Portion Due to Degree (2014 dollars, per graduate)
Notes:
The estimates of synthetic work-life earnings by educational attainment for professional degrees, doctoral degrees, master’s degrees, bachelor’s degrees, associate’s degrees, and high school diplomas was obtained from the U.S. Census Bureau, American Community Survey brief, ACSABR/11-04, Table 1, issued October 2012. Synthetic work-life earnings for certificates, however, were estimated by the author based on data obtained from the U.S. Census Bureau, “What It’s Worth: Field of Training and Economic Status in 2009,” Household Economic Studies, F70-129, February 2012. The synthetic work-life earnings estimates represent expected earnings over a 40-year time period for the population aged 25-64 who maintain full-time, year-round employment the entire period. The estimates therefore are not a prediction, but provide an example of the magnitude of differences in earnings based on educational attainment over a work life. The U.S. Bureau of Labor Statistics consumer price index for all urban consumers was used to convert dollar amounts to 2014 dollars.
Source: Estimated for the United Negro College Fund by Dr. Jeffrey M. Humphreys, Director of the Selig Center for Economic Growth, Terry College of Business, University of Georgia, 2016.
TABLE 6
Synthetic Work-Life Earnings by Educational Attainment, 2014

62 A STUDY COMMISSIONED BY UNCF
HBCUs MAKE AMERICA STRONG: THE POSITIVE ECONOMIC IMPACT OF HISTORICALLY BLACK COLLEGES AND UNIVERSITIES
HBCU TOTAL 50,037 129,821,953,630 83,454,385,061 46,367,568,568
Professional 1,785 7,778,404,856 4,529,765,944 3,248,638,912
Doctoral 638 2,356,368,471 1,894,453,403 461,915,068
Master’s 7,840 23,279,803,576 19,895,442,577 3,384,361,000
Bachelor’s 33,544 85,124,072,167 48,185,426,483 36,938,645,684
Associate’s 4,099 7,786,443,300 5,888,148,794 1,898,294,505
Certificate 2,131 3,496,861,260 3,061,147,861 435,713,399
PUBLIC HBCU TOTAL 38,182 97,659,469,288 63,824,102,173 33,835,367,115
Professional 929 4,048,256,645 2,357,508,438 1,690,748,207
Doctoral 432 1,595,534,764 1,282,764,687 312,770,077
Master’s 6,621 19,660,150,444 16,802,005,778 2,858,144,666
Bachelor’s 24,330 61,741,851,772 34,949,660,933 26,792,190,839
Associate’s 3,794 7,207,066,572 5,450,021,109 1,757,045,463
Certificate 2,076 3,406,609,092 2,982,141,229 424,467,863
Alabama A&M University 702 1,885,808,304 1,264,709,621 621,098,683
Professional 0 0 0 0
Doctoral 7 25,853,573 20,785,539 5,068,034
Master’s 223 662,167,882 565,903,532 96,264,350
Bachelor’s 472 1,197,786,849 678,020,549 519,766,300
Associate’s 0 0 0 0
Certificate 0 0 0 0
Alabama State University 721 1,989,306,415 1,252,403,634 736,902,781
Professional 53 230,955,438 134,497,252 96,458,186
Doctoral 2 7,386,735 5,938,725 1,448,010
Master’s 141 418,680,141 357,813,444 60,866,697
Bachelor’s 525 1,332,284,101 754,154,212 578,129,889
Associate’s 0 0 0 0
Certificate 0 0 0 0
Institution/Award Number of Recipients
Total Synthetic Work-Life Earnings
(2014 dollars)
Base Earnings (2014 dollars)
Incremental Earnings Due to Degree (2014 dollars)
TABLE 7
Synthetic Estimates of Work-Life Earnings of 2014 HBCU Graduates
HBCUHBCU

UNCF PUBLIC POLICY PRIORITIES FOR THE 114TH CONGRESS
63#HBCUStrong UNCF.org/HBCUsMakeAmericaStrong
HBCUs MAKE AMERICA STRONG: THE POSITIVE ECONOMIC IMPACT OF HISTORICALLY BLACK COLLEGES AND UNIVERSITIES T E C H N I C A L R E P O R T
Albany State University 600 1,569,231,701 980,820,106 588,411,595
Professional 0 0 0 0
Doctoral 0 0 0 0
Master’s 108 320,691,172 274,069,872 46,621,299
Bachelor’s 492 1,248,540,529 706,750,233 541,790,296
Associate’s 0 0 0 0
Certificate 0 0 0 0
Alcorn State University 586 1,507,880,937 982,733,322 525,147,615
Professional 0 0 0 0
Doctoral 0 0 0 0
Master’s 128 380,078,426 324,823,552 55,254,873
Bachelor’s 404 1,025,224,337 580,339,623 444,884,714
Associate’s 54 102,578,175 77,570,148 25,008,027
Certificate 0 0 0 0
Bishop State Community College 558 989,363,752 801,558,192 187,805,561
Professional 0 0 0 0
Doctoral 0 0 0 0
Master’s 0 0 0 0
Bachelor’s 0 0 0 0
Associate’s 285 541,384,811 409,398,001 131,986,810
Certificate 273 447,978,941 392,160,190 55,818,751
Bluefield State College 347 808,472,385 498,460,022 310,012,363
Professional 0 0 0 0
Doctoral 0 0 0 0
Master’s 0 0 0 0
Bachelor’s 234 593,818,056 336,137,306 257,680,750
Associate’s 113 214,654,329 162,322,716 52,331,612
Certificate 0 0 0 0
Bowie State University 1,026 2,731,760,249 1,790,696,494 941,063,755
Professional 0 0 0 0
Doctoral 7 25,853,573 20,785,539 5,068,034
Master’s 278 825,482,831 705,476,153 120,006,678
Bachelor’s 741 1,880,423,846 1,064,434,803 815,989,043
Associate’s 0 0 0 0
Certificate 0 0 0 0
Institution/Award Number of Recipients
Total Synthetic Work-Life Earnings
(2014 dollars)
Base Earnings (2014 dollars)
Incremental Earnings Due to Degree (2014 dollars)

64 A STUDY COMMISSIONED BY UNCF
HBCUs MAKE AMERICA STRONG: THE POSITIVE ECONOMIC IMPACT OF HISTORICALLY BLACK COLLEGES AND UNIVERSITIES
Central State University 299 761,357,589 436,115,979 325,241,610
Professional 0 0 0 0
Doctoral 0 0 0 0
Master’s 6 17,816,176 15,226,104 2,590,072
Bachelor’s 293 743,541,413 420,889,875 322,651,538
Associate’s 0 0 0 0
Certificate 0 0 0 0
Cheyney University of Pennsylvania 160 410,346,227 240,849,472 169,496,755
Professional 0 0 0 0
Doctoral 0 0 0 0
Master’s 10 29,693,627 25,376,840 4,316,787
Bachelor’s 150 380,652,600 215,472,632 165,179,968
Associate’s 0 0 0 0
Certificate 0 0 0 0
Coahoma Community College 351 642,962,582 504,205,959 138,756,623
Professional 0 0 0 0
Doctoral 0 0 0 0
Master’s 0 0 0 0
Bachelor’s 0 0 0 0
Associate’s 259 491,995,319 372,049,411 119,945,908
Certificate 92 150,967,262 132,156,548 18,810,715
Coppin State University 559 1,454,394,689 894,394,258 560,000,431
Professional 0 0 0 0
Doctoral 0 0 0 0
Master’s 83 246,457,104 210,627,772 35,829,332
Bachelor’s 476 1,207,937,585 683,766,486 524,171,099
Associate’s 0 0 0 0
Certificate 0 0 0 0
Delaware State University 686 1,803,903,557 1,137,781,414 666,122,143
Professional 0 0 0 0
Doctoral 6 22,160,205 17,816,176 4,344,029
Master’s 130 386,017,151 329,898,920 56,118,231
Bachelor’s 550 1,395,726,201 790,066,318 605,659,883
Associate’s 0 0 0 0
Certificate 0 0 0 0
TABLE 7 continued
HBCUHBCU
Institution/Award Number of Recipients
Total Synthetic Work-Life Earnings
(2014 dollars)
Base Earnings (2014 dollars)
Incremental Earnings Due to Degree (2014 dollars)

UNCF PUBLIC POLICY PRIORITIES FOR THE 114TH CONGRESS
65#HBCUStrong UNCF.org/HBCUsMakeAmericaStrong
HBCUs MAKE AMERICA STRONG: THE POSITIVE ECONOMIC IMPACT OF HISTORICALLY BLACK COLLEGES AND UNIVERSITIES T E C H N I C A L R E P O R T
Denmark Technical College 341 580,513,873 489,841,117 90,672,756
Professional 0 0 0 0
Doctoral 0 0 0 0
Master’s 0 0 0 0
Bachelor’s 0 0 0 0
Associate’s 81 153,867,262 116,355,221 37,512,041
Certificate 260 426,646,611 373,485,896 53,160,715
Elizabeth City State University 543 1,401,704,742 840,576,917 561,127,825
Professional 0 0 0 0
Doctoral 0 0 0 0
Master’s 55 163,314,949 139,572,620 23,742,328
Bachelor’s 488 1,238,389,793 701,004,297 537,385,496
Associate’s 0 0 0 0
Certificate 0 0 0 0
Fayetteville State University 1,148 3,004,665,008 1,872,345,586 1,132,319,421
Professional 0 0 0 0
Doctoral 7 25,853,573 20,785,539 5,068,034
Master’s 193 573,087,001 489,773,012 83,313,989
Bachelor’s 948 2,405,724,434 1,361,787,035 1,043,937,399
Associate’s 0 0 0 0
Certificate 0 0 0 0
Florida A&M University 2,272 6,407,499,132 3,947,555,015 2,459,944,117
Professional 312 1,359,586,731 791,757,409 567,829,322
Doctoral 23 84,947,453 68,295,342 16,652,111
Master’s 277 822,513,468 702,938,469 119,575,000
Bachelor’s 1547 3,925,797,151 2,222,241,079 1,703,556,072
Associate’s 113 214,654,329 162,322,716 52,331,612
Certificate 0 0 0 0
Fort Valley State University 516 1,346,569,313 835,929,036 510,640,277
Professional 0 0 0 0
Doctoral 0 0 0 0
Master’s 86 255,365,192 218,240,824 37,124,368
Bachelor’s 430 1,091,204,121 617,688,212 473,515,909
Associate’s 0 0 0 0
Certificate 0 0 0 0
Institution/Award Number of Recipients
Total Synthetic Work-Life Earnings
(2014 dollars)
Base Earnings (2014 dollars)
Incremental Earnings Due to Degree (2014 dollars)

66 A STUDY COMMISSIONED BY UNCF
HBCUs MAKE AMERICA STRONG: THE POSITIVE ECONOMIC IMPACT OF HISTORICALLY BLACK COLLEGES AND UNIVERSITIES
Gadsden State Community College 862 1,561,409,290 1,238,249,393 323,159,898
Professional 0 0 0 0
Doctoral 0 0 0 0
Master’s 0 0 0 0
Bachelor’s 0 0 0 0
Associate’s 568 1,078,970,430 815,923,034 263,047,397
Certificate 294 482,438,860 422,326,359 60,112,501
Grambling State University 939 2,487,132,540 1,630,290,138 856,842,402
Professional 0 0 0 0
Doctoral 4 14,773,470 11,877,451 2,896,019
Master’s 250 742,340,675 634,421,001 107,919,675
Bachelor’s 672 1,705,323,649 965,317,392 740,006,257
Associate’s 13 24,694,746 18,674,295 6,020,451
Certificate 0 0 0 0
H. Councill Trenholm State Tech College 460 806,565,776 660,782,739 145,783,038
Professional 0 0 0 0
Doctoral 0 0 0 0
Master’s 0 0 0 0
Bachelor’s 0 0 0 0
Associate’s 200 379,919,166 287,296,843 92,622,323
Certificate 260 426,646,611 373,485,896 53,160,715
Harris-Stowe State University 132 334,974,288 189,615,916 145,358,372
Professional 0 0 0 0
Doctoral 0 0 0 0
Master’s 0 0 0 0
Bachelor’s 132 334,974,288 189,615,916 145,358,372
Associate’s 0 0 0 0
Certificates 0 0 0 0
J.F. Drake State Community & Tech College 180 320,718,168 258,567,159 62,151,010
Professional 0 0 0 0
Doctoral 0 0 0 0
Master’s 0 0 0 0
Bachelor’s 0 0 0 0
Associate’s 98 186,160,391 140,775,453 45,384,938
Certificate 82 134,557,777 117,791,706 16,766,072
HBCUHBCU
TABLE 7 continued
Institution/Award Number of Recipients
Total Synthetic Work-Life Earnings
(2014 dollars)
Base Earnings (2014 dollars)
Incremental Earnings Due to Degree (2014 dollars)

UNCF PUBLIC POLICY PRIORITIES FOR THE 114TH CONGRESS
67#HBCUStrong UNCF.org/HBCUsMakeAmericaStrong
HBCUs MAKE AMERICA STRONG: THE POSITIVE ECONOMIC IMPACT OF HISTORICALLY BLACK COLLEGES AND UNIVERSITIES T E C H N I C A L R E P O R T
Jackson State University 1,588 4,294,927,493 2,856,880,015 1,438,047,478
Professional 0 0 0 0
Doctoral 71 262,229,093 210,824,752 51,404,341
Master’s 424 1,259,009,785 1,075,978,017 183,031,768
Bachelor’s 1093 2,773,688,614 1,570,077,246 1,203,611,368
Associate’s 0 0 0 0
Certificate 0 0 0 0
Kentucky State University 370 928,829,017 585,457,949 343,371,068
Professional 0 0 0 0
Doctoral 0 0 0 0
Master’s 49 145,498,772 124,346,516 21,152,256
Bachelor’s 272 690,250,049 390,723,706 299,526,342
Associate’s 49 93,080,196 70,387,726 22,692,469
Certificate 0 0 0 0
Langston University 436 1,186,297,071 771,665,489 414,631,581
Professional 22 95,868,295 55,829,048 40,039,247
Doctoral 0 0 0 0
Master’s 110 326,629,897 279,145,240 47,484,657
Bachelor’s 292 741,003,729 419,453,391 321,550,338
Associate’s 12 22,795,150 17,237,811 5,557,339
Certificate 0 0 0 0
Lawson State Comm. College-Birmingham 433 768,726,350 621,997,665 146,728,685
Professional 0 0 0 0
Doctoral 0 0 0 0
Master’s 0 0 0 0
Bachelor’s 0 0 0 0
Associate’s 225 427,409,061 323,208,948 104,200,113
Certificate 208 341,317,289 298,788,717 42,528,572
Lincoln University (MO) 449 1,110,820,355 702,243,801 408,576,554
Professional 0 0 0 0
Doctoral 0 0 0 0
Master’s 52 154,406,860 131,959,568 22,447,292
Bachelor’s 317 804,445,829 455,365,496 349,080,333
Associate’s 80 151,967,666 114,918,737 37,048,929
Certificate 0 0 0 0
Institution/Award Number of Recipients
Total Synthetic Work-Life Earnings
(2014 dollars)
Base Earnings (2014 dollars)
Incremental Earnings Due to Degree (2014 dollars)

68 A STUDY COMMISSIONED BY UNCF
HBCUs MAKE AMERICA STRONG: THE POSITIVE ECONOMIC IMPACT OF HISTORICALLY BLACK COLLEGES AND UNIVERSITIES
Lincoln University (PA) 439 1,183,111,869 806,808,536 376,303,333
Professional 0 0 0 0
Doctoral 0 0 0 0
Master’s 160 475,098,032 406,029,440 69,068,592
Bachelor’s 279 708,013,837 400,779,096 307,234,741
Associate’s 0 0 0 0
Certificate 0 0 0 0
Mississippi Valley State University 456 1,187,401,414 732,120,787 455,280,627
Professional 0 0 0 0
Doctoral 0 0 0 0
Master’s 70 207,855,389 177,637,880 30,217,509
Bachelor’s 386 979,546,025 554,482,907 425,063,118
Associate’s 0 0 0 0
Certificate 0 0 0 0
Morgan State University 1,199 3,200,769,726 2,052,026,606 1,148,743,120
Professional 0 0 0 0
Doctoral 52 192,055,110 154,406,860 37,648,250
Master’s 227 674,045,333 576,054,268 97,991,065
Bachelor’s 920 2,334,669,282 1,321,565,477 1,013,103,805
Associate’s 0 0 0 0
Certificate 0 0 0 0
Norfolk State University 1,132 2,903,431,114 1,840,120,562 1,063,310,552
Professional 3 13,072,949 7,613,052 5,459,897
Doctoral 6 22,160,205 17,816,176 4,344,029
Master’s 183 543,393,374 464,396,172 78,997,202
Bachelor’s 845 2,144,342,982 1,213,829,161 930,513,821
Associate’s 95 180,461,604 136,466,000 43,995,603
Certificate 0 0 0 0
North Carolina A&T State University 1,907 5,091,946,771 3,322,853,072 1,769,093,700
Professional 0 0 0 0
Doctoral 43 158,814,803 127,682,596 31,132,207
Master’s 470 1,395,600,470 1,192,711,481 202,888,989
Bachelor’s 1394 3,537,531,499 2,002,458,995 1,535,072,504
Associate’s 0 0 0 0
Certificate 0 0 0 0
HBCUHBCU
TABLE 7 continued
Institution/Award Number of Recipients
Total Synthetic Work-Life Earnings
(2014 dollars)
Base Earnings (2014 dollars)
Incremental Earnings Due to Degree (2014 dollars)

UNCF PUBLIC POLICY PRIORITIES FOR THE 114TH CONGRESS
69#HBCUStrong UNCF.org/HBCUsMakeAmericaStrong
HBCUs MAKE AMERICA STRONG: THE POSITIVE ECONOMIC IMPACT OF HISTORICALLY BLACK COLLEGES AND UNIVERSITIES T E C H N I C A L R E P O R T
North Carolina Central University 1,618 4,546,483,016 2,948,611,738 1,597,871,277
Professional 141 614,428,619 357,813,444 256,615,175
Doctoral 0 0 0 0
Master’s 426 1,264,948,511 1,081,053,385 183,895,126
Bachelor’s 1051 2,667,105,886 1,509,744,909 1,157,360,977
Associate’s 0 0 0 0
Certificate 0 0 0 0
Prairie View A&M University 1,462 3,928,479,427 2,626,099,553 1,302,379,874
Professional 0 0 0 0
Doctoral 22 81,254,085 65,325,979 15,928,106
Master’s 447 1,327,305,127 1,134,344,749 192,960,378
Bachelor’s 993 2,519,920,214 1,426,428,825 1,093,491,389
Associate’s 0 0 0 0
Certificate 0 0 0 0
Savannah State University 521 1,350,887,148 829,897,060 520,990,088
Professional 0 0 0 0
Doctoral 0 0 0 0
Master’s 74 219,732,840 187,788,616 31,944,224
Bachelor’s 442 1,121,656,329 634,926,023 486,730,306
Associate’s 5 9,497,979 7,182,421 2,315,558
Certificate 0 0 0 0
Shelton State Community College 545 988,205,913 782,883,897 205,322,016
Professional 0 0 0 0
Doctoral 0 0 0 0
Master’s 0 0 0 0
Bachelors 0 0 0 0
Associate’s 363 689,553,286 521,443,770 168,109,516
Certificate 182 298,652,628 261,440,127 37,212,501
South Carolina State University 698 1,841,609,434 1,155,125,049 686,484,385
Professional 0 0 0 0
Doctoral 19 70,173,983 56,417,891 13,756,091
Master’s 112 332,568,623 284,220,608 48,348,014
Bachelor’s 567 1,438,866,829 814,486,549 624,380,280
Associate’s 0 0 0 0
Certificate 0 0 0 0
Institution/Award Number of Recipients
Total Synthetic Work-Life Earnings
(2014 dollars)
Base Earnings (2014 dollars)
Incremental Earnings Due to Degree (2014 dollars)

70 A STUDY COMMISSIONED BY UNCF
HBCUs MAKE AMERICA STRONG: THE POSITIVE ECONOMIC IMPACT OF HISTORICALLY BLACK COLLEGES AND UNIVERSITIES
Southern University and A&M College 1,042 2,776,707,222 1,816,270,314 960,436,908
Professional 0 0 0
Doctoral 13 48,013,778 38,601,715 9,412,063
Master’s 272 807,666,655 690,250,049 117,416,606
Bachelor’s 757 1,921,026,790 1,087,418,550 833,608,239
Associate’s 0 0 0 0
Certificate 0 0 0 0
Southern University at New Orleans 500 1,338,905,969 919,761,668 419,144,300
Professional 0 0 0 0
Doctoral 0 0 0 0
Master’s 183 543,393,374 464,396,172 78,997,202
Bachelor’s 303 768,918,253 435,254,717 333,663,536
Associate’s 14 26,594,342 20,110,779 6,483,563
Certificate 0 0 0 0
Southern University at Shreveport 374 684,325,460 537,245,096 147,080,364
Professional 0 0 0 0
Doctoral 0 0 0 0
Master’s 0 0 0 0
Bachelor’s 0 0 0 0
Associate’s 273 518,589,661 392,160,190 126,429,471
Certificate 101 165,735,799 145,084,906 20,650,893
St. Philip’s College 790 1,416,878,971 1,134,822,529 282,056,442
Professional 0 0 0 0
Doctoral 0 0 0 0
Master’s 0 0 0 0
Bachelor’s 0 0 0 0
Associate’s 466 885,211,656 669,401,644 215,810,012
Certificate 324 531,667,315 465,420,885 66,246,430
Tennessee State University 1,472 3,972,821,840 2,768,970,534 1,203,851,306
Professional 0 0 0 0
Doctoral 85 313,936,238 252,395,830 61,540,409
Master’s 476 1,413,416,646 1,207,937,585 205,479,061
Bachelor’s 807 2,047,910,990 1,159,242,761 888,668,229
Associate’s 104 197,557,966 149,394,358 48,163,608
Certificate 0 0 0 0
HBCUHBCU
TABLE 7 continued
Institution/Award Number of Recipients
Total Synthetic Work-Life Earnings
(2014 dollars)
Base Earnings (2014 dollars)
Incremental Earnings Due to Degree (2014 dollars)

UNCF PUBLIC POLICY PRIORITIES FOR THE 114TH CONGRESS
71#HBCUStrong UNCF.org/HBCUsMakeAmericaStrong
HBCUs MAKE AMERICA STRONG: THE POSITIVE ECONOMIC IMPACT OF HISTORICALLY BLACK COLLEGES AND UNIVERSITIES T E C H N I C A L R E P O R T
Texas Southern University 1,576 4,740,208,262 3,067,229,082 1,672,979,180
Professional 292 1,272,433,735 741,003,729 531,430,007
Doctoral 37 136,654,598 109,866,420 26,788,178
Master’s 386 1,146,174,003 979,546,025 166,627,978
Bachelor’s 861 2,184,945,926 1,236,812,908 948,133,017
Associate’s 0 0 0 0
Certificate 0 0 0 0
University of Arkansas-Pine Bluff 455 1,165,869,867 682,231,512 483,638,355
Professional 0 0 0 0
Doctoral 0 0 0 0
Master’s 26 77,203,430 65,979,784 11,223,646
Bachelor’s 429 1,088,666,437 616,251,728 472,414,709
Associate’s 0 0 0 0
Certificate 0 0 0 0
University of Maryland Eastern Shore 752 2,108,223,419 1,274,972,467 833,250,952
Professional 81 352,969,632 205,552,404 147,417,228
Doctoral 20 73,867,350 59,387,254 14,480,096
Master’s 68 201,916,664 172,562,512 29,354,152
Bachelor’s 583 1,479,469,773 837,470,297 641,999,476
Associate’s 0 0 0 0
Certificate 0 0 0 0
University of the District of Columbia 759 1,795,409,336 1,184,994,700 610,414,636
Professional 0 0 0 0
Doctoral 0 0 0 0
Master’s 86 255,365,192 218,240,824 37,124,368
Bachelor’s 410 1,040,450,441 588,958,528 451,491,913
Associate’s 263 499,593,703 377,795,348 121,798,354
Certificate 0 0 0 0
University of the Virgin Islands 322 801,709,070 517,607,906 284,101,163
Professional 0 0 0 0
Doctoral 0 0 0 0
Master’s 50 148,468,135 126,884,200 21,583,935
Bachelor’s 214 543,064,376 307,407,622 235,656,755
Associate’s 58 110,176,558 83,316,084 26,860,474
Certificate 0 0 0 0
Institution/Award Number of Recipients
Total Synthetic Work-Life Earnings
(2014 dollars)
Base Earnings (2014 dollars)
Incremental Earnings Due to Degree (2014 dollars)

72 A STUDY COMMISSIONED BY UNCF
HBCUs MAKE AMERICA STRONG: THE POSITIVE ECONOMIC IMPACT OF HISTORICALLY BLACK COLLEGES AND UNIVERSITIES
Virginia State University 955 2,496,002,909 1,550,386,620 945,616,289
Professional 0 0 0 0
Doctoral 8 29,546,940 23,754,902 5,792,038
Master’s 151 448,373,768 383,190,284 65,183,484
Bachelor’s 793 2,012,383,414 1,139,131,982 873,251,432
Associate’s 3 5,698,787 4,309,453 1,389,335
Certificate 0 0 0 0
West Virginia State University 414 1,057,939,715 613,424,861 444,514,854
Professional 0 0 0 0
Doctoral 0 0 0 0
Master’s 17 50,479,166 43,140,628 7,338,538
Bachelor’s 397 1,007,460,549 570,284,233 437,176,316
Associate’s 0 0 0 0
Certificate 0 0 0 0
Winston-Salem State University 1,530 3,986,000,613 2,372,911,614 1,613,088,999
Professional 25 108,941,244 63,442,100 45,499,144
Doctoral 0 0 0 0
Master’s 134 397,894,602 340,049,656 57,844,946
Bachelor’s 1,371 3,479,164,767 1,969,419,858 1,509,744,909
Associate’s 0 0 0 0
Certificate 0 0 0 0
PRIVATE HBCU TOTAL 11,855 32,162,484,341 19,630,282,888 12,532,201,453
Professional 856 3,730,148,211 2,172,257,506 1,557,890,705
Doctoral 206 760,833,707 611,688,716 149,144,990
Master’s 1,219 3,619,653,133 3,093,436,799 526,216,334
Bachelor’s 9,214 23,382,220,396 13,235,765,550 10,146,454,845
Associate’s 305 579,376,728 438,127,685 141,249,042
Certificate 55 90,252,168 79,006,632 11,245,536
Allen University 81 205,552,404 116,355,221 89,197,183
Professional 0 0 0 0
Doctoral 0 0 0 0
Master’s 0 0 0 0
Bachelor’s 81 205,552,404 116,355,221 89,197,183
Associate’s 0 0 0 0
Certificate 0 0 0 0
HBCUHBCU
TABLE 7 continued
Institution/Award Number of Recipients
Total Synthetic Work-Life Earnings
(2014 dollars)
Base Earnings (2014 dollars)
Incremental Earnings Due to Degree (2014 dollars)

UNCF PUBLIC POLICY PRIORITIES FOR THE 114TH CONGRESS
73#HBCUStrong UNCF.org/HBCUsMakeAmericaStrong
HBCUs MAKE AMERICA STRONG: THE POSITIVE ECONOMIC IMPACT OF HISTORICALLY BLACK COLLEGES AND UNIVERSITIES T E C H N I C A L R E P O R T
Arkansas Baptist College 127 269,962,638 182,433,495 87,529,143
Professional 0 0 0 0
Doctoral 0 0 0 0
Master’s 0 0 0 0
Bachelor’s 45 114,195,780 64,641,790 49,553,990
Associate’s 82 155,766,858 117,791,706 37,975,152
Certificate 0 0 0 0
Benedict College 309 784,144,357 443,873,622 340,270,734
Professional 0 0 0 0
Doctoral 0 0 0 0
Master’s 0 0 0 0
Bachelor’s 309 784,144,357 443,873,622 340,270,734
Associate’s 0 0 0 0
Certificate 0 0 0 0
Bennett College 105 266,456,820 150,830,842 115,625,978
Professional 0 0 0 0
Doctoral 0 0 0 0
Master’s 0 0 0 0
Bachelor’s 105 266,456,820 150,830,842 115,625,978
Associate’s 0 0 0 0
Certificate 0 0 0 0
Bethune-Cookman University 509 1,304,199,839 763,105,259 541,094,580
Professional 0 0 0 0
Doctoral 0 0 0 0
Master’s 29 86,111,518 73,592,836 12,518,682
Bachelor’s 480 1,218,088,321 689,512,423 528,575,898
Associate’s 0 0 0 0
Certificate 0 0 0 0
Claflin University 396 1,015,714,832 596,377,744 419,337,089
Professional 0 0 0 0
Doctoral 0 0 0 0
Master’s 25 74,234,068 63,442,100 10,791,967
Bachelor’s 371 941,480,765 532,935,643 408,545,121
Associate’s 0 0 0 0
Certificate 0 0 0 0
Institution/Award Number of Recipients
Total Synthetic Work-Life Earnings
(2014 dollars)
Base Earnings (2014 dollars)
Incremental Earnings Due to Degree (2014 dollars)

74 A STUDY COMMISSIONED BY UNCF
HBCUs MAKE AMERICA STRONG: THE POSITIVE ECONOMIC IMPACT OF HISTORICALLY BLACK COLLEGES AND UNIVERSITIES
Clark Atlanta University 684 1,863,311,767 1,248,455,660 614,856,106
Professional 0 0 0 0
Doctoral 42 155,121,435 124,713,233 30,408,202
Master’s 183 543,393,374 464,396,172 78,997,202
Bachelor’s 459 1,164,796,957 659,346,254 505,450,703
Associate’s 0 0 0 0
Certificate 0 0 0 0
Clinton College 31 62,077,912 44,531,011 17,546,901
Professional 0 0 0 0
Doctoral 0 0 0 0
Master’s 0 0 0 0
Bachelor’s 5 12,688,420 7,182,421 5,505,999
Associate’s 26 49,389,492 37,348,590 12,040,902
Certificate 0 0 0 0
Concordia College Alabama 63 141,369,535 90,498,505 50,871,030
Professional 0 0 0 0
Doctoral 0 0 0 0
Master’s 0 0 0 0
Bachelor’s 34 86,281,256 48,840,463 37,440,793
Associate’s 29 55,088,279 41,658,042 13,430,237
Certificate 0 0 0 0
Dillard University 186 472,009,224 267,186,064 204,823,161
Professional 0 0 0 0
Doctoral 0 0 0 0
Master’s 0 0 0 0
Bachelor’s 186 472,009,224 267,186,064 204,823,161
Associate’s 0 0 0 0
Certificate 0 0 0 0
Edward Waters College 106 268,994,504 152,267,327 116,727,178
Professional 0 0 0 0
Doctoral 0 0 0 0
Master’s 0 0 0 0
Bachelor’s 106 268,994,504 152,267,327 116,727,178
Associate’s 0 0 0 0
Certificate 0 0 0 0
HBCUHBCU
TABLE 7 continued
Institution/Award Number of Recipients
Total Synthetic Work-Life Earnings
(2014 dollars)
Base Earnings (2014 dollars)
Incremental Earnings Due to Degree (2014 dollars)
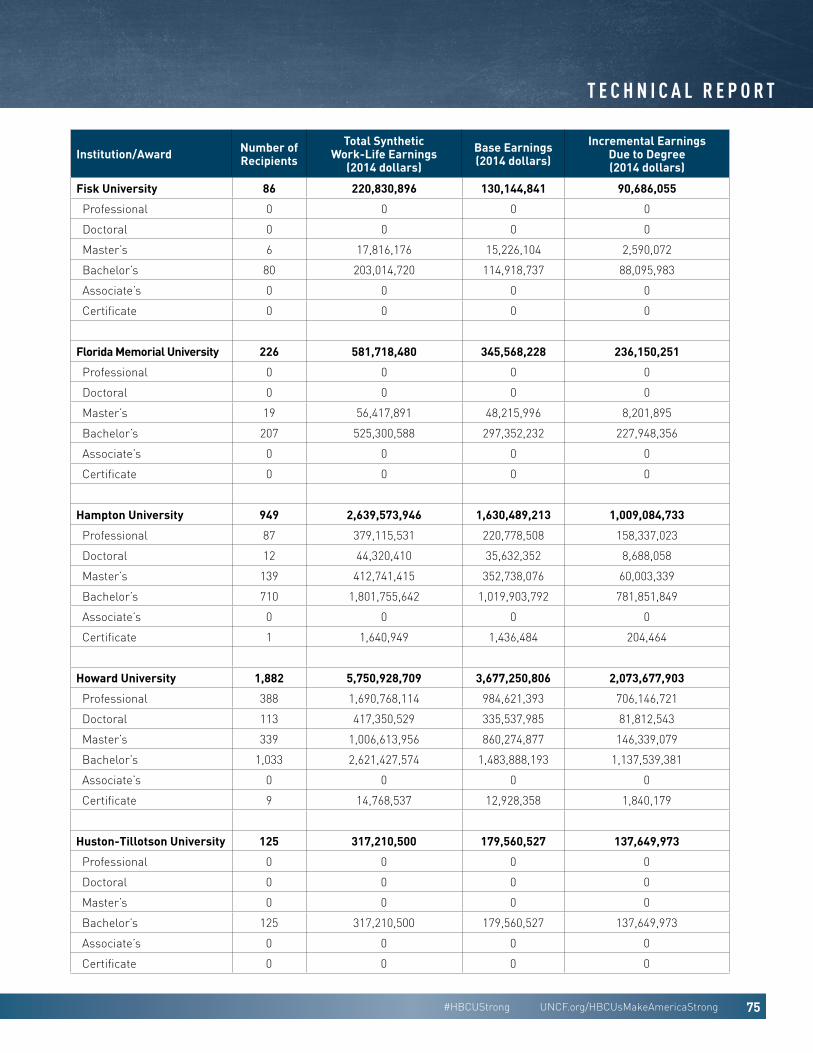
UNCF PUBLIC POLICY PRIORITIES FOR THE 114TH CONGRESS
75#HBCUStrong UNCF.org/HBCUsMakeAmericaStrong
HBCUs MAKE AMERICA STRONG: THE POSITIVE ECONOMIC IMPACT OF HISTORICALLY BLACK COLLEGES AND UNIVERSITIES T E C H N I C A L R E P O R T
Fisk University 86 220,830,896 130,144,841 90,686,055
Professional 0 0 0 0
Doctoral 0 0 0 0
Master’s 6 17,816,176 15,226,104 2,590,072
Bachelor’s 80 203,014,720 114,918,737 88,095,983
Associate’s 0 0 0 0
Certificate 0 0 0 0
Florida Memorial University 226 581,718,480 345,568,228 236,150,251
Professional 0 0 0 0
Doctoral 0 0 0 0
Master’s 19 56,417,891 48,215,996 8,201,895
Bachelor’s 207 525,300,588 297,352,232 227,948,356
Associate’s 0 0 0 0
Certificate 0 0 0 0
Hampton University 949 2,639,573,946 1,630,489,213 1,009,084,733
Professional 87 379,115,531 220,778,508 158,337,023
Doctoral 12 44,320,410 35,632,352 8,688,058
Master’s 139 412,741,415 352,738,076 60,003,339
Bachelor’s 710 1,801,755,642 1,019,903,792 781,851,849
Associate’s 0 0 0 0
Certificate 1 1,640,949 1,436,484 204,464
Howard University 1,882 5,750,928,709 3,677,250,806 2,073,677,903
Professional 388 1,690,768,114 984,621,393 706,146,721
Doctoral 113 417,350,529 335,537,985 81,812,543
Master’s 339 1,006,613,956 860,274,877 146,339,079
Bachelor’s 1,033 2,621,427,574 1,483,888,193 1,137,539,381
Associate’s 0 0 0 0
Certificate 9 14,768,537 12,928,358 1,840,179
Huston-Tillotson University 125 317,210,500 179,560,527 137,649,973
Professional 0 0 0 0
Doctoral 0 0 0 0
Master’s 0 0 0 0
Bachelor’s 125 317,210,500 179,560,527 137,649,973
Associate’s 0 0 0 0
Certificate 0 0 0 0
Institution/Award Number of Recipients
Total Synthetic Work-Life Earnings
(2014 dollars)
Base Earnings (2014 dollars)
Incremental Earnings Due to Degree (2014 dollars)
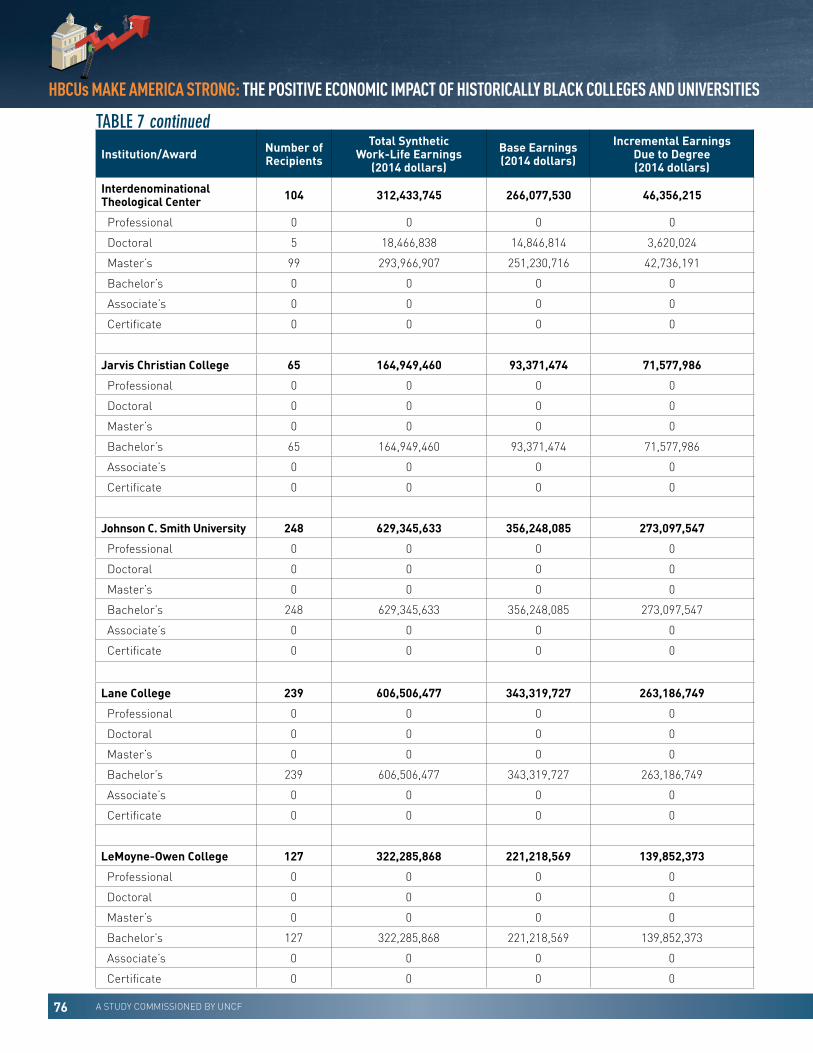
76 A STUDY COMMISSIONED BY UNCF
HBCUs MAKE AMERICA STRONG: THE POSITIVE ECONOMIC IMPACT OF HISTORICALLY BLACK COLLEGES AND UNIVERSITIES
Interdenominational Theological Center 104 312,433,745 266,077,530 46,356,215
Professional 0 0 0 0
Doctoral 5 18,466,838 14,846,814 3,620,024
Master’s 99 293,966,907 251,230,716 42,736,191
Bachelor’s 0 0 0 0
Associate’s 0 0 0 0
Certificate 0 0 0 0
Jarvis Christian College 65 164,949,460 93,371,474 71,577,986
Professional 0 0 0 0
Doctoral 0 0 0 0
Master’s 0 0 0 0
Bachelor’s 65 164,949,460 93,371,474 71,577,986
Associate’s 0 0 0 0
Certificate 0 0 0 0
Johnson C. Smith University 248 629,345,633 356,248,085 273,097,547
Professional 0 0 0 0
Doctoral 0 0 0 0
Master’s 0 0 0 0
Bachelor’s 248 629,345,633 356,248,085 273,097,547
Associate’s 0 0 0 0
Certificate 0 0 0 0
Lane College 239 606,506,477 343,319,727 263,186,749
Professional 0 0 0 0
Doctoral 0 0 0 0
Master’s 0 0 0 0
Bachelor’s 239 606,506,477 343,319,727 263,186,749
Associate’s 0 0 0 0
Certificate 0 0 0 0
LeMoyne-Owen College 127 322,285,868 221,218,569 139,852,373
Professional 0 0 0 0
Doctoral 0 0 0 0
Master’s 0 0 0 0
Bachelor’s 127 322,285,868 221,218,569 139,852,373
Associate’s 0 0 0 0
Certificate 0 0 0 0
HBCUHBCU
TABLE 7 continued
Institution/Award Number of Recipients
Total Synthetic Work-Life Earnings
(2014 dollars)
Base Earnings (2014 dollars)
Incremental Earnings Due to Degree (2014 dollars)

UNCF PUBLIC POLICY PRIORITIES FOR THE 114TH CONGRESS
77#HBCUStrong UNCF.org/HBCUsMakeAmericaStrong
HBCUs MAKE AMERICA STRONG: THE POSITIVE ECONOMIC IMPACT OF HISTORICALLY BLACK COLLEGES AND UNIVERSITIES T E C H N I C A L R E P O R T
Livingstone College 154 390,803,336 221,218,569 169,584,767
Professional 0 0 0 0
Doctoral 0 0 0 0
Master’s 0 0 0 0
Bachelor’s 154 390,803,336 221,218,569 169,584,767
Associate’s 0 0 0 0
Certificate 0 0 0 0
Meharry Medical College 219 851,890,671 560,069,583 291,821,087
Professional 140 610,070,969 355,275,760 254,795,209
Doctoral 10 36,933,675 29,693,627 7,240,048
Master’s 69 204,886,026 175,100,196 29,785,830
Bachelor’s 0 0 0 0
Associate’s 0 0 0 0
Certificate 0 0 0 0
Miles College 196 497,386,064 281,550,906 215,835,158
Professional 0 0 0 0
Doctoral 0 0 0 0
Master’s 0 0 0 0
Bachelor’s 196 497,386,064 281,550,906 215,835,158
Associate’s 0 0 0 0
Certificate 0 0 0 0
Morehouse College 383 932,476,611 550,173,454 382,303,157
Professional 0 0 0 0
Doctoral 0 0 0 0
Master’s 0 0 0 0
Bachelor’s 339 860,274,877 486,968,149 373,306,728
Associate’s 0 0 0 0
Certificate 44 72,201,734 63,205,305 8,996,429
Morehouse School of Medicine 70 267,611,456 178,501,238 89,110,218
Professional 42 183,021,291 106,582,728 76,438,563
Doctoral 2 7,386,735 5,938,725 1,448,010
Master’s 26 77,203,430 65,979,784 11,223,646
Bachelor’s 0 0 0 0
Associate’s 0 0 0 0
Certificate 0 0 0 0
Institution/Award Number of Recipients
Total Synthetic Work-Life Earnings
(2014 dollars)
Base Earnings (2014 dollars)
Incremental Earnings Due to Degree (2014 dollars)

78 A STUDY COMMISSIONED BY UNCF
HBCUs MAKE AMERICA STRONG: THE POSITIVE ECONOMIC IMPACT OF HISTORICALLY BLACK COLLEGES AND UNIVERSITIES
Morris College 152 385,727,968 218,345,601 167,382,368
Professional 0 0 0 0
Doctoral 0 0 0 0
Master’s 0 0 0 0
Bachelor’s 152 385,727,968 218,345,601 167,382,368
Associate’s 0 0 0 0
Certificate 0 0 0 0
Oakwood University 333 850,454,186 493,766,040 356,688,146
Professional 0 0 0 0
Doctoral 0 0 0 0
Master’s 14 41,571,078 35,527,576 6,043,502
Bachelor’s 318 806,983,513 456,801,980 350,181,533
Associate’s 1 1,899,596 1,436,484 463,112
Certificate 0 0 0 0
Paine College 108 274,069,872 155,140,295 118,929,577
Professional 0 0 0 0
Doctoral 0 0 0 0
Master’s 0 0 0 0
Bachelor’s 108 274,069,872 155,140,295 118,929,577
Associate’s 0 0 0 0
Certificate 0 0 0 0
Paul Quinn College 21 53,291,364 30,166,168 23,125,196
Professional 0 0 0 0
Doctoral 0 0 0 0
Master’s 0 0 0 0
Bachelor’s 21 53,291,364 30,166,168 23,125,196
Associate’s 0 0 0 0
Certificate 0 0 0 0
Philander Smith College 108 274,069,872 155,140,295 118,929,577
Professional 0 0 0 0
Doctoral 0 0 0 0
Master’s 0 0 0 0
Bachelor’s 108 274,069,872 155,140,295 118,929,577
Associate’s 0 0 0 0
Certificate 0 0 0 0
HBCUHBCU
TABLE 7 continued
Institution/Award Number of Recipients
Total Synthetic Work-Life Earnings
(2014 dollars)
Base Earnings (2014 dollars)
Incremental Earnings Due to Degree (2014 dollars)

UNCF PUBLIC POLICY PRIORITIES FOR THE 114TH CONGRESS
79#HBCUStrong UNCF.org/HBCUsMakeAmericaStrong
HBCUs MAKE AMERICA STRONG: THE POSITIVE ECONOMIC IMPACT OF HISTORICALLY BLACK COLLEGES AND UNIVERSITIES T E C H N I C A L R E P O R T
Rust College 108 270,879,431 155,140,295 115,739,136
Professional 0 0 0 0
Doctoral 0 0 0 0
Master’s 0 0 0 0
Bachelor’s 103 261,381,452 147,957,874 113,423,578
Associate’s 5 9,497,979 7,182,421 2,315,558
Certificate 0 0 0 0
Saint Augustine’s University 226 573,516,584 324,645,432 248,871,152
Professional 0 0 0 0
Doctoral 0 0 0 0
Master’s 0 0 0 0
Bachelor’s 226 573,516,584 324,645,432 248,871,152
Associate’s 0 0 0 0
Certificate 0 0 0 0
Selma University 27 72,834,255 49,797,072 23,037,183
Professional 0 0 0 0
Doctoral 0 0 0 0
Master’s 10 29,693,627 25,376,840 4,316,787
Bachelor’s 17 43,140,628 24,420,232 18,720,396
Associate’s 0 0 0 0
Certificate 0 0 0 0
Shaw University 305 781,125,749 457,949,282 323,176,468
Professional 0 0 0 0
Doctoral 0 0 0 0
Master’s 18 53,448,529 45,678,312 7,770,217
Bachelor’s 286 725,777,625 410,834,485 314,943,139
Associate’s 1 1,899,596 1,436,484 463,112
Certificate 0 0 0 0
Shorter College 11 20,895,554 15,801,326 5,094,228
Professional 0 0 0 0
Doctoral 0 0 0 0
Master’s 0 0 0 0
Bachelor’s 0 0 0 0
Associate’s 11 20,895,554 15,801,326 5,094,228
Certificate 0 0 0 0
Institution/Award Number of Recipients
Total Synthetic Work-Life Earnings
(2014 dollars)
Base Earnings (2014 dollars)
Incremental Earnings Due to Degree (2014 dollars)
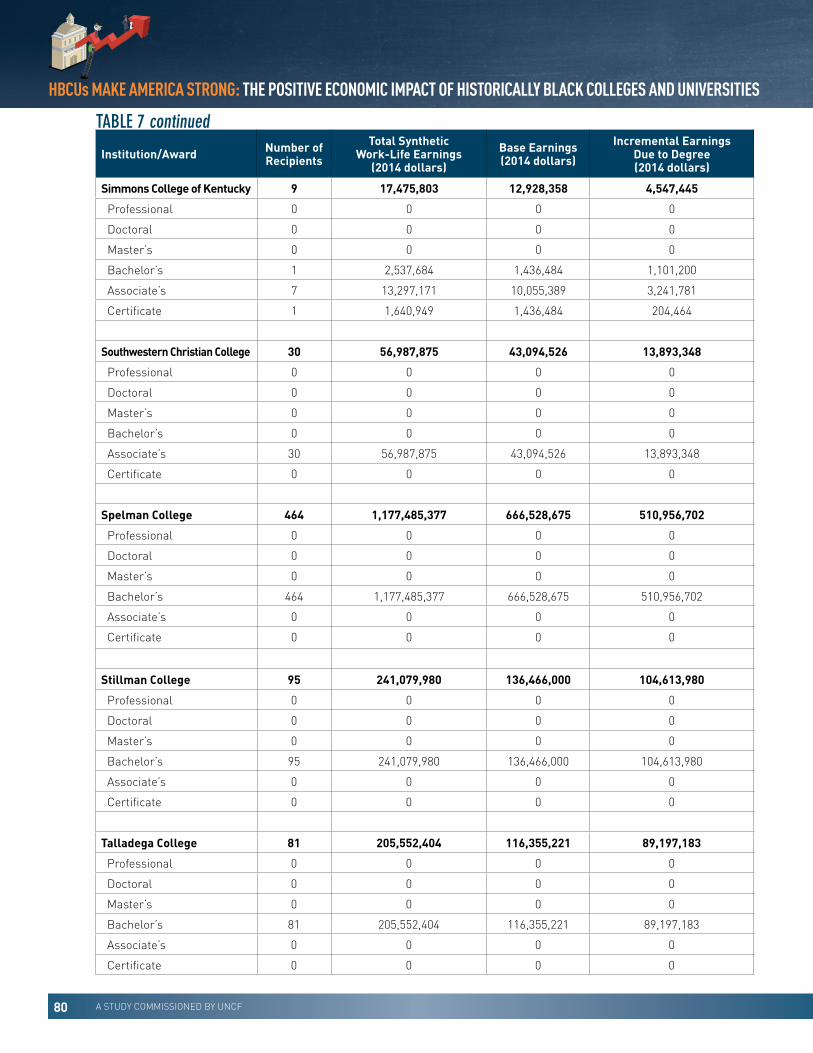
80 A STUDY COMMISSIONED BY UNCF
HBCUs MAKE AMERICA STRONG: THE POSITIVE ECONOMIC IMPACT OF HISTORICALLY BLACK COLLEGES AND UNIVERSITIES
Simmons College of Kentucky 9 17,475,803 12,928,358 4,547,445
Professional 0 0 0 0
Doctoral 0 0 0 0
Master’s 0 0 0 0
Bachelor’s 1 2,537,684 1,436,484 1,101,200
Associate’s 7 13,297,171 10,055,389 3,241,781
Certificate 1 1,640,949 1,436,484 204,464
Southwestern Christian College 30 56,987,875 43,094,526 13,893,348
Professional 0 0 0 0
Doctoral 0 0 0 0
Master’s 0 0 0 0
Bachelor’s 0 0 0 0
Associate’s 30 56,987,875 43,094,526 13,893,348
Certificate 0 0 0 0
Spelman College 464 1,177,485,377 666,528,675 510,956,702
Professional 0 0 0 0
Doctoral 0 0 0 0
Master’s 0 0 0 0
Bachelor’s 464 1,177,485,377 666,528,675 510,956,702
Associate’s 0 0 0 0
Certificate 0 0 0 0
Stillman College 95 241,079,980 136,466,000 104,613,980
Professional 0 0 0 0
Doctoral 0 0 0 0
Master’s 0 0 0 0
Bachelor’s 95 241,079,980 136,466,000 104,613,980
Associate’s 0 0 0 0
Certificate 0 0 0 0
Talladega College 81 205,552,404 116,355,221 89,197,183
Professional 0 0 0 0
Doctoral 0 0 0 0
Master’s 0 0 0 0
Bachelor’s 81 205,552,404 116,355,221 89,197,183
Associate’s 0 0 0 0
Certificate 0 0 0 0
HBCUHBCU
TABLE 7 continued
Institution/Award Number of Recipients
Total Synthetic Work-Life Earnings
(2014 dollars)
Base Earnings (2014 dollars)
Incremental Earnings Due to Degree (2014 dollars)

UNCF PUBLIC POLICY PRIORITIES FOR THE 114TH CONGRESS
81#HBCUStrong UNCF.org/HBCUsMakeAmericaStrong
HBCUs MAKE AMERICA STRONG: THE POSITIVE ECONOMIC IMPACT OF HISTORICALLY BLACK COLLEGES AND UNIVERSITIES T E C H N I C A L R E P O R T
Texas College 101 242,906,233 145,084,906 97,821,327
Professional 0 0 0 0
Doctoral 0 0 0 0
Master’s 0 0 0 0
Bachelor’s 80 203,014,720 114,918,737 88,095,983
Associate’s 21 39,891,512 30,166,168 9,725,344
Certificate 0 0 0 0
Tougaloo College 158 397,763,631 226,964,506 170,799,126
Professional 0 0 0 0
Doctoral 0 0 0 0
Master’s 0 0 0 0
Bachelor’s 153 388,265,652 219,782,085 168,483,568
Associate’s 5 9,497,979 7,182,421 2,315,558
Certificate 0 0 0 0
Tuskegee University 426 1,185,837,102 724,846,163 460,990,940
Professional 40 174,305,991 101,507,360 72,798,631
Doctoral 9 33,240,308 26,724,264 6,516,043
Master’s 50 148,468,135 126,884,200 21,583,935
Bachelor’s 327 829,822,669 469,730,338 360,092,331
Associate’s 0 0 0 0
Certificate 0 0 0 0
Virginia Union University 356 965,186,421 656,227,061 308,959,360
Professional 0 0 0 0
Doctoral 9 33,240,308 26,724,264 6,516,043
Master’s 119 353,354,161 301,984,396 51,369,765
Bachelor’s 228 578,591,952 327,518,401 251,073,552
Associate’s 0 0 0 0
Certificate 0 0 0 0
Virginia University of Lynchburg 121 264,107,734 192,059,302 72,048,432
Professional 0 0 0 0
Doctoral 4 14,773,470 11,877,451 2,896,019
Master’s 11 32,662,990 27,914,524 4,748,466
Bachelor’s 24 60,904,416 34,475,621 26,428,795
Associate’s 82 155,766,858 117,791,706 37,975,152
Certificate 0 0 0 0
Institution/Award Number of Recipients
Total Synthetic Work-Life Earnings
(2014 dollars)
Base Earnings (2014 dollars)
Incremental Earnings Due to Degree (2014 dollars)

82 A STUDY COMMISSIONED BY UNCF
HBCUs MAKE AMERICA STRONG: THE POSITIVE ECONOMIC IMPACT OF HISTORICALLY BLACK COLLEGES AND UNIVERSITIES
Voorhees College 117 296,909,028 168,068,653 128,840,375
Professional 0 0 0 0
Doctoral 0 0 0 0
Master’s 0 0 0 0
Bachelor’s 117 296,909,028 168,068,653 128,840,375
Associate’s 0 0 0 0
Certificate 0 0 0 0
Wilberforce University 108 276,228,266 160,646,294 115,581,972
Professional 0 0 0 0
Doctoral 0 0 0 0
Master’s 5 14,846,814 12,688,420 2,158,393
Bachelor’s 103 261,381,452 147,957,874 113,423,578
Associate’s 0 0 0 0
Certificate 0 0 0 0
Wiley College 181 456,130,364 260,003,643 196,126,721
Professional 0 0 0 0
Doctoral 0 0 0 0
Master’s 0 0 0 0
Bachelor’s 176 446,632,384 252,821,222 193,811,163
Associate’s 5 9,497,979 7,182,421 2,315,558
Certificate 0 0 0 0
Xavier University of Louisiana 539 1,682,223,600 1,013,225,345 668,998,255
Professional 159 692,866,315 403,491,756 289,374,559
Doctoral 0 0 0 0
Master’s 58 172,223,037 147,185,672 25,037,365
Bachelor’s 322 817,134,249 462,547,917 354,586,332
Associate’s 0 0 0 0
Certificate 0 0 0 0
HBCUHBCU
TABLE 7 continued
Institution/Award Number of Recipients
Total Synthetic Work-Life Earnings
(2014 dollars)
Base Earnings (2014 dollars)
Incremental Earnings Due to Degree (2014 dollars)

UNCF PUBLIC POLICY PRIORITIES FOR THE 114TH CONGRESS
83#HBCUStrong UNCF.org/HBCUsMakeAmericaStrong
HBCUs MAKE AMERICA STRONG: THE POSITIVE ECONOMIC IMPACT OF HISTORICALLY BLACK COLLEGES AND UNIVERSITIES T E C H N I C A L R E P O R T
Notes:
Data for the number of students receiving a degree/award were obtained from the U.S. Department of Education, National Center for Educational Statistics, Integrated Postsecondary Education System (IPEDS), DRVC2014 (extracted on May 24, 2016). The number of students receiving a certificate includes all those receiving awards of less than 4 academic years, but does not include those receiving post-baccalaureate or post-master’s certificates (less than 0.5 percent of total degrees/awards granted by HBCUs in 2014) .
The synthetic estimates of work-life earnings for each HBCU are based on estimates of synthetic work-life earnings by educational attainment for professional degrees, doctoral degrees, master’s degrees, bachelor’s degrees, associate’s degrees, and high school diplomas that were obtained from the U.S. Census Bureau, American Community Survey brief, ACSABR/11-04, Table 1, issued October 2012. The estimates of synthetic work-life earnings for certificates, however, were estimated by the author based on data obtained from the U.S. Census Bureau, “What It’s Worth: Field of Training and Economic Status in 2009,” Household Economic Studies, F70-129, February 2012. The synthetic work-life earnings estimates represent expected earnings over a 40-year time period for the population aged 25-64 who maintain full-time, year-round employment the entire period. The estimates therefore are not a prediction, but provide an illustrative example of the magnitude of differences in earnings based on educational attainment over a work life. The U.S. Bureau of Labor Statistics consumer price index for all urban consumers was used to convert dollar amounts to 2014 dollars.
Source: Estimated for the United Negro College Fund by Dr. Jeffrey M. Humphreys, Director of the Selig Center for Economic Growth, Terry College of Business, University of Georgia, 2016.

APPENDIX C: HBCU REGIONAL ECONOMIESUnit ID Public HBCUs 100654 Alabama A&M University Huntsville, AL MSA
100724 Alabama State University Montgomery, AL MSA
138716 Albany State University Albany, GA MSA
175342 Alcorn State University Adams, Claiborne, Jefferson, and Warren counties, MS
102030 Bishop State Community College Mobile and Baldwin counties, AL
237215 Bluefield State College Mercer and McDowell counties, WV & Tazewell County, VA
162007 Bowie State University Washington-Arlington-Alexandria, DC-VA-WV MSA & Baltimore- Columbia-Towson, MD MSA
201690 Central State University Dayton, OH MSA
211608 Cheyney University of Pennsylvania Philadelphia-Camden-Wilmington, PA-NJ-DE-MD MSA
175519 Coahoma Community College Clarksdale, MS Micropolitan Statistical Area
162283 Coppin State University Baltimore-Columbia-Towson, MD MSA
130934 Delaware State University Dover, DE MSA
217989 Denmark Technical College Bamberg and Barnwell counties, SC
198507 Elizabeth City State University Elizabeth City, NC Micropolitan Statistical Area
198543 Fayetteville State University Fayetteville, NC MSA
133650 Florida A&M University Tallahassee, FL MSA
139719 Fort Valley State University Warner Robins MSA and Macon and Crawford counties, GA
101240 Gadsden State Community College Gadsden AL, MSA
159009 Grambling State University Lincoln and Jackson parishes, LA
102313 H. Councill Trenholm State Technical College Montgomery, AL MSA
177551 Harris-Stowe State University St. Louis, MO-IL MSA
101462 J .F .Drake State Community and Technical College Huntsville, AL MSA
175856 Jackson State University Jackson, MS MSA
157058 Kentucky State University Frankfort, KY Micropolitan Statistical Area
207209 Langston University Oklahoma City, OK MSA
101569 Lawson State Community College-Birmingham Birmingham-Hoover, AL MSA
177940 Lincoln University Jefferson City, MO MSA
213598 Lincoln University Philadelphia-Camden-Wilmington, PA-NJ-DE-MD MSA
176044 Mississippi Valley State University Greenwood, MS Micropolitan Statistical Area
163453 Morgan State University Baltimore-Columbia-Towson, MD MSA
232937 Norfolk State University Virginia Beach-Norfolk-Newport News, VA-NC MSA
84 A STUDY COMMISSIONED BY UNCF
HBCUs MAKE AMERICA STRONG: THE POSITIVE ECONOMIC IMPACT OF HISTORICALLY BLACK COLLEGES AND UNIVERSITIES
HBCUHBCU

199102 North Carolina A&T State University Greensboro-High Point, NC MSA
199157 North Carolina Central University Durham-Chapel Hill, NC MSA
227526 Prairie View A&M University Houston-The Woodlands-Sugar Land, TX MSA
140960 Savannah State University
Savannah, GA MSA
102067 Shelton State Community College Tuscaloosa, AL MSA
218733 South Carolina State University Orangeburg, SC Micropolitan Statistical Area
160621 Southern University and A&M College Baton Rouge, LA MSA
160630 Southern University at New Orleans New Orleans-Metairie, LA MSA
160649 Southern University at Shreveport Shreveport-Bossier City, LA MSA
227854 St. Philip’s College San Antonio-New Braunfels, TX MSA
221838 Tennessee State University Nashville-Davidson-Murfreesboro-Franklin, TN MSA
229063 Texas Southern University Houston-The Woodlands-Sugar Land, TX MSA
106412 University of Arkansas - Pine Bluff Pine Bluff, AR MSA
163338 University of Maryland Eastern Shore Salisbury, MD-DE MSA
131399 University of the District of Columbia Washington-Arlington-Alexandria, DC-VA-MD-WV MSA & Baltimore-Columbia-Towson, MD MSA
243665 University of the Virgin Islands Regional economy not defined
234155 Virginia State University Richmond, VA MSA
237899 West Virginia State University Charleston, WV MSA
199999 Winston-Salem State University Winston-Salem, NC MSA
Unit ID Private HBCUs 217624 Allen University
Columbia, SC MSA
106306 Arkansas Baptist College Little Rock-North Little Rock-Conway, AR MSA
217721 Benedict College Columbia, SC MSA
197993 Bennett College Greensboro-High Point, NC MSA
132602 Bethune-Cookman University Deltona-Daytona Beach-Ormond Beach, FL MSA
217873 Claflin University Orangeburg, SC Micropolitan Statistical Area
138947 Clark Atlanta University Atlanta-Sandy Springs-Roswell, GA MSA
217891 Clinton College Charlotte-Concord-Gastonia, NC-SC MSA
101073 Concordia College Alabama Selma, AL Micropolitan Statistical Area
158802 Dillard University New Orleans-Metairie, LA MSA
133526 Edward Waters College Jacksonville, FL MSA
220181 Fisk University Nashville-Davidson-Murfreesboro-Franklin, TN MSA
133979 Florida Memorial University Miami-Fort Lauderdale-West Palm Beach, FL MSA
232265 Hampton University Virginia Beach-Norfolk-Newport News, VA-NC MSA
UNCF PUBLIC POLICY PRIORITIES FOR THE 114TH CONGRESS
85#HBCUStrong UNCF.org/HBCUsMakeAmericaStrong
HBCUs MAKE AMERICA STRONG: THE POSITIVE ECONOMIC IMPACT OF HISTORICALLY BLACK COLLEGES AND UNIVERSITIES T E C H N I C A L R E P O R T

131520 Howard University Washington-Arlington-Alexandria, DC-VA-MD-WV MSA
225575 Huston-Tillotson University Austin-Round Rock, TX MSA
140146 Interdenominational Theological Center Atlanta-Sandy Springs-Roswell, GA MSA
225885 Jarvis Christian College Wood, Smith, Upshur, and Gregg counties, TX
198756 Johnson C. Smith University Charlotte-Concord-Gastonia, NC-SC MSA
220598 Lane College Jackson, TN MSA
220604 Le Moyne-Owen College Memphis, TN-MS-AR MSA
198862 Livingstone College Charlotte-Concord-Gastonia, NC-SC MSA
220792 Meharry Medical College Nashville-Davidson-Murfreesboro-Franklin, TN MSA
101675 Miles College Birmingham-Hoover, AL MSA
140553 Morehouse College Atlanta-Sandy Springs-Roswell, GA MSA
140562 Morehouse School of Medicine Atlanta-Sandy Springs-Roswell, GA MSA
218399 Morris College Sumter, SC MSA
101912 Oakwood University Huntsville, AL MSA
140720 Paine College Augusta-Richmond County, GA-SC MSA
227429 Paul Quinn College Dallas-Fort Worth-Arlington, TX MSA
107600 Philander Smith College Little Rock-North Little Rock-Conway, AR MSA
176318 Rust College Memphis, TN-MS-AR MSA
199582 Saint Augustine’s University Raleigh, NC MSA
102058 Selma University Selma, AL Micropolitan Statistical Area
199643 Shaw University Raleigh, NC MSA
107840 Shorter College Little Rock-North Little Rock-Conway, AR MSA
461759 Simmons College of Kentucky Louisville/Jefferson County, KY-IN MSA
228486 Southwestern Christian College Dallas-Fort Worth-Arlington, TX MSA
141060 Spelman College Atlanta-Sandy Springs-Roswell, GA MSA
102270 Stillman College Tuscaloosa, AL MSA
102298 Talladega College Talladega-Sylacauga, AL Micropolitan Statistical Area
228884 Texas College Tyler, TX MSA
176406 Tougaloo College Jackson, MS MSA
102377 Tuskegee University Elmore, Macon, and Montgomery counties, AL
234164 Virginia Union University Richmond, VA MSA
234137 Virginia University of Lynchburg Lynchburg, VA MSA
218919 Voorhees College Bamberg and Orangeburg counties, SC
206491 Wilberforce University Dayton, OH MSA
APPENDIX C - HBCU REGIONAL ECONOMIES continued
86 A STUDY COMMISSIONED BY UNCF
HBCUs MAKE AMERICA STRONG: THE POSITIVE ECONOMIC IMPACT OF HISTORICALLY BLACK COLLEGES AND UNIVERSITIES
HBCUHBCU

UNCF PUBLIC POLICY PRIORITIES FOR THE 114TH CONGRESS
87#HBCUStrong UNCF.org/HBCUsMakeAmericaStrong
HBCUs MAKE AMERICA STRONG: THE POSITIVE ECONOMIC IMPACT OF HISTORICALLY BLACK COLLEGES AND UNIVERSITIES T E C H N I C A L R E P O R T
REFERENCES
College Board (2013). Trends in College Pricing, 2013. Retrieved from www.collegeboard.org.
College Board (2014). Trends in College Pricing, 2014. Retrieved from www.collegeboard.org.
Ewert, S. (2012). What It’s Worth: Field of Training and Economic Status in 2009: Household Economic Studies. Current Population Reports, P70-129. U.S. Department of Commerce, Economics and Statistics Administration, U.S. Census Bureau.
Executive Office of the President, Office of Management and Budget (2013). OMB Bulletin No. 13-01. Revised Delineations of Metropolitan Statistical Areas, Micropolitan Statistical Areas, and Combined Statistical Areas, and Guidance on Uses of the Delineations of These Areas.
Gallup, Inc. (2015). Gallup-USA Funds Minority College Graduates Report. Retrieved from: www.gallup.com/services/186305/gallup-usa-funds-minority-college-graduates-report.aspx.
Fortune 500 (2016). Retrieved from http://fortune.com/fortune500.
Humphreys, J. (2005). Economic Impact of the Nation’s Historically Black Colleges and Universities (NCES 2007-178). U.S. Department of Education, National Center for Education Statistics. Washington DC: U.S. Government Printing Office.
IMPLAN Group LLC (2016). 2014 IMPLAN Online National Package. Retrieved from https://implan.com.
Julian, T. and Kominski, R. (2011). Education and Synthetic Work-Life Earnings Estimates. American Community Survey Reports, ACS-14. U.S. Department of Commerce, Economics and Statistics Administration, U.S. Census Bureau.
Julian, T. (2012). Work-Life Earnings by Field of Degree and Occupation for People with a Bachelor’s Degree: 2011. American Community Survey Briefs, ACSBR/11-04. U.S. Department of Commerce, Economics and Statistics Administration, U.S. Census Bureau.
National Science Foundation, National Center for Science and Engineering Statistics (2015). Science and Engineering Degrees, by Race/Ethnicity of Recipients: 2002-12, Detailed Statistical Tables, NSF 15-321.
Paulin, G.D. (2001). Expenditures of College-Age Students and Nonstudents. Monthly Labor Review, pp, 46-50.
President’s Board of Advisors on Historically Black Colleges and Universities (2005). The Mission Continues: Annual Report to the President on the Results of Participation of Historically Black Colleges and Universities in Federal Programs, 2002-03. Jessup. MD: Education Publications Center, U.S. Department of Education.

Purnell, H. (2016). The History of Historically Black Colleges and Universities: A Tradition Rich in History. College View. Retrieved from http://www.collegeview.com/articles/article/the-history-of-historically-black-colleges-and-universities.
U.S. Department of Education, National Center for Education Statistics (2016). Integrated Postsecondary Education Data System (IPEDS).
U.S. Department of Education, National Center for Education Statistics (2015). Integrated Postsecondary Education Data System (IPEDS), 2015-16 Data Collection Systems Survey Materials: Glossary.
U.S. Department of Education, National Center for Education Statistics (2015). Integrated Postsecondary Education Data System (IPEDS), 2014-15. Methodology Report, NCES 2015-098.
U.S. Department of Education, National Center for Education Statistics (2015). Digest of Education Statistics, Tables 306.20, 313.10, 313.20, 313.30, 322.20, 323.20, and 324.30.
U.S. Department of Education, National Center for Education Statistics (2015). IPEDS Data Center User Manual (2015).
U.S. Department of Education, National Center for Education Statistics (2014). Integrated Postsecondary Education Data System (IPEDS), 2013-14 Methodology Report, NCES 2014-067.
U.S. Department of Education, Office for Civil Rights (1991). Historically Black Colleges and Universities and Higher Education Desegregation. http://www2.ed.gov.
U.S. Department of Labor, Bureau of Labor Statistics (2016). Online data extraction of the consumer price index, all urban consumers (current series), all items. Retrieved from: http://www/bls.gov.
U.S. Department of Labor, Bureau of Labor Statistics (2015). Consumer Expenditure Surveys. Table 3403 – Consumer units of one person by income before taxes: Average annual expenditures and characteristics, Consumer Expenditure Survey, 2013-2014. Table 3202 – Consumer units with reference person under age 25 by income before taxes: Average annual expenditures and characteristics, Consumer Expenditure Survey, 2013-2014. Retrieved from http://www.bls.gov/CEX.
Upton, R. and Tannenbaum, C. (2014). The Role of Historically Black Colleges and Universities as Pathway Providers: Institutional Pathways to the STEM PhD Among Black Students. American Institutes for Research, Issue Brief.
88 A STUDY COMMISSIONED BY UNCF
HBCUs MAKE AMERICA STRONG: THE POSITIVE ECONOMIC IMPACT OF HISTORICALLY BLACK COLLEGES AND UNIVERSITIES
HBCUHBCU

UNCF PUBLIC POLICY PRIORITIES FOR THE 114TH CONGRESS
89#HBCUStrong UNCF.org/HBCUsMakeAmericaStrong
HBCUs MAKE AMERICA STRONG: THE POSITIVE ECONOMIC IMPACT OF HISTORICALLY BLACK COLLEGES AND UNIVERSITIES T E C H N I C A L R E P O R T
NOTES___________________________________________________________________________________________
___________________________________________________________________________________________
___________________________________________________________________________________________
___________________________________________________________________________________________
___________________________________________________________________________________________
___________________________________________________________________________________________
___________________________________________________________________________________________
___________________________________________________________________________________________
___________________________________________________________________________________________
___________________________________________________________________________________________
___________________________________________________________________________________________
___________________________________________________________________________________________
___________________________________________________________________________________________
___________________________________________________________________________________________
___________________________________________________________________________________________
___________________________________________________________________________________________
___________________________________________________________________________________________
___________________________________________________________________________________________
___________________________________________________________________________________________
___________________________________________________________________________________________
___________________________________________________________________________________________
___________________________________________________________________________________________
___________________________________________________________________________________________
90 A STUDY COMMISSIONED BY UNCF
HBCUs MAKE AMERICA STRONG: THE POSITIVE ECONOMIC IMPACT OF HISTORICALLY BLACK COLLEGES AND UNIVERSITIES
HBCUHBCU

UNCF PUBLIC POLICY PRIORITIES FOR THE 114TH CONGRESS
91#HBCUStrong UNCF.org/HBCUsMakeAmericaStrong
HBCUs MAKE AMERICA STRONG: THE POSITIVE ECONOMIC IMPACT OF HISTORICALLY BLACK COLLEGES AND UNIVERSITIES

#HBCUStrong
HBCUs Make America Strong:THE POSITIVE ECONOMIC IMPACT OF HISTORICALLY BLACK COLLEGES AND UNIVERSITIES
United Negro College Fund, Inc. 1805 7th Street, NW Washington, DC 20001 T 800 331 2244
UNCF.org /HBCUsMakeAmericaStrong
T E C H N I C A L R E P O R T
UNCF is grateful for the generous support of the Citi Foundation that made this report possible.