HAZARD PERCEPTION TRAINING FOR ADOLESCENTS WITH …
104
HAZARD PERCEPTION TRAINING FOR ADOLESCENTS WITH AUTISM SPECTRUM DISORDER ON THE INTERACTIVE DRIVING SIMULATOR: USING EYE TRACKING TECHNOLOGY TO DETERMINE EFFECTIVENESS By Tara Jean Baran May, 2020 Thesis Director: Dr. Anne Dickerson, PhD, OTR/L, SCDCM, FAOTA, FGSA Department: Occupational Therapy Rationale: Driving is an important developmental milestone for all adolescents as it increases their independence and ability to participate in vehicle-dependent activities. However, adolescents with high functioning autism spectrum disorder (HFASD) are less likely to obtain licenses and drive independently due to characteristics related to their diagnosis. Although current research exists exploring the efficacy of driving simulator training for adolescent drivers with HFASD and eye tracking, there is a gap in the literature related to training on the simulator and its effects on overall driving performance and hazard perception and response in this population. Purpose: This pilot study utilized a training protocol on the simulator that included hazard perception to determine its effect on overall driving performance. Eye tracking technology was used to determine if there was a change in hazard perception and response to non-social and social hazards after training. Design: This study was a one group, pretest-posttest intervention design. Methods: There were 17 participants between the ages of 15 and 22 with a self-reported diagnosis of ASD and a desire to learn to drive independently. Each participant completed a pre-test and post-test on the driving simulator while wearing eye tracking
Transcript of HAZARD PERCEPTION TRAINING FOR ADOLESCENTS WITH …

HAZARD PERCEPTION TRAINING FOR ADOLESCENTS WITH AUTISM SPECTRUM
DISORDER ON THE INTERACTIVE DRIVING SIMULATOR:
USING EYE TRACKING TECHNOLOGY TO DETERMINE EFFECTIVENESS
By
Tara Jean Baran
May, 2020
Thesis Director: Dr. Anne Dickerson, PhD, OTR/L, SCDCM, FAOTA, FGSA
Department: Occupational Therapy
Rationale: Driving is an important developmental milestone for all adolescents as it increases
their independence and ability to participate in vehicle-dependent activities. However,
adolescents with high functioning autism spectrum disorder (HFASD) are less likely to obtain
licenses and drive independently due to characteristics related to their diagnosis. Although
current research exists exploring the efficacy of driving simulator training for adolescent drivers
with HFASD and eye tracking, there is a gap in the literature related to training on the simulator
and its effects on overall driving performance and hazard perception and response in this
population. Purpose: This pilot study utilized a training protocol on the simulator that included
hazard perception to determine its effect on overall driving performance. Eye tracking
technology was used to determine if there was a change in hazard perception and response to
non-social and social hazards after training. Design: This study was a one group, pretest-posttest
intervention design. Methods: There were 17 participants between the ages of 15 and 22 with a
self-reported diagnosis of ASD and a desire to learn to drive independently. Each participant
completed a pre-test and post-test on the driving simulator while wearing eye tracking

technology. Each participant completed a protocol of 30 learning modules with scenarios related
to driving skills and hazard detection and response in one-to-one training. Analysis: Driving
performance was measured by a quantitative score from a standardized observational tool for
driving. Eye tracking measures including fixation duration, fixation count, and time to first
fixation were analyzed using a Wilcoxon Signed Rank Test. Results: Participants significantly
increased their overall driving performance scores pre-test to post-test. Results of hazard
perception using eye tracking technology tended towards improvement overall, but specific
hazard results were inconsistent and varied for both non-social and social hazards in terms of
fixation duration, fixation count, and time to first fixation. Discussion: Findings from this study
indicate driving simulator training related to hazard perception was effective in improving
overall driving simulator performance in adolescents with HFASD. Additionally, findings
indicate hazard perception and response differs for this population after hazard perception
training, but specific eye tracking measures may increase or decrease, and results may not be
specific to non-social or social hazards.


i
HAZARD PERCEPTION TRAINING FOR ADOLESCENTS WITH AUTISM SPECTRUM
DISORDER ON THE INTERACTIVE DRIVING SIMULATOR:
USING EYE TRACKING TECHNOLOGY TO DETERMINE EFFECTIVENESS
A Thesis
Presented to the Faculty of the Department of Occupational Therapy
East Carolina University
In Partial Fulfillment of the Requirements for the Degree
Master of Science in Occupational Therapy
By
Tara Jean Baran
May, 2020

ii
© Tara Jean Baran, 2020

iii
HAZARD PERCEPTION TRAINING FOR ADOLESCENTS WITH AUTISM SPECTRUM
DISORDER ON THE INTERACTIVE DRIVING SIMULATOR:
USING EYE TRACKING TECHNOLOGY TO DETERMINE EFFECTIVENESS
By
Tara Jean Baran
APPROVED BY:
DIRECTOR OF THESIS: ________________________________________________________
Anne E. Dickerson, PhD
COMMITTEE MEMBER: _______________________________________________________
Denise Donica, DHS
COMMITTEE MEMBER: _______________________________________________________
Xiangming Fang, PhD
DEPARTMENT CHAIRPERSON:_________________________________________________
Denise Donica, DHS
DEAN OF THE GRADUATE SCHOOL: ___________________________________________
Paul J. Gemperline, PhD

iv
Acknowledgments
I would like to thank my parents for their never-ending support and encouragement
throughout my education and especially during this thesis process. I would like to thank Mary-
Grace McDonald for her friendship and invaluable assistance with data collection and analysis. I
am fortunate to have you as a fellow thesis student to solve problems, brainstorm ideas, and
complete research with throughout my time in graduate school. Sincere thanks also go to
Kimberly Fitzgerald, as this research would not have been completed without her consistent
willingness to complete P-Drive assessments, collect data, and interact with my participants. I
am indebted to Kelly Semon for acting as my sounding board and enthusiastically discussing my
thesis with me no matter what time of day (or night) I called. I would also like to extend my
gratitude to my thesis committee, Dr. Denise Donica and Dr. Xianming Fang for their feedback,
insight, and assistance throughout this project. I appreciate you both for holding me to the
highest standards of research and helping to ensure my writing was concise and understandable. I
would like to give special acknowledgment to my thesis advisor, Dr. Anne Dickerson. Your
research expertise and comprehensive knowledge about driving helped to inspire my path of
research. You provided extensive personal and professional guidance and taught me to not only
be a better researcher, but also a better occupational therapist. Your patience, understanding, and
advice ensured this research was completed and you have taught me more than I could ever give
you credit for here. I am proud to not only be your student and mentee, but one day your
colleague in the field of occupational therapy.

v
Table of Contents List of Tables ................................................................................................................................ vii
Chapter 1: Introduction ................................................................................................................... 1
Chapter 2: Literature Review .......................................................................................................... 5
Model of Driving ........................................................................................................................ 5
Learning to Drive ........................................................................................................................ 5
Driving Simulator ....................................................................................................................... 7
HFASD and Driving ................................................................................................................... 8
Performance Skills for Driving ................................................................................................... 9
Motor/Physical Factors ........................................................................................................... 9
Sensory/Perceptual Factors ................................................................................................... 11
Cognitive/Processing Factors................................................................................................ 12
Social Interaction factors ...................................................................................................... 13
Driving Simulation.................................................................................................................... 15
Evaluation ............................................................................................................................. 15
Training ................................................................................................................................. 16
Hazard Perception, Recognition and Response ........................................................................ 17
Summary ................................................................................................................................... 22
Chapter 3: Methods ....................................................................................................................... 25
Design ....................................................................................................................................... 25
Participants ................................................................................................................................ 25
Equipment ................................................................................................................................. 26
Tobii Pro Glasses 2. .............................................................................................................. 26
WT-960 TRAN-SIT Car Transfer Simulator and STISIM OT DRIVE Simulator System. . 27
DriveSafety RS 200. ............................................................................................................. 27
Instrumentation and Outcome Measures .................................................................................. 28
Tobii Pro Lab Analyzer Software ......................................................................................... 28
P-Drive .................................................................................................................................. 28
Procedure .................................................................................................................................. 30
Data Analysis ............................................................................................................................ 32
Chapter 4: Results ......................................................................................................................... 33
Change in Driving Performance ............................................................................................... 33
Non-Social Hazards .............................................................................................................. 34
Social Hazards ...................................................................................................................... 38

vi
Chapter 5: Discussion ................................................................................................................... 43
Change in Driving Performance ............................................................................................... 43
Driving Performance Change due to Training ...................................................................... 45
Change in Hazard Perception.................................................................................................... 49
Non-Social Hazards .............................................................................................................. 50
Social Hazards ...................................................................................................................... 54
Skill Development .................................................................................................................... 58
Implications for Occupational Therapy Practice ...................................................................... 59
Limitations ................................................................................................................................ 59
Chapter 6: Conclusion................................................................................................................... 62
References ................................................................................................................................. 63
Appendix A: IRB Approval Letter ............................................................................................... 74
Appendix B: Tobii Pro Glasses 2 Photos ...................................................................................... 75
Appendix C: Description of Tobii Software Terms and Tools .................................................... 77
Appendix D: Example Diagrams of AOIs .................................................................................... 78
Appendix E: P-Drive Scoring Manual ......................................................................................... 79
Appendix F: P-Drive Score Sheet................................................................................................ 88
Appendix G: Road Test Version 1 and 2 Description ................................................................. 89
Appendix H: Simulator Protocol Scenarios and Objectives (DriveSafety & Clemson University,
2019) ............................................................................................................................................. 91

vii
List of Tables
1. Participant Demographics
2. Wilcoxon Signed Rank Test Comparing P-Drive Scores
3. Wilcoxon Signed Rank Test Comparing Eye Tracking Metrics for Head-on Collision
4. Wilcoxon Signed Rank Test Comparing Eye Tracking Metrics for Hidden Stop Sign
5. Wilcoxon Signed Rank Test Comparing Eye Tracking Metrics for Trucks on Right
6. Wilcoxon Signed Rank Test Comparing Eye Tracking Metrics for Left Turn Oncoming
Traffic
7. Wilcoxon Signed Rank Test Comparing Eye Tracking Metrics for Left Turn Traffic Light
8. Wilcoxon Signed Rank Test Comparing Eye Tracking Metrics for Bicyclist
9. Wilcoxon Signed Rank Test Comparing Eye Tracking Metrics for Pedestrian.
10. Wilcoxon Signed Rank Test Comparing Eye Tracking Metrics for School Crosswalk.
11. Wilcoxon Signed Rank Test Comparing Eye Tracking Metrics for Pedestrian

1
Chapter 1: Introduction
Autism spectrum disorder (ASD) is a neurodevelopmental disability with social,
communication, and behavioral challenges typically characterized by impaired social interaction,
repetitive behavior, difficulty developing relationships, and difficulty communicating both
verbally and non-verbally (American Psychiatric Association, 2013). The most recent Diagnostic
and Statistical Manual of Mental Disorders (DSM) DSM-5 created an umbrella term autism
spectrum disorder that offers in-depth descriptions of core features, with general examples to
determine a child’s need for clinical services (Lai et al., 2014).
As defined as a spectrum disorder, individuals with ASD have a wide range of symptoms
with the severity of symptoms differing between individuals. The DSM-5 specifies three levels
of severity for ASD, Level 3 “requiring very substantial support,” Level 2 “requiring substantial
support,” and Level 1 “requiring support” (American Psychiatric Association, 2013). For
example, those that experience significant deficits in social interaction and restricted, repeated
behaviors that interfere with all functioning would be classified with severity level 3. However,
individuals that have difficulty initiating social interactions or have restricted, repeated behaviors
that interfere with functioning in specific contexts would be classified with severity level 1.
Although, the term high functioning autism spectrum disorder (HFASD) is no longer used in the
DSM-5, it can be used to identify individuals with ASD classified as severity level 1. Before the
DSM-5 changed terminology, studies found those with HFASD typically present with little
language difficulty, high cognitive skills, and often succeed in higher education, secure full-time
work, developed relationships leading to marriage and families, and live independently
(Cederlund et al., 2008; Howlin, 2000; Levy & Perry, 2011). However, even those with HFASD,

2
or ASD classified as severity level 1, still need assistance with everyday living skills and thus,
need occupational therapy evaluation and intervention (Monahan, 2012).
In the United States, the Centers for Disease Control and Prevention (CDC) estimate the
number of children with ASD every two years, using the largest ASD tracking system, The
Autism and Developmental Disabilities Monitoring Network (ADDM) (Maenner et al., 2020).
Currently, the CDC reports the prevalence of ASD in the United States as 1 in 54, with an
estimated 2 million people diagnosed with ASD, compared to 2002, when the prevalence was
only 1 in 150 (Maenner et al., 2020). This indicates the rate of children diagnosed with ASD has
almost tripled in the last 20 years and a half-million people with ASD will be of driving age in
the coming decade (Lubin & Feeley, 2016).
In the Occupational Therapy Practice Framework: Domain and Process (2014), driving
and community mobility is one of the identified instrumental activities of daily living (IADLs) in
the domain of practice for occupational therapy practitioners (American Occupational Therapy
Association, 2014 [AOTA]). Typically, IADLs require higher level thinking and organizational
skills with driving being the most complex, largely due to the unpredictable and dynamic nature
of the environment in which driving is performed. Thus, an emphasis needs to be placed on the
importance of occupational therapy to address the needs of these individuals from a perspective
of complex IADLs, including driving to live independently, especially as the prevalence of
children with ASD has increased.
Research has shown driving is essential to helping those with ASD gain employment,
participate in social activities, and attain a high quality of life (Curry et al., 2017; Huang et al.,
2012; Lubin & Feeley, 2016). However, driver’s license rates in the adolescent population with
ASD are lower than rates in the general population (Curry et al., 2017; Lubin & Feeley, 2016).

3
This is likely because characteristics of ASD (e.g., executive functioning issues, impaired motor
coordination, problems with attention, rigidity in thinking, increased levels of anxiety,
understanding non-verbal communication) are barriers to independent driving (Almberg et al.,
2017; Classen, Monahan, & Wang, 2013; Daly et al., 2014; Reimer et al., 2013).
Obtaining a driver’s license is an intricate process, where each new driver must acquire a
set of new and complex skills. This process may be impossible for adolescents with ASD
classified as level 2 and 3. It may also be more difficult for adolescents with HFASD or those
with severity level 1, making them less likely to obtain a driver’s license, despite its importance
for working and/or living independently. Therefore, occupational therapy practitioners are in a
unique position and have the requisite education and skill set to assist those with HFASD in
driving skills to increase the likelihood they achieve their independent living goals (Monahan,
2012) as driving is within the occupational therapy practitioner’s scope of practice (AOTA,
2014). In fact, occupational therapy practitioners have an ethical obligation to assist adolescents
with HFASD with obtaining a license, and they should consider how to address the skills and
abilities needed to increase safety and fitness to drive (Hunt & Slater, 2012; Monahan, 2012).
Occupational therapy practitioners must develop and use evidence-based guidelines, resources,
and studies which help support the opportunities to increase the likelihood those with HFASD
will achieve goals of becoming independent and driving themselves.
One evidence-based method for increasing fitness to drive and safety for adolescents with
HFASD is using interactive driving simulators. Driving simulators offer clinicians a safe,
objective alternative to on-road driving (Classen, 2017; Mullen et al., 2011). Studies have shown
that simulators can demonstrate the differences between driving skills in adolescents with
HFASD and their typically developing peers, while others use simulators to attempt to train

4
driving skills in adolescents with HFASD (Brooks et al., 2016; D. J. Cox et al., 2017; S. M. Cox
et al., 2016). However, there are few evidence-based studies demonstrating successful
intervention strategies or protocols. Therefore, studies designed to develop interactive driving
simulator training protocols for adolescents with HFASD should continue to be investigated to
determine the most effective methods of intervention.

5
Chapter 2: Literature Review
Model of Driving
Michon’s (1985) Hierarchy of Driving Behavior categorizes driving into three levels of
behavior: operational, tactical, and strategic (Michon, 1985). An updated description of
Michon’s levels of behavior can be used to more fully understand what these levels of driving
behavior indicate and how they relate to the skills needed to learn to drive and continuously drive
safely (Transportation Research Board [TRB], 2016).
• The Operational level: Controlling the motor vehicle through the physical actions of
steering the wheel, moving or shifting gears, pressing the accelerator or brake, or using
the turn signals. Draws upon skills that are overlearned and habitual so that performance
of such actions is largely automatic.
• The Tactical level: Executing maneuver control over the vehicle to complete a goal
directed trip in response to prevailing conditions; including behaviors that are typically
learned and practiced such as maintaining lane position or speed, obstacle avoidance, gap
acceptance, obeying traffic signals, turning, and passing other vehicles.
• The Strategic level: The general planning of a trip, including trip goals, route, and modal
choice with the associated costs and risks involved; This also includes the ability to adapt
plans when necessary such as changing a route due to a crash or construction, needing to
make an unexpected stop (e.g., to use a bathroom), a change in a trip’s goals, or seeking
help if lost.
Learning to Drive
Driving is considered an integral part of development and maturation for teenagers
because they gain the ability to transport themselves to vehicle-dependent activities

6
independently when they acquire their license. The U.S Department of Transportation estimates
87% of those who are age-eligible to drive have a license (U.S. Department of Transportation:
Federal Highway Administration, 2014) and a study by Huang et. al (2012) found teens with
driver’s licenses were more likely to hold a paid job, attend full-time regular education, and plan
to go to college than teens who were age-eligible for a license but did not have one.
The process to obtain a license is different depending on where a person lives as state
governments have jurisdiction over transportation laws. Most states in the U.S utilize a
Graduated Driver Licensing (GDL) policy to provide adolescent novice drivers with a clear
process to work towards obtaining a driver’s license. GDL policies typically include driver’s
education and supervised driving requirements as well as restrictions about when and how
adolescents can drive (Chen et al., 2006). Driver’s education requirements vary from state to
state, but in North Carolina, driver’s education includes 30 hours of classroom instruction
followed by six hours of behind the wheel instruction. However, in all states, driver’s education
includes the “rules of the road” and the basic driving skills of steering, using pedals, lane
maintenance, turning, and speed maintenance.
As driving instructors typically teach driver’s education classes to adolescents, it is important
to understand a driving instructor’s purpose and teaching role related to Michon’s Hierarchy of
Driving Behavior. Driving instructors focus on teaching adolescents how to handle and drive a
motor vehicle (operational level skills) and knowledge about the rules of the road (tactical level
skills) (Dickerson et al., 2018). They typically do not focus on teaching strategic skills, such as
adapting to the environment or planning routes. Once a teenager completes driver’s education,
they obtain a driver’s permit and can drive when accompanied by a licensed adult driver.
Teenagers obtain the most practice driving with supervision and learn the most strategic skills

7
when they have their driver’s permit (Simons-Morton & Ouimet, 2006). After a specific amount
of time with a driver’s permit, a teenager takes a road test to gain a driver’s license, which allows
them to drive a vehicle without supervision.
Driving Simulator
Driving simulators are computer-controlled technology made to mimic driving in a
virtual context, usually used for training or research. Driving simulators are typically divided
into two groups, high fidelity research or clinical driving simulators (Classen, 2017). High
fidelity research simulators are systems that include actual vehicles and extensive visualization
needing technicians to program; typically, complex, expensive, and used for driving-related
research in multiple fields. Clinical driving simulators are smaller systems with only the main
controls of a vehicle and are designed for health professionals for rehabilitation or research.
Clinical driving simulators, like high fidelity simulators, are also representative of driving on real
roads with the software responding interactively with the “driver’s” responses. Interactive
driving simulators designed for clinical use typically have a driver cab, monitors to visualize the
driving scenarios, and driver controls (e.g., steering wheel, gas/brake pedals, turn signals).
Interactive driving simulators provide an impression of driving, are safe, use relatively less
space, and are cost-effective. They allow practitioners and/or researchers to obtain objective data
and create standardized evaluation or intervention protocols (Classen, 2017).
Many studies have reported driving simulation has moderate to high reliability and is
appropriate for measuring driving performance (Classen & Akinwuntan, 2017). Driving
simulation has also demonstrated concurrent validity (predicts similar outcomes) with driving on
real roads (Shechtman et al., 2009). Additionally, several studies have found simulated driving

8
behavior has relative validity (approximates driving behavior) with on-road driving behavior
(Mullen et al., 2011; Bella, 2008; Lee et al., 2003).
Driving simulators have been used in research with multiple populations and diagnoses
including, but not limited to developmental disabilities or intellectual disabilities (Brooks et al.,
2014), veterans (George & de la Perrelle, 2017), older adults (Lee et al., 2003; Selander et al.,
2013), Multiple Sclerosis (Harand et al., 2018), Parkinson’s disease (Devos et al., 2016) stroke or
brain injury (Blane et al., 2018), and ASD (Brooks et al., 2016; D. J. Cox et al., 2017; N. B. Cox
et al, 2012; S. M. Cox et al., 2016).
HFASD and Driving
ASD, even for those that are classified with severity level 1, can affect an adolescent’s
ability to obtain a license. There is evidence that those with ASD obtain licenses less often than
their typically developing peers. Lubin and Feeley (2016) found only 24% of adults with ASD
report driving themselves, as most transportation needs are met by a family member or friend,
and 75% of adults in the general population report driving themselves (Lubin & Feeley, 2016).
This incongruity in driving rates between those with ASD and the typically developing
population was supported by another study by Curry et al. (2017). Curry found 83.5% of eligible
adolescents attain a driver’s license, but only 33% of eligible adolescents with ASD attain a
driver’s license (Curry et al., 2017).
Most researchers agree the core characteristics or associated deficits of ASD, such as
motor deficits (Brooks et al., 2016; Classen, Monahan, & Brown, 2014; Classen, Monahan, &
Hernandez, 2013), visual-perceptual deficits (Bishop et al., 2017; Sheppard et al., 2010; Wang et
al., 2015), cognitive deficits (S. M. Cox et al., 2016; Hill, 2004), non-verbal communication
deficits (Almberg et al., 2017; Chee et al., 2017; Classen & Monahan, 2013; Daly et al., 2014),

9
and a higher rate of anxiety (Chee et al., 2015; N. B. Cox et al., 2012; Reimer et al., 2013),
present potential barriers to driving and could explain the discrepancy between driving rates of
those with ASD and the general population.
Performance Skills for Driving
Performance skills are the skills required for a person to complete an activity (AOTA,
2014). Driving is a complex IADL which requires motor, process, and social communication
skills. It also requires specific body functions, including but not limited to mental, sensory, and
movement functions.
Motor/Physical Factors
Motor skills are necessary to plan out motor actions while operating the vehicle, such as
pressing the gas or brake pedals, or steering (Dickerson & Niewoehner, 2012). A person has
motor deficits when they have difficulty with certain motor skills. Motor deficits are decreased
performances in gross motor or fine motor skills, sometimes manifested by increased clumsiness
and instability or decreased coordination.
Individuals with HFASD may have motor deficits including reduced accuracy of hand
movements, poor bilateral coordination of the hands, poor coordination of upper and lower
limbs, and poor hand-eye coordination, as reported in the literature (Fournier et al., 2010). In
fact, Fournier et al. (2010) conducted a meta-analysis of motor coordination in the ASD
population. The results determined motor coordination deficits were prevalent across multiple
studies and therefore should qualify as a core symptom of ASD. Fournier et al. (2010) concluded
there was a consensus amongst the studies which indicated those diagnosed with ASD had
deficits in balance, gait, motor planning, and upper and lower extremity function. These deficits

10
are likely to affect a driver’s ability to react to unexpected events in their environment, maneuver
the car, and control the speed of the car using the gas or brake pedals.
In a study comparing the motor skills of adolescents with HFASD to neurotypical
controls (Brooks et al., 2016), the participants with HFASD took significantly longer to complete
motor-related tasks without errors on a driving simulator. Specifically, participants with HFASD
took on average 30-35 minutes more to complete the motor-related tasks without errors (Brooks
et al., 2016).
Similarly Classen, Monahan, and Hernandez (2013) found upper-motor deficits could
have caused an increase in lane maintenance errors when driving on a simulator. In their study,
drivers in the HFASD group made significantly more lane maintenance errors when compared to
the control group. The researchers hypothesized decreased upper-extremity motor deficits and
motor coordination created a slower motor response when making turns, causing the HFASD
drivers to exit their lane more often than controls (Classen, Monahan, & Hernandez, 2013).
When driving in a simulator, the researchers also found adolescent drivers with HFASD made
significantly more speed regulation errors than drivers in the control group. They hypothesized
motor deficits in the HFASD population provided an explanation for the statistically significant
difference when driving (Classen et al., 2014).
These studies provide evidence that motor deficits will affect driving in those with
HFASD. In relation to Michon’s Hierarchy, motor deficits are going to affect a driver’s
operational level of skills. In interventions to assist drivers with HFASD, operational skills may
need to be focused on first to ensure they are at an appropriate level for safe driving.

11
Sensory/Perceptual Factors
Sensory-perceptual skills are required to respond to external cues from the car or
surrounding environment. One of the most important sensory-perceptual skills related to driving
is visual-perceptual skill. Visual-perceptual skills are those needed to take visual information
from the environment, analyze, and interpret it to produce a motor action (Classen, 2017).
Deficits in visual-perceptual skills would affect a driver’s ability to comprehend and react to
visual information from the driving environment.
Individuals with HFASD are shown to be slower to visually perceive and react to
hazards in the driving environment (Bishop et al., 2017; Sheppard et al., 2010). This could be
due to adolescents with ASD having slower visual scanning velocities than their typically
developing peers. In fact, Wang et al. (2015) compared 20 individuals with ASD and 19 control
individuals to obtain detailed information about gaze differences. This research differed from
other eye gaze studies by providing complex visual stimuli similar to what people see in the real
world. The visual stimuli included multiple dominant objects with non-social and social objects
to make the scenes as close to real life visual stimuli as possible. Individuals with ASD were
significantly slower to visually fixate on faces or hand gestures when compared to controls. It
was hypothesized this was due to slower scanning velocities and despite object distribution in a
photo, adolescents with ASD tended to focus on the center of a picture. Specifically, adolescents
with ASD looked at the center of an image two times as much as the typically developing
controls. This tendency to look at the center of an image could adversely affect driving;
important information comes from all areas around the car and drivers must scan in different
directions. If their focus is in the center, drivers will miss information from the side view mirrors
and left and right areas outside of the car (Wang et al., 2015).

12
Cognitive/Processing Factors
Cognitive skills involve planning or managing an activity, and can also involve quick
decision making and judgments, which lead to specific actions (Dickerson & Niewoehner, 2012).
The higher level cognitive-related skill of executive functioning includes planning, self-
regulation, prioritizing, working memory, and problem-solving (Hill, 2004). These skills are
essential for driving as they help a person make decisions and act when the driving environment
changes, or they are required to complete a driving maneuver. For example, planning is essential
for drivers to decide on their route, speed, and how they react to changes in the driving
environment. The plan must be consistently revised based on information from traffic lights,
road signs, and other drivers. Another aspect of executive functioning is mental flexibility or set-
shifting, which refers to a person’s ability to shift actions dependendent on changing
circumstances (Hill, 2004). Mental flexibility is important for driving as conditions on the road
are constantly changing. When weather, traffic, or traffic signals change, drivers are required to
set shift to a different action and may need to change the route of the car.
Studies have linked difficulties with executive functioning to poorer driving performance
in those with HFASD (S. M. Cox et al., 2016; Hill, 2004). Navigating, an executive function, is
directly related to the strategic skill level in Michon’s Hierarchy. It requires a driver to plan and
follow a route to arrive at a destination. Adolescents with HFASD have demonstrated a deficit in
general navigating when compared to their typically developing peers (Hill, 2004). A 2013 study
by Reimer et al. found a shift in gaze when drivers with HFASD were required to drive and
simultaneously complete a cell phone task, a higher cognitively demanding situation. During this
high cognitively demanding task, drivers with HFASD shifted their attention from the roadway
towards a less complex area, either to the sides of the road or the sky. This increased cognitive

13
demand may have affected their ability to respond quickly to hazards or a change in the roadway
environment (Reimer et al., 2013). In 2016, Cox et al. further studied the impact of executive
functioning difficulties and their relationship to working memory (i.e., temporarily storing and
managing information used to guide behavior and carry out specific actions) on tactical driving
including lane positioning, speed, turning, and traffic signals using a simulator. The study found
adolescents with HFASD had deficits in their working memory, tested by their ability to
remember road signs while performing a task which required accurate steering and braking
performance. Using working memory had a negative effect on steering and braking performance
in adolescents with HFASD (S. M. Cox et al., 2016). This may indicate interventions to assist
drivers with HFASD should decrease focus on executive functioning skills (i.e., strategic level),
until motor skills (i.e., operational level) are sufficiently practiced and the driver is competent.
Social Interaction factors
Social interaction factors are those that can “be observed during the ongoing stream of a
social exchange” (Fisher & Griswold, 2014, p. 1241). During a social exchange, communication
typically occurs to increase understanding. Communication is the words, behaviors, and signals
we use to convey, and exchange information or feelings. Verbal communication specifically
includes the words we speak and the sounds we use when speaking. Non-verbal communication
is separate from the verbal words people use and can include body language, eye contact, facial
expressions, gestures, pitch, and tone of voice (Craighead & Nemeroff, 2004). Difficulties with
non-verbal communication can affect a driver’s ability to communicate with other drivers and
understand the non-verbal information they convey.
Adolescents with HFASD demonstrate difficulty anticipating the intentions or actions of
other drivers and may misinterpret non-verbal cues when driving (Almberg et al., 2017; Chee et

14
al., 2017; Classen & Monahan, 2013; Daly et al., 2014). This can be especially difficult when
the rules of the road are ambiguous (e.g., parking lots, exiting driveway, arrival at a four way
stop simultaneously) or when other drivers do not adhere strictly to rules of the road (e.g.,
neglecting to use a turn signal, running a yellow light) (Monahan, 2012). Classen and Monahan
(2013) found adolescents with HFASD had increased signaling errors in a simulator when
compared to their typically developing peers. The researchers believed this was due to the
participants’ deficit in non-verbal communication, resulting in their decreased understanding of
the importance of signaling (Classen & Monahan, 2013). In another study, Almberg et al. (2017)
had 12 adolescents with HFASD complete a questionnaire resulting in reported problems
interacting with other road users. The participants reported issues interpreting traffic situations
and anticipating what other road users would do in different driving situations (Almberg et al.,
2017). Another study reported deficits in non-verbal communication caused adolescents with
HFASD to have a decreased ability to predict movements or objectives of other drivers or
pedestrians on the road, which could potentially lead to more accidents (Daly et al., 2014).
Anxiety. Anxiety is a feeling of worry, unease, or fear, typically related to an impending
event (American Psychological Association, 2020) and symptoms can include panic, shortness of
breath, sweating, nausea, and higher blood pressure or heart rate. In a study on driving behavior,
adolescents with HFASD were more likely to have higher heart rates when driving, which could
be an indicator of higher anxiety (Reimer et al., 2013). This phenomenon is supported by the
self-reported increased anxiety rates of those with HFASD (Cox et al., 2012). Additionally, in a
study using Q-methodology (an inductive and deductive approach to understanding viewpoints)
young adults with HFASD defined the viewpoint “I am anxious when I drive and will only drive
when I need to’’ as accurate (Chee et al., 2015). Anxiety may make driving a stressful and

15
mentally demanding experience, especially with difficult driving maneuvers which can
contribute to errors that may lead to crashes. Alternatively, higher anxiety rates could be one
reason adolescents with HFASD have lower rates of licensure; increased anxiety while driving
could contribute to the decision to not drive. Driving Simulation
Evaluation
Driving simulators allow for the assessment of adolescent drivers with HFASD in more
challenging, but less dangerous environments, as scenarios can include environments that may
not be immediately available to drivers (e.g., urban environment for those living in rural areas) or
hazards that are not realistic for driver training (e.g., pedestrian running in front of car).
Researchers have found adolescents with HFASD have difficulty with speed, lane maintenance,
signaling, car maneuvering, steering, and multi-tasking while driving (Brooks et al., 2016;
Classen, Monahan, & Wang, 2013; D. J. Cox et al., 2017; S. M. Cox et al., 2016; Reimer et al.,
2013; Ross et al., 2017). A study by S.M. Cox et. al (2016) found adolescents with HFASD had
significantly slower reaction times when steering in a driving simulator, which could affect their
ability to avoid crashes and drive safely. A 2013 study by Classen et. al found adolescents with
HFASD were more likely to make more types and a larger number of driving errors in a
simulator than their typically developing peers, especially related to visual acuity, visual-motor
integration, and motor skills (Classen, Monahan, Brown, & Hernandez, 2013). Additionally, a
2017 study by D.J. Cox et al., also found adolescents with HFASD were more likely to make
driving errors than their neurotypical peers, as demonstrated by their overall tactical driving
composite score. The study found adolescents with HFASD performed worse on multiple tactical
driving variables, including crashing, swerving, lane maintenance, and tailgating (D. J. Cox et
al., 2017).

16
Training
Driving simulators have given reliable and detailed information about the characteristics
of those with HFASD due to their safe use compared to on road driving (Classen, Monahan, &
Hernandez, 2013; S. M. Cox et al., 2016; Reimer et al., 2013). It is possible driving simulators
can also be appropriate and functional tools to improve driving skills in the HFASD population
with an appropriate trainer. Although there are currently no best practice protocols for simulator
training, the following studies investigated the efficacy of driving simulation for training drivers
with HFASD.
A simulator was used to compare motor driving performance of adolescents with HFASD
and their neurotypical peers and improve motor driving performance through simulated driving
tasks (Brooks et al., 2016). There were 31 neurotypical control participants and 10 participants
with HFASD in the study. Participants completed a total of 18 simulated driving tasks relating to
steering and using the car’s pedals. The tasks increased in difficulty and each participant had a
maximum of five attempts to complete a task. The results of the study showed the number of
trials to achieve error free performance on the more difficult tasks were not significantly
different between the HFASD group and the control group. These interactive exercises were
appropriate at balancing any existing differences in motor skills related to driving between the
two groups (Brooks et al., 2016). This finding indicates the simulator training was effective at
addressing motor skills for driving in the adolescent population with HFASD.
The researchers in the Brooks et al. 2016, study found simulator training to be effective
for those with HFASD, but does it compare to on road driving for this specific population? A
study explored this question by comparing Virtual Reality Driving Simulator Training (VRDST)
to routine training on the road in adolescents with HFASD. Routine training consisted of

17
instructing participants to follow the DMV training manual and having them document on road
driving experiences. The VRDST consisted of between eight and 12 one-hour training sessions
on a driving simulator. There were 51 participants with HFASD, and they completed pre-
assessments and post-assessments on the simulator. Virtual reality driving simulation training
resulted in significantly better overall performance post-assessment on driving. The specific
variables effected were steering and speed control, meaning the VRDST participants
demonstrated fewer instances of crossing the midline, swerving, tailgating, and speeding than the
routine training participants (D. J. Cox et al., 2017).
Another study by Meeks (2017) included 15 adolescents with HFASD between the ages
of 14 and 23 to determine the efficacy of a driving simulator as a training tool. Each participant
moved through a standardized protocol of scenarios one-on-one with an instructor. The scenarios
each participant practiced were related to 10 critical events including turn signals, stop signs,
traffic lights, speed and lane maintenance, hazard identification and avoidance, right/left turns,
lane changes, and navigation. The training was individualized so that each participant moved
through training at their own pace, beginning a new skill once they received an 80% on two
consecutive drives related to the skill. The researcher used a standardized driving evaluation, the
Performance Analysis of Driving Ability (P-Drive) (Patomella, 2014), to compare pre-test and
post-test scores of three drives and found significant results, indicating the participants improved
their driving performance. This study suggests that using the driving simulator is a potentially
effective tool to improve driving skills in those with HFASD.
Hazard Perception, Recognition and Response
One of the important aspects of driving critical to avoiding collisions is visually scanning
the environment and perceiving hazards to respond appropriately to visual stimuli in the driving

18
environment. A study by Underwood (2007) found visual scanning and attention was a
differentiating factor between novice and experienced drivers and that decreased visual scanning
was a risk factor for motor vehicle collisions. While all teens need to learn when to scan the
environment and react to hazards, studies have found eye gaze, visual attention, visual scanning,
and hazard perception differences between adolescents with HFASD and their typically
developing peers (Bishop et al., 2017; Classen, Monahan, & Wang, 2013; Grynszpan & Nadel,
2015; Guillon et al., 2014; Reimer et al., 2013; Sheppard et al., 2010; Wang et al., 2015). This
suggests that an important skill for driving may be affected in adolescents with ASD, making
licenses more difficult to attain, collisions more common, and specific driving instruction related
to visual scanning and hazard perception more essential to safe and independent driving for this
population.
Reimer et al.’s (2013) study found statistically significant gaze differences by
determining the exact gaze positions of adolescents with HFASD while in a car, compared to
controls. The study reported the gaze of drivers with HFASD was 44% higher than typically
developing controls (Reimer et al. 2013) when looking out the windshield area of the car.
Drivers with HFASD were looking at the horizon more often than they were looking at objects
lower in the visual field, such as oncoming vehicles or the dashboard. This visual gaze
preference could cause them to miss pertinent information in the most active portions of the
roadway (Reimer et al., 2013).
Adolescents with HFASD also tend to shift their visual attention to social and non-social
stimuli in different ways than their typically developing peers (Guillon et al., 2014; Sheppard et
al., 2010). Social stimuli are used to describe faces and people, while non-social stimuli are
unrelated to people such as shapes, objects, or locations. For example, Guillon et al. (2014)

19
reviewed multiple eye tracking studies and found those with HFASD exhibit decreased visual
attention to social stimuli, such as faces and people, when compared to typically developing
individuals. They found the visual attention of the participants in situations with multiple people
or complex social situations, and in situations comparing naturalistic and acting behavior, was
significantly different for those with HFASD. This suggests visual attention was context-
specific, and if contexts changed so would visual attention (Guillon et al., 2014).
Commonly on the road, the context changes when a driver perceives a hazard and must
take some action to address it. Sheppard et al.’s (2010) study explored drivers’ ability to
recognize and respond to hazard scenarios. They used 10 videos of driving scenarios, each
containing a hazardous situation to determine hazard responses in 23 participants with HFASD
and 21 control participants. They defined a driving hazard to the participants as “an event that
occurs on the road whilst you are driving along that would make you have to consider taking
some kind of action to avoid an accident” (Sheppard et al., 2010, p. 506). Participants were
required to hit a button as soon as they noticed a hazard in the video and then were required to
identify the hazardous situation for a researcher. Results determined participants with HFASD
identified fewer socially relevant hazards, such as pedestrians or cyclists, yet identified non-
social hazards (e.g., car, bus) the same as control participants. Also, the participants with
HFASD were significantly slower at responding to all hazards. Two explanations for this result
were proposed: the participants may have become aware of the hazard later than the controls, or
they perceived the hazards at the same time as controls, but motor deficits caused them to
respond more slowly (Sheppard et al., 2010).
Another study by Sheppard et al. (2017) explored these proposed explanations by
combining hazard videos with eye tracking technology (Sheppard et al., 2017) . A total of 15

20
participants with HFASD and 16 control participants watched driving scenario videos containing
hazardous situations and were asked to press a key when a hazard occurred. The results of this
study determined the control participants were significantly faster at fixating (or looking) at a
hazard when compared to the HFASD group. However, once participants with HFASD fixated
on a hazard their response-time to key-press was not significantly different than the control
group, suggesting a motor response occurred just as quickly in the HFASD group as it did in the
control group once fixation occurred. Interestingly, this study also found no statistically
significant differences between groups in accuracy or response time to social and non-social
hazards, unlike similar studies. However, researchers did report reaction time to hazards
approached significance for participants in the HFASD group reacting slower than participants in
the control group (Sheppard et al., 2017).
These results were similar to Bishop et al.’s (2017) work in which 16 drivers with
HFASD and 16 control drivers drove a simulator scenario with multiple hazard situations. Data
from the simulator showed the HFASD group had no significant differences in their reaction
times to social and non-social hazards. However, when drivers with HFASD were compared to
the typically developing controls, the control group had significantly faster reaction times to
social hazards, increasing the likelihood of avoiding a motor vehicle accident with cyclists or
pedestrians (Bishop et al., 2017).
Building on previous work with adolescent drivers with HFASD and their identification
and driving response to hazards, studies have attempted to mitigate the visual scanning and gaze
differences in adolescents with HFASD by combining eye tracking and driving simulators (D. J.
Cox et al., 2017; Wade et al., 2017; Zhang et al., 2017). A novel virtual reality driving simulator,
The Virtual Reality Adaptive Driving Intervention Architecture (VADIA), was created to be used

21
with eye tracking. The VADIA combines a virtual driving environment with sensory peripherals
to create a simulated, on the road, driving experience. The simulated on-road driving experience
is meant to as closely match reality as possible; physical and sensory elements of driving on a
real road are presented by the simulator system (Evans & Lavallière, 2017). Wade et al. (2017)
tested two modes using the VADIA, performance-based and gaze-contingent, to train
adolescents with HFASD and improve overall driving skills. Participants in the performance-
based group completed tasks using the non-adaptive (i.e. without gaze-sensitivity) version of
VADIA. They were permitted a maximum of three trial errors per driving assignment and a
fourth trial error resulted in failure of the assignment which could not be re-attempted.
Participants in the gaze-contingent group used an adaptive version of VADIA where trial errors
were classified as either performance errors or gaze errors, and drivers had to follow the rules of
the performance-based system, while also paying attention to salient aspects of the driving
environment. Drivers who failed to look at any one of these important objects during trials (e.g.,
oncoming vehicles, traffic lights, etc.) received a gaze error. A maximum of three gaze errors
and/or three performance errors were permitted in the gaze-contingent system, but a fourth error
in either category resulted in an assignment failure. Researchers in this study found both the
performance-based and gaze-contingent modalities significantly reduced driving trial errors in
the VADIA after training (Wade et al., 2017).
However, there were some limitations to the scope of the VADIA study (Wade et al.,
2017). First, the VADIA used eye tracking technology to determine whether each participant
failed or passed an assignment. There was no specific training given to the participants to target
improvements in their eye tracking and hazard perception skills. A more specific training
protocol using a simulator and cues from a researcher could be used in other experiments to

22
specifically affect scanning, hazard detection, and other driving skills needed on the road. Also,
the VADIA was specifically created and structured by the researchers for these experiments and
is not commercially available. It would be difficult for other researchers to repeat this experiment
without access to the VADIA itself (Wade et al., 2017). However, other researchers have
emphasized the importance of using driving simulators in combination with eye tracking
technology and hazard training to further explore its efficacy in this population.
In fact, Sheppard et al. concluded that specific training programs that use eye tracking or
facilitate hazard perception and focus on visual scanning will be beneficial to those with HFASD
(Sheppard et al., 2010). Similar to the VRDST (D. J. Cox et al., 2017) and motor performance
training (Brooks et al., 2016) studies, this study will use a driving simulator to train driving skills
in adolescents with HFASD. This study will also be using performance-based errors to determine
competence before moving further in the simulator protocol similar to the VADIA study (Wade
et al., 2017). However, unlike the VADIA study, this study will use a commercially available
driving simulator (STISIM OT Drive) and a specific simulation protocol focused on both general
driving skills and gaze, visual scanning, and hazard perception/response skills to train adolescent
drivers with HFASD (Wade et al., 2017). Also, participants in this study will have unlimited
attempts to practice driving learning modules until competence is achieved and will not fail
assignments. Lastly, this study will use eye tracking in the pre-test and the post-test to determine
if hazard perception and response changed for the adolescent drivers with HFASD after training.
Summary
Driving is an important developmental milestone for all adolescents, as it increases their
independence and their likelihood to hold a full-time job, receive an education, and attend
college. However, obtaining a license is typically more difficult for adolescents with HFASD

23
due to characteristics and symptoms related to their diagnosis. Occupational therapy practitioners
have an ethical obligation to address difficulties with driving as driving and community mobility
is within their scope of practice and they have the knowledge and skills to support adolescents
with HFASD in learning to drive. Adolescents with HFASD typically have high cognitive skills
and little language difficulty, but they may also have specific characteristics and symptoms that
make driving a challenging, but obtainable goal.
Therefore, occupational therapy practitioners and researchers need to create a clearer
picture and more evidence-based options to assess and increase fitness to drive for adolescents
with HFASD. Clearly, the evidence supports that driving simulators can be used to train and
evaluate driving skills in adolescents with HFASD (Brooks et al., 2016; Classen, Monahan, &
Hernandez, 2013; D. J. Cox et al., 2017; S. M. Cox et al., 2016) and are a safe, low-cost,
objective method (Classen, 2017; Bella, 2008; Lee et al., 2003). Also, studies have shown visual
scanning of the environment and hazard perception and response are essential factors to drive
safely and avoid collisions (Underwood, 2007). However, studies have shown adolescents with
HFASD exhibit differences in eye gaze, visual attention, visual scanning, and hazard
perception/response when compared to their typically developing peers. (Bishop et al., 2017;
Reimer et al., 2013; Sheppard et al., 2010). Studies have used using eye tracking technology to
further explore these differences as it adds the ability to understand in real-time when and where
drivers with HFASD are looking, especially related to their response to social and non-social
hazards (D. J. Cox et al., 2017; Sheppard et al., 2017; Zhang et al., 2017). The VADIA study by
Wade et al. (2017) found a performance-based non-gaze contingent training protocol and an eye
tracking gaze-contingent training protocol increased driving skills in those with HFASD (Wade
et al., 2017). Although these studies have explored eye tracking and training on the simulator for

24
adolescents with HFASD, there are still gaps in the literature. Studies have not yet explored
whether a training protocol focusing on hazard perception and response can improve driving
skills in adolescents with ASD or used eye tracking technology to determine if hazard perception
and response to social and non-social hazards changes after driving simulator training. Thus, the
purpose of this study will be to determine if training on an interactive driving simulator will
improve the social and non-social hazard perception and driving performance of adolescents with
HFASD.
Specifically, the research questions are: 1) is there a significant difference between pre-
and post-training in overall driving performance scores as measured by a standardized
observational tool designed to measure fitness to drive and 2) is there a significant difference
between the pre- and post- time a person spends looking at a hazard (i.e., fixation duration), how
many times a person looks at a specific hazard (i.e., fixation count), and how long it takes to look
at a hazard once it is visible (i.e., time to first fixation)?

25
Chapter 3: Methods
Design
The design is a one group, pretest-posttest intervention design using outcome measures
from eye tracking technology and outcome measures from observation of driving performance
on an interactive driving simulator using a standardized observation tool. The intervention is the
completion of structured learning modules with scenarios on an interactive driving simulator to
improve hazard perception and response.
Participants
The target population was adolescents with HFASD who were not driving independently.
A total of 17 participants were recruited through convenience/volunteer sampling by contacting
the Autism Society of North Carolina, organizations that work with the population with ASD,
personal contacts, through email and posted advertisements. Inclusion criteria was adolescents
age between the ages of 15 and 22 years, self-reported diagnosis of ASD, and had a desire to
learn to drive. Participants were excluded from the study if they had known motion sickness,
had extreme behavioral issues or other significant neurological conditions that would affect
driving behaviors. The inclusion criteria were chosen because 15 is the legal driving age in North
Carolina. Participant demographics were obtained and are described in Table 1. Participants’
mean age was 17.18, standard deviation (SD]=1.81. There were 14 males and 3 females with a
variety of driving experience. A large group of participants (6) had no driving experience at all
and two participants had participated in other training on the driving simulator. Approval from
the Institutional Review Board of East Carolina University was obtained (see Appendix A) and

26
informed assent from the children and informed consent from the children’s parent or guardian
was obtained before collecting any data.
Table 1. Participant Demographics
N Age M(SD) Males
/Females
Driving Experience Level
17 17.18 (1.81) 14/3 None Simulator Driver’s Ed Learner’s
Permit
6 2 5 4
Equipment
Tobii Pro Glasses 2.
The study used the Tobii Pro Glasses 2 to collect eye-tracking data from the participants.
The Tobii Pro Glasses 2 is a light-weight wearable eye tracker (see Appendix B) which takes
gaze sampling frequencies at 50 or 100 Hz. It utilizes corneal reflection and dark pupil tracking
to track eye movements and visual gazes. The head unit includes four eye cameras, gyroscope
and accelerometer sensors, a 90-degree field of view in the scene camera, and a sound recording
microphone. The head unit connects to a recording unit which allows for 120 minutes of
recording time and downloads gaze data to an SD card (Tobii Pro, 2018a). The Tobii Pro Glasses
2 also come with a controller unit, which provides the researcher with a real-time video feed of
where the participant is looking. The Tobii Pro Glasses 2 were found to have high accuracy and
precision of gaze data in multiple lighting conditions, distances from targets, and gaze angles
(Tobii Pro, 2017). Tobii Pro Lab was launched at the end of 2016 and reliability and validity of
the system have not been established yet. However, the creators of the Tobii Pro Glasses 2 also
created the Tobii Pro Lab to seamlessly work together to observe and analyze gaze recordings

27
downloaded from the SD card in the recording unit. These systems were specifically made to use
in combination to produce the most accurate eye tracking data.
WT-960 TRAN-SIT Car Transfer Simulator and STISIM OT DRIVE Simulator System.
This study also used the STISIM Driving Simulator System (Systems Technology Inc.,
Hawthorne, CA, USA) with STISIM OT Drive simulation software (Systems Technology Inc.,
2013) to complete the pre-test and post-test. This clinical driving simulator has been used
nationally and internationally in multiple studies and settings. The car “buck” or mock-up of a
vehicle is the WT-960 TRAN-SIT (Advanced Therapy Products), a 48 in W and 60 in L mock-
up car with functional doors, handles, and locks as well as a tilt steering wheel, gas, and brake
pedals (Advanced Therapy Products, 2014). This mock-up car was fitted with three LCD screens
which portray two side mirrors, a review mirror, and the animated driving environment of the
STISIM. During the pre-test and post-test sessions, participants completed at least two
orientation drives to learn or reorient themselves to how the simulator works.
DriveSafety RS 200.
This study used the DriveSafety RS 200 driving simulator with SimClinic Software
(DriveSafety, Murray, UT, USA) to complete all hazard detection training sessions. During the
simulator training sessions, participants completed a variety of driving simulator learning
modules which included multiple scenarios available from the SimClinic software (Drive Safety
Incorporated & Clemson University (2019). The scenarios ranged from easy to medium to hard
and included hazards such as pedestrians, stop lights, bikers, dogs, and parked/moving vehicles.

28
Instrumentation and Outcome Measures
Tobii Pro Lab Analyzer Software
The Tobii Pro Lab Analyzer Software (Tobii, 2018b) was used to generate the eye
tracking outcome measures. Each of these measures was related to areas of interest (AOIs),
which in this case, were specific hazards in the driving simulator scenario. The first measure is
fixation duration on AOIs. Fixation duration on AOIs is a measurement of the amount of time in
seconds a participant spends looking at an AOI (hazard). The second measure is time to first
fixation on AOIs which is a measurement of how long it takes a participant to look at an AOI
once it is visible on the simulation screen. Finally, fixation count on AOIs was used. This is how
many times a participant looks at a specific AOI while it is visible on the simulation screen.
The Tobii Pro Lab Analyzer software allows the replay and analysis of the recorded gaze
data from each participant. The tools used included: manually mapped gaze points, areas of
interest through excel files, and visual heat maps to analyze the data (see Appendix C). A
diagram of the driving scene was created with the AOIs listed on the diagram. The diagram with
each hazard encountered during the drive, was used to manually map each gaze point for each
hazard in a scene (see Appendix D). Then, the software completed fixation-related metric
analysis for each AOI. These numbers were then exported as an Excel spreadsheet to analyze.
P-Drive
The Performance Analysis of Driving Ability (P-Drive) (Patomella, 2014) is a
standardized observational assessment tool developed by Ann-Helen Patomella. It is designed to
evaluate driving performance on road and in a driving simulator. The P-Drive has scores for the
following four areas: maneuvers, orientate, follow regulations, and attending/responding and a
total score (Patomella, 2014). The maneuvers category includes items related to physically

29
handling the car including steering, using the pedals, controlling the car’s speed, and using the
turn signals. The orientate category includes items related to listening, cognition, and
positioning including planning, listening to instructions, keeping distance, and positioning on
road. The follows regulations category includes items related to the “rules” of the road including
yielding, obeying stops, and following speed regulations. The attending/responding category
included items related to higher level cognition such as reacting, focusing, and problem solving.
This category also included items related to awareness and response to various stimuli in the
driving environment such as awareness to all directions outside the car, awareness of the mirrors,
and response to regulatory signs, advisory signs, and fellow road users.
The manual has detailed descriptions/examples of how each item is scored (see Appendix
E). Three items, 2 (changing gears), 7 (reversing), and 9 (wayfinding) were eliminated as they
cannot be scored due to the nature of the driving simulator. Only behaviors that are directly
observed are recorded and the areas include 25 actions or behaviors that could be observed while
someone is driving. Each item on the score sheet is scored on a 4-point scale and each point
correlates to a specific type of performance (4= competent performance, 3= hesitant
performance, 2= ineffective performance, or 1= incompetent performance) (Patomella, 2014)
(see Appendix F). Two trained raters scored each pre-test and post-test while the participant was
on the simulator. After separately scoring, the raters then discussed the scores they gave for each
item to ensure similar scores were obtained. If necessary, scores were adjusted during discussion
by the two raters until there was less than a three-point difference between raters’ total scores.
A study determined the P-Drive was a valid and reliable tool for measuring driving
ability (Patomella et al., 2010). The P-Drive has acceptable person response validity, as 95% of
drivers in the study demonstrated goodness-of-fit to the model (Patomella et al., 2010). Also, the

30
P-Drive had high correlation between raw scores and the interval score measures, indicating the
raw scores for each item can be summed and used as a valid outcome measure (Patomella &
Bundy, 2015). Additionally, the P-Drive was determined to have high predictive validity, as the
positive predictive value= .95 and the negative predictive value= .90. This indicates the P-Drive
was successful at predicting a passing or failing driving decision similar to the passing or failing
driving decision determined by an occupational therapist using an on-road test, cognitive tests,
and clinical characteristics of the participant (Patomella & Bundy, 2015). These high
psychometric properties provide evidence that the P-Drive is an appropriate and informational
driving performance outcome measure.
Procedure
After approval from East Carolina University’s Institutional Review Board, potential
participants were contacted. After initial contact, the participant (and parent if appropriate) read
and signed assent and consent forms and completed a pre-testing session. The pretest session
took approximately 75 minutes.
During the pretest session, the participant was fitted with the Tobii Pro Glasses 2. Once
the glasses were calibrated, the participant was introduced to the STISIM simulator and
completed two accommodation drives. When the accommodation drives were completed, and the
participant felt comfortable with the simulator, Road Test Version 1 or Road Test Version 2 was
randomly assigned. At post-test, the participant was tested on the other version. Although these
two versions have virtually identical hazards, the events are in different orders and slightly
adjusted as to prevent learning by the participant. For example, urban driving was either first or
last and a pedestrian walking across the street came from another direction or some feet later
down the street (see Appendix G). Using two versions of the same elements of the scenario Road

31
Test for pre-test and post-test mitigated any learning that could occur and ensured data received
was accurate and objective. The hazards in both scenarios included pedestrians walking out onto
the roadway, traffic lights, and parked/moving vehicles. Driving environments within the
scenarios included metropolitan, school zone, rural, and residential environments.
All training sessions occurred within 12 weeks to ensure learning was reinforced. Each
participant completed 30 learning modules to gradually build awareness and strategies to avoid
hazards. Learning modules included one to four scenarios related to the specific modules’
learning objectives. Learning modules were selected in sequence because the skills required built
on each other and were necessary for subsequent learning modules and scenarios (see Appendix
H). The first training sessions featured learning modules with scenarios focused on basic driving
skills, such as speed and lane maintenance, using the pedals, and steering. The next training
sessions featured learning modules with scenarios focused on visual scanning, identifying
distractors, and detecting hazards while driving in the simulator. These learning modules ranged
from easy to medium to hard and included social (pedestrians, bicyclists) and non-social
(construction, parked cars) hazards. Each participant moved through the process in an
individualized manner, as expected in occupational therapy interventions. If there was a skill or
learning module that was difficult, the participant was given multiple opportunities to succeed.
Thus, participants differed in the amount of training sessions they required to complete all 30
learning modules. Each training session’s main objective was moving through the learning
modules at the participant’s unique pace ensuring competence before moving forward. Allowing
the participant to repeat learning modules and scenarios with skills they found difficult ensured
the participant was learning and could continue to efficiently move through the scenarios.

32
Once all training sessions were completed, the final testing session occurred which
involved the participant completing the scenario not viewed at pretest on the STISIM simulator
while wearing the Tobii Pro 2 glasses. The eye tracking data from those test drives was uploaded
to the Tobii Pro Analyzer software for further analysis.
Data Analysis
Descriptive statistics were used to describe the demographics of the group, including
gender, age, and driving experience. The outcome measures of P-Drive data and eye tracking
data were analyzed, and both were not normally distributed. A Wilcoxon Signed Rank Test was
used to determine if there were significant differences in pre-and post-scores for the eye tracking
and P-Drive data. The eye tracking data was separated into non-social and social hazard
categories for analysis. Significant differences in these outcome measures determined whether
the specific hazard perception simulator training is effective in increasing hazard perception in
adolescents with HFASD. The significance level for statistical testing was set at 0.05.
Specifically, the research questions are: 1) is there a significant difference between pre-
and post-training in overall driving performance scores as measured by a standardized
observational tool designed to measure fitness to drive and 2) is there a significant difference
between the pre- and post- time a person spends looking at a hazard (i.e., fixation duration), how
many times a person looks at a specific hazard (i.e., fixation count), and how long it takes to look
at a hazard once it is visible (i.e., time to first fixation)?
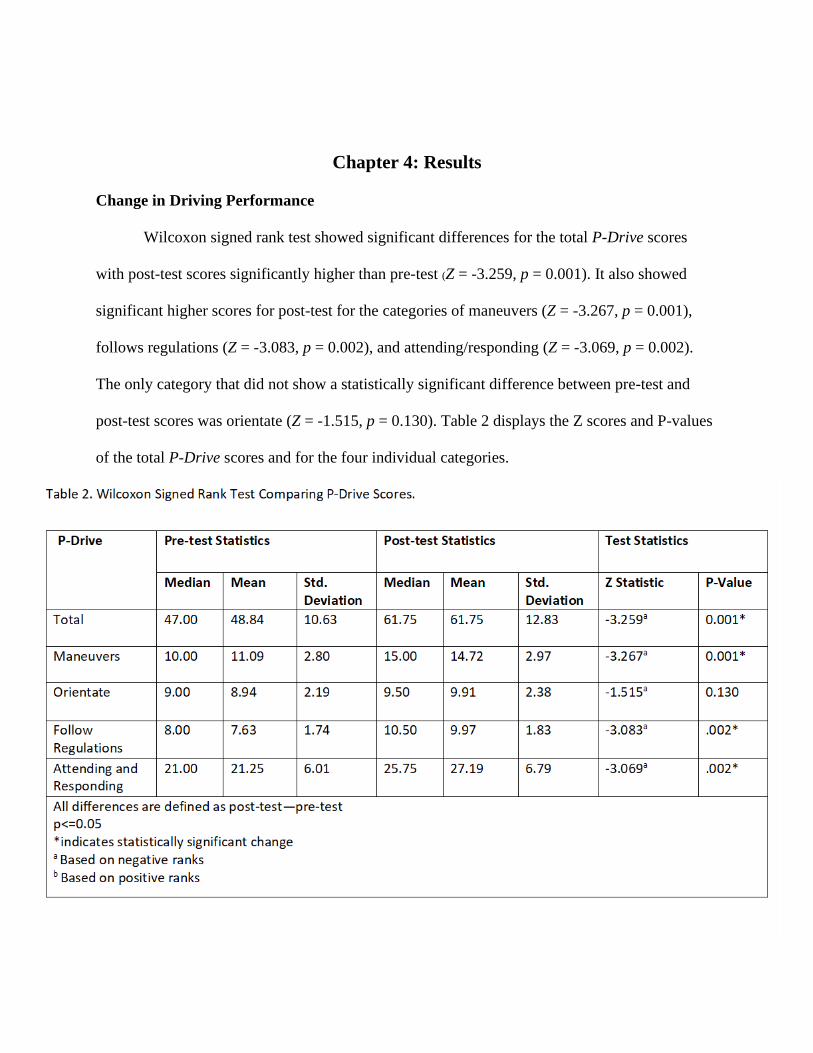
33
Chapter 4: Results
Change in Driving Performance
Wilcoxon signed rank test showed significant differences for the total P-Drive scores
with post-test scores significantly higher than pre-test (Z = -3.259, p = 0.001). It also showed
significant higher scores for post-test for the categories of maneuvers (Z = -3.267, p = 0.001),
follows regulations (Z = -3.083, p = 0.002), and attending/responding (Z = -3.069, p = 0.002).
The only category that did not show a statistically significant difference between pre-test and
post-test scores was orientate (Z = -1.515, p = 0.130). Table 2 displays the Z scores and P-values
of the total P-Drive scores and for the four individual categories.

34
Change in Hazard Perception
Non-Social Hazards
Head-On Collision. The head-on collision hazard is on a highway (70-mph zone) when
a vehicle passes a truck and heads for the participant’s vehicle, requiring the participant to move
off the right side of the road to avoid a collision. Wilcoxon signed rank test showed no
significant differences for head-on collision fixation count (Z = -1.725, p = 0.084) or total
fixation duration (Z = -0.094, p = 0.925) between pre-test and post-test. Wilcoxon signed rank
test did show a significant difference for time to first fixation for head-on collision (Z = -1.961, p
= 0.050), with post-test significantly faster than pre-test. On average, participants looked at the
head-on collision 2.68 seconds faster in the post-test than they did in the pre-test. Table 3
provides Z scores and P values for each eye tracking metric for the head on collision hazard.

35
Hidden Stop. The hidden stop hazard consists of a stop sign hidden behind parked trucks
in a 35-mph zone. The hidden stop sign and the parked trucks were analyzed as hazards. The
Wilcoxon signed rank test showed no significant differences for the hidden stop sign for fixation
count (Z = -0.707, p = 0.480), total fixation duration (Z = -0.840, p = 0.401), or time to first
fixation (Z = -0.447, p = 0.655) between pre-test and post-test. Interestingly, the eye tracking
data showed only 3 participants in the pre-test, and 4 participants in the post-test fixated on the
stop sign hazard, instead they may have been fixating on the trucks hiding the stop sign. It also
showed no significant differences between pre-test and post-test for fixation count (Z = -0.581, p
=0.561) or time to first fixation (Z = -0.169, p = 0.886) for the parked trucks. Wilcoxon signed
rank test did show significantly longer time in the pre-test vs post-test for total fixation duration
for parked trucks (Z = -2.040, p = 0.041). Participants in the pre-test looked at the trucks for a
longer amount of time than participants in the post-test, with an average of 3.66 seconds in the
pre-test and 2.66 seconds in the post-test. Table 4 provides Z scores and P values for each eye
tracking metric for the hidden stop hazard. Table 5 provides Z scores and P values for the trucks.

36
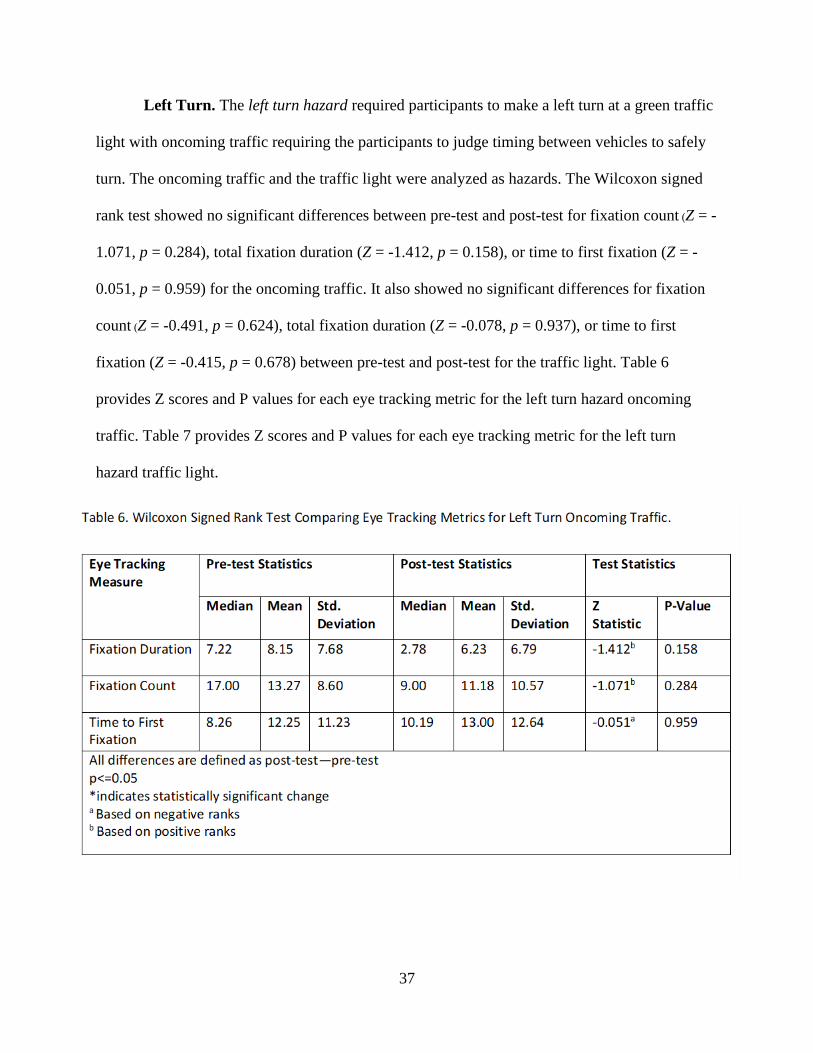
37
Left Turn. The left turn hazard required participants to make a left turn at a green traffic
light with oncoming traffic requiring the participants to judge timing between vehicles to safely
turn. The oncoming traffic and the traffic light were analyzed as hazards. The Wilcoxon signed
rank test showed no significant differences between pre-test and post-test for fixation count (Z = -
1.071, p = 0.284), total fixation duration (Z = -1.412, p = 0.158), or time to first fixation (Z = -
0.051, p = 0.959) for the oncoming traffic. It also showed no significant differences for fixation
count (Z = -0.491, p = 0.624), total fixation duration (Z = -0.078, p = 0.937), or time to first
fixation (Z = -0.415, p = 0.678) between pre-test and post-test for the traffic light. Table 6
provides Z scores and P values for each eye tracking metric for the left turn hazard oncoming
traffic. Table 7 provides Z scores and P values for each eye tracking metric for the left turn
hazard traffic light.
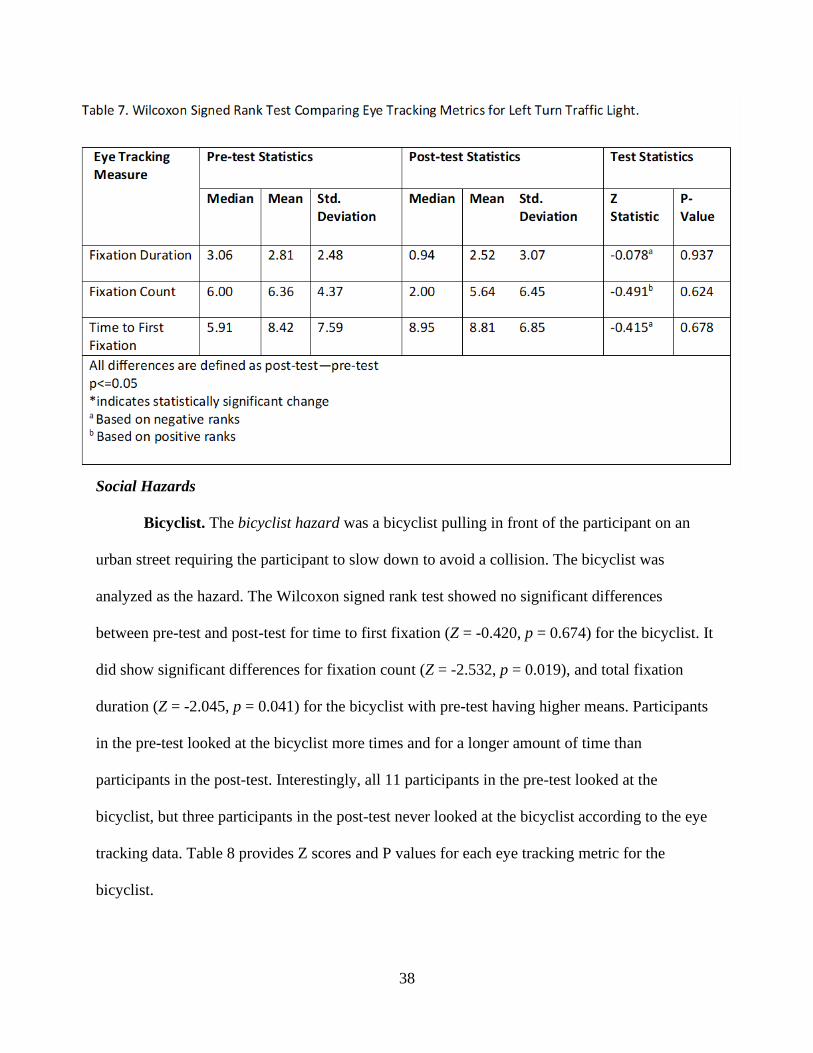
38
Social Hazards
Bicyclist. The bicyclist hazard was a bicyclist pulling in front of the participant on an
urban street requiring the participant to slow down to avoid a collision. The bicyclist was
analyzed as the hazard. The Wilcoxon signed rank test showed no significant differences
between pre-test and post-test for time to first fixation (Z = -0.420, p = 0.674) for the bicyclist. It
did show significant differences for fixation count (Z = -2.532, p = 0.019), and total fixation
duration (Z = -2.045, p = 0.041) for the bicyclist with pre-test having higher means. Participants
in the pre-test looked at the bicyclist more times and for a longer amount of time than
participants in the post-test. Interestingly, all 11 participants in the pre-test looked at the
bicyclist, but three participants in the post-test never looked at the bicyclist according to the eye
tracking data. Table 8 provides Z scores and P values for each eye tracking metric for the
bicyclist.

39
Pedestrian. The pedestrian hazard occurs when the simulator commands the participant
to turn right at an intersection as a pedestrian begins to walk into the crosswalk. The pedestrian
was analyzed as the hazard. The Wilcoxon signed rank test showed no significant differences
between pre-test and post-test for fixation count (Z = -1.138, p = 0.255) and total fixation
duration (Z = -8.66, p = 0.386) for the pedestrian. The Wilcoxon signed rank test did show
significantly shorter mean in the pre-test for time to first fixation (Z = -2.666, p = 0.008) for the
pedestrian. On average, participants in the pre-test were 45% faster at fixating on the pedestrian
than participants in the post-test. Table 9 provides Z scores and P values for each eye tracking
metric for the pedestrian.

40
School Crosswalk. The school crosswalk hazard occurred in a marked 25-mph school
zone, where pedestrians from the right and left sides of the road began crossing the crosswalk as
the participant drove close to the crosswalk. If participants were going faster than 35 mph (more
than 10 mph over the speed limit), they could pass through the crosswalk before the pedestrians
began crossing. The pedestrians and crosswalk were analyzed as hazards. The Wilcoxon signed
rank test showed no significant differences for fixation count (Z = -0.461, p = 0.645), total
fixation duration (Z = -0.153, p = 0.878), and time to first fixation (Z = -0.560, p = 0.575)
between pre-test and post-test for the crosswalk. The Wilcoxon signed rank test did show
significantly higher numbers for fixation count (Z = -2.025, p = 0.43) and means for total fixation
duration (Z = -2.045, p = 0.041) for pre-test participants for the pedestrians. It did not show
significant differences for time to first fixation (Z = -1.014, p =.310) for the pedestrians.
Participants in the pre-test looked at the pedestrians longer than participants in the post-test.

41
Participants in the pre-test also looked at the pedestrians more times altogether (48 fixations),
compared to participants in the post-test (25 fixations). Table 10 provides Z scores and P values
for each eye tracking metric for the school crosswalk. Table 11 provides Z scores and P values
for each eye tracking metric for the pedestrians.

42

43
Chapter 5: Discussion
The purpose of this study was to explore if training on a driving simulator could improve
driving ability and hazard perception and response in adolescents with HFASD. Results suggest
training on a driving simulator does improve overall driving performance. Results for hazard
perception and response were varied, but drivers avoided hazards and received higher scores on
the P-Drive during the post-test than they did on the pre-test.
Change in Driving Performance
The first research question is whether overall driving performance scores would be
significantly different between pre- and post-training as measured by the P-Drive. Overall,
participants achieved significantly higher scores after training when compared to their pre-
training scores. This significant change in performance was expected due to previous findings by
studies exploring simulator training in adolescents with HFASD (Brooks et al., 2016; D. J. Cox
et al., 2017; Meeks, 2017; Wade et al., 2017). All participants were taught in a series of skill-
based learning modules, building on the basic skills first, then increasing the degree of difficulty.
Participants also had multiple attempts to practice scenarios within the learning modules and
skills that were more difficult for them. This needed repetition was expected as it was a
suggestion from parents of adolescent drivers with HFASD in the 2012 study by Cox et al.
(2012).
Another aspect of the simulator training that could have contributed to increased overall
driving performance was the individualized and therapeutic nature of the training. In the majority
of GDL programs, driver’s education occurs in a group-setting. In contrast, the driving simulator
training occurred in a one-to-one or two-to-one ratio and participants were able to move through
the training at their own pace. Participants also received occupational therapy therapeutic

44
guidance and an opportunity to ask questions, discuss performance, and practice. Occupational
therapy therapeutic guidance is a holistic approach, which considers the participant’s personality,
learning style, diagnosis, and specific characteristics. It allows the occupational therapist to use
specific cues, which are most likely to assist the participant in understanding the task and
improving their performance.
The change in performance also suggests that an interactive driving simulator is an
effective tool for individuals with ASD. The evidence has shown the simulator itself has
reliability, concurrent validity, and relative validity with real world driving (Classen &
Akinwuntan, 2017; Mullen et al., 2011; Bella, 2008; Lee et al., 2003; Shechtman et al., 2009).
However, for adolescent drivers with ASD it allows them to focus on driving more fully as
participants did not have to be worried about real-world consequences unlike when driving on
the road with a driving instructor. This likely decreased participant’s feelings of anxiety or
pressure, which could affect participant’s driving performance as hypothesized by the 2015 study
by Chee et al. (2015).
Another factor that could have contributed to the significant overall performance change
is the learning module protocol. The 30 learning modules were specifically chosen to ensure
participants had the ability to practice driving skills in sequence and separately (e.g., steering
wheel without pedals, brake pedal without gas pedal) which is not typically possible in real
world driving. The protocol also ensured participants could practice and become competent at
operational level skills first, which could increase driving performance based on evidence from
prior research (Brooks et al., 2016; Classen, Monahan, & Hernandez, 2013). The protocol
decreased focus on executive functioning or strategic skills until motor skills or operational level
skills were sufficiently practiced. This is likely to increase overall driving performance in

45
adolescent drivers with HFASD due to the significant results related to executive functioning in
this population reported previously (S. M. Cox et al., 2016). Another possible reason for the
increase in overall driving performance after training is the focus on hazard perception during
this study. Ten of the 30 learning modules during the simulator training related specifically to
hazard perception and reaction of the participants. This finding supports the hypothesis by
Sheppard et al. (2017) that hazard perception training for adolescents with HFASD would
improve driving performance overall.
Driving Performance Change due to Training
Overall, participants also improved their driving performance scores in three out four P-
Drive categories: maneuvers, follows regulations, and attending/responding. This is likely due to
the specific skills chosen for focused training in the learning modules and within each scenario.
For example, the maneuvers category included items related to steering, using the pedals,
and using the turn signals. These skills are most related to the operational level of driving. These
specific skills were focused on in approximately 12 learning modules. In terms of steering and
pedals, learning Modules 2 and 3 included scenarios such as holding the steering wheel, brake
pedal, or gas pedal in a static target zone for a specified amount of time. In later learning
modules, participants repeated these static holds in smaller target zones, increasing the difficulty
and ensuring participants were competent at these motor skills. In learning modules, 9 and 10
participants had to use both the pedals and steering wheel simultaneously to hold in a static zone.
Learning modules 4 and 8 required participants to respond to a traffic light and arrows
appropriately (e.g. green light=gas pedal, left arrow=turn steering wheel to left), which allowed
them to better understand the function of the pedals and steering wheel. Participants also
reported it was helpful to separately use the gas/brake pedals and the steering wheel/pedals

46
before using them in combination during training. Learning module 11 related to turn signal
usage and allowed participants to practice using their turn signals to change lanes. Participants
were also able to comprehensively practice use of turn signals in modules 13 and 14 where they
repeatedly turned left or right in various driving environments. These learning modules all
directly related to items in the maneuvers category, making it likely for participants to
significantly change their performance in this category after training.
P-Drive’s follows regulations category included items related to obeying stop signs,
following speed regulations, and yielding. These skills are most related to the tactical level of
driving and were addressed in approximately six learning modules. For example, obeying stop
signs occurred in learning modules 18 and 20 where participants had the opportunity to
repeatedly practice using the pedals to make complete stops at stops signs, stop lights, and
intersections. In terms of speed regulations, learning module 12 included scenarios designed for
the participant to maintain target speeds while driving on a straight road. In terms of yielding,
learning module 19 focused on participants yielding to other traffic as they repeatedly practiced
merging on and off highways. The training during these learning modules likely improved
participant’s significant change in performance for the follows regulations category.
P-Drive’s attending and responding category included items related to attending and
responding to different stimuli related to the traffic environment and to regulatory or advisory
signs. It also included items related to cognition like reacting, focusing, and problem solving. It
is likely this category showed significant results in the post-test because these skills were
repeatedly practiced in learning modules 21-30 with specific focus on hazard perception and
response. For example, learning modules 22, 23, and 28 included scenarios requiring the
participant to visually scan and identify target objects. As the difficulty in these modules

47
increased, participants had to identify target objects, respond to a lead car’s braking, and
maintain their road positioning on a straight road simultaneously. Learning modules 21 and 26
allowed participants to practice appropriately and safely avoiding obstacles. Participants were
required to attend to the road ahead and determine the safest action to avoid obstacles in the
vehicle’s path. Learning module 24 was unique as it contained multiple scenarios allowing
participants to practice using their mirrors. During the scenarios in this module, participants had
the opportunity to independently decide to change lanes with various traffic and continue to
practice awareness of fellow road users. Learning modules 25, 27, 29, and 30 focused on hazard
detection and response in various driving environments. These drives included social and non-
social hazards and the researcher reviewed performance with the participant after each hazard
occurred. The cognitive-related items of reacting, focusing, and problem solving were more
difficult to train as they are related to the strategic level and are dependent on the participant’s
independent use of their cognitive skills. However, occupational therapy therapeutic guidance
was repeatedly used during the hazard perception modules to increase participant’s visual
scanning, attention to road signs, and response time to hazards. Participants likely improved in
these items due to the nature of the individualized therapeutic guidance they received, and/or
improvement of these items was inherent in the completion of the learning modules themselves.
Orientate was the only category that did not show a significant change from pre-test to
post-test. The orientate category included skills related to planning, following instructions, road
position, and keeping distance. Participants may not have demonstrated significant change in this
category due to the planning item being scored in this category. Planning is a strategic level
driving ability and is difficult to practice and observe on a driving simulator. Achieving a high
score in planning required the participant to anticipate required driving maneuvers and
48
accomplish them correctly and safely without verbal cues, due to the scoring requirements
outlined in the P-Drive and the nature of planning itself. Change or significant results for this
item may not have been achievable in the structure of this intervention.
Another item scored in the orientate category, following instructions was not directly
addressed by learning modules in the driving simulator training, which could explain why
participants did not significantly change their scores in this category. Instead, following
instructions was generally addressed as participants had to follow standardized instructions given
by the researcher to complete the learning modules. Also, the simulator itself gave standardized
instructions in some scenarios to prompt the participant to turn, change lanes, or stop.
Participants could not have completed the learning modules and moved forward in the training
protocol without following the instructions to succeed at the learning module objective but
specific training on this item did not occur.
In terms of positioning on road and keeping distance, three learning modules specifically
focused on these skills. For example, learning module 5 included scenarios where participants
had to maintain their lane position on a straight road for a specified amount of time. Learning
module 15 included scenarios designed to teach participants the difference between unsafe and
safe following distances and allowed them to practice following distance behind a lead car.
These items are related to the tactical level of driving, unlike planning.
It is possible the item positioning on road may have lacked changes in scores due to the
simulator’s programming. Although the driving simulator does have concurrent and relative
validity with on road driving (Shechtman et al., 2009; Mullen et al., 2011; Bella, 2008; Lee et al.,
2003), the driving simulator does not provide as much sensory perceptual feedback as real world
vehicles and driving environments. For example, the simulator did not give feedback when a

49
participant was not centered in the road, unlike what a driver might experience in the real world.
In the real world, a driver could expect to feel the road become bumpier or see dust/gravel flying
up when they were not positioned in the center of their lane. The simulator did not have animated
gravel or dirt kicking up when the participant was off to the side of the road and there were no
rumble strips to alert the participant they were drifting, which would occur in some on road
driving. Also, sounds from the traffic and driving environment of the simulator were only
produced by speakers located in front of the driver. On the real road, auditory stimuli typically
occur in surround sound, from all areas inside and around the car. Therefore, the simulator could
have caused participants to have lower scores on the positioning on road item in the orientate
category due to a combination of decreased sensory perceptual stimuli and lack of feedback,
which decreased participant’s awareness of their positioning on the simulated road. Although it
is not clear, specific items in the orientate category, which were difficult train or practice on the
simulator likely contributed to the lack of significant results for this category.
Change in Hazard Perception
Overall, results of hazard perception using eye tracking technology tended towards
improvement overall, but specific hazard results were inconsistent and varied for both social and
non-social hazards in terms of fixation duration, fixation count, and time to first fixation. Only
one hazard (left turn) did not return significant results for any of the eye tracking measures. All
other hazards returned at least one significant result for eye tracking. Although, most results
showed the pre-test eye tracking data for hazards was higher than the post-test numbers, which
would suggest more attention to the hazard, it was not true in all cases.

50
Non-Social Hazards
The results of the non-social hazards were interesting as only two of the three non-social
hazards produced significant results for at least one of the eye tracking measures. Interestingly,
the left turn hazard did not produce significant results for either the oncoming traffic or the
traffic light. It is possible this hazard had too much visual stimuli or was too complex to find
significant results for eye tracking. Participants may have been fixating on more areas of the
roadway environment than the two hazards studied during the left turn because they were
required to consider multiple factors to determine the appropriate time to turn left. Further
analysis will be required to determine appropriate hazards to use with eye tracking on the driving
simulator.
There were also no significant results for the stop sign in the hidden stop hazard, likely
due to the positioning of the trucks and the minimal number of participants that looked at the
stop sign according to the eye tracking data. Surprisingly, for the trucks in the hidden stop hazard
the change in fixation duration decreased in time post-test, not increased as expected. This may
be due to the participants requiring less time (fixation duration) in the post-test to look at the
trucks and determine the appropriate motor response required to stop at the stop sign. This
finding is supported by the Sheppard et al. study (2017) where the motor response time for
adolescents with HFASD was not significantly different than controls once the hazard was
perceived on screen (Sheppard et al., 2017).
The head-on collision hazard was the only hazard in this study that had significant results
for an eye tracking measure that increased in post-test as expected because time to first fixation
was significantly faster for the head on collision in the post-test than it was in the pre-test. This
could be due to participants’ increased ability to scan the driving environment and detect hazards

51
more quickly due to the hazard perception training they received on the simulator. The
participants may also have been faster at reacting to this hazard as it was a non-social hazard and
previous research has shown adolescents with HFASD are faster at identifying and reacting to
non-social stimuli/hazards than social stimuli/hazards (Bishop et al., 2017; Guillon et al., 2014;
Sheppard et al., 2010). However, this could also be due the nature of the hazard itself as no other
hazards returned significantly faster results for the post-test in time to first fixation. Additional
research will need to be completed to further explore the eye tracking and motor responses to
these specific non-social hazards on the driving simulator.
Head-On Collision. Participants during the head-on collision hazard fixated on the head-
on car significantly faster in the post-test than they did in the pre-test. This may be due to the
specific scenarios focusing on hazard perception and awareness of various stimuli in the driving
environment. Four learning modules required participants to perceive and quickly react to
various hazards. During this portion of simulator training, any collisions that occurred were
thoroughly discussed with the researcher. Participants were asked to discuss what they could
have done differently to avoid a collision and how they would react to a similar situation in the
future. If participants did not collide with any hazards during these scenarios, the researcher
reviewed their performance at the end and discussed the correct decisions the participant had
made to avoid collisions Although the learning modules did not include any head-on collisions,
participants were required to avoid collisions with other cars in the learning modules.
Another explanation for the faster reaction time in the post-test could have been the head-
on collision hazard itself. The head-on collision occurred in a 70-mph zone on a highway, where
all other hazards explored in this study occurred in speed zones of 45 mph or less. Also, this
hazard may have required more aggressive actions from the participant, where other hazards

52
allowed for more passivity. During this hazard, the participant had to use the car’s brake to
decrease the car’s speed, but also had to turn the wheel to move off the edge of the road to
entirely avoid the collision. The participants likely learned through training that hazards at higher
speeds are typically more difficult to avoid and participants could have been more visually
attentive to the driving environment in preparation for making assertive actions required to avoid
collisions such as this one.
Hidden Stop.
Hidden Stop. Participants demonstrated no significant change in the eye tracking metrics
for the hidden stop itself. The eye tracking data showed only 3 participants in the pre-test and 4
participants in the post-test fixated on the stop sign hazard. The stop sign may have been difficult
to fixate on due to the positioning of the trucks. Also, participants had other methods of
determining a stop sign existed without fixating on the stop sign itself as there were “limit lines”
on the road next to each stop sign indicating to the driver where to stop. This lack of finding
could also be explained by participants using their peripheral vision to notice the stop sign. If
participants used their peripheral vision for the stop sign in either the pre-test or the post-test the
eye tracking technology would not have the capability to record periphery eye movements. It is
possible the stop sign itself was not an appropriate hazard for the eye tracking technology as
some participants were observed running the stop sign during the pre-test and the post-test,
which may have decreased the ability to determine significant results for this hazard.
Trucks. The trucks hiding the stop sign did produce significant results for total fixation
duration as it was significantly less for participants in the post-test. Although the overall average
difference from pre-test to post-test was about one second, this was found to be significantly
different. This is likely due to the practice participants received during training on stopping at

53
intersections and at stop lights in multiple different scenarios. Participants repeatedly practiced
anticipating where stop signs should be based on “limit lines” and how to stop appropriately for a
stop sign. Also, participants in the post-test may have looked at the trucks for less time as they
were already anticipating the stop sign behind the trucks and did not have to look at the trucks
blocking the way for as long as they did in the pre-test to make a decision. The simulator training
could have increased the speed the participants required to understand how to respond to the
trucks meaning they spent less time looking at them overall.
Left Turn.
Left Turn Oncoming Traffic and Traffic Light. There were no significant results for the
left turn oncoming traffic or left turn traffic light. Participants in both the pre-test and the post-
test had similar eye tracking measures related to this hazard. This is likely due to the nature of
the hazard itself, which was complex with multiple visual stimuli and had unique aspects
compared to the other hazards investigated in this study. During the left turn hazard, participants
were prompted to make a left turn at a 4-way intersection but did not have the right of way and
were required to wait until it was safe to turn in between oncoming traffic. Participants had to
use cognitive processing skills to determine the appropriate time to complete the left turn.
Participants may have been fixating on other pertinent areas or visual stimuli in both the pre-test
and post-test during the left turn hazard. It is also possible this hazard caused the participant to
use their peripheral vision or turn their head to maintain visual attention on the various stimuli,
which the eye tracking technology could not record. An interesting aspect of this hazard was the
amount of time participants spent waiting to complete the left turn itself. Both the pre-test and
post-test numbers on all eye tracking measures for this hazard were higher compared to other
hazards investigated in this study. Although the results are not clear, it is possible hazards that

54
include complex cognitive processing, multiple visual stimuli, or increased stationary time may
not be appropriate for determining significant results related to eye tracking. Further analysis is
required to determine the most appropriate hazards for eye tracking measures in this population.
Social Hazards
The most interesting results were related to the social hazards. There were significant
changes for at least one of the eye tracking measures in the bicyclist, pedestrian, and school
crosswalk hazards. Surprisingly, for the bicyclist and the pedestrians in the school crosswalk, the
changes in fixation duration and fixation count decreased in time on post-test, not increased as
expected. Time to first fixation did not show a significant change for these hazards. This would
suggest that the participants saw the hazard (bicyclist/pedestrians) as they appeared in the drive
at about the same time in the pre-test and post-test (thus no change in time to first fixation) and
understood what the hazard was and their likely path of progress. This would account for less
amount of time looking at the hazard (fixation duration) and decrease the need to look at the
hazard multiple times (fixation count). As such the participants may be focusing on driving
more effectively and attending to other aspects of driving competence. Conversely, it may be an
affirmation of other studies that show individuals with HFASD disregarding social hazards
(Bishop et al., 2017; Guillon et al., 2014; Sheppard et al., 2010; Sheppard et al., 2017).
In terms of the pedestrian hazard, the time to first fixation was significantly different,
showing a slower time to the first view of the hazard in the post-test. This may be an outlier, as it
is a social hazard, or the focus of the participants was on the operational and tactical components
of making the turn. It is possible the participants were more focused in the post-test on correctly
making the turn using skills practiced in training, which decreased their visual attention and

55
made them slower to fixate on the pedestrian. Additional result and analysis will be needed to
investigate these unique situations.
Bicyclist. Both fixation count and fixation duration were higher in the pre-test than they
were in the post-test for the bicyclist hazard indicating participants in the pre-test visually
attended to the hazard for longer and more often. However, as the participants’ overall driving
performance significantly increased during post-test, this finding does not indicate increased
visual attention always causes increased performance. Instead, it is likely participants in the post-
test required less fixations on the bicyclist and less time looking at the bicyclist to understand
and respond to the hazard. Participants in the pre-test may have needed to repeatedly look at the
bicyclist to decide what to do and how to react and to keep track of what the bicyclist was doing.
Participants in the post-test perceived the bicyclist in about the same time as they did in the pre-
test, but they decided on a motor response more quickly reducing the number and amount of
times they needed to fixate. During the simulator training, participants were required to react
quickly to avoid pedestrian hazards, but there were no bicyclist hazards in the learning modules.
This suggests the pedestrian hazard training on the simulator was adequate to increase the
decision-making ability of the participants when they encountered the bicyclist during the post-
test.
Pedestrian. Although there were no significant results for fixation count and fixation
duration for the pedestrian, participants were significantly faster at fixating on the pedestrian in
the pre-test (time to first fixation). Participants had multiple learning modules with training
related to perceiving and avoiding pedestrian hazards. However, most pedestrian hazards during
training occurred on a straight road, whereas the pedestrian hazard being studied occurred while
the participant was making a right turn at an intersection. It is possible the participant was

56
spending more time scanning the visual stimuli in the intersection causing them to take more
time to notice the pedestrian once they began turning in the post-test. Visual scanning was
emphasized during training and participants were reminded to focus on all areas outside the car,
not only directly in front of them or at the horizon as adolescents with HFASD may be prone to
do as evidenced by Reimer et al. (2017). If participants were visually scanning more competently
in the post-test, it is possible they took more time to fixate on the pedestrian. However, it is also
possible participants were more focused on the operational level components of making the turn
(e.g., steering, turn signals, gas/brake pedals) or the tactical level component of turning. If
participants were more focused on these aspects of driving, it could have decreased their visual
attention to the pedestrian. In contrast, participants in the pre-test had not received training on the
operational components of turning and may have noticed the pedestrian more quickly but
completed an unsafe or illegal turn during this hazard. It may be possible participants in the post-
test were performing the correct motor actions, but this adversely affected the speed of their
hazard perception for the pedestrian. It is interesting to note only the hazards that included a turn
(left turn and pedestrian) returned significant results for time to first fixation. This could indicate
a component of “turning hazards” makes them more likely to affect time to first fixation or these
hazards may not be appropriate for accurate results related to the specific eye tracking measures
investigated in this study.
School Crosswalk.
School Crosswalk. Participants demonstrated no significant change in the eye tracking
measures for the school crosswalk itself. Unlike the stop sign hazard, almost all the participants
fixated on the crosswalk at least once. Eye tracking data showed only 2 participants in the pre-
test and 2 participants in the post-test did not fixate on the school crosswalk. It is likely this

57
hazard did not produce significant results as the participants were more focused on the
pedestrians and they already had knowledge of school crosswalks in the pre-test. Participants in
both the pre-test and the post-test may have determined the school crosswalk itself did not
require visual attention if they were visually attentive to the pedestrians utilizing the crosswalk.
Participants in the pre-test and the post-test could have fixated on the hazard similarly as they
may have already been familiar with the nature of a school crosswalk during the pre-test and did
not need training to understand where to look. School crosswalks are a common occurrence and
participants may have utilized a crosswalk or been taught about them in school prior to this
study. Although training on crosswalks did occur during the simulator training, it was not
emphasized and there were no school crosswalks, which require a change in speed. Also, the
school crosswalk hazard is the only hazard investigated in this study that could be predicted by
participants based on the simulator graphics. In both the pre-test and post-test, the school
crosswalk was preceded by two school crosswalk signs alerting the participant to slow down in
preparation. As they knew the school crosswalk was going to occur, it could have affected the
participants’ visual attention and decreased the likelihood for statistically significant results.
School Crosswalk Pedestrians. Both fixation count and fixation duration were higher in
the pre-test than they were in the post-test for the pedestrians in the school crosswalk hazard.
This is likely due to participants requiring less time to determine the appropriate motor response
to the pedestrians in the crosswalk after training, as theorized for the results of the bicyclist
hazard. The simulator learning modules included multiple instances of pedestrians and repeated
practice occurred to increase the reaction time of the participants and ensure they avoided
collision. Time to first fixation for the pedestrians was similar for the pre-test and post-test
indicating participants perceived them in about the same time after they appeared on screen.

58
However, in the post-test it is likely participants were quicker at choosing a motor response and
could switch to visually scanning or fixating on other stimuli, instead of repeatedly fixating on
the pedestrians.
Skill Development
As designed, the participants completed the learning modules which included scenarios in
sequence beginning with simpler skills (e.g., steering, use of pedals, lane keeping) before moving
onto more complex skills (turning, use of mirrors, lane changing, merging). The participant was
provided with an explanation of the objective and instructions to complete the overall objective
at the beginning of each learning module and scenario. This specific information was provided in
a standardized script by the DriveSafety company related to the SimClinic software learning
modules, meaning each participant received the same instructions related to the objectives before
beginning each module. However, verbal cues given during the training varied depending on the
participant’s performance, understanding, and level of competence at each skill. Some
participants moved quickly through the scenarios, while others required repetition to gain
competence for each skill set. The Meeks (2017) study also used this progressive skills
development with opportunities for repetition with adolescent drivers with HFASD on the
driving simulator. Once the participant was competent at a specific skill being targeted, they
were able to move on until all 30 learning modules had been completed. Total time to complete
the 30 learning modules ranged from 2.5 to 5.5 hours, due to the individualized nature of
repeated practice and the differing driving skill levels of the participants.

59
Implications for Occupational Therapy Practice
This study informs occupational therapists that driving simulator training is appropriate
for improving driving performance in adolescents with HFASD. This supports previous research
that concluded driving simulators were appropriate, objective methods for clinicians and
researchers to evaluate and train driving skills in adolescents with HFASD (Classen, 2017;
Brooks et al., 2016; D. J. Cox et al., 2017; N. B. Cox et al., 2012; S. M. Cox et al., 2016). It also
informs occupational therapy practitioners that their knowledge of driving and community
mobility and their ability to provide individualized therapeutic guidance may make training on
the driving simulator more effective for adolescents with HFASD. Occupational therapy
practitioners should also be aware that hazard perception specific training does effect hazard
perception and response in this population. However, results related to specific social and non-
social hazards using eye tracking measures may not be appropriate for research or general
occupational therapy practitioners as findings in this study were inconsistent. Further research
will need to be completed using eye tracking response in this population related to social and
non-social hazards.
Limitations
One specific limitation of this study is the sample itself. Recruiting individuals with
HFASD with a desire to learn to drive or improve their driving skills was difficult because
adolescents with HFASD are less likely to drive themselves and obtain a driver’s license than
their typically developing peers (Curry et al., 2017; Lubin & Feeley, 2016). Therefore, the
sample size of this study was small, and this could limit the power of the statistical analyses
used. The sample was also a convenience sample which may affect the generalizability of the
results. However, to attempt to mitigate this limitation, demographic information was provided

60
about the participants, and it is assumed the participant sample is representative of the HFASD
population in Eastern. NC. Also, occupational therapy practitioners and researchers would also
find this a limitation when designing interventions for this population related to independent
driving. The use of a convenience sample could have caused selection bias (adolescents enrolling
in the study with interest in eye tracking affecting their driving skills) or the Hawthorne effect
(alteration of behavior in simulated driving because of the researcher’s presence). Participants
may also have had trouble completing driving simulator scenarios and focusing due to the
symptoms associated with their ASD diagnosis, but participants in this study did not self-report
any other diagnoses, which would affect their attention.
Technical difficulties were also a study limitation as the driving simulators, Tobii Pro
Glasses 2, and Tobii Pro Lab Analyzer software are all technologically complex. Accurate and
consistent data for each participant could be interrupted by lost connections. Also, some
participants were unable to use the eye tracking data as an outcome measure. Only eye tracking
data from participants whose gaze points were tracked at least 75% of the time was included.
Participants with less than 75% gaze samples were typically unable to properly wear and use the
Tobii Pro Glasses 2 due to squinting, peripheral vision usage, or a vision prescription higher than
the technology has available. In an attempt mitigate instances of technical difficulties training
with Tobii Pro repeatedly occurred throughout the study to address issues and ensure all
technology was up to date and well maintained for the duration of the study (Case, 2016).
Also, participants in the study had varying levels of driving experience. Some had their
driver’s license, while others had not completed driver’s education. These differing levels of
driving experience could have an adverse effect on the strength of the statistical analyses and
their ability to show significant change. However, we wanted to include adolescents with

61
HFASD with different levels of driving experience, as this increased the sample size and allowed
for better generalization of findings to a variety of adolescent drivers with HFASD.
Finally, a limitation of the study was the diversity of individuals with HFASD. The
intervention was tailored and included individualized occupational therapy therapeutic guidance
and therefore was not identical for each participant. Some participants moved faster than others
through the learning modules and scenarios, but the focus was continuously on matching the
pace that was best for the specific participant. However, no matter the characteristics or driving
difficulties each participant had, the focus was on training general driving skills and hazard
perception and response, and completing the modules competently.

62
Chapter 6: Conclusion
The literature overall indicates adolescents with HFASD may have characteristics that
make driving independently a difficult, but obtainable goal. Research has shown, training on a
driving simulator can increase driving performance in adolescents with HFASD. Overall,
findings in this study supported this previous research as adolescents with HFASD improved
their driving performance scores after training.
Existing studies have begun to explore using eye tracking in combination with simulator
training as adolescents with HFASD exhibit difference in eye gaze, visual attention, visual
scanning, and hazard perception and these are all important factors related to driving safely and
avoiding collisions. This study found hazard perception training on a simulator had varying
effects on hazard perception and response to social and non-social hazards in adolescent drivers
with HFASD. The training protocol may have given participants the ability to more quickly
perceive and decide on a course of action when encountering a hazard. However, due to the
inconsistency in results related to the eye tracking measures, further research needs to be
completed to help determine the efficacy of using eye tracking technology to determine a change
in hazard perception and response in this population.

63
References
Advanced Therapy Products (2014). WT-690 transit car transfer simulator. Atpwork.
http://www.atpwork.com/WT960.html
Almberg, M., Selander, H., Falkmer, M., Vaz, S., Ciccarelli, M., & Falkmer, T. (2017).
Experiences of facilitators or barriers in driving education from learner and novice
drivers with ADHD or ASD and their driving instructors. Developmental
Neurorehabilitation, 20(2), 59-67. https://doi.org/10.3109/17518423.2015.1058299
American Occupational Therapy Association. (2014). Occupational therapy practice framework:
Domain and process. American Journal of Occupational Therapy, 68(suppl.1), S1-S48.
https://doi.org/10.5014/ajot.2014.682006
American Psychiatric Association. (2013). Autism spectrum Disorder. In diagnostic and
statistical manual of mental disorders (5th ed.).
https://doi.org/10.1176/appi.books.9780890425596
American Psychological Association. (2020). Anxiety. APA.
https://www.apa.org/topics/anxiety/index.html
Chen, L.-H., Baker, S. P., & Li, G. (2006). Graduated driver licensing programs and fatal crashes
of 16-year-old drivers: a national evaluation. Pediatrics, 118(1), 56-62.
https://doi.org/10.1542/peds.2005-2281
Bella, F. (2008). Driving simulator for speed research on two-lane rural roads. Accident Analysis
& Prevention, 40(3), 1078-1087. https://doi.org/10.1016/j.aap.2007.10.015
Bishop, H. J., Biasini, F. J., & Stavrinos, D. (2017). Social and non-social hazard response in
drivers with autism spectrum disorder. Journal of Autism and Developmental Disorders,
47(4), 905-917. https://doi.org/ 10.1007/s10803-016-2992-1
64
Blane, A., Falkmer, T., Lee, H. C., & Dukic Willstrand, T. (2018). Investigating cognitive ability
and self-reported driving performance of post-stroke adults in a driving simulator. Topics
in Stroke Rehabilitation, 25(1), 44-53. https://doi.org/10.1080/10749357.2017.1373929
Fisher, A. G. & Griswold, L. A. (2014). Performance skills: implementing performance analyses
to evaluate quality of occupational performance. In B. A. Schell, G. Gillen, M. E. Scaffa,
and E. S. Cohn (Eds .), Willard and Spackman's Occupational Therapy (12th ed., p.
1241). Wolters Kluwer/Lippincott Williams & Wilkins.
Brooks, J., Kellett, J., Seeanner, J., Jenkins, C., Buchanan, C., Kinsman, A., Kelly D., & Pierce,
S. (2016). Training the motor aspects of pre-driving skills of young adults with and
without autism spectrum disorder. Journal of Autism and Developmental Disorders,
46(7), 2408-2426. https://doi.org/10.1007/s10803-016-2775-8
Brooks, J., Mossey, M. E., Tyler, P., & Collins, J. C. (2014). An exploratory investigation: are
driving simulators appropriate to teach pre-driving skills to young adults with intellectual
disabilities? British Journal of Learning Disabilities, 42(3), 204-213.
https://doi.org/10.1111/bld.12029
Case, R. (2016). Perceived effectiveness of a driving and community mobility bootcamp for
individuals with autism spectrum disorder. [Unpublished master’s thesis]. East Carolina
University. https://hdl.handle.net/10342/6021
Cederlund, M., Hagberg, B., Billstedt, E., Gillberg, I. C., & Gillberg, C. (2008). Asperger
syndrome and autism: A comparative longitudinal follow-up study more than 5 years
after original diagnosis. Journal of Autism and Developmental Disorders, 38(1), 72-85.
https://doi.org/10.1007/s10803-007-0364-6

65
Chee, D. Y., Lee, H. C., Patomella, A.-H., & Falkmer, T. (2017). Driving behaviour profile of
drivers with autism spectrum disorder (ASD). Journal of Autism and Developmental
Disorders, 47(9), 2658-2670. https://doi.org/10.1007/s10803-017-3178-1
Chee, D. Y., Lee, H. C., Falkmer, M., Barnett, T., Falkmer, O., Siljehav, J., & Falkmer, T.
(2015). Viewpoints on driving of individuals with and without autism spectrum disorder.
Developmental Neurorehabilitation, 18(1), 26-36.
https//:doi.org/10.3109/17518423.2014.964377
Classen, S. (Ed.). (2017). Driving simulation for assessment, intervention, and training: A guide
for occupational therapy and health care professionals. AOTA Press, The American
Occupational Therapy Association.
Classen S., & Akinwuntan, A. (2017). Validity and reliability in driving simulation. In: Classen
S. (Ed.), Driving simulation for assessment, intervention, and training:A guide for
occupational therapy and health care professionals (pp. 95-103). AOTA Press, The
American Occupational Therapy Association.
Classen, S., & Monahan, M. (2013). Evidence-based review on interventions and determinants of
driving performance in teens with attention deficit hyperactivity disorder or autism
spectrum disorder. Traffic Injury Prevention, 14(2), 188-193.
https://doi.org/10.1080/15389588.2012.700747
Classen, S., Monahan, M., & Brown, K. (2014). Indicators of simulated driving skills in
adolescents with attention deficit hyperactivity disorder. The Open Journal of
Occupational Therapy, 2(1), 3. https://doi.org/10.15453/2168-6408.1066
Classen, S., Monahan, M., Brown, K. E., & Hernandez, S. (2013). Driving indicators in teens
with attention deficit hyperactivity and/or autism spectrum disorder: Indicateurs de la

66
conduite automobile chez les jeunes ayant un déficit de l’attention avec hyperactivité ou
un trouble du spectre autistique. Canadian Journal of Occupational Therapy, 80(5), 274-
283. https://doi.org/10.1177/0008417413501072
Classen, S., Monahan, M., & Hernandez, S. (2013). Indicators of simulated driving skills in
adolescents with autism spectrum disorder. The Open Journal of Occupational Therapy,
1(4), 2. https://doi.org/10.15453/2168-6408.1051
Classen, S., Monahan, M., & Wang, Y. (2013). Driving characteristics of teens with attention
deficit hyperactivity and autism spectrum disorder. American Journal of Occupational
Therapy, 67(6), 664-673. https://doi.org/10.5014/ajot.2013.008821
Cox, D. J., Brown, T., Ross, V., Moncrief, M., Schmitt, R., Gaffney, G., & Reeve, R. (2017).
Can youth with autism spectrum disorder use virtual reality driving simulation training to
evaluate and improve driving performance? An exploratory study. Journal of Autism and
Developmental Disorders, 47(8), 2544-2555. https://doi.org/10.1007/s10803-017-3164-7
Cox, N. B., Reeve, R. E., Cox, S. M., & Cox, D. J. (2012). Brief report: Driving and young
adults with ASD: Parents’ experiences. Journal of Autism and Developmental Disorders,
42(10), 2257-2262. https://doi.org/10.1007/s10803-012-1470-7
Cox, S. M., Cox, D. J., Kofler, M. J., Moncrief, M. A., Johnson, R. J., Lambert, A. E., Cain, S. &
Reeve, R. E. (2016). Driving simulator performance in novice drivers with autism
spectrum disorder: The role of executive functions and basic motor skills, 46(4), 1379-
1391. https://doi.org/10.1007/s10803-015-2677-1
Curry, A. E., Yerys, B. E., Huang, P., & Metzger, K. B. (2017). Longitudinal study of driver
licensing rates among adolescents and young adults with autism spectrum disorder.
Autism, 22(4), 479-488. https://doi.org/10.1177/1362361317699586

67
Daly, B. P., Nicholls, E. G., Patrick, K. E., Brinckman, D. D., & Schultheis, M. T. (2014).
Driving behaviors in adults with autism spectrum disorders. Journal of Autism and
Developmental Disorders, 44(12), 3119-3128.
https://doi.org/10.1007/s10803-014-2166-y
Devos, H., Morgan, J. C., Onyeamaechi, A., Bogle, C. A., Holton, K., Kruse, J., Sasser, S., &
Akinwuntan, A. E. (2016). Use of a driving simulator to improve on-road driving
performance and cognition in persons with Parkinson's disease: A pilot study. Australian
Occupational Therapy Journal, 63(6), 408-414. https://doi.org/10.1111/1440-1630.12263
Dickerson, A. E., & Niewoehner, P. (2012). Chapter 6: Analyzing the complex IADLs of driving
and community mobility. In M. J. McGuire & E. Schold Davis (Eds.), Driving and
Community Mobility: Occupational Therapy Strategies Across the Lifespan (pp. 115-
135). AOTA Press, The American Occupational Therapy Association.
Dickerson, A., Schold Davis, E., & Carr, D. (2018). Driving decisions: Distinguishing
evaluations, providers, and outcomes. Geriatrics, 3(2), 25.
https://doi.org/10.3390/geriatrics3020025
Drive Safety Incorporated & Clemson University. (2019). SimClinic Scenario Descriptions.
Evans, D. & Lavallière, M. (2017). Fidelity. Physical fidelity in driving simulation. In: Classen
S. (Ed.), Driving simulation for assessment, intervention, and training:A guide for
occupational therapy and health care professionals (pp. 67-74). AOTA Press, The
American Occupational Therapy Association.
Fournier, K. A., Hass, C. J., Naik, S. K., Lodha, N., & Cauraugh, J. H. (2010). Motor
coordination in autism spectrum disorders: A synthesis and meta-analysis. Journal of

68
Autism and Developmental Disorders, 40(10) 1227-1240. https://doi.org/10.1007/s10803-
010-0981-3
George, S., & de la Perrelle, N. (2017). Simulator-based occupational therapy driving
intervention can reduce driving errors on a simulator-based driving assessment in combat
veterans with polytrauma. Australian Occupational Therapy Journal, 64(6), 512-513.
https://doi.org/10.1111/1440-1630.12435
Grynszpan, O., & Nadel, J. (2015). An eye-tracking method to reveal the link between gazing
patterns and pragmatic abilities in high functioning autism spectrum disorders. Frontiers
in Human Neuroscience, 8, para. 12. https://doi.org/10.3389/fnhum.2014.01067
Guillon, Q., Hadjikhani, N., Baduel, S., & Rogé, B. (2014). Visual social attention in autism
spectrum disorder: Insights from eye tracking studies. Neuroscience and biobehavioral
reviews, 42, 279-297. https://doi.org/10.1016/j.neubiorev.2014.03.013
Harand, C., Mondou, A., Chevanne, D., Bocca, M. L., & Defer, G. (2018). Evidence of
attentional impairments using virtual driving simulation in multiple sclerosis. Multiple
Sclerosis and Related Disorders, 25, 251-257.
https://doi.org/10.1016/j.msard.2018.08.005
Hill, E. L. (2004). Evaluating the theory of executive dysfunction in autism. Developmental
Review, 24(2), 189-233. https://doi.org/10.1016/j.dr.2004.01.001
Howlin, P. (2000). Outcome in adult life for more able individuals with autism or Asperger
Syndrome. Autism, 4(1), 63-83. https://doi.org/10.1177/1362361300004001005
Huang, P., Kao, T., Curry, A., & Durbin, D. (2012). Factors associated with driving in teens with
autism spectrum disorders. Journal of Developmental & Behavioral Pediatrics, 33(1),
70-74. https://doi.org/10.1097/DBP.0b013e31823a43b7

69
Hunt, L. A. & Slater L. (2012). Occupational therapy's ethical obligation to address driving and
community mobility. In M. J. McGuire & E. Schold Davis (Eds.), Driving and
community mobility: Occupational therapy strategies across the lifespan (pp. 101–113).
AOTA Press, The American Occupational Therapy Association.
Lai, M.-C., Lombardo, M. V., & Baron-Cohen, S. (2014). Autism. The Lancet, 383(9920), 896-
910. https://doi.org/10.1016/S0140-6736(13)61539-1
Lee, H. C., Cameron, D., & Lee, A. H. (2003). Assessing the driving performance of older adult
drivers: On-road versus simulated driving. Accident Analysis & Prevention, 35(5), 797-
803. https://doi.org/10.1016/S0001-4575(02)00083-0
Levy, A., & Perry, A. (2011). Outcomes in adolescents and adults with autism: A review of the
literature. Research in Autism Spectrum Disorders, 5(4), 1271-1282.
https://doi.org/10.1016/j.rasd.2011.01.023
Lubin, A., & Feeley, C. (2016). Transportation issues of adults on the autism spectrum: Findings
from focus group discussions. Transportation Research Record: Journal of the
Transportation Research Board, 2542(1), 1-8. https://doi.org/10.3141/2542-01
Maenner, M. J., Shaw K. A., Baio J., Washington, A., Patrick, M., DiRienzo, M., Christensen, D.
L., Wiggins, L. D., Pettygrove, S., Andrews, J. G., Lopez, M., Hudson, A., Baroud, T.,
Schwenk, Y., White, T., Rosenburg, C. R., Lee, L. C-., Harrington, R. A., Huston, M.,…
Dietz, P.M. (2020). Prevalence of autism spectrum disorder among children aged 8
Years--Autism and Developmental Disabilities Monitoring Network, 11 sites, United
States, 2016. MMWR Surveillance Summaries, 69(4), 1-12. https://doi.org/
10.15585/mmwr.ss6904a1

70
Meeks, L. T. (2017). Effective use of a driving simulator as an intervention tool for adolescents
and young adults with autism spectrum disorder. [Unpublished master’s thesis]. East
Carolina University. https://hdl.handle.net/10342/6486
Michon, J. A. (1985). A critical view of driver behavior models: What do we know, what should
we do? In L. Evans & R. C. Schwing (Eds.), Human behavior and traffic safety, (pp.
485–520). Plenum Press.
Monahan, M. (2012). Assessing, treating, and preparing youth with special needs for driving and
community mobility. In M. J. McGuire & E. Schold Davis (Eds.), Driving and
community mobility: Occupational therapy strategies across the lifespan (pp. 383-410).
AOTA Press, The American Occupational Therapy Association.
Mullen, N., Charlton, J., Devlin, A., & Bedard, M. (2011). Simulator validity: Behaviours
observed on the simulator and on the road. In D. L. Fisher, M. Rizzo, J. K. Caird, & J. D.
Lee (Eds.), Handbook of Driving Simulation for Engineering, Medicine and Psychology
(pp. 1-18) CRC Press.
Nonverbal communication. (2004). In W. E. Craighead & C. B. Nemeroff (Eds.), The concise
Corsini encyclopedia of psychology and behavioral science (3rd ed.). Wiley Credo
Reference.
Patomella, A.-H. (2014). P-Drive Manual and Guidelines.
Patomella, A.-H., & Bundy, A. (2015). P-Drive: Implementing an assessment of on-road driving
in clinical settings and investigating its internal and predictive validity. The American
Journal of Occupational Therapy, 69(4), 1-8. https://doi.org/10.5014/ajot.2015.015131
Patomella, A.-H., Tham, K., Johansson, K., & Kottorp, A. (2010). P-Drive on-road: Internal
scale validity and reliability of an assessment of on-road driving performance in people

71
with neurological disorders. Scandinavian Journal of Occupational Therapy, 17(1), 86-
93. https://doi.org/ 10.3109/11038120903071776
Reimer, B., Fried, R., Mehler, B., Joshi, G., Bolfek, A., Godfrey, K. M., Zhao, N., Goldin, R., &
Biederman, J. (2013). Brief report: Examining driving behavior in young adults with high
functioning autism spectrum disorders: A pilot study using a driving simulation
paradigm. Journal of Autism and Developmental Disorders, 43(9), 2211-2217.
https://doi.org/10.1007/s10803-013-1764-4
Ross, V., Cox, D. J., Reeve, R., Brown, T., Moncrief, M., Schmitt, R., & Gaffney, G. (2017).
Measuring the attitudes of novice drivers with autism spectrum disorder as an indication
of apprehensive driving: Going beyond basic abilities. Autism, 22(1), 62-69.
https://doi.org/10.1177/1362361317735959
Selander, H., Stave, C., Willstrand, T. D., & Peters, B. (2019). Driving simulator-based training
to improve self-rating ability of driving performance in older adults – a pilot study.
European Transport Research Review, 11(1), 1-7. https://doi.org/10.1186/s12544-019-
0372-6
Shechtman, O., Classen, S., Awadzi, K., & Mann, W. (2009). Comparison of driving errors
between on-the-road and simulated driving assessment: A validation study. Traffic Injury
Prevention, 10(4), 379-385. https://doi.org/10.1080/15389580902894989
Sheppard, E., Ropar, D., Underwood, G., & van Loon, E. (2010). Brief report: Driving hazard
perception in autism. Journal of Autism and Developmental Disorders, 40(4), 504-508.
https://doi.org/10.1007/s10803-009-0890-5
Sheppard, E., van Loon, E., Underwood, G., & Ropar, D. (2017). Attentional differences in a
driving hazard perception task in adults with autism spectrum disorders. Journal of

72
Autism and Developmental Disorders, 47(2), 405-414. https://doi.org/10.1007/s10803-
016-2965-4
Simons-Morton, B., & Ouimet, M. C. (2006). Parent involvement in novice teen driving: a
review of the literature. Injury Prevention, 12(suppl.1), i30-i37.
https://doi.org/10.1136/ip.2006.011569
Systems Technology Inc. (2013). STISIM drive for occupational therapists: SDOT user manual.
Tobii Pro (2017). Eye tracker data quality report: Accuracy, precision, and detected gaze under
optimal conditions- controlled environment. Unpublished Report.
https://www.tobiipro.com/siteassets/tobii-pro/accuracy-and-precision-tests/tobii-pro-
glasses-2-accuracy-and-precision-test-report.pdf
Tobii Pro (2018a). Tobii Pro Glasses 2 Brochure. https://www.tobiipro.com/siteassets/tobii-
pro/brochures/tobii-pro-glasses-2-brochure.pdf/?v=5
Tobii Pro (2018b). Tobii Pro Lab Brochure. https://www.tobiipro.com/siteassets/tobii-
pro/brochures/tobii-pro-lab-brochure.pdf/?v=1.76
Transportation Research Board (2016). Taxonomy and Terms for Stakeholders in Senior
Mobility. Transportation Research Circular.
http://onlinepubs.trb.org/Onlinepubs/circulars/ec211.pdf
Underwood, G. (2007). Visual attention and the transition from novice to advanced driver,
Ergonomics, 50(8), 1235-1249. https://doi.org/10.1080/00140130701318707
U.S. Department of Transportation Federal Highway Administration (2011). Drivers. Our
Nation’s Highways: 2011. pp. 25-36.
https://www.fhwa.dot.gov/policyinformation/pubs/hf/pl11028/

73
Wade, J., Weitlauf, A., Broderick, N., Swanson, A., Zhang, L., Bian, D., Sarkar, M., Warren, Z.,
& Sarkar, N. (2017). A pilot study assessing performance and visual attention of
teenagers with ASD in a novel adaptive driving simulator. Journal of Autism and
Developmental Disorders, 47(11), 3405-3417.
https://doi.org/10.1007/s10803-017-3261-7
Wang, S., Jiang, M., Duchesne, X. M., Laugeson, E. A., Kennedy, D. P., Adolphs, R., & Zhao,
Q. (2015). Atypical visual saliency in autism spectrum disorder quantified through
model-based eye tracking. Neuron, 88(3), 604-616.
https://doi.org/10.1016/j.neuron.2015.09.042
Zhang, L., Wade, J., Bian, D., Fan, J., Swanson, A., Weitlauf, A., Warren, Z., & Sarkar, N.
(2017). Cognitive load measurement in a virtual reality-based driving system for autism
intervention. IEEE Transactions on Affective Computing, 8(2), 176-189.
https://doi.org/10.1109/TAFFC.2016.2582490

74
EAST CAROLINA UNIVERSITY
University & Medical Center Institutional Review Board
4N-64 Brody Medical Sciences Building· Mail Stop 682 600 Moye Boulevard · Greenville, NC 27834
Office 252-744-2914 · Fax 252-744-2284 · www.ecu.edu/ORIC/irb
Notification of Initial Approval: Expedited
From: Social/Behavioral IRB
To: Tara Baran
CC:
Anne Dickerson
Date: 12/18/2018
Re: UMCIRB 18-002318
Driving Simulator, Eye Tracking, and P-Drive
I am pleased to inform you that your Expedited Application was approved. Approval of the study and any consent form(s) is for
the period of 12/18/2018 to 12/17/2019. The research study is eligible for review under expedited category # 6, 7. The
Chairperson (or designee) deemed this study no more than minimal risk.
Changes to this approved research may not be initiated without UMCIRB review except when necessary to eliminate an apparent
immediate hazard to the participant. All unanticipated problems involving risks to participants and others must be promptly
reported to the UMCIRB. The investigator must submit a continuing review/closure application to the UMCIRB prior to the date
of study expiration. The Investigator must adhere to all reporting requirements for this study.
Approved consent documents with the IRB approval date stamped on the document should be used to consent participants
(consent documents with the IRB approval date stamp are found under the Documents tab in the study workspace).
The approval includes the following items:
Name Description
15-17 year assent Consent Forms
18 and up Consent Consent Forms
Parent Consent Consent Forms
Recruitment Email Recruitment Documents/Scripts
Recruitment Flyer Recruitment Documents/Scripts
Thesis Proposal Study Protocol or Grant Application
The Chairperson (or designee) does not have a potential for conflict of interest on this study.
IRB00000705 East Carolina U IRB #1 (Biomedical) IORG0000418
IRB00003781 East Carolina U IRB #2 (Behavioral/SS) IORG0000418
Appendix A:
IRB Approval Letter

75
Appendix B:
Tobii Pro Glasses 2 Photos

76

77
Appendix C:
Description of Tobii Software Terms and Tools
Area of interest (AOI): Tool to select subregions of a displayed image or video and extract
metrics related to these subregions. In this study, AOIs will be specifically used for specific
hazards in the driving simulation scenarios
Gaze point: Show each individual place the eyes are looking during eye tracking
Fixation: Series of gaze points extremely close together, meaning the eyes are fixed on an object
during eye tracking
Visual heat maps: Visual representation of fixations and gaze points of a single participant or an
entire study, areas where fixations are more common will be denoted in red, followed by yellow
and then green
Manual mapping: When a researcher clicks each individual gaze point to map it on a still picture,
diagram, or schematic
AOI diagram: Used to manually map individual gaze points on subregions of a displayed image
Fixation duration on AOIs: Measurement of the amount of time in seconds a participant spends
looking at an AOI
Time to first fixation on AOIs: Measurement of how long it takes a participant to look at an AOI
once it is visible
Fixation count on AOIs: Measurement of how many times a participant looks at a specific AOI
while it is visible

78
Appendix D:
Example Diagrams of AOIs

79
Appendix E:
P-Drive Scoring Manual
-Drive Copyright Ann-Helen Patomella ©
P-Drive Items to Score (N = 25): 1. Steering This item is about steering the vehicle in a competent and safe manner. The grading is influenced by the quality of the grasp of the steering wheel and coordination of steering to maintain the correct road position. Examples of scoring: 4 = Has no problem steering the vehicle in a competent and safe manner. 3 = Steers the vehicle with some hesitancy. Example: Uses a questionable grip of the steering
wheel such as one-handed steering. 2 = Unsafe steering has a potential to create a risky situation. Example; Steering in a risky
manner such as hitting the curb. 1 = Loses control of the steering or incompetent steering that has potential for crash or running
off the road. Intervention is required to assist with steering. 3. Using pedals This item is about using the pedals in a competent and secure manner during the driving test. Observe the client’s ability to locate the pedals accurately and apply the brake and accelerator in a smooth and coordinated manner without looking at pedals. Examples of scoring: 4 = Competent and secure use of pedals 3 = Shows hesitancy in the calibration of pressure on one or both pedals. Example: Slow or late
in taking action but does not impinge action. 2 = Delay in the use of pedals leads to a potentially risky situation. For example: Uses too little pressure on the brake, stops abruptly causing difficulty for vehicles behind. 1 = Makes mistakes or physically does not use the pedals in a secure manner. Examples:
Brakes too late, mistakes the brake for accelerator or reverse, applies the accelerator and brake at the same time, physically cannot use the pedals. 4. Controlling speed - too slow This item is about being able to control and adapt the vehicle’s speed without being too slow for the conditions. Observe ability to drive at a speed appropriate to the conditions and without slowing other traffic down. A low speed that is unjustified and hinders other traffic will lead to a lower score.

80
Examples of scoring: 4 = Selects and adapts an appropriate speed for the traffic conditions without hindering other
road users. 3 = Choice of speed is questionable. Example: Drives at a speed that would have some other
road users overtake or pass the client’s vehicle. 2 = Choice of speed is unjustified and too slow for the situation in that all drivers are needing to
overtake or pass the client’s vehicle or other road users are significantly slowed down. Example: Drives approximately at 25-30 mph on a 40-50 mph road where it is warranted to keep up the speed.
1 = Does not maintain a speed appropriate for other traffic and the road conditions so that driving is not performed in a safe and competent manner. Example: Causes other road users to slow or brake suddenly, potentially increasing the risk of a crash.
5. Controlling speed- too fast This item is about being able to control and adapt speed according to the traffic situation without driving too fast. Ability to stay within the speed limit and reduce speed when necessary for the situation (e.g., due to other traffic, school zones or pedestrians) is observed. Driving at a speed that is above the client’s ability or inappropriate for the traffic conditions will lower the score. Examples of scoring: 4 = Selects and adapts an appropriate speed for the traffic situation by remaining within the
speed limit. 3 = Choice of speed is questionable. Example: Overtakes a slower vehicle going slightly over
speed limits. 2= Choice of speed is risky for driving conditions or drives at a speed potentially above driver’s
ability to safely control the vehicle. 1= Does not adapt speed for driving conditions, driving too fast and it unsafe manner.
Repeatedly drives over the speed limit or for the road conditions (rain, traffic, intersections). 6. Using turn signals (indicators) This item concerns the use of indicators in a safe and appropriate manner. Difficulties that would lead to a lower score include; 1) Difficulties in planning and correctly sequence the use of the indicator, or 2) incorrect use of the left and right indicator depending of the direction of the turn or 3) applying the indicator unnecessarily (when not turning). Although many drivers have bad habits, this should be scored for the safety and competence of the skills observed. Examples of scoring: 4 = Uses the correct indicators in an appropriate manner. 3 = Misses or is late in application of the indicator without compromising safety. 2 = Does not use the indicator consistently, but use does not lead to any risky issues in the
traffic situation.

81
1 = Does not use the indicator when needed to prevent a risky situation or uses the indicator I inaccurate way causing a risky situation, such as indicating the wrong direction without correction.
8. Following instructions This item is about being able to follow verbal instructions in a competent and secure manner. Ability to follow verbal instructions without hesitation or the need for prompts or repeated instructions or the need for clarification is observed. Examples of scoring: 4 = Follows instructions appropriately and in accordance with situational needs. 3 = Hesitates with directions or asks a single confirming question such as “Which way did you
say to turn?” 2 = Does not follow instructions, needs repeated directions, or needs cues to follow the
instructions. 1 = Does not follow instructions and requires significant intervention to manage traffic situations. 10. Positioning on the road This item is about being able to select the correct position on the road in a competent and safe manner. Ability to stay within the lane, maintain a straight course, avoid cutting corners or taking wide corners, and maintain appropriate buffer zones from other vehicles and object in other lanes or at the side of the road is scored. Examples of scoring: 4 = Maintains a correct and secure lane position on the roadway. 3 = May move into an incorrect position on the road but corrects the mistake. Becomes aware of any incorrect lane position and self corrects without prompting. Hesitates in the choice of
lane when required. 2 = Lane position is too much to the right or the left, does not maintain correct lane position or
chooses incorrect lane. Does not present a risk for a crash. 1 = Does not maintain correct lane position on the road even with cueing. Repeatedly drives
too close to other vehicles or objects on either side of the lane. Chooses incorrect lane which may cause a crash, as in a two lane turn and moving into the other lane).
11. Keeping distance This item is about maintaining adequate buffer zones (distances) around the vehicle and selecting the right distance to other cars and objects. This includes being able to keep a secure distance to pedestrian crossings, traffic lights, stop lines, other vehicles, moving and still objects, parking spaces, and/or road signs. Examples of scoring:

82
4 = Keeps an adequate buffer zones or distances to objects in front and to the side of the vehicle.
3 = Buffer zones to other objects are too close or too far but does not impact safety. Does not adapt to distances smoothly as in stopping abruptly just before the stop line.
2 = Buffer zones are too close which may create a risky situation, as in tailgating, although corrects when cued.
1 = Does not keep a safe distance without intervention or stops the vehicle over the stop line in an intersection when traffic lights are red putting the vehicle at risk for a crash.
12. Planning This item is about being able to plan driving maneuvers and sequences in a competent and safe manner. This includes being able to plan the next maneuver, such as changing lanes before an intersection, slowing down before a roundabout and knowing when to merge into a lane on a highway. (The item is about finding a flow in the driving and being able to plan the driving from place A to place B). Examples of scoring: 4 = Competently plans driving maneuvers in a way that facilitates performance of other actions 3 = Hesitates in the planning of the driving maneuvers. Does not follow directions to a specified
place or positions but chooses a different route with the same outcome (although signage was present).
2 = Does not plan appropriate maneuvers resulting in a different outcome from expected. Poor planning may put vehicle in risky situations.
1 = Does not plan appropriate or safe maneuvers resulting in intervention or several risky actions.
13. Yielding This item is about being able to yield to other traffic in compliance with road law in a competent and safe manner. This includes understanding when specific road rules apply and being able to drive in a way that indicates the rules are understood. Understanding includes both for when yielding is needed as well as when other traffic needs to yield for him or her. Examples of scoring: 4 = Yields appropriately for traffic situation in a competent and safe manner and in compliance
with road laws. 3 = Hesitates in yielding such as in merging 2 = Does not yield according to the road rules or needs to be cued to yield appropriately and
safely. Example: Does not slow down enough so that other vehicles can pass or yield while in a roundabout.
1 = Repeatedly fails to yield according to road rules leading to risky driving needing intervention. 14. Obeying stop signs and traffic lights

83
This item is about being able to stop the vehicle at a stop sign or traffic light in a competent and safe manner including being able to decide when to stop in accordance with current road law. Ability to drive in a confident and competent manner without hesitating is observed (demonstrating knowledge of the road rules for stopping). Failure to stop the car completely at a stop sign leads to a lower score. Examples of scoring: 4 = Obeys the stop regulations and road laws appropriately and adequately. 3 = Hesitates to stop at stop sign or traffic light. 2 = Inadequate actions at stop signs or traffic lights including not stopping completely as in
yielding instead of stopping. 1= Does not stop at stop sign or red light or slowing down to assess risk, requiring intervention. 15. Following speed regulations This item is about being able to follow speed regulations in a competent and safe manner, without speeding. Violating the speed limit is a more severe error in low speed zones such as 25 mph school zones. Be aware that only speeding is scored for this item. If the driver is driving is too slow or hindering other traffic but the speed limit is not exceeded, this is still scored as a 4. Examples of scoring: 4 = Adheres to posted speed limits. 3 = Hesitates in response to speed limit signs and/or drives up to 5 mph over the limit 2 = Drives over the speed limit; but within 10 mph over the limit. 1 = Drives consistently over the speed limit and over the 10 mph limit; Potential risky situations
due to speeding. 16. Attending and responding to the road environment ahead This item is about being able to attend to the forward road environment ahead in a competent and safe manner, including attending to and acting upon stimuli in the traffic environment (e.g. other cars, signs and pedestrians). A slowed action will lead to a lower score. Examples of scoring: 4 = Attends and responds to road signs, hazards and traffic in the road environment ahead. 3 = Hesitant in attending to and responding to road environment ahead. 2 = Late or slow in attending and responding to road environment ahead. 1 = Does not attend and respond to road environment ahead or needs intervention. 17. Attending and responding to the right This item is about being able to attend the right side of the vehicle and then respond in a competent and safe manner. The right is defined as the area immediately to the right of the vehicle. This includes being able to attend and respond to stimuli in the traffic environment that

84
is to the right of the vehicle, such as other vehicles, signs and pedestrians. It also includes ability to attend and act upon traffic in the blind spot. A slowed action will lead to a lower score. Examples of scoring: 4 = Attends and responds to signs, traffic and hazards on the right of the vehicle 3 = Hesitant in attending and responding to stimuli on the right side of the vehicle. 2 = Late or slow in attending and responding to stimuli on the right side of the vehicle 1 = Does not attend and respond to stimuli on the right side of the vehicle or needs intervention. 18. Attending and responding to the left This item is about being able heed to the left in a competent and safe manner, attending and responding to stimuli in the traffic environment that is to the left of the vehicle such as other vehicles, signs and pedestrians etc. Also, ability to attend and act upon traffic in the left blind spot is scored. A slowed action will lead to a lower score. Examples of scoring: 4 = Attends and responds to signs, traffic and hazards on the left side of the vehicle 3 = Hesitant in attending and responding to stimuli on the left side of the vehicle. 2 = Late or slow to attending and responding to stimuli on the left side of the vehicle. 1= Does not attend and respond to stimuli to the left side of the vehicle or needs intervention in it requires intervention. 19. Attending and responding to mirrors This item is about being able to use mirrors to attend and respond to stimuli in the traffic environment to either side or the rear of the vehicle in a competent and safe manner. This includes awareness of other vehicles to the side/behind the vehicle and when changing lanes. A slowed action will lead to a lower score. Examples of scoring: 4 = Actively uses mirrors to attend and respond to stimuli in the road environment such as other
vehicles. 3 = Hesitant in using mirrors to attend and respond to stimuli to the side or rear of the vehicle. 2 = Does not use mirrors consistently or adequately to attend and respond to stimuli in the
mirrors / to the side or rear of the vehicle so that there is potential for risk. 1= Does not use mirrors to respond to stimuli in the road environment. Example: Changing
lanes increases risk of crash or requires intervention.
20. Attending and responding to regulatory signs
This item is about being able to attend and respond to signs of regulation in a competent and safe manner and appropriately following the intent of the signs. A slowed action will lead to a lower score.

85
Examples of scoring: 4 = Appropriately attends and responds to regulatory signs. 3 = Hesitate in attending or responding to regulatory signs 2 = Late in attend or respond to regulatory signs or corrects a mistake when made. 1 = Does not attend or respond to regulatory signs repeatedly or requires repeated cueing or
intervention to avoid an adverse incident.
21. Attending and responding to advisory road signs
This item is about being able attend and respond to advisory signs in a competent and safe manner and appropriately responds to the intent of the advisory signs. A slowed action will lead to a lower score. Examples of scoring: 4 = Attend and respond with the appropriate respond to advisory signs. 3 = Hesitant to attending and responding to advisory signs. 2 = Late in attending and responding to advisory signs or corrects a mistake when made. 1 = Does not attend or respond to advisory signs repeatedly or requires cueing or intervention to avoid an adverse incident. 22. Attends and responds to fellow road users This item is about being aware of fellow road users and adjusting driving performance in a competent and safe manner as required. This includes being able to interact appropriately with fellow road users. A slowed action will lead to a lower score. Examples of scoring: 4 = Attends and responds appropriately towards the intentions of fellow road users. 3 = Hesitant in attending and responding with fellow road users. 2 = Slowed or late in attending and responding to fellow road users. 1 = Does not attend or respond to fellow road users and requires intervention. 23. Reacting This item is about being able to react in a timely manner and act appropriately to expected, unexpected, and hazardous road situations. A slowed action will lead to a lower score. Examples of scoring: 4 = Reacts in advance to unexpected situations involving fellow road users or situations. 3 = Hesitant in response to unexpected situations in the road environment actions ore expected
actions such as a red light. 2 = Late reaction to an unexpected action but manages to respond appropriately to the
situation.

86
1 = Does not react appropriately to an expected or unexpected action causing a risky situation and/or needing intervention.
24. Focusing This item is about concentrating on the driving task in a competent and safe manner. This involves being able to focus on the task at hand and prioritize safety during driving. To be easily distracted leads to a lower score. Examples of scoring: 4 = Concentrates on the driving task even with conversation. 3 = Increased hesitancy with maneuvers with any distraction, but able to complete the task.
Example: Late in planning turn due to a conversation in the vehicle or can correct mistake without help.
2 = Late or misses maneuvers of the driving task with distractions. Example: Misses turn or signs during drive because talking instead of focusing on driving.
1 = Late or misses maneuvers of the driving task with distractions, is easily distracted, cannot correct mistakes, and needs intervention.
25. Problem solving This item is about solving problems in a competent and safe manner without assistance. Examples of scoring: 4 = Solves a problem or situation that arise during driving independently and adequately 3 = Hesitate in the solving of problems but resolves the issue with little or no intervention. 2 = Late problem solving, requires prompting to solve problems. 1 = Unable to solve problems. Requires verbal or physical intervention. Other: Weather and road conditions: Note the circumstances for the test, for example slippery roads, rush hour or rain. Standard route or special route: Specify which route was used. It is allowed to mark more than one. General rules for scoring:
• Only score what you have observed.
• The worst behavior observed is scored; record and score error items even if the client has been driving well for the rest of the test.
• When you are hesitating between two scores, give the lower score.
• If an item has not been observed, do not score this item.

87
• When the car is adapted, do not give the client a lower score due to the adaption, but make sure that you have made a note about the modification on the score protocol.
• When you observe an error, it is usually scored down on several items.
*Items 2, 7, and 9 have been removed as they will not be scored in this study*

88
Appendix F:
P-Drive Score Sheet

89
Appendix G:
Road Test Version 1 and 2 Description

90

91
Appendix H:
Simulator Protocol Scenarios and Objectives (DriveSafety & Clemson University, 2019)
Learning
Module Qualifiers Category Objectives
Calibration-
Interactive -- Phase 1 1. Calibrate the pedals and steering wheel
Steering Static Tutorial, Level 1 Phase 1 1. Effectively and efficiently move the
steering wheel to a static target zone
Pedals Static Level 1 Phase 1 1. Press the pedal to hold the indicator
within a static target zone
Stop Light and
Steering Task Only, 32 symbols Phase 1
1. Interact with the pedals and steering
wheel
2. Interpret meaning of traffic lights and
arrows
Lane Keeping
Straight -- Phase 2
1. Travel an appropriate speed while
maintaining good lane positioning on a
straight road (for 30 seconds)
Pedals Static Level 2 Phase 1 1. Press the pedal to hold the indicator
within a static target zone
Steering Static Level 2 Phase 1 1. Effectively and efficiently move the
steering wheel to a static target zone
Stop Light and
Steering Task Only, 64 symbols Phase 1
1. Interact with the pedals and steering
wheel
2. Interpret the meaning of on-screen
symbols (traffic lights and arrow) in
relation to steering and pedal responses
Combined
Controls Gas Level 1 Phase 1
1. Press the pedals and turn the wheel
with a static target zone
Combined
Controls Brake Level 1 Phase 1
1. Press the pedals and turn the wheel
with a static target zone
Lane Keeping,
Changing Lanes -- Phase 2
1. Practice changing lanes and using turn
signals on straight road with no traffic

92
Speed Control
Straight -- Phase 2
1. Maintain target speeds while
maintaining central lane position
Turning Left -- Phase 3 1. Practice making left hand turns at
intersections
Turning Right -- Phase 3 1. Practice making right hand turns at
intersections
Following
Distance -- Phase 3 1. Practice safe following distances
Pedals Static Level 3 Phase 1 1. Press the pedal to hold the indicator
within a static target zone
Steering Static Level 3 Phase 1 1. Effectively and efficiently move the
steering wheel to a static target zone
Pedals and
Stopping -- Phase 3
1. Become familiar with pedal operation
and stop vehicle at stop signs and traffic
lights
Merging -- Phase 3 1. Introduce merging into freeway traffic
Changing Lanes
and Braking -- Phase 3
1. Practice lane changing and stop sign
intersections
Obstacles on
Straight Beginner Phase 3
1. Make smooth lane changes and avoid
obstacles
FOD Complete full tutorial
procedure, cruise pop Phase 2
1. Drive down a straight road while
scanning the driving environment for
targets
2. Respond to lead vehicle brake events
FOD Do not complete full tutorial,
no cruise pop Phase 2
1. Drive down a straight road while
scanning the driving environment for
targets
2. Respond to lead vehicle brake events
Lane Keeping
Mirrors -- Phase 2
1. Practice mirror usage and awareness
of surrounding vehicles
Practice lane changing, can crash
Level 1 Hazards -- Phase 4
1. Drive on a straight road, avoid (3)
hazardous events, can crash
2. Park the car on the side of the road at
end of drive

93
Obstacles on
Straight Advanced Phase 3
1. Make smooth lane changes and avoid
obstacles
Level 2 Hazards -- Phase 4 1. Drive on a straight road, avoid (3)
hazardous events
FOD- Advanced
All rows, no cruise pop, 0
distractors, 0 fade time, 2
display time, 1 presentation
Phase 4
1. Drive down a straight road while
scanning the driving environment for
targets
2. Respond to lead vehicle brake events
Level 3 Hazards -- Phase 4 1. Drive on a straight road, avoid (3)
hazardous events
City and
Highway -- Phase 4