Hazard assessment of ciprofloxacin, sulfamethoxazole and ...
100
Hazard assessment of ciprofloxacin, sulfamethoxazole and triclosan for marine periphyton Ecotoxicology, Pollution-Induced Community Tolerance and Co-Tolerance Henrik Johansson Institutionen för biologi och miljövetenskap Naturvetenskapliga fakulteten Akademisk avhandling för filosofie doktorsexamen i Naturvetenskap med inriktning mot Miljövetenskap, som med tillstånd från Naturvetenskapliga fakulteten kommer att offentligt försvaras fredag den 17:e oktober 2014 kl. 10.00 i Hörsalen, Institutionen för biologi och miljövetenskap, Carl Skottsbergsgata 22B, Göteborg. ISBN: 978-91-85529-72-8
Transcript of Hazard assessment of ciprofloxacin, sulfamethoxazole and ...

Hazard assessment of ciprofloxacin, sulfamethoxazole and triclosan for marine
periphyton
Ecotoxicology, Pollution-Induced Community Tolerance and Co-Tolerance
Henrik Johansson Institutionen för biologi och miljövetenskap
Naturvetenskapliga fakulteten
Akademisk avhandling för filosofie doktorsexamen i Naturvetenskap med inriktning mot Miljövetenskap, som med tillstånd från Naturvetenskapliga
fakulteten kommer att offentligt försvaras fredag den 17:e oktober 2014 kl. 10.00 i Hörsalen, Institutionen för biologi och miljövetenskap, Carl Skottsbergsgata 22B,
Göteborg.
ISBN: 978-91-85529-72-8

Abstract Antibiotics and personal care products are used in large quantities and commonly detected in various environmental compartments. The two antibiotics, ciprofloxacin and sulfamethoxazole, and the personal care product triclosan are among the most commonly detected compounds in sewage treatment plants and aquatic environments. Due to their usage patterns there is a risk that they also will end up in the coastal marine environment, where they risk affecting marine microorganisms. Despite this, only a limited number of studies have been published on their occurrence and ecotoxicity in the marine environment.
As ciprofloxacin, sulfamethoxazole and triclosan are used for their inherent antimicrobial properties, microorganisms are thus likely to be among the most sensitive organisms and the aim of this thesis is thus to perform an in depth ecotoxicological hazard assessment on natural marine microbial communities. Periphyton (biofilm forming communities composed of both autotrophic and heterotrophic organisms) from the Gullmar fjord on the Swedish west coast was used for the hazard assessments.
Chronic effects on the periphyton were assessed using two types of test systems, the semi-static SWIFT periphyton test and a flow through microcosm system. Clear concentration-dependent effects on bacterial respiration rates were observed on the periphytic bacteria after exposure to the two antibiotics, ciprofloxacin and sulfamethoxazole. Triclosan never inhibited the bacterial part of the periphyton communities despite its use as an antimicrobial agent.
Algae were on the other hand insensitive to the two antibiotics and no inhibition was observed for periphytic algae exposed to ciprofloxacin or sulfamethoxazole. Sulfamethoxazole did instead stimulate total pigment content already at the lowest test concentrations of 5 nmol/L. Triclosan did in contrast affect periphytic algae in a concentration-dependent fashion in all experiments. The triclosan experiments performed with the SWIFT periphyton test system consistently resulted in inhibition of algal pigment content while a significant increase of total and individual pigment content was seen in the flow-through microcosm experiment with triclosan. This increase was probably due to a shift in species composition, a so called toxicant induced succession, producing a community composed of species with higher triclosan tolerance.
A significantly increased community tolerance (PICT) was indeed observed for communities pre-exposed to triclosan concentrations of 100 nmol/L in the microcosm system. PICT was measured and quantified using acute inhibition of photosynthesis as well as chronic inhibition of algal pigment content (in the SWIFT periphyton test). A tenfold increase in tolerance, compared to the unexposed control communities, was observed with both methods. The chronic SWIFT test, however, detected PICT at lower exposure levels than the acute test of photosynthesis inhibition. The results for the SWIFT test thus indicate that chronic methods can be used to assess PICT.
I
List of publications The thesis is built upon the work presented in these four papers. The papers will be referred to by their roman numerals.
I. Johansson C.H., Janmar L., Backhaus T. (2014) Toxicity of ciprofloxacin and sulfamethoxazole to marine periphytic algae and bacteria. Marine pollution bulletin, vol. 84, 208-212.
II. Johansson C.H., Janmar L., Backhaus T. (2014) Inhibition and stimulation on marine biofilms due to exposure of triclosan. Accepted for publication in Aquatic Toxicology.
III. Eriksson K.M., Johansson C.H., Fihlman, V., Grehn A., Sanli K., Andersson M.X., Blanck H., Arrhenius Å., Sircar T., Backhaus T. (2014) Long-term effects of the antibacterial agent triclosan on marine periphyton communities. Submitted to Environmental toxicology and chemistry.
IV. Johansson C.H., Eriksson K.M., Andersson M.X., Fihlman V.,
Arrhenius Å., Blanck H., Svensson M., Backhaus T. (2014) Sensitivity of marine biofilm communities after chronic pre-exposure to triclosan: Pollution-Induced Community Tolerance (PICT) and co-tolerance to ciprofloxacin and sulfamethoxazole. Manuscript.
II
Table of Contents Abstract ..................................................................................................................... I
List of publications .................................................................................................. II
Abbreviations ........................................................................................................... V
Pharmaceuticals and personal care products .............................................................1
Test compounds ........................................................................................................2
Ciprofloxacin ........................................................................................................2
Sulfamethoxazole .................................................................................................3
Triclosan ...............................................................................................................3
Routes into the environment .....................................................................................4
Occurrence in the environment .................................................................................6
Ecotoxicity ..............................................................................................................10
Community ecotoxicology ......................................................................................13
Toxicant induced succession ..............................................................................14
Pollution-Induced Community Tolerance...........................................................15
Tolerance and Co-tolerance ................................................................................17
Aims and approaches ..............................................................................................18
Methodological considerations ...............................................................................19
Periphyton ...........................................................................................................19
Field sampling of periphyton ..............................................................................20
SWIFT periphyton test........................................................................................20
Flow-through microcosms ..................................................................................21
Biolog Ecoplates .................................................................................................23
Pigment profiles ..................................................................................................24
Multivariate analyses ..........................................................................................24
Manhattan (City block) ...................................................................................25
Bray Curtis ......................................................................................................25
Non-metric Multi-Dimensional Scaling .........................................................25
III

PICT detection ....................................................................................................26
PAM fluorometry ................................................................................................26
Significant findings .................................................................................................29
Chronic toxicity towards bacteria .......................................................................34
Relative carbon source utilization ...................................................................37
Multivariate analyses ......................................................................................39
Triclosan-induced tolerance and co-tolerance to ciprofloxacin and sulfamethoxazole ............................................................................................40
Chronic toxicity towards algae ...........................................................................41
PICT ....................................................................................................................46
Acute versus chronic tests for quantifying PICT ....................................................46
Are marine waters at risk from pollution with antibiotics and antimicrobials? ......49
Summary and Conclusions .....................................................................................51
Suggestions for future work ....................................................................................52
Populärvetenskaplig sammanfattning .....................................................................53
Acknowledgements .................................................................................................56
References ...............................................................................................................58
Appendix 1 ..............................................................................................................68
Appendix 2 ..............................................................................................................86
IV

Abbreviations STP – Sewage Treatment Plant
NOEC – No Observed Effect Concentration
LOEC – Lowest Observed Effect Concentration
ECX – Effect concentration, e.g. EC50 is causing 50% effect
TIS – Toxicant Induced Succession
PICT – Pollution-Induced Community Tolerance
PEC – Predicted Environmental Concentration
PNEC – Predicted No Effect Concentration
V

Pharmaceuticals and personal care products Pharmaceuticals is a diverse group of compounds used in human and veterinary medicine to prevent or cure illnesses (Kümmerer, 2009). Personal care products are, in contrast, applied in various types of product categories as disinfectants, soaps, toothpastes and preservatives to inhibit bacterial growth (Brausch & Rand, 2011; Boxall et al., 2012). Both pharmaceuticals and personal care products include substances with antimicrobial properties and I will, in this thesis, use the term antibiotics for those being used as pharmaceutical compounds, usually within a host organism (animal or human), and antimicrobial agents for those that are used in personal care products. Both antibiotics and antimicrobial agents have highly diverse chemical and structural properties but have in common that they are used to kill or prevent growth of bacteria. They are used extensively in various settings, ranging from direct application of antibiotics into the waters in aquacultures to a more controlled in-patient use. Both groups are produced in high volumes. The global annual antibiotic consumption was estimated to be between 100 000 and 200 000 ton in 2002 (Wise, 2002) and the total sales volumes in Sweden for 2012 were 64.9 and 11.6 ton for human and veterinary medicine, respectively (SWEDRES-SVARM, 2012). Hence, only a fragmented picture exists on how much of these compounds that are actually produced, used and released into the environment. Similar data have, to the best of my knowledge, not been collected for antimicrobial agents in general but do instead exist for some individual compounds. The annual usage volumes of the antimicrobial agent triclosan have for example been estimated to exceed 300 ton in USA (Halden & Paull, 2005) and were estimated to reach 450 ton in Europe in 2006 (SCCS, 2010). Antibiotics and antimicrobial compounds occur in the aquatic environment- an issue that will be discussed later in this thesis - as a direct consequence of their usage patterns. There is thus a need for ecotoxicological investigations, in particular because our knowledge on the effects of antibiotics as well as antimicrobial agents on environmental bacteria is very limited. This thesis therefore aims to evaluate and fill gaps in the current ecotoxicological knowledge on how antibiotics and antimicrobial agents affect marine microorganisms and their complex interactions in naturally established communities. Three widely used and commonly detected compounds were chosen for the studies, the two antibiotics ciprofloxacin and sulfamethoxazole and the antimicrobial agent triclosan, and they will now be introduced in more detail.
1
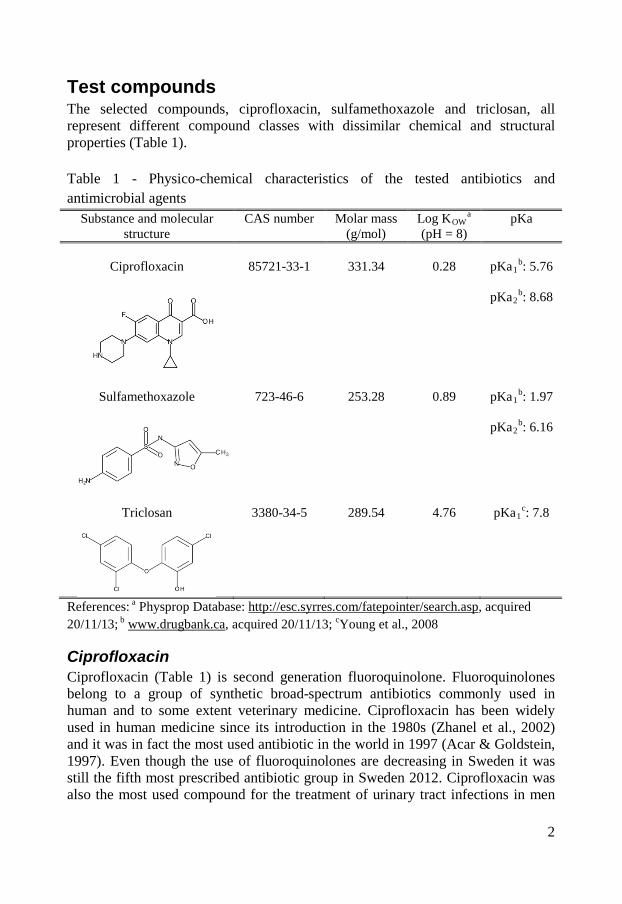
Test compounds The selected compounds, ciprofloxacin, sulfamethoxazole and triclosan, all represent different compound classes with dissimilar chemical and structural properties (Table 1). Table 1 - Physico-chemical characteristics of the tested antibiotics and antimicrobial agents
Substance and molecular structure
CAS number Molar mass (g/mol)
Log KOWa
(pH = 8) pKa
Ciprofloxacin
85721-33-1
331.34
0.28
pKa1
b: 5.76
pKa2b: 8.68
Sulfamethoxazole
723-46-6
253.28
0.89
pKa1
b: 1.97
pKa2b: 6.16
Triclosan
3380-34-5
289.54
4.76
pKa1
c: 7.8
References: a Physprop Database: http://esc.syrres.com/fatepointer/search.asp, acquired 20/11/13; b www.drugbank.ca, acquired 20/11/13; cYoung et al., 2008
Ciprofloxacin Ciprofloxacin (Table 1) is second generation fluoroquinolone. Fluoroquinolones belong to a group of synthetic broad-spectrum antibiotics commonly used in human and to some extent veterinary medicine. Ciprofloxacin has been widely used in human medicine since its introduction in the 1980s (Zhanel et al., 2002) and it was in fact the most used antibiotic in the world in 1997 (Acar & Goldstein, 1997). Even though the use of fluoroquinolones are decreasing in Sweden it was still the fifth most prescribed antibiotic group in Sweden 2012. Ciprofloxacin was also the most used compound for the treatment of urinary tract infections in men
2

the same year (SWEDRES-SVARM, 2012). It is effective against gram-negative bacteria as Escherichia coli, Pseudomonas aeruginosa, Salmonella spp., Shigella spp. and Haemophilus spp. but also toward some gram-positive bacteria such as Staphylococcus aureus (Davis et al., 1996; Van Bambeke et al., 2005). Ciprofloxacin inhibits the enzymes DNA gyrase and topoisomerase IV which consequently stops the unwinding of supercoiled DNA strands during replication and transcription (Zhanel et al., 2002). Hence, the compound inhibits DNA repair and bacterial growth which leads to bacteriostasis and ultimately to cell death (Zhanel et al., 2002).
Sulfamethoxazole Sulfamethoxazole (Table 1) belongs to the sulfonamide group of antibiotics. This was the first synthetic antibiotic group to be used as a pharmaceutical and these antibiotics have been used in human and veterinary medicine since the 1940s. Sulfamethoxazole, mainly used in human medicine, was chosen to be the representative of this group due to its widespread use and detection frequency in the aquatic environment. It is effective against both gram-positive and gram-negative bacteria and inhibits growth by a competitive binding to dihydropteroate synthetase which stops the conversion of para-aminobenzoate (PABA) to dihydropteroate, a precursor to tetrahydrofolic acid, which is essential for the synthesis of nucleic acids. An additional mechanism of action is that sulfonamides block cross-membrane transport of glutamic acids which also is an essential component for synthesizing folic acid (Baran et al., 2011).
Triclosan The broad-spectrum antimicrobial agent triclosan (Table 1) has been used for more than 40 years in various products, e.g. antiseptics, disinfectants, cosmetics and toys (SCCS, 2010). As many as 2 483 triclosan containing products were listed on Amazon.com (http://www.amazon.com/s/ref=nb_sb_noss?url=search-alias%3Daps &field-keywords=triclosan) in September 2014, which shows how commonly used the substance is. Triclosan is classified as “very toxic to aquatic organisms” and “may cause long-term adverse effects to the environment” by the European Commission. The International Chemical Secretariat (ChemSec), a non-governmental organization, has also listed triclosan on their SIN (Substitute It Now) list, which means that it has been identified as a chemical of very high concern based on criteria within the EU chemical regulation REACH. It is currently under review by the FDA in the US and it has been banned in products for hand and body cleansing in the state of Minnesota, US. Triclosan affects both gram-negative and gram-positive bacteria and several mechanisms of action have been suggested for its activity towards bacteria (Bedoux et al., 2012). It has been shown to bind to the active site of the enoyl-acyl carrier protein reductase (ENR), encoded by the fabI gene, in both bacteria and the
3

apicomplexan parasites Plasmodium falciparum and Toxoplasma gondii. This binding leads to inhibition of fatty acid synthesis (Levy et al., 1999; McMurryet al., 1998; McLeod et al., 2001). It has additionally been shown that triclosan destabilizes membranes (Lygre et al., 2003; Villalaín et al., 2001) and there have been observations indicating that oxidative phosphorylation could constitute a mode of action in algae (Franz et al., 2008) similar to what previously has been described for rat liver mitochondria (Newton et al., 2005).
Routes into the environment Antibiotics and antimicrobial agents have been detected in all types of waters, ranging from heavily contaminated sewage waters to drinking waters (Bedoux et al., 2012; Kümmerer, 2009; Santos et al., 2010). The main routes for antibiotics and antimicrobial agents to enter the environment were summarized by Boxall (2004) in his overview on pharmaceuticals and personal care products. In figure 1 the main emission routes for antibiotics and antimicrobial agents is shown.
Antibiotics administered to humans and animals are metabolized, the remaining parent compound and its metabolites are then excreted after passing through the body. There are compound dependent differences in how much of the parent compound that remains after excretion. The two antibiotics amoxicillin and
Figure 1 - Overview of the main entry routes for antibiotics and antimicrobial agents into the aquatic environment.
4

tetracycline are examples where only minor metabolisation occurs in the host organism and up to 90% of the parent compound is excreted after administration (Hirsch et al., 1999). In the case of fluoroquinolones, there is a broad spectrum, from 6% (trovafloxacin) to 83% (levofloxacin), of the parent compound being excreted after human use (Zhanel et al., 2002). Studies have further shown that 34% of ciprofloxacin (Zhanel et al., 2002) and approximately 15% of sulfamethoxazole (Hirsch et al., 1999) were excreted from humans unchanged. This means that after antibiotic use there will be a large portion of the antimicrobially active compound excreted, which threatens to affect microorganisms in the environment. Ciprofloxacin and sulfamethoxazole are mainly used in human medicine. Hence the main portion will enter sewage treatment plants (STPs) after excretion. Antimicrobial agents such as triclosan are, in contrast, applied directly to a surface or skin and are thus not subjected to metabolism within an organism (Brausch & Rand, 2011) and a large portion of the applied product therefore enters the STPs directly after use (Boxall et al., 2012). A portion of the antibiotics and antimicrobial agents received at a STP is removed before the effluent is emitted into the aquatic environment. Castiglioni et al. (2006) showed that the removal rate depends on factors such as chemical properties of the compound, what type of removal processes are used in the STP and the water temperature. Ciprofloxacin had an almost constant removal rate of 60% in winter and 63% in summer, which can be compared to a more complex pattern for sulfamethoxazole: a median of 17% of the incoming sulfamethoxazole was removed during the winter while 71% was removed in the summer indicating large seasonal differences in the effluent waters (Castiglioni et al., 2006). Additional routes for antibiotics entering the aquatic environment include inappropriate disposal directly into the environment, field runoff from soils that have been fertilized with antibiotic contaminated manure or sewage sludge (Boxall et al., 2012), and direct application of antibiotics in the aquatic environment via feed used in aquacultures (Cabello et al., 2013). As approximately 80% of the applied antibiotics used in aquaculture enter the aquatic environment intact this use leads to locally high environmental concentrations. There is only a fragmented picture of the antibiotic use in aquacultures globally but quinolones, mainly oxolonic acid and flumequin, are approved for use in aquacultures in Chile and Norway while sulfonamides are approved for used in aquaculture North America (Cabello et al., 2013). A comparison between the amounts of antibiotics used to produce a metric ton of salmon in Norway and Chile, the two largest salmon producers in the world, show that 1 750 times more antibiotics were used in Chile compared to Norway (Cabello et al., 2013). These large differences will further lead to differences in antibiotic concentrations in the surface waters.
5
Antibiotics have further been shown to be emitted from pharmaceutical production plants directly into surface waters in India. This insufficient waste water treatment therefore leads to high environmental concentrations (Fick et al., 2009). Occurrence in the environment Antibiotics and personal care products enter the aquatic environment via the routes described above and are commonly detected in waste waters, surface waters, ground waters and, to some extent, in marine waters (Brausch & Rand, 2011; Kümmerer, 2009). Concentrations of up to 10, 23 and 19 nmol/L have been measured in municipal STP effluents for ciprofloxacin, sulfamethoxazole and triclosan, respectively (Batt et al., 2006; Bueno et al., 2007; Kumar et al., 2010). Most studies report concentrations in the 10-3 – 10 nmol/L range even though higher antibiotic concentrations occur in the proximity of pharmaceutical production plants or aquaculture facilities in Asia figure 2 A-C. The reported ciprofloxacin concentrations in surface waters range globally between 0.0018 nmol/L in the Atibaia watershed (São Paulo State, Brazil) (Locatelli et al., 2011) to the extreme values of 19 617 nmol/L in Indian lakes near pharmaceutical production plants (Fick et al., 2009). The corresponding range in Europe is between 0.04 nmol/L in the Italian river Po and 0.407 nmol/L in the Charmoise River, downstream of the STP Fontenay-Les-Briis (Dinh et al., 2011; Zuccato et al., 2010). In North American surface waters measured concentrations vary between 0.091 nmol/L and 1.09 nmol/L (Batt et al., 2006; Focazio et al., 2008; Kolpin et al., 2002; Kolpin et al., 2004). The latter concentration was detected downstream a STP. In Asia there are rather large geographical variations in ciprofloxacin concentrations. Measured concentrations between 0.20 nmol/L in the seawater of Laizhou Bay to the highly contaminated waters in India with concentrations of 19 617 nmol/L (Fick et al., 2009; Zhang et al., 2012) have been detected (figure 2 A). Sulfamethoxazole has been measured in various surface waters globally with a maximum concentration as high as 79 nmol/L in the Nairobi river basin. The measured surface water concentrations in Europe span between 0.00039 nmol/L, in the Henares-jarama-tajo river system in the province of Madrid in Spain, and 5.67 nmol/L in the Charmoise River downstream of the STP Fontenay-Les-Briis in Paris, France (Dinh et al., 2011; Fernández et al., 2010). In North America the corresponding concentrations range between 0.0055 nmol/L in a river in Nebraska to 3.01 nmol/L in a river downstream a STP (Bartelt-Hunt et al., 2009; Glassmeyer et al., 2005). In Asia the range is broader, similar to ciprofloxacin. A concentration of 0.0024 nmol/L was reported in marine waters in Hong Kong while concentrations of up to 9 436 nmol/L have been reported in pond water at shrimp farms (figure 2 B).
6

The occurrence of triclosan in the environment is more uniform and no extreme concentrations have been measured in Asia, which might indicate a more similar use pattern globally. Measured triclosan concentrations in European surface waters range between 0.0048 nmol/L in the lake Greifensee (Switzerland) to 0.98 nmol/L in the Ebro river (Spain) (Kantiani et al., 2008; Lindström et al., 2002) while the corresponding values for North America range between 0.012 nmol/L in Ogeechee River (Georgia, USA) and 7.94 nmol/L in South Platte River (Colorado, USA) (Barnes et al., 2002; Kumar et al., 2010). The measured concentrations in Asia range between 0.0021 nmol/L upstream the Liuxi River (China) and 3.53 nmol/L in the Pearl river (Guangzhou, China) (Peng et al., 2008; Zhao et al., 2009) (figure 2 C). Only a limited number of studies have been published on the occurrence of ciprofloxacin, sulfamethoxazole and triclosan in marine environments and the few available studies mainly focus on Asian sea waters. This can be partly due to low occurrence but is more likely caused by a general lack of monitoring data for the marine environment. Still, there are a few studies showing the occurrence of ciprofloxacin, sulfamethoxazole and triclosan in marine environments. Ciprofloxacin was detected in Laizhou Bay in China at concentrations up to 0.20 nmol/L and in sediments at concentrations up to 0.0073 nmol/g (He et al., 2012; Zhang et al., 2012). Sulfamethoxazole has been reported to occur in the Chinese marine environment at concentrations reaching 0.32 nmol/L (Zhang et al., 2012; Zheng et al., 2012). Slightly more data are available on triclosan levels in the marine environment and measured concentrations reach up to 0.024, 0.047 and 0.1 nmol/L for European, North American and Asian waters respectively (Bedoux et al., 2012).
7
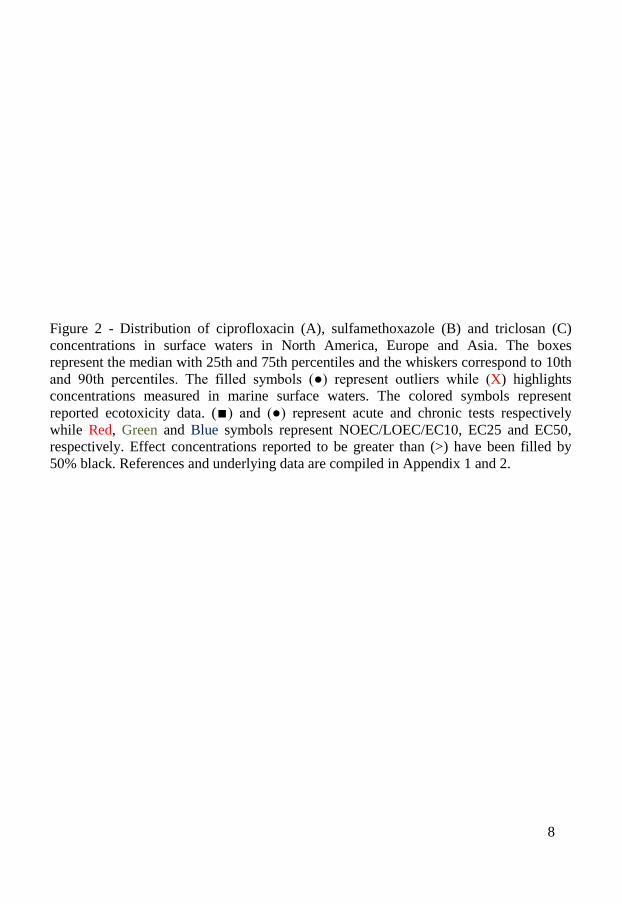
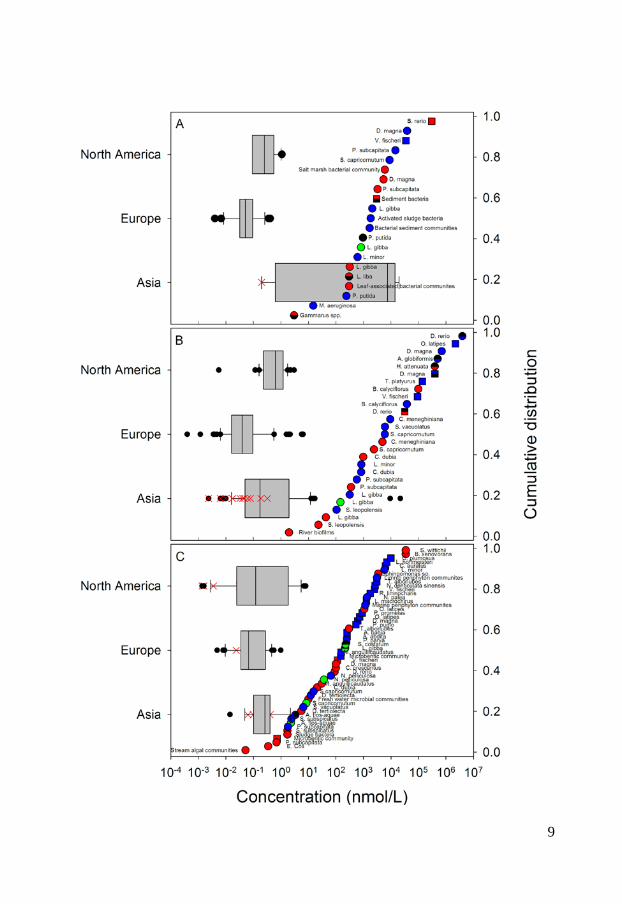
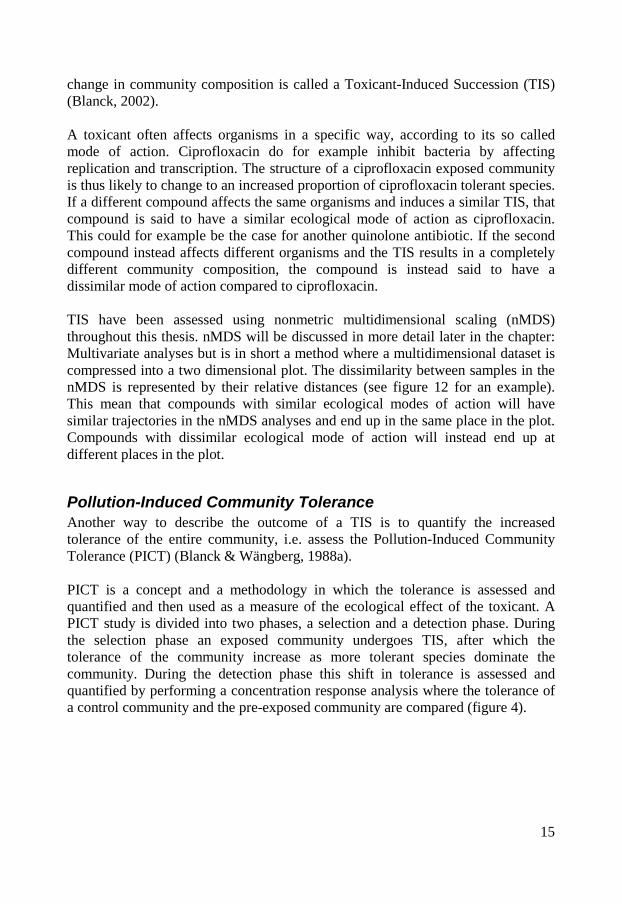
Figure 2 - Distribution of ciprofloxacin (A), sulfamethoxazole (B) and triclosan (C) concentrations in surface waters in North America, Europe and Asia. The boxes represent the median with 25th and 75th percentiles and the whiskers correspond to 10th and 90th percentiles. The filled symbols (●) represent outliers while (X) highlights concentrations measured in marine surface waters. The colored symbols represent reported ecotoxicity data. (∎) and (●) represent acute and chronic tests respectively while Red, Green and Blue symbols represent NOEC/LOEC/EC10, EC25 and EC50, respectively. Effect concentrations reported to be greater than (>) have been filled by 50% black. References and underlying data are compiled in Appendix 1 and 2.
8
9

Ecotoxicity Ciprofloxacin, sulfamethoxazole and triclosan are all used for their optimized antimicrobial properties to prevent growth of microbes. Therefore, it is further called for investigations of their ecotoxicity to microbial communities. To visualize the current knowledge, cumulative distributions of their reported ecotoxicity were therefore plotted together with the occurrence data in figure 2 A-C. The available ecotoxicological data for each substance were grouped into acute and chronic tests and further divided into NOEC/LOEC/EC10 combined, EC25, EC50 and EC100 values to represent different ecotoxicological thresholds. NOEC (No Observed Effect Concentration) is the highest tested concentration whose effect is not statistically different from the controls while LOEC is the lowest tested concentration where a statistically significant response is observed. An EC10 is the concentration at which 10% of the exposed organisms are affected. The lowest reported value for a species was used for each endpoint/species. In those cases where a value was reported as “higher than (>)” the reported value have been used in figure 2 but marked with a symbol half-filled in black. Ciprofloxacin is, as visualized in figure 2 A, most toxic toward prokaryotes with chronic EC50 values of 15 – 51 nmol/L for the cyanobacteria Microsystis aeruginosa (Halling-Sørensen et al., 2000; Robinson et al., 2005) followed by 241 nmol/L for the bacteria Pseudomonas putida (Kümmerer et al., 2000) and 301.8 nmol/L for detrivorous stream microbial communities (Maul et al., 2006). It is further evident from figure 2 A that all effect concentrations reported in the scientific literature are above concentrations that have been measured in the aquatic environments in Europe and North America while almost all available ecotoxicity data falls within the measured concentration range in Asia. These large regional variances affect, as discussed in paper I, the possibility to make a general risk assessment to the aquatic environment. Previously performed studies have therefore come to different conclusions whether or not ciprofloxacin may pose a risk to aquatic organisms. In a study from Switzerland, Golet et al., (2002) concluded that there is a low likelihood for adverse effects on the STP degrading process and in the Glatt Valley watershed (Golet et al., 2002). A recent study also came to a similar conclusion concerning Italian STP effluents and their receiving water bodies (Al Aukidy et al., 2012). Halling-Sørensen et al. (2000) did in contrast calculate an environmental risk to aquatic organisms in Europe using a Predicted No Effect Concentration (PNEC) (of 0.15 nmol/L, based on toxicity to Microsystis aeruginosa. Zhang et al. (2012) later used a different assessment factor on the same cyanobacterial data and calculated an even lower PNEC of 0.015 nmol/L and consequently a risk to aquatic organisms in Asia.
10
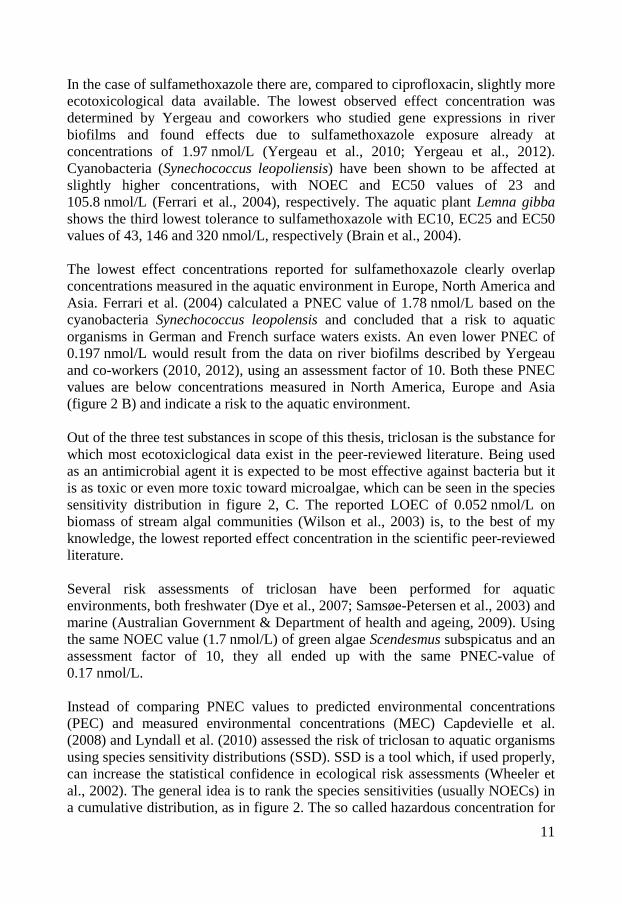
In the case of sulfamethoxazole there are, compared to ciprofloxacin, slightly more ecotoxicological data available. The lowest observed effect concentration was determined by Yergeau and coworkers who studied gene expressions in river biofilms and found effects due to sulfamethoxazole exposure already at concentrations of 1.97 nmol/L (Yergeau et al., 2010; Yergeau et al., 2012). Cyanobacteria (Synechococcus leopoliensis) have been shown to be affected at slightly higher concentrations, with NOEC and EC50 values of 23 and 105.8 nmol/L (Ferrari et al., 2004), respectively. The aquatic plant Lemna gibba shows the third lowest tolerance to sulfamethoxazole with EC10, EC25 and EC50 values of 43, 146 and 320 nmol/L, respectively (Brain et al., 2004). The lowest effect concentrations reported for sulfamethoxazole clearly overlap concentrations measured in the aquatic environment in Europe, North America and Asia. Ferrari et al. (2004) calculated a PNEC value of 1.78 nmol/L based on the cyanobacteria Synechococcus leopolensis and concluded that a risk to aquatic organisms in German and French surface waters exists. An even lower PNEC of 0.197 nmol/L would result from the data on river biofilms described by Yergeau and co-workers (2010, 2012), using an assessment factor of 10. Both these PNEC values are below concentrations measured in North America, Europe and Asia (figure 2 B) and indicate a risk to the aquatic environment. Out of the three test substances in scope of this thesis, triclosan is the substance for which most ecotoxiclogical data exist in the peer-reviewed literature. Being used as an antimicrobial agent it is expected to be most effective against bacteria but it is as toxic or even more toxic toward microalgae, which can be seen in the species sensitivity distribution in figure 2, C. The reported LOEC of 0.052 nmol/L on biomass of stream algal communities (Wilson et al., 2003) is, to the best of my knowledge, the lowest reported effect concentration in the scientific peer-reviewed literature. Several risk assessments of triclosan have been performed for aquatic environments, both freshwater (Dye et al., 2007; Samsøe-Petersen et al., 2003) and marine (Australian Government & Department of health and ageing, 2009). Using the same NOEC value (1.7 nmol/L) of green algae Scendesmus subspicatus and an assessment factor of 10, they all ended up with the same PNEC-value of 0.17 nmol/L. Instead of comparing PNEC values to predicted environmental concentrations (PEC) and measured environmental concentrations (MEC) Capdevielle et al. (2008) and Lyndall et al. (2010) assessed the risk of triclosan to aquatic organisms using species sensitivity distributions (SSD). SSD is a tool which, if used properly, can increase the statistical confidence in ecological risk assessments (Wheeler et al., 2002). The general idea is to rank the species sensitivities (usually NOECs) in a cumulative distribution, as in figure 2. The so called hazardous concentration for
11

5% of the species (HC5), i.e. the concentration where 5% of the species are affected, is then calculated and used for the risk assessment. This was done by Capdevielle et al. (2008) who estimated a PNEC of 5.36 nmol/L and Lyndall et al. (2010) that calculated a HC5 value of 1.73 nmol/L. The relatively high PNEC value of Capdevielle et al. (2008) can be questioned (paper II and III) as these authors did not apply an assessment factor to the HC5 value and due the misfit between the log-logistic model that was used for describing the SSD and the toxicity data. Lyndall et al. (2010) ended up with a slightly lower PNEC value which was concluded to protect 95% of the aquatic species. However, as microalgae are among the most sensitive organisms, this PNEC might not be low enough to safeguard ecologically important processes, such as photosynthesis, at sites with high triclosan concentrations. To summarize, the ecotoxicological data on the three compounds suggest that they are most toxic toward microorganisms and that there is a risk for organisms in surface waters in close proximity to point sources. But as the occurrence data varies several orders of magnitude, no general risk assessment can be made. Instead case by case evaluations have to be made. In addition it is interesting to note that – even though these three substances have been thoroughly studied – a reliable species sensitivity distribution can only be calculated for triclosan. Wheeler and coworkers showed that at least 10 to 15 comparable data points are needed to draw statistically sound conclusions from SSDs (Wheeler et al., 2002), a requirement that is fulfilled neither for ciprofloxacin nor for sulfamethoxazole. One contributing factor to this dilemma is that most studies have been made on only a few species (the green algae Pseudokirchneriella subcapitata, duckweed Lemna gibba, the crustacean Daphnia magna represent the best examples of this repetition). This means for example that local species, which the risk assessment actually aims to protect, are not included in the risk assessment process. Instead, standard test organisms, which are easy to handle under laboratory conditions, are used even though the wealth of such data does not improve the SSDs to be used in the risk assessment. The time aspect of an exposure is also commonly ignored. Surprisingly many studies have been performed as acute tests which only span over a time period of minutes to hours. As ciprofloxacin, sulfamethoxazole and triclosan have been shown to affect growth-related processes, e.g. replication and lipid synthesis, their toxicity needs to be assessed over longer time scales. Otherwise the effect from their specific mechanisms of action will not be detected and only toxicity from narcotic, unspecific pathways will be detected. Hence, there is a great risk of underestimating their ecotoxicity from acute tests, which also can be seen in figure 2 A-C where the chronic studies in general indicate higher ecotoxicity compared to acute studies.
12

Finally, a majority of the investigations has been performed using single species assays. Single species assays are good tools that facilitate reproducible toxicity testing with high precision and throughput, but they are blind to interactions between species. Such interactions can only be included in toxicity estimates when ecological communities composed of many different species are used. In order to provide more ecologically relevant data on the possible environmental hazard of sulfamethoxazole, ciprofloxacin and triclosan, the investigations that are described in this thesis are based on tests with natural microbial communities. In the following I will now introduce the basic ideas and concepts in community ecotoxicology as a background for the following description of the experimental strategy in this thesis.
Community ecotoxicology Community ecotoxicology has been defined as the study of the effects of contaminants on patterns of species abundance, diversity, community composition, and species interactions (Clements & Rohr, 2009). By investigating effects on more than one species at the time it is possible to assess effects as well as interactions within and between trophic levels in the community. Different species have varying tolerance to a toxicant and some organisms will thus be affected more than others. Another toxicant will likely exert a completely different effect and affect other organisms instead. Community testing thereby increases the likelihood, compared to single species assays, of exposing a species sensitive to the toxicant. The best way to assess effects on a community would therefore be to evaluate which organisms are present and how many they are. This is very laborious and effects are therefore commonly quantified in other ways instead. Effects can be measured on the community structure or the performed functions. Structural measures can in addition to species composition for example also include pigment content in the case of microalgae (see: Pigment profiles) which reflects the algal biodiversity in the community. Functions are in contrast something performed by the organisms in a community and could for example be photosynthesis or carbon source utilization. The fact that several organisms can perform functions as photosynthesis is called functional redundancy. This safeguards important processes in a community in the event that sensitive organisms are eliminated. The effects from a toxicant on a community can be top-down or bottom-up regulated (figure 3). An herbicide, lethal to photosynthetic organisms, will affect the resource availability and will thereby indirectly affect grazers feeding on the dying plants i.e. a bottom-up regulation of the feeding organisms. Similarly, an insecticide decreasing the abundance of grazers might affect the primary producers positively by reducing the grazing pressure, a top-down effect. A comparison
13

between a toxic chemical and a predator is a helpful analogy when trying to understand and visualize the effects that a toxic compound might exert on a community but the analogy is not perfect. In a predator-prey relationship the predator will be down-regulated with a decrease in available prey but this is not the case for toxic chemicals, even though the amount of a pesticide applied to control a specific pest is usually decreased after the pest is under control (Rohr et al., 2006). By safeguarding community structure in the environment one ensures that ecological processes such as primary production, energy flows and nutrient cycling are preserved. Species-rich communities are commonly more stable and recover faster from disturbance than those with lower biological diversity (Clements & Rohr, 2009). Assessing the hazard of ciprofloxacin, sulfamethoxazole and triclosan for marine organisms was the main aim for this thesis. As micro-organisms are likely to be the most sensitive organisms to these compounds (figure 2), all ecotoxicity testing in this thesis were performed on microorganism communities called periphyton, which will be introduced in the chapter “methodological considerations” below. In short, periphyton is mainly composed of bacteria and microalgae and grows on any submerged surface in the aquatic environment (van Dam et al., 2002) The fact that periphyton communities are stationary, in contrast to for example plankton communities, makes them suitable for ecotoxicological testing as they will be exposed to the toxicant as long as its present or until the biofilm releases from the surface it is attached to. Periphyton communities further fulfill important ecological processes such as primary production and nutrient cycling and are thus ecologically relevant test entities for hazard assessments.
Toxicant induced succession The organisms living together in a community are able to tolerate toxic stress to varying degrees. The differences in chemical tolerance that can be seen in figure 2 C illustrate this differential tolerance, although this data originates from single species tests and not from species within a community. In a community, composed of many species, it is likely that the most sensitive organisms will be eliminated, which in turn will favor more tolerant ones due to the lowered competition. The selection pressure from a toxicant will over time result in a community which becomes increasingly different from an unexposed control community. This
Resource
Predator
Consumer
Figure 3 – Species and chemical interactions. Full and dashed arrows indicate direct and indirect effects respectively (Rohr et al., 2006)
Insecticide
Herbicide
14
change in community composition is called a Toxicant-Induced Succession (TIS) (Blanck, 2002). A toxicant often affects organisms in a specific way, according to its so called mode of action. Ciprofloxacin do for example inhibit bacteria by affecting replication and transcription. The structure of a ciprofloxacin exposed community is thus likely to change to an increased proportion of ciprofloxacin tolerant species. If a different compound affects the same organisms and induces a similar TIS, that compound is said to have a similar ecological mode of action as ciprofloxacin. This could for example be the case for another quinolone antibiotic. If the second compound instead affects different organisms and the TIS results in a completely different community composition, the compound is instead said to have a dissimilar mode of action compared to ciprofloxacin. TIS have been assessed using nonmetric multidimensional scaling (nMDS) throughout this thesis. nMDS will be discussed in more detail later in the chapter: Multivariate analyses but is in short a method where a multidimensional dataset is compressed into a two dimensional plot. The dissimilarity between samples in the nMDS is represented by their relative distances (see figure 12 for an example). This mean that compounds with similar ecological modes of action will have similar trajectories in the nMDS analyses and end up in the same place in the plot. Compounds with dissimilar ecological mode of action will instead end up at different places in the plot.
Pollution-Induced Community Tolerance Another way to describe the outcome of a TIS is to quantify the increased tolerance of the entire community, i.e. assess the Pollution-Induced Community Tolerance (PICT) (Blanck & Wängberg, 1988a). PICT is a concept and a methodology in which the tolerance is assessed and quantified and then used as a measure of the ecological effect of the toxicant. A PICT study is divided into two phases, a selection and a detection phase. During the selection phase an exposed community undergoes TIS, after which the tolerance of the community increase as more tolerant species dominate the community. During the detection phase this shift in tolerance is assessed and quantified by performing a concentration response analysis where the tolerance of a control community and the pre-exposed community are compared (figure 4).
15

PICT can be used for diagnostic purposes in field studies. By sampling communities in a gradient of contamination, testing their tolerance levels and comparing them to the tolerance level of a community at a pristine, uncontaminated site, it is possible to infer whether or not the toxicant in question has exerted a selection pressure in that environment. Importantly, in this context detection of PICT represent an ecologically relevant effect caused by this specific toxicant or a toxicant that is tolerated using the same tolerance mechanism in situ. The detection phase in a PICT study should be short enough to only detect changes in tolerance that already occurred during the selection phase (Blanck, 2002). (Blanck, 2002). If the detection is performed over longer time frames there is a risk that there will be additional selection pressures during the detection phase, and that the PICT signal is exaggerated by further growth of tolerant species. Even though it seems reasonable not to induce changes to the community during the detection phase it is not a simple task (or even possible) to find acute toxicity tests suitable for all substances, which is exemplified by the three compounds in scope of this thesis. Moreover, several authors have successfully used detection tests with longer exposure times (Müller, Rasmussen, & Sorensen, 2001; Rutgers et al., 1998; Schmitt et al., 2006).
Figure 4 – Conceptual visualization of the PICT detection phase. The tolerance level is measured using acute toxicity testing of communities that have been exposed to different toxicant concentrations during the selection phase. An increase of tolerance is observed as a right-shift of the concentration-response relationships. A control community (A) has a lower tolerance compared to a community exposed to the toxicant in question during the selection phase (B).
16
I will use sulfamethoxazole to exemplify the problem of finding suitable acute test in more detail but the situation is similar for the other two substances in this thesis (and many more). Sulfamethoxazole exert its toxic action by binding to dihydropteroate synthetase, thereby stopping the formation of tetrahydrofolic acid which is needed for nucleic acid synthesis. But, there will be no detectable effects of the exposure as long as there are depots of tetrahydrofolic acid in the organisms. Hence, until the storage of tetrahydrofolic acid runs out no acute test can determine sulfamethoxazole toxicity, and therefore cannot be used to detect PICT. So, for sulfamethoxazole and other compounds for which no acute ecotoxicity tests are available, there is thus a need to assess changes in tolerance using chronic tests instead. A comparison between acute and chronic test methods to quantify PICT has thus been made later in this thesis (See: acute versus chronic tests for quantifying PICT).
Tolerance and Co-tolerance Organisms have, as discussed above, different sensitivities which leads to TIS when a community is exposed to a toxicant. The resulting PICT is either due to structural changes in the community (change in species composition) or physiological adaptations (Blanck, 2002). Physiological adaptations in the form of antibiotic resistance have been widely studied for human pathogens while there is still more to discover for other organism groups in the environment. Increased tolerance to a toxicant could be achieved by an increased formation of the extracellular polymeric matrix (EPS) that are excreted and in which the periphyton organisms are embedded. EPS serves as a barrier, decreasing the bioavailable portion of a toxicant, and genes coding for the production of EPS have in fact been shown to increase in Salmonella typhimurium after triclosan exposure (Tabak et al., 2007). Additional tolerance mechanisms include efflux pumps which actively export the toxicants from the cells, which also have been described in the case of triclosan by Tabak and co-workers (2007). Tolerance toward antibiotics and antimicrobial agents binding to specific targets can also be achieved by mutations in the binding site of the enzyme which results in a decreased affinity (Neu, 1993). Several of these tolerance mechanisms have the potential to affect the toxicity of more than one specific compound. EPS production is likely to hinder more than one substance and general efflux pumps could also export similar drugs. Tolerance to a compound that has not exerted a selection pressure on the community is called co-tolerance. This phenomenon most likely arise between chemicals with similar mechanisms of action as they are transported by the same carriers, are affecting the same enzymatic target, end up in the same compartments or have similar degradation routes (Blanck, 2002). There are ongoing discussion on the possibility for co-tolerance development between triclosan and antibiotics (SCENIHR, 2009) but there is currently no
17

consensus within the scientific community about this question. However, indications of a co-tolerance have been observed between triclosan and ciprofloxacin in previous studies (Tabak et al., 2009). Aims and approaches The overarching aim of this thesis was to assess the ecotoxicity of the two antibiotics ciprofloxacin and sulfamethoxazole and the personal care product triclosan on marine microorganisms. These compounds were selected since they inhibit microbial growth but still belong to different chemical classes and are thus assumed to have different ecological modes of action. As shown above, there is much to be gained by using natural communities for ecotoxicological assessments. Marine biofilm forming communities, so called periphyton, was thus used throughout this thesis. These communities are suitable for ecotoxicological testing of antimicrobial agents as they consist of a broad range of hetero- and autotrophic organisms, mainly microalgae and bacteria. In addition to being sensitive to the test substances, periphyton live in a closely confined space while competing for nutrients space and light, and changes in ecological fitness due to toxicant exposure are likely to have direct or indirect effects on the community structure. Several studies were thus performed on marine periphyton to describe TIS and PICT. In addition to the overarching aim, several specific objectives were further assessed.
1. Establish ecotoxicological thresholds for ciprofloxacin, sulfamethoxazole and triclosan by providing full concentration-response curves using marine periphyton communities (Paper I-III).
2. Compare the sensitivity of marine bacteria and microalgae to ciprofloxacin, sulfamethoxazole and triclosan (Paper I-IV).
3. Investigate whether exposure to ciprofloxacin, sulfamethoxazole or triclosan induce TIS (paper I, II, III).
4. Analyze whether exposure to triclosan leads to PICT, and, if so, at what concentration. (Paper III and IV)
5. Assess whether exposure to triclosan leads to co-tolerance towards ciprofloxacin or sulfamethoxazole (Paper IV)
6. Compare the classical acute methods to analyze PICT to chronic methods more suitable for compounds with chronic modes of action.
18

Methodological considerations
Periphyton All experiments within this thesis have been performed on so called periphyton communities. There are several definitions of the term periphyton but all references within this thesis refer to “entire complex of attached aquatic biota on submerged substrates, including associated non-attached organisms and detritus” as defined by (van Dam et al., 2002). That means that periphyton communities are made up of a broad range of different organisms, such as bacteria, fungi, protozoa, microalgae, benthic organisms and a range of invertebrates, living attached to surfaces submerged into water (Azim et al., 2005). The settling and development of periphyton communities have been shown to follow a general succession similar to the one observed in terrestrial ecosystems (Hoagland et al., 1982). The colonization is initiated by coating of the substratum by dissolved organic substances, such as amino acids and mucopolysaccharides. This is an abiotic process governed by electrostatic forces. Bacteria will then settle within hours after the substratum was immersed into the water. When the biofilm are a few days old, pinnate diatoms attach to the mucilage excreted by the bacteria. This is followed by species with short and long stalks as well as rosette formed diatoms. In the final phase, green and red algae with long filaments or long strands will start to grow, invertebrate larvae will attach and a complex community is formed (Azim & Asaeda, 2005; Hoagland et al., 1982). Periphyton communities fulfill important functions in the aquatic environment, for example primary production, nutrient cycling and simply serving as food for grazers such as fishes and various invertebrates. Primary production in aquatic environments is performed by periphyton communities to a large extent and the production exceeds that of phytoplankton in many cases. There are reports stating that up to 97% of the primary production in the shallow zone of oligotrophic lakes is accounted to periphyton (Azim et al., 2005). The heterotrophic portion of these biofilms perform important nutrient cycling and convert organic matter into inorganic nutrients which are taken up and used by the autotrophs performing primary production (Milstein, 2005). As periphyton are made up of many different organisms living attached to a surface in a clearly defined area while competing for space and nutrients, they are well suited for ecotoxicology testing and have thus been used in a number of studies over several years with varying aims and topics, e.g. Backhaus et al., 2011; Blanck & Wängberg, 1988a; Eriksson et al., 2009; Franz et al., 2008; Porsbring et al., 2007; Porsbring et al., 2009 just to mention a few.
19

Field sampling of periphyton Periphyton was sampled in the field for paper I and II while they were colonized and sampled from a flow-through microcosm in paper III and IV. In all cases, the periphyton settled on glass discs (1.5 cm2) mounted in polyethylene holders in a specialized sampling rack (figure 5). The discs used for paper I and II were submerged to a depth of approximately 1 meter into the Gullmar fjord (long 11.4, lat 58.23) on the Swedish west coast in April and June 2010. The glass substrata were left in the sea over a period of 8 days to let the indigenous microbiota settle. A thin biofilm were visible on the discs when the discs were brought back to the lab. As the abundance of different species varies over
the year, the use of natural communities have pros and cons. It gives a more realistic view of what would happen if a toxicant enters the environment than by assessing effects by only using single species cultures. The main drawback is that as the composition vary over the year it is impossible to repeat an experiment with exactly the same community (figure 13) with associated variations in sensitivity as a consequence (paper II).
SWIFT periphyton test The periphyton toxicity testing in paper I, II and IV was performed using the SWIFT periphyton test. This test was developed and described by Porsbring et al. (2007) as a simpler alternative, with higher throughput, than the more demanding microcosm methodology used in paper III. It still ensures a high ecological realism by the use of natural microorganism communities which undergo Toxicant Induced Succession (TIS) during exposure to chemical stressors. Still, as the SWIFT periphyton test employs GF/F filtration (pore size 0.7 µm) of the media it is a semi-closed system where renewal of bacterial organisms occurs but not that of algae. This decrease in immigration of new algal and meiofaunal/invertebrate species decrease the possible ways in which the TIS can be driven in comparison with the microcosm setup (Porsbring et al., 2007). The discs sampled from the Gullmar fjord were pooled and those with uneven or atypical appearance were discarded. The remaining discs were cleaned to remove any biofilm on the sides and bottom, enabling a similar area of starting material in all tests.
Figure 5 – Periphyton sampling devise
20

The biofilms were then incubated in glass vessels (figure 6) in a media composed of filtered sea water (GF/F, Whatman), elevated concentrations of the nutrients phosphate and nitrate and toxicants. The media was changed daily to ensure high enough toxicant and nutrient concentrations. After 72 or 96 hours the periphyton were sampled for measurements on bacteria (see: Biolog Ecoplates) and algae (see: Pigment profiles), respectively. The incubation was performed on shakers in climate chambers with a light-dark cycle and temperature set to mimic the ambient conditions in the sea at the time of sampling.
Flow-through microcosms The chronic exposure to triclosan in paper III was performed using a flow-through microcosm system (figure 7) situated at Sven Lovén Center for Marine Sciences at Kristineberg. The test system is similar to the one described by Blanck & Wängberg (1988b) and does in contrast to the SWIFT periphyton test enable continuous settling of new micro-biota over longer periods of toxicant exposure.
Figure 6 – Glass discs incubated in glass vessels during the SWIFT periphyton test. Photo: Mikael Johansson
21

Sea water was continuously pumped from the Gullmar fjord into the lab through a nylon mesh (1 mm mesh size) before being distributed into 24 different glass aquaria. The incoming water had an approximate flow rate of 220 mL/minute in each aquarium. Toxicant solutions, prepared in de-ionized water every third day, was pumped into the aquaria in parallel to the sea water creating a concentration range of triclosan (0 – 1,000 nmol/L) in the aquaria. The glass discs were mounted on polyethylene racks attached to the sides of the aquaria. Only organisms able to thrive in the aquaria during the toxicant exposure will settle and grow on the glass discs. There will thus be a toxicant dependent change in the communities as different organisms are likely to thrive in the aquaria with different exposure levels. As the microcosm system is a more stable environment than the sea it is important to compare the sensitivities between periphyton sampled from the two environments. Periphyton sampling racks (see: Field sampling of periphyton) were therefore placed approximately 7 meters from the water intake at the start of the experiment and sampled in parallel to the microcosms in the final sampling event.
Figure 7 – Aquaria microcosms used for paper III and IV. The glass discs are mounted on the long-sides of the aquaria. Photo: Mikael Johansson
22
Biolog Ecoplates Biolog EcoplatesTM (from now on only referred to as Ecoplates) was used in order to assess effects on the bacterial part of the periphyton communities throughout this thesis (papers I – IV). The Ecoplates are 96-well micro-titer plates pre-loaded with 31 different carbon-sources distributed one by one, in triplicates, over the plate. The wells are, in addition to the carbon sources, also pre-loaded with a tetrazolium dye that turns red upon oxidation, indicating metabolization of a carbon source. The basic principle of the method is that different bacteria can utilize different carbon sources. The utilization patterns of two communities with different bacterial composition are therefore likely to be different, and these patterns can thus be used to assess changes in the physiological profiles of these communities. Ecoplates can be analyzed as the overall rate of color development, the diversity and the relative utilization rate between wells (Garland, 2006). Although originally developed for soil ecotoxicology the method has previously been shown to work for testing effects on aquatic communities (Lawrence et al., 2009; Maul et al., 2006). The method is well suited to compare similarity between communities between different sites or, as in the scope of this thesis, between control and exposed treatments (Preston-Mafham et al., 2002). The carbon utilization was monitored, as absorbance at 595 nm and 700 nm, twice a day during the experiments (paper I-IV) over a time period of 96 hours. The resulting multivariate data set was interpreted in several ways. First the total color development was summarized and interpreted as total carbon source utilization per plate and time, the so called average well color development (AWC). Secondly, the time-integrated color development was calculated for of each carbon source and described as area under the curve (AUC) of a Weibull function. These AUC values were assessed one by one, as well as assessed together using multivariate methods (see: Multivariate analyses). There are three major confounding factors of the use of Ecoplates. The first is the long incubation time needed to perform the analysis (up to 96 hours in paper I-IV) which will induce a selection pressure on the bacterial communities (Garland, 2006). Two additional factors were exemplified in paper I. The lag-phase of color development for different carbon sources has different response times. This introduces a noise in the measurements. However, the noise is reduced as the color development becomes uniform with increased incubation time. The inhibition needed for a significant difference between controls and exposed communities were assessed and found to be decreasing with increased incubation times, i.e. the longer the incubation time, the stronger the statistical power. At the same time the carbon sources that are easily utilized by the community members will be used up
23

more quickly. This leads to a decreased difference between treatment and controls. From this perspective the most sensitive measurement is as early as possible. Due to these two contradicting factors, the AWC measurements at 72 hours of incubation were used as a compromise between sensitivity and reliability.
Pigment profiles Effects on algae within the periphyton biofilms were assessed using photosynthetic pigment composition profiles. This is a way to structurally classify a community instead of using the time consuming work of species determination by microscopy counting. Chlorophyll a is common to all microalgal classes but there are differences in additional marker pigments between classes or species. These differences can be used to assess structural differences between communities (Porsbring et al., 2007). Samples were taken from each incubation vessel after 96 hours of incubation in SWIFT (paper I, II and IV) and after 18 days in the microcosm aquaria (paper III). The pigments were extracted in a mixture of methanol, acetone, DMSO and water (v/v 30:30:30:10) over maximum three weeks followed by HPLC analysis for pigment quantification. Seven pigments (chlorophyll c, fucoxanthin, diadinoxanthin, diatoxanthin, chlorophyll a, zeaxanthin and β-carotene) could be classified by name while other pigments in each experiment were only classified by retention-time to avoid misclassifications. The toxicant driven effects were assessed for individual pigments and the total pigment content, as well as dissimilarities in the multivariate patterns in-between communities using nMDS (see: Multivariate analyses).
Multivariate analyses The measurements of pigment composition and carbon source utilization (Ecoplates) both results in more than one variable per sample and can thus be subjected for multivariate analyses. The differences in community structure (pigment composition) or function (Ecoplates) can be used to quantify how similar or dissimilar two sampled communities are. The Manhattan (City block) and the Bray Curtis indices were used to assess such differences within this thesis and will be introduced briefly below.
24

Manhattan (City block) Manhattan (also called the city block index) is calculated as the sum of absolute differences between each variable of two objects (equation 1). The inherent properties of the method leads to a dominance of variables with large values (Quinn & Keough, 2002). The absolute distance between each variable can be exemplified by how far you need to travel from A to B in Manhattan when you need follow the streets around the different blocks, hence the name. 𝐸𝑞𝑢𝑎𝑡𝑖𝑜𝑛 1: ∑ �𝑦1𝑗 − 𝑦2𝑗�
𝑝𝑗=1
where p equals the number of variables, y1j and y2j are the values of the variable in object 1 and object 2.
Bray Curtis The Bray Curtis index is a modification of the Manhattan index and is in many cases better to use for species data comparisons, as variable absence in two objects are ignored and thus not mistaken for a similarity between the considered communities. The sum of absolute differences between two objects is scaled to the sum of variable values of the objects (equation 2) (Quinn & Keough, 2002).
𝐸𝑞𝑢𝑎𝑡𝑖𝑜𝑛 2: ∑ �𝑦1𝑗 − 𝑦2𝑗�𝑝𝑗=1
∑ �𝑦1𝑗 + 𝑦2𝑗�𝑝𝑗=1
where p equals the number of variables, y1j and y2j are the values of the variable in object 1 and object 2. This means that the index values range between zero and one, where zero indicates complete similarity while one means that the objects are completely dissimilar to each other.
Non-metric Multi-Dimensional Scaling The similarities between communities in this thesis have, in addition to the use of similarity indices, been compared graphically using non-metric Multi-Dimensional Scaling (nMDS). By the use of pair-vise comparison of communities, using Manhattan or Bray Curtis indices, the relative distance between communities in a study was calculated and ranked. The nMDS algorithm randomly project the investigated communities in a two dimensional plot. By iteratively changing the positions of the communities in the projection, the distances between each plotted community are as close to the relative distance calculated using the index as possible. That means that similar
25
communities are plotted close together while more dissimilar ones are plotted further away (Clarke, 1993). This means that communities exposed to compounds with similar ecological modes of action will display similar concentration dependent trajectories in the nMDS plot, while communities exposed to compounds having dissimilar modes of action will be separated (Porsbring, 2009).
PICT detection The PICT determination in paper III was performed as acute inhibition of photosynthetic capacity, measured as incorporation of radiolabeled (14C) sodium bicarbonate, in periphytic algae and cyanobacteria. The principle behind the method is that high photosynthetic performance leads to high incorporation rates of the radiolabeled carbon, which in turn gives a high number of radioactive disintegrations in a sample. Inhibition of photosynthesis will instead lead to a lower number of disintegrations in a sample as only low (if any) amounts of radioactive carbon has been taken up by the photosynthetic organisms. The radiolabeled sodium bicarbonate was mixed with filtered water, sampled from the incoming water to the microcosm aquaria (paper III), to a final activity of 0.074 MBq in each sample. Periphyton communities were sampled from each microcosm and incubated with different concentrations of triclosan at the temperature and light conditions corresponding to the microcosm system over 45 minutes to ensure an ongoing or inhibited photosynthesis. An additional 15 minutes of incubation was then initiated with radiolabeled sodium bicarbonate. The photosynthesis was then terminated with the addition of 50 µL formaldehyde (37%). The samples were acidified with acetic acid, dried at 60°C under a gentle stream of air followed by the addition of dimethylsulfoxide and scintillation cocktail. The radioactivity of the samples was measured using a liquid scintillation counting and the disintegrations per minute were calculated for each sample.
PAM fluorometry Pulse Amplitude Modulation (PAM) uses chlorophyll fluorescence to estimate the photosynthetic capacity of the investigated plant or algae. An advantage compared to the incorporation of radiolabeled carbon is that PAM is a non-destructive method which does not kill the organism(s) during measurement. This means, in principle, that the same sample can be monitored several times during an experiment. The underlying principle of PAM is that the light energy absorbed by chlorophyll molecules can be de-excited in three ways. It can be used as energy to drive photosynthesis, dissipated as heat or re-emitted as fluorescence at longer wavelengths than the incoming light. PAM uses a short pulse of high intensity light – saturating pulse (SP) (figure 8), which fully reduces the electron acceptors
26

downstream photosystem II (PSII). Hence, it saturates the energy transfer in the light reactions of photosynthesis, which at this time point is zero, and consequently the fluorescence reach a maximum (figure 8). As heat transfer is a relatively slow process compared to light emission, this component is assumed to be zero. Thus, fluorescence and energy conversion at PS II are inversely related.
When dark adapted photosynthetic material is transferred to light, using PAM terminology; actinic light (AL) (Fig.9), the fluorescence signal, or fluorescence yield, will increase. Similarly to the SP this increase is due to the reduction of electron acceptors downstream PSII in the photosynthetic pathway. After this initial increase the fluorescence yield will drop, as can be seen in figure 8. This phenomenon of an immediate increase and a following decrease in fluorescence was first described by Kautsky and co-workers in 1960 and is therefore called the Kautsky effect. There are two main reasons for the decrease in fluorescence after the turn-on of actinic light. The first is the re-supply of electron acceptors that transfer the energy from PSII. The second is the increased heat dissipation, a reaction called non-photochemical quenching (NPQ) (Maxwell & Johnson, 2000). To distinguish between photochemical and non-photochemical work PAM applies a SP to dark adapted photosynthetic material. As outlined above, this will close all PSII reaction centers and no (or at least negligible) NPQ occurs, which gives rise to a peak in fluorescence (Fm) (figure 8). A SP to light adapted photosynthetic material will also give rise to an increased fluorescence, but as there is an ongoing
Figure 8 – Fluorescence over time. F0 represent the baseline fluorescence, Fm and Fm’ are the fluorescence maxima during a saturation pulse (SP) in dark and light adapted cells, respectively. Actinic light (AL) is light applied to drive the photosynthesis.
27
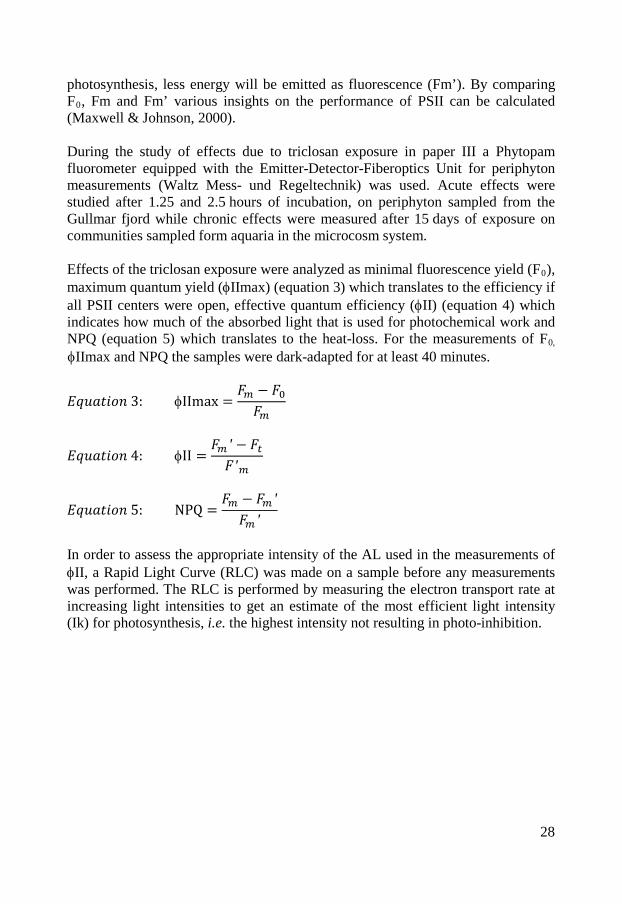
photosynthesis, less energy will be emitted as fluorescence (Fm’). By comparing F0, Fm and Fm’ various insights on the performance of PSII can be calculated (Maxwell & Johnson, 2000). During the study of effects due to triclosan exposure in paper III a Phytopam fluorometer equipped with the Emitter-Detector-Fiberoptics Unit for periphyton measurements (Waltz Mess- und Regeltechnik) was used. Acute effects were studied after 1.25 and 2.5 hours of incubation, on periphyton sampled from the Gullmar fjord while chronic effects were measured after 15 days of exposure on communities sampled form aquaria in the microcosm system. Effects of the triclosan exposure were analyzed as minimal fluorescence yield (F0), maximum quantum yield (φIImax) (equation 3) which translates to the efficiency if all PSII centers were open, effective quantum efficiency (φII) (equation 4) which indicates how much of the absorbed light that is used for photochemical work and NPQ (equation 5) which translates to the heat-loss. For the measurements of F0,
φIImax and NPQ the samples were dark-adapted for at least 40 minutes.
𝐸𝑞𝑢𝑎𝑡𝑖𝑜𝑛 3: φIImax =𝐹𝑚 − 𝐹0𝐹𝑚
𝐸𝑞𝑢𝑎𝑡𝑖𝑜𝑛 4: φII =𝐹𝑚′− 𝐹𝑡𝐹′𝑚
𝐸𝑞𝑢𝑎𝑡𝑖𝑜𝑛 5: NPQ =𝐹𝑚 − 𝐹𝑚′𝐹𝑚′
In order to assess the appropriate intensity of the AL used in the measurements of φII, a Rapid Light Curve (RLC) was made on a sample before any measurements was performed. The RLC is performed by measuring the electron transport rate at increasing light intensities to get an estimate of the most efficient light intensity (Ik) for photosynthesis, i.e. the highest intensity not resulting in photo-inhibition.
28
Significant findings Ciprofloxacin, sulfamethoxazole and triclosan were all toxic to marine periphyton communities. Effects on the periphytic bacteria were analyzed as metabolic capacity, using Ecoplates (see: Biolog Ecoplates), while effects on algae were assessed by pigment profiling and photosynthetic capacity (see: Pigment profiles, PICT detection and PAM fluorometry). The main results are summarized in table 2 and the lowest effect concentrations for the periphyton sampled in the Gullmar fjord have also been added to the cumulative distribution plot, discussed in the chapters “Occurrence in the environment” and “Ecotoxicity” (figure 9), to facilitate comparison between the results within this thesis and to the occurrence and ecotoxicological data published in the peer-reviewed literature. The effects were qualitatively and quantitatively different for periphytic bacteria and algae. Therefore these will be discussed separately in the following paragraphs, starting with effects on bacteria.
29
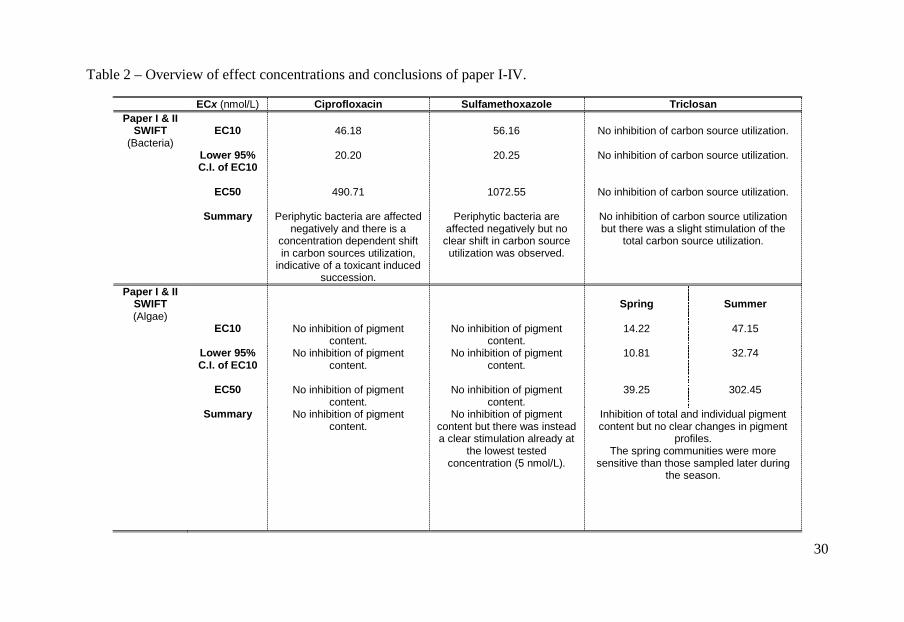
Table 2 – Overview of effect concentrations and conclusions of paper I-IV.
ECx (nmol/L) Ciprofloxacin Sulfamethoxazole Triclosan Paper I & II
SWIFT (Bacteria)
EC10
46.18
56.16
No inhibition of carbon source utilization.
Lower 95%
C.I. of EC10
20.20 20.25 No inhibition of carbon source utilization.
EC50
490.71
1072.55
No inhibition of carbon source utilization.
Summary
Periphytic bacteria are affected negatively and there is a
concentration dependent shift in carbon sources utilization,
indicative of a toxicant induced succession.
Periphytic bacteria are affected negatively but no
clear shift in carbon source utilization was observed.
No inhibition of carbon source utilization but there was a slight stimulation of the
total carbon source utilization.
Paper I & II SWIFT (Algae)
Spring
Summer
EC10 No inhibition of pigment content.
No inhibition of pigment content.
14.22 47.15
Lower 95% C.I. of EC10
No inhibition of pigment content.
No inhibition of pigment content.
10.81 32.74
EC50
No inhibition of pigment content.
No inhibition of pigment content.
39.25 302.45
Summary
No inhibition of pigment content.
No inhibition of pigment content but there was instead a clear stimulation already at
the lowest tested concentration (5 nmol/L).
Inhibition of total and individual pigment content but no clear changes in pigment
profiles. The spring communities were more
sensitive than those sampled later during the season.
30
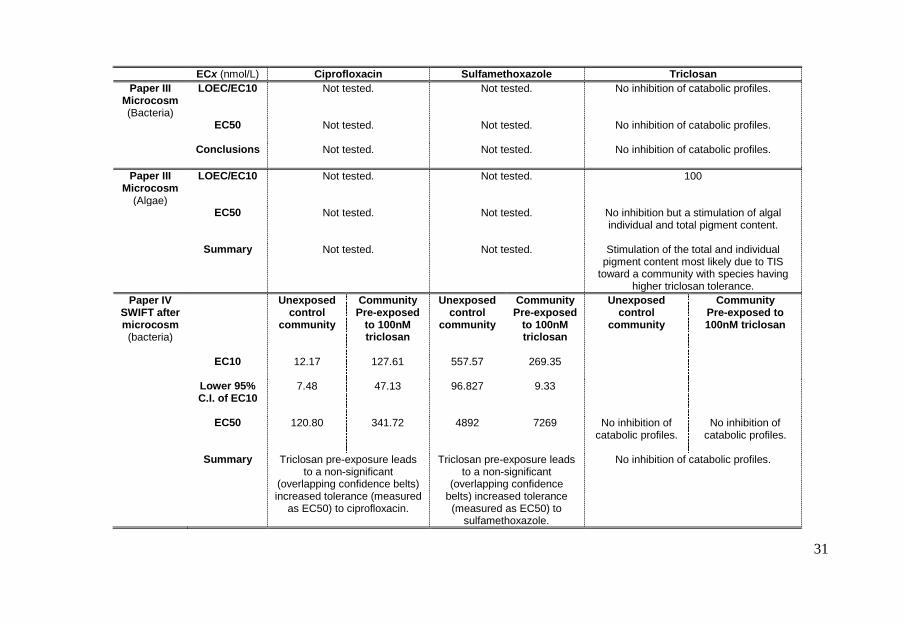
ECx (nmol/L) Ciprofloxacin Sulfamethoxazole Triclosan Paper III
Microcosm (Bacteria)
LOEC/EC10
Not tested.
Not tested. No inhibition of catabolic profiles.
EC50
Not tested.
Not tested. No inhibition of catabolic profiles.
Conclusions
Not tested.
Not tested. No inhibition of catabolic profiles.
Paper III Microcosm
(Algae)
LOEC/EC10
Not tested.
Not tested. 100
EC50
Not tested.
Not tested. No inhibition but a stimulation of algal individual and total pigment content.
Summary
Not tested.
Not tested. Stimulation of the total and individual
pigment content most likely due to TIS toward a community with species having
higher triclosan tolerance. Paper IV
SWIFT after microcosm (bacteria)
Unexposed control
community
Community Pre-exposed
to 100nM triclosan
Unexposed control
community
Community Pre-exposed
to 100nM triclosan
Unexposed control
community
Community Pre-exposed to 100nM triclosan
EC10
12.17 127.61 557.57 269.35
Lower 95% C.I. of EC10
7.48 47.13 96.827 9.33
EC50
120.80 341.72 4892 7269 No inhibition of catabolic profiles.
No inhibition of catabolic profiles.
Summary
Triclosan pre-exposure leads
to a non-significant (overlapping confidence belts) increased tolerance (measured
as EC50) to ciprofloxacin.
Triclosan pre-exposure leads to a non-significant
(overlapping confidence belts) increased tolerance (measured as EC50) to
sulfamethoxazole.
No inhibition of catabolic profiles.
31

ECx (nmol/L) Ciprofloxacin Sulfamethoxazole Triclosan Paper IV
SWIFT after microcosm
(algae)
Unexposed control
community
Community Pre-exposed
to 100nM triclosan
Unexposed control
community
Community Pre-
exposed to 100nM
triclosan
Unexposed control
community
Community Pre-exposed to 100nM triclosan
EC10
3.20 576.19
EC50 (nmol/L)
No inhibition of pigment
content.
No inhibition of pigment
content.
No inhibition of pigment
content.
No inhibition of pigment
content.
152.33 1271.80
32

Figure 9 – Distribution of ciprofloxacin (A), sulfamethoxazole (B) and triclosan (C) concentrations in surface waters in North America, Europe and Asia (box plots). The filled symbols (●) represent outliers while (X) highlights concentrations measured in marine surface waters. The colored symbols represent reported ecotoxicity data. (∎) and (●) represent acute and chronic tests respectively while Red, Green and Blue symbols represent NOEC/LOEC/EC10, EC25 and EC50, respectively. Vertical lines represent the effect data from paper I-II. Black vertical lines represent EC50 (▬), EC10 (- -), Lower 95% interval of the EC10 value (∙∙∙) while the red vertical line (▬) correspond to the calculated PNEC value.
33

Chronic toxicity towards bacteria The first aims of this thesis were to perform hazard assessment of ciprofloxacin, sulfamethoxazole and triclosan for marine periphyton, to identify critical thresholds and to describe the concentration response curves. This was performed in paper I-III and the results are summarized in figure 10 and table 2. Ciprofloxacin and sulfamethoxazole both caused a clear concentration dependent inhibition of bacterial carbon source utilization, while triclosan never affected bacterial metabolization negatively in the tested concentration interval of up to 10 000 nmol/L (paper II, III, IV). Ciprofloxacin exposure resulted in AWC-based EC10 and EC50 values of 46.18 nmol/L and 490.71 nmol/L, respectively (paper I). Thus, using this endpoint, periphyton bacteria are more tolerant to ciprofloxacin than the bacterial test species that has been tested in standardized single-species assays, with EC50 values ranging between 15 – 51 nmol/L for Microcystis aeruginosa (Halling-Sørensen et al., 2000; Robinson et al., 2005) and 241 nmol/L for Pseudomonas putida (Kümmerer et al., 2000). Still, the AWC of periphyton is more sensitive to ciprofloxacin than pyrene degradation of sediment communities (EC50 = 1700 nmol/L) (Näslund et al., 2008), catabolic profiles (Ecoplates) of stream communities (LOEC = 301.8 nmol/L) (Maul et al., 2006) and biomass and richness of salt marsh microbial communities (LOEC = 6036 nmol/L) (Córdova-Kreylos & Scow, 2007). Sulfamethoxazole also inhibited growth and carbon degradation of periphytic bacteria (measured as AWC) in a concentration-dependent fashion, with EC10 and EC50 values of 56.16 and 1072.55 nmol/L, respectively (paper I). These values were compared to data from an unpublished SWIFT study on fresh water periphyton from a stream outside Gothenburg. As can be seen in figure 10B sulfamethoxazole affects marine and freshwater communities in a similar way but the freshwater bacteria are slightly more tolerant, with an EC50 of 2 398 nmol/L. Marine periphytic bacteria are, however, more tolerant to sulfamethoxazole than the cyanobacteria Synechococcus leopolensis, for which Ferrari et al. (2004) reported an EC50 value of 105.8 nmol/L. Yergeau and co-workers reported an even lower tolerance (LOEC = 1.97 nmol/L) for river biofilms by analyzing their transcriptional responses to sulfamethoxazole exposure (Yergeau et al., 2010; Yergeau et al., 2012). The periphytic bacteria tested in paper I is in contrast more sensitive than Pseudomonas putida (EC50 = 1000 000 nmol/L) as well as waste water bacteria for which effects of growth were reported at a concentration of 15 000 nmol/L (Al-Ahmad, Daschner, & Kümmerer, 1999). Several acute studies (5 – 30 minutes) have in addition been performed on the marine bacterium Vibrio fischeri and the observed EC50 values range between 92 000 and 308 000 nmol/L (Isidori et al., 2005; Kim et al., 2007). These values
34

are approximately two orders of magnitude higher than those described in paper I and points toward the fact that acute tests often underestimate the toxic effects of antibiotics, which previously have been discussed in the scientific literature (e.g. (Kümmerer et al., 2004) Still, it has to be noted that differences in species sensitivity exemplified with a range between 105.8 and 1000 000 nmol/L for Synechococcus leopolensis Ferrari et al. (2004) and Pseudomonas putida (Al-Ahmad et al., 1999), respectively, is even larger than the differences between acute and chronic effects in this case. Triclosan did, in contrast to the two antibiotics, not inhibit periphytic bacteria even though clear effects were observed on pigment content and photosynthesis of the algal part of the periphyton communities (see: chronic effects toward algae). The lack of inhibition was first observed in the SWIFT periphyton test where a small stimulation occurred (paper II, figure 10 C). A follow up study was performed using a flow through microcosm system in which the indigenous biota from the Gullmar fjord was settling and growing under the triclosan exposure of triclosan. The results were similar to the observations in paper II and no negative effects were seen on the bacterial carbon source utilization (paper III, figure 10D). The observed stimulation and complete lack of inhibition after triclosan exposure are partially supported by recent studies where shifts toward more heterotrophic communities (Drury et al., 2013; Lawrence et al., 2009), increased tolerance as well as the ability for bacteria to utilize triclosan as a sole carbon source have been reported (Meade et al., 2001; Nietch et al., 2013). Drury et al. (2013) showed, using an artificial stream, that triclosan did not decrease bacterial abundance or respiration rate, while it did affect bacterial diversity negatively. These effects were coupled to shifts in community composition as well as an exposure dependent increase in triclosan resistance. Further investigations are needed to evaluate if these observation also are applicable in marine periphyton as well but it seem to be a plausible explanation.
35

Figure 10 – Inhibition of carbon source utilization, measured as AWC after 72 hours of incubation in Ecoplates, after exposure to ciprofloxacin (A), sulfamethoxazole (B) or triclosan (C) in SWIFT and exposure to triclosan in aquaria microcosms (D). Open symbols represent untreated controls while filled symbols represent a toxicant treatment. The stars in (B) represent freshwater data from 2008. 36
Relative carbon source utilization In addition to the analyses of the AWC described above, the chronic effects on periphytic bacteria were assessed by analyzing each individual carbon source separately. The results from paper I and paper II were plotted as relative proportion of single carbon source utilization in figure 11 A-D to visualize the effects of the studied compounds on the utilization pattern. Different responses were observed for the three test compounds in the SWIFT periphyton test. Ciprofloxacin and sulfamethoxazole were both toxic to periphyton communities (figure 10 A-B) but only ciprofloxacin drastically changed the relative carbon source utilization of the community (figure 11 A). Sulfamethoxazole exposure did instead affect the relative utilization of all carbon sources to a similar extent over the concentration range (figure 11 B). Under the assumption that carbon source utilization reflects the bacterial structure in the community, sulfamethoxazole seems to affect all periphytic bacteria equally much up to an exposure of 9 054 nmol/L, at which concentration a drastic change is seen. Ciprofloxacin, on the other hand, cause greater changes in the communities already at 1 711 nmol/L. Triclosan, which induced a small stimulation of the AWC (figure 10 C, paper II), did not induce any significant changes of the relative carbon source utilization during any of the experiments (figure 11 C-D). The degradation of carbon sources were furthermore grouped into degradation guilds: carboxylic acids, polymers, carbohydrates, phenolic compounds, amino acids and amines. No effects were observed for triclosan in this assessment while ciprofloxacin did, in addition to inducing clear structural effects on the relative carbon source utilization, also affect the degradation guilds to different degrees (paper II). The degradation of phenolic compounds were most affected (not degraded above 61 nmol/L) while carboxylic acids (not degraded above 323 nmol/L) and amino acids (not degraded above 744 nmol/L) were affected at slightly higher concentrations. Carbohydrates and polymers were the two groups of carbon sources mostly used at the highest concentrations. Sulfamethoxazole exposure on the other hand gave a more uniform pattern in the individual carbon source utilization and this is also evident on the guild level where the first effects are evident at 1 711 nmol/L. At this concentration a decrease in the utilization of carboxylic acids and amino acids was observed in favor of polymers (paper II). The use guilds thus highlights changes in carbon source utilization slightly better than the relative individual carbon sources in this case.
37

Figure 11 – relative proportion (%) of carbon source utilization after 72 hours incubation in Ecoplates. The communities were exposed to ciprofloxacin (A), sulfamethoxazole (B) and triclosan (C & D) for 72 hours in the SWIFT periphyton test before the incubation in Ecoplates (paper I and II).
38

Multivariate analyses The Ecoplate data were further assessed using the ordination method non-metric Multi-Dimensional Scaling (nMDS) in order to visualize Toxicant Induced Succession (TIS) in the bacterial part of the periphyton communities. nMDS is, as discussed in the chapter “Non-metric Multi-Dimensional Scaling”, a method where a multidimensional data set is compressed to a two-dimensional plot. Similar communities are grouped together while dissimilar communities are placed apart from each other. A TIS will thus be visible as a concentration dependent trajectory in the nMDS plot. Figure 12 shows a nMDS plot of the time integrated carbon source utilization in Ecoplates (AUC data) presented in paper I and II. The data have been scaled to the controls, which therefore are plotted on top of each other, of each experiment to enable comparison between the different tests. The inhibitory effects of ciprofloxacin and sulfamethoxazole to periphytic bacteria lead to a clear trajectory from left to right in figure 12, which represents inhibition of gross respiration. In addition to this effect, ciprofloxacin further affects the communities’ ability to utilize different carbon sources, as shown in figure 11A, and this pattern reoccurs in the nMDS (figure 12) as a vertical component in the trajectory. Sulfamethoxazole, on the other hand, affects bacteria in a more uniform way and no vertical component in the trajectory can be seen in figure 12. That ciprofloxacin affect bacteria to varying extent is supported by (Van Bambeke et al., 2005) who observed a higher toxicity of ciprofloxacin to gram-negative than gram-positive bacteria. Triclosan, which in contrast to ciprofloxacin and sulfamethoxazole stimulated bacterial respiration, gives rise to less clear concentration dependent trajectories to the left side of figure 12. More obvious is the distinct clusters from the two experiments carried out in spring (upper left) and summer (lower left), which show difference in community functions between the two seasons.
39

Triclosan-induced tolerance and co-tolerance to ciprofloxacin and sulfamethoxazole Previous studies have, in addition to investigating the immediate hazard of triclosan, also shown that triclosan resistance occurs in Salmonella enterica. This resistance is partly due to an up-regulation of fabI, which counter-acts the inhibition of fatty acid synthesis, and is partly caused by the up-regulation of genes leading to reduced influx, increased efflux and increased exopolysaccharide production (Tabak et al., 2007). Furthermore there is a concern that triclosan exposure could lead to cross-resistance to antibiotics (SCENIHR, 2009), which has been observed between triclosan and ciprofloxacin (Tabak et al., 2009).
Figure 12 – nMDS plot of the time integrated carbon source utilization (AUC) over 100 hours in Ecoplates. The communities were exposed to ciprofloxacin (●), sulfamethoxazole (▲) and triclosan (spring [■] and summer [■]) for 72 hours in the SWIFT periphyton test before the incubation in Ecoplates (paper I and II).The arrows indicate trajectories for each toxicant and experiment, starting from the controls to the highest test concentration. Blue, green, yellow and red circles are plotted to help visualize the clusters.
40

A study was thus performed to assess if a long-term exposure of 100 nmol/L triclosan leads to increased community tolerance in periphytic bacteria. Community tolerance was assessed as growth in the SWIFT periphyton test and measured using Ecoplates. A small stimulation, similar to the one observed in paper II (figure 10 C), was recorded instead of the expected inhibition after triclosan exposure. No difference in the response could be observed between communities sampled from control microcosms and those dosed with 100 nmol/L triclosan. Hence, no increase in community tolerance was detected. The two antibiotics did, on the other hand, inhibit the bacterial communities from control microcosms and those dosed with 100 nmol/L triclosan in a concentration dependent fashion. The observed EC50 values for communities sampled from control microcosms and microcosms dosed with 100 nmol/L triclosan were 121 and 342 nmol/L for ciprofloxacin and 4 892 and 7 269 nmol/L for sulfamethoxazole, respectively. The concentration response curves were only separated in the case of ciprofloxacin while no statistically significant increase in antibiotic tolerance could be observed in the case of sulfamethoxazole as the confidence belts clearly overlaps. As no effects were observed for the periphytic bacteria there was no further increase in triclosan tolerance. Therefore it is not possible to state that there is a co-tolerance between triclosan and ciprofloxacin. But, the interesting fact remains that triclosan exposure actually seems to change the sensitivity against ciprofloxacin which calls for further investigations.
Chronic toxicity towards algae In parallel to the toxicity determinations in bacteria, the chronic toxicity towards algae was assessed, throughout the presented studies. No inhibition of pigment content in periphytic algae and cyanobacteria was observed after chronic exposure to ciprofloxacin and sulfamethoxazole (paper I and IV) while triclosan exposure resulted in clear and concentration dependent effects (paper II, III, IV). All presented experiments were performed using periphyton from the Gullmar fjord but since the experiments were performed at different time points, the community composition was unique for each experiment. This is, under the assumption that changes in relative pigment content are indicative of differences in species composition, confirmed by analyzes of pigment profiles of the controls for each experiment. The major pigments from the controls of each experiment have thus been plotted in figure 13. An increase in the relative content of fucoxanthin, diadinoxanthin and diatoxanthin was observed in periphyton sampled from the Gullmar fjord in the summer of 2010 compared to those sampled during spring (paper I and II). These pigments are all
41

abundant in diatoms, coccolithophores and raphidophytes in contrast to for example green algae (Jeffrey, Mantoura, & Wright, 1997). Even larger difference can be observed between the periphyton from Gullmar fjord and the biofilms sampled from the microcosm system (paper III and IV). The relative abundance of chlorophyll c was higher in the microcosm experiment than in the communities from Gullmar fjord while diadinoxanthin and β-caroten instead was present in lower proportions, further showing the complex changes in community structure. As different species have different sensitivities to toxicants, the outcome of an ecotoxicological test with communities is dependent on the sensitivity distribution of the starting material. Also, differences in water chemistry of the media used
Figure 13 – Relative pigment content scaled to the chlorophyll a content in each experiment. White and black bars correspond to the SWIFT experiments in the spring and summer of 2010. Grey bars represent samples in the SWIFT experiment carried out on biofilms from the controls in the microcosm system, while striped grey bars represent samples in the SWIFT experiment carried out on biofilms from 100 nmol/L triclosan pre-treatment. The black and white “chess board” bars indicate samples from the microcosm controls
42

during the incubations can affect the bioavailability of the tested compound and contribute to differences in effect thresholds. Such factors was likely involved when triclosan was tested in paper II, where the EC50 value increased approximately eight times (from 39.25 to 302.45 nmol/L) between the experiments carried out in the end of April and in June (figure 14 A). In the more elaborate follow up study, presented in paper III, periphyton was sampled after 17 days of colonization and growth in aquaria. A comparison between the periphyton in the microcosm controls and the communities sampled near the water intake was additionally performed in parallel (see: Flow-through microcosms). This study shows that the sensitivity of the periphyton communities sampled in the field were only slightly lower than for the microcosm controls. The microcosms can thus be said to represent the sensitivity in the natural marine environment. Chronic triclosan exposure in the microcosm system resulted in a stimulation of total and individual algal pigments (figure 14 B, paper III). This stimulation was significantly different from controls at a concentration of 100 nmol/L but there were indications already at the exposure of 31.6 nmol/L. As these stimulatory effects only occur at concentrations where clear inhibitory effects were observed in the SWIFT periphyton test it is likely that there has been a shift toward a community with organisms with higher triclosan tolerance, according to the PICT concept. Indeed, algae and cyanobacteria exposed to 100 nmol/L and above in the microcosm system were more tolerant to triclosan (paper III). The stimulation in pigment content could be a response to a triclosan induced uncoupling of photophosphorylation in the periphytic algae, which also has been suggested as an possible mechanism of action for triclosan (Franz et al., 2008). In such a case, when the uncoupler collapses the electrochemical gradient needed to drive the ATPase, an increased production of pigments may help harvest more energy and in turn uphold the pH gradient. Chlorophyll a content has been shown to increase in Chlorella vulgaris (Sahinkaya & Dilek, 2009) and in a micro-algal consortium (Lima et al., 2004) after exposure to other uncoupling substances, which is supporting this hypothesis. Marine periphyton, with EC50 values ranging from 39.25 to 302.45 nmol/L in the SWIFT periphyton test system (paper II and IV) and a LOEC of 100 nmol/L in the microcosm experiment (paper III), are slightly less sensitive to triclosan than green algae for which EC50 values as low as 15.4 nmol/L have been described (DeLorenzo & Fleming, 2008; Franz et al., 2008; Orvos et al., 2002; Yang et al., 2008). Diatoms are, on the other hand, as sensitive as the periphyton examined in this thesis, with EC50 values in the range of 65.97 and 1 347 nmol/L (Bedoux et al., 2012). This similarity reflects the fact that the tested periphyton communities largely consist of diatoms (Porsbring et al., 2007). Neither ciprofloxacin nor sulfamethoxazole inhibited periphytic algae (paper I and IV) within the tested concentration range of up to 9 054 nmol/L (paper I and IV),
43

which coincides with previous studies on micro-algae (Ferrari et al., 2004; Halling-Sørensen et al., 2000; Martins et al., 2012; Robinson et al., 2005). Sulfamethoxazole did on the contrary stimulate the total and individual pigment content (paper I) already at the lowest tested concentration of 5 nmol/L. The stimulation did then decrease with increasing test concentration to finally disappear at the highest tested concentration. A similar effect was described for the growth of the green algae Pseudokirchneriella subcapitata (Yang et al., 2008) but not in the same magnitude as in paper I. No similar stimulation was observed on sulfamethoxazole exposure to periphyton grown in aquaria, independent if they were exposed to 100 nmol/L of triclosan or not (paper IV). This could be due to the differences in community composition in the starting material as discussed above (figure 13) but further studies are needed to explain the cause of the stimulation.
44

Figure 14 – Inhibition of total pigment content after triclosan exposure in the SWIFT periphyton test system using biofilms sampled in the sea (A [∆] and [○] was sampled in the spring and summer, respectively) and from microcosm aquaria (C) [○] and [∆] was untreated and pre-treated with 100 nmol/L triclosan, respectively. Effects on periphyton after 18 days of exposure in the flow-through microcosm system are mare presented in (B). Open symbols represent controls.
45

PICT A study on Pollution-Induced Community Tolerance (PICT) is, as described in the introduction, performed in two steps – the selection and the detection phases. During the selection phase, a community is chronically exposed to a stressor resulting in a toxicant induced succession (TIS), which favors species that are tolerant to the toxicant. This tolerance change is then quantified in the detection phase. Triclosan-driven TIS and PICT were studied in paper III. Periphyton was exposed to different triclosan concentrations during a PICT selection phase of 18 days. The PICT detection was then performed by measuring the inhibition of photosynthetic activity, using incorporation rate of 14C radiolabeled carbonate, in an acute test. One acute test was performed for each microcosm and the resulting EC50 values were recorded and compared as a measure of PICT. No significant difference in tolerance was observed for concentrations below 10 nmol/L, while clear tolerance increases were measured at 100 nmol/L and above. The community tolerance did in fact increase more than tenfold, from an average of 560 nmol/L for the unexposed control communities to 5 950 nmol/L for communities exposed to 100 nmol/L triclosan. An even higher EC50 of 7 840 nmol/L was determined for communities sampled from microcosms with the highest triclosan concentration of 1 000 nmol/L. The concentration where community tolerance increased coincided with the concentrations where stimulation of total pigment content occurs in figure 14 B (paper III) and gives further support to a long-term change in community structure due to triclosan exposure.
Acute versus chronic tests for quantifying PICT According to the PICT concept, it is essential that the detection phase itself is short enough to avoid a second selection phase. Reasonable as it sounds, this is problematic for compounds which only act over longer time-scales, for example the two antibiotics in scope of this thesis. The situation is on the other hand a bit more complex for triclosan which might have both an acute mode of action, in the form of uncoupling of photophosphorylation (see: Chronic algal toxicity), as well as a chronic mode of action in bacteria, in the form of inhibition of fatty acid synthesis. A comparison between acute (paper III) and chronic (paper IV) PICT detection was thus performed on biofilms sampled from control microcosms and microcosms dosed with 100 nmol/L triclosan. Periphyton for the chronic PICT detection was sampled after 10 days of growth in the aquaria and exposed to a
46
concentration series of triclosan in the SWIFT periphyton test (paper IV) over 96 hours. Effects on the periphytic algae were then assessed using total and individual pigment content. Periphyton for the acute PICT detection were sampled after 17-18 days and PICT was quantified as inhibition of photosynthetic capacity using 14C radiolabeled carbonate, as described in the previous paragraph and in the chapter “PICT detection” (paper III). A more than tenfold increase in EC50 values was observed using the acute PICT detection methodology, when comparing the average of the unexposed control communities (EC50 = 560 nmol/L, n = 3) and the communities exposed to 100 nmol/L triclosan (EC50 = 5 950 nmol/L, n = 1) (see: PICT, figure 15). A similar increase was observed using the chronic SWIFT assay, with EC50 values increasing from 152.33 nmol/L for the unexposed control communities to 1271.80 nmol/L for communities exposed to 100 nmol/L triclosan (figure 15). This represents an increase of 8 times. The approximate tenfold increase in tolerance, observed with the acute and chronic methods alike, indicates that the communities have undergone PICT in the microcosms. Since the chronic method only was used to detect increased community tolerance for one long-term exposure concentration (100 nmol/L) it is not possible to assess the sensitivity of the SWIFT periphyton test for detecting PICT. Further studies have to be performed to assess if the PICT signal can be detected at concentration similar or lower than with an acute test. However, the magnitude of the PICT signals for the acute and the chronic methods can be compared, and the two methods detected similar PICT signal. These results points to that chronic tests can be used to detect PICT, which is imperative for compounds which only exert their effects over longer time-frames and for which no acute chronic tests systems exists.
47

Figure 15 – Concentration response curves from acute (black) and chronic (red) toxicity tests of triclosan. Dashed lines represent communities established without triclosan exposure and solid lines communities exposed to 100 nmol/L during the initial settling and growth phase.
48

Are marine waters at risk from pollution with antibiotics and antimicrobials? A sound environmental risk assessment for the marine environment is hampered by a severe lack of exposure data for ciprofloxacin, sulfamethoxazole and triclosan alike. As discussed in the introduction, only a few, scattered, data are available, often restricted to surface waters in Asia. Given their use in human pharmaceuticals and personal care products, it can be assumed that all three compounds enter the marine environment predominately via effluents and river mouths. Maximum sulfamethoxazole concentrations in the effluent of Kalmar County hospital (finally discharging into the Baltic sea) was 50 nmol/L, i.e. at a concentration that directly inhibits the catabolic activity of marine biofilms (see: table 2) (Lindberg et al., 2004). Ciprofloxacin was detected in the same study at effluent concentrations up to 304 nmol/L, which also is a concentration well above the critical threshold for bacterial community-level effects determined in the present study. Triclosan has been detected at a slightly lower concentration of 7.6 nmol/L in European effluents (Bedoux et al., 2012), which is just above the lower 95% confidence belt of the EC10 (10.8 nmol/L), used as a first estimate of toxic effects in the present study. Keeping the occurrence and ecotoxicity of ciprofloxacin, sulfamethoxazole and triclosan in mind, conclusions on environmental risk for the marine environment based on the data presented in this thesis depend on three issues: (i) are marine microorganisms (bacteria and algae) indeed the most sensitive organism group for each compound, (ii) which assessment factor should be applied and (iii) how much is the sewage effluent diluted before it enters the marine environment? (i) As can be seen in figure 10, micro-organisms are in fact highly sensitive to the tested compounds and are thus suitable test organisms for triclosan, ciprofloxacin and sulfamethoxazole alike. Bacteria are most sensitive to the two antibiotics, ciprofloxacin and sulfamethoxazole. Microalgae are, on the other hand, more sensitive than bacteria to the antibacterial agent triclosan even though the mechanism of action in microalgae still largely is unknown. (ii) According to the EMA guideline, effects of antimicrobial substances should be evaluated using an acute respiration assay with STP sludge (OECD guideline 209) (European Medicines Agency (EMA), 2006). The use of acute tests to determine effects of chronically acting compounds is, as discussed in previous paragraphs, inappropriate. In fact, the EMA guideline specifically states “Short-term testing is generally not applicable for human pharmaceuticals since continuous exposure of the aquatic environment via STP effluents is assumed.” It is all the more surprising that the acute STP sludge respiration assay with a contact time of 3 hours is
49

recommend for assessing the bacterial toxicity of antimicrobially active compounds. As chronic tests are likely to be more sensitive than acute tests the ecotoxicological assessment of a pharmaceutical will use an assessment factor of 10 (EMA guideline). The marine environment is not specifically considered in the EMA guideline, but the REACH guidance suggests the use of an additional assessment factor of 10 for the conversion between fresh and marine waters if “long-term results (e.g. EC10 or NOEC) from three freshwater or saltwater species (normally algae and/or crustaceans and/or fish) representing three trophic levels” are available. An assessment factor of 10 was applied to the calculated ecotoxicological benchmark values (lower 95% interval of the EC10 value) from the studies in paper I and II using periphyton established in the Gullmar fjord with resulting PNEC values of 2.020 nmol/L for ciprofloxacin, 2.025 nmol/L for sulfamethoxazole and 1.081 nmol/L for triclosan (table 2). These PNEC values have been plotted together with the cumulative distributions of available peer-review ecotoxicological and occurrence data in figure 10. It is further evident from figure 10 that the PNEC values for sulfamethoxazole and triclosan are within the detected concentrations range in surface waters from North America, Europe and Asia. Surface water concentrations do in contrast only exceed the calculated PNEC for ciprofloxacin in Asia. Even though the occurrence data are scarce for the marine environment, one can assume that the pollutants emitted into streams eventually end up in the coastal environment if not adsorbed to sediments or degraded first. (iii) The works of Ort and Siegrist (2009) and Keller et al. (2006) suggest that sewage is diluted by a factor of 1.4 – 50 in rivers. Applying this range of dilution factors on the effluent concentrations described by Lindberg et al. (2004) and Bedoux et al. (2012) above, there will hypothetically be 6 – 220 nmol/L ciprofloxacin, 1 – 36 nmol/L sulfamethoxazole and 0.2 – 5.4 nmol/L triclosan occurring in the marine environment. Based on these assumptions, the river water must be further diluted at least 3 – 109 times for ciprofloxacin, 0 – 18 times for sulfamethoxazole and 0 – 5 times for triclosan to end up at concentrations below the PNEC determined based on the data presented in this thesis. These calculations indicate that there might be a risk to marine organisms depending on the final dilution, the removal and the degradation rates in surface and marine waters.
50

Summary and Conclusions This thesis shows that the two investigated antibiotics, ciprofloxacin and sulfamethoxazole, both inhibit periphytic bacteria, sampled from the marine environment on the Swedish west coast, after chronic exposure to concentrations above 20.25 nmol/L and 22.21 nmol/L, respectively. Ciprofloxacin has a more selective effect, resulting in clear changes in the bacterial carbon source utilization pattern, while sulfamethoxazole affects the bacterial utilization of a broader range of carbon sources with a similar concentration-response pattern. Triclosan, on the other hand, stimulates the bacterial carbon source utilization slightly, without affecting the functional diversity in periphytic bacterial communities. Triclosan is the only compound that is toxic to periphytic algae in a concentration dependent fashion, with first effects becoming visible at 10.8 nmol/L in the SWIFT periphyton test. Communities sampled in the Gullmar fjord were used for the SWIFT experiments and the observed results are opposite to the observations made after 18 days of exposure to triclosan in a flow-through microcosm system. This long-term exposure did in fact result in a significant increase in algal pigment content at a triclosan concentration of 100 nmol/L. This increase is most likely due to a change toward more tolerant organisms, which also is supported by the observed increase in triclosan tolerance. The tolerance increased by a factor of approximately 10 times for the communities pre-exposed to 100 nmol/L triclosan, measured as acute inhibition of photosynthetic activity. A similar increase was also observed on communities pre-exposed to the same triclosan concentration (100 nmol/L), measured as pigment content in the chronic SWIFT periphyton test. As the PICT signals are comparable there are indications that the two methods have a similar potential for detecting a triclosan induced tolerance increase. Therefore these initial results indicate that the SWIFT periphyton test can be used to detect PICT for substances which only are toxic after prolonged exposures. PNECs for all three compounds were calculated using an assessment factor of 10 and the resulting values are within the measured concentration range for sulfamethoxazole and triclosan in North American, European and Asian surface waters alike. The PNEC for ciprofloxacin was only within the measured concentrations in Asia. However, it should be emphasised that actual monitoring for the marine environment for the three tested compounds are extremely scarce. Given that the calculated PNECs are in the proximity of the few data that are available, the final conclusion on risks to the marine environment depends largely on how much the effluent waters are diluted before entering the marine environment.
51

Suggestions for future work Although this thesis provides data on the toxicity of triclosan, ciprofloxacin and sulfamethoxazole for natural marine communities, and hence provides an improved estimate of the environmental hazards of these compounds, there are several remaining gaps and issues that I would like to address shortly. First of all, I would like to get an answer to why triclosan is not toxic to periphytic bacteria. As a first step, it would worth trying other chronic endpoints to measure effects on periphytic bacteria to assess if triclosan affects bacteria but not their metabolic capacity. It would also be very interesting to further investigate the mechanism of action by which triclosan affects microalgae and why we observed a stimulation in pigment content in the microcosm system for the communities exposed to triclosan. This could be due to the uncoupling of photophosphorylation in the periphytic algae but this needs to be assessed in future studies to proof. These questions could for example be addressed by studies using genome-wide gene expression in microorganisms. The results presented in this thesis further show that the chronic SWIFT periphyton test detect a PICT signal of similar magnitude as the acute inhibition of photosynthesis activity. This must be complemented by investigations on how sensitive the chronic detection method is, for which pre-exposure concentration a PICT-signal can be detected. As triclosan never inhibited periphytic bacteria no tolerance increase could be observed and hence no co-tolerance. Further studies are therefore needed to explain the increased tolerance to ciprofloxacin that pre-exposure to 100 nmol/L triclosan actually induced. On a more general note, there are not enough published data on antimicrobial agents in the coastal environment to properly assess environmental risks. Based on the few studies available to date, it seems that antibiotics and antimicrobial agents might be present in sufficiently high concentrations to affect marine microorganisms but more data on environmental concentrations are needed to know for sure. It would also be interesting to assess the combined effects of the studied compounds since complex mixtures of contaminants always occur in marine surface waters. The sometimes questionable choice of test organisms and experimental setups used during the regulatory environmental risk assessment of antimicrobials is also worth to mention. The strategy suggested by EMA, to use cyanobacteria instead of green-algae for effect testing of antimicrobials, seems appropriate, and is supported by the findings in paper I. The use of an acute test, such as the sludge respiration test, to assess effects of chronically acting compounds makes less sense though.
52

Populärvetenskaplig sammanfattning I dagens samhälle används stora mängder bakteriedödande ämnen. Antibiotika används för att behandla infektioner hos människor och djur, och användandet har inneburit att många dödliga sjukdomar nu går att bota. Bakteriedödande ämnen finns också i produkter som desinfekteringsmedel, tvål, tandkräm, konserveringsmedel, leksaker, sportsockar och mycket mer. Ämnena i dessa produkter utgör ytterligare en grupp, vid sidan av antibiotika och kallas gemensamt för antibakteriella substanser i denna doktorsavhandling. Båda grupperna släpps i regel ut i miljön efter användning och återfinns ofta i olika vattendrag. Eftersom bakteriedödande ämnen används just för deras antimikrobiella egenskaper finns det en risk att de påverkar mikroorganismer, till exempel bakterier och mikroalger som lever i våra vattendrag. Att undersöka huruvida bakteriedödande ämnen utgör en risk för vattenlevande mikroorganismer är därför huvudmålet för den här doktorsavhandlingen. Eftersom det är omöjligt att testa alla ämnen med antimikrobiella egenskaper valdes två vanliga antibiotika, ciprofloxacin och sulfametoxazol, och den antibakteriella substansen triklosan, som representanter för de två grupperna. De tre substanserna påverkar bakterier genom väl studerade men helt olika verkningsmekanismer och har gemensamt att de är vanligt förekommande vid låga koncentrationer i ytvatten över hela världen. Vidare så har det i tidigare studier visats att mikroorganismer är mest känsliga mot ciprofloxacin, sulfametoxazol och triklosan, vilket är i linje med deras användningsområde. Majoriteten av tidigare studier har dock fokuserat på sötvatten, både beträffande vid vilka koncentrationer de återfinns i miljön och vilka effekter de har på organismerna som utsätts för dem. För att utöka den vetenskapliga kunskapen gjordes därför alla försök på marina organismer. Vidare så utförs ekotoxikologiska tester traditionellt på en art i taget. Det innebär i regel snabba och relativt lättolkade resultat, men också att det ekologiska samspelet mellan olika organismer i miljön ignoreras. För att inkludera interaktioner mellan olika organismer gjordes därför alla tester på så kallade perifytonsamhällen. Perifyton är mikrobiella biofilmer som bland annat består av mikroalger, bakterier och protozoer och de koloniserar alla ytor nedsänkta i till exempel havet. De perifytonsamhällen som användes i studierna hade koloniserat och växt på små glasplattor som antingen hängts ut i Gullmarsfjorden (publikation I & II) eller på långsidorna av akvarier igenom vilka vatten från Gullmarsfjorden ständigt pumpades parallellt med en triklosanlösning (publikation III & IV). Perifytonsamhällen utför viktiga funktioner som till exempel fotosyntes och nedbrytning samtidigt som de ständigt konkurrerar om plats och näringsämnen. Eftersom mikroorganismerna är snabbväxande leder en förändring i yttre faktorer, som till exempel ljus, näring och temperatur, till en snabb ekologisk succession. Det betyder att samhällsstrukturen förändras när de olika organismerna tillväxer
53
och omgivningen förändras. Om ett samhälle utsätts för ett bakeridödande ämne resulterar även det i att de mest känsliga organismerna konkurreras ut, till fördel för mer toleranta organismer. Detta kallas Toxicant Induced Succession (TIS) och resulterar i ett samhälle med högre tolerans mot det specifika ämnet som inducerade den ekologiska successionen, ett fenomen som benämns Pollution-Induced Community Tolerance (PICT). En klassisk PICT-studie består av två faser, selektions- och detektionsfasen. Under selektionsfasen genomgår ett samhälle en ekologisk succession mot mer toleranta organismer genom att de känsliga konkurreras ut (TIS). Genom att mäta känsligheten för det selekterande ämnet, triklosan i det här fallet, hos ett exponerat samhälle och jämföra det med ett opåverkat kontrollsamhälle kan skillnaden i tolerans beskrivas. Detta görs i detektionsfasen och utförs helst med ett korttidstest. Att detektionsfasen är kort är viktigt för att ingen ytterligare selektion ska förvanska PICT-signalen. Men för många ämnen, till exempel ciprofloxacin och sulfametoxazol, finns inga fungerande korttidstest då de endast påverkar bakterier över längre tid. Därför finns ett behov att använda tester över längre tid. Att undersöka PICT med hjälp av ett långtidstest var därför ett ytterligare mål med denna avhandling. Exponering över lång tid kan dessutom leda till en ökad tolerans mot andra ämnen som påverkar bakterier med likande verkningsmekanismer eller för vilka det finns gemensamma mekanismer för avgiftning. Att ett ämne leder till tolerans för ett annat kallas för ko-tolerans och har också studerats i den här avhandlingen. Studierna i min avhandling visar att ciprofloxacin och sulfametoxazol påverkar hur väl bakterierna i de testade perifytonsamhällena kan tillgodogöra sig olika kolkällor (publikation I&IV). Desto högre koncentration av ciprofloxacin och sulfametoxazol desto sämre tillgodogör sig bakterierna de erbjudna kolkällorna. Ciprofloxacin påverkar dessutom vilka kolkällor ett samhälle kan bryta ner, vilket indikerar ett samhällskifte. I motsatts påverkas inte mikroalger negativt av varken ciprofloxacin eller sulfametoxazol. Trots att triklosan är en antibakteriell substans påverkades bakterierna i biofilmerna aldrig negativt (publikation II-IV). Istället stimuleras deras förmåga att bryta ner kolkällor. Varför detta sker är oklart men det kan till exempel bero på en minskad konkurrens med alger om yta eller ett ökat utsläpp av kolhydrater från alger. Det visade sig nämligen att triklosan istället påverkade mikroalgerna i alla studier, men på lite olika sätt. Det första försöket gjordes på färdiga perifytonsamhällen från Gullmarsfjorden. Samhällena exponerades för triklosan under fyra dagar och inga nya alger kunde ersätta de gamla under tiden. Här sågs en tydlig negativ effekt, triklosan är giftigt för mikroalger (publikation II). I ett andra försök pumpades vatten från Gullmarsfjorden in i akvarier under 18 dagar parallellt med triklosanlösning (publikation III). Med det inkommande vattnet följde mikroorganismer som bildade perifytonsamhällen inuti akvarierna. Här sågs
54

en motsatt effekt, algerna växte bättre med ökad triklosankoncentration. Det betyder inte att mikroalger växer bättre tack vare triklosan utan skillnaden mot det första försöket beror på att nya toleranta organismer tillförts med det inkommande vattnet och växt till under experimentets gång, samtidigt som de känsliga har konkurrerats ut. Detta styrks genom att de samhällen som utsatts för triklosan över 18 dagar var mer toleranta (PICT) och kunde tåla högre halter triklosan i ett uppföljande korttidstest (1 timme). Den sista studien (publikation IV) gjordes på samhällen som växt 10 dagar i akvariesystemet som nämnts ovan. PICT och ko-tolerans analyserades med hjälp av ett fyra dagar långt test. Även med hjälp av en längre detektionsfas kunde en tydlig PICT detekteras. Det innebär att metoder med längre exponeringstid kan användas för att detektera PICT för de substanser där inga kortidsmetoder finns att tillgå. Eftersom endast en triklosan koncentration användes vid selektionsfasen är det ett naturligt steg för uppföljande experiment att undersöka om långtidsstudier kan visa en PICT-signal vid lika låga koncentration som för ett korttidstest. Eftersom triklosan aldrig påverkade bakterier negativt och ciprofloxacin eller sulfametoxazol inte påverkade alger så är det inte möjligt att påvisa någon ko-tolerans för varken bakterier eller alger i perifytonsamhällena. Men en 10 dagar lång exponering för triklosan resulterade i en ökad tolerans hos bakterier mot ciprofloxacin vilket ger en tydlig indikation på att triklosan faktiskt påverkar bakterierna. Framtida studier behövs dock för att beskriva det i större detalj. Sammanfattningsvis visar studierna i publikation I-IV att ciprofloxacin, sulfametoxazol och triklosan påverkar marina mikroorganismsamhällen negativt men på grund av bristande kunskap om vilka koncentrationer som finns i havet går det inte att göra en tillfredställande riskbedömning. Det finns därför ett behov av fler analysstudier av bakteriedödande ämnen i våra kustnära vatten.
55

Acknowledgements I would first like to thank the following organizations for their finanzial support to this research: The EU Commission FP7 project PHARMAS (contract 265346), the Swedish Research Council (FORMAS) projects NICE (2011-1733) and INTERACT (2012-86), Adlerbertska Stipendiestiftelsen, Stiftelsen Paul och Marie Berghaus donationsfond and finally Stiftelsen Birgit och Birger Wåhlströms minnesfond för den bohuslänska havs- och insjömiljön. Tjoho, det gick! Och kul var det, oftast. Att det varit roligt är främst tack vare alla de som varit delaktiga i att producera denna avhandling genom handledning, stöd, tips, kaffe, glada rop, ett och annat bus och ännu mer kaffe. Alla förtjänar ett stort tack. Först och främst mina två handledare: Thomas, thank you for all interesting and constructive discussions on how to set up experiments, analyze data, write a text and everything else included in producing this thesis. You usually have a cunning plan on how to proceed to something much better than I had imagined. It amazes me that you always have managed to find time to discuss a problem, even when you were on a conference in land far away. It has been a pleasure and I have learnt a lot! Martin, du har inte bara visat hur man hittar till kalvhagefjorden och hur man tämjer flödesmaskinen utan även en hel massa annat i hantverket vetenskap. Tack! Konstigt nog kommer jag nog snart börja drömma om att stå på en vinglig stege och mäta vattenflöden långt efter läggdags. Det var rätt kul ändå… Hans, utöver din roll som examinator har du även varit en källa till nya tankar och uppslag och jag är glad att du introducerat så många koncept och idéer som jag aldrig skulle fått höra talas om annars. Du är dessutom en av de få jag känner som skulle kunna göra en lysande karriär i att sanera minkbon. Malin, tack för ditt fina stöd som examinator i slutet av det här projektet.
Åsa, gruppens klippa. Det skulle varit mycket svårare och klart tråkigare att komma fram till den här boken om inte du funnits för att stötta, svara på frågor om både det ena och det andra, och styra mot ordning och reda på labb, i projekten och på kurs. Mikael, du är en fantastisk rumskamrat, både på kontoret och runt om i världen. Du är dessutom en fantastisk hjälp när det kommer till att lura Excel på några timmars onödigt arbete eller att förklara något obskyrt regelverk. Tror tyvärr inte att så mycket fastande men det var trevligt. Jenny och Johanna, ni är helt enkelt bäst. Den portionsförpackade presentlasagnen är bland det bästa jag fått! Tack för maten, fikat, hejaropen och sällskapet. Ida, du introducerade en förvirrad nybliven doktorand till Kristineberg och förklarade hur allt fungerade. Stället blev aldrig riktigt sig likt när du inte var kvar under fältsäsongen. Sara och Tobias, ni visade mig hur roligt man kan ha, både på labb och i fikarummet och jag tar med mig alla era labbparanojjor. Har dessutom sett till att skaffa ett par egna längs vägen. Marianne, Triranta, Kemal, Maria, Alexander, Viktor: Thanks for a very nice time!
56

Tack alla kollegor på botan för en trevlig tid och många spännande fikadiskussioner. Monica, Mats och Erik, utan er hjälp med HPLCerna hade jag nog inte kommit någonstans. Och Sven, du är helt enkelt ovärderlig.
Fältsäsongerna hade inte varit lika trevliga utan alla personer på Kristineberg. Tack för all hjälp och alla skratt.
Tack alla vänner som har kommit med glada upptåg, barnpassning och stöd i största allmänhet. Framförallt har ni sett till att fylla min fritid. Ni är grymma och jag kommer äntligen ha tid att umgås med er igen.
Min familj har slutligen utgjort ett fantastiskt stöd som hela tiden peppat, hjälpt till på alla sätt och vis, och fixat så att livet utanför ekotoxikologin har gått ihop. Tack mamma, pappa, Micke, Lisa, Chicki, Göran, utan er hade det inte gått.
Emma och Jakob, ni har stått ut med att jag varit bortrest, frånvarande i grubblerier och att jag jobbat långa dagar på labb och med avhandlingen. Ni har dessutom på ett nästan mirakulöst sätt lyckats få mig att glömma bort avhandlingen när det som mest behövts och istället fokusera på det som är viktigast i livet, nämligen er två. Tack! Nu kommer vi äntligen att få ha kvällar och helger ihop igen.
57
References Acar, J. F., & Goldstein, F. W. (1997). Trends in bacterial resistance to
fluoroquinolones. Clinical Infectious Diseases: An Official Publication of the Infectious Diseases Society of America, 24 Suppl 1, S67–73.
Al Aukidy, M., Verlicchi, P., Jelic, A., Petrovic, M., & Barcelò, D. (2012). Monitoring release of pharmaceutical compounds: occurrence and environmental risk assessment of two WWTP effluents and their receiving bodies in the Po Valley, Italy. The Science of the Total Environment, 438(null), 15–25. doi:10.1016/j.scitotenv.2012.08.061
Al-Ahmad, A., Daschner, F. D., & Kümmerer, K. (1999). Biodegradability of Cefotiam, Ciprofloxacin, Meropenem, Penicillin G, and Sulfamethoxazole and Inhibition of Waste Water Bacteria. Archives of Environmental Contamination and Toxicology, 37(2), 158–163. doi:10.1007/s002449900501
Australian Government, & Department of health and ageing. (2009). Triclosan, Priority Existing Chemical, Assessment Report No. 30.
Azim, M. E., & Asaeda, T. (2005). Periphyton Structure, Diveristy and Colonization. In M. E. Azim, M. C. J. Verdegem, A. van Dam, & M. C. M. Beveridge (Eds.), Periphyton: Ecology, Exploitation and Management (pp. 15–33). CABI Publishing. doi:0-85199-096-7
Azim, M. E., Beveridge, M. C. M., van Dam, A. ., & Verdegem, M. C. J. (2005). Periphyton and Aquatic Production: an Introduction. In M. E. Azim, M. C. J. Verdegem, A. . van Dam, & M. C. M. Beveridge (Eds.), Periphyton: Ecology, Exploitation and Management (pp. 1–13). CABI Publishing.
Backhaus, T., Porsbring, T., Arrhenius, A., Brosche, S., Johansson, P., & Blanck, H. (2011). Single-substance and mixture toxicity of five pharmaceuticals and personal care products to marine periphyton communities. Environmental Toxicology and Chemistry / SETAC, 30(9), 2030–40. doi:10.1002/etc.586
Baran, W., Adamek, E., Ziemiańska, J., & Sobczak, A. (2011). Effects of the presence of sulfonamides in the environment and their influence on human health. Journal of Hazardous Materials, 196, 1–15. doi:10.1016/j.jhazmat.2011.08.082
Barnes, K. K., Kolpin, D. W., Meyer, M. T., Thumarn, E. M., Furlong, E. T., Zaugg, S. D., & Barber, L. B. (2002). Water-Quality Data for Pharmaceuticals, Hormones, and Other Organic Wastewater Contaminants in U.S. Streams, 1999-2000. US Geological Survey USGS Open-File Report 02-94. Retrieved April 02, 2014, from http://toxics.usgs.gov/pubs/OFR-02-94/
Bartelt-Hunt, S. L., Snow, D. D., Damon, T., Shockley, J., & Hoagland, K. (2009). The occurrence of illicit and therapeutic pharmaceuticals in wastewater effluent and surface waters in Nebraska. Environmental Pollution (Barking, Essex : 1987), 157(3), 786–791. doi:10.1016/j.envpol.2008.11.025
58
Batt, A. L., Bruce, I. B., & Aga, D. S. (2006). Evaluating the vulnerability of surface waters to antibiotic contamination from varying wastewater treatment plant discharges. Environmental Pollution, 142(2), 295–302.
Bedoux, G., Roig, B., Thomas, O., Dupont, V., & Le Bot, B. (2012). Occurrence and toxicity of antimicrobial triclosan and by-products in the environment. Environmental Science and Pollution Research International, 19(4), 1044–65. doi:10.1007/s11356-011-0632-z
Blanck, H. (2002). A Critical Review of Procedures and Approaches Used for Assessing Pollution-Induced Community Tolerance (PICT) in Biotic Communities. Human and Ecological Risk Assessment: An International Journal, 8(5), 1003–1034. doi:10.1080/1080-700291905792
Blanck, H., & Wängberg, S.-Å. (1988a). Induced Community Tolerance in Marine Periphyton established under Arsenate Stress. Canadian Journal of Fisheries and Aquatic Sciences, 45(10), 1816–1819. doi:10.1139/f88-213
Blanck, H., & Wängberg, S.-Å. (1988b). Validity of an Ecotoxicological Test System: Short-Term and Long-Term Effects of Arsenate on Marine Periphyton Communities in Laboratory Systems. Canadian Journal of Fisheries and Aquatic Sciences, 45(10), 1807–1815. doi:10.1139/f88-212
Boxall, A. B. A. (2004). The environmental side effects of medication, EMBO reports 5(12), 1110–1116.
Boxall, A. B. A., Rudd, M. A., Brooks, B. W., Caldwell, D. J., Choi, K., Hickmann, S., … Beazley, K. F. (2012). Pharmaceuticals and Personal Care Products in the Environment: What Are the Big Questions?, Environmental Health Perspectives 120(9), 1221–1229.
Brain, R. A., Johnson, D. J., Richards, S. M., Sanderson, H., Sibley, P. K., & Solomon, K. R. (2004). Effects of 25 pharmaceutical compounds to Lemna gibba using a seven-day static-renewal test. Environmental Toxicology and Chemistry, 23(2), 371–382.
Brausch, J. M., & Rand, G. M. (2011). A review of personal care products in the aquatic environment: environmental concentrations and toxicity. Chemosphere, 82(11), 1518–1532. doi:10.1016/j.chemosphere.2010.11.018
Bueno, M. J. M., Agüera, A., Gómez, M. J., Hernando, M. D., García-Reyes, J. F., & Fernandez-Alba, A. R. (2007). Application of liquid chromatography/quadrupole-linear Ion trap mass spectrometry and time-of-flight mass spectrometry to the determination of pharmaceuticals and related contaminants in wastewater. Analytical Chemistry, 79(24), 9372–9384.
Cabello, F. C., Godfrey, H. P., Tomova, A., Ivanova, L., Dölz, H., Millanao, A., & Buschmann, A. H. (2013). Antimicrobial use in aquaculture re-examined: its relevance to antimicrobial resistance and to animal and human health. Environmental Microbiology, 15(7), 1917–42. doi:10.1111/1462-2920.12134
Capdevielle, M., Van Egmond, R., Whelan, M., Versteeg, D., Hofmann-kamensky, M., Inauen, J., … Woltering, D. (2008). Consideration of exposure and species sensitivity of triclosan in the freshwater environment. Integrated Environmental Assessment and Management, 4(1), 15–23.
59

Castiglioni, S., Bagnati, R., Fanelli, R., Pomati, F., Calamari, D., & Zuccato, E. (2006). Removal of pharmaceuticals in sewage treatment plants in Italy. Environmental Science & Technology, 40(1), 357–63.
Clarke, K. R. (1993). Non-parametric multivariate analyses of changes in community structure, (1988), 117–143.
Clements, W., & Rohr, J. (2009). Community responses to contaminants: using basic ecological principles to predict ecotoxicological effects. Environmental Toxicology and …, 28(9), 1789–1800.
Córdova-Kreylos, A. L., & Scow, K. M. (2007). Effects of ciprofloxacin on salt marsh sediment microbial communities. The ISME Journal, 1(7), 585–95. doi:10.1038/ismej.2007.71
DeLorenzo, M. E., & Fleming, J. (2008). Individual and mixture effects of selected pharmaceuticals and personal care products on the marine phytoplankton species Dunaliella tertiolecta. Archives of Environmental Contamination and Toxicology, 54(2), 203–10. doi:10.1007/s00244-007-9032-2
Dinh, Q. T., Alliot, F., Moreau-Guigon, E., Eurin, J., Chevreuil, M., & Labadie, P. (2011). Measurement of trace levels of antibiotics in river water using on-line enrichment and triple-quadrupole LC-MS/MS. Talanta, 85(3), 1238–1245. doi:10.1016/j.talanta.2011.05.013
Drury, B., Scott, J., Rosi-Marshall, E. J., & Kelly, J. J. (2013). Triclosan exposure increases triclosan resistance and influences taxonomic composition of benthic bacterial communities. Environmental Science & Technology, 47(15), 8923–30. doi:10.1021/es401919k
Dye, C., Schlabach, M., Green, J., Remberger, M., Kaj, L., Palm-Cousins, A., & Broström-Lundén, E. (2007). Bronopol, Resorcinol, m-Cresol and Triclosan in the Nordic Environment, Report for the Nordic Council of Ministers, Copenhagen 2007, ISBN 978-92-893-1573-9.
Eriksson, K. M., Antonelli, a, Nilsson, R. H., Clarke, a K., & Blanck, H. (2009). A phylogenetic approach to detect selection on the target site of the antifouling compound irgarol in tolerant periphyton communities. Environmental Microbiology, 11(8), 2065–77. doi:10.1111/j.1462-2920.2009.01928.x
European Medicines Agency (EMA). Guideline On The Environmental Risk Assessment Of Medicinal Products For Human Use (2006).
Fernández, C., González-Doncel, M., Pro, J., Carbonell, G., & Tarazona, J. V. (2010). Occurrence of pharmaceutically active compounds in surface waters of the henares-jarama-tajo river system (madrid, spain) and a potential risk characterization.
Ferrari, B., Mons, R., Vollat, B., Fraysse, B., Paxéus, N., Lo Giudice, R., … Garric, J. (2004). Environmental risk assessment of six human pharmaceuticals: Are the current environmental risk assessment procedures sufficient for the protection of the aquatic environment? Environmental Toxicology and Chemistry / SETAC, 23(5), 1344–1354.
60
Fick, J., Söderström, H., Lindberg, R. H., Phan, C., Tysklind, M., & Larsson, D. G. J. (2009). Contamination of surface, ground, and drinking water from pharmaceutical production. Environmental Toxicology and Chemistry / SETAC, 28(12), 2522–7. doi:10.1897/09-073.1
Focazio, M. J., Kolpin, D. W., Barnes, K. K., Furlong, E. T., Meyer, M. T., Zaugg, S. D., … Thurman, M. E. (2008). A national reconnaissance for pharmaceuticals and other organic wastewater contaminants in the United States--II) untreated drinking water sources. The Science of the Total Environment, 402(2-3), 201–16. doi:10.1016/j.scitotenv.2008.02.021
Franz, S., Altenburger, R., Heilmeier, H., & Schmitt-Jansen, M. (2008). What contributes to the sensitivity of microalgae to triclosan? Aquatic Toxicology (Amsterdam, Netherlands), 90(2), 102–8. doi:10.1016/j.aquatox.2008.08.003
Garland, J. L. (2006). Analysis and interpretation of community-level physiological profiles in microbial ecology. FEMS Microbiology Ecology, 24(4), 289–300. doi:10.1111/j.1574-6941.1997.tb00446.x
Glassmeyer, S. T., Furlong, E. T., Kolpin, D. W., Cahill, J. D., Zaugg, S. D., Werner, S. L., … Kryak, D. D. (2005). Transport of Chemical and Microbial Compounds from Known Wastewater Discharges: Potential for Use as Indicators of Human Fecal Contamination. Environmental Science & Technology, 39(14), 5157–5169. doi:10.1021/es048120k
Halden, R. U., & Paull, D. H. (2005). Co-occurrence of triclocarban and triclosan in U.S. water resources. Environmental Science & Technology, 39(6), 1420–6.
Halling-Sørensen, B., Lützhøft, H. C., Andersen, H. R., & Ingerslev, F. (2000). Environmental risk assessment of antibiotics: comparison of mecillinam, trimethoprim and ciprofloxacin. The Journal of Antimicrobial Chemotherapy, 46 Suppl 1, 53–8; discussion 63–5.
He, X., Wang, Z., Nie, X., Yang, Y., Pan, D., Leung, A. O. W., … Chen, K. (2012). Residues of fluoroquinolones in marine aquaculture environment of the Pearl River Delta, South China. Environmental Geochemistry and Health, 34(3), 323–35. doi:10.1007/s10653-011-9420-4
Hirsch, R., Ternes, T., Haberer, K., & Kratz, K.-L. (1999). Occurrence of antibiotics in the aquatic environment. The Science of the Total Environment, 225(1-2), 109–118.
Hoagland, K., Roemer, S., & Rosowski, J. (1982). Colonization and community structure of two periphyton assemblages, with emphasis on the diatoms (Bacillariophyceae). American Journal of Botany, 69(2), 188–213.
Isidori, M., Lavorgna, M., Nardelli, A., Pascarella, L., & Parrella, A. (2005). Toxic and genotoxic evaluation of six antibiotics on non-target organisms. The Science of the Total Environment, 346(1-3), 87–98. doi:10.1016/j.scitotenv.2004.11.017
Jeffrey, S. w., Mantoura, R. F. C., & Wright, S. W. (1997). Phytoplankton pigments in oceanography. (S. w. Jeffrey, R. F. C. Mantoura, & S. W. Wright, Eds.). Paris: UNESCO.
61

Kantiani, L., Farré, M., Asperger, D., Rubio, F., González, S., López de Alda, M. J., … Barceló, D. (2008). Triclosan and methyl-triclosan monitoring study in the northeast of Spain using a magnetic particle enzyme immunoassay and confirmatory analysis by gas chromatography–mass spectrometry. Journal of Hydrology, 361(1-2), 1–9. doi:10.1016/j.jhydrol.2008.07.016
Keller, V.D.J., Whelan, M.J., Rees, H.G. (2006). A global assessment of chemical effluent dilution capacities from a macro-scale hydrological model. IAHS-AISH Publ., 586e590.
Kim, Y., Choi, K., Jung, J., Park, S., Kim, P.-G., & Park, J. (2007, April). Aquatic toxicity of acetaminophen, carbamazepine, cimetidine, diltiazem and six major sulfonamides, and their potential ecological risks in Korea. Environment International. doi:10.1016/j.envint.2006.11.017
Kolpin, D. W., Furlong, E. T., Meyer, M. T., Thurman, E. M., Zaugg, S. D., Barber, L. B., & Buxton, H. T. (2002). Pharmaceuticals, Hormones, and Other Organic Wastewater Contaminants in U.S. Streams, 1999−2000: A National Reconnaissance. Environmental Science & Technology, 36(6), 1202–1211. doi:10.1021/es011055j
Kolpin, D. W., Skopec, M., Meyer, M. T., Furlong, E. T., & Zaugg, S. D. (2004). Urban contribution of pharmaceuticals and other organic wastewater contaminants to streams during differing flow conditions. The Science of the Total Environment, 328(1-3), 119–30. doi:10.1016/j.scitotenv.2004.01.015
Kumar, K. S., Priya, S. M., Peck, A. M., & Sajwan, K. S. (2010). Mass loadings of triclosan and triclocarbon from four wastewater treatment plants to three rivers and landfill in Savannah, Georgia, USA. Archives of Environmental Contamination and Toxicology, 58(2), 275–85. doi:10.1007/s00244-009-9383-y
Kümmerer, K. (2009). Antibiotics in the aquatic environment--a review--part I. Chemosphere, 75(4), 417–34. doi:10.1016/j.chemosphere.2008.11.086
Kümmerer, K., Al-Ahmad, A., & Mersch-Sundermann, V. (2000). Biodegradability of some antibiotics, elimination of the genotoxicity and affection of wastewater bacteria in a simple test. Chemosphere, 40, 701–710.
Kümmerer, K., Alexy, R., Hüttig, J., & Schöll, A. (2004). Standardized tests fail to assess the effects of antibiotics on environmental bacteria. Water Research, 38(8), 2111–2116.
Lawrence, J. R., Zhu, B., Swerhone, G. D. W., Roy, J., Wassenaar, L. I., Topp, E., & Korber, D. R. (2009). Comparative microscale analysis of the effects of triclosan and triclocarban on the structure and function of river biofilm communities. The Science of the Total Environment, 407(10), 3307–16. doi:10.1016/j.scitotenv.2009.01.060
Levy, C. W., Roujeinikova, a, Sedelnikova, S., Baker, P. J., Stuitje, a R., Slabas, a R., … Rafferty, J. B. (1999). Molecular basis of triclosan activity. Nature, 398(6726), 383–4. doi:10.1038/18803
62

Lima, S. A. C., Raposo, M. F. J., Castro, P. M. L., & Morais, R. M. (2004). Biodegradation of p-chlorophenol by a microalgae consortium. Water Research, 38(1), 97–102. doi:10.1016/j.watres.2003.09.005
Lindberg, R., Jarnheimer, P.-A., Olsen, B., Johansson, M., & Tysklind, M. (2004). Determination of antibiotic substances in hospital sewage water using solid phase extraction and liquid chromatography/mass spectrometry and group analogue internal standards. Chemosphere, 57(10), 1479–88. doi:10.1016/j.chemosphere.2004.09.015
Lindström, A., Buerge, I. J., Poiger, T., Bergqvist, P.-A., Müller, M. D., & Buser, H.-R. (2002). Occurrence and environmental behavior of the bactericide triclosan and its methyl derivative in surface waters and in wastewater. Environmental Science & Technology, 36(11), 2322–2329.
Locatelli, M. A. F., Sodré, F. F., & Jardim, W. F. (2011). Determination of antibiotics in Brazilian surface waters using liquid chromatography-electrospray tandem mass spectrometry. Archives of Environmental Contamination and Toxicology, 60(3), 385–93. doi:10.1007/s00244-010-9550-1
Lygre, H., Moe, G., Skalevik, R., & Holmsen, H. (2003). Interaction of triclosan with eukaryotic membrane lipids. European Journal of Oral Sciences, 111(3), 216–222. doi:10.1034/j.1600-0722.2003.00034.x
Lyndall, J., Fuchsman, P., Bock, M., Barber, T., Lauren, D., Leigh, K., … Capdevielle, M. (2010). Probabilistic risk evaluation for triclosan in surface water, sediments, and aquatic biota tissues. Integrated Environmental Assessment and Management, 6(3), 419–40. doi:10.1897/IEAM_2009-072.1
Martins, N., Pereira, R., Abrantes, N., Pereira, J., Goncalves, F., & Marques, C. R. (2012). Ecotoxicological effects of ciprofloxacin on freshwater species: data integration and derivation of toxicity thresholds for risk assessment. Ecotoxicology, 21(4), 1167–1176. doi:10.1007/s10646-012-0871-x
Maul, J. D., Schuler, L. J., Belden, J. B., Whiles, M. R., & Lydy, M. J. (2006). Effects of the antibiotic ciprofloxacin on stream microbial communities and detritivorous macroinvertebrates. Environmental Toxicology and Chemistry / SETAC, 25(6), 1598–606.
Maxwell, K., & Johnson, G. N. (2000). Chlorophyll fluorescence--a practical guide. Journal of Experimental Botany, 51(345), 659–68.
McLeod, R., Muench, S. P., Rafferty, J. B., Kyle, D. E., Mui, E. J., Kirisits, M. J., … Rice, D. W. (2001). Triclosan inhibits the growth of Plasmodium falciparum and Toxoplasma gondii by inhibition of apicomplexan Fab I. International Journal for Parasitology, 31(2), 109–13.
McMurry, L. M., Oethinger, M., & Levy, S. B. (1998). Triclosan targets lipid synthesis. Nature, 394(6693), 531–2. doi:10.1038/28970
Meade, M. J., Waddell, R. L., & Callahan, T. M. (2001). Soil bacteria Pseudomonas putida and Alcaligenes xylosoxidans subsp . denitri ¢ cans inactivate triclosan in liquid and solid substrates, 204, 45–48.
63

Milstein, A. (2005). Effect of Periphyton on Water Quality. In M. E. Azim, M. C. J. Verdegem, A. . van Dam, & M. C. M. Beveridge (Eds.), Periphyton: Ecology, Exploitation and Management (pp. 179–190). CABI Publishing.
Müller, A. K., Rasmussen, L. D., & Sorensen, S. J. (2001). Adaptation of the bacterial community to mercury contamination. FEMS Microbiology Letters, 204(1), 49–53. doi:10.1111/j.1574-6968.2001.tb10861.x
Näslund, J., Hedman, J. E., & Agestrand, C. (2008). Effects of the antibiotic ciprofloxacin on the bacterial community structure and degradation of pyrene in marine sediment. Aquatic Toxicology (Amsterdam, Netherlands), 90(3), 223–7. doi:10.1016/j.aquatox.2008.09.002
Neu, H. C. (1993). The Crisis in Antibiotic Resistance, 257. Newton, A. P. N., Cadena, S. M. S. C., Rocha, M. E. M., Carnieri, E. G. S., &
Martinelli de Oliveira, M. B. (2005). Effect of triclosan (TRN) on energy-linked functions of rat liver mitochondria. Toxicology Letters, 160(1), 49–59. doi:10.1016/j.toxlet.2005.06.004
Nietch, C. T., Quinlan, E. L., Lazorchak, J. M., Impellitteri, C. a, Raikow, D., & Walters, D. (2013). Effects of a chronic lower range of triclosan exposure on a stream mesocosm community. Environmental Toxicology and Chemistry / SETAC, 32(12), 2874–87. doi:10.1002/etc.2385
Ort, C., Siegrist, H., (2009). Assessing wastewater dilution in small rivers with high resolution conductivity probes. Water Science and Technology, 59(8), 1593‐1601
Orvos, D. R., Versteeg, D. J., Inauen, J., Capdevielle, M., Rothenstein, A., & Cunningham, V. (2002). Aquatic toxicity of triclosan. Environmental Toxicology and Chemistry / SETAC, 21(7), 1338–49.
Peng, X., Yu, Y., Tang, C., Tan, J., Huang, Q., & Wang, Z. (2008). Occurrence of steroid estrogens, endocrine-disrupting phenols, and acid pharmaceutical residues in urban riverine water of the Pearl River Delta, South China. The Science of the Total Environment, 397(1-3), 158–66. doi:10.1016/j.scitotenv.2008.02.059
Porsbring, T. (2009). On toxicant-induced succession in periphyton communities: effects of single chemicals and chemical mixtures. Gothenburg: University of Gothenburg, Faculty of Science, Department of Plant and Environmental Sciences.
Porsbring, T., Arrhenius, Å., Backhaus, T., Kuylenstierna, M., Scholze, M., & Blanck, H. (2007). The SWIFT periphyton test for high-capacity assessments of toxicant effects on microalgal community development. Journal of Experimental Marine Biology and Ecology, 349(2), 299–312. doi:10.1016/j.jembe.2007.05.020
Porsbring, T., Blanck, H., Tjellström, H., & Backhaus, T. (2009). Toxicity of the pharmaceutical clotrimazole to marine microalgal communities. Aquatic Toxicology (Amsterdam, Netherlands), 91(3), 203–11. doi:10.1016/j.aquatox.2008.11.003
64

Preston-Mafham, J., Boddy, L., & Randerson, P. F. (2002). Analysis of microbial community functional diversity using sole-carbon-source utilisation profiles - a critique. FEMS Microbiology Ecology, 42(1), 1–14. doi:10.1111/j.1574-6941.2002.tb00990.x
Quinn, G. P., & Keough, M. J. (2002). Introduction to multivariate analyses. In Experimental design and data analysis for biologists (pp. 401–424). Cambridge University Press.
Robinson, A. a, Belden, J. B., & Lydy, M. J. (2005). Toxicity of fluoroquinolone antibiotics to aquatic organisms. Environmental Toxicology and Chemistry / SETAC, 24(2), 423–30.
Rohr, J. R., Kerby, J. L., & Sih, A. (2006). Community ecology as a framework for predicting contaminant effects. Trends in Ecology & Evolution, 21(11), 606–13. doi:10.1016/j.tree.2006.07.002
Rutgers, M., Verlaat, I. M. van’t, Wind, B., Posthuma, L., & Breure, A. M. (1998). Rapid method for assessing pollution-induced community tolerance in contaminated soil. Environmental Toxicology and Chemistry, 17(11), 2210–2213. doi:10.1002/etc.5620171111
Sahinkaya, E., & Dilek, F. B. (2009). The growth behavior of Chlorella vulgaris in the presence of 4-chlorophenol and 2,4-dichlorophenol. Ecotoxicology and Environmental Safety, 72(3), 781–6. doi:10.1016/j.ecoenv.2007.11.014
Samsøe-Petersen, L., Winther-nielsen, M., & Madsen, T. (2003). Fate and Effects of Triclosan. Environmental Project No. 861. Danish Environmental Protection Agency, Copenhagen.
Santos, L. H. M. L. M., Araújo, a N., Fachini, A., Pena, a, Delerue-Matos, C., & Montenegro, M. C. B. S. M. (2010). Ecotoxicological aspects related to the presence of pharmaceuticals in the aquatic environment. Journal of Hazardous Materials, 175(1-3), 45–95. doi:10.1016/j.jhazmat.2009.10.100
SCCS, (Scientific Committee on Consumer Safety). (2010). Opinion on triclosan (antimicrobial resistance). doi:10.2772/11162
SCENIHR, (Scientific Committee on Emerging and Newly Identified Health Risks). (2009). Scientific Committee on Emerging and Newly Identified Health Risks SCENIHR Assessment of the Antibiotic Resistance Effects of Biocides, (January).
Schmitt, H., Martinali, B., Van Beelen, P., & Seinen, W. (2006). On the limits of toxicant-induced tolerance testing: cotolerance and response variation of antibiotic effects. Environmental Toxicology and Chemistry / SETAC, 25(7), 1961–8.
SWEDRES-SVARM. (2012). Use of antimicrobials and occurrence of antimicrobial resistance in Sweden. Solna/Uppsala ISSN 1650-6332.
Tabak, M., Scher, K., Chikindas, M. L., & Yaron, S. (2009). The synergistic activity of triclosan and ciprofloxacin on biofilms of Salmonella Typhimurium. FEMS Microbiology Letters, 301(1), 69–76. doi:10.1111/j.1574-6968.2009.01804.x
65
Tabak, M., Scher, K., Hartog, E., Romling, U., Matthews, K. R., Chikindas, M. L., & Yaron, S. (2007). Effect of triclosan on Salmonella typhimurium at different growth stages and in biofilms. FEMS Microbiology Letters, 267(2), 200–6. doi:10.1111/j.1574-6968.2006.00547.x
Van Bambeke, F., Michot, J.-M., Van Eldere, J., & Tulkens, P. M. (2005). Quinolones in 2005: an update. Clinical Microbiology and Infection : The Official Publication of the European Society of Clinical Microbiology and Infectious Diseases, 11(4), 256–80. doi:10.1111/j.1469-0691.2005.01131.x
Van Dam, A. A., Beveridge, M. C. M., Azim, M. E., & Verdegem, M. C. J. (2002). The potential of fish production based on periphyton. Reviews in Fish Biology and Fisheries, 12, 1–31.
Villalaín, J., Mateo, C. R., Aranda, F. J., Shapiro, S., & Micol, V. (2001). Membranotropic effects of the antibacterial agent Triclosan. Archives of Biochemistry and Biophysics, 390(1), 128–36. doi:10.1006/abbi.2001.2356
Wheeler, J. R., Grist, E. P. M., Leung, K. M. Y., Morritt, D., & Crane, M. (2002). Species sensitivity distributions : data and model choice, 45, 192–202.
Wilson, B. a, Smith, V. H., DeNoyelles, F., & Larive, C. K. (2003). Effects of three pharmaceutical and personal care products on natural freshwater algal assemblages. Environmental Science & Technology, 37(9), 1713–1719.
Wise, R. (2002). Leading articles Antimicrobial resistance : priorities for action, 585–586.
Yang, L.-H., Ying, G.-G., Su, H.-C., L Stauber, J., S Adams, M., & T Binet, M. (2008). Growth-inhibiting effects of 12 antibacterial agents and their mixtures on the freshwater microalga Pseudokirchneriella subcapitata. Environmental Toxicology and Chemistry, 27(5), 1201–1208.
Yang, L.-H., Ying, G.-G., Su, H.-C., Stauber, J. L., Adams, M. S., & Binet, M. T. (2008). Growth-inhibiting effects of 12 antibacterial agents and their mixtures on the freshwater microalga Pseudokirchneriella subcapitata. Environmental Toxicology and Chemistry / SETAC, 27(5), 1201–8. doi:10.1897/07-471.1
Yergeau, E., Lawrence, J. R., Waiser, M. J., Korber, D. R., & Greer, C. W. (2010). Metatranscriptomic analysis of the response of river biofilms to pharmaceutical products, using anonymous DNA microarrays. Applied and Environmental Microbiology, 76(16), 5432–9. doi:10.1128/AEM.00873-10
Yergeau, E., Sanschagrin, S., Waiser, M. J., Lawrence, J. R., & Greer, C. W. (2012). Sub-inhibitory concentrations of different pharmaceutical products affect the meta-transcriptome of river biofilm communities cultivated in rotating annular reactors. Environmental Microbiology Reports, 4(3), 350–9. doi:10.1111/j.1758-2229.2012.00341.x
Young, T. A., Heidler, J., Matos-Pérez, C. R., Sapkota, A., Toler, T., Gibson, K. E., … Halden, R. U. (2008). Ab Initio and in Situ Comparison of Caffeine, Triclosan, and Triclocarban as Indicators of Sewage-Derived Microbes in Surface Waters. Environmental Science & Technology, 42(9), 3335–3340. doi:10.1021/es702591r
66

Zhanel, G. G., Ennis, K., Vercaigne, L., Walkty, A., Gin, A. S., Embil, J., … Hoban, D. J. (2002). Fluoroquinolones Focus on Respiratory Tract Infections, 62(1), 13–59.
Zhang, R., Zhang, G., Zheng, Q., Tang, J., Chen, Y., Xu, W., … Chen, X. (2012). Occurrence and risks of antibiotics in the Laizhou Bay, China: impacts of river discharge. Ecotoxicology and Environmental Safety, 80, 208–215. doi:10.1016/j.ecoenv.2012.03.002
Zhao, J.-L., Ying, G.-G., Wang, L., Yang, J.-F., Yang, X.-B., Yang, L.-H., & Li, X. (2009). Determination of phenolic endocrine disrupting chemicals and acidic pharmaceuticals in surface water of the Pearl Rivers in South China by gas chromatography-negative chemical ionization-mass spectrometry. The Science of the Total Environment, 407(2), 962–74. doi:10.1016/j.scitotenv.2008.09.048
Zheng, Q., Zhang, R., Wang, Y., Pan, X., Tang, J., & Zhang, G. (2012). Occurrence and distribution of antibiotics in the Beibu Gulf, China: Impacts of river discharge and aquaculture activities. Marine Environmental Research, 78, 26–33. doi:10.1016/j.marenvres.2012.03.007
Zuccato, E., Castiglioni, S., Bagnati, R., Melis, M., & Fanelli, R. (2010). Source, occurrence and fate of antibiotics in the Italian aquatic environment. Journal of Hazardous Materials, 179(1-3), 1042–1048.
67

Appendix 1 No Compound Continent Salt/fresh water Highest conc.
(nmol/L) Reference
1 Ciprofloxacin North America Fresh water 1.0865
Batt et al., Environmental
Pollution 142, 295-302, 2006
2 Ciprofloxacin North America Fresh water 0.5734
Batt et al., Environmental
Pollution 142, 295-302, 2006
3 Ciprofloxacin North America Fresh water 0.2294
Batt et al., Environmental
Pollution 142, 295-302, 2006
4 Ciprofloxacin North America Fresh water 0.5131
Batt et al., Environmental
Pollution 142, 295-302, 2006
5 Ciprofloxacin North America Fresh water 0.8451
Batt et al., Environmental
Pollution 142, 295-302, 2006
6 Ciprofloxacin North America Fresh water 0.0936
Batt et al., Environmental
Pollution 142, 295-302, 2006
7 Ciprofloxacin North America Fresh water 0.2716
Batt et al., Environmental
Pollution 142, 295-302, 2006
8 Ciprofloxacin North America Fresh water 0.3501 Massey et al.,
Ecological Engineering 36(7), 930-938, 2010
9 Ciprofloxacin North America Fresh water 0.0905
Focazio et al., Science of The Total
Environment 402(2-3), 201-216, 2008
10 Ciprofloxacin North America Fresh water 0.0905
Kolpin et al., Science of The Total Environment
328(1-3), 119-130, 2004
11 Ciprofloxacin North America Fresh water 0.1177
Haggard et al., Journal of Environmental
Quality 35(4), 1078-1087, 2006
12 Ciprofloxacin North America Fresh water 0.0905
Kolpin et al., Environmental Science & Technology 36(6),
1202-1211, 2002
13 Ciprofloxacin Europe Fresh water 0.3598 Santos et al., Journal of
Hazardous Materials 175, 45–95, 2010
14 Ciprofloxacin Europe Fresh water 0.0543 Golet et al., Environ Sci Technol 36(17),
3645-3651, 2002
15 Ciprofloxacin Europe Fresh water 0.0423 Golet et al., Environ Sci Technol 36(17),
68

3645-3651, 2002
16 Ciprofloxacin Europe Fresh water 0.0423 Golet et al., Environ Sci Technol 36(17),
3645-3651, 2002
17 Ciprofloxacin Europe Fresh water 0.0302 Golet et al., Environ Sci Technol 36(17),
3645-3651, 2002
18 Ciprofloxacin Europe Fresh water 0.1086 Vieno et al., Environ Sci Technol 41(14),
5077-5084, 2007
19 Ciprofloxacin Europe Fresh water 0.1056 Vieno et al., Environ Sci Technol 41(14),
5077-5084, 2007
20 Ciprofloxacin Europe Fresh water 0.0936 Vieno et al., Environ Sci Technol 41(14),
5077-5084, 2007
21 Ciprofloxacin Europe Fresh water 0.0789
Calamari et al., Environmental Science and Technology 37(7),
1241-1248, 2003
22 Ciprofloxacin Europe Fresh water 0.0433
Calamari et al., Environmental Science and Technology 37(7),
1241-1248, 2003
23 Ciprofloxacin Europe Fresh water 0.0068
Zuccato et al., Journal of Hazardous Materials 179(1-3), 1042-1048,
2010
24 Ciprofloxacin Europe Fresh water 0.0040
Zuccato et al., Journal of Hazardous Materials 179(1-3), 1042-1048,
2010
25 Ciprofloxacin Europe Fresh water 0.0483
Zuccato et al., Journal of Hazardous Materials 179(1-3), 1042-1048,
2010
26 Ciprofloxacin Europe Fresh water 0.0468
Zuccato et al., Journal of Hazardous Materials 179(1-3), 1042-1048,
2010
27 Ciprofloxacin Europe Fresh water 0.0318
Zuccato et al., Journal of Hazardous Materials 179(1-3), 1042-1048,
2010
28 Ciprofloxacin Europe Fresh water 0.0812
Zuccato et al., Journal of Hazardous Materials 179(1-3), 1042-1048,
2010
29 Ciprofloxacin Europe Fresh water 0.1132
Zuccato et al., Journal of Hazardous Materials 179(1-3), 1042-1048,
2010
30 Ciprofloxacin Europe Fresh water 0.0930
Vazquez-Roig et al., Analytical and
Bioanalytical Chemistry 400(5), 1287-1301,
2011
31 Ciprofloxacin Europe Fresh water 0.0604 Vazquez-Roig et al., Analytical and
69

Bioanalytical Chemistry 400(5), 1287-1301,
2011
32 Ciprofloxacin Europe Fresh water 0.0184
Vazquez-Roig et al., Analytical and
Bioanalytical Chemistry 400(5), 1287-1301,
2011
33 Ciprofloxacin Europe Fresh water 0.0513 Dinh et al., Talanta 85, 1238–1245, 2011
34 Ciprofloxacin Europe Fresh water 0.0106 Dinh et al., Talanta 85, 1238–1245, 2011
35 Ciprofloxacin Europe Fresh water 0.4074 Dinh et al., Talanta 85, 1238–1245, 2011
36 Ciprofloxacin Asia Fresh water 7545.1
Fick et al., Environmental Toxicology and
Chemistry 28(12), 2522-2527, 2009
37 Ciprofloxacin Asia Fresh water 8451.5
Fick et al., Environmental Toxicology and
Chemistry 28(12), 2522-2527, 2009
38 Ciprofloxacin Asia Fresh water 19617
Fick et al., Environmental Toxicology and
Chemistry 28(12), 2522-2527, 2009
39 Ciprofloxacin Asia Fresh water 1.0442
Zhang et al., Ecotoxicology and
environmental Safety 80, 208-215, 2012
40 Ciprofloxacin Asia Salt water 0.1992
Zhang et al., Ecotoxicology and
environmental Safety 80, 208-215, 2012
41 Sulfamethoxazole North America Fresh water 0.5922 Santos et al., Journal of
Hazardous Materials 175, 45–95, 2010
42 Sulfamethoxazole North America Fresh water 1.1845 Santos et al., Journal of
Hazardous Materials 175, 45–95, 2010
43 Sulfamethoxazole North America Fresh water 1.7767
Batt et al., Environmental
Pollution 142, 295-302, 2006
44 Sulfamethoxazole North America Fresh water 0.7896
Batt et al., Environmental
Pollution 142, 295-302, 2006
45 Sulfamethoxazole North America Fresh water 0.2566
Batt et al., Environmental
Pollution 142, 295-302, 2006
46 Sulfamethoxazole North America Fresh water 1.4608
Batt et al., Environmental
Pollution 142, 295-302, 2006
70

47 Sulfamethoxazole North America Fresh water 0.7502
Batt et al., Environmental
Pollution 142, 295-302, 2006
48 Sulfamethoxazole North America Fresh water 0.2211
Batt et al., Environmental
Pollution 142, 295-302, 2006
49 Sulfamethoxazole North America Fresh water 0.1698
Batt et al., Environmental
Pollution 142, 295-302, 2006
50 Sulfamethoxazole North America Fresh water 0.3159
Batt et al., Environmental
Pollution 142, 295-302, 2006
51 Sulfamethoxazole North America Fresh water 2.2268 Massey et al.,
Ecological Engineering 36(7), 930-938, 2010
52 Sulfamethoxazole North America Fresh water 1.2832 Massey et al.,
Ecological Engineering 36(7), 930-938, 2010
53 Sulfamethoxazole North America Fresh water 0.1619 Massey et al.,
Ecological Engineering 36(7), 930-938, 2010
54 Sulfamethoxazole North America Fresh water 1.1529
Glassmeyer et al., Environmental science
& Technology 39, 5157-5169, 2005
55 Sulfamethoxazole North America Fresh water 3.0125
Glassmeyer et al., Environmental science
& Technology 39, 5157-5169, 2005
56 Sulfamethoxazole North America Fresh water 1.2674
Glassmeyer et al., Environmental science
& Technology 39, 5157-5169, 2005
57 Sulfamethoxazole North America Fresh water 0.2764
Kolpin et al., Science of The Total Environment
328(1-3), 119-130, 2004
58 Sulfamethoxazole North America Fresh water 0.2487
Kolpin et al., Science of The Total Environment
328(1-3), 119-130, 2004
59 Sulfamethoxazole North America Fresh water 1.1845
Brown et al., Science of The Total Environment
366(2-3), 772-783, 2006
60 Sulfamethoxazole North America Fresh water 1.1845
Brown et al., Science of The Total Environment
366(2-3), 772-783, 2006
61 Sulfamethoxazole North America Fresh water 0.1161
Bartelt-Hunt et al., Environmental
Pollution 157, 786-791, 2009
71

62 Sulfamethoxazole North America Fresh water 0.0055
Bartelt-Hunt et al., Environmental
Pollution 157, 786-791, 2009
63 Sulfamethoxazole North America Fresh water 1.3542
Bartelt-Hunt et al., Environmental
Pollution 157, 786-791, 2009
64 Sulfamethoxazole North America Fresh water 0.6846
Bartelt-Hunt et al., Environmental
Pollution 157, 786-791, 2009
65 Sulfamethoxazole North America Fresh water 0.5583
Bartelt-Hunt et al., Environmental
Pollution 157, 786-791, 2009
66 Sulfamethoxazole North America Fresh water 0.4738 Yang et al., Water
research 38, 3155-3166, 2004
67 Sulfamethoxazole North America Fresh water 0.1974 Yang et al., Water
research 38, 3155-3166, 2004
68 Sulfamethoxazole North America Fresh water 0.1974 Yang et al., Water
research 38, 3155-3166, 2004
69 Sulfamethoxazole North America Fresh water 0.2369 Yang et al., Water
research 38, 3155-3166, 2004
70 Sulfamethoxazole North America Fresh water 0.9870 Gibs et al., Science of the Total Environment
458-460, 107-116, 2013
71 Sulfamethoxazole Europe Fresh water 0.0869 Santos et al., Journal of
Hazardous Materials 175, 45–95, 2010
72 Sulfamethoxazole Europe Fresh water 0.0197 Santos et al., Journal of
Hazardous Materials 175, 45–95, 2010
73 Sulfamethoxazole Europe Fresh water 1.5872 Santos et al., Journal of
Hazardous Materials 175, 45–95, 2010
74 Sulfamethoxazole Europe Fresh water 0.0395 Bendz et al., Journal of Hazardous Materials 122, 195–204, 2005
75 Sulfamethoxazole Europe Fresh water 1.8951
Hirsch et al., The Science of the Total
Environment 225, 109-118, 1999
76 Sulfamethoxazole Europe Fresh water 0.3672
Tamtam et al., Science of The Total
Environment 393(1), 84-95, 2008
77 Sulfamethoxazole Europe Fresh water 0.2843
Tamtam et al., Science of The Total
Environment 393(1), 84-95, 2008
78 Sulfamethoxazole Europe Fresh water 0.4777
Tamtam et al., Science of The Total
Environment 393(1), 84-95, 2008
72

79 Sulfamethoxazole Europe Fresh water 0.3238
Tamtam et al., Science of The Total
Environment 393(1), 84-95, 2008
80 Sulfamethoxazole Europe Fresh water 2.1478
Tamtam et al., Science of The Total
Environment 393(1), 84-95, 2008
81 Sulfamethoxazole Europe Fresh water 0.0072
Zuccato et al., Journal of Hazardous Materials 179(1-3), 1042-1048,
2010
82 Sulfamethoxazole Europe Fresh water 0.0094
Zuccato et al., Journal of Hazardous Materials 179(1-3), 1042-1048,
2010
83 Sulfamethoxazole Europe Fresh water 0.0089
Zuccato et al., Journal of Hazardous Materials 179(1-3), 1042-1048,
2010
84 Sulfamethoxazole Europe Fresh water 0.0083
Zuccato et al., Journal of Hazardous Materials 179(1-3), 1042-1048,
2010
85 Sulfamethoxazole Europe Fresh water 0.0071
Zuccato et al., Journal of Hazardous Materials 179(1-3), 1042-1048,
2010
86 Sulfamethoxazole Europe Fresh water 0.0450
Zuccato et al., Journal of Hazardous Materials 179(1-3), 1042-1048,
2010
87 Sulfamethoxazole Europe Fresh water 0.0155
Zuccato et al., Journal of Hazardous Materials 179(1-3), 1042-1048,
2010
88 Sulfamethoxazole Europe Fresh water 0.0157
Zuccato et al., Journal of Hazardous Materials 179(1-3), 1042-1048,
2010
89 Sulfamethoxazole Europe Fresh water 0.5488
Vazquez-Roig et al., Analytical and
Bioanalytical Chemistry 400(5), 1287-1301,
2011
90 Sulfamethoxazole Europe Fresh water 0.0952
Vazquez-Roig et al., Analytical and
Bioanalytical Chemistry 400(5), 1287-1301,
2011
91 Sulfamethoxazole Europe Fresh water 0.0687
Vazquez-Roig et al., Analytical and
Bioanalytical Chemistry 400(5), 1287-1301,
2011
92 Sulfamethoxazole Europe Fresh water 0.1769
Vazquez-Roig et al., Analytical and
Bioanalytical Chemistry 400(5), 1287-1301,
73

2011
93 Sulfamethoxazole Europe Fresh water 0.5685
Vazquez-Roig et al., Analytical and
Bioanalytical Chemistry 400(5), 1287-1301,
2011
94 Sulfamethoxazole Europe Fresh water 0.0162
Vazquez-Roig et al., Analytical and
Bioanalytical Chemistry 400(5), 1287-1301,
2011
95 Sulfamethoxazole Europe Fresh water 0.0422
Vazquez-Roig et al., Analytical and
Bioanalytical Chemistry 400(5), 1287-1301,
2011
96 Sulfamethoxazole Europe Fresh water 0.0249
Vazquez-Roig et al., Analytical and
Bioanalytical Chemistry 400(5), 1287-1301,
2011
97 Sulfamethoxazole Europe Fresh water 0.0746
Vazquez-Roig et al., Analytical and
Bioanalytical Chemistry 400(5), 1287-1301,
2011
98 Sulfamethoxazole Europe Fresh water 0.0782
Tamtam et al., Analytical and
Bioanalytical Chemistry 393(6-7), 1709-1718,
2009
99 Sulfamethoxazole Europe Fresh water 0.0509
Tamtam et al., Analytical and
Bioanalytical Chemistry 393(6-7), 1709-1718,
2009
100 Sulfamethoxazole Europe Fresh water 0.1027
Tamtam et al., Analytical and
Bioanalytical Chemistry 393(6-7), 1709-1718,
2009
101 Sulfamethoxazole Europe Fresh water 0.0268
Fernández et al., Science of the Total
Environment 408, 543-551, 2010
102 Sulfamethoxazole Europe Fresh water 0.0047
Fernández et al., Science of the Total
Environment 408, 543-551, 2010
103 Sulfamethoxazole Europe Fresh water 0.0261
Fernández et al., Science of the Total
Environment 408, 543-551, 2010
104 Sulfamethoxazole Europe Fresh water 0.0004
Fernández et al., Science of the Total
Environment 408, 543-551, 2010
105 Sulfamethoxazole Europe Fresh water 0.0095 Fernández et al., Science of the Total
74

Environment 408, 543-551, 2010
106 Sulfamethoxazole Europe Fresh water 0.0039
Fernández et al., Science of the Total
Environment 408, 543-551, 2010
107 Sulfamethoxazole Europe Fresh water 0.028
Fernández et al., Science of the Total
Environment 408, 543-551, 2010
108 Sulfamethoxazole Europe Fresh water 0.0012
Fernández et al., Science of the Total
Environment 408, 543-551, 2010
109 Sulfamethoxazole Europe Fresh water 0.0118
Fernández et al., Science of the Total
Environment 408, 543-551, 2010
110 Sulfamethoxazole Europe Fresh water 0.0063
Fernández et al., Science of the Total
Environment 408, 543-551, 2010
111 Sulfamethoxazole Europe Fresh water 0.0367
Fernández et al., Science of the Total
Environment 408, 543-551, 2010
112 Sulfamethoxazole Europe Fresh water 0.0012
Fernández et al., Science of the Total
Environment 408, 543-551, 2010
113 Sulfamethoxazole Europe Fresh water 0.0395
Fernández et al., Science of the Total
Environment 408, 543-551, 2010
114 Sulfamethoxazole Europe Fresh water 0.0036
Fernández et al., Science of the Total
Environment 408, 543-551, 2010
115 Sulfamethoxazole Europe Fresh water 0.0411
Fernández et al., Science of the Total
Environment 408, 543-551, 2010
116 Sulfamethoxazole Europe Fresh water 0.0063
Fernández et al., Science of the Total
Environment 408, 543-551, 2010
117 Sulfamethoxazole Europe Fresh water 0.0387
Fernández et al., Science of the Total
Environment 408, 543-551, 2010
118 Sulfamethoxazole Europe Fresh water 0.0186
Fernández et al., Science of the Total
Environment 408, 543-551, 2010
119 Sulfamethoxazole Europe Fresh water 0.0608
Fernández et al., Science of the Total
Environment 408, 543-551, 2010
120 Sulfamethoxazole Europe Fresh water 0.0213 Fernández et al.,
75

Science of the Total Environment 408, 543-
551, 2010
121 Sulfamethoxazole Europe Fresh water 0.0936
Fernández et al., Science of the Total
Environment 408, 543-551, 2010
122 Sulfamethoxazole Europe Fresh water 0.0170
Fernández et al., Science of the Total
Environment 408, 543-551, 2010
123 Sulfamethoxazole Europe Fresh water 0.0561
Fernández et al., Science of the Total
Environment 408, 543-551, 2010
124 Sulfamethoxazole Europe Fresh water 0.043
Fernández et al., Science of the Total
Environment 408, 543-551, 2010
125 Sulfamethoxazole Europe Fresh water 0.0399
Fernández et al., Science of the Total
Environment 408, 543-551, 2010
126 Sulfamethoxazole Europe Fresh water 0.0237
Fernández et al., Science of the Total
Environment 408, 543-551, 2010
127 Sulfamethoxazole Europe Fresh water 0.0458
Fernández et al., Science of the Total
Environment 408, 543-551, 2010
128 Sulfamethoxazole Europe Fresh water 0.0292
Fernández et al., Science of the Total
Environment 408, 543-551, 2010
129 Sulfamethoxazole Europe Fresh water 0.0608
Fernández et al., Science of the Total
Environment 408, 543-551, 2010
130 Sulfamethoxazole Europe Fresh water 0.0170
Fernández et al., Science of the Total
Environment 408, 543-551, 2010
131 Sulfamethoxazole Europe Fresh water 0.0351
Fernández et al., Science of the Total
Environment 408, 543-551, 2010
132 Sulfamethoxazole Europe Fresh water 0.0328
Fernández et al., Science of the Total
Environment 408, 543-551, 2010
133 Sulfamethoxazole Europe Fresh water 0.0580
Fernández et al., Science of the Total
Environment 408, 543-551, 2010
134 Sulfamethoxazole Europe Fresh water 0.0193
Fernández et al., Science of the Total
Environment 408, 543-551, 2010
76
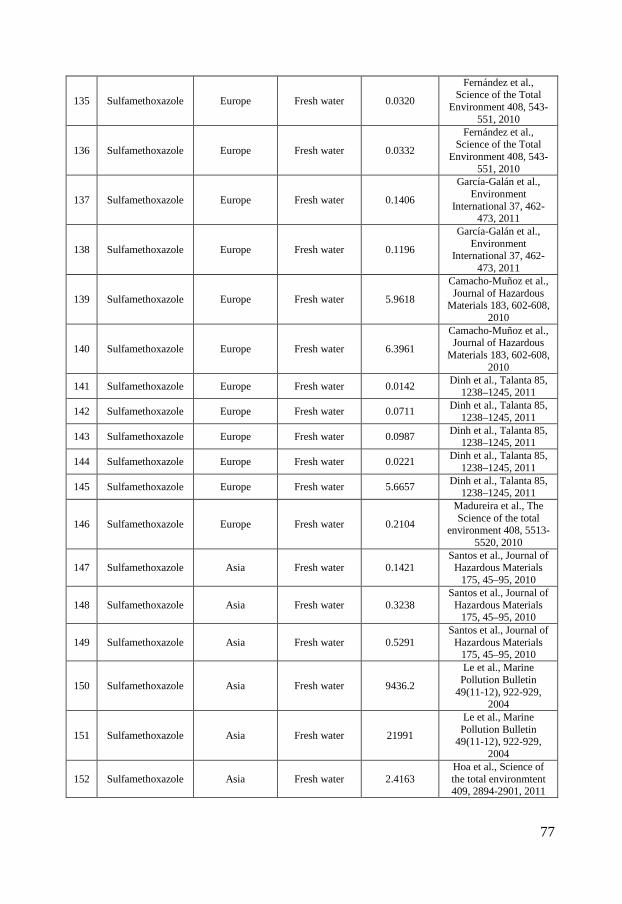
135 Sulfamethoxazole Europe Fresh water 0.0320
Fernández et al., Science of the Total
Environment 408, 543-551, 2010
136 Sulfamethoxazole Europe Fresh water 0.0332
Fernández et al., Science of the Total
Environment 408, 543-551, 2010
137 Sulfamethoxazole Europe Fresh water 0.1406
García-Galán et al., Environment
International 37, 462-473, 2011
138 Sulfamethoxazole Europe Fresh water 0.1196
García-Galán et al., Environment
International 37, 462-473, 2011
139 Sulfamethoxazole Europe Fresh water 5.9618
Camacho-Muñoz et al., Journal of Hazardous
Materials 183, 602-608, 2010
140 Sulfamethoxazole Europe Fresh water 6.3961
Camacho-Muñoz et al., Journal of Hazardous
Materials 183, 602-608, 2010
141 Sulfamethoxazole Europe Fresh water 0.0142 Dinh et al., Talanta 85, 1238–1245, 2011
142 Sulfamethoxazole Europe Fresh water 0.0711 Dinh et al., Talanta 85, 1238–1245, 2011
143 Sulfamethoxazole Europe Fresh water 0.0987 Dinh et al., Talanta 85, 1238–1245, 2011
144 Sulfamethoxazole Europe Fresh water 0.0221 Dinh et al., Talanta 85, 1238–1245, 2011
145 Sulfamethoxazole Europe Fresh water 5.6657 Dinh et al., Talanta 85, 1238–1245, 2011
146 Sulfamethoxazole Europe Fresh water 0.2104
Madureira et al., The Science of the total
environment 408, 5513-5520, 2010
147 Sulfamethoxazole Asia Fresh water 0.1421 Santos et al., Journal of
Hazardous Materials 175, 45–95, 2010
148 Sulfamethoxazole Asia Fresh water 0.3238 Santos et al., Journal of
Hazardous Materials 175, 45–95, 2010
149 Sulfamethoxazole Asia Fresh water 0.5291 Santos et al., Journal of
Hazardous Materials 175, 45–95, 2010
150 Sulfamethoxazole Asia Fresh water 9436.2
Le et al., Marine Pollution Bulletin
49(11-12), 922-929, 2004
151 Sulfamethoxazole Asia Fresh water 21991
Le et al., Marine Pollution Bulletin
49(11-12), 922-929, 2004
152 Sulfamethoxazole Asia Fresh water 2.4163 Hoa et al., Science of the total environmtent 409, 2894-2901, 2011
77

153 Sulfamethoxazole Asia Fresh water 11.7735 Hoa et al., Science of the total environmtent 409, 2894-2901, 2011
154 Sulfamethoxazole Asia Fresh water 17.0957 Hoa et al., Science of the total environmtent 409, 2894-2901, 2011
155 Sulfamethoxazole Asia Fresh water 1.6661 Hoa et al., Science of the total environmtent 409, 2894-2901, 2011
156 Sulfamethoxazole Asia Fresh water 2.4676 Hoa et al., Science of the total environmtent 409, 2894-2901, 2011
157 Sulfamethoxazole Asia Fresh water 1.295 Hoa et al., Science of the total environmtent 409, 2894-2901, 2011
158 Sulfamethoxazole Asia Fresh water 0.0529 Hoa et al., Science of the total environmtent 409, 2894-2901, 2011
159 Sulfamethoxazole Asia Fresh water 0.0094 Hoa et al., Science of the total environmtent 409, 2894-2901, 2011
160 Sulfamethoxazole Asia Fresh water 3.2296 Hoa et al., Science of the total environmtent 409, 2894-2901, 2011
161 Sulfamethoxazole Asia Fresh water 15.1887 Hoa et al., Science of the total environmtent 409, 2894-2901, 2011
162 Sulfamethoxazole Asia Fresh water 12.5158 Hoa et al., Science of the total environmtent 409, 2894-2901, 2011
163 Sulfamethoxazole Asia Fresh water 1.2871 Hoa et al., Science of the total environmtent 409, 2894-2901, 2011
164 Sulfamethoxazole Asia Fresh water 0.2693 Hoa et al., Science of the total environmtent 409, 2894-2901, 2011
165 Sulfamethoxazole Asia Fresh water 0.276 Hoa et al., Science of the total environmtent 409, 2894-2901, 2011
166 Sulfamethoxazole Asia Fresh water 0.0426 Hoa et al., Science of the total environmtent 409, 2894-2901, 2011
167 Sulfamethoxazole Asia Fresh water 3.6087 Hoa et al., Science of the total environmtent 409, 2894-2901, 2011
168 Sulfamethoxazole Asia Fresh water 0.0237 Choi et al., Science of the total environment 405, 120-128, 2008
169 Sulfamethoxazole Asia Fresh water 0.0513 Choi et al., Science of the total environment 405, 120-128, 2008
170 Sulfamethoxazole Asia Fresh water 0.1421 Choi et al., Science of the total environment 405, 120-128, 2008
171 Sulfamethoxazole Asia Fresh water 0.3238 Choi et al., Science of the total environment 405, 120-128, 2008
172 Sulfamethoxazole Asia Fresh water 0.075 Choi et al., Science of the total environment
78
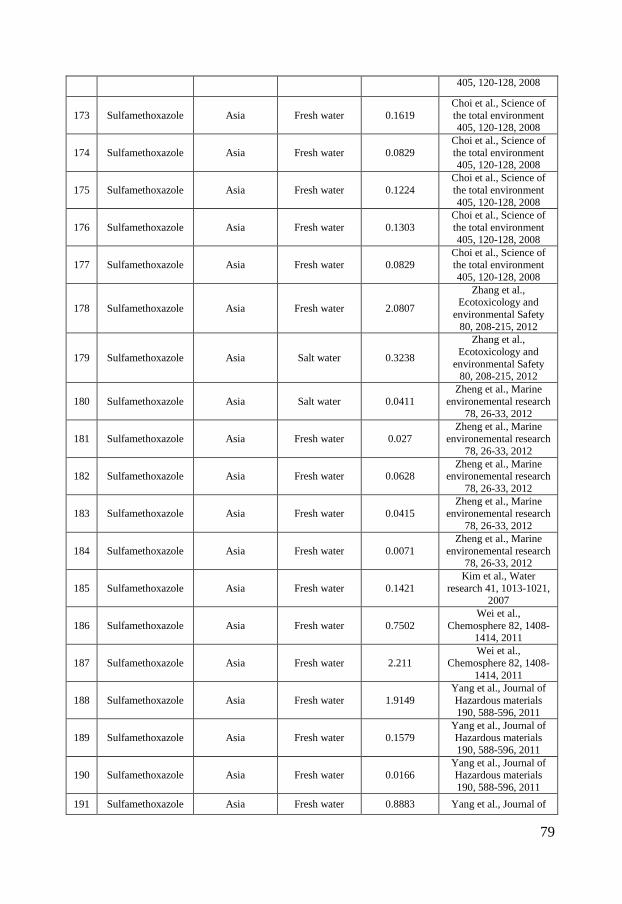
405, 120-128, 2008
173 Sulfamethoxazole Asia Fresh water 0.1619 Choi et al., Science of the total environment 405, 120-128, 2008
174 Sulfamethoxazole Asia Fresh water 0.0829 Choi et al., Science of the total environment 405, 120-128, 2008
175 Sulfamethoxazole Asia Fresh water 0.1224 Choi et al., Science of the total environment 405, 120-128, 2008
176 Sulfamethoxazole Asia Fresh water 0.1303 Choi et al., Science of the total environment 405, 120-128, 2008
177 Sulfamethoxazole Asia Fresh water 0.0829 Choi et al., Science of the total environment 405, 120-128, 2008
178 Sulfamethoxazole Asia Fresh water 2.0807
Zhang et al., Ecotoxicology and
environmental Safety 80, 208-215, 2012
179 Sulfamethoxazole Asia Salt water 0.3238
Zhang et al., Ecotoxicology and
environmental Safety 80, 208-215, 2012
180 Sulfamethoxazole Asia Salt water 0.0411 Zheng et al., Marine
environemental research 78, 26-33, 2012
181 Sulfamethoxazole Asia Fresh water 0.027 Zheng et al., Marine
environemental research 78, 26-33, 2012
182 Sulfamethoxazole Asia Fresh water 0.0628 Zheng et al., Marine
environemental research 78, 26-33, 2012
183 Sulfamethoxazole Asia Fresh water 0.0415 Zheng et al., Marine
environemental research 78, 26-33, 2012
184 Sulfamethoxazole Asia Fresh water 0.0071 Zheng et al., Marine
environemental research 78, 26-33, 2012
185 Sulfamethoxazole Asia Fresh water 0.1421 Kim et al., Water
research 41, 1013-1021, 2007
186 Sulfamethoxazole Asia Fresh water 0.7502 Wei et al.,
Chemosphere 82, 1408-1414, 2011
187 Sulfamethoxazole Asia Fresh water 2.211 Wei et al.,
Chemosphere 82, 1408-1414, 2011
188 Sulfamethoxazole Asia Fresh water 1.9149 Yang et al., Journal of Hazardous materials 190, 588-596, 2011
189 Sulfamethoxazole Asia Fresh water 0.1579 Yang et al., Journal of Hazardous materials 190, 588-596, 2011
190 Sulfamethoxazole Asia Fresh water 0.0166 Yang et al., Journal of Hazardous materials 190, 588-596, 2011
191 Sulfamethoxazole Asia Fresh water 0.8883 Yang et al., Journal of
79
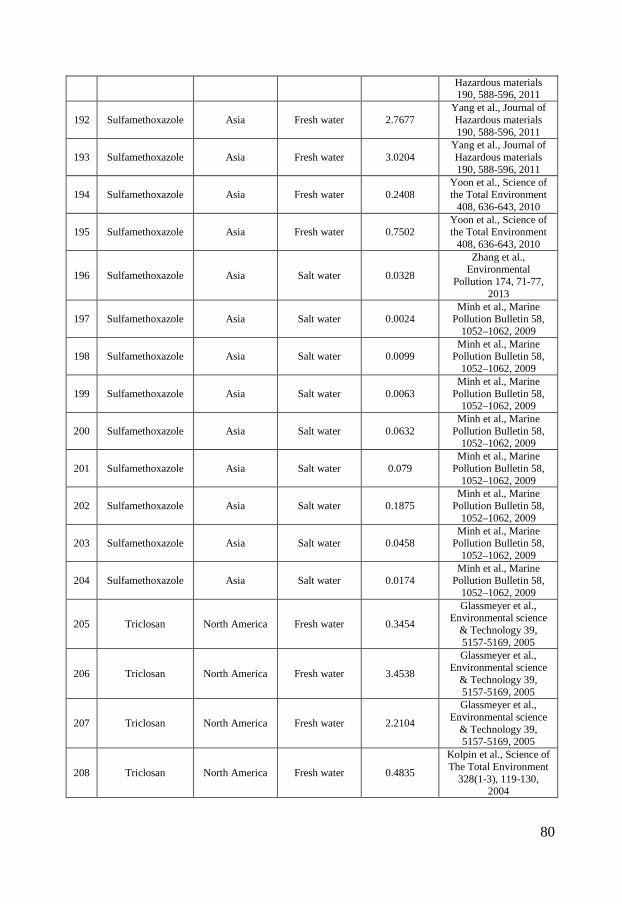
Hazardous materials 190, 588-596, 2011
192 Sulfamethoxazole Asia Fresh water 2.7677 Yang et al., Journal of Hazardous materials 190, 588-596, 2011
193 Sulfamethoxazole Asia Fresh water 3.0204 Yang et al., Journal of Hazardous materials 190, 588-596, 2011
194 Sulfamethoxazole Asia Fresh water 0.2408 Yoon et al., Science of the Total Environment
408, 636-643, 2010
195 Sulfamethoxazole Asia Fresh water 0.7502 Yoon et al., Science of the Total Environment
408, 636-643, 2010
196 Sulfamethoxazole Asia Salt water 0.0328
Zhang et al., Environmental
Pollution 174, 71-77, 2013
197 Sulfamethoxazole Asia Salt water 0.0024 Minh et al., Marine
Pollution Bulletin 58, 1052–1062, 2009
198 Sulfamethoxazole Asia Salt water 0.0099 Minh et al., Marine
Pollution Bulletin 58, 1052–1062, 2009
199 Sulfamethoxazole Asia Salt water 0.0063 Minh et al., Marine
Pollution Bulletin 58, 1052–1062, 2009
200 Sulfamethoxazole Asia Salt water 0.0632 Minh et al., Marine
Pollution Bulletin 58, 1052–1062, 2009
201 Sulfamethoxazole Asia Salt water 0.079 Minh et al., Marine
Pollution Bulletin 58, 1052–1062, 2009
202 Sulfamethoxazole Asia Salt water 0.1875 Minh et al., Marine
Pollution Bulletin 58, 1052–1062, 2009
203 Sulfamethoxazole Asia Salt water 0.0458 Minh et al., Marine
Pollution Bulletin 58, 1052–1062, 2009
204 Sulfamethoxazole Asia Salt water 0.0174 Minh et al., Marine
Pollution Bulletin 58, 1052–1062, 2009
205 Triclosan North America Fresh water 0.3454
Glassmeyer et al., Environmental science
& Technology 39, 5157-5169, 2005
206 Triclosan North America Fresh water 3.4538
Glassmeyer et al., Environmental science
& Technology 39, 5157-5169, 2005
207 Triclosan North America Fresh water 2.2104
Glassmeyer et al., Environmental science
& Technology 39, 5157-5169, 2005
208 Triclosan North America Fresh water 0.4835
Kolpin et al., Science of The Total Environment
328(1-3), 119-130, 2004
80

209 Triclosan North America Salt water 0.0014 DeLorenzo et al.,
Environ Toxicol 23, 224-232, 2008
210 Triclosan North America Salt water 0.0035 DeLorenzo et al.,
Environ Toxicol 23, 224-232, 2008
211 Triclosan North America Salt water 0.0016 DeLorenzo et al.,
Environ Toxicol 23, 224-232, 2008
212 Triclosan North America Fresh water 7.9436
Lyndall et al., Integrated
environmental assessment and
management 6(3), 419-440, 2010
213 Triclosan North America Fresh water 0.4145
Lyndall et al., Integrated
environmental assessment and
management 6(3), 419-440, 2010
214 Triclosan North America Fresh water 0.3868
Lyndall et al., Integrated
environmental assessment and
management 6(3), 419-440, 2010
215 Triclosan North America Fresh water 0.0276
Lyndall et al., Integrated
environmental assessment and
management 6(3), 419-440, 2010
216 Triclosan North America Fresh water 2.5212
Lyndall et al., Integrated
environmental assessment and
management 6(3), 419-440, 2010
217 Triclosan North America Fresh water 1.4886
Lyndall et al., Integrated
environmental assessment and
management 6(3), 419-440, 2010
218 Triclosan North America Fresh water 6.9075
Lyndall et al., Integrated
environmental assessment and
management 6(3), 419-440, 2010
219 Triclosan North America Fresh water 1.0016
Lyndall et al., Integrated
environmental assessment and
management 6(3), 419-440, 2010
220 Triclosan North America Fresh water 4.4899 Lyndall et al., Integrated
81
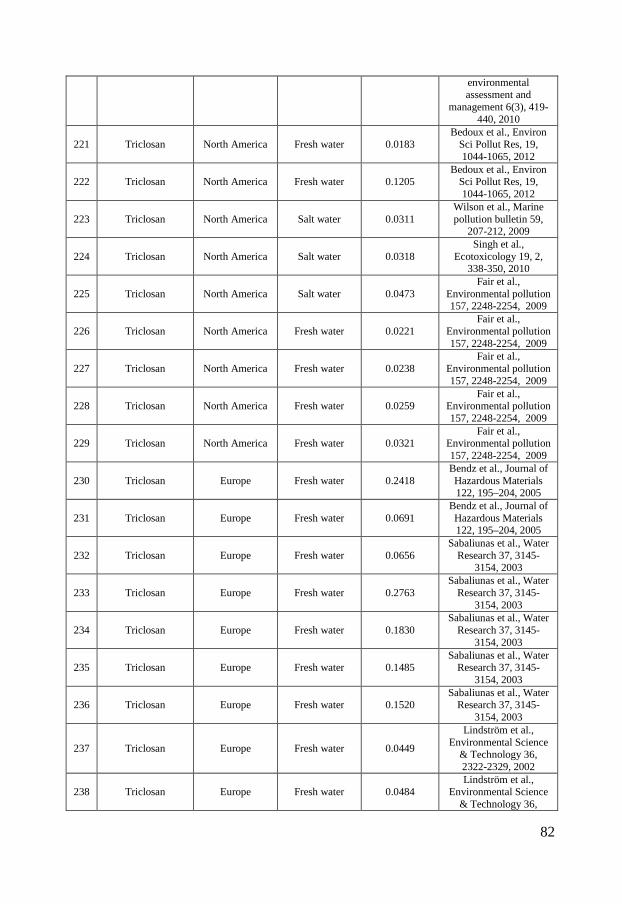
environmental assessment and
management 6(3), 419-440, 2010
221 Triclosan North America Fresh water 0.0183 Bedoux et al., Environ
Sci Pollut Res, 19, 1044-1065, 2012
222 Triclosan North America Fresh water 0.1205 Bedoux et al., Environ
Sci Pollut Res, 19, 1044-1065, 2012
223 Triclosan North America Salt water 0.0311 Wilson et al., Marine pollution bulletin 59,
207-212, 2009
224 Triclosan North America Salt water 0.0318 Singh et al.,
Ecotoxicology 19, 2, 338-350, 2010
225 Triclosan North America Salt water 0.0473 Fair et al.,
Environmental pollution 157, 2248-2254, 2009
226 Triclosan North America Fresh water 0.0221 Fair et al.,
Environmental pollution 157, 2248-2254, 2009
227 Triclosan North America Fresh water 0.0238 Fair et al.,
Environmental pollution 157, 2248-2254, 2009
228 Triclosan North America Fresh water 0.0259 Fair et al.,
Environmental pollution 157, 2248-2254, 2009
229 Triclosan North America Fresh water 0.0321 Fair et al.,
Environmental pollution 157, 2248-2254, 2009
230 Triclosan Europe Fresh water 0.2418 Bendz et al., Journal of Hazardous Materials 122, 195–204, 2005
231 Triclosan Europe Fresh water 0.0691 Bendz et al., Journal of Hazardous Materials 122, 195–204, 2005
232 Triclosan Europe Fresh water 0.0656 Sabaliunas et al., Water
Research 37, 3145-3154, 2003
233 Triclosan Europe Fresh water 0.2763 Sabaliunas et al., Water
Research 37, 3145-3154, 2003
234 Triclosan Europe Fresh water 0.1830 Sabaliunas et al., Water
Research 37, 3145-3154, 2003
235 Triclosan Europe Fresh water 0.1485 Sabaliunas et al., Water
Research 37, 3145-3154, 2003
236 Triclosan Europe Fresh water 0.1520 Sabaliunas et al., Water
Research 37, 3145-3154, 2003
237 Triclosan Europe Fresh water 0.0449
Lindström et al., Environmental Science
& Technology 36, 2322-2329, 2002
238 Triclosan Europe Fresh water 0.0484 Lindström et al.,
Environmental Science & Technology 36,
82

2322-2329, 2002
239 Triclosan Europe Fresh water 0.0048
Lindström et al., Environmental Science
& Technology 36, 2322-2329, 2002
240 Triclosan Europe Fresh water 0.0345
Lindström et al., Environmental Science
& Technology 36, 2322-2329, 2002
241 Triclosan Europe Fresh water 0.0414
Lindström et al., Environmental Science
& Technology 36, 2322-2329, 2002
242 Triclosan Europe Fresh water 0.0345
Lindström et al., Environmental Science
& Technology 36, 2322-2329, 2002
243 Triclosan Europe Fresh water 0.0117
Lindström et al., Environmental Science
& Technology 36, 2322-2329, 2002
244 Triclosan Europe Fresh water 0.0380
Lindström et al., Environmental Science
& Technology 36, 2322-2329, 2002
245 Triclosan Europe Fresh water 0.2556
Lindström et al., Environmental Science
& Technology 36, 2322-2329, 2002
246 Triclosan Europe Fresh water 0.0079
Lindström et al., Environmental Science
& Technology 36, 2322-2329, 2002
247 Triclosan Europe Fresh water 0.0107
Lindström et al., Environmental Science
& Technology 36, 2322-2329, 2002
248 Triclosan Europe Fresh water 0.0090
Lindström et al., Environmental Science
& Technology 36, 2322-2329, 2002
249 Triclosan Europe Fresh water 0.0829
Lyndall et al., Integrated
environmental assessment and
management 6(3), 419-440, 2010
250 Triclosan Europe Fresh water 0.5526
Lyndall et al., Integrated
environmental assessment and
management 6(3), 419-440, 2010
251 Triclosan Europe Fresh water 0.3108
Lyndall et al., Integrated
environmental assessment and
management 6(3), 419-440, 2010
83

252 Triclosan Europe Fresh water 0.0238
Lyndall et al., Integrated
environmental assessment and
management 6(3), 419-440, 2010
253 Triclosan Europe Fresh water 0.0345 Bedoux et al., Environ
Sci Pollut Res, 19, 1044-1065, 2012
254 Triclosan Europe Fresh water 0.0518 Bedoux et al., Environ
Sci Pollut Res, 19, 1044-1065, 2012
255 Triclosan Europe Fresh water 0.4214 Bedoux et al., Environ
Sci Pollut Res, 19, 1044-1065, 2012
256 Triclosan Europe Fresh water 0.3626 Bedoux et al., Environ
Sci Pollut Res, 19, 1044-1065, 2012
257 Triclosan Europe Fresh water 0.3699 Bedoux et al., Environ
Sci Pollut Res, 19, 1044-1065, 2012
258 Triclosan Europe Fresh water 0.4766 Bedoux et al., Environ
Sci Pollut Res, 19, 1044-1065, 2012
259 Triclosan Europe Fresh water 0.9843 Bedoux et al., Environ
Sci Pollut Res, 19, 1044-1065, 2012
260 Triclosan Europe Fresh water 0.1623 Bedoux et al., Environ
Sci Pollut Res, 19, 1044-1065, 2012
261 Triclosan Europe Salt water 0.0237
Xie et al., Environmental pollution
156 (3), 1190-1195, 2008
262 Triclosan Asia Fresh water 0.1002 Yoon et al., Science of the Total Environment
408, 636-643, 2010
263 Triclosan Asia Fresh water 0.2832 Yoon et al., Science of the Total Environment
408, 636-643, 2010
264 Triclosan Asia Fresh water 0.2041
Lyndall et al., Integrated
environmental assessment and
management 6(3), 419-440, 2010
265 Triclosan Asia Fresh water 3.5332
Lyndall et al., Integrated
environmental assessment and
management 6(3), 419-440, 2010
266 Triclosan Asia Fresh water 0.3430
Lyndall et al., Integrated
environmental assessment and
management 6(3), 419-440, 2010
84

267 Triclosan Asia Fresh water 1.1985
Lyndall et al., Integrated
environmental assessment and
management 6(3), 419-440, 2010
268 Triclosan Asia Fresh water 0.4044 Bedoux et al., Environ
Sci Pollut Res, 19, 1044-1065, 2012
269 Triclosan Asia Fresh water 1.6509 Bedoux et al., Environ
Sci Pollut Res, 19, 1044-1065, 2012
270 Triclosan Asia Fresh water 0.3454 Bedoux et al., Environ
Sci Pollut Res, 19, 1044-1065, 2012
271 Triclosan Asia Fresh water 0.1071 Bedoux et al., Environ
Sci Pollut Res, 19, 1044-1065, 2012
272 Triclosan Asia Fresh water 0.2255 Chau et al.,
Chemosphere 73, S13-S17, 2008
273 Triclosan Asia Fresh water 0.0142 Chau et al.,
Chemosphere 73, S13-S17, 2008
274 Triclosan Asia Salt water 0.0635 Chau et al.,
Chemosphere 73, S13-S17, 2008
275 Triclosan Asia Fresh water 0.2494 Chau et al.,
Chemosphere 73, S13-S17, 2008
276 Triclosan Asia Fresh water 0.4044 Chau et al.,
Chemosphere 73, S13-S17, 2008
277 Triclosan Asia Salt water 0.0998 Chau et al.,
Chemosphere 73, S13-S17, 2008
85

Appendix 2 No Compound Organism Acute/chronic Effect ECx
(nmol/L) Reference
1 Ciprofloxacin B. rerio Acute NOEC 301800
Halling-Sørensen et al., Journal of Antimicrobial Chemotherapy 46, Suppl. S1, 53–58, 2000
2 Ciprofloxacin Sediment bacteria Acute LOEC 3018
Costanzo et al., Marine Pollution Bulletin 51, 218–
223, 2005
3 Ciprofloxacin V. fischeri Acute EC50 34708
Martins et al., Ecotoxicology 21, 1167-1176,
2012
4 Ciprofloxacin P. subcapitata Chronic NOEC 3290
Martins et al., Ecotoxicology 21, 1167-1176,
2012
5 Ciprofloxacin D. magna Chronic NOEC 5432
Martins et al., Ecotoxicology 21, 1167-1176,
2012
6 Ciprofloxacin Gammarus spp. Chronic LOEC 3.018
Maul et al., Environmental Toxicology and
Chemistry 25(6), 1598–1606, 2006
7 Ciprofloxacin
Leaf-associated bacterial
communites
Chronic LOEC 301.80
Maul et al., Environmental Toxicology and
Chemistry 25(6), 1598–1606, 2006
8 Ciprofloxacin L. liba Chronic LOEC 301.80
Maul et al., Environmental Toxicology and
Chemistry 25(6), 1598–1606, 2006
9 Ciprofloxacin Salt marsh bacterial
community Chronic LOEC 6036.1
Córdova-Kreylos et al., The ISME Journal 1, 585–
595, 2007
10 Ciprofloxacin L. gibba Chronic EC10 319.91
Brain et al., Environmental Toxicology and Chemistry, vol 23(2), 371-382,
2004
11 Ciprofloxacin L. gibba Chronic EC25 817.89
Brain et al., Environmental Toxicology and Chemistry, vol 23(2), 371-382,
2004
12 Ciprofloxacin M. aeruginosa Chronic EC50 15.090 Halling-Sørensen et al., Journal of
86
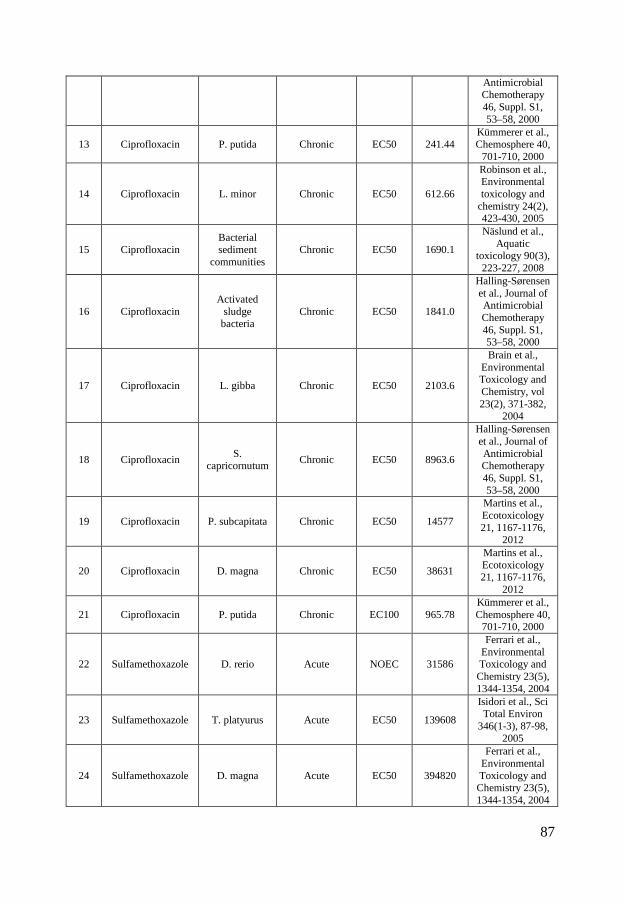
Antimicrobial Chemotherapy 46, Suppl. S1, 53–58, 2000
13 Ciprofloxacin P. putida Chronic EC50 241.44 Kümmerer et al., Chemosphere 40,
701-710, 2000
14 Ciprofloxacin L. minor Chronic EC50 612.66
Robinson et al., Environmental toxicology and
chemistry 24(2), 423-430, 2005
15 Ciprofloxacin Bacterial sediment
communities Chronic EC50 1690.1
Näslund et al., Aquatic
toxicology 90(3), 223-227, 2008
16 Ciprofloxacin Activated
sludge bacteria
Chronic EC50 1841.0
Halling-Sørensen et al., Journal of Antimicrobial Chemotherapy 46, Suppl. S1, 53–58, 2000
17 Ciprofloxacin L. gibba Chronic EC50 2103.6
Brain et al., Environmental Toxicology and Chemistry, vol 23(2), 371-382,
2004
18 Ciprofloxacin S. capricornutum Chronic EC50 8963.6
Halling-Sørensen et al., Journal of Antimicrobial Chemotherapy 46, Suppl. S1, 53–58, 2000
19 Ciprofloxacin P. subcapitata Chronic EC50 14577
Martins et al., Ecotoxicology 21, 1167-1176,
2012
20 Ciprofloxacin D. magna Chronic EC50 38631
Martins et al., Ecotoxicology 21, 1167-1176,
2012
21 Ciprofloxacin P. putida Chronic EC100 965.78 Kümmerer et al., Chemosphere 40,
701-710, 2000
22 Sulfamethoxazole D. rerio Acute NOEC 31586
Ferrari et al., Environmental Toxicology and
Chemistry 23(5), 1344-1354, 2004
23 Sulfamethoxazole T. platyurus Acute EC50 139608
Isidori et al., Sci Total Environ
346(1-3), 87-98, 2005
24 Sulfamethoxazole D. magna Acute EC50 394820
Ferrari et al., Environmental Toxicology and
Chemistry 23(5), 1344-1354, 2004
87
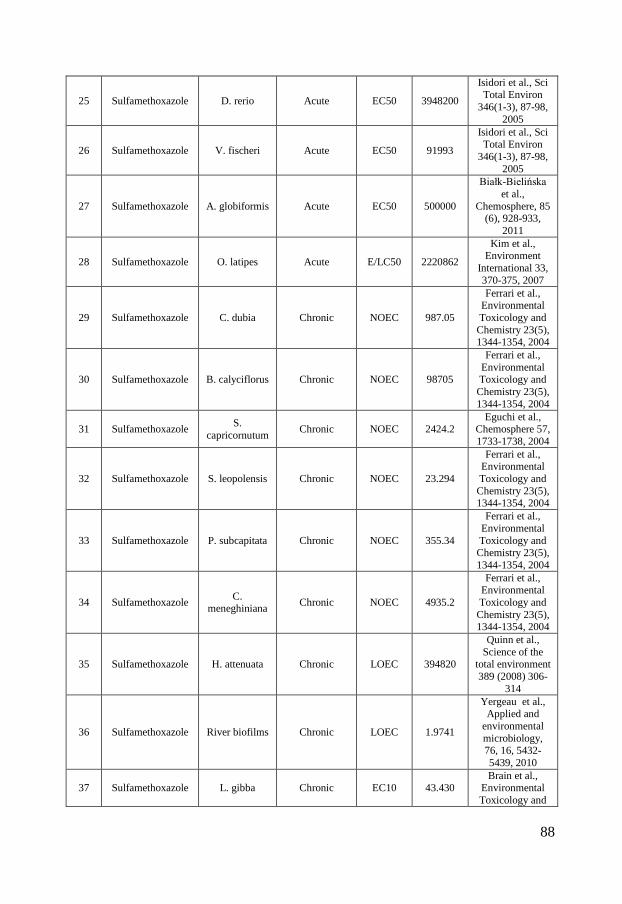
25 Sulfamethoxazole D. rerio Acute EC50 3948200
Isidori et al., Sci Total Environ
346(1-3), 87-98, 2005
26 Sulfamethoxazole V. fischeri Acute EC50 91993
Isidori et al., Sci Total Environ
346(1-3), 87-98, 2005
27 Sulfamethoxazole A. globiformis Acute EC50 500000
Białk-Bielińska et al.,
Chemosphere, 85 (6), 928-933,
2011
28 Sulfamethoxazole O. latipes Acute E/LC50 2220862
Kim et al., Environment
International 33, 370-375, 2007
29 Sulfamethoxazole C. dubia Chronic NOEC 987.05
Ferrari et al., Environmental Toxicology and
Chemistry 23(5), 1344-1354, 2004
30 Sulfamethoxazole B. calyciflorus Chronic NOEC 98705
Ferrari et al., Environmental Toxicology and
Chemistry 23(5), 1344-1354, 2004
31 Sulfamethoxazole S. capricornutum Chronic NOEC 2424.2
Eguchi et al., Chemosphere 57, 1733-1738, 2004
32 Sulfamethoxazole S. leopolensis Chronic NOEC 23.294
Ferrari et al., Environmental Toxicology and
Chemistry 23(5), 1344-1354, 2004
33 Sulfamethoxazole P. subcapitata Chronic NOEC 355.34
Ferrari et al., Environmental Toxicology and
Chemistry 23(5), 1344-1354, 2004
34 Sulfamethoxazole C. meneghiniana Chronic NOEC 4935.2
Ferrari et al., Environmental Toxicology and
Chemistry 23(5), 1344-1354, 2004
35 Sulfamethoxazole H. attenuata Chronic LOEC 394820
Quinn et al., Science of the
total environment 389 (2008) 306-
314
36 Sulfamethoxazole River biofilms Chronic LOEC 1.9741
Yergeau et al., Applied and
environmental microbiology, 76, 16, 5432-5439, 2010
37 Sulfamethoxazole L. gibba Chronic EC10 43.430 Brain et al.,
Environmental Toxicology and
88
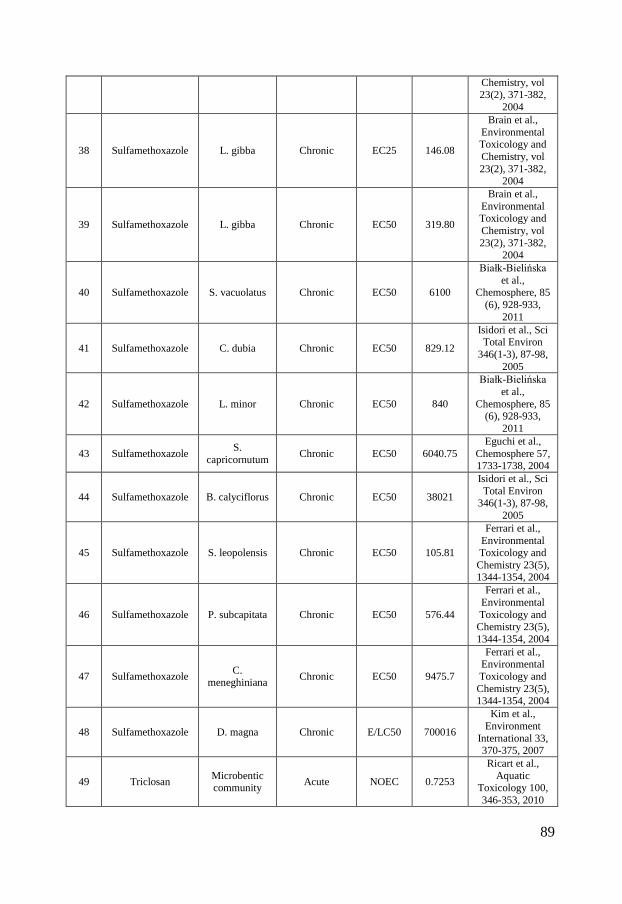
Chemistry, vol 23(2), 371-382,
2004
38 Sulfamethoxazole L. gibba Chronic EC25 146.08
Brain et al., Environmental Toxicology and Chemistry, vol 23(2), 371-382,
2004
39 Sulfamethoxazole L. gibba Chronic EC50 319.80
Brain et al., Environmental Toxicology and Chemistry, vol 23(2), 371-382,
2004
40 Sulfamethoxazole S. vacuolatus Chronic EC50 6100
Białk-Bielińska et al.,
Chemosphere, 85 (6), 928-933,
2011
41 Sulfamethoxazole C. dubia Chronic EC50 829.12
Isidori et al., Sci Total Environ
346(1-3), 87-98, 2005
42 Sulfamethoxazole L. minor Chronic EC50 840
Białk-Bielińska et al.,
Chemosphere, 85 (6), 928-933,
2011
43 Sulfamethoxazole S. capricornutum Chronic EC50 6040.75
Eguchi et al., Chemosphere 57, 1733-1738, 2004
44 Sulfamethoxazole B. calyciflorus Chronic EC50 38021
Isidori et al., Sci Total Environ
346(1-3), 87-98, 2005
45 Sulfamethoxazole S. leopolensis Chronic EC50 105.81
Ferrari et al., Environmental Toxicology and
Chemistry 23(5), 1344-1354, 2004
46 Sulfamethoxazole P. subcapitata Chronic EC50 576.44
Ferrari et al., Environmental Toxicology and
Chemistry 23(5), 1344-1354, 2004
47 Sulfamethoxazole C. meneghiniana Chronic EC50 9475.7
Ferrari et al., Environmental Toxicology and
Chemistry 23(5), 1344-1354, 2004
48 Sulfamethoxazole D. magna Chronic E/LC50 700016
Kim et al., Environment
International 33, 370-375, 2007
49 Triclosan Microbentic community Acute NOEC 0.7253
Ricart et al., Aquatic
Toxicology 100, 346-353, 2010
89
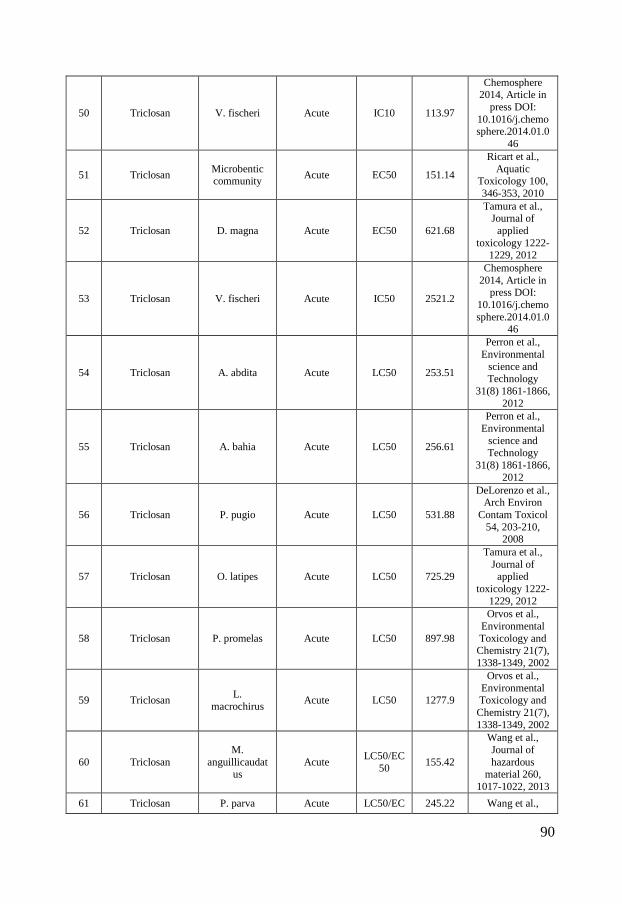
50 Triclosan V. fischeri Acute IC10 113.97
Chemosphere 2014, Article in
press DOI: 10.1016/j.chemosphere.2014.01.0
46
51 Triclosan Microbentic community Acute EC50 151.14
Ricart et al., Aquatic
Toxicology 100, 346-353, 2010
52 Triclosan D. magna Acute EC50 621.68
Tamura et al., Journal of
applied toxicology 1222-
1229, 2012
53 Triclosan V. fischeri Acute IC50 2521.2
Chemosphere 2014, Article in
press DOI: 10.1016/j.chemosphere.2014.01.0
46
54 Triclosan A. abdita Acute LC50 253.51
Perron et al., Environmental
science and Technology
31(8) 1861-1866, 2012
55 Triclosan A. bahia Acute LC50 256.61
Perron et al., Environmental
science and Technology
31(8) 1861-1866, 2012
56 Triclosan P. pugio Acute LC50 531.88
DeLorenzo et al., Arch Environ
Contam Toxicol 54, 203-210,
2008
57 Triclosan O. latipes Acute LC50 725.29
Tamura et al., Journal of
applied toxicology 1222-
1229, 2012
58 Triclosan P. promelas Acute LC50 897.98
Orvos et al., Environmental Toxicology and
Chemistry 21(7), 1338-1349, 2002
59 Triclosan L. macrochirus Acute LC50 1277.9
Orvos et al., Environmental Toxicology and
Chemistry 21(7), 1338-1349, 2002
60 Triclosan M.
anguillicaudatus
Acute LC50/EC50 155.42
Wang et al., Journal of hazardous
material 260, 1017-1022, 2013
61 Triclosan P. parva Acute LC50/EC 245.22 Wang et al.,
90

50 Journal of hazardous
material 260, 1017-1022, 2013
62 Triclosan R. limnocharis Acute LC50/EC50 1789.0
Wang et al., Journal of hazardous
material 260, 1017-1022, 2013
63 Triclosan N. denticulata sinensis Acute LC50/EC
50 2666.3
Wang et al., Journal of hazardous
material 260, 1017-1022, 2013
64 Triclosan T. albonubes Acute LC50/EC50 3070.4
Wang et al., Journal of hazardous
material 260, 1017-1022, 2013
65 Triclosan C. auratus Acute LC50/EC50 6351.5
Wang et al., Journal of hazardous
material 260, 1017-1022, 2013
66 Triclosan L. hoffmeisteri Acute LC50/EC
50 7066.4
Wang et al., Journal of hazardous
material 260, 1017-1022, 2013
67 Triclosan C. plumosus Acute LC50/EC50 9981.3
Wang et al., Journal of hazardous
material 260, 1017-1022, 2013
68 Triclosan P. subcapitata Chronic NOEC 0.6908
Yang et al., Environmental Toxicology and
Chemistry 27(5), 1201-1208, 2008
69 Triclosan S. subspicatus Chronic NOEC 1.7269
Orvos et al., Environmental Toxicology and
Chemistry 21(7), 1338-1349, 2002
70 Triclosan D. tertiolecta Chronic NOEC 5.526
DeLorenzo et al., Arch Environ
Contam Toxicol 54, 203-210,
2008
71 Triclosan C. dubia Chronic NOEC 20.723
Orvos et al., Environmental Toxicology and
Chemistry 21(7), 1338-1349, 2002
72 Triclosan D. rerio Chronic NOEC 89.798
Tamura et al., Journal of
applied toxicology 1222-
1229, 2012
91

73 Triclosan Stream algal communities Chronic LOEC 0.0518
Wilson et al., Environ. Sci. &
Tech, 37, 9, 2003
74 Triclosan E. Coli Chronic LOEC 0.3454
Pasquini et al., Science of the
Total Environment
463–464, 355–365, 2013
75 Triclosan Sludge bactera Chronic LOEC 1.7269
Pasquini et al., Science of the
Total Environment
463–464, 355–365, 2013
76 Triclosan Fresh water microbial
communities Chronic LOEC 10
Johnson et al., Env. Microbiol. 11(7), 1682-91,
2009
77 Triclosan C. crescentus Chronic LOEC 100
Johnson et al., Env. Microbiol. 11(7), 1682-91,
2009
78 Triclosan O. latipes Chronic LOEC 1081.0
Ishibashi et al., Aquatic
toxicology 67, 2004
79 Triclosan Sphingomonas sp. Chronic LOEC 3453.8
Kim et al., Bioresource
Technology 102, 2206-2212, 2011
80 Triclosan B. xenovorans Chronic LOEC 34538
Kim et al., Bioresource
Technology 102, 2206-2212, 2011
81 Triclosan S. wittichii Chronic LOEC 34538
Kim et al., Bioresource
Technology 102, 2206-2212, 2011
82 Triclosan M.
anguillicaudatus
Chronic EC10 31.084
Wang et al., Journal of hazardous
material 260, 1017-1022, 2013
83 Triclosan D. magna Chronic EC10 100.16
Wang et al., Journal of hazardous
material 260, 1017-1022, 2013
84 Triclosan T. albonubes Chronic EC10 300.48
Wang et al., Journal of hazardous
material 260, 1017-1022, 2013
85 Triclosan A. flos-aquae Chronic EC25 2.314
Orvos et al., Environmental Toxicology and
Chemistry 21(7), 1338-1349, 2002
92

86 Triclosan S capricornutum Chronic EC25 8.4272
Orvos et al., Environmental Toxicology and
Chemistry 21(7), 1338-1349, 2002
87 Triclosan N. pelliculosa Chronic EC25 36.955
Orvos et al., Environmental Toxicology and
Chemistry 21(7), 1338-1349, 2002
88 Triclosan L. gibba Chronic EC25 215.86
Orvos et al., Environmental Toxicology and
Chemistry 21(7), 1338-1349, 2002
89 Triclosan S. costatum Chronic EC25 227.95
Orvos et al., Environmental Toxicology and
Chemistry 21(7), 1338-1349, 2002
90 Triclosan S. subspicatus Chronic EC50 2.4176
Orvos et al., Environmental Toxicology and
Chemistry 21(7), 1338-1349, 2002
91 Triclosan A. flos-aquae Chronic EC50 3.3501
Orvos et al., Environmental Toxicology and
Chemistry 21(7), 1338-1349, 2002
92 Triclosan S. vacuolatus Chronic EC50 6.5621
Franz et al., Aquatic
Toxicology 90, 102-108, 2008
93 Triclosan D. tertiolecta Chronic EC50 12.261
DeLorenzo et al., Inc. Environ
Toxicol 23, 224-232, 2008
94 Triclosan S capricornutum Chronic EC50 15.404
Orvos et al., Environmental Toxicology and
Chemistry 21(7), 1338-1349, 2002
95 Triclosan N. pelliculosa Chronic EC50 65.967
Orvos et al., Environmental Toxicology and
Chemistry 21(7), 1338-1349, 2002
96 Triclosan Marine
periphyton communites
Chronic EC50 1166
Backhaus et al., Environmental toxicology and
Chemistry 30(9), 2030-2040, 2011
97 Triclosan N. palea Chronic EC50 1347.0
Franz et al., Aquatic
Toxicology 90, 102-108, 2008
98 Triclosan Limnic periphyton Chronic EC50 3108.4 Franz et al.,
Aquatic
93

communites Toxicology 90, 102-108, 2008
99 Triclosan L. minor Chronic EC50 5836.8
Kuster et al., Environmental
Science and Pollution
Research - International
14(6), 377, 2007
100 Triclosan P. subcapitata Chronic IC50 1.8
Yang et al., Environmental Toxicology and
Chemistry 27(5), 1201-1208, 2008
94