
Hatch’s LCA on Nuclear, Wind, and Natural Gas Generation · PDF fileCanadian Nuclear...
103
This document contains confidential information intended only for the person(s) to whom it is addressed. The information in this document may not be disclosed to, or used by, any other person without Hatch's prior written consent. Lifecycle Assessment Literature Review of Nuclear, Wind and Natural Gas Power Generation Prepared for The Canadian Nuclear Association H345621-236-02 Rev. E October 9, 2014
Transcript of Hatch’s LCA on Nuclear, Wind, and Natural Gas Generation · PDF fileCanadian Nuclear...

This document contains confidential information intended only for the person(s) to whom it is addressed. The information in this document may not be disclosed to, or used by, any other person without Hatch's prior written consent.
Lifecycle Assessment Literature Review of Nuclear, Wind and Natural
Gas Power Generation
Prepared for
The Canadian Nuclear Association
H345621-236-02 Rev. E
October 9, 2014

Canadian Nuclear Association - Meta-analysis LCA of Power Generation Lifecycle Assessment Literature Review of Nuclear, Wind and Natural Gas Power Generation - October 9, 2014
H345621-236-02, Rev. E Page ii
© Hatch 2014 All rights reserved, including all rights relating to the use of this document or its contents.
This report was prepared by Hatch Ltd. (“Hatch”) for the sole and exclusive use by the
Canadian Nuclear Association (the “Owner”) for the purpose of reporting an objective and
transparent compilation and review of Life Cycle Assessment (LCA) data pertaining to
nuclear, wind and natural gas power generation (the “Project”), and may not be relied
upon by any third party. Any use of this report by the Owner is subject to the terms and
conditions of the services agreement H-345621-0000-313-001 between Hatch and the
Owner dated January 24, 2014, including the limitations on liability set out therein.
This report is meant to be read as a whole, and sections should not be read or relied
upon out of context. The report includes information sourced from published literature
sources. Unless specifically stated otherwise, Hatch has not verified such information
and disclaims any responsibility or liability in connection with such information.
This report contains the expression of the professional opinion of Hatch, based upon
information available at the time of preparation. The quality of the information,
conclusions and estimates contained herein is consistent with the intended level of
accuracy as set out in this report, as well as the circumstances and constraints under
which this report was prepared.
This report is a meta-analysis of independent LCA studies and, accordingly, all estimates
and projections contained herein are limited by the accuracy and availability of data
available from published LCA studies. Therefore, while the work, results, estimates and
projections herein may be considered to be generally indicative of the nature and quality
of the Project, they are not definitive.

Canadian Nuclear Association - Meta-analysis LCA of Power Generation Lifecycle Assessment Literature Review of Nuclear, Wind and Natural Gas Power Generation - October 9, 2014
H345621-236-02, Rev. E Page iii
© Hatch 2014 All rights reserved, including all rights relating to the use of this document or its contents.
Table of Contents
List of Figures ............................................................................................................................................ vi
List of Tables ............................................................................................................................................. vii
Executive Summary ................................................................................................................................. viii
1. Introduction ........................................................................................................................................... 1
1.1 Background ................................................................................................................................... 1
1.2 Objectives and Scope ................................................................................................................... 2
1.3 Approach ....................................................................................................................................... 2
1.4 Lifecycle Assessment Overview ................................................................................................... 3
1.5 Report Structure ............................................................................................................................ 4
2. LCA Scope and System Boundaries .................................................................................................. 5
2.1 Power Generation Scenarios ........................................................................................................ 5
2.2 System Boundaries ....................................................................................................................... 5 2.2.1 Supply Chain ....................................................................................................................... 7 2.2.2 Lifespan ............................................................................................................................... 7 2.2.3 Exclusions ........................................................................................................................... 8 2.2.4 Partial Inclusions ................................................................................................................. 8
2.3 Geographical, Temporal and Technological Scope ...................................................................... 9
2.4 Environmental Indicators ............................................................................................................ 10 2.4.1 Greenhouse Gases (GHGs) ............................................................................................. 11 2.4.2 Nitrogen Oxides (NOX) ...................................................................................................... 11 2.4.3 Sulphur Oxides (SOX) ....................................................................................................... 12 2.4.4 Particular Matter (PM) ....................................................................................................... 12 2.4.5 Ionizing radiation (IR) ........................................................................................................ 12
2.5 Functional Unit ............................................................................................................................ 14
3. Literature Review and Meta-analysis Methodology ........................................................................ 15
3.1 Overview ..................................................................................................................................... 15
3.2 Literature Review ........................................................................................................................ 16 3.2.1 Search ............................................................................................................................... 17 3.2.2 Scope Screen .................................................................................................................... 18 3.2.3 Documentation .................................................................................................................. 18 3.2.4 Quality Assessment .......................................................................................................... 18 3.2.5 Gap Analysis ..................................................................................................................... 19
3.3 Data Collection and Synthesis .................................................................................................... 20 3.3.1 Data Compilation ............................................................................................................... 21 3.3.2 System Boundary Adjustment ........................................................................................... 21 3.3.3 Cluster Analysis ................................................................................................................ 25 3.3.4 Assessment of Statistical Outliers ..................................................................................... 25
3.4 LCA Dataset Characteristics ....................................................................................................... 27 3.4.1 System Boundary Coverage ............................................................................................. 27 3.4.2 Geographical Coverage .................................................................................................... 28

Canadian Nuclear Association - Meta-analysis LCA of Power Generation Lifecycle Assessment Literature Review of Nuclear, Wind and Natural Gas Power Generation - October 9, 2014
H345621-236-02, Rev. E Page iv
© Hatch 2014 All rights reserved, including all rights relating to the use of this document or its contents.
3.4.3 Temporal Coverage .......................................................................................................... 28 3.4.4 Technological Coverage ................................................................................................... 29
3.5 Lifecycle Modelling...................................................................................................................... 29 3.5.1 Analysis of Process Stage and Aggregated Lifecycle Data .............................................. 30 3.5.2 Linking Process Stages .................................................................................................... 31
4. Description of Power Generation Scenarios ................................................................................... 33
4.1 Wind Power Generation .............................................................................................................. 33 4.1.1 Upstream Supply Chain .................................................................................................... 33 4.1.2 Operation .......................................................................................................................... 34 4.1.3 Waste Management .......................................................................................................... 34 4.1.4 Construction ...................................................................................................................... 34 4.1.5 Decommissioning .............................................................................................................. 35
4.2 Nuclear Scenario ........................................................................................................................ 35 4.2.1 Upstream Supply Chain .................................................................................................... 36 4.2.2 Operation .......................................................................................................................... 38 4.2.3 Waste Management .......................................................................................................... 39 4.2.4 Construction ...................................................................................................................... 40 4.2.5 Decommissioning .............................................................................................................. 40
4.3 Natural Gas Scenario ................................................................................................................. 40 4.3.1 Upstream Supply Chain .................................................................................................... 41 4.3.2 Operation .......................................................................................................................... 42 4.3.3 Waste Management .......................................................................................................... 43 4.3.4 Construction ...................................................................................................................... 43 4.3.5 Decommissioning .............................................................................................................. 44
4.4 Wind/Natural Gas Scenario ........................................................................................................ 44
5. Results ................................................................................................................................................. 45
5.1 Guide to Interpreting Results ...................................................................................................... 45
5.2 Total Lifecycle Emissions ........................................................................................................... 46
5.3 Lifecycle Distribution ................................................................................................................... 50 5.3.1 Overview ........................................................................................................................... 50 5.3.2 Wind Power ....................................................................................................................... 51 5.3.3 Nuclear Power ................................................................................................................... 53 5.3.4 Natural Gas Power Generation ......................................................................................... 55 5.3.5 Wind and Natural Gas Mix ................................................................................................ 57
5.4 Natural Gas Sources .................................................................................................................. 58
5.5 Ionizing Radiation Potential ........................................................................................................ 60
6. Discussion ........................................................................................................................................... 62
6.1 Comparison of Power Generation Lifecycles ............................................................................. 62
6.2 Contribution of Lifecycle Process Stages ................................................................................... 62
6.3 Influence of System Boundary and Modeling Variations ............................................................ 63
6.4 Influence of LCA Literature & Data Availability ........................................................................... 65
6.5 Comparison to Other LCA Literature Reviews ........................................................................... 66
6.6 Study Limitations......................................................................................................................... 68

Canadian Nuclear Association - Meta-analysis LCA of Power Generation Lifecycle Assessment Literature Review of Nuclear, Wind and Natural Gas Power Generation - October 9, 2014
H345621-236-02, Rev. E Page v
© Hatch 2014 All rights reserved, including all rights relating to the use of this document or its contents.
7. Conclusions ........................................................................................................................................ 70
8. References .......................................................................................................................................... 72
9. Bibliography ........................................................................................................................................ 74
Appendix A - Summary of Statistical Results ........................................................................................ 88

Canadian Nuclear Association - Meta-analysis LCA of Power Generation Lifecycle Assessment Literature Review of Nuclear, Wind and Natural Gas Power Generation - October 9, 2014
H345621-236-02, Rev. E Page vi
© Hatch 2014 All rights reserved, including all rights relating to the use of this document or its contents.
List of Figures
Figure 1. ISO 14040 LCA Project Stages ..................................................................................................... 3 Figure 2. General System Boundary ............................................................................................................. 6 Figure 3. Literature Review and Meta-analysis Methodology Steps .......................................................... 16 Figure 4. Data Collection Methodology ....................................................................................................... 17 Figure 5. Gap Analysis for Final Scope and System Boundaries ............................................................... 19 Figure 6. Data Collection and Synthesis Approach .................................................................................... 21 Figure 7. Distribution of Operating Lifetimes Found in LCA Literature by Power Generation Scenario ..... 23 Figure 8. Influence of Operating Lifetime Over Total Lifecycle Emissions ................................................. 24 Figure 9. Treatment of Statistical Outliers ................................................................................................... 26 Figure 10. Regional Coverage .................................................................................................................... 28 Figure 11. Temporal Coverage ................................................................................................................... 29 Figure 12. LCA Modelling Methodology ...................................................................................................... 30 Figure 13. Wind Scenario Detailed System Boundaries ............................................................................. 33 Figure 14. Nuclear Scenario Detailed System Boundaries ......................................................................... 36 Figure 15. Natural Gas Scenario Detailed System Boundaries .................................................................. 41 Figure 16. Natural Gas Combined Cycle Generation ................................................................................. 43 Figure 17. Schematic Plot Used to Represent the Mean and Distribution of Literature Data .................... 45 Figure 18. Summary of Total Lifecycle Emissions ...................................................................................... 47 Figure 19. Total Lifecycle Emissions (Statistical Approach) ....................................................................... 48 Figure 20. Percentage Contribution of Lifespan and Supply Chain Process Stages to Total Lifecycle Emissions .................................................................................................................................................... 50 Figure 21. Lifecycle Distribution for Onshore Wind Turbines ..................................................................... 52 Figure 22. Lifecycle Distribution for Nuclear Power Plants ......................................................................... 54 Figure 23. Lifecycle Distribution for Natural Gas Combined Cycle Power Plants ...................................... 56 Figure 24. Lifecycle Distribution for Mix of Onshore Wind Turbines and Natural Gas Combined Cycle .... 58 Figure 25. Emissions from Different Natural Gas Sources ......................................................................... 59 Figure 26. Lifecycle Distribution of IR for Nuclear Power Plants ................................................................ 60 Figure 27. Percentage Contribution of IR to Lifecycle for Nuclear Power Plants ....................................... 61

Canadian Nuclear Association - Meta-analysis LCA of Power Generation Lifecycle Assessment Literature Review of Nuclear, Wind and Natural Gas Power Generation - October 9, 2014
H345621-236-02, Rev. E Page vii
© Hatch 2014 All rights reserved, including all rights relating to the use of this document or its contents.
List of Tables
Table 1. Global Warming Potential (GWP) for 100 Year Time Horizon ...................................................... 11 Table 2. Radioactivity of Selected Materials (10)........................................................................................ 13 Table 3. Total Lifecycle IR Emissions for Nuclear Power (11).................................................................... 14 Table 4. Number of Screened Studies Considered .................................................................................... 28 Table 5. Statistical Mean Total Lifecycle Emissions ................................................................................... 47 Table 6. Comparison of Lifecycle Emissions from Recent Literature Reviews .......................................... 67 Table 7. Summary Of Statistics of Qualified Studies for Onshore Wind Turbines ...................................... 89 Table 8. Summary of Statistics of Qualified Studies for Nuclear Power Plants .......................................... 89 Table 9. Summary of Statistics of Qualified Studies for Natural Gas Combined Cycle Power Plants ....... 90 Table 10. Summary of Statistics of Qualified Studies for Mix of Onshore Wind Turbines and Natural Gas Combined Cycle Power Plants.................................................................................................................... 90 Table 11. Summary of IR Statistics of Qualified Studies for Nuclear Power Plants ................................... 91 Table 12. Summary of Statistics of Qualified Studies for Natural Gas Sources ......................................... 91

Canadian Nuclear Association - Meta-analysis LCA of Power Generation Lifecycle Assessment Literature Review of Nuclear, Wind and Natural Gas Power Generation - October 9, 2014
H345621-236-02, Rev. E Page viii
© Hatch 2014 All rights reserved, including all rights relating to the use of this document or its contents.
Executive Summary
The Canadian Nuclear Association (CNA) commissioned Hatch Ltd. to conduct an
independent comparison of Life Cycle Assessment (LCA) data covering the environmental
performance of nuclear, wind and natural gas power generation scenarios relevant within a
Canadian context.
Using a combined literature review and meta-analysis methodology, the present study
compiles data from previous LCA projects and synthesises the data to conform to a common
set of model parameters and system boundaries. The study focuses on four power
generation scenarios:
Onshore wind generation;
Nuclear power, considering all types of commercial reactors;
Natural gas combined cycle (NGCC); and
A total generation mix of onshore wind (20%) and NGCC (80%) generation.
The system boundaries of the study cover the full lifecycle of each power generation
scenario, encompassing a broad range of processes for each power generation scenario,
including:
Upstream and downstream supply chain processes from extraction and processing of
fuels through to waste management;
Power plant operations;
The lifespan of the power generating facility itself, from acquisition and application of
construction materials through to decommissioning at end of life.
For each generation scenario and process stage, the study presents the distribution of LCA
data available on the greenhouse gas emissions (GHG), nitrogen oxides (NOX), sulfur oxides
(SOX), particulate matter (PM) and ionizing radiation (IR) associated with the generation of
electricity delivered to the power grid. The information presented in this report is intended to
provide the basis with which to make qualified comparisons of the average contribution of
nuclear, wind and natural gas to each emission category, while considering the full range of
LCA data presented in the literature.
To ensure a transparent and unbiased assessment of the literature, a systematic approach
was applied to review the LCA studies and incorporate them into the final dataset and results.
A statistical screening process based on a cluster analysis was performed to flag cases
where a detailed review of system boundary conformance was required before inclusion in
the final dataset. A statistical representation of the distribution of LCA data in the final
dataset was provided, documenting the mean as well as the standard deviation and
uncertainty of the mean, to help qualify the variation in LCA results and the reliability of the
mean value reported by this study.
Canadian Nuclear Association - Meta-analysis LCA of Power Generation Lifecycle Assessment Literature Review of Nuclear, Wind and Natural Gas Power Generation - October 9, 2014
H345621-236-02, Rev. E Page ix
© Hatch 2014 All rights reserved, including all rights relating to the use of this document or its contents.
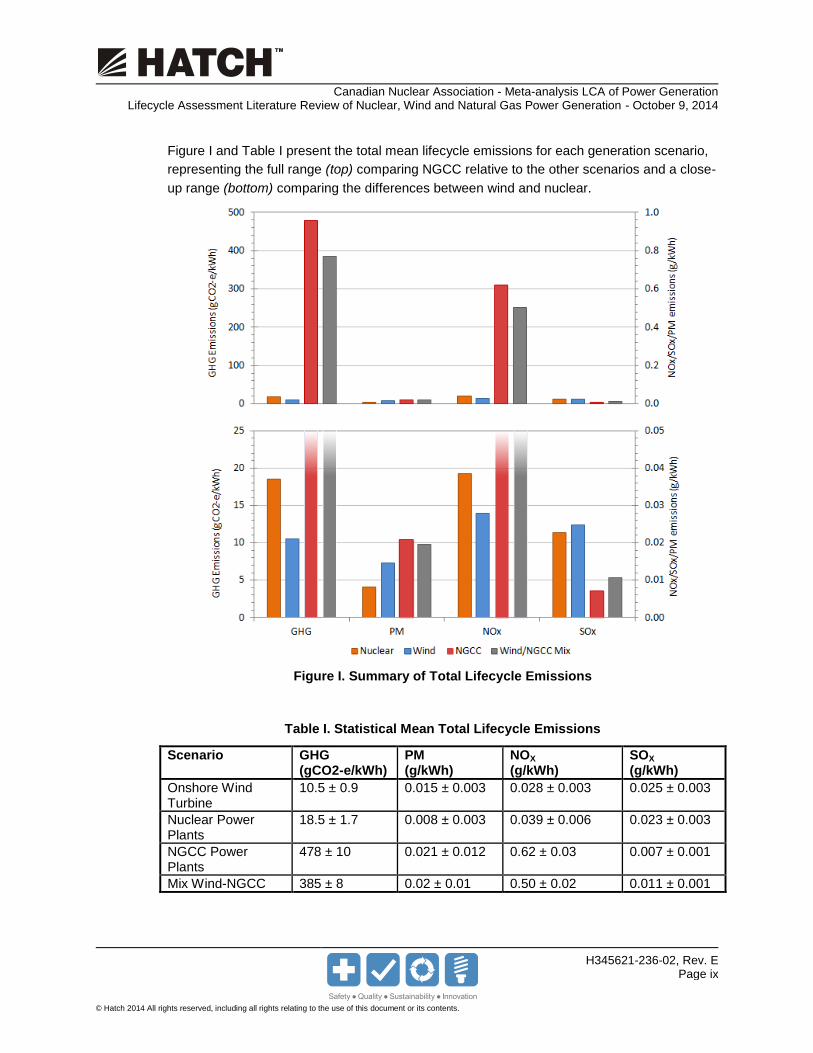
Figure I and Table I present the total mean lifecycle emissions for each generation scenario,
representing the full range (top) comparing NGCC relative to the other scenarios and a close-
up range (bottom) comparing the differences between wind and nuclear.
Figure I. Summary of Total Lifecycle Emissions
Table I. Statistical Mean Total Lifecycle Emissions
Scenario GHG (gCO2-e/kWh)
PM (g/kWh)
NOX (g/kWh)
SOX (g/kWh)
Onshore Wind Turbine
10.5 ± 0.9 0.015 ± 0.003 0.028 ± 0.003 0.025 ± 0.003
Nuclear Power Plants
18.5 ± 1.7 0.008 ± 0.003 0.039 ± 0.006 0.023 ± 0.003
NGCC Power Plants
478 ± 10 0.021 ± 0.012 0.62 ± 0.03 0.007 ± 0.001
Mix Wind-NGCC 385 ± 8 0.02 ± 0.01 0.50 ± 0.02 0.011 ± 0.001

Canadian Nuclear Association - Meta-analysis LCA of Power Generation Lifecycle Assessment Literature Review of Nuclear, Wind and Natural Gas Power Generation - October 9, 2014
H345621-236-02, Rev. E Page x
© Hatch 2014 All rights reserved, including all rights relating to the use of this document or its contents.
The study concludes that GHG and NOX emissions from nuclear and wind power plants are
orders of magnitude less than NGCC power plants, while the difference in emissions of PM
and SOX for each scenario is less pronounced, and difficult to resolve due to limited
availability of LCA data.
Wind and nuclear power are similar, where the average emissions from nuclear relative to
wind are slightly elevated for GHG and NOX and reduced for PM and SOX, respectively.
However, when the intermittency of wind is compensated for by a steady power supply – in
this case modeled in the wind-NGCC scenario – the emissions profile takes the shape of the
backing power source (i.e. NGCC), diluted by wind power.
The study also investigated the differences in emissions between upstream natural gas
sources, determining that GHG emissions from shale gas are slightly larger than conventional
natural gas, while the difference in NOX, SOX, and PM was inconclusive.
By representing the range of data available in the literature for each individual process stage,
variations in the results could be linked to the modelling parameters used in the LCA literature
as well as the influence of technological and process differences within the system
boundaries of each scenario. This additional information, documented in this report, provides
a basis of understanding of the strengths and weaknesses of the data, and helps explain
some of the root causes for discrepancies across LCA studies applied to the power sector.

Canadian Nuclear Association - Meta-analysis LCA of Power Generation Lifecycle Assessment Literature Review of Nuclear, Wind and Natural Gas Power Generation - October 9, 2014
H345621-236-02, Rev. E Page 1
© Hatch 2014 All rights reserved, including all rights relating to the use of this document or its contents.
1. Introduction
1.1 Background
The future of the energy and electricity supply sector in Canada will have a profound and
long-lasting role in reducing greenhouse gas emissions and facilitating the transition to a low-
carbon economy. Rapidly changing technology including the emergence of shale gas
requires an up-to-date understanding of the environmental performance of available energy
supply options to develop a roadmap towards meeting Canada‘s environmental and
economic objectives.
The Canadian Nuclear Association (CNA) commissioned Hatch Ltd. (Hatch) to conduct an
independent comparison of the environmental performance of various power generation
scenarios relevant within a Canadian context. Hatch is an employee-owned global
multidisciplinary engineering consulting company headquartered in Mississauga, Ontario.
Hatch serves the global mining and metals, energy and infrastructure sectors with projects in
more than 150 countries. As part of its experience, Hatch has designed and constructed
facilities spanning the entire electricity generation supply chain for a range of renewable and
non-renewable power generation. Hatch has an in-house LCA group working together with
our industry experts to incorporate lifecycle thinking and environmental design into projects.
Using a combined literature review and meta-analysis methodology, the present study
compiles previous Life Cycle Assessment (LCA) projects pertaining to the supply chain of
nuclear, wind and natural gas combined cycle generation under comparable parameters and
system boundaries. The purpose of the study was to compile accurate, objective, and
comparable scientific data on the environmental footprint of each generation scenario.
LCA, standardized under ISO 14040, is the most widely accepted comprehensive measure of
environmental performance. This study builds off of previous LCA literature reviews with
updated data representing technology improvements and incorporating a broader range of
upstream and downstream processes associated with construction, decommissioning, and
waste management. The meta-analysis approach adopted synthesized LCA literature data to
conform to similar system boundaries with which to compare each power generation
scenario.
For each generation scenario and process stage, the study presents the distribution of LCA
data available on the greenhouse gas emissions (GHG), nitrogen oxides (NOX), sulfur oxides
(SOX), particulate matter (PM) and ionizing radiation (IR) associated with the generation of
electricity delivered to the power grid. The information presented in this report is intended to
provide the basis with which to make qualified comparisons of the average contribution of
nuclear, wind and natural gas to each emission category, while considering the full range of
LCA data presented in the literature.

Canadian Nuclear Association - Meta-analysis LCA of Power Generation Lifecycle Assessment Literature Review of Nuclear, Wind and Natural Gas Power Generation - October 9, 2014
H345621-236-02, Rev. E Page 2
© Hatch 2014 All rights reserved, including all rights relating to the use of this document or its contents.
1.2 Objectives and Scope
The ultimate aim of this study was to provide an objective, scientific-based comparison of the
environmental emissions associated with the supply chain and lifespan of nuclear, natural
gas and wind power generation facilities. Specific objectives of the study were to:
Focus on published LCA data that is well documented, relevant, and current;
Maintain the same conditions and system boundaries for each generation scenario;
Understand and document the range of LCA data represented in the literature;
Limit any manipulation of the data to the minimum number of approximations and
assumptions necessary to model each generation scenario.
With these objectives in mind, the study compiled and documented LCA data covering a
broad scope of processes for each power generation scenario, including:
Upstream and downstream supply chain processes from extraction and processing of
fuels through to waste management;
Power plant operations;
The lifespan of the power plant from acquisition and application of construction
materials through plant decommissioning at end of life.
For each scenario and process stage, the literature review covered emissions of GHG, NOX,
SOX, PM and IR.
While wind is presented as a standalone scenario, the study also presents a merged wind
and natural gas combined cycle scenario reflecting a hypothetical electricity grid mix where
wind power is supported by natural gas to compensate for the intermittency of wind supply.
Based on grid infrastructure currently in place in Canada, this scenario considers 20% of total
electricity generated as a practical maximum proportion of intermittent power supply possible
without compromising the ability of the grid to respond to changing electricity demand.
Within the natural gas combined cycle generation scenario, the supply of natural gas has
been divided into conventional, unconventional and shale gas for comparison.
1.3 Approach
Hatch used a two-phased approach, starting with a literature review and gap analysis,
followed by a meta-analysis and LCA modeling phase to combine and synthesize the
literature data to conform to a common set of system boundaries for each generation
scenario.
The literature review focused on documenting a broad range of LCA studies, covering each
generation scenario, process stage, and emission type. The goal of the literature review was
to gather the greatest number of relevant and current LCA studies possible to cover the
scope of the study with the largest dataset possible. Following the review, a gap analysis
was performed to evaluate the strength of coverage achieved by the dataset.

Canadian Nuclear Association - Meta-analysis LCA of Power Generation Lifecycle Assessment Literature Review of Nuclear, Wind and Natural Gas Power Generation - October 9, 2014
H345621-236-02, Rev. E Page 3
© Hatch 2014 All rights reserved, including all rights relating to the use of this document or its contents.
The meta-analysis and modeling phase involved compiling LCA data extracted from the
literature review, and assembling the data in LCA models representing each power
generation scenario. The modeled data was assessed using a number of statistical
approaches to refine the data to match the system boundaries of the study. The results of
the analysis comprise the main findings of the study, including the mean, uncertainty of the
mean, and standard deviation of emissions associated with each generation scenario and
process.
1.4 Lifecycle Assessment Overview
Lifecycle Assessment (LCA) measures the environmental impacts of a product by modeling
the processes, materials consumed and emissions at each stage of the product lifecycle,
extending beyond the conventional operational boundaries of any one company or process
stage (1). The process of conducting an LCA is standardized under ISO 14040, consisting of
a four-step process including goal and scope definition, inventory analysis, impact
assessment, and interpretation (Figure 1).
Figure 1. ISO 14040 LCA Project Stages
The goal and scope aligns the stakeholders and project team on the course and outcomes of
the LCA study . The goal determines the context of the study, the audience and how the
results are intended to be used. The scope of the study defines what is included and
excluded in the system, defining the system boundary of the project (process/activities
included), the functional unit, and the geographical, temporal and technological coverage.
The inventory analysis stage consists of data collection and modeling to produce a lifecycle
inventory (LCI) containing all inputs and outputs for each of the process stage within the
system boundary. The LCI serves as the basis for calculating potential environmental impacts
during the Lifecycle Impact Assessment (LCIA) stage. The final step is the interpretation of
the results to provide conclusions and recommendations.

Canadian Nuclear Association - Meta-analysis LCA of Power Generation Lifecycle Assessment Literature Review of Nuclear, Wind and Natural Gas Power Generation - October 9, 2014
H345621-236-02, Rev. E Page 4
© Hatch 2014 All rights reserved, including all rights relating to the use of this document or its contents.
1.5 Report Structure
This report presents the goals, system boundaries, methodology and results of the meta-analysis
LCA. The following list provides an outline of the contents of each chapter:
Section 2 – LCA Scope and System Boundaries defines the scope and system
boundaries of the study for each power generation scenario, including the supply chain,
lifespan, temporal, geographical and technological coverage included in the study.
Section 3 – Literature Review and Meta-analysis Methodology documents the
methodology used to carry out the study and ensure validity of the results, including a
description of the literature review and gap analysis, the data compilation and synthesis
approach and the LCA modeling procedure.
Section 4 – Description of Power Scenarios documents each power generation
scenario in greater detail than Section 2, including a description of the supply chain and
lifespan of each generation scenario as well as technological variations found in the
literature.
Section 5 – Results presents the mean, uncertainty of the mean and distribution of
emissions data for each power generation scenario, supply chain and lifespan process
stage relative to a kWh of electricity produced.
Section 6 – Discussion presents a discussion of the results to provide an overall
comparison between the power generation scenarios, limitations of the study, and a
comparison of the results to similar literature review studies.
Section 7 – Conclusions provides conclusions and key findings in the context of the
overall study objectives. Recommendations and future opportunities are also
incorporated.

Canadian Nuclear Association - Meta-analysis LCA of Power Generation Lifecycle Assessment Literature Review of Nuclear, Wind and Natural Gas Power Generation - October 9, 2014
H345621-236-02, Rev. E Page 5
© Hatch 2014 All rights reserved, including all rights relating to the use of this document or its contents.
2. LCA Scope and System Boundaries
This study is intended to generate LCA data based on a meta-analysis of literature data found
in the public domain. In order to ensure that each power generation scenario was compared
on the same basis, a common set of system boundaries was defined for all power generation
scenarios.
The system boundaries define what is included and excluded in the range and mean results
for each power generation scenario and process stage presented in Section 5. This chapter
outlines the general LCA system boundaries considered in the study, while detailed
descriptions of each power generation scenario is provided in Section 4. Section 3
documents the methodology used to execute the literature review and meta-analysis while
adhering to these system boundaries.
The scope and system boundaries include the various power generation scenarios,
environmental emissions, process stages, technologies and time periods covered by the
study. In some cases, slight variations in the system boundaries have been permitted in
order to incorporate studies with minor differences between them, typically contributing to
less than 1% of the total lifecycle emissions in any category. These variations are also
documented in this section.
2.1 Power Generation Scenarios
This study provides a complete lifecycle comparison of the environmental performance of
various power generation scenarios using a similar set of system boundaries. The lifecycle of
the following power generation scenarios have been considered:
Nuclear power production;
Onshore wind power production;
Natural gas combined cycle (NGCC) power production fed by a mix of conventional,
unconventional and shale gas sources;
A mixture of total electricity generated by onshore wind (20%) and NGCC (80%),
reflecting a grid mix with a high proportion of intermittent wind power backed by NGCC.
The following sections discuss aspects of the scope including functional unit, environmental
indicators, regional, temporal and technological coverage, and the system boundaries
applying to each scenario.
2.2 System Boundaries
The LCA meta-analysis is a cradle-to-gate study spanning from resource extraction up to the
production of electricity at the point (or gate) of delivery to the electricity grid. The study
encompasses all upstream and downstream processes associated with the generation of
1kWh of electricity, excluding transmission and distribution losses.

Canadian Nuclear Association - Meta-analysis LCA of Power Generation Lifecycle Assessment Literature Review of Nuclear, Wind and Natural Gas Power Generation - October 9, 2014
H345621-236-02, Rev. E Page 6
© Hatch 2014 All rights reserved, including all rights relating to the use of this document or its contents.
The environmental impacts and emissions in this study were obtained taking into account two
dimensions of their lifecycle:
Supply Chain – processes corresponding to the on-going operation of the power
generation facility, including the upstream systems associated with fuels and
consumables and downstream systems associated with the management and
disposal or wastes.
Lifespan – processes corresponding to the entire lifetime of the power plant from
inception to eventual decommissioning, not otherwise captured in the day-to-day
operation of the plant.
Figure 2 presents the general system boundaries applied to each generation scenario,
showing the supply chain and lifespan definitions used throughout this study.
Figure 2. General System Boundary
The supply chain encompasses the extraction, production and transportation of raw materials
(fuels and consumables) to the power plant, operations and maintenance, and the
management of all waste associated with the activities of the power plant.
The lifespan includes all the process stages required build and disassemble the power plant
at the start and end of the plant‘s lifetime, including the extraction, production, transportation
and application of materials and fuels used during construction, as well as the disassembly
and disposal or re-use of plant materials during decommissioning.
Combined, the supply chain and lifespan represent the complete range of processes directly
and indirectly required to generate electricity from each generation scenario.

Canadian Nuclear Association - Meta-analysis LCA of Power Generation Lifecycle Assessment Literature Review of Nuclear, Wind and Natural Gas Power Generation - October 9, 2014
H345621-236-02, Rev. E Page 7
© Hatch 2014 All rights reserved, including all rights relating to the use of this document or its contents.
The following subsections present a general description of the system boundary of each
process stage selected for this study. A detailed description of each stage of the lifecycle, for
each of the power generation scenarios, is presented in Section 4.
2.2.1 Supply Chain
The supply chain consists of all upstream, on-site and downstream processes associated
with the regular operation of the power plant. Supply chain emissions are primarily
associated with the fuel consumed to generate electricity. The supply chain has been divided
into three process groups – upstream supply chain, power plant operations, and waste
management, each represented relative to 1 kWh of generated electricity.
Upstream Supply Chain
The upstream supply chain includes the environmental impacts associated with the
extraction, production and transportation of all fuels and auxiliary substances and chemicals
used in the operation of the power plant. Note that the upstream supply chain excludes
resource exploration for each generation scenario.
Operations & Maintenance
The operations stage encompasses the environmental impacts associated with the normal
operation and maintenance of the power plant. Emissions from power plant operations are
primarily a result of fuel consumption.
Waste Management
Waste management includes emissions associated with the waste disposal and treatment of
all wastes generated during normal operation and maintenance of the power plant, occurring
on site or downstream of the facility.
2.2.2 Lifespan
The lifespan consists of all upstream, on-site and downstream processes at the start and end
of the plant‘s natural lifespan. Lifespan emissions are primarily associated with the fuels and
building materials consumed during construction and the disassembly and waste
management activities during decommissioning. The lifespan has been divided into two
process groups – construction and decommissioning, each represented relative to 1 kWh of
generated electricity.
Lifespan emissions were distributed to each unit of power generated by the plant by
incorporating the operating lifetime of the facility. The literature reviewed considered a range
of plant operating lifetimes for each of the scenarios, which were normalized in order to
compare all the scenarios on the same basis. This methodology is described further in
Section 3.3.2.2.
Construction
The construction stage includes the environmental impacts associated with the extraction,
production and transportation of all necessary materials required for the construction of the
Canadian Nuclear Association - Meta-analysis LCA of Power Generation Lifecycle Assessment Literature Review of Nuclear, Wind and Natural Gas Power Generation - October 9, 2014
H345621-236-02, Rev. E Page 8
© Hatch 2014 All rights reserved, including all rights relating to the use of this document or its contents.
power plants. The electricity and fuel required for construction activities are also included in
this stage.
Decommissioning
The decommissioning phase covers all environmental impacts associated with the site work
for the dismantling of the power plant, the transportation of waste to authorized agents, and
the impacts/credits associated with waste management and treatment.
2.2.3 Exclusions
The following processes are not included within the system boundaries of the study:
Resource Exploration
The resource exploration preceding extraction of raw materials has been excluded from this
study due to insufficient coverage of this process by previous LCA studies. The exploration
phase includes prospecting, surveying and drilling and forms only a minor contribution to the
lifecycle of each power generation scenario, below the cut-off criteria of most LCAs.
Moreover, the link between the extent of exploration activities that lead to an operating mine
is difficult to establish. While minor, exploration is expected to contribute emissions to each
power generation lifecycle, principally through energy exploration but also through mineral
exploration associated with construction materials and on-going maintenance.
Transmission and Distribution
Transmission and distribution (T&D) infrastructure and electricity losses were not considered
in accordance with the end-gate of the study – at the point of delivery to the electricity grid. In
cases where a study included T&D losses, emissions were back-calculated to isolate and
remove T&D losses. A detailed description of this procedure is described in Section 3.3.2.1.
Carbon Capture & Storage
This study does not consider any technology with carbon capture as no such technology
appears to be available for general use at grid scale in the near future.
Energy Storage
Energy storage technologies under development aiming to regulate the power supply from
intermittent energy sources including wind and solar power were not considered in this
review.
2.2.4 Partial Inclusions
Some processes are permitted to be within or outside the system boundaries to
accommodate a greater proportion of the LCA literature. These processes are limited to
minor variations in system boundaries that result in a negligible change in the total lifecycle
emissions.

Canadian Nuclear Association - Meta-analysis LCA of Power Generation Lifecycle Assessment Literature Review of Nuclear, Wind and Natural Gas Power Generation - October 9, 2014
H345621-236-02, Rev. E Page 9
© Hatch 2014 All rights reserved, including all rights relating to the use of this document or its contents.
Pipeline Construction
Pipeline construction, primarily within the natural gas lifecycle were partially included and
excluded from the system boundaries of the studies investigated. Based on a study
conducted by the National Energy Technology Laboratory in May 2011, the construction of
pipelines contributes 0.1% of the cradle-to-gate emissions from the natural gas lifecycle (2).
Frequency and Significance of Wind Turbine Maintenance
The literature reviewed included variations in the modelling approximations and assumptions
surrounding turbine maintenance, including travel associated with periodic inspections, the
degree of replacement of worn parts, lubrication and change of oil, or a combination of the
above. The frequency of the maintenance in each study also varied, between four times a
year (3) to once every 5 years (4). For the purpose of this study, data covering all
approximations and assumptions were included, including those studies that did not
specifically reference turbine maintenance.
Wind Farm Size and Capacity
Some studies conducted LCAs on wind farms (group of wind turbines), while others were
conducted on a single wind turbine. For the purpose of this study, LCAs based on wind farms
and individual wind turbines were considered provided each turbine exceeded 100 kW total
capacity.
Maintenance at NGCC Plants
Few studies specifically identify emissions from NGCC plant maintenance separately from
normal plant operations. Moreover, most studies do not provide a full breakdown on the type
of activities considered or the approximations used. As a result, some variations in the type
and frequency of activities are expected. For the purpose of this study, all studies (with and
without specific mention of maintenance activities) were included. The overall impacts of
maintenance activities are negligible relative to combustion-related emissions.
Well Construction for Natural Gas Extraction
While some of the studies specifically included well construction in the system boundaries,
other studies did not document the inclusion or exclusion of this process, but were still
considered in this assessment. Based on a study conducted by the National Energy
Technology Laboratory in September 2013, the construction of wells contributes 2% of
upstream GHG and NOX emissions and 30% of upstream SOX and PM. Over the entire
natural gas power generation lifecycle, well construction generates negligible GHG and NOX
emissions while having a small to moderate contribution to total SOX and PM emissions (5).
2.3 Geographical, Temporal and Technological Scope
The literature reviewed in this study covered primary and modeled LCA data representing
various plants, regions, technologies, and time periods. The following lists the coverage of
the literature review and any limitations applied during the process.

Canadian Nuclear Association - Meta-analysis LCA of Power Generation Lifecycle Assessment Literature Review of Nuclear, Wind and Natural Gas Power Generation - October 9, 2014
H345621-236-02, Rev. E Page 10
© Hatch 2014 All rights reserved, including all rights relating to the use of this document or its contents.
Geographical Coverage
There were no restrictions placed on the regional scope of LCA data reviewed, author origins
or other region-specific mechanism, although English was the language of all literature
reviewed. As a result, notwithstanding other scope and system boundary limits, this study
covers the set of global LCA data corresponding to each generation scenario. The relative
regional weighting in this study is proportional to the regional distribution of LCA literature and
does not necessarily reflect the true proportion of global electricity production.
It is important to note that the location of the study can play a significant role in the
environmental impacts due to the variation of the grid electricity mix, and the availability of
resources. These variations are addressed in further detail in Section 6.
Technological Coverage
The literature was evaluated to restrict the scope of the literature data to the following
technologies for each power generation scenario:
Nuclear: including a mix of upstream uranium processing and/or enrichment, reactor
technology and spent fuel management techniques;
Wind: covering large onshore wind turbines and excluding small-scale and off-shore
turbines;
Natural gas: covering natural gas combined cycle (NGCC) generation sourced by
conventional, unconventional and shale gas sources, excluding other natural gas fired
power plant technology and applications of carbon capture and storage.
While wind is presented as a standalone scenario, the study will also present a merged
onshore wind turbines and NGCC scenario, reflecting a conservative maximum proportion of
intermittent wind power that can be supplied to a power grid, and reflecting the consequent
need for wind generating capacity to be associated with similar capacity of some flexible,
non-intermittent generation to support it.
Temporal Coverage
The temporal coverage of the study refers to the time span covered by the LCA model. This
study covers the full lifespan of the power plant from construction through to
decommissioning, considered to be 20 years for wind turbines, 30 years for NGCC power
plants and 40 years for nuclear power. These operating times are consistent with the median
operating lifetimes considered in the LCA studies captured during the literature review
(Section 3.3.2.2).
2.4 Environmental Indicators
The environmental indicators cover each process stage within the lifespan and supply chain,
for each generation scenario. Within the system boundary, this study has been assessed for
the following set of five environmental metrics:

Canadian Nuclear Association - Meta-analysis LCA of Power Generation Lifecycle Assessment Literature Review of Nuclear, Wind and Natural Gas Power Generation - October 9, 2014
H345621-236-02, Rev. E Page 11
© Hatch 2014 All rights reserved, including all rights relating to the use of this document or its contents.
Greenhouse gases (GHG)
Particulate matter (PM)
Sulphur oxides (SOx)
Nitrogen oxides(NOx)
Ionizing radiation (IR).*
* IR is only quantified for nuclear power and omitted for natural gas and wind-based
scenarios.
2.4.1 Greenhouse Gases (GHGs)
Global Warming Potential (GWP) is a total measure of the atmospheric heat-trapping
(greenhouse) effect of air emissions (GHGs) contributing to climate change, typically over a
100-year period. The most significant GHGs associated with power generation are carbon
dioxide (CO2), methane (CH4) and nitrous oxide (N2O), associated with the combustion of
fuels for electricity production and transportation.
GWP is calculated by a weighted sum of each GHG according to its relative heat-trapping
effect, aggregated in units of carbon dioxide equivalents (kgCO2e). The relative effect of
each GHG may vary based on the impact model used although the variation is minor. A
typical example of GWP factors is presented in Table 1, from the International Panel on
Climate Change (IPCC) Fourth Assessment Report (6).
Table 1. Global Warming Potential (GWP) for 100 Year Time Horizon
Greenhouse Gas Fourth Assessment Report GWP
Carbon dioxide (CO2), 1
Methane (CH4) 25
Nitrous oxide (N2O) 298
2.4.2 Nitrogen Oxides (NOX)
Nitrogen oxides (NOX) are atmospheric emissions generated during combustion when
nitrogen and oxygen are present in the combustion zone. After release, NOX reacts with
other compounds in the atmosphere, producing a variety of reaction products which have
adverse environmental and health effects, including respiratory illnesses, ground-level ozone
or smog, and acid rain.
NOX emissions are influenced by several factors, including the nitrogen content of fuels and
combustion air, and the temperature profile of the combustion zone. A variety of emissions
control technologies may be used to control NOX. Combustion-related technologies such as
low-NOX burners focus on reducing combustion temperature or the concentration of nitrogen
and excess oxygen in the reaction zone. Post-combustion-related technologies focus on
chemically stripping NOX from the off-gas stream. NOx emissions are produced along the
power generation lifecycle generated principally from fuel combustion.

Canadian Nuclear Association - Meta-analysis LCA of Power Generation Lifecycle Assessment Literature Review of Nuclear, Wind and Natural Gas Power Generation - October 9, 2014
H345621-236-02, Rev. E Page 12
© Hatch 2014 All rights reserved, including all rights relating to the use of this document or its contents.
2.4.3 Sulphur Oxides (SOX)
Sulphur oxides (SOX) are atmospheric pollutants generated during combustion of sulphur-
containing materials such as coal and oil. After release, SOX reacts in the atmosphere to
form a variety of compounds with adverse environmental and health effects including ground-
level ozone and acid rain.
The degree of SOX formation is related to the concentration and type of sulphur compounds
present in the combustion zone. SOX can be reduced by stripping sulphur from input
materials and fuels, or during or after combustion by addition of lime, limestone or dolomite.
SOx emissions are produced along the power generation lifecycle generated principally from
combustion and processing of high-sulphur content fuels.
2.4.4 Particular Matter (PM)
Particulate matter (PM) is a category of air emissions describing the total mass of suspended
solid and liquid particles in air, regardless of the chemical composition of the particulates. PM
is sub-divided by particle size: PM10 refers to particulate between 2.5 µm and 10 µm; PM2.5
refers to particulate smaller than 2.5µm. Coarser PM10 particulates have a limited resident
time in air, eventually settling back to the ground within hours, while finer PM2.5 particulates
may stay in the air for several days or weeks. PM can be generated during combustion
activities, construction and decommissioning and in the handling and transportation of raw
materials.
Particulates of any size and composition have adverse environmental and health effects
when inhaled, damaging the respiratory system, with increasing penetration and damage
occurring for smaller particulates. PM has been linked to increased incidence of respiratory
disease, asthma, and mortality.
2.4.5 Ionizing radiation (IR)
Ionizing radiation potential (IR) is a measure used in selected LCAs to characterize the
emissions of ionizing radiation, radiation with enough energy to ionize atoms as it propagates
through space (7). IR includes the high energy end of the electromagnetic spectrum such as
x-rays and gamma rays as well as some particles produced during radioactive decay such as
neutrons and alpha and beta particles.
In LCAs included in this review, IR potential is reported in becquerels (Bq), the number of
atoms decaying per second in a given source material. However, becquerels do not specify
the energy or character of the ionizing radiation products emitted by the radioactive decay or
the potential effect they may have on human health.
IR is generated by a variety of natural and man-made sources, including cosmic rays and
naturally occurring radioactive isotopes on Earth as well as isotopes used in medical imaging
and cancer treatment. IR potential measured by LCA focuses on man-made IR emissions to
the environment. IR exposure from nuclear power generation is generally exceeded by
exposure from medical sources, which in turn are generally exceeded by exposure from
natural sources such as sunlight.

Canadian Nuclear Association - Meta-analysis LCA of Power Generation Lifecycle Assessment Literature Review of Nuclear, Wind and Natural Gas Power Generation - October 9, 2014
H345621-236-02, Rev. E Page 13
© Hatch 2014 All rights reserved, including all rights relating to the use of this document or its contents.
Natural sources of radiation vary according to factors such as location and altitude (8).
Sources of natural background radiation include:
Cosmic radiation - Radiation emanating from sources outside Earth's atmosphere;
Terrestrial radiation – Radiation found in the natural environment, mainly from radon-222
and radionuclides from the decay of uranium-238.
Internal radiation – Radiation found in elements such as potassium-40, carbon-14, lead-
210, and other isotopes inside human body. (9)
Table 2 shows radioactivity of some common materials to serve as a comparison for the IR
emissions estimated in this study.
Table 2. Radioactivity of Selected Materials (10)
Source Radiation
1 adult human (65 Bq/kg) 4,500 Bq
1 kg of coffee 1,000 Bq
1 kg of brazil nuts 400 Bq
1 banana 15 Bq
The air in a 100 sq metre Australian home (radon) 3,000 Bq
The air in many 100 sq metre European homes (radon) Up to 30,000 Bq
1 household smoke detector (with americium) 30,000 Bq
Radioisotope for medical diagnosis 70 million Bq
Radioisotope source for medical therapy 100,000,000 million Bq (100 TBq)
1 kg 50-year old vitrified high-level nuclear waste 10,000,000 million Bq (10 TBq)
1 luminous Exit sign (1970s) 1,000,000 million Bq (1 TBq)
1 kg uranium ore (Canadian, 15%) 25 million Bq
1 kg uranium ore (Australian, 0.3%) 500 000 Bq
1 kg low level radioactive waste 1 million Bq
1 kg of coal ash 2000 Bq
1 kg of granite 1000 Bq
1 kg of superphosphate fertilizer 5000 Bq
Based on the literature reviewed, there is a wide range of types of radionuclides assessed in
determining the IR potential in an LCA. Most of the studies reviewed include Rn-222,
radioactive noble gases, and tritium. Some selected studies consider a broader range of
radionuclides, including: Rn-222, Pb-210, Th-230, Ra-226, U-234, U-235, U-238, Th-228, Th-
230, Th- 232, Th-234, U-234, U-235, Xe-133, I-129, I-131, I-133, Mn-54, Co-58, Co-60, Cs-
134, Cs-137, H-3, Zn-65, Ag-110m, Sb-124, Sb-125, PU-238, PU-239, H-3, C-14, and
aerosols. Quantitatively, Rn-222 emissions is the majority contributor to IR potential over the
nuclear power generation lifecycle, as presented in Table 3. Therefore, studies that do not
consider Rn-222 were excluded.

Canadian Nuclear Association - Meta-analysis LCA of Power Generation Lifecycle Assessment Literature Review of Nuclear, Wind and Natural Gas Power Generation - October 9, 2014
H345621-236-02, Rev. E Page 14
© Hatch 2014 All rights reserved, including all rights relating to the use of this document or its contents.
Table 3. Total Lifecycle IR Emissions for Nuclear Power (11).
Radionuclide Value (kBq/kWh) %
Radon 7.29E+02 65.10%
Other noble gases, H3, C
14 3.74E+02 33.40%
Aerosols 2.22E-04 0.00%
Actinides 4.62E-04 0.00%
Radium 6.32E-02 0.01%
Tritium 1.68E+01 1.50%
Sum of Emission 1.12E+03 100%
2.5 Functional Unit
The functional unit in LCA is the basis or normalizing unit used to represent environmental
emissions and impacts on similar terms. Thus, the functional unit determines the equivalence
between systems and enables comparison between each power generation scenario.
For the purpose of this study, the functional unit has been defined as 1 kWh of electricity
produced at the gate of the power plant, at the point of delivery to the electricity grid.
Accordingly, all environmental emissions considered in this study are reported in units of
mass or becquerels per kWh produced.

Canadian Nuclear Association - Meta-analysis LCA of Power Generation Lifecycle Assessment Literature Review of Nuclear, Wind and Natural Gas Power Generation - October 9, 2014
H345621-236-02, Rev. E Page 15
© Hatch 2014 All rights reserved, including all rights relating to the use of this document or its contents.
3. Literature Review and Meta-analysis Methodology
This section documents the literature review and meta-analysis methodology defined to carry
out the study. The methodology was developed to ensure that the study was performed in a
transparent and unbiased manner, and as a mechanism to ensure the results are complete,
representative and accurate.
While the previous section defined the scope and system boundaries of the LCA studies
reviewed, this section describes the mechanisms used to gather and assess the most
relevant and up to date information within the public domain, and then to use that information
to build LCA models covering each generation scenario on a common basis.
3.1 Overview
A two-phased methodology was developed to address the study objectives in Section 1.2.
An overview of the methodology is presented in Figure 3. The first phase consisted of a
literature review and gap analysis, followed by the second phase encompassing a meta-
analysis of the LCA data to build LCA models representing the entire lifecycle of each power
generation scenario.
The first phase – literature review and gap analysis – captured a broad picture of each power
generation scenario, spanning the full lifecycle (supply chain and lifespan) and a range of
technologies and environmental indicators. The review focused on gathering as much recent
and high quality LCA data as possible in order to provide the most reasonable average and
distribution of LCA results as possible. A gap analysis was performed to evaluate the
coverage of LCA data in meeting the scope and system boundaries defined in Section 2.
The second phase – meta-analysis and LCA – compiled and synthesized published LCA data
to conform with the common scope and system boundaries used in this study. The meta-
analysis consisted of a screening process to filter or adjust studies with dissimilar scope and
system boundaries and linking process stage LCA data together to represent the complete
supply chain and lifespan of each power generation scenario.
The results of this process, presented in Section 5, consists of the average emission values
of each generation scenario, process stage and emission type. The results also report the
distribution of data and a measure of the uncertainty of the mean in order to understand the
differences in the basis, methodology and results existing within the LCA community.
In all cases, the approach was to limit the influence of the authors on the results of the
literature compilation.

Canadian Nuclear Association - Meta-analysis LCA of Power Generation Lifecycle Assessment Literature Review of Nuclear, Wind and Natural Gas Power Generation - October 9, 2014
H345621-236-02, Rev. E Page 16
© Hatch 2014 All rights reserved, including all rights relating to the use of this document or its contents.
Figure 3. Literature Review and Meta-analysis Methodology Steps
3.2 Literature Review
The first phase of this study was a literature review and gap analysis, intended to gather
scientific literature to determine the level of information available in the public domain, in
terms of the lifecycle stages (supply chain and lifespan), and the environmental metrics
(GHG, NOx, SOx, PM, and IR) corresponding to wind, nuclear and natural gas electricity
generation.
A systematic and objective approach was used to find the most relevant and up to date
articles and studies within the public domain. The approach included a literature search,
scope and system boundary screening process, study documentation, quality assessment
and gap analysis. An overview of the process is presented in Figure 4.

Canadian Nuclear Association - Meta-analysis LCA of Power Generation Lifecycle Assessment Literature Review of Nuclear, Wind and Natural Gas Power Generation - October 9, 2014
H345621-236-02, Rev. E Page 17
© Hatch 2014 All rights reserved, including all rights relating to the use of this document or its contents.
Figure 4. Data Collection Methodology
3.2.1 Search
During the literature review, an exhaustive search of English-language publications was
performed to compile a list of published LCA studies covering the lifecycle for each
generation scenario.
The initial search involved a keyword search in scientific journal indices and internet search
engines. A forward and reverse citation search was subsequently performed on each of the
studies found in the initial search. The sources of literature reviewed included, but was not
limited to:
Canadian Energy Research Institute‘s (CERI) 2008 study;
Scientific papers/presentations;
Lifecycle databases, such as GaBi and Eco-Invent;
Technical journals, such as, International Journal of Life Cycle Assessment, Renewable
and Sustainable Energy Reviews, Renewable Energy, Journal of Industrial Ecology, etc.;
Master/PhD thesis from different universities, such as University of Florida, Carnegie
Mellon University, University of Sydney, University of Manchester, etc.;
Industry data, such as Vestas, Gamesa, Vattenfall, Enel, National Energy Technology
Laboratory (NETL), IFC consulting, etc.

Canadian Nuclear Association - Meta-analysis LCA of Power Generation Lifecycle Assessment Literature Review of Nuclear, Wind and Natural Gas Power Generation - October 9, 2014
H345621-236-02, Rev. E Page 18
© Hatch 2014 All rights reserved, including all rights relating to the use of this document or its contents.
The search was focused on studies with LCA-derived data, excluding studies that did not
follow LCA methodologies to measure environmental emissions.
3.2.2 Scope Screen
The articles found in the public domain were reviewed to determine their relevance in terms
of the defined scope and system boundaries (Section 2) and the age of the study.
Studies that did not match any segment of the scope and system boundaries, or failed to
clearly present the scope and assumptions of the study were removed from the list of
available literature. Any study preceding the year 2000 were also excluded.
3.2.3 Documentation
All articles passing the screening process were summarized and stored in a literature review
database, used throughout the rest of the study. The database consisted of a variety of data
tags used to categorize each study. Key information stored in the database included author,
title, publication year, and a variety of categories outlining the scope and system boundaries,
including:
Supply chain and lifespan coverage;
System boundary segmentation;
Temporal, geographical and technological coverage;
Environmental indicators/emissions considered;
Key assumptions/approximations and approaches.
3.2.4 Quality Assessment
A subjective quality assessment was conducted for all studies passing the scope and system
boundary screening process. The quality assessment provided a quality score to each study
to help inform the quantitative data screening process in the second phase of the project.
The quality assessment focused on the methodology and documentation of each LCA study,
giving preference to articles that are:
Conducted based on ISO 14040 principles or are ISO 14040 compliant;
Peer reviewed by an independent third party;
Authored by well-established and objective academic and research organizations;
Well documented, transparent, and reproducible with a clear description of the scope,
boundaries, methods, assumptions and approximations;
Presenting LCA results derived directly from primary and secondary sources.
The results of the quality assessment alone were not used to remove any LCA study.
Instead, the quality scores were revisited for statistical outliers identified in the second phase
of the study as part of a process to understand the underlying causes for discrepancies
between the quantitative data provided by the literature review.

Canadian Nuclear Association - Meta-analysis LCA of Power Generation Lifecycle Assessment Literature Review of Nuclear, Wind and Natural Gas Power Generation - October 9, 2014
H345621-236-02, Rev. E Page 19
© Hatch 2014 All rights reserved, including all rights relating to the use of this document or its contents.
3.2.5 Gap Analysis
A gap analysis was performed following the literature review to assess the strength of scope
and system boundary coverage achieved by literature in the public domain. A colour matrix
was developed to show gaps and strengths in the supply chain and/or the lifespan, and in the
environmental impacts for each scenario.
Figure 5 presents the results of the gap analysis, colour-coded such that:
Green cells indicate several studies were available;
Orange cells indicate moderate data availability;
Pink cells indicate moderate data availability but requiring some approximations and
assumptions to conform to the system boundaries of the study;
Red cells (none shown) indicated insufficient data found through the literature review.
Red cell are not presented in Figure 5, as a series of iterations to the system
boundary were performed to address these critical areas (described below).
Figure 5. Gap Analysis for Final Scope and System Boundaries
The gap analysis was an iterative process, leading to a refinement of the scope and system
boundaries to better match the data available in the LCA literature. The following gaps were
identified and addressed in the initial analysis:
Resource Exploration – insufficient data was available to capture the exploration phase
of each power generation scenario. Based on the type of activities typically associated
with exploration, it is not expected to be a major contributor of any of the emissions
included in this study. As a result, the exploration phase was excluded from the system
boundaries of the study.
IR Potential for Wind and Natural Gas – review of literature data for the IR potential of
wind and natural gas-based generation showed limited data sources available as well as
data derived from generic LCA datasets covering indirect, upstream sources, primarily
associated with the use nuclear-derived electricity in the production of consumables and
construction materials. As a result, a comparison of IR potential between power

Canadian Nuclear Association - Meta-analysis LCA of Power Generation Lifecycle Assessment Literature Review of Nuclear, Wind and Natural Gas Power Generation - October 9, 2014
H345621-236-02, Rev. E Page 20
© Hatch 2014 All rights reserved, including all rights relating to the use of this document or its contents.
generation scenarios was not possible, and only the IR potential of nuclear power
generation was reported.
Waste Management at Natural Gas Power Plants – the amount of data available for
waste management is limit and often aggregated with power plant operations. This has a
negligible impact on the total lifecycle emissions as outlined in Section 4.3.3, but limits
the ability to draw accurate findings associated with waste management.
Supply Chain Segmentation – while some studies separate upstream extraction,
production and transportation of materials, several studies merge each stage together.
As a result, the upstream supply chain is represented in this study as one process group
in order to increase the amount of data available to improve the statistics of the study.
Lifespan Segmentation – a key strength found during the gap analysis was the level of
information gathered for the lifespan of the power generation scenarios (i.e. construction
and decommissioning). However, the information presented for construction was typically
not separated into extraction, production, transportation and construction activities. As a
result, all on-site and upstream construction activities were grouped in order to increase
the statistics of the dataset.
3.3 Data Collection and Synthesis
Data management and assessment is a key element of this study, to ensure that multiple
data sources can be compared along similar scope/system boundaries so that the
aggregated results are technically accurate.
While the literature and gap analysis phase assessed the qualitative aspects of each
literature source (scope, methods, etc.), the meta-analysis phase focused on the quantitative
results of each study. By comparing quantitative results across studies, statistical outliers
could be identified and evaluated separately to ensure the modeling assumptions, limitations
and system boundaries are appropriate for including in the final dataset.
A transparent, systematic and statistics-based methodology was applied consistently
throughout the assessment and screening process with the objective to maximize the number
of studies included in the results (improved range and statistics) while adhering to the scope
and system boundaries of the study.
Figure 6 presents the data collection and synthesis approach used in this study. First,
quantitative LCA data was compiled and grouped according to its coverage of the scope and
system boundaries. Next, a system boundary adjustment was performed on selected data
when necessary in order to conform better with the system boundaries of the study. A cluster
analysis was then performed, identifying trends in the LCA data by comparing the similarities
and differences in the results across multiple independent LCA studies, and linking these
trends to geographical scope, technological representation, modelling assumptions and a
number of other factors. A statistical analysis was performed on each process stage and
data cluster to identify statistical outliers for further examination.

Canadian Nuclear Association - Meta-analysis LCA of Power Generation Lifecycle Assessment Literature Review of Nuclear, Wind and Natural Gas Power Generation - October 9, 2014
H345621-236-02, Rev. E Page 21
© Hatch 2014 All rights reserved, including all rights relating to the use of this document or its contents.
Figure 6. Data Collection and Synthesis Approach
3.3.1 Data Compilation
Quantitative LCA data was extracted from each of the studies matching all or part of the
scope and system boundaries defined in Section 2, grouped by generation scenario, process
stage, technology and other criteria and compiled into a database.
During data compilation, the database was divided into the process stages defined in Section
2.2, with tags indicating author, publication year, coverage (temporal, geographical and
technological), and other key elements of the scope. The database was linked to the
qualitative documentation of each study outlined in Section 3.2.3, and formed the basis of the
meta-analysis to follow.
3.3.2 System Boundary Adjustment
Selected data points extracted from the literature required minor adjustments so that the data
compiled conforms to the system boundary definition in this study, thereby ensuring that the
results are technically comparable across all power generation scenarios. Adjustments were
limited to cases where only minimal changes to the original study methodologies were
required. Cases involving significant changes and assumptions were excluded from the
results. The system boundary adjustments included adjusting to:
Isolate and remove transmission and distribution losses;
Normalize plant operating lifetime for all data;
Represent upstream natural gas extraction and production studies relative to units of
electricity produced.
The methodology and rationale behind these adjustments are explained in the following
sections.

Canadian Nuclear Association - Meta-analysis LCA of Power Generation Lifecycle Assessment Literature Review of Nuclear, Wind and Natural Gas Power Generation - October 9, 2014
H345621-236-02, Rev. E Page 22
© Hatch 2014 All rights reserved, including all rights relating to the use of this document or its contents.
3.3.2.1 Transmission and Distribution Losses
The system boundaries of this study was up to and including the production of electricity,
prior to delivery to the electricity grid and represented, accordingly, using a functional unit of
1 kWh of electricity produced. LCA studies which include transmission and distribution losses
required an adjustment to conform to the system boundaries and functional unit reported in
Section 2.
The adjustment consisted of:
Changing the functional unit from electricity delivered to the consumer to electricity
produced at the power generating facility;
Isolating and removing power losses occurring during transmission and distribution.
A percentage of the electricity produced at the generating facility is lost to transmission and
distribution (T&D) infrastructure while in transit to the consumer. This T&D loss is dependent
on the characteristics of the regional power grid considered in the study, and acts to increase
the relative magnitude of emissions when represented in units of electricity delivered.
To make the adjustment, the percentage of T&D losses was used to re-scale the data,
thereby excluding the T&D losses from the LCA results. When available, the T&D loss figure
provided by the study was used. In the absence of study-specific figures, a typical industry
value of 7% was used.
The range of losses presented in the literature range between 5% and 7%, while non-LCA
data reported by various energy organizations typically report T&D losses higher than 7%. In
fact, based on data from the World Bank, the electric power transmission and distribution
losses worldwide for 2011 averaged 13%. For the purpose of this study, a 7 % loss was
assumed based on the upper bound of LCA studies, consistent with a U.S. National Energy
Technology Laboratory study on the T&D network in the U.S., and was used in cases where
the study did not provide enough information to back-calculate to kWh-produced.
3.3.2.2 Plant Operating Lifetime Normalization
The literature review considered different plant operating times within each of the power
generation scenarios. To compare all the studies for each scenario using the same basis, the
lifespan segment of the lifecycle (construction and decommissioning) was normalized to a
standardized lifetime reflecting the median lifetimes considered in the LCA literature for each
scenario, respectively.
The distribution of operating lifetime figures used across the LCA studies pertaining to each
power generation scenario are reported in Figure 7, indicating a median plant operating
lifetime of 20, 40 and 30 years respectively for wind, nuclear and natural gas power
generation, respectively. Accordingly, this study considers a 20 year lifetime for wind
turbines, 40 years for an average nuclear power plant, and 30 years for an NGCC power
station. For example, over a 60 year span, the LCA model considers the construction and
decommissioning of 1.5 nuclear plants, 2 NGCC plants and 3 wind farms.

Canadian Nuclear Association - Meta-analysis LCA of Power Generation Lifecycle Assessment Literature Review of Nuclear, Wind and Natural Gas Power Generation - October 9, 2014
H345621-236-02, Rev. E Page 23
© Hatch 2014 All rights reserved, including all rights relating to the use of this document or its contents.
The distribution of operating lifetimes considered during LCA modeling are narrowly defined
for wind and natural gas. A wider distribution for nuclear power was observed, reflective of
the mix of technologies considered in the nuclear power generation scenario defined in
Section 2.3.
It is important to note that while most nuclear LCAs considered a reactor lifespan of 40 years,
CANDU reactors normally operate for roughly 30 years, with an option to refurbish the plant
for an additional 30 years of operation. Due to the wide range of nuclear reactors considered
in this study, and the fact that not every LCA study reviewed was explicit on their
consideration of refurbishment in their estimation of lifetime, the contribution of refurbishment
to the total life cycle of nuclear power plants was not explicitly quantified.
Standardizing the lifespan process stage data to the median lifetime was not possible for
studies that did not document their chosen operating lifetime. In these cases, the data was
simply included without any adjustment, in effect assuming that the chosen operating lifetime
is equal to the median lifetime observed across the LCA literature. Of all studies included in
each scenario, 6%, 17% and 23% of wind, natural gas and nuclear studies, respectively,
either do not document or contain a mix of operating lifetimes. Including these data points
improved the size of the dataset while introducing uncertainty in the true distribution of the
operating lifetime values considered in the LCA data. To address the uncertainty, all LCA
data still had to pass the statistical outlier screening process outlined in Section 3.3.4.
Figure 7. Distribution of Operating Lifetimes Found in LCA Literature by Power Generation Scenario
*
The choice of operating lifetime by LCA studies has an important effect in distributing the
emissions from construction and decommissioning to each kWh of power generated during a
plant‘s operating life; if the operating time is increased, emissions are diluted over a longer
time period, while if the operating time is decreased, the emissions are concentrated per kWh
of power generated. The effect of operating lifetime on the overall lifecycle totals can be
significant when emissions from construction and decommissioning (lifespan processes) are
* ―ND‖ refers to studies where the operating lifetime was not disclosed.

Canadian Nuclear Association - Meta-analysis LCA of Power Generation Lifecycle Assessment Literature Review of Nuclear, Wind and Natural Gas Power Generation - October 9, 2014
H345621-236-02, Rev. E Page 24
© Hatch 2014 All rights reserved, including all rights relating to the use of this document or its contents.
large relative to plant operations (supply chain processes). The impact of changing the
operating lifetime on total lifecycle emissions is examined in Figure 8. When lifespan
(construction/decommissioning) emissions greatly exceed supply chain emissions (e.g. 90%-
lifespan), doubling or halving the length of time the plant is operating leads to a decrease and
increase in total life cycle emissions of 45% and 90%, respectively. When supply chain
emissions dominate (e.g. 10%-lifespan), doubling or halving the operating time results in less
than a 10% change in total life cycle emissions.
Figure 8. Influence of Operating Lifetime Over Total Lifecycle Emissions
3.3.2.3 Natural Gas Combined Cycle (NGCC) Power Plant Efficiency Factor
In order to closely examine the various sources of natural gas, the literature review included
LCA studies spanning only the upstream extraction and production of natural gas. The LCA
data contained in these studies were correspondingly represented relative to units of natural
gas (typically 1 MJ) rather than power plant electricity generation.
To represent the upstream data relative to 1 kWh of power produced, upstream emissions
were scaled according to the amount of natural gas required to produce 1 kWh of electricity
via NGCC generation. Based on the literature reviewed, NGCC efficiencies typically varied
between 50% to 57.5%, based on a mix of turbine and boiler technology. In cases where the
study did not provide the necessary figures, an average efficiency of 50.2% was applied. This
value was taken from the study ―Life Cycle Analysis: Natural Gas Combined Cycle (NGCC)
-50%
-25%
0%
25%
50%
75%
100%
0.5X 1.0X 1.5X
Ch
ange
in L
ife
Cyc
le E
mis
sio
ns
(%)
Operating Lifetime Change
Lifespan = 10% Lifespan = 50% Lifespan = 90%

Canadian Nuclear Association - Meta-analysis LCA of Power Generation Lifecycle Assessment Literature Review of Nuclear, Wind and Natural Gas Power Generation - October 9, 2014
H345621-236-02, Rev. E Page 25
© Hatch 2014 All rights reserved, including all rights relating to the use of this document or its contents.
Power Plant‖, National Energy Technology Laboratory (12), an aggregated value of average
NGCC efficiency in the United States.
3.3.3 Cluster Analysis
A cluster analysis was performed on the literature LCA data following the scope and system
boundaries adjustment. The analysis consisted of grouping similar LCA data points within the
overall distribution of data points representing a given process stage and power generation
scenario and then examining the cluster or subset of data to identify common characteristics
in their studies‘ methodology, technology selection and modelling approximations. The
cluster analysis involved the following steps:
Identify clusters of similar data points by examining the distribution of data points in
the literature database;
Evaluate clusters to identify common study characteristics and trends underlying
cluster formation;
Examine the distribution of all data pertaining to the common study characteristics
and trends (e.g. a particular technology) to confirm the cluster and identify statistical
outliers.
Trends identified as part of the cluster analysis informed the evaluation of statistical outliers
and helped in understanding how the system boundaries and other LCA parameters
influenced the range of data observed in the literature. Initial findings of the cluster analysis
also led to refinements in the scope and system boundaries through an iterative process.
Examples of findings from the cluster analysis include:
The inverse relationship between wind turbine capacity and turbine emissions,
becoming pronounced for wind turbines less than 100 kW. Small-scale wind
turbines, below the capacity of turbines used in large wind farms have since been
excluded from the scope of the study.
The type and presence of uranium enrichment in the upstream supply chain has a
pronounced influence on the total lifecycle emissions associated with nuclear power
generation. For instance, GHG emissions from gas centrifuge enrichment
technologies have a mean of 4.1 ± 0.8 gCO2-e/kWh, compared to 14.0 ± 5.0 gCO2-
e/kWh for diffusion enrichment. Similarly, GHG emissions are substantially lower for
nuclear reactor technologies utilizing using natural-grade fuel (i.e. no enrichment).
While all enrichment technologies (including no enrichment) are included within the
scope of the study, the cluster analysis helps explain the range of LCA data observed
in the literature.
The results of the cluster analysis form the basis for the discussion in Section 6.
3.3.4 Assessment of Statistical Outliers
The final stage of data collection and synthesis focused on statistical outliers identified as a
result of the cluster analysis. Rather than removing statistical outliers from the final dataset,

Canadian Nuclear Association - Meta-analysis LCA of Power Generation Lifecycle Assessment Literature Review of Nuclear, Wind and Natural Gas Power Generation - October 9, 2014
H345621-236-02, Rev. E Page 26
© Hatch 2014 All rights reserved, including all rights relating to the use of this document or its contents.
the purpose of this stage was to identify outlying data for a comprehensive review. The
review, in turn, attempted to find a root cause for the differences between the outlying data
point and the rest of the results and take appropriate action if necessary.
The methodology to identify and treat statistical outliers is presented in Figure 9. The
process was applied to each cluster and process stage. For the purpose of this study, a
statistical outlier was defined as any point outside of a two standard deviation band about the
mean.
Figure 9. Treatment of Statistical Outliers
If the data is within the lower/upper limit, the data point is included in the analysis as part of
the final data set. If the data point is defined as an outlier, a further analysis to determine the
equivalence of the scope/assumptions is conducted as follows:
Detailed Scope Review – to confirm that the scope and system boundary definitions
are similar or different. If the documentation of the scope and system boundaries is
insufficient to perform the review the corresponding data point was removed.
Scope Adjustment – performed when a difference in scope was identified as the
cause of the outlier. If the data point can be adjusted to conform with the scope
definition by using article information, the data point is adjusted and included as part
of the final data set. If the data point cannot be accurately extracted by using the
article information, the data point is excluded from the final dataset.
Methodology Review – performed when the outlier cannot be explained by
differences in the scope and system boundaries. The methodology review evaluates
the quality ranking of the study (Section 3.2.4) to assess whether the study is well
documented and conducted in accordance with accepted standards and practices of

Canadian Nuclear Association - Meta-analysis LCA of Power Generation Lifecycle Assessment Literature Review of Nuclear, Wind and Natural Gas Power Generation - October 9, 2014
H345621-236-02, Rev. E Page 27
© Hatch 2014 All rights reserved, including all rights relating to the use of this document or its contents.
LCA. Articles scoring below average, loosely based on LCA practices or lacking in
detailed documentation of methods assumptions and approximations were removed
from the final dataset. Despite their outlier status, all data from moderately and highly
ranked studies were considered in the final dataset.
This approach helped to address statistical outliers in an objective way, improving the
conformance of the dataset with the scope and system boundaries of the study while
minimizing the decision to exclude data to a last resort.
Following the assessment of outliers, a statistical comparison of the final dataset to the
original dataset was performed to confirm that the uncertainty in the determination of the
mean was reduced by the process. The analysis reviewed statistical metrics characterizing
each dataset, including standard deviation, minimum/maximum, mean and uncertainty of the
mean.
The uncertainty of the mean, a measure of the standard error in the determination of the
mean was compared with the original value, to compare the impact of narrowing the
distribution of the data and reducing the size of the dataset due to the removal of each outlier.
Decreases in the uncertainty of the mean implies that the removal of the outlier was effective
in improving the accuracy of the determination of the mean for each process stage and power
generation scenario.
3.4 LCA Dataset Characteristics
The combination of the literature review, gap analysis and data collection and synthesis
produced a final database of LCA data grouped by power generation scenario, process stage
and type of environmental emission. This database formed the basis of the meta-analysis
based LCA modelling outlined in Section 3.5 and results presented in Section 5. This section
outlines key characteristics of the coverage achieved by the dataset to consider when
evaluating the findings of the study.
3.4.1 System Boundary Coverage
The process of matching scope and system boundaries narrowed the number of literature
sources included in the final dataset in order to provide a comparison between each
generation scenario on similar terms. Table 4 presents an overview of the number of studies
considered in the final dataset addressing each generation scenario.
The gap analysis outlined in Section 3.2.5 revealed that the best coverage was achieved for
the plant operations process stage and for GHG emissions across the lifecycle of each
generation scenario.
Minor process stages within each generation scenario were given less attention in the LCA
literature, including the upstream supply chain for wind power, management of wastes
produced by wind and NGCC generation, and the start and end-of-life activities associated
with NGCC generation. In each case, these process stages form only a minor contribution
relative to the other process stages such as wind turbine construction and NGCC plant
operations.

Canadian Nuclear Association - Meta-analysis LCA of Power Generation Lifecycle Assessment Literature Review of Nuclear, Wind and Natural Gas Power Generation - October 9, 2014
H345621-236-02, Rev. E Page 28
© Hatch 2014 All rights reserved, including all rights relating to the use of this document or its contents.
The LCA literature focused on GHG emissions above all other environmental emissions
categories. Coverage of PM emissions generated during construction and decommissioning
activities were the most limited of any environmental emission category.
Table 4. Number of Screened Studies Considered
Electricity Generation Number of scenarios
(1) on final
data set (2)
Onshore Wind Turbines 46
Nuclear 79
Natural Gas Combined Cycle 27 (1)
The number of individual lifecycle scenarios in the literature database. The number of
scenarios is not an indication of the number of studies considered, the type of emissions covered or number of process stages included. (2)
Final data set represents the database after all statistical outliers were removed.
3.4.2 Geographical Coverage
The scope of the literature review covered studies with a variety of regional focus areas,
including Europe, North America, Asia, Australia, South America and Worldwide (as a mix or
average), as presented in Figure 10.
Figure 10. Regional Coverage
Wind and nuclear are predominantly covered by European data, followed by North America
and worldwide averages. Natural gas is predominantly covered by North American data,
followed by European data.
Although a focus area of the literature review, Canadian data is not widely available in the
literature, representing only 16% for nuclear, 10% for wind and 12% for natural gas.
3.4.3 Temporal Coverage
A focus of the literature review was to gather up-to-date information, especially covering the
period from 2008 to 2013. However, to provide complete coverage of the scope and system
0
10
20
30
40
50
60
70
North America Europe Asia Australia and New Zeland
South America World Wide
Nu
me
r o
f Stu
die
s
Nuclear Wind NGCC

Canadian Nuclear Association - Meta-analysis LCA of Power Generation Lifecycle Assessment Literature Review of Nuclear, Wind and Natural Gas Power Generation - October 9, 2014
H345621-236-02, Rev. E Page 29
© Hatch 2014 All rights reserved, including all rights relating to the use of this document or its contents.
boundaries the period was extended to cover 2000 to 2013. The number of studies
contributing to the final dataset are presented in Figure 11 divided by the year of publication.
Figure 11. Temporal Coverage
3.4.4 Technological Coverage
The scope of the study is restricted to on-shore wind turbines and NGCC plants for wind and
natural gas generation, while the nuclear power generation scenario covers the full range of
enrichment and generator technologies.
Of the entire set of literature reviewed covering wind power and natural gas generation, 56%
and 40% of studies specifically addressed on-shore wind power and NGCC, respectively.
Nuclear power generation is represented by technologies such as pressurized water reactors
(PWR), boiling water reactors (BWR), light water reactors (LWR) and CANDU reactors.
CANDU reactors represent 10% of the articles collected. A mixture of fuel supply chain
technologies are also captured, including no enrichment and diffusion and centrifuge based
enrichment.
3.5 Lifecycle Modelling
The data collection and synthesis stage produced a final database of data points derived
from LCA literature representing individual process stages as well as aggregated data
representing the supply chain, lifespan and/or entire lifecycle. The focus of the lifecycle
modelling phase was to build LCA models to incorporate individual process stage data into
the aggregated lifecycle totals.
This approach increased the number of studies considered in the mean and distribution of
data for each power generation scenario by including studies which only address a segment
of the system boundaries.
The steps involved in the lifecycle modelling process are outlined in Figure 12. Total data,
data points representative of the entire lifecycle, are considered separately from data
0
5
10
15
20
25
30
35
2000 2001 2002 2003 2004 2005 2006 2007 2008 2009 2010 2011 2012 2013
Nu
me
r o
f Stu
die
s
Nuclear Wind NGCC

Canadian Nuclear Association - Meta-analysis LCA of Power Generation Lifecycle Assessment Literature Review of Nuclear, Wind and Natural Gas Power Generation - October 9, 2014
H345621-236-02, Rev. E Page 30
© Hatch 2014 All rights reserved, including all rights relating to the use of this document or its contents.
representing individual process stages. A process stage linking process was applied to the
individual process stage data to assemble the data into lifecycle models in order to provide
additional data to the analysis of the aggregated lifecycle. The process stage linking
procedure scaled process stage data based on the average contribution of each stage
towards the total lifecycle emissions using a weighted average approach. After linking, both
the total lifecycle data and individual process data were analyzed to produce statistical data
representing the mean and distribution of emissions, presented in Section 5.
Figure 12. LCA Modelling Methodology
3.5.1 Analysis of Process Stage and Aggregated Lifecycle Data
Statistical metrics were extracted to represent the average and distribution of emissions data
available in the LCA literature contained in the final data set. The statistical metrics included
the mean ( ), standard deviation (σ) and uncertainty of the mean as a representation of the
error ( ), used to represent the data grouped by:
Power generation scenario;
Environmental emission type;
Process stage;
Total supply chain;
Total lifespan;
Total lifecycle (supply chain and lifespan)

Canadian Nuclear Association - Meta-analysis LCA of Power Generation Lifecycle Assessment Literature Review of Nuclear, Wind and Natural Gas Power Generation - October 9, 2014
H345621-236-02, Rev. E Page 31
© Hatch 2014 All rights reserved, including all rights relating to the use of this document or its contents.
While the mean identifies the central location of the data, the uncertainty of the mean
provides a measure of the confidence in the accuracy of the calculated mean (i.e. how well
the sample mean represents the ‗true‘ mean). The standard deviation represents the spread
of the data from the mean, where larger values reflect a broader distribution. The standard
deviation alone is not a measure of the accuracy of the sample mean. The mean, uncertainty
of the mean and standard deviation are calculated using the following formulas, respectively:
3.5.2 Linking Process Stages
Individual process stage data was incorporated into the aggregated totals representing the
supply chain, lifespan and total lifecycle. The procedure improved the amount of data
available to determine the total lifecycle emissions to compare each power generation
scenario.
The linking process considered process stage data in the aggregated totals by:
1. Determining the average contribution of each process stage to the total lifecycle;
2. Completing the lifecycle system boundaries for each data point by applying the
average contribution of each process stage not represented by the particular study;
3. Summing the literature source data and averaged data to yield a calculated value for
the total lifecycle;
4. Weighting the value of the calculated total according to the percentage contribution of
the source data relative to averaged data used to complete the lifecycle.
5. The weighting was applied when determining the mean, standard deviation and
uncertainty of the mean for the total supply chain, lifespan and complete lifecycle.

Canadian Nuclear Association - Meta-analysis LCA of Power Generation Lifecycle Assessment Literature Review of Nuclear, Wind and Natural Gas Power Generation - October 9, 2014
H345621-236-02, Rev. E Page 32
© Hatch 2014 All rights reserved, including all rights relating to the use of this document or its contents.
The weighted average approach was built based on the premise than the significance of the
data considered in the supply chain, lifespan and total lifecycle should be equal to the
proportion of the total scope covered by the data. Using this approach, the weighting of GHG
emissions data from upstream natural gas extraction and processing will be less than a data
point covering the combustion of natural gas during power generation and lesser still
compared to a data point covering the entire natural gas supply chain.
This approach allowed the study to consider all process stage data points into the total, while
weighting their influence on the total according to the significance of the particular process
stage.

Canadian Nuclear Association - Meta-analysis LCA of Power Generation Lifecycle Assessment Literature Review of Nuclear, Wind and Natural Gas Power Generation - October 9, 2014
H345621-236-02, Rev. E Page 33
© Hatch 2014 All rights reserved, including all rights relating to the use of this document or its contents.
4. Description of Power Generation Scenarios
This chapter details how the general scope and system boundaries in Section 2 applies
specifically to each power generation scenario considered in the study. The following
sections provide a description of the processes and technologies included in each process
stage in order to understand what is represented by the results of the study presented in
Section 5.
4.1 Wind Power Generation
The lifecycle of wind power generation covers the extraction, production, transportation and
waste management of all consumables for construction, decommissioning and normal
operation of on-shore wind farms. A detailed system boundary for the wind scenario, and the
process stage divisions included in this study, is presented in Figure 13.
As a form of renewable power, the lifecycle of wind-based power is dominated by the lifespan
process stages covering the construction and decommissioning of the wind farm, as opposed
to the on-going supply of fuels and other site consumables.
In this study, the wind power scenario is limited to on-shore wind farms comprising turbines
greater than 100 kW in capacity. The operating lifetime considered to annualize the lifespan
emissions is 20 years, the median lifetime observed in LCA literature.
Figure 13. Wind Scenario Detailed System Boundaries
4.1.1 Upstream Supply Chain
The upstream supply chain includes the impacts associated with the extraction, production
and transportation of all necessary auxiliary substances and chemicals for the proper

Canadian Nuclear Association - Meta-analysis LCA of Power Generation Lifecycle Assessment Literature Review of Nuclear, Wind and Natural Gas Power Generation - October 9, 2014
H345621-236-02, Rev. E Page 34
© Hatch 2014 All rights reserved, including all rights relating to the use of this document or its contents.
operation and maintenance of wind turbines. The main consumables used during operations
include hydraulic oil, lubricants and grease. The upstream supply chain for wind is minor
compared to other forms of electricity production requiring a steady supply of fuel in order to
operate.
Environmental emissions during this stage are influenced, to a certain extent, by the distance
and mode of transportation of materials from the extraction and production center to the wind
farm.
4.1.2 Operation
The operational stage of the wind power generation scenario encompasses the
environmental impacts primarily associated with the periodic maintenance of wind farms.
Again, relative to other forms of power generation, the on-going operation of a wind farm
requires minimal activities or input to operate relative to non-renewable power generation.
Maintenance includes all activities necessary to maintain the correct operation of the turbines.
Some of the maintenances activities include change of oil, lubrication, replacement of worn
parts, and travel to and from the turbine for inspections and repairs.
The literature reviewed included variations in the modelling approximations and assumptions
surrounding turbine maintenance, including the travel and frequency of inspections, the
degree of replacement of worn parts, and lubrication and oil change requirements. Other
variations included whether a single turbine was considered in the assessment, rather than a
full-scale wind farm. In all cases, the variations between studies were accepted within the
scope and system boundaries of this study (Section 2.2.4).
4.1.3 Waste Management
Waste management includes emissions associated with the disposal and treatment of wastes
generated during normal operation of wind turbines, consisting primarily of the waste
products generated as a result of turbine maintenance.
Variations within the literature consist of the type and location of waste disposal, covering a
combination of landfill, incineration and recycling. Waste management data may also be
influenced by the regulated waste management requirements in the region of study.
In the case of recycling, a significant number of studies credited the beneficial environmental
impact of recycling the materials in the future to the overall environmental impact of the
lifecycle (13).
4.1.4 Construction
The construction stage includes the upstream extraction, production and transportation of
materials and on-site construction activities required to erect a wind turbine or wind farm.
Construction activities include any civil work associated with the wind turbine.
It should be noted that materials for construction vary among the studies reviewed,
dependent on the physical size of the turbine (capacity and hub height), turbine technology
(turbine with gearbox and without gearbox), and turbine type (horizontal and vertical axes).

Canadian Nuclear Association - Meta-analysis LCA of Power Generation Lifecycle Assessment Literature Review of Nuclear, Wind and Natural Gas Power Generation - October 9, 2014
H345621-236-02, Rev. E Page 35
© Hatch 2014 All rights reserved, including all rights relating to the use of this document or its contents.
Different types of turbine materials influence the upstream extraction, production and
manufacturing. For the purpose of this study, all variations in this respect were included
within the system boundaries.
Similarly to the upstream supply chain stage, emissions generated by the construction
process stage are influenced by transportation from the extraction and production center to
the location of the wind turbine
4.1.5 Decommissioning
The decommissioning process stage includes emissions resulting from the decommissioning
of a turbine or wind farm at the end of its useful life.
Typical activities involved in this stage include the dismantling and disassembly of the wind
turbine, the transportation of all turbine components to their respective waste management
facility, and the impacts/credits associated with the final waste management and disposal,
either by recycling, incineration, or landfill (14).
The range of literature results for decommissioning was primarily affected by the choice of
waste management, where a significant number of studies modeled decommissioning to
include the recycling and re-use of components. Studies which included beneficial impacts of
recycling and re-use provided an emissions credit for recovering useful materials from the
turbines (13).
4.2 Nuclear Scenario
The lifecycle of electricity generation from nuclear power plants, as presented in Figure 14,
includes the extraction and production of uranium fuel and auxiliary supplies, operation of the
nuclear reactors, the construction and decommissioning of the power plant, and the
management of nuclear waste.
Compared with other generation options, the environmental emissions from nuclear power
generation are distributed across its lifecycle, including upstream fuel supply, plant
construction and decommissioning. Unlike other forms of non-renewable power, nuclear
power does not rely on fossil production, limiting the air emissions generated during normal
plant operations.
In this study, the nuclear power scenario covers all methods of upstream production and
power generation covered in the LCA literature. The operating lifetime considered to
annualize the lifespan emissions is 40 years, the median lifetime observed in LCA literature.
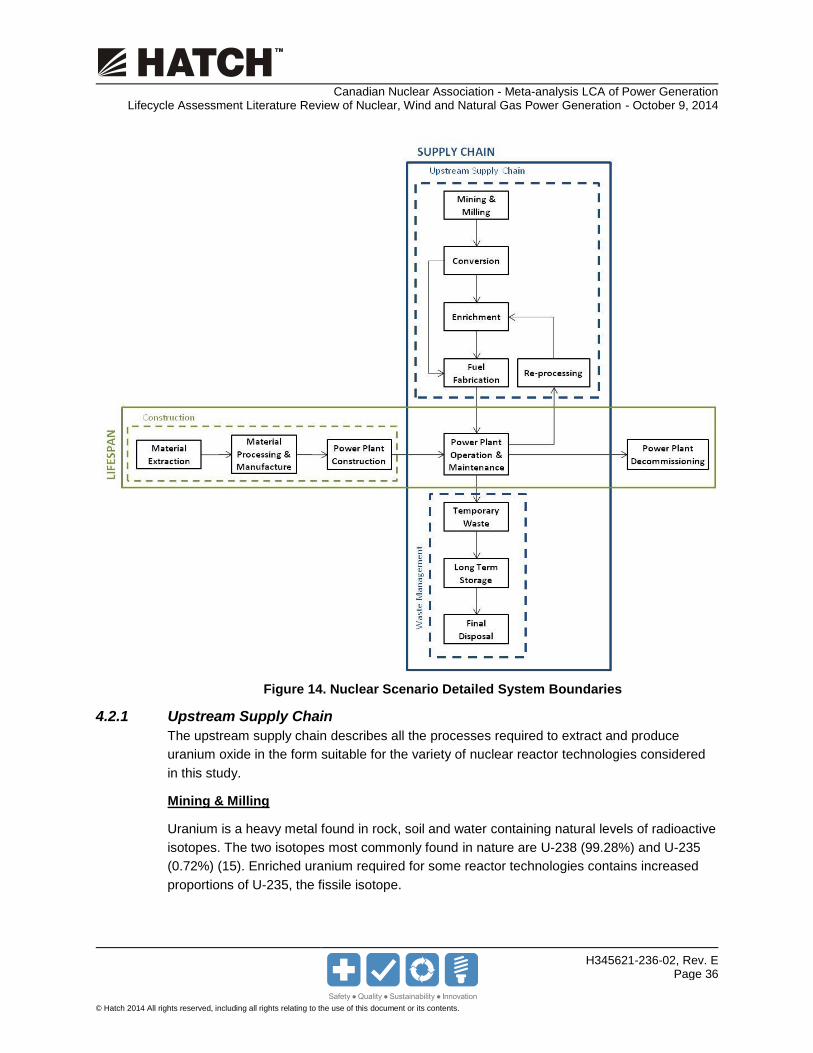
Canadian Nuclear Association - Meta-analysis LCA of Power Generation Lifecycle Assessment Literature Review of Nuclear, Wind and Natural Gas Power Generation - October 9, 2014
H345621-236-02, Rev. E Page 36
© Hatch 2014 All rights reserved, including all rights relating to the use of this document or its contents.
Figure 14. Nuclear Scenario Detailed System Boundaries
4.2.1 Upstream Supply Chain
The upstream supply chain describes all the processes required to extract and produce
uranium oxide in the form suitable for the variety of nuclear reactor technologies considered
in this study.
Mining & Milling
Uranium is a heavy metal found in rock, soil and water containing natural levels of radioactive
isotopes. The two isotopes most commonly found in nature are U-238 (99.28%) and U-235
(0.72%) (15). Enriched uranium required for some reactor technologies contains increased
proportions of U-235, the fissile isotope.

Canadian Nuclear Association - Meta-analysis LCA of Power Generation Lifecycle Assessment Literature Review of Nuclear, Wind and Natural Gas Power Generation - October 9, 2014
H345621-236-02, Rev. E Page 37
© Hatch 2014 All rights reserved, including all rights relating to the use of this document or its contents.
Uranium is mined in open pit mines, underground mines and by in-situ leaching (ISL), where
a leaching solution is pumped into the ore body to dissolve the uranium; the dissolved
uranium is then pumped to the surface. In line with the global scope of this study, all uranium
mining methods were considered, although the in-situ leaching process is not used anywhere
in Canada, and given the local geology, is an unlikely candidate to ever be applied in
Canada.
The concentration of uranium varies greatly depending on the substance and the location of
the ore deposit. Based on the LCA literature review, the ore grade varies from 0.01% to
12.7%, although the International Atomic Energy Agency states provides a broader range
varying between 0.03% and 20% (16).
The environmental emissions of the upstream nuclear fuel supply chain increase by orders of
magnitude for very low grade ores (less than 0.2%), as more material must be unearthed and
processed in order to produce fuel suitable for power generation.
During the data analysis, selected data points were discarded as statistical outliers when the
ore grades considered were below (0.2%). This decision was made to focus on the ore and
power production most typical of global production. Ore grades in Canada are some of the
highest in the world, evidenced from the McArthur River mine, containing an average uranium
content of 18% (17). Due to the high grade of uranium deposits in Canada, the extraction of
uranium destined for Canadian reactors is expected to be at the lower end of the emissions
spectrum.
The extracted ore is sent to a milling process, where the ore is crushed and treated with acid
or alkaline solutions to dissolve and separate the uranium from the waste rock. The uranium,
in the form of uranium oxide (U308) or yellow cake, is then recovered from the solution and
precipitated with a concentration higher than 80% (16).
Conversion
The conversion process converts yellow cake to uranium dioxide (UO2) and subsequently to
uranium hexafluoride (UF6) gas, which solidifies in large cylinders prior to transport (18).
Uranium dioxide (UO2) can be used directly as the fuel for CANDU reactors, which can
operate on un-enriched uranium, while uranium hexafluoride (UF6) gas is a feedstock for the
enrichment process required to produce fuel for other types of reactor technology.
Enrichment
Most nuclear reactor technologies require a U-235 concentration between 3% and 5% (16).
To increase the level of U-235 to the required levels, the UF6 undergoes an enrichment
process involving gaseous diffusion or gas centrifuge technology. Some LCA studies provide
emissions associated with only one method, while others provide emissions from a mix of
enrichment methods. According to several studies, gas diffusion is more energy and
emissions intensive than gas centrifuge technology (19); in fact, the gas centrifuge process
consumes 2% to 2.5% as much energy as gaseous diffusion (20).

Canadian Nuclear Association - Meta-analysis LCA of Power Generation Lifecycle Assessment Literature Review of Nuclear, Wind and Natural Gas Power Generation - October 9, 2014
H345621-236-02, Rev. E Page 38
© Hatch 2014 All rights reserved, including all rights relating to the use of this document or its contents.
Certain reactors, such as CANDU reactors, do not use any enrichment process, designed
instead to consume uranium with natural levels of U-235 (0.7%). For the purpose of this
study, all enrichment methods (including a lack of any enrichment) were included.
Fuel Fabrication
As a product of the enrichment phase, two streams of UF6 are generated: the enriched
uranium and the tails or depleted uranium. The enrichment uranium (UF6) is converted back
to uranium oxide (UO2) in the first step of the fuel fabrication process.
The converted enriched uranium oxide is then pressed and sintered at a high temperature
(over 1,400°C) to produce cylindrical fuel pellets (5 – 15 mm in diameter, and 10 – 15 mm in
length) (18), (16). The fuel pellets are then loaded into long tubes called rods. Rods are made
of a noncorrosive material, usually a zirconium alloy. Once grouped together into a bundle,
rods form a fuel assembly (16). A similar process is performed for un-enriched uranium oxide
destined for CANDU reactors.
Reprocessing
Some studies consider the reprocessing of the spent fuel, where the fuel bundles are cut, and
the fuel is dissolved and separated into its constituents, i.e., 96% uranium, 1% plutonium and
3% high level waste products (16). The recovered uranium can be returned to the conversion
plant to follow the same nuclear fuel cycle, to be reused as fuel after conversion and
enrichment. The recovered plutonium can be mixed with uranium to produce mixed oxide fuel
(MOX) which, in certain reactors, can substitute the U-235 (18).
Based on the literature reviewed, 27% of the studies include reprocessing, while 39% omit
this stage. The remaining studies, 34% of the literature reviewed, do not specify whether
reprocessing is included or not. Based on the study ―Life Cycle Inventories for the Nuclear
and Natural Gas Energy Systems, and Examples of Uncertainty Analysis‖ (21), reprocessing
counts less than 5% of the total GHG emission of the total lifecycle of nuclear power. For the
purpose of this study, papers with and without reprocessing were included.
4.2.2 Operation
Once the fuel is loaded into the nuclear reactor the controlled fission reaction starts. During
the fission process, the splitting of the U-235 atoms release energy, which is used to heat
water and produce high pressure steam. The steam is then used to turn a turbine, to
generate electricity. The exact operational process is fully controlled, and depends on the
type of nuclear reactor, the type of fuel, moderator and coolant used (18).
To maintain reactor performance, fuel is used for 3 to 6 years before being replaced. The
replacement cycle occurs every 12 to 18 months, where one third of the spent fuel is replaced
with fresh fuel (18). At this point, the concentration of U-235 is less than 1% (22).
The literature reviewed addressed several types of nuclear reactors. For the purpose of this
study, all technologies were considered. The technologies addressed in the literature include
light water reactors (LWR), pressurized water reactors (PWR), boiling water reactors (BWR),

Canadian Nuclear Association - Meta-analysis LCA of Power Generation Lifecycle Assessment Literature Review of Nuclear, Wind and Natural Gas Power Generation - October 9, 2014
H345621-236-02, Rev. E Page 39
© Hatch 2014 All rights reserved, including all rights relating to the use of this document or its contents.
advanced boiling water reactors, advanced gas-cooled reactors (AGR), Canada deuterium
uranium reactors (CANDU), European fast reactors (EFR), European pressurized reactors
(ERP), fast breeder reactors (FBR), and GEN III reactors, either represented alone or as a
mix of technologies.
A major difference between CANDU reactors and the other nuclear reactors assessed in this
study is the use of heavy water as a moderator and coolant. Since CANDU reactors are
included in this study, emissions associated with heavy water are accounted for in the final
results and within the plant operations process stage.
4.2.3 Waste Management
After the rods are unloaded from the nuclear reactor, they generate intense heat and
radiation. To control the heat and radiation, the fuel assemblies are submerged into water in
concrete ponds (18).
After a few years, when the temperature and the level of radiation from the spent fuel have
decreased, the spent fuel can be re-processed, or can be transferred to a long term and final
disposal facility, without reprocessing. As stated by the World Nuclear Association, ―about
97% of the used fuel can be recycled leaving only 3% as high-level waste‖ (18); however, the
reprocessing is not a common practice and only a small amount of the spent fuel is
reprocessed.
This study includes LCA studies covering GHG and other air emissions generated in the
process of managing various grades of nuclear waste generated by nuclear power plants, It
should be noted that only emissions associated to the waste management process are
considered in this stage; emissions associated with reprocessing are accounted for in the
upstream supply chain process.
Wastes from the nuclear fuel cycle are categorized as high-, intermediate- or low-level
wastes, depending on the amount of radiation emitted (18), (23):
Low-level wastes (LLW) contain small amounts of short-lived radioactivity, and are
produced throughout the nuclear fuel cycle.
Intermediate-level wastes (ILW) emit higher levels of radioactivity than LLW, requiring
shielding, but not cooling. ILW are produced during reactor operation and by
reprocessing.
High-level wastes (HLW) emit higher levels of radioactivity than ILW requiring shielding
and cooling. HLW are generated from reprocessing, or, depending on the country, the
spent fuel itself.
Currently, LLW and ILW are disposed of in near surface strata such as abandoned mines
(22). High level waste can be calcined and encased in solid materials such as glass (vitrified),
concrete and metal, to be stored into ponds or casks until the radioactivity levels and the
concentration are reduced to less than 1% of its original value (18), (22).

Canadian Nuclear Association - Meta-analysis LCA of Power Generation Lifecycle Assessment Literature Review of Nuclear, Wind and Natural Gas Power Generation - October 9, 2014
H345621-236-02, Rev. E Page 40
© Hatch 2014 All rights reserved, including all rights relating to the use of this document or its contents.
Currently, operating facilities managing HLW focus on storage rather than permanent
disposal. Potential final disposal sites include deep geological formations, such as salt domes
or granite bodies (18). Manfred Lenzen in ―Life cycle energy and Greenhouse Gas Emission
of Nuclear Energy: A Review‖ notes that, to prevent any groundwater contamination, the
formations will have to ―exhibit a lack of contact with ground water, tectonic stability,
sufficient heat conductivity and low permeability for radionuclides‖ (22).
4.2.4 Construction
The upstream lifespan stage includes the extraction, production and transportation of all
necessary materials required for the construction of nuclear power plants. Construction of the
waste management facilities for radioactive wastes is also included. It is important to note
that construction activities are dependent on the type of nuclear reactor.
Similarly to the upstream supply chain, emissions from plant construction are influenced by
the transportation from the extraction and production center (e.g. steel mill, cement plant,
etc.) to the site of the nuclear power plant.
4.2.5 Decommissioning
The decommissioning stage encompasses all environmental impacts associated with the
dismantling of the nuclear power plant, as well as the management of radioactive and non-
radioactive waste generated. Similarly to construction, decommissioning is dependent on the
type of nuclear reactor.
4.3 Natural Gas Scenario
As presented in Figure 15, the lifecycle of natural gas starts with the extraction and
production of natural gas and ends with the final disposal of wastes, including construction
and decommissioning activities.
The lifecycle of natural gas power generation considered in this study encompasses natural
gas sourced from conventional and unconventional sources such as shale gas, and is limited
to combined cycle generation facilities, the most efficient and least emissions intensive
commercial natural gas power plant technology. Compared with other generation options,
the environmental emissions from natural gas power generation are dominated by the power
plant itself, resulting from the combustion of natural gas.
The operating lifetime considered to annualize the lifespan emissions is 30 years, the median
lifetime observed in LCA literature.

Canadian Nuclear Association - Meta-analysis LCA of Power Generation Lifecycle Assessment Literature Review of Nuclear, Wind and Natural Gas Power Generation - October 9, 2014
H345621-236-02, Rev. E Page 41
© Hatch 2014 All rights reserved, including all rights relating to the use of this document or its contents.
Figure 15. Natural Gas Scenario Detailed System Boundaries
4.3.1 Upstream Supply Chain
Natural gas comes from both ‗conventional‘ and ‗unconventional‘ sources. Conventional gas
refers to gas ―trapped in structures in the rock that are caused by folding and/or faulting of
sedimentary layers‖ (24). This gas is often difficult to find but, is typically the easiest and most
cost-effective to extract. Unconventional gas is ―trapped in impermeable rock which cannot
migrate to a trap‖ (24).
Shale gas, a type of unconventional gas, are formations of organic-rich shale, a sedimentary
rock formed from deposits of mud, silt, clay, and organic matter. Normally, shale reservoirs
are continuous deposits over large areas, with low permeability and low natural production
capacities (25).
The upstream supply chain starts with the preparation of the well pad (clearing the well pad
area and construction of temporary structures) so the construction and installation of wells
can begin. Conventional gas reservoirs do not require significant site preparation to recover
the gas using by vertical drilling techniques (5). Shale gas recovery requires the creation of a
wellbore that runs the length of a shale formation (horizontal drilling), and hydraulic fracturing

Canadian Nuclear Association - Meta-analysis LCA of Power Generation Lifecycle Assessment Literature Review of Nuclear, Wind and Natural Gas Power Generation - October 9, 2014
H345621-236-02, Rev. E Page 42
© Hatch 2014 All rights reserved, including all rights relating to the use of this document or its contents.
(hydrofracking) to allow the movement of the gas to the surface (5). During hydrofracking, a
high pressure fluid (a mixture of water, surfactants, and proppants) is inserted to break apart
the reservoir of natural gas (26).
After the pre-production phase is completed, the well becomes operational and natural gas is
extracted as a mixture of raw natural gas, condensed higher hydrocarbons, free water and
particles. Once the well has been producing for some time, some maintenance activities
and/or alterations (also know as well workovers (27)) to the well might be required.
The raw gas needs to be purified to meet pipeline specifications (5). Thus, the raw natural
gas is sent to a processing plant where it undergoes different processes such as dehydration,
acid gas removal (sweetening), flaring and compression (5), to remove the water, carbon
dioxide, sulphur and other hydrocarbons mixed with the raw natural gas. Flaring is required in
certain occasions when natural gas (or other hydrocarbon) stream cannot be safely or
economically recovered (5).
Among the literature reviewed, different assumptions regarding the pre-production and
production stage of natural gas are considered:
Number of wells per pad;
Equipment required for drilling. Some studies considered only drilling rigs, while other
considered a comprehensive list of equipment;
Length of the well;
Well completion emissions flared and vented;
Productivity of the well;
Number of hydraulic fractures per cycle.
For the purpose of this study, all the different assumptions mentioned above were included.
Once processed, natural gas is ready to be compressed and sent to the power plants by a
pipeline transmission system. The transmission system might include some storage to meet
seasonal and/or sudden short-term demand (28), (29), (26).
Various parameters such as the length of the pipeline transmission, maintenance (type of
activities and frequency) and emissions from the pipeline itself will affect the overall
emissions from this stage. For the purpose of this study, all the different parameters
mentioned above were considered in the results.
4.3.2 Operation
The operation stage encompasses the environmental impacts associated with the operation
and maintenance of the natural gas combined cycle power plant.
In a basic combined cycle power plant, Figure 16, the natural gas is burned in a gas
combustion turbine in the presence of compressed air, generating electricity. The heat in the

Canadian Nuclear Association - Meta-analysis LCA of Power Generation Lifecycle Assessment Literature Review of Nuclear, Wind and Natural Gas Power Generation - October 9, 2014
H345621-236-02, Rev. E Page 43
© Hatch 2014 All rights reserved, including all rights relating to the use of this document or its contents.
exhaust gas from the gas turbine is recovered and utilized to drive a steam turbine to
generate additional electricity, thereby increasing overall efficiency relative to single cycle
generation facilities (27).
Figure 16. Natural Gas Combined Cycle Generation
4.3.3 Waste Management
This stage includes emissions associated with the management of wastes generated during
normal operation and maintenance of the NGCC power plant, including transportation of
wastes to waste treatment facilities. Waste management refers to the handling of solid and
liquid wastes and does not refer to off-gas pollution control equipment.
Waste management for NGCC power plants is not well defined by the LCA literature included
in this study, lacking documentation of the operating parameters and waste management
practices considered during modelling. In all cases, waste management was included within
normal plant operations or otherwise not explicitly defined.
The overall contribution of waste management is negligible in comparison to the total lifecycle
emissions. This assumption was validated with the study ―Life Cycle Assessment of a Natural
Gas Combined-Cycle Power Generation System‖ by Spath and Mann (30). According to this
study, 94 wt% percent of the total solid waste comes from the production and distribution of
natural gas. The only waste stream from the plant is spent catalyst generated every one to
five years from the selective catalytic reduction (SCR) unit. SCR is frequently used to reduce
NOx emissions from power plants, by injecting ammonia (NH3) into the gas stream before the
gas enters the catalyst bed. (30).
4.3.4 Construction
The upstream lifespan stage includes the extraction, production and transportation of all
necessary materials for the construction of a NGCC power plant, including steel, cement and
other building materials. The electricity and fuel required for construction activities is also
considered.
Construction of auxiliary infrastructure (such as pipelines and transmissions lines) is omitted
from the study system boundary, as it is determined that they would exist without the
construction of the studied facility or fuel extraction operation.

Canadian Nuclear Association - Meta-analysis LCA of Power Generation Lifecycle Assessment Literature Review of Nuclear, Wind and Natural Gas Power Generation - October 9, 2014
H345621-236-02, Rev. E Page 44
© Hatch 2014 All rights reserved, including all rights relating to the use of this document or its contents.
4.3.5 Decommissioning
The decommissioning phase covers all environmental impacts associated with the site work
for the dismantling of the natural gas power plant, the transportation of waste to waste
management facilities, and the impacts/credits associated with the final waste management,
either by recycling, incineration, or by depositing at a landfill site.
4.4 Wind/Natural Gas Scenario
In addition to the stand-alone wind, nuclear and natural gas power generation scenarios, a
mix of natural gas and wind power was also considered. In this scenario, the LCA models of
wind and natural gas were summed based on a 20% to 80% split of total electricity
generation, respectively. Accordingly, the system boundaries of the scenario is equal to a
combination of the systems detailed in Section 4.1 and 4.3.
The wind/natural gas scenario was considered to reflect the intermittency of wind power
supply. As an intermittent power source, wind generation must be paired with energy storage
or an alternate power source capable of responding to changing electricity demand.
The severity of intermittency depends on a number of regional factors including climate
patterns and seasonal load variations. Integrating high proportions of wind power also faces
practical limits imposed by existing electricity grid infrastructure, which could be alleviated in
part by implementing modern smart grid technology.
Technical options to overcome the intermittency of wind turbines include (31):
Interconnect several wind farms along a wide geographical zone. A disperse
geographical area will ensure that power is always produced.
Implement a smart grid that allows interconnection of renewable and non-renewable
resources, by managing the response depending on the availability of renewable energy.
Integrate wind turbines with a non-variable energy source that can rapidly adjust to the
demand, such as NGCC power plants.
For the purpose of this study, an option where wind power is supplemented with NGCC
power plant is considered.
Due in part to the range of variables above, a wide range of ratios have been published for
the total electricity supplied by wind, ranging in extremes between 10% and 85%. A study
published in October 2006 for the Ontario Power Authority (OPA), Ontario Independent
Electric System Operator (IESO), and the Canadian Wind Energy Association (CanWEA)
examined a number of wind scenarios in Ontario. The study used an ―overall yearly capacity
value {of} approximately 20% for all wind penetration scenarios‖. In the study, a high
penetration scenario for wind of 13% total yearly energy was considered for Ontario(32).
For the purposes of the present analysis, a basis of 20% total wind penetration (electricity
supplied) was considered, with the remaining 80% of annual electricity supply being
supported by NGCC.

Canadian Nuclear Association - Meta-analysis LCA of Power Generation Lifecycle Assessment Literature Review of Nuclear, Wind and Natural Gas Power Generation - October 9, 2014
H345621-236-02, Rev. E Page 45
© Hatch 2014 All rights reserved, including all rights relating to the use of this document or its contents.
5. Results
5.1 Guide to Interpreting Results
This section reports the emissions from each lifecycle stage and lifespan of each energy
generation scenario. For each generation technology, GHG (as CO2e), NOx, SOx and PM
emissions are evaluated per kWh of electricity generated, according to the contributions to
the following five lifecycle stages: construction (from extraction of raw materials to
construction activities), decommissioning (dismantling activities and waste management),
upstream supply chain (from extraction of the fuel to the gate of the plant), operation
(operation and maintenance) and waste management (waste disposal from normal
operation).
The results are consistent with the scope and system boundaries defined in Section 2 and 4
and the LCA literature review and meta-analysis methodology presented in Section 3. The
results document the mean, standard deviation and uncertainty of the mean corresponding to
the distribution of data points observed in the LCA literature. First, a comparison of the total
lifecycle of each generation scenario is presented in Section 5.2, with a focus on the
contributions of individual process stages to follow in Section 5.3. Sections 5.4 and 5.5 cover
an analysis of emissions from natural gas sources and the ionizing radiation (IR) potential of
nuclear power generation.
Beyond the total average results, a statistical analysis was performed to support the study‘s
overall findings. The statistical approach helps convey the strengths, weaknesses, and
characteristics of the literature LCA data and results. Figure 17 shows a sample bar plot used
to represent the results of the statistical analysis. The mean (centre-line) is the best single-
point value representing the LCA literature, the standard deviation (clear bars) represents the
spread of data points in the distribution of LCA literature, while the uncertainty of the mean
(red bars) is representative of the confidence (or uncertainty) of the calculation of the mean.
Figure 17. Schematic Plot Used to Represent the Mean and Distribution of Literature Data
The standard deviation helps to characterize the range of LCA literature resulting from the
degree of variation in the:
Measurement and modelling techniques used (e.g. varying modelling assumptions
affecting the range of results);

Canadian Nuclear Association - Meta-analysis LCA of Power Generation Lifecycle Assessment Literature Review of Nuclear, Wind and Natural Gas Power Generation - October 9, 2014
H345621-236-02, Rev. E Page 46
© Hatch 2014 All rights reserved, including all rights relating to the use of this document or its contents.
Scope and system boundaries considered (e.g. technology variations, regional
differences, etc.);
Environmental performance achieved by the specific plants considered (e.g. best
practice facilities, use of emission control technologies, etc.).
The uncertainty of the mean represents the range within which the true mean of the dataset is
expected to reside. The uncertainty of the mean becomes smaller when the size of the LCA
dataset increases. Comparing the size of this confidence range across each power
generation scenario helps determine:
The strengths and weaknesses in the assertion of the calculated mean;
Whether the difference in mean emissions between two power generation scenarios
is a true result or the result of statistical uncertainty.
In some cases, the lower bound of the standard deviation or uncertainty of the mean may be
less than zero. In these cases, the negative value may be a result of the statistical approach
used rather than the real distribution of the data itself. Generally, this condition will occur
when there is a wide distribution of a small set of data, asymmetrically distributed about the
mean.
5.2 Total Lifecycle Emissions
This section illustrates the total lifecycle emissions for each power generation scenario
considered by the study:
Onshore wind generation;
Nuclear power;
Natural gas combined cycle (NGCC); and
A total electricity supply mix of onshore wind (20%) and NGCC (80%) generation.
Figure 18 and Table 5 present the total mean lifecycle emissions for each generation
scenario, representing the full range (top) comparing NGCC relative to the other scenarios
and a close-up range (bottom) comparing the differences between wind and nuclear.
Figure 18 shows that nuclear and wind power are similar in magnitude for each emission
category and an order of magnitude less than natural gas with respect to GHG and NOX
emissions. The graph also shows that the GHG and NOX contribution from nuclear power is
slightly higher than wind while slightly lower for PM and SOX.

Canadian Nuclear Association - Meta-analysis LCA of Power Generation Lifecycle Assessment Literature Review of Nuclear, Wind and Natural Gas Power Generation - October 9, 2014
H345621-236-02, Rev. E Page 47
© Hatch 2014 All rights reserved, including all rights relating to the use of this document or its contents.
Figure 18. Summary of Total Lifecycle Emissions
Table 5. Statistical Mean Total Lifecycle Emissions
Scenario GHG (gCO2-e/kWh)
PM (g/kWh)
NOX (g/kWh)
SOX (g/kWh)
Onshore Wind Turbine
10.5 ± 0.9 0.015 ± 0.003 0.028 ± 0.003 0.025 ± 0.003
Nuclear Power Plants
18.5 ± 1.7 0.008 ± 0.003 0.039 ± 0.006 0.023 ± 0.003
NGCC Power Plants
478 ± 10 0.021 ± 0.012 0.62 ± 0.03 0.007 ± 0.001
Mix Wind-NGCC 385 ± 8 0.02 ± 0.01 0.50 ± 0.02 0.011 ± 0.001

Canadian Nuclear Association - Meta-analysis LCA of Power Generation Lifecycle Assessment Literature Review of Nuclear, Wind and Natural Gas Power Generation - October 9, 2014
H345621-236-02, Rev. E Page 48
© Hatch 2014 All rights reserved, including all rights relating to the use of this document or its contents.
Total lifecycle emissions from the 20-80 electricity supply mix of wind-NGCC is more
comparable to NGCC, where emissions of GHG and NOx exceed nuclear or the stand-alone
wind power scenario. The wind-NGCC scenario reflects a potential grid mix based on current
grid infrastructure in Canada that (in the absence of energy storage) uses NGCC supply to
compensate for the intermittent nature of electricity generation from wind power.
Figure 19 presents the mean and range of total lifecycle emissions for each power generation
scenario resulting from the statistical analysis of the LCA literature data. The standard
deviation (clear bars) represents the spread of data points in the distribution of LCA literature,
while the uncertainty of the mean (red bars) is representative of the confidence in the
calculation of the mean (centre-line). For guidance in interpreting the results, please refer to
Section 5.1.
Figure 19. Total Lifecycle Emissions (Statistical Approach)*†
* Standard deviation ranges less than zero are due to the statistical approach used to represent the data. Actual emissions data in all cases exceeds zero. † Note that a secondary y-axis is presented for GHG and NOX emissions corresponding to the NGCC and
wind/NGCC scenarios (indicated by a dashed vertical line).
0
5
10
15
20
25
30
35
Wind Nuclear
GH
G (g
CO
2-e
/kW
h)
300
335
370
405
440
475
510
545
NGCC Wind/NGCC
GH
G (g
CO
2-e
/kW
h)
0.00
0.01
0.02
0.03
0.04
0.05
0.06
0.07
Wind Nuclear
NO
x (g
/kW
h)
0.30
0.36
0.42
0.48
0.54
0.60
0.66
0.72
NGCC Wind/NGCC
NO
x (g
/kW
h)
-0.01
0.00
0.01
0.02
0.03
0.04
0.05
Wind Nuclear NGCC Wind/NGCC
PM
(g/k
Wh
)
0.000
0.005
0.010
0.015
0.020
0.025
0.030
0.035
0.040
Wind Nuclear NGCC Wind/NGCC
SOx
(g/k
Wh
)

Canadian Nuclear Association - Meta-analysis LCA of Power Generation Lifecycle Assessment Literature Review of Nuclear, Wind and Natural Gas Power Generation - October 9, 2014
H345621-236-02, Rev. E Page 49
© Hatch 2014 All rights reserved, including all rights relating to the use of this document or its contents.
Figure 19 confirms that the range of GHG and NOX emissions for natural gas and a mix of
natural gas and wind power are in every case, significantly higher than for the nuclear and
wind power scenario. GHG emissions from wind power reside in the lower half of the nuclear
power generation studies investigated, although the average GHG and NOX emissions from
nuclear LCA data are distinctly higher than for wind power. Lifecycle emissions from both
wind and nuclear power are between 2% - 4%, and 4% - 6% those of natural gas generation
for GHG and NOX, respectively.
The comparison of PM emissions across generation scenarios is less conclusive, due to the
low availability and high variability of the LCA literature data. While the range of PM
emissions from wind and nuclear power appear on the lower range of natural gas, their
means fall within the range of uncertainty for natural gas and the wind/NGCC mix. In this
case, the high uncertainty involved in calculating the mean for natural gas generation makes
it difficult to make a definitive comparison between the scenarios.
The difference in the mean SOX emissions for wind and nuclear power is similarly
inconclusive due to limited data availability and a range of modelling parameters affecting the
results. SOX emissions are particularly sensitive to the presence of coal in the upstream
power generation and supply mix considered in each LCA study. The natural gas scenario
has reduced SOX emissions relative to wind and nuclear.

Canadian Nuclear Association - Meta-analysis LCA of Power Generation Lifecycle Assessment Literature Review of Nuclear, Wind and Natural Gas Power Generation - October 9, 2014
H345621-236-02, Rev. E Page 50
© Hatch 2014 All rights reserved, including all rights relating to the use of this document or its contents.
5.3 Lifecycle Distribution
5.3.1 Overview
Figure 20 presents a breakdown of the average contribution of each supply chain and
lifespan process stage to the total lifecycle emissions of each scenario A more detailed
breakdown of each scenario is provided separately in Figure 21 to Figure 24, including the
range of data represented by the LCA literature investigated.
Figure 20. Percentage Contribution of Lifespan and Supply Chain Process Stages to Total Lifecycle Emissions
0% 10% 20% 30% 40% 50% 60% 70% 80% 90% 100%
PM
SOx
NOx
GHG
PM
SOx
NOx
GHG
PM
SOx
NOx
GHG
PM
SOx
NOx
GHG
Win
d N
GC
C M
ixN
GC
CN
ucl
ear
Win
d
Percentage Contribution (%)
Construction Decommissioning Upstream Supply Chain Operation Waste Management
LIFESPAN PROCESS STAGES SUPPLY CHAIN PROCESS STAGES

Canadian Nuclear Association - Meta-analysis LCA of Power Generation Lifecycle Assessment Literature Review of Nuclear, Wind and Natural Gas Power Generation - October 9, 2014
H345621-236-02, Rev. E Page 51
© Hatch 2014 All rights reserved, including all rights relating to the use of this document or its contents.
From Figure 20, the predominate process stages for each generation scenario can be
observed:
Emissions generated during the lifecycle of a wind farm are generated primarily from the
production and application of construction materials and the assembly of the turbine
itself, as opposed to the requirements of continuously operating the turbine over it‘s
operational phase. Lifespan (construction and decommissioning) activities are the
predominant segments of the wind power lifecycle despite being distributed across the
operating lifetime of the wind farm (considered to be 20 years), emphasizing the minimal
impacts observed during the operating phase. Accordingly, emissions from wind power
are especially sensitive to choice of operating lifetime during LCA modelling, where
longer operating times act to reduce lifespan emissions when presented relative to power
produced.
Emissions from the nuclear power lifecycle are primarily associated with the supply chain
and plant operations, as opposed to construction and decommissioning activities. The
upstream supply chain in particular is the most significant emissions source for all
emissions types. The upstream supply chain consists primarily of the various extraction,
enrichment and fabrication processes involved in delivering fuel bundles to the various
nuclear reactor technologies considered in the study.
Emissions generated across the natural gas (NGCC) scenario are dominated by the
supply chain and plant operations rather than plant construction and decommissioning.
Emissions across all categories are driven by natural gas combustion during the
operational phase and through flaring, fugitive emissions and other sources during
extraction and fuel processing.
The scenario considering a total electricity supply mix of wind (20%) and NGCC (80%) is
a linear combination of the wind and NGCC models. Accordingly, the distribution of
emissions from this scenario is a combination of wind and NGCC. The NGCC scenario
contributes the majority of GHG and NOX emissions relative to wind power, resulting in a
distribution closely matching NGCC. However, the SOX and PM emissions from wind
farm construction are not immaterial, resulting in both the wind and NGCC scenarios
contributing to the lifespan and supply chain stages of the aggregated result.
5.3.2 Wind Power
Figure 21 shows the mean and distribution of LCA literature data for environmental emissions
pertaining to each stage in the wind power lifecycle. As reported in Section 5.3.1, the
average contribution of the lifespan stages – construction and decommissioning – are the
most significant contributors to the total lifecycle emissions, representing between 85% and
99% of total lifecycle emissions. By comparison, the other stages – the upstream supply
chain, turbine operations, and waste management – are minor, consisting primarily of the
activities surrounding periodic turbine maintenance.

Canadian Nuclear Association - Meta-analysis LCA of Power Generation Lifecycle Assessment Literature Review of Nuclear, Wind and Natural Gas Power Generation - October 9, 2014
H345621-236-02, Rev. E Page 52
© Hatch 2014 All rights reserved, including all rights relating to the use of this document or its contents.
The lifespan stages of wind power generation are also the most studied by LCA practitioners,
especially for GHG emissions. Consideration of the supply chain and turbine operations was
more limited, consistent with the often negligible contribution made to overall lifecycle
emissions. These phases may have been excluded from the system boundaries of other
LCA studies or implicitly incorporated into the LCA models without specific documentation.
Of the environmental emissions included in the study, GHGs were well documented, while
data at the process stage level was limited and varied for NOX, SOX and PM. In these cases,
the range of confidence in the mean is broad, but sufficient to identify the dominance of the
construction phase relative to the other stages.
Figure 21. Lifecycle Distribution for Onshore Wind Turbines*
* LCA data for decommissioning may be positive (emissions generated) or negative (emissions avoided) depending on the modelling basis and assumptions considered in each individual LCA study.
-5.000
0.000
5.000
10.000
15.000
20.000
Upstream Operation Waste Construction Decom.
SUPPLY CHAIN LIFESPAN
GH
G (g
CO
2-e
/kW
h)
-0.01
0.00
0.01
0.02
0.03
0.04
0.05
Upstream Operation Waste Construction Decom.
SUPPLY CHAIN LIFESPAN
NO
x (g
/kW
h)
-0.010
-0.005
0.000
0.005
0.010
0.015
0.020
0.025
Upstream Operation Waste Construction Decom.
SUPPLY CHAIN LIFESPAN
PM
(g/k
Wh
)
-0.005
0.000
0.005
0.010
0.015
0.020
0.025
0.030
0.035
Upstream Operation Waste Construction Decom.
SUPPLY CHAIN LIFESPAN
SOx
(g/k
Wh
)

Canadian Nuclear Association - Meta-analysis LCA of Power Generation Lifecycle Assessment Literature Review of Nuclear, Wind and Natural Gas Power Generation - October 9, 2014
H345621-236-02, Rev. E Page 53
© Hatch 2014 All rights reserved, including all rights relating to the use of this document or its contents.
A number of observations on the wind power lifecycle and LCA literature can be inferred from
Figure 21:
Despite limiting the scope of the scenario to on-shore wind farms, there is a relatively
broad distribution of GHG emission data for construction-related activities. This
range of data is also apparent in the range of total lifecycle GHG emissions (Section
5.2). Rather than representing technological differences, this range is indicative of
the range of electricity grid emissions factors contributing to the production and
fabrication of wind turbine components. GHG grid emission factors can vary by up to
two orders of magnitude depending on the power supply mix representing each
region, an important contributor to most production and fabrication processes.
The LCA literature considered a range of approaches to model the decommissioning
of a wind turbine, ranging from net positive (impact) to net negative (credit)
emissions. On average, LCA practitioners have considered decommissioning as a
net negative process, or a credit reducing the total emissions generated by the wind
power lifecycle. Net negative emissions can occur when the recycling and re-use of
materials is considered to offset emissions generated by another system. In this
case, many components of the wind turbines were modeled as recyclable or reusable
for other purposes, offsetting the production of virgin materials (33).
5.3.3 Nuclear Power
Figure 22 shows the mean and distribution of LCA literature data for environmental emissions
pertaining to each stage in the nuclear power lifecycle. As reported in Section 5.3.1, the
upstream supply chain, and primarily the provision of nuclear fuel, is the main contributor to
each environmental indicator considered in the nuclear power plant lifecycle. The other
process stages each make a small contribution to the total lifecycle, and exhibit a smaller
range of data when compared to the upstream supply chain. On average, nuclear power
plant decommissioning has a small but net positive effect on total lifecycle emissions.
Of the environmental emissions considered, GHG emissions have been the largest focus
area for nuclear LCA studies, exhibited by the relatively well defined mean GHG emissions
for each process stage. PM, SOX and NOX emissions, while less studied than GHGs, have
received more attention for nuclear power than the wind and natural gas scenarios, where
data was more limited.

Canadian Nuclear Association - Meta-analysis LCA of Power Generation Lifecycle Assessment Literature Review of Nuclear, Wind and Natural Gas Power Generation - October 9, 2014
H345621-236-02, Rev. E Page 54
© Hatch 2014 All rights reserved, including all rights relating to the use of this document or its contents.
Figure 22. Lifecycle Distribution for Nuclear Power Plants*
A number of observations on the nuclear power lifecycle and LCA literature can be inferred
from Figure 22:
The broad range of upstream supply chain results derived from LCA literature is
indicative of the range of nuclear generation technologies considered within the
scope and system boundaries of this study. The range of results was affected by
uranium ore grade, type of enrichment technology (if any), and other factors
discussed in Section 4.2.1.
Under certain upstream technology configurations, the emissions from the nuclear
power lifecycle may equal those of onshore wind generation on a per kWh generated
basis. In particular, nuclear fuel supply chains with high grade ore and either no
enrichment or centrifuge-based enrichment form the lower band of LCA data
observed in the literature.
* Standard deviation ranges less than zero are due to the statistical approach used to represent the data. Actual emissions data in all cases exceeds zero.
-5
0
5
10
15
20
25
Upstream Operation Waste Construction Decom.
SUPPLY CHAIN LIFESPAN
GH
G (g
CO
2-e
/kW
h)
-0.001
0.000
0.001
0.002
0.003
0.004
0.005
0.006
0.007
Upstream Operation Waste Construction Decom.
SUPPLY CHAIN LIFESPAN
PM
(g/k
Wh
)
-0.01
0.00
0.01
0.02
0.03
0.04
0.05
0.06
0.07
Upstream Operation Waste Construction Decom.
SUPPLY CHAIN LIFESPAN
NO
x (g
/kW
h)
-0.005
0.000
0.005
0.010
0.015
0.020
0.025
0.030
Upstream Operation Waste Construction Decom.
SUPPLY CHAIN LIFESPAN
SOx
(g/k
Wh
)
Canadian Nuclear Association - Meta-analysis LCA of Power Generation Lifecycle Assessment Literature Review of Nuclear, Wind and Natural Gas Power Generation - October 9, 2014
H345621-236-02, Rev. E Page 55
© Hatch 2014 All rights reserved, including all rights relating to the use of this document or its contents.
From an emissions perspective, the influence of reactor technology was more
impactful upstream rather than directly at the power plant itself, specifically CANDU
reactors able to process un-enriched fuel bundles avoid emissions generated during
enrichment. The second largest contribution for all environmental impacts is
construction, where the range of data may be explained in part by technological
differences, but also other factors including the variation in grid electricity mix by
region.
While data for waste management of spent fuel and plant decommissioning have not
been studied to the extent of other stages of the nuclear lifecycle, their overall impact
is relatively small and in line with emissions from other phases of the lifecycle.
5.3.4 Natural Gas Power Generation
Figure 23 shows the mean and distribution of LCA literature data for environmental emissions
pertaining to each stage in the natural gas (NGCC) power lifecycle.
GHG emissions from NGCC power plants are mainly generated during the operational stage
due to the combustion of natural gas, contributing 82% of total lifecycle emissions. Most of
the balance of GHG emissions stem from the upstream extraction and processing of natural
gas, emitted as fugitives and during flaring. Conversely NOX and SOX emissions are
generated primarily from the upstream supply chain (80% and 55% of the total lifecycle,
respectively) and to a lesser extent from NGCC plant operation.
A wealth of LCA data is available documenting GHG emissions for each stage of the natural
gas lifecycle. However, for NOX, SOX and especially PM emissions, a lack of available and
consistent data reduces the ability to accurately determine mean emissions figures from the
LCA literature. PM emission for the operational stage of NGCC power plants were highly
variable amongst the literature examined, ranging from effectively zero to 62 mg/kWh. This
range may be due to real observations such as a range in the presence and effectiveness of
PM control technologies, or undetermined variations in study scope, system boundaries and
assumptions.

Canadian Nuclear Association - Meta-analysis LCA of Power Generation Lifecycle Assessment Literature Review of Nuclear, Wind and Natural Gas Power Generation - October 9, 2014
H345621-236-02, Rev. E Page 56
© Hatch 2014 All rights reserved, including all rights relating to the use of this document or its contents.
Figure 23. Lifecycle Distribution for Natural Gas Combined Cycle Power Plants*
A number of observations on the NGCC power lifecycle and LCA literature can be inferred
from Figure 23:
GHG emissions produced from NGCC plants (operations process stage) are well-
defined across the LCA literature, likely range bound due to its direct correlation with
NGCC plant efficiency and the combustion products generated during natural gas
consumption.
Despite the variation of technologies considered for the supply of natural gas,
including conventional and unconventional sources, LCA data documenting upstream
GHG, NOX and PM emissions are narrowly defined. The variation (or lack there of)
for the upstream natural gas sources considered in this study is presented in Section
5.4.
* Standard deviation ranges less than zero are due to the statistical approach used to represent the data. Actual emissions data in all cases exceeds zero.
0
50
100
150
200
250
300
350
400
450
Upstream Operation Waste Construction Decom.
SUPPLY CHAIN LIFESPAN
GH
G (g
CO
2-e
/kW
h)
-0.020
-0.010
0.000
0.010
0.020
0.030
0.040
0.050
Upstream Operation Waste Construction Decom.
SUPPLY CHAIN LIFESPAN
PM
(g/k
Wh
)
-0.1
0.0
0.1
0.2
0.3
0.4
0.5
0.6
Upstream Operation Waste Construction Decom.
SUPPLY CHAIN LIFESPAN
NO
x (g
/kW
h)
-0.001
0.000
0.001
0.002
0.003
0.004
0.005
0.006
0.007
Upstream Operation Waste Construction Decom.
SUPPLY CHAIN LIFESPAN
SOx
(g/k
Wh
)

Canadian Nuclear Association - Meta-analysis LCA of Power Generation Lifecycle Assessment Literature Review of Nuclear, Wind and Natural Gas Power Generation - October 9, 2014
H345621-236-02, Rev. E Page 57
© Hatch 2014 All rights reserved, including all rights relating to the use of this document or its contents.
Conversely the range LCA data for NOX and SOX emissions from NGCC plants is
broad. Combined with the increased level of NOX and SOX emissions from natural
gas extraction and production, the broad range of data from operations is indicative
of a range of NOX and SOX control technologies applied to NGCC sites. Without
emissions control technologies in place at the plant, the emissions of NOx and SOx
might otherwise might otherwise mirror GHG emissions, more closely related to the
combustion of natural gas, which is more significant during plant operations than
upstream extraction and processing.
5.3.5 Wind and Natural Gas Mix
Figure 24 shows the mean and distribution of LCA literature data for environmental emissions
pertaining to each stage in a 20%/80% hybrid wind-NGCC generation mix (i.e. 20% wind
power penetration). As a linear combination of the wind and natural gas scenarios presented
in Section 5.3.2 and 5.3.4, the characteristics of the LCA data are also a blend of the two
scenarios.
In the wind-NGCC scenario, GHG emissions are generated almost exclusively from natural
gas supply and NGCC plant operations, each with sufficient data available to determine the
mean for each process stage with reasonable confidence.
PM emissions occur primarily from NGCC plant operation and wind farm construction,
although a lack of availability and consistency of PM data for NGCC plants limits the ability of
this study to draw any definitive conclusions. A small dataset representing PM emissions
from NGCC reduced the degree of confidence in the determination of the mean.
NOX emissions are driven by the upstream supply chain, followed by the operation of the
power plant. NOX emissions represent the emissions from the natural gas supply chain,
diluted by the addition of wind power.
The SOX emissions across the lifecycle of the mixed wind-NGCC scenario are representative
of a combination of emissions from the natural gas supply chain and wind farm lifespan. The
wind lifespan is the largest contributor of SOX, potentially resulting from coal-derived
electricity and materials used during wind farm construction and turbine assembly. The
natural gas supply chain contributes SOX emissions from fuel extraction and processing as
well as NGCC plant operations.
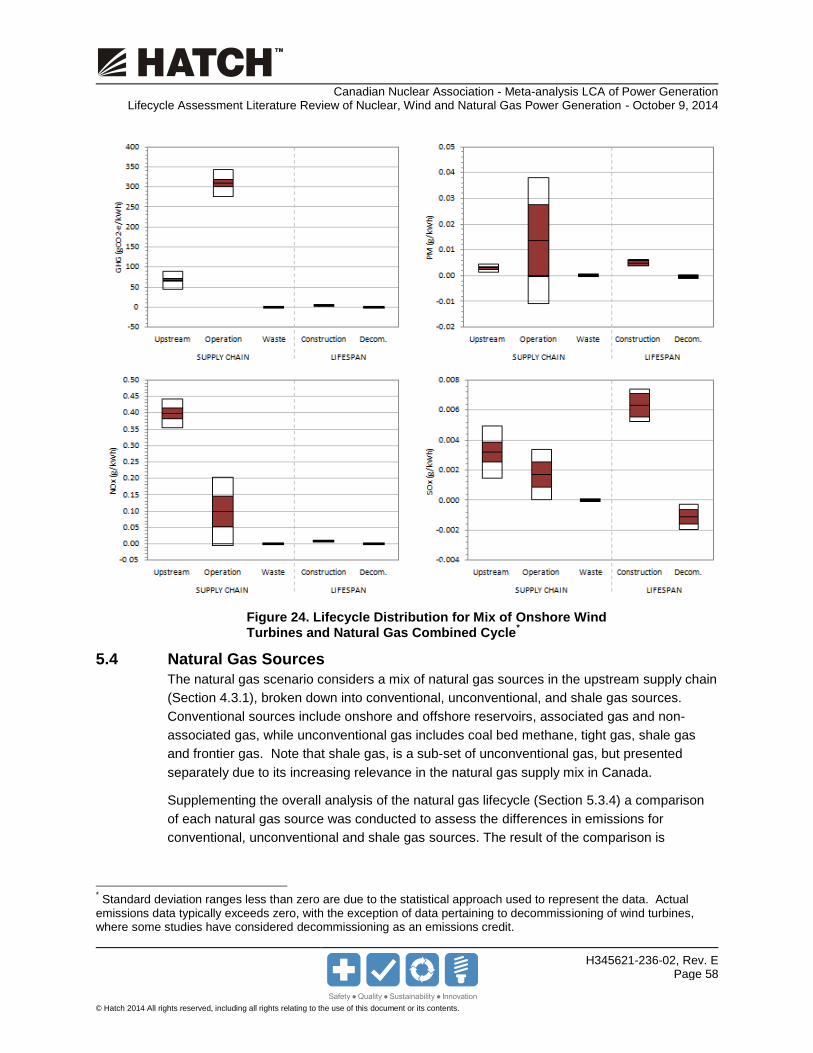
Canadian Nuclear Association - Meta-analysis LCA of Power Generation Lifecycle Assessment Literature Review of Nuclear, Wind and Natural Gas Power Generation - October 9, 2014
H345621-236-02, Rev. E Page 58
© Hatch 2014 All rights reserved, including all rights relating to the use of this document or its contents.
Figure 24. Lifecycle Distribution for Mix of Onshore Wind Turbines and Natural Gas Combined Cycle
*
5.4 Natural Gas Sources
The natural gas scenario considers a mix of natural gas sources in the upstream supply chain
(Section 4.3.1), broken down into conventional, unconventional, and shale gas sources.
Conventional sources include onshore and offshore reservoirs, associated gas and non-
associated gas, while unconventional gas includes coal bed methane, tight gas, shale gas
and frontier gas. Note that shale gas, is a sub-set of unconventional gas, but presented
separately due to its increasing relevance in the natural gas supply mix in Canada.
Supplementing the overall analysis of the natural gas lifecycle (Section 5.3.4) a comparison
of each natural gas source was conducted to assess the differences in emissions for
conventional, unconventional and shale gas sources. The result of the comparison is
* Standard deviation ranges less than zero are due to the statistical approach used to represent the data. Actual emissions data typically exceeds zero, with the exception of data pertaining to decommissioning of wind turbines, where some studies have considered decommissioning as an emissions credit.

Canadian Nuclear Association - Meta-analysis LCA of Power Generation Lifecycle Assessment Literature Review of Nuclear, Wind and Natural Gas Power Generation - October 9, 2014
H345621-236-02, Rev. E Page 59
© Hatch 2014 All rights reserved, including all rights relating to the use of this document or its contents.
presented in Figure 25, including an aggregated column (mixed) representing natural gas
supply in the analysis of the overall lifecycle.
Figure 25. Emissions from Different Natural Gas Sources
Based on Figure 25, only GHG emissions showed a statistically relevant difference when
comparing the three sources, with emissions highest for shale gas, followed by
unconventional and then conventional sources. This difference between conventional and
unconventional gas is consistent with the increased complexity of the horizontal drilling and
hydrofracking procedure to access shale gas relative to conventional gas, which requires only
vertical drilling techniques. However, the differences in the mean GHG emissions is small,
and the range of LCA data shows that an efficient shale gas source may achieve similar
results to conventional sources.
The difference between average GHG emissions from each gas source is small when
compared with the entire natural gas power generation lifecycle. Emissions from
conventional and shale gas sources are separated by 27+/-13 gCO2e/kWh. The difference is
0.0
0.1
0.2
0.3
0.4
0.5
0.6
Conv. Unconv. Shale Mix
NO
x (g
/kW
h)
0
20
40
60
80
100
120
140
Conv. Unconv. Shale Mix
GH
G (g
CO
2-e
/kW
h)
0.000
0.001
0.002
0.003
0.004
0.005
0.006
0.007
Conv. Unconv. Shale Mix
PM
(g/k
Wh
)
0.000
0.001
0.002
0.003
0.004
0.005
0.006
0.007
0.008
Conv. Unconv. Shale Mix
SOx
(g/k
Wh
)

Canadian Nuclear Association - Meta-analysis LCA of Power Generation Lifecycle Assessment Literature Review of Nuclear, Wind and Natural Gas Power Generation - October 9, 2014
H345621-236-02, Rev. E Page 60
© Hatch 2014 All rights reserved, including all rights relating to the use of this document or its contents.
even smaller when compared across the entire NGCC lifecycle, roughly 3% of total lifecycle
GHG emissions.
Aside from GHG emissions, the volume of LCA data available on other emissions was
limited, resulting in a wider confidence band when calculating the sample mean. Combined
with the similarity of data for each source, it was not possible to discern a difference in the
mean PM, NOX or SOX emissions generated by conventional, unconventional and shale gas
sources. Instead, within the accuracy of LCA literature data currently available, each source
of natural gas appears to produce similar amounts of PM, NOX or SOX emissions.
5.5 Ionizing Radiation Potential
An analysis of ionizing radiation (IR) potential was performed separately for the nuclear
power generation lifecycle. While each power generation scenario contributes to IR potential,
it was not studied in sufficient detail to be considered for the natural gas and wind power
lifecycles. The results of the analysis are presented in Figure 26 and Figure 27, respectively.
Figure 26. Lifecycle Distribution of IR for Nuclear Power Plants
-200
0
200
400
600
800
1,000
1,200
1,400
Up
stre
am
Op
era
tio
n
Was
te
Co
nst
ruct
ion
De
com
.
Sup
ply
Ch
ain
Life
span
Syst
em
SUPPLY CHAIN LIFESPAN TOTAL
IR (k
Bq
/kW
h)

Canadian Nuclear Association - Meta-analysis LCA of Power Generation Lifecycle Assessment Literature Review of Nuclear, Wind and Natural Gas Power Generation - October 9, 2014
H345621-236-02, Rev. E Page 61
© Hatch 2014 All rights reserved, including all rights relating to the use of this document or its contents.
Figure 27. Percentage Contribution of IR to Lifecycle for Nuclear Power Plants
IR emissions for the entire system ranged from 220 – 1,720 kBq/kWh, with a mean of 810 ±
150 kBq/kWh. IR emissions are dominated by the supply chain, while emissions from the
lifespan – plant construction and decommissioning are negligible. Within the supply chain,
the upstream fuel supply chain and waste management are responsible for 68.4% and 30.2%
of lifecycle emissions, respectively. Emissions from power plant operations represent 1.4% of
the total lifecycle.
The high variability of the upstream supply chain IR emissions can be explained due to the
variation in technologies and processes involved in preparing reactor fuels. Differences
affecting the results including mining techniques and ore grade, the enrichment process, and
whether any fuel reprocessing occurs.
68.4%
1.4% 30.2%
0.0012%
Upstream Operation Waste Management
46.4%53.6%
Construction Decom.
SUPPLY CHAIN LIFESPAN

Canadian Nuclear Association - Meta-analysis LCA of Power Generation Lifecycle Assessment Literature Review of Nuclear, Wind and Natural Gas Power Generation - October 9, 2014
H345621-236-02, Rev. E Page 62
© Hatch 2014 All rights reserved, including all rights relating to the use of this document or its contents.
6. Discussion
6.1 Comparison of Power Generation Lifecycles
The primary objective of this study was to provide a systematic comparison of wind, nuclear,
and a mix of wind and natural gas lifecycles based on a review of existing LCA literature.
Based on a meta-analysis approach, the literature data was organised by process stage and
screened to meet a common definition of scope and system boundaries.
The results of this process showed that GHG and NOX emissions from natural gas combined
cycle (NGCC) generation greatly exceeded the wind and nuclear lifecycles. Based on the
statistical mean, lifecycle GHG and NOX emissions are a factor of 26 and 16 times less
intensive than the NGCC lifecycle, respectively. GHG and NOX emissions are associated
primarily with the combustion of natural gas.
The variation in PM and SOX emissions by comparison were less pronounced, with the
average difference between scenarios varying by a maximum factor of approximately 3 times.
The LCA literature examined shows overlapping distributions of PM emissions across all
generation options. The lowest range of emissions corresponds to nuclear generation
followed by wind and natural gas. However, no substantive difference can be discerned
when comparing the calculated mean values of each scenario.
SOX emissions from the wind and nuclear lifecycle exceed the emissions from NGCC and
wind-NGCC generation. The construction and upstream fuel supply chain are the dominant
sources of SOX emissions from wind and nuclear, respectively, and may be related to
emissions from coal-derived electricity consumption or manufacture of intermediate products
such as steel.
The total emissions from the nuclear and wind power lifecycles were similar. Onshore wind
power, on average, is a slightly more GHG efficient option than nuclear power over its
lifecycle. The distribution of wind LCA data resides in the lower band of the range of nuclear
power technologies considered. Of the nuclear power lifecycle, technologies that do not use
diffusion-based enrichment produce similar emissions to onshore wind power. Average
emissions of PM, SOX and NOX are comparable over the lifecycle of wind and nuclear power.
No discernable difference in the statistical mean total lifecycle emissions of wind and nuclear
power were observed.
Ionising radiation (IR) potential was assessed for nuclear power only, due to a lack of LCA
data available for wind and natural gas. IR emissions are associated most with the upstream
extraction and production and downstream waste management of nuclear fuels. The level of
IR emissions from nuclear power generation can be compared to a number of common
materials listed in Table 2.
6.2 Contribution of Lifecycle Process Stages
By grouping literature LCA data by process stage, the results showed variations in where
emissions are generated across the lifecycle of each power generation scenario. The lifecycle

Canadian Nuclear Association - Meta-analysis LCA of Power Generation Lifecycle Assessment Literature Review of Nuclear, Wind and Natural Gas Power Generation - October 9, 2014
H345621-236-02, Rev. E Page 63
© Hatch 2014 All rights reserved, including all rights relating to the use of this document or its contents.
was broken down into supply chain and lifespan process stages, covering the on-going
operations and start-up and closure activities respectively.
NGCC was the only option which generated significant emissions from plant operations,
although upstream natural gas production also factored into the total lifecycle emissions.
Conversely, almost all of the environmental impacts of wind power are attributed to the
construction of the wind farm itself, and only negligible emissions are produced on an on-
going basis. The lifecycle of nuclear power, despite the infrastructure requirements, are
primarily linked to the upstream supply chain, representing on average between 78% and
81% of total GHG, NOX, SOX and PM emissions.
The source of emissions across the lifecycle has an impact on where to target strategies to
optimize and reduce emissions. Indirect emissions are less controllable from the perspective
of individual power producers, compared to emissions generated directly at the power plant,
or exclusively associated with the fuel supply chain of a particular power generation option.
The source of the emissions also indicates whether the emissions are occurring as part of
on-going electricity production, or a once-only emissions source at the start or end of the
plant‘s lifetime. Emissions associated with construction and decommissioning can be reduced
or increased by extending or shortening a plant‘s life while on-going emissions sources can
be targeted to achieve continuous improvement throughout the plant‘s lifetime.
6.3 Influence of System Boundary and Modeling Variations
The results of the literature review and meta-analysis showed a considerable variability in the
range of emissions data representing each scenario and process stage. This section
discusses how some of the differences in the scope, system boundaries and modelling
parameters of each of the studies considered contribute to the range of data observed in the
results.
Electricity Grid Mix
The lifecycle of each power generation scenario requires a source of electricity for the
upstream supply chain, plant construction, and production and transport of materials. The
electricity required by the lifecycle is typically supplied indirectly by third party operators
through regional electricity grids, which can have a significant impact on the environmental
performance of individual process stages and the lifecycle as a whole.
The regional electricity grid mix – the proportion of electricity production sources – can vary
between low-air emissions sources such as run-of-river hydro, to air emissions-intensive coal
power. Air emissions generated from the range of power sources can vary by two orders of
magnitude.
In certain cases, the variation of electricity grid mixes led to variations in the LCA literature
based on the region of each respective study. By including studies from all regions, the
distribution of data presented in the results spans the range of low to high air emissions grids,
while the statistical mean is expected to more closely reflect the results for an average grid
mix.

Canadian Nuclear Association - Meta-analysis LCA of Power Generation Lifecycle Assessment Literature Review of Nuclear, Wind and Natural Gas Power Generation - October 9, 2014
H345621-236-02, Rev. E Page 64
© Hatch 2014 All rights reserved, including all rights relating to the use of this document or its contents.
Differences in the electricity mix would affect not only the emissions per stage, but also the
total emissions accounted for a particular power generation scenario. Variations in grid
electricity mix are expected to have the greatest impact on the manufacturing and fabrication
of materials and consumables for the supply chain and power plant construction, including
the activities associated with the construction phase of the wind power scenario. The close
link between SOX emissions and coal-fired generation may lead to a greater sensitivity of SOX
emissions results for grid electricity mixes that feature high proportions of coal power.
Nuclear Technology & Process Route
While the scope of the wind and natural gas scenarios were limited to specific conditions,
onshore wind farms and NGCC plants, respectively, LCA studies on all nuclear power
generation technologies have been considered. By broadening the scope of the scenario,
the distribution of data has also widened to reflect the variation in environmental performance
across the industry. The upstream nuclear fuel supply chain appears to be most affected by
technology selection and process route, where some reactor technologies necessitate a
potentially emissions-intensive enrichment process. In particular, diffusion-based enrichment
is an energy and emissions intensive process relative to centrifuge-based enrichment. Other
factors include the extraction technique and ore grade, amongst others.
Emission Control Technologies & Management
For a given technology and process route, the management of emissions and application of
environmental control technologies can influence overall environmental performance. Some
LCA studies specifically considered control technologies within their system boundaries, or
implicitly included control technologies by the selection of particular facilities or regions as
focus areas for their respective studies.
Emissions control technologies can attenuate emissions of NOX, SOX and PM by orders of
magnitude. Control technologies include a variety of pre and post combustion techniques
including fuel selection, low-NOX burners, selected catalytic reduction, fuel desulfurization,
flue gas desulfurization, bag houses, wet scrubbers and electrostatic precipitators. Control
technologies applied at NGCC plants have contributed to lower NOX and SOX emissions
during plant operations relative to upstream natural gas supply, despite the amount of natural
gas combustion occurring during operations.
Note that carbon capture and storage (CCS) was not considered within the boundaries of this
study, limiting the influence that management and control of emissions can have on reducing
CO2 releases, the largest contributor of GHG emissions. Emissions control of other GHGs,
including fugitive CH4 releases during natural gas extraction, in particular, may have a limited
effect on lifecycle GHG emissions. Efficiency improvements at NGCC plants have the largest
influence on total GHG emissions per kWh of electricity generated from the natural gas
lifecycle.

Canadian Nuclear Association - Meta-analysis LCA of Power Generation Lifecycle Assessment Literature Review of Nuclear, Wind and Natural Gas Power Generation - October 9, 2014
H345621-236-02, Rev. E Page 65
© Hatch 2014 All rights reserved, including all rights relating to the use of this document or its contents.
Geography & Efficiency of Wind Generation
The location considered for each LCA study plays a significant role for wind power studies,
directly affecting the availability, speed, duration and daily and seasonal variability of wind
supply. These parameters greatly influence the efficiency of electricity production from wind
power, and therefore the emissions intensity, contributing to the range of data observed in the
literature reviewed.
Other Regional Factors
Regional-specific factors are underlying the difference in results observed in the LCA
literature. Wind power efficiency and the electricity grid are examples of regional-specific
factors. Other regional factors affecting the range of results include but are not limited to
local emissions limits, waste management regulations, ore/fuel quality, material availability
and proximity, local transportation networks.
Modeling Plant Operating Lifetime
Plant operating lifetime is an important modelling parameter used to relate the emissions from
construction and decommissioning, one time activities, to on-going power production.
Extending plant lifetime, either as a modelling consideration or in actuality, acts to reduce the
contribution of construction and decommissioning on an emissions per kWh electricity
generated basis.
When possible, this study normalized the operating lifetime of the literature LCA data to fixed
lifetimes specific to each power generation scenario and based on the median lifetime
considered by the LCA literature. This process helps to standardize the treatment of
operating lifetime, although some variability is still expected in the results, specifically for
studies that did not document the operating lifetime considered.
LCA Data Sources – Primary and Generic Data
Some studies estimate the emissions from the lifecycle of a specific power plant, while other
studies assess the industry at a regional, national, or global level for one or more
technologies. Depending on the study‘s goal and scope, a varying combination of primary
and generic industry data may be used to reflect an individual site or average of multiple
sites, with varying degrees of accuracy and reliability.
6.4 Influence of LCA Literature & Data Availability
The availability of data from previous LCA studies has an important impact on the ability of
the literature review to draw meaningful conclusions about the range and average
environmental emissions from each of the power generation lifecycles considered. In
general, the benefits of increasing the pool of available LCA data include:
More accurate calculation of the statistical mean emissions;
Improved resolution of process stages making up the total supply chain, lifespan and
lifecycle;

Canadian Nuclear Association - Meta-analysis LCA of Power Generation Lifecycle Assessment Literature Review of Nuclear, Wind and Natural Gas Power Generation - October 9, 2014
H345621-236-02, Rev. E Page 66
© Hatch 2014 All rights reserved, including all rights relating to the use of this document or its contents.
More complete representation of technologies, processes and study regions;
Ability to focus on particular technologies, process routes and/or geographic regions
of interest.
The coverage of GHG emissions for each power generation source allowed for sufficient data
to understand and compare the contribution of each process stage and power generation
lifecycle. However, limitations in the quantity of data treating PM, NOX, SOX and IR potential
emissions placed restrictions on the study. While the assessment of the PM, NOX and SOX
emissions datasets usually allowed for general conclusions to be drawn, in some cases the
accuracy of the statistical mean was too broad to determine any definitive difference between
power generation scenarios.
6.5 Comparison to Other LCA Literature Reviews
To validate the information presented in this report, the calculated statistical mean of each
power generation lifecycle was compared with recent literature reviews covering wind, natural
gas and nuclear power. A number of recent literature reviews were relevant to this study,
including:
A study published in 2012 by Dolan and Heath, which performed a systematic review
and harmonization to screen 240 LCAs of GHG emissions from onshore and
offshore wind power (14);
A 2012 study by Turconi, Boldrin, and Astrup, which reviewed 167 studies to
compare, among other technologies, natural gas, nuclear and wind power for GHG,
NOX and SOX emissions (34);
A 2012 study by Warner and Heath, which performed a systematic review and
harmonization to screen 274 LCAs of GHG emissions from nuclear power production
(35);
A study published in 2008 by B.K. Sovacool, screening 103 lifecycle studies of
greenhouse gas-equivalent emissions for nuclear power (36);
A study presented at the LCA XII conference in 2012 covering a systematic review
and harmonization for the lifecycle GHG emissions from conventional natural gas
power generation (37).
A comparison of the study‘s results with each literature review is presented in Table 6.

Canadian Nuclear Association - Meta-analysis LCA of Power Generation Lifecycle Assessment Literature Review of Nuclear, Wind and Natural Gas Power Generation - October 9, 2014
H345621-236-02, Rev. E Page 67
© Hatch 2014 All rights reserved, including all rights relating to the use of this document or its contents.
Table 6. Comparison of Lifecycle Emissions from Recent Literature Reviews
Ref. Study
1
Scenario (Tech.)
2
Average Current Study 4
(g/kWh) Range of Reference Study
5
(g/kWh)
GHG NOX SOX GHG NOX SOX
(14) Wind (onshore)
10.5±0.9 0.03±0.003 0.006±0.002
3-45 - -
(34) Wind (Mix)
3-41 0.02-0.11 0.02-0.09
(35) Nuclear (LWR)
18.5±1.7 0.04±0.006 0.02±0.003
3.7-110 - -
(35) Nuclear (PWR)
3.7-110
(35) Nuclear (BWR)
4.6-17
(36) Nuclear (Mix)
1.36-288.25 - -
(34) Nuclear (Mix)
3-35 0.01-0.04 0.003-0.038
(37) NG (NGCC)
478±10 0.6±0.03 0.007±0.001
360-720 - -
(34) NG (Mix)
380-1000 0.2-3.8 0.01-0.32
(1) Reference studies is the reference to the studies found in the literature that are compared to the
results of this study. (2)
Scenario represents the generation scenario evaluated in the ref. studies. If more than one generation scenario is addressed, more than one row is presented in the table. (4)
Average Meta-Analysis represents the results from this study, including the uncertainty of the mean. (5)
Total Emissions for study represents the range (min/max) values from the reference studies.
The following observations were made by comparing the statistical mean data from the
present study with the ranges provided by the literature reviews from Table 6:
Average emissions results for wind power are within the lower end of the range provided
by Turconi, Boldrin, and Astrup (34), which represents a mix of onshore and offshore
wind farms, while the current study considers only onshore installations.
Average GHG emissions results are also within the lower end of the range reported by
Dolan and Heath (14). The average reported by the Dolan and Heath study is also
higher than the current results, 15 g/kWh compared to 10.5 +/- 0.9 g/kWh, respectively.
The slightly lower average may reflect a combination of factors including the
consideration of plant operating lifetime, which has a particularly important influence for
the wind power lifecycle, which is dominated by emissions relating to wind farm
construction. The Dolan and Heath study considers studies between 1994-2010 as
opposed to between 2000 and 2013, potentially incorporating less efficient technology.
The average GHG emissions result for nuclear power generation is within the range for
LWR and PWR, but slightly higher for BWR, according to Warner and Heath (35), where
the mean values reported are 18, 22 and 11 g/kWh for LWR, PWR and BWR,
respectively. Their study used a harmonization process incorporating different

Canadian Nuclear Association - Meta-analysis LCA of Power Generation Lifecycle Assessment Literature Review of Nuclear, Wind and Natural Gas Power Generation - October 9, 2014
H345621-236-02, Rev. E Page 68
© Hatch 2014 All rights reserved, including all rights relating to the use of this document or its contents.
parameters such as capacity factor, lifetime, and thermal efficiency and including a
broader temporal coverage, including data from 1992 to 2009.
The average emissions results for nuclear power generation in the present study are
within range when compared to the Sovacool (36) and Turconi, Boldrin, and Astrup (34)
studies, which both consider a mix of nuclear power plant technologies.
The average lifecycle emissions from the NGCC power plant lifecycle are within the
ranges presented at LCA XII (37) and by Turconi, Boldrin, and Astrup (34). The results
are on the lower end of the Turconi, Boldrin, and Astrup study, and slightly below the
range expected for SOX emissions. This outcome is expected to some extent as the
present study focused exclusively on NGCC plants, a high efficiency (low-emissions
intensity) technology relative to single cycle gas plants also considered in the reference
studies.
6.6 Study Limitations
The specific approach and methodology employed during the literature review and meta-
analysis introduced some limitations to consider while interpreting the study‘s results. This
section describes aspects of the study that may affect how well the study‘s overall results
reflect the actual environmental performance of each generation scenario.
Selection of Environmental Emissions
This study is limited to assessing the GHG, NOX, SOX, PM and IR (only for nuclear)
emissions for different power generation scenarios. These emissions provide an important
but incomplete picture of overall environmental performance across the power generation
lifecycle, excluding water consumption and quality, solid waste generation, and other types of
emissions.
Furthermore, the study does not consider the impacts of each of these emissions sources on
location-specific end points including sensitive ecosystems or local communities.
Application of Plant Lifetime Normalisation
Plant lifetime is an important parameter used to represent construction and decommissioning
related activities on a per-kWh electricity basis, generated throughout the operating time of a
power plant. In order to compare literature on a common basis, the lifetime was normalized
for each power generation scenario whenever possible. Applying this approach helped to
standardize the scope and system boundaries of the aggregated results but also imposed a
new parameter as part of the meta-analysis rather than reporting literature data verbatim.
The potential for introducing bias into the study was minimized by using the median lifetime of
the literature representing each generation scenario, such that the choice of lifetime was
systematic and representative of the LCA literature. For wind and NGCC, the distribution of
lifetimes considered is narrowly defined around 20 and 30 years, respectively. However, the
range of nuclear technologies represented by the LCA literature, some which may consider
refurbishment, led to a broader distribution of operating lifetimes. As a result, the 40 year

Canadian Nuclear Association - Meta-analysis LCA of Power Generation Lifecycle Assessment Literature Review of Nuclear, Wind and Natural Gas Power Generation - October 9, 2014
H345621-236-02, Rev. E Page 69
© Hatch 2014 All rights reserved, including all rights relating to the use of this document or its contents.
median lifetime is not representative of a single reactor technology but, instead is reflective of
the broad range of nuclear technologies studied by LCA.
Regardless of normalization procedures, the effect of plant lifetime on total lifecycle results
can be significant when emissions from the start and end-of-life activities greatly exceed
emissions associated with daily plant and fuel supply operations. This effect is most
significant for wind power, where its lifecycle is dominated by emissions associated with wind
farm/turbine construction and least significant for natural gas due to combustion related
activities during operations.
Sample Bias in Regional & Technology Representation
This study does not place regional restrictions on LCA data considered as part of the
literature review. Accordingly, the results of the study do not represent any geographical
location in particular. Moreover, no attempt was made to weight the results to be
representative of any global or regional technology mix. Instead, the results are, in effect,
weighted according to the availability of data in the literature, and may be biased towards
regions, technologies or process routes of particular interest to LCA practitioners. Availability
of Canadian data, of specific interest to this study, was often limited.
Double Counting Primary Source Data
The literature review considered the distribution of LCA data based on individual LCA
publications, rather than according to original primary source data. As a result, well
referenced primary data from particularly well-studied facilities has a higher tendency to
appear in multiple studies, and consequently to be more heavily weighted in this assessment.
Similarly, the approach of a single author or research organization applied in multiple
separate studies may lead to data clusters (similar results) reflecting the application of
common LCA methods rather than physical phenomena.
The extent of the potential bias on the results due to overlapping studies was not examined
nor quantified in this study, but minimized by removing duplicate data points when it could be
shown that they were derived from the same source data and methods.

Canadian Nuclear Association - Meta-analysis LCA of Power Generation Lifecycle Assessment Literature Review of Nuclear, Wind and Natural Gas Power Generation - October 9, 2014
H345621-236-02, Rev. E Page 70
© Hatch 2014 All rights reserved, including all rights relating to the use of this document or its contents.
7. Conclusions
The purpose of this study was to conduct a systematic comparison of the environmental
emissions generated across the entire lifecycle of nuclear, wind and natural gas power
generation by compiling and evaluating lifecycle assessment (LCA) data available in the
public domain. The scope of the assessment included GHG, NOX, SOX and PM emissions,
as well as ionising radiation (IR) potential specifically for the nuclear lifecycle. The system
boundaries of each scenario encompassed all processes involved in the supply chain
required for on-going plant operations including upstream fuel supply, electricity generation,
and waste management, as well as the plant lifespan, consisting of the activities associated
with plant construction and decommissioning. The study presented the lifecycle emissions
for each power source relative to 1 kWh of electricity generated just prior to delivery to the
electricity grid.
A literature review and meta-analysis approach was developed to utilize pre-existing LCA
data published between 2000 and 2013, but focusing primarily on data published after 2008.
The evaluation considered 246 studies covering various power generation scenarios, system
boundaries and emissions types. The literature varied greatly in terms of the process stages
covered, with some studies covering only a portion of the complete lifecycle and others
providing coverage for the entire lifecycle in enough detail to resolve individual process
stages contributing to the lifecycle total. The documentation of previous LCA studies also
varied, sometimes lacking clarity of scope and system boundaries, inhibiting the ability to
interpret the results. Data gathered during the literature review was compiled, assessed, and
grouped into categories representing segments of the system boundaries defined for the
study.
The coverage of each process stage was limited in some cases, although the level of
coverage improved in line with the importance of a given process stage (in terms of the
contribution of emissions to the total). In terms of environmental indicators, the majority of
LCA studies addressed GHG emissions, but the number of studies addressing NOX, SOX,
and PM, were comparatively limited. Future LCA research involving modelling of electricity
generation systems would help to better understand the emissions of NOX, SOX, and PM
along the power generation lifecycle.
The results of the assessment show that the lifecycle of nuclear and wind power generation
produces a small fraction of the GHG and NOX emissions of the natural gas combined cycle
(NGCC) lifecycle. The GHG emissions of the NGCC lifecycle are increased when sourcing
natural gas from shale gas reservoirs, although the increase is minor relative to plant
operations. Emissions of PM were more comparable across generation sources, with the
range of emissions from nuclear and wind on the lower end of the range of emissions from
NGCC. Emissions of SOX were similarly comparable with nuclear and wind generating more
emissions on average than NGCC.

Canadian Nuclear Association - Meta-analysis LCA of Power Generation Lifecycle Assessment Literature Review of Nuclear, Wind and Natural Gas Power Generation - October 9, 2014
H345621-236-02, Rev. E Page 71
© Hatch 2014 All rights reserved, including all rights relating to the use of this document or its contents.
On average, emissions from wind and nuclear are similar within the accuracy of the study for
all emissions except GHG emissions, where wind produces distinctly less GHG emissions on
average than the combination of nuclear technologies considered.
When considering wind backed by natural gas power (20%/80% on a total electricity supply
basis) to compensate for intermittency, emissions from the modified grid mix closely
resembles that of natural gas production, diluted by a low-emissions power source.
Based on the similarity of each generation scenario as well as limitations in the availability of
LCA data, the study was unable to resolve any statistical difference in the average PM
emissions between wind, nuclear and natural gas generation, or the average PM, NOX and
SOX emissions between wind and nuclear power.
The range and variability of data published in the LCA literature highlights the importance of
literature review in incorporating multiple LCA studies in comparing power generation
scenarios, as well as meta-analysis approaches in harmonizing the scope and system
boundaries necessary in setting a common basis for comparison. Several regional, process
route and technological factors contributed to the range of published data which should be
considered in any comparison. As a result, a separate approach utilising primary source data
that is region, technology and even site specific is recommended in order to compare specific
scenarios. Aside from region and technology-specific objectives, the more general global
literature review process employed in this study may be preferred in order to provide an
overall comparison of the range and average lifecycle emissions that can result from nuclear,
wind and natural gas under a variety of potential applications.

Canadian Nuclear Association - Meta-analysis LCA of Power Generation Lifecycle Assessment Literature Review of Nuclear, Wind and Natural Gas Power Generation - October 9, 2014
H345621-236-02, Rev. E Page 72
© Hatch 2014 All rights reserved, including all rights relating to the use of this document or its contents.
8. References
1. ISO 14040:2006. Environmental management - Life cycle assessment - Principles and framework. 2. Life Cycle Greenhouse Gas Analysis of Natural Gas Extraction & Delivery in the United States. Skone, Timothy J. 2011. Presented at: Cornell University Lecture Series. 3. Life cycle assessment of 50MW wind firms and strategies for impacts reduction. A. Rashedi, I.Sridhar, K.J.Tseng. 21, January 26, 2013, RenewableandSustainableEnergyReviews, pp. 89-101. 4. Life cycle energy and greenhouse emissions analysis of wind turbines and the effect of size on energy yield. Crawford, R.H. 13, juLY 6, 2009, Renewable and Sustainable Energy Reviews, pp. 2653–2660. 5. National Energy Technology Laboratory (NETL). Life Cycle Analysis: Natural Gas Combined Cycle (NGCC) Power Plant. 2013. 6. Environment Canada. Global Warming Potentials. [Online] October 29, 2013. https://www.ec.gc.ca/ges-ghg/default.asp?lang=En&n=CAD07259-1. 7. World Health Organization. Ionizing radiation. What is Ionizing Radiation? [Online] http://www.who.int/ionizing_radiation/about/what_is_ir/en/. 8. Health Canada. Health Concerns. Ionizing Radiation. [Online] http://www.hc-sc.gc.ca/hc-ps/ed-ud/event-incident/radiolog/info/radiation-ion-eng.php. 9. Department of Minerals and Energy Republic of South Africa. Understanding Radioactivity & Radiation in Everyday Life. [Online] April 2005. www.gov.za/documents/download.php?f=107435. 10. World Nuclear Association. Nuclear Radiation and Health Effects. [Online] February 2014. http://www.world-nuclear.org/info/Safety-and-Security/Radiation-and-Health/Nuclear-Radiation-and-Health-Effects/. 11. Life Cycle Inventories for the Nuclear and Natural Gas Energy Systems, ecoinvent: Energy Supply. Roberto Dones, Thomas Heck, Mireille Faist Emmenegger and Niels Jungbluth. 10, 2005, International Journal of Life Cycle Assessment , pp. 10-23. 12. National Energy Technology Laboratory (NETL). Life Cycle Analysis: Natural Gas Combined Cycle (NGCC) Power Plant. 2012. 13. A review of life cycle assessments on wind energy systems. Davidsson, Simon, Höök, Mikael and Wall, Göran. [ed.] Christopher J. Koroneos. 17, March 13, 2012, International Journal of Life Cycle Assessment, pp. 729-742. 14. Life Cycle Greenhouse Gas Emissions of Utility-Scale Wind Power. Systematic Review and Harmonization. Dolan, Stacey L. and Heath, Garvin A. S1, March 2012, Journal of Industrial Ecology, Vol. 16, pp. S136-S154. 15. World Nuclear Association. What is Uranium? How Does it Work? World Nuclear Association. [Online] March 2014. [Cited: April 04, 2014.] http://www.world-nuclear.org/info/Nuclear-fuel-cycle/introduction/what-is-Uranium--How-Does-it-Work-/. 16. International Atomic Energy Agency. The Nuclear Fuel Cycle. International Atomic Energy Agency. [Online] August 2011. http://www.iaea.org/Publications/Booklets/NuclearFuelCycle/nfc0811.pdf. 17. Natural Resources Canada. Uranium in Canada. [Online] December 2013. https://www.nrcan.gc.ca/energy/uranium-nuclear/7693. 18. World Nuclear Association. The Nuclear Fuel Cycle. [Online] December 2012. http://www.world-nuclear.org/info/Nuclear-Fuel-Cycle/Introduction/Nuclear-Fuel-Cycle-Overview/. 19. Life cycle assessment (LCA) o felectricity generation technologies: Overview, comparability and limitations. Turconi, Roberto, Boldrin, Alessio and Astrup, Thomas. 28, 2013, Renewable and Sustainable Energy Reviews, pp. 555-565. 20. World Nuclear Association. Uranium Enrichment. [Online] October 2013. http://www.world-nuclear.org/info/Nuclear-Fuel-Cycle/Conversion-Enrichment-and-Fabrication/Uranium-Enrichment/#.UWrver-IRAs. 21. Life Cycle Inventories for the Nuclear and Natural Gas Energy Systems, and Examples of Uncertainty Analysis. Dones, Roberto, et al. 2005, The International Journal of Life Cycle Assessment, Vol. 10, pp. 10-23.

Canadian Nuclear Association - Meta-analysis LCA of Power Generation Lifecycle Assessment Literature Review of Nuclear, Wind and Natural Gas Power Generation - October 9, 2014
H345621-236-02, Rev. E Page 73
© Hatch 2014 All rights reserved, including all rights relating to the use of this document or its contents.
22. Life cycle energy and greenhouse gas emissions of nuclear energy: A review. Lenzen, Manfred. 2008, Energy Conversion and Management , pp. 2178-2199. 23. World Nuclear Association. Radioactive Waste Management. [Online] November 2013. http://www.world-nuclear.org/info/Nuclear-Fuel-Cycle/Nuclear-Wastes/Radioactive-Waste-Management/. 24. Northern Territory Government Australia, Department of Mines and Energy. What is the difference between Conventional and Unconventional Gas? [Online] September 2012. http://www.nt.gov.au/d/Minerals_Energy/?header=What%20is%20the%20difference%20between%20Conventional%20and%20Unconventional%20Gas?. 25. Milieu Law and Policy Consulting. Climate impact of potential shale gas production in the EU. 2012. 26. Branosky, Evan, Stevens, Amanda and Forbes, Sarah. Defining the Shale Gas Life Cycle: A Framework for Identifying and Mitigating Environmental Impatcs. World Resources Institute. [Online] December 2012. http://pdf.wri.org/defining_shale_gas_life_cycle.pdf. 27. ICF International. Yukon Power Plant Fuel Life Cycle Analysis Final Report. [Online] July 2013. http://www.yukonenergy.ca/media/site_documents/1260_ICF%20Marbek%20Final%20Report_LNG_lifecycle_july2013.pdf. 28. Comparative Life-Cycle Air Emissions of Coal, Domestic Natural Gas, LNG, and SNG for Electricity Generation. Paulina Jaramillo, W. Michael Griffin, and H.Scott Matthews. 2007, Environmental Science & Technology , pp. 6290-6296. 29. Jaramillo, Paulina. A Life Cycle Comparison of Coal and Natural Gas for Electricity Generation and the Production of Transportation Fuels. PhD Thesis. s.l. : Carnegie Mellon University, December 2007. 30. Spath, Pamela L. and Mann, Margaret K. Life Cycle Assessment of a Natural Gas Combined-Cycle Power Generation System. 2000. 31. Providing allglobalenergy with wind, water, and solar power, PartII: Reliability, system and transmission costs, and policies. Mark A.Delucchi, Mar kZ.Jacobson. 39, 2011, Energy Policy, pp. 1170-1190. 32. Ontario Independent Electric System Operator. Ontario Wind Integration Study. 2006. 33. Vestas. Life Cycle Assessment of Electricity Production from a V80-2.0MW Gridstreamer Wind Plant. 2011. 34. Life cycle assessment (LCA) o felectricity generation technologies: Overview, comparability and limitations. Roberto Turconi, Alessio Boldrin, Thomas Astrup. 28, 2013, Renewable and Sustainable Energy Reviews, pp. 555-565. 35. Life Cycle Greenhouse Gas Emissions of Nuclear Electricity Generation: Systematic Review and Harmonization. Warner, Ethan S. and Heath, Gavin A. S1, 2012, Journal of Industrial Ecology, Vol. 16, pp. S73-S92. 36. Valuing the greenhouse gas emissions from nuclear power: A critical survey. Sovacool, Benjamin K. 2008, Energy Policy, Vol. 36, pp. 2940-2953. 37. Life Cycle GHG Emissions from Conventional Natural Gas Power Generation: Systematic Review and Harmonization (Presentation). Heath, G., P. O’Donoughue, and M. Whitaker. 2012.

Canadian Nuclear Association - Meta-analysis LCA of Power Generation Lifecycle Assessment Literature Review of Nuclear, Wind and Natural Gas Power Generation - October 9, 2014
H345621-236-02, Rev. E Page 74
© Hatch 2014 All rights reserved, including all rights relating to the use of this document or its contents.
9. Bibliography
(S&T)2 Consultants Inc. "Shale Gas Update for GHGenius." 2011.
(S&T)2 Consultants Inc. "The addition of unconventional natural gas supply to GHGenius." Natural
Resources Canada, 2010.
Aden, Nathaniel, Augustin Marty, and Marc Muller. "Comparative Life-cycle Assessment of Non-fossil
Electricity Generation Technologies: China 2030 Scenario Analysis." Project Report, Berkeley, University
of California, 2010.
Advanced Resources International, Inc. and ICF International. "Greenhouse Gas Life-Cycle Emission
Study: Fuel Life-Cycle of U.S. Natural Gas Supplies and International LNG." 2008. http://www.adv-
res.com/pdf/ari_lca_nov_10_08.pdf (accessed 2014).
Anders, Arvesen, and Edgar G. Hertwich. "Assessing the life cycle environmental impacts of wind power:
A review of present knowledge and research needs." Renewable and Sustainable Energy Reviews , no.
16(8) (2012): 5994-6006.
Andseta, S., M. J. Thompson, J. P Jarrell, and D. R. Pendergast. "CANDU reactors and greenhouse gas
emissions." In Proceedings of 19th Annual Conference, Canadian Nuclear Society, Toronto, Ontario,
Canada.
Ansari, Saadia. "Life Cycle Environmental Impact Assessment of Nuclear Power." 2010.
Ardente, Fulvio, Marco Beccali, Maurizio Cellura, and Valerio Lo Brano. "Energy performances and life
cycle assessment of an Italian wind farm." Renewable and Sustainable Energy Reviews 12 (2008): 200-
217.
Areva Corporation. "The nuclear Power Cycle." 2004.
Argonne National Laboratory. "Life-Cycle Analysis of Shale Gas and Natural Gas." 2011.
Arvesen, Anders, and Edgar G. Hertwich. "Assessing the life cycle environmental impacts of wind power:
A review of present knowledge and research needs." Renewable and Sustainable Energy Reviews 16
(2012): 5994-6006.
Ataei, A., A. Iranmanesh, and Z. Rashidi. "Life cycle assessment of advanced zero emission combined
cycle power plants." Journal of Environmental Research, no. 6 (2012): 801-814.
Axpo Group. "Environmental Product Declaration - Beznau Nuclear Power Plant | Update 2011." 2011.
Axpo Group. "Environmental Product Declaration - Rizziconi Combined-Cycle Gas Turbie plant, Italy."
2008.

Canadian Nuclear Association - Meta-analysis LCA of Power Generation Lifecycle Assessment Literature Review of Nuclear, Wind and Natural Gas Power Generation - October 9, 2014
H345621-236-02, Rev. E Page 75
© Hatch 2014 All rights reserved, including all rights relating to the use of this document or its contents.
Badea, , Adrian Alexandru, Irina Vodă, and Cristian Florian Dincă. "Comparative analysis of coal, natural
gas and nuclear fuel life cycles by chains of electrical energy production." Scientific Bulletin -
Universitatea Politehnica din Bucuresti 72, no. 2 (2010).
Bauer, Christian, Thomas Heck, Roberto Dones, Oliver Mayer-Spohn, and Markus Blesl. Final report on
technical data, costs, and life cycle inventories of advanced fossil power generation systems. New Energy
Externalities Developments for Sustainability, 2008.
Beerten, Jef, Erik Laes, Gaston Meskens, and William D‘haeseleer. "Greenhouse gas emissions in the
nuclear life cycle: A balanced appraisal." Energy policy 37 (2009): 5056-5068.
Bergerson, Joule, and Lester Lave. "A life cycle analysis of electricity generation technologies." A report
by CarnegieMellon Electricity Industry Centre, 2002.
Bhat, I. K., and Ravi Prakash. "LCA of renewable energy for electricity generation systems—A review."
Renewable and Sustainable Energy Reviews 13 (2009): 1067-1073.
Branosky, Evan, Amanda Stevens, and Sarah Forbes. "Defining the Shale Gas Life Cycle: A Framework
for Identifying and Mitigating Environmental Impatcs." World Resources Institute. December 2012.
http://pdf.wri.org/defining_shale_gas_life_cycle.pdf (accessed April 2014).
Broderick, John, Kevin Anderson, Ruth Wood, Paul Gilbert, and Maria Sharmina. "Shale gas: an updated
assessment of environmental and climate change impacts." A report commissions by the Co-operative
and undertaken by researchers at the Tyndall Centre, University of Manchester , 2011.
Burnham, Andrew. "Life-Cycle Greenhouse Gas Emissions of Shale Gas, Natural Gas, Coal, and
Petroleum." IPIECA Workshop: The Expanding Role of Natural Gas. 2012.
Cameco Corporation. "Comparison of lifecycle greenhouse gas emissions of various electricity generation
sources." 2010.
Canadian Asasociation of Petroleum Producers. Conventional & Unconventional.
http://www.capp.ca/canadaIndustry/naturalGas/Conventional-Unconventional/Pages/default.aspx
(accessed April 2014).
"Canadian Electricity Association." Key Canadian Electricity Statistics. May 12, 2013.
http://www.electricity.ca/media/IndustryData/KeyCanadianElectricityStatistics21May2013.pdf (accessed
April 2014).
Canadian Energy Research Institute (CERI). "Comparative Life Cycle Assessment (LCA) of Base Load
Electricity Generation in Ontario." Prepared for the Canadian Nuclear Association, 2008.
Canadian Nuclear Association. Nuclear Facts – Does radiation come only from nuclear power plants?
http://www.cna.ca/nuclear_facts/radiation_power_plants/ (accessed April 2014).

Canadian Nuclear Association - Meta-analysis LCA of Power Generation Lifecycle Assessment Literature Review of Nuclear, Wind and Natural Gas Power Generation - October 9, 2014
H345621-236-02, Rev. E Page 76
© Hatch 2014 All rights reserved, including all rights relating to the use of this document or its contents.
Canadian Nuclear Association. "The Canadian Nuclear Factbook." 2013. http://www.cna.ca/wp-
content/uploads/Factbook2013EN.pdf (accessed April 2014).
Centre for Climate and Energy Solutions. "Natural Gas in the U.S. Electricity Power Sector." 2012.
Cleary, Brendan, Aidan Duffy, and Alan O'Connor. "Using life cycle assessment to compare wind energy
infrastructure." International Symposium on Life Cycle Assessment and Construction. Nantes, France.,
2012.
Crawford, R. H. "Life cycle energy and greenhouse emissions analysis of wind turbines and the effect of
size on energy yield." Renewable and Sustainable Energy Reviews, no. 13 (2009): 2653-2660.
Davidsson, Simon, Mikael Höök, and Göran Wall. "A review of life cycle assessments on wind energy
systems." Edited by Christopher J. Koroneos. International Journal of Life Cycle Assessment, no. 17
(March 2012): 729-742.
Delucchi, Mark A., and Mark Z. Jacobson. "Providing all global energy with wind, water, and solar power,
Part II: Reliability, system and transmission costs, and policies." Energy Policy 39 (2011): 1170-1190.
Demir, Nesrin, and Akif Taşkın. "Life cycle assessment of wind turbines in Pınarbaşı-Kayseri." Journal of
Cleaner Production , no. 54 (2013).
Denholm, Paul, Gerald L. Kulcinski, and Tracey Holloway. "Emissions and energy efficiency assessment
of baseload wind energy systems." Environmental science & technology 39 (2005): 1903-1911.
Department of Minerals and Energy Republic of South Africa. "Understanding Radioactivity & Radiation in
Everyday Life." April 2005. www.gov.za/documents/download.php?f=107435 (accessed May 2014).
Dinca, Cristian, Patrick Rousseaux, and Adrian Badea. "A life cycle impact of the natural gas used in the
energy sector in Romania." Journal of cleaner production, no. 15 (2007): 1451-1462.
Dolan, Stacey L., and Garvin A. Heath. "Life Cycle Greenhouse Gas Emissions of Utility-Scale Wind
Power. Systematic Review and Harmonization." Journal of Industrial Ecology 16, no. S1 (March 2012):
S136-S154.
Dones, Roberto, Christian Bauer, and Thomas Heck. "LCA of Current Coal, Gas, and Nuclear Electricity
Systems and Electricity Mix in the USA." Paul Scherrer Institute, Switzerland, 2003.
Dones, Roberto, et al. Life cycle inventories of energy systems: results for current systems in Switzerland
and other UCTE countries. Data v1 1, 2007.
Dones, Roberto, Thomas Heck, Mireille Faist Emmenegger, and Niels Jungbluth. "Life Cycle Inventories
for the Nuclear and Natural Gas Energy Systems, and Examples of Uncertainty Analysis." The
International Journal of Life Cycle Assessment 10 (2005): 10-23.

Canadian Nuclear Association - Meta-analysis LCA of Power Generation Lifecycle Assessment Literature Review of Nuclear, Wind and Natural Gas Power Generation - October 9, 2014
H345621-236-02, Rev. E Page 77
© Hatch 2014 All rights reserved, including all rights relating to the use of this document or its contents.
Donnelly, C. Richard, Anibal Carias, Michael Morgenroth, Mohammad Ali, Andrew Bridgeman, and
Nicholas Wood. "An Assessment of the Life Cycle Costs and GHG Emissions for Alternative Generation
Technologies." 21st World Energy Congress. 2009.
EDF Energy. "Environmental Product Declaration of electricity from Sizewell B nuclear power station."
2008.
Elsam Engineering A/S. "Life Cycle Assessment of offshore and onshore sited wind farms." 2004.
Enel. "Certified Environmental Produc Declaration of Electricity from Enel's Wind Plant of Sclafani Bagni
1."
Environment Canada. Global Warming Potentials. October 29, 2013. https://www.ec.gc.ca/ges-
ghg/default.asp?lang=En&n=CAD07259-1 (accessed April 2014).
EURELECTRIC. "LIfe Cycle Assessment of Electricty Generation." 2011.
Fiji, George C., et al. "Working Document of the NPC North American Resource Development Study."
Paper #4-2 Life-Cycle Emissions of Natural Gas and Coal in the Power Sector. 2011.
http://www.npc.org/Prudent_Development-Topic_Papers/4-2_Life-
Cycle_Emissions_Coal_and_Gas_in_Power_Paper.pdf (accessed 2014).
Flanagan, Bill. "An Environmental Life Cycle Perspective on Wind Power." 2012.
http://98.210.186.59/greatbaywind/wp-content/uploads/2012/05/An-Environmental-Life-Cycle-Analysis-of-
Wind-Power-GE.pdf (accessed April 2014).
Forster, D., and J. Perks. "Climate Impact of Potential Shale Gas Production in the EU." 2012.
http://go.nature.com/6KUuc4 .
Fripp, Matthias. "Greenhouse gas emissions from operating reserves used to backup large-scale wind
power." Environmental science & technology 45 (2011): 9405-9412.
Fritsche, Uwe, and Sui-San Lim. "Comparison of Greenhouse-Gas Emissions and Abatement Cost of
Nuclear and Alternative Energy Options from a Life-Cycle Perspective." Öko Institute, Darmstadt,
Deutschland, Jänner , 2005.
Fthenakis, Vasilis M., and Hyung Chul Kim. "Greenhouse-gas emissions from solar electric-and nuclear
power: a life-cycle study." Energy Policy 35 (2007): 2549-2557.
Fthenakis, Vasilis. "Nuclear Power -Greenhouse Gas Emissions & Risks." Presentation at the California
Energy Commission Nuclear Issues Workshop, Panel 4 “Environmental, Safety, and Economic
Implications of Nuclear Power”. Sacramento, CA, 2007.

Canadian Nuclear Association - Meta-analysis LCA of Power Generation Lifecycle Assessment Literature Review of Nuclear, Wind and Natural Gas Power Generation - October 9, 2014
H345621-236-02, Rev. E Page 78
© Hatch 2014 All rights reserved, including all rights relating to the use of this document or its contents.
Fulton, Mark, Nils Mellquist, and Joel Bluestein. Comparing life-cycle greenhouse gas emissions from
natural gas and coal. Deustsche Bank Group and Worldwatch institute , 2011.
Gamesa Corporacion Tecnologica. "EPD Gamesa G90 ." 2013.
Gamesa Corporación Tecnológica. "Life cycle assessment of 1 kWh generated by a wind farm Gamesa
G90-2.0MW Onshore." 2013.
Ghenai, Chaouki. "Life Cycle Analysis of Wind Turbine, Sustainable Development - Energy, Engineering
and Technologies - Manufacturing and Environment." 2012.
http://www.intechopen.com/books/sustainable-development-energy-engineering-and-technologies-
manufacturing-and-environment/life-cycle-analysis-of-wind-turbine- (accessed 2014).
Guezuraga, Begoña, Rudolf Zauner, and Werner Pölz. "Life cycle assessment of two different 2 MW
class wind turbines." Renewable Energy , no. 37 (2012): 37-44.
Hardisty, Paul E., Tom S. Clark, and Robert G. Hynes. "cycle greenhouse gas emissions from electricity
generation: A comparative analysis of Australian energy sources." Energies , no. 5 (2012): 872-897.
Health Canada. Health Concerns. http://www.hc-sc.gc.ca/hc-ps/ed-ud/event-
incident/radiolog/info/radiation-ion-eng.php (accessed April 2014).
Heath, G., P. O‘Donoughue, and M. Whitaker. "Life Cycle GHG Emissions from Conventional Natural Gas
Power Generation: Systematic Review and Harmonization (Presentation)." 2012.
Heath, Garvin. "Natural Gas and the Transformation of the U.S. Energy Sector: Electricity Life Cycle GHG
Emissions of Barnett Shale Gas in 2009." Seminar series: "Emerging Issues in Shale Gas Development.".
2013.
Heath, Garvin, Patrick O‘Donoughue, and Michael Whitaker. "Life Cycle GHG Emissions from
Conventional Natural Gas Power Generation: Systematic Review and Harmonization." InLCAXII.
Tacoma, Washington, 2012.
Hiroki, Hondo. "Life cycle GHG emission analysis of power generation systems: Japanese case." Energy
30 (2005): 2042-2056.
Howarth, Robert W., Renee Santoro, and Anthony Ingraffea. "Methane and the greenhouse-gas footprint
of natural gas from shale formations." Climatic Change 106 (2011): 679-690.
Hughes, David. "Life Cycle Greenhouse Gas Emissions from Shale Gas Compared to Coal: An Analysis
of Two Conflicting Studies." 2011. http://www.postcarbon.org/reports/PCI-Hughes-NETL-Cornell-
Comparison.pdf (accessed 2014).

Canadian Nuclear Association - Meta-analysis LCA of Power Generation Lifecycle Assessment Literature Review of Nuclear, Wind and Natural Gas Power Generation - October 9, 2014
H345621-236-02, Rev. E Page 79
© Hatch 2014 All rights reserved, including all rights relating to the use of this document or its contents.
ICF International. "Life Cycle Greenhouse Gas emissions of natural gas: A Literature Review of Key
Studies Comparing Emissions from Natural Gas and Coal." 2012.
ICF International. "Yukon Power Plant Fuel Life Cycle Analysis Final Report." July 2013.
http://www.yukonenergy.ca/media/site_documents/1260_ICF%20Marbek%20Final%20Report_LNG_lifec
ycle_july2013.pdf (accessed April 2014).
International Atomic Energy Agency. "The Nuclear Fuel Cycle." International Atomic Energy Agency.
August 2011. http://www.iaea.org/Publications/Booklets/NuclearFuelCycle/nfc0811.pdf (accessed April
2014).
ISO 14040:2006. "Environmental management - Life cycle assessment - Principles and framework."
Jaramillo, Paulina. A life cycle comparison of coal and natural gas for electricity generation and the
production of transportation fuels. Diss. Carnegie Mellon University, 2008.
Jaramillo, Paulina. "A Life Cycle Comparison of Coal and Natural Gas for Electricity Generation and the
Production of Transportation Fuels. PhD Thesis." Carnegie Mellon University, December 2007.
Jaramillo, Paulina, H. Scott Matthews, and Michael W. Griffin. "Comparative Life Cycle Carbon Emissions
of LNG Versus Coal and Gas for Electricity Generation." 2007.
Jaramillo, Paulina, W. Michael Griffin, and H. Scott Matthews. "Comparative life-cycle air emissions of
coal, domestic natural gas, LNG, and SNG for electricity generation." Environmental Science &
Technology 41 (2007): 6290-6296.
Jungbluth, Niels, Christian Bauer, Roberto Dones, and Rolf Frischknecht. "Life cycle assessment for
emerging technologies: case studies for photovoltaic and wind power (11pp)." The International Journal of
Life Cycle Assessment 10, no. 1 (2005): 24-34.
Kabir, Md Ruhul, Braden Rooke, G.D. Malinga Dassanayake, and Brian A. Fleck. "Comparative life cycle
energy, emission, and economic analysis of 100 kW nameplate wind power generation." Renewable
Energy 37 (2012): 133-141.
Kim, Heetae, Claudio Tenreiro, and Tae Kyu Ahn. "2D representation of life cycle greenhouse gas
emission and life cycle cost of energy conversion for various energy resources." Korean Journal of
Chemical Engineering , no. 30 (2013): 1882-1888.
Kim, Seungdo, and Bruce E. Dale. "Life Cycle Inventory Information of the United States Electricity
System." The International Journal of Life Cycle Assessment 10 (2005): 294-304.
Laurenzi, Ian J., and Gilbert R. Jersey. "Life cycle greenhouse gas emissions and freshwater
consumption of Marcellus shale gas." Environmental science & technology 47 (2013): 4896-4903.

Canadian Nuclear Association - Meta-analysis LCA of Power Generation Lifecycle Assessment Literature Review of Nuclear, Wind and Natural Gas Power Generation - October 9, 2014
H345621-236-02, Rev. E Page 80
© Hatch 2014 All rights reserved, including all rights relating to the use of this document or its contents.
Lecointe, Claire, David Lecarpentier, Vincent Maupu, Denis Le Boulch, and Romain Richard. Final report
on technical data, costs and life cycle inventories of nuclear power plants. New Energy Externalities
Developments for Sustainability, 2007.
Lee, Yuh-Ming, Yun-Ern Tzeng, and Chiung-Lung Su. "Life Cycle Assessment of Wind Power Utilization
in Taiwan." The 7th International Conference on Eco Balance. 2006.
Leeuwen, Jan Willem Storm van. "Nuclear power – the energy balance ." The reference reactor. 2008.
http://www.stormsmith.nl/Media/downloads/partB.pdf (accessed May 2014).
Lenzen, Manfred. "Life cycle energy and greenhouse gas emissions of nuclear energy: A review." Energy
conversion and management , no. 49 (2008): 2178-2199.
Lenzen, Manfred, and Jesper Munksgaard. "Energy and CO2 life-cycle analyses of wind turbines—review
and applications." Renewable energy 26 (2002): 339-362.
Liberman, Edward J. A life cycle assessment and economic analysis of wind turbines using Monte Carlo
simulation. Air Force Institute of Technology, Wright-Patterson Air Force Base, Ohio .School Of
Engineering Aand Management.
Life cycle approaches to assess emerging energy technologies. Final report on offshore wind technology.
New Energy Externalities Developments for Sustainability, 2008.
Logan, Jeffrey, Garvin Heath, Jordan Macknick, Elizabeth Paranhos, William Boyd, and Ken Carlson.
"Natural Gas and the Transformation of the U.S. Energy Sector: Electricity." Joint Institute for Strategic
Energy Analysis, 2012.
Mallia, E., and G. Lewis. "Life cycle greenhouse gas emissions of electricity generation in the province of
Ontario, Canada." International Journal of Life Cycle Assessment 18 (2013): 377-391.
Marriott, Joe H., Scott Matthews, and Chris T. Hendrickson. "Impact of power generation mix on life cycle
assessment and carbon footprint greenhouse gas results." Journal of Industrial Ecology 14 (2010): 919-
928.
Martinez, E., F. Sanz, S. Pellegrini, E. Jimenez, and J. Blanco. "Life cycle assessment of a multi-
megawatt wind turbine." Renewable Energy , no. 34 (2009): 667-673.
Martínez, Eduardo, Sanz Sanz, Stefano Pellegrini, Emilio Jiménez, and Julio Blanco. "Life-cycle
assessment of a 2-MW rated power wind turbine: CML method." The International Journal of Life Cycle
Assessment 14 (2009): 52-63.
McCulloch, Matt, and Jaisel Vadgama. "Life Cycle Evaluation of GHG Emissions and Land Change
Related to Selected Power Generation Options in Manitoba." 2003.

Canadian Nuclear Association - Meta-analysis LCA of Power Generation Lifecycle Assessment Literature Review of Nuclear, Wind and Natural Gas Power Generation - October 9, 2014
H345621-236-02, Rev. E Page 81
© Hatch 2014 All rights reserved, including all rights relating to the use of this document or its contents.
McCulloch, Matthew, Marlo Raynolds, and Michelle Laurie. "Life-cycle value assessment of a wind
turbine. Alberta, Canada." Pembina Institute for Appropriate Development, 2000.
Meier, Paul J. Life-cycle assessment of electricity generation systems and applications for climate change
policy analysis. University of Wisconsin--Madison, 2002.
Meier, Paul J., and Gerald L. Kulcinski. "The potential for fusion power to mitigate US greenhouse gas
emissions." Fusion technology 39 (2000): 507-512.
Milieu Law and Policy Consulting. "Climate impact of potential shale gas production in the EU." 2012.
Mohan, Jiang, Michael W. Griffin, Chris Hendrickson, Paulina Jaramillo, Jeanne VanBriesen, and Aranya
Venkatesh. "Life Cycle Greenhouse Gas Emissions of Marcellus Shale Gas (presentation)."
Environmental Research Letters 6 (2011): 034014.
National Energy Technology Laboratory (NETL). "Life Cycle Analysis: Integrated Gasification Combined
Cycle (IGCC) Power Plant." 2010.
National Energy Technology Laboratory (NETL). "Life Cycle Analysis: Natural Gas Combined Cycle
(NGCC) Power Plant." 2010.
National Energy Technology Laboratory (NETL). "Life Cycle Analysis: Natural Gas Combined Cycle
(NGCC) Power Plant." 2012.
National Energy Technology Laboratory (NETL). "Life Cycle Analysis: Natural Gas Combined Cycle
(NGCC) Power Plant." 2013.
National Energy Technology Laboratory (NETL). "Life Cycle Analysis: Power Studies Compilation
Report." 2010.
Natural Resources Canada. Uranium in Canada. December 2013.
https://www.nrcan.gc.ca/energy/uranium-nuclear/7693 (accessed May 2014).
Northern Territory Government Australia, Department of Mines and Energy. What is the difference
between Conventional and Unconventional Gas? September 2012.
http://www.nt.gov.au/d/Minerals_Energy/?header=What%20is%20the%20difference%20between%20Con
ventional%20and%20Unconventional%20Gas? (accessed April 2014).
Nugent, Daniel, and Benjamin K. Sovacool. "Assessing the lifecycle greenhouse gas emissions from solar
PV and wind energy: A critical meta-survey." Energy Policy , no. 65 (2013): 229-244.
Oebels, Kerstin B., and Sergio Pacca. "Life cycle assessment of an onshore wind farm located at the
northeastern coast of Brazil." Renewable Energy , no. 53 (2013): 60-70.
Canadian Nuclear Association - Meta-analysis LCA of Power Generation Lifecycle Assessment Literature Review of Nuclear, Wind and Natural Gas Power Generation - October 9, 2014
H345621-236-02, Rev. E Page 82
© Hatch 2014 All rights reserved, including all rights relating to the use of this document or its contents.
Ontario Independent Electric System Operator. "Ontario Wind Integration Study." 2006.
Ontario Power Authority. Natural Gas – Simple/Combined Cycle Contracts. September 2013.
http://www.powerauthority.on.ca/current-electricity-contracts/sc-cc (accessed April 2014).
Österreichisches Ökologie-Institut and Austrian Energy Agency. "Energy Balance of Nuclear Power
Generation - Life Cycle Analysis of Nuclear Power: Energy Balance and CO2 Emissions." 2011.
http://www.ecology.at/files/berichte/E22.595.pdf.
Ou, Xunmin, Yan Xiaoyu, and Xiliang Zhang. "Life-cycle energy consumption and greenhouse gas
emissions for electricity generation and supply in China." Applied Energy 88 (2011): 289-297.
Pacca, Sergio Almeida. "Global warming effect applied to electricity generation technologies." Diss.
University of California, Berkeley, 2003.
Pacca, Sergio, and Arpad Horvath. "Greenhouse gas emissions from building and operating electric
power plants in the Upper Colorado River Basin." Environmental Science & Technology 36 (2002): 3194-
3200.
Padey, Pierryves, Isabelle Blanc, Denis Le Boulch, and Xiusheng Zhao. "A simplified life cycle approach
for assessing greenhouse gas emissions of wind electricity." Journal of Industrial Ecology 16 (2012): S28-
S38.
PE NWE. "Life Cycle Assessment of Electricity Production from a V112 Turbine Wind Plant." Vestas Wind
Systems A/S, 2011.
Pehnt, Martin. "Dynamic life cycle assessment (LCA) of renewable energy technologies." Renewable
energy 31 (2006): 55-71.
Pembina Institute. "Appendix 7.3: Life Cycle Greenhouse Gas Assessment Overview." Manitoba Hydro,
2013.
Pembina Institute. "Life Cycle Evaluation of GHG Emissions and Land Change Related to Selected
Power Generation Options in Manitoba." June 16, 2003.
http://www.cecmanitoba.ca/resource/hearings/39/KHLP-
083%20Life%20Cycle%20Evaluation%20of%20GHG%20and%20Land%20Change%202003%20Pembin
a%20Institute.pdf (accessed April 2014).
Phumpradab, Kamalaporn, Amongpong Thongbhakdi, and Shabbir H. Gheewala. "Environmental
Assessment of Electricity Production from Natural Gas Fired Power Plants." The 2nd Joint International
Conference on “Sustainable Energy and Environment (SEE 2006). Bangkok, Thailand, 2006.

Canadian Nuclear Association - Meta-analysis LCA of Power Generation Lifecycle Assessment Literature Review of Nuclear, Wind and Natural Gas Power Generation - October 9, 2014
H345621-236-02, Rev. E Page 83
© Hatch 2014 All rights reserved, including all rights relating to the use of this document or its contents.
Phumpradab, Kamalaporn, Shabbir H. Gheewala, and Masayuki Sagisaka. "Life cycle assessment of
natural gas power plants in Thailand." The International Journal of Life Cycle Assessment , no. 14 (2009):
354-363.
Properzi, Scott, and Helle Herk-Hansen. "Life cycle assessment of a 150 MW offshore wind turbine farm
at Nysted/Roedsand, Denmark." Journal of Environment and Sustainable Development 1 (2002): 113-
121.
Raadal, Hanne Lerche, Luc Gagnon, Ingunn Saur Modahl, and Ole Jørgen Hansen. "Life cycle
greenhouse gas (GHG) emissions from the generation of wind and hydro power." Renewable and
Sustainable Energy Reviews 15 (2011): 3417-3422.
Rashad, S. M., and F. H. Hammad. "Nuclear power and the environment: comparative assessment of
environmental and health impacts of electricity-generating systems." Applied Energy 65 (2000): 211-229.
Rashedi, A., I. Sridhar, and K. J. Tseng. "Life cycle assessment of 50MW wind firms and strategies for
impact reduction." Renewable and Sustainable Energy Reviews, no. 21 (2013): 89-101.
Riva, Angelo, Simona D‘Angelosante, and Carla Trebeschi. "Natural gas and the environmental results of
life cycle assessment." Energy 31 (2006): 138-148.
Rule, Bridget M., Zeb J. Worth, and Carol A. Boyle. "Comparison of life cycle carbon dioxide emissions
and embodied energy in four renewable electricity generation technologies in New Zealand."
Environmental science & technology 43 (2009): 6406-6413.
Schori, Salome, and Rolf Frischknecht. "Life Cycle Inventory of Natural Gas Supply." ESU-Services fair
consulting in sustainability, 2012.
Scient ific Certification Systems (SCS). "An Environmental Assessment of Selected Canadian Electric
Power Generation Systems Using a Site-Dependent Life-Cycle Impact Assessment Approach." 2005.
Scientific Certification Systems, Inc. "Renewable Electrical Generation Technologies Compared to WECC
Baseline — Final LCIA Report." Emeryville, CA, 2009.
SENES Consultants Limited Ottawa, Ontario. "Environmental impacts of different uranium mining
processes." 2008. http://environment.gov.ab.ca/info/library/8178.pdf (accessed 2014).
Sevenster, Maartje, and Harry Croezen. "The natural gas chain - Toward a global life cycle assessment."
2006.
Skone, Timothy J. "Life Cycle Greenhouse Gas Analysis of Natural Gas Extraction & Delivery in the
United States." Presented at: Cornell University Lecture Series. 2011.

Canadian Nuclear Association - Meta-analysis LCA of Power Generation Lifecycle Assessment Literature Review of Nuclear, Wind and Natural Gas Power Generation - October 9, 2014
H345621-236-02, Rev. E Page 84
© Hatch 2014 All rights reserved, including all rights relating to the use of this document or its contents.
Skone, Timothy J. "Life Cycle Greenhouse Gas Inventory of Natural Gas Extraction, Delivery and
Electricity Production." National Energy Technology Laboratory (NETL), 2011.
Skone, Timothy J. "Power Generation Technology Comparison from a Life Cycle Perspective." National
Energy Technology Laboratory (NETL), 2013.
Skone, Timothy J. "Role of Alternative Energy Sources: Natural Gas Technology Assessment." National
Energy Technology Laboratory (NETL), 2012.
Skone, Timothy J. "Role of Alternative Energy Sources: Nuclear Technology Assessment." National
Energy Technology Laboratory (NETL), 2012.
Skone, Timothy J. "Role of Alternative Energy Sources: Wind Technology Assessment." National Energy
Technology Laboratory (NETL), 2012.
Skone, Timothy J., Joe Marriott, and James Littlefield. "Life Cycle Assessment of Natural Gas Extraction,
Delivery and Electricity Production." 2012.
Songlin, Tang, Zhang Xiliang, and Wang Licheng. "Life cycle analysis of wind power: A case of Fuzhou."
Energy Procedia, no. 5 (2011): 1847–1851.
Sovacool, Benjamin K. "Valuing the greenhouse gas emissions from nuclear power: A critical survey."
Energy Policy 36 (2008): 2940-2953.
Spath, Pamela L., and Margaret K. Mann. "Life Cycle Assessment of a Natural Gas Combined-Cycle
Power Generation System." 2000.
Stacey, Dolan. Life cycle assessment and emergy synthesis of a theoretical offshore wind farm for
Jacksonville, Florida. Diss. University of Florida, 2007.
Stamford, Laurence, and Adisa Azapagic. "Life cycle sustainability assessment of electricity options for
the UK." International Journal of Energy Research 36 (2012): 1263-1290.
Stephenson, Trevor, Jose Eduardo Valle, and Xavier Riera-Palou. "Modeling the relative GHG emissions
of conventional and shale gas production." Environmental science & technology 45 (2011): 10757–10764.
Storm van Leeuwen, Jan Willem. "Nuclear power insights." 2007.
http://www.stormsmith.nl/Media/downloads/partB.pdf (accessed 2014).
The nternational Energy Agency. Environmental and Health. Impacts of Electricity Generation - A
Comparison of the Environmental Impacts of Hydropower. 2002. http://www.ieahydro.org/reports/ST3-
020613b.pdf (accessed 2014).

Canadian Nuclear Association - Meta-analysis LCA of Power Generation Lifecycle Assessment Literature Review of Nuclear, Wind and Natural Gas Power Generation - October 9, 2014
H345621-236-02, Rev. E Page 85
© Hatch 2014 All rights reserved, including all rights relating to the use of this document or its contents.
The University of Sydney. "Life-Cycle Energy Balance and Greenhouse Gas Emissions and Greenhouse
Gas Emissions." 2006.
Tremeac, Brice, and Francis Meunier. "Life cycle analysis of 4.5 MW and 250W wind turbines."
Renewable and sustainable energy reviews 13 (2009): 2104-2110.
Turconi, Roberto, Alessio Boldrin, and Thomas Astrup. "Life cycle assessment (LCA) o felectricity
generation technologies: Overview, comparability and limitations." Renewable and Sustainable Energy
Reviews, no. 28 (2013): 555-565.
United States Environmental Protection Agency . Nitrogen Dioxide.
http://www.epa.gov/airquality/nitrogenoxides/index.html (accessed April 2014).
United States Environmental Protection Agency. Particular Matter.
http://www.epa.gov/airquality/particulatematter/ (accessed April 2014).
United States Environmental Protection Agency. Particular Matter Basic Information.
http://www.epa.gov/airquality/particulatematter/basic.html (accessed April 2014).
United States Environmental Protection Agency. Sources of Greenhouse Gas Emissions.
http://www.epa.gov/climatechange/ghgemissions/sources.html (accessed April 2014).
United States Environmental Protection Agency. Sulfur Dioxide. http://www.epa.gov/air/sulfurdioxide/
(accessed April 2014).
Van Zandt, Devin, Lavelle Freeman, Gao Zhi, Richard Piwko, Gary Jordan, and Nicholas Miller. "Ontario
Wind Integration Study." Tech. Rep , Energy for Ontario Power Authority, 2006.
Vattenfall AB. "Certified Environmental Product Declaration EPD® of Electricity from Vattenfall‘s Nordic
Wind Farms." 2013.
Vattenfall AB Generation Nordic. "Vattenfall AB Generation Nordic Certified Environmental Product
Declaration EPD of Electricity from Forsmark Nuclear Power Plant." 2007.
Vattenfall AB. "Life Cycle Assessment Vattenfall's electricity generation in the Nordic countries." 2012.
Vattenfall AB. "Nuclear Power Certified Environmental Product Declaration EPD® of Electricity from
Forsmark Nuclear Power Plant." 2010.
Vattenfall AB. "Nuclear Power Certified Environmental Product Declaration EPD® of Electricity from
Ringhals Nuclear Power Plant." 2010.
Vattenfall AB. "Vattenfall Wind Power Certified Environmental Product declaration EPD® of Electricity
from Vattenfall´s wind farms." 2010.

Canadian Nuclear Association - Meta-analysis LCA of Power Generation Lifecycle Assessment Literature Review of Nuclear, Wind and Natural Gas Power Generation - October 9, 2014
H345621-236-02, Rev. E Page 86
© Hatch 2014 All rights reserved, including all rights relating to the use of this document or its contents.
Vattenfall Business Service Nordic AB. "Life-Cycle Assessment Vattenfall's Electricity in Sweden." 2005.
Vestas Wind Systems A/S. "Life cycle assessment of electricity produced from onshore sited wind power
plants based on Vestas V82-1.65 MW turbines." Denmark, 2006.
Vestas Wind Systems A/S. "Life Cycle Assessment of Electricity Production from a V80-2.0MW
Gridstreamer Wind Plant." 2011.
Vestas Wind Systems A/S. "Life cycle assessment of offshore and onshore sited wind power plants
based on Vestas V90-3.0 MW turbines." 2005.
http://www.vestas.com/Files/Filer/EN/Sustainability/LCA/LCAV90_juni_2006.pdf (accessed 2014).
Voorspools, Kris R., Els A. Brouwers, and William D. D'haeseleer. "Energy content and indirect
greenhouse gas emissions embedded in ‗emission-free‘power plants: results for the low countries."
Applied Energy 67 (2000): 307-330.
Warner, Ethan S., and Gavin A. Heath. "Life Cycle Greenhouse Gas Emissions of Nuclear Electricity
Generation: Systematic Review and Harmonization." Journal of Industrial Ecology 16, no. S1 (2012): S73-
S92.
Weber, Christopher, and Christopher Clavin. "Life cycle carbon footprint of shale gas: Review of evidence
and implications." science & technology, no. 46 (2012): 5688-5695.
Weisser, Daniel. "A guide to life-cycle greenhouse gas (GHG) emissions from electric supply
technologies." Energy 32 (2007): 1543-1559.
Wiedmann, Thomas O., et al. "Application of hybrid life cycle approaches to emerging energy
technologies–the case of wind power in the UK." Environmental science & technology 45 (2011): 5900-
5907.
World Energy Council. "Comparison of Energy Systems Using Life Cycle Assessment." 2004.
http://www.worldenergy.org/documents/lca2.pdf (accessed 2014).
World Health Organization. Ionizing radiation. http://www.who.int/ionizing_radiation/about/what_is_ir/en/
(accessed April 2014).
World Nuclear Association. March 2014. http://www.world-nuclear.org/info/Energy-and-
Environment/Energy-Balances-and-CO2-Implications/ (accessed April 2014).
World Nuclear Association. Radiation and Life. December 2012. http://www.world-nuclear.org/info/Safety-
and-Security/Radiation-and-Health/Radiation-and-Life/ (accessed May 2014).

Canadian Nuclear Association - Meta-analysis LCA of Power Generation Lifecycle Assessment Literature Review of Nuclear, Wind and Natural Gas Power Generation - October 9, 2014
H345621-236-02, Rev. E Page 87
© Hatch 2014 All rights reserved, including all rights relating to the use of this document or its contents.
World Nuclear Association. Radioactive Waste Management. November 2013. http://www.world-
nuclear.org/info/Nuclear-Fuel-Cycle/Nuclear-Wastes/Radioactive-Waste-Management/ (accessed April
2014).
World Nuclear Association. The Nuclear Fuel Cycle. December 2012. http://www.world-
nuclear.org/info/Nuclear-Fuel-Cycle/Introduction/Nuclear-Fuel-Cycle-Overview/ (accessed April 2014).
World Nuclear Association. "Uranium Enrichment." October 2013. http://www.world-
nuclear.org/info/Nuclear-Fuel-Cycle/Conversion-Enrichment-and-Fabrication/Uranium-
Enrichment/#.UWrver-IRAs (accessed April 2014).
World Nuclear Association. What is Uranium? How Does it Work? March 2014. http://www.world-
nuclear.org/info/Nuclear-fuel-cycle/introduction/what-is-Uranium--How-Does-it-Work-/ (accessed April 04,
2014).
Zhang, Yimin, et al. "Life cycle emissions and cost of producing electricity from coal, natural gas, and
wood pellets in Ontario, Canada." Environmental science & technology , no. 44 (2010): 538-544

Canadian Nuclear Association - Meta-analysis LCA of Power Generation Lifecycle Assessment Literature Review of Nuclear, Wind and Natural Gas Power Generation - October 9, 2014
H345621-236-02, Rev. E Page 88
© Hatch 2014 All rights reserved, including all rights relating to the use of this document or its contents.
Appendix A - Summary of Statistical Results

Canadian Nuclear Association - Meta-analysis LCA of Power Generation Lifecycle Assessment Literature Review of Nuclear, Wind and Natural Gas Power Generation - October 9, 2014
H345621-236-02, Rev. E Page 89
© Hatch 2014 All rights reserved, including all rights relating to the use of this document or its contents.
Table 7. Summary Of Statistics of Qualified Studies for Onshore Wind Turbines
Onshore Wind Turbines Statistics
GHG PM
SUPPLY CHAIN LIFESPAN TOTAL SUPPLY CHAIN LIFESPAN TOTAL
Ups. Ops. Waste Const. Decom. SC LS System Ups. Ops. Waste Const. Decom. SC LS System
Mean 2.9E-02 4.9E-01 9.7E-02 1.2E+01 -1.5E+00 7.1E-01 1.0E+01 1.1E+01 2.4E-05 3.0E-03 5.5E-04 2.0E-02 -1.9E-03 2.4E-03 1.9E-02 1.5E-02
Uncertainty 1.4E-02 1.7E-01 4.9E-02 1.6E+00 7.0E-01 2.1E-01 1.3E+00 9.0E-01 1.2E-05 3.9E-04 2.7E-04 1.8E-03 1.5E-03 1.5E-03 2.6E-03 3.3E-03
Standard Deviation - 5.8E-01 - 6.4E+00 2.3E+00 7.7E-01 5.7E+00 4.9E+00 - 3.9E-04 - 3.1E-03 2.7E-03 2.1E-03 5.9E-03 8.5E-03
Contribution to Total 0% 3% 1% 86% 10% 4% 96% 100% 0% 12% 2% 78% 8% 14% 86% 100%
Onshore Wind Turbines Statistics
NOx SOx
SUPPLY CHAIN LIFESPAN TOTAL SUPPLY CHAIN LIFESPAN TOTAL
Ups. Ops. Waste Const. Decom. SC LS System Ups. Ops. Waste Const. Decom. SC LS System
Mean 9.5E-05 2.6E-04 2.4E-04 3.7E-02 -3.3E-03 3.2E-03 3.4E-02 2.8E-02 1.6E-04 3.9E-04 7.2E-05 2.7E-02 -5.6E-03 8.6E-04 2.2E-02 2.5E-02
Uncertainty 4.7E-05 5.9E-05 1.2E-04 6.8E-03 1.6E-04 1.9E-03 5.1E-03 3.3E-03 8.2E-05 7.5E-05 3.6E-05 3.1E-03 2.4E-03 4.3E-04 1.5E-03 3.1E-03
Standard Deviation - 8.4E-05 - 9.6E-03 2.3E-04 3.8E-03 1.1E-02 1.1E-02 - 1.1E-04 0.0E+00 5.5E-03 4.2E-03 7.5E-04 3.7E-03 1.1E-02
Contribution to Total 0% 1% 1% 90% 8% 1% 99% 100% 0% 1% 0% 81% 17% 2% 98% 100%
Table 8. Summary of Statistics of Qualified Studies for Nuclear Power Plants
Nuclear Power Plant Statistics
GHG PM
SUPPLY CHAIN LIFESPAN TOTAL SUPPLY CHAIN LIFESPAN TOTAL
Ups. Ops. Waste Const. Decom. SC LS System Ups. Ops. Waste Const. Decom. SC LS System
Mean 1.2E+01 2.2E+00 1.6E+00 2.9E+00 1.2E+00 1.4E+01 3.4E+00 1.9E+01 3.2E-03 1.1E-04 2.4E-04 8.3E-04 7.2E-06 3.6E-03 7.5E-04 8.2E-03
Uncertainty 1.6E+00 6.0E-01 5.0E-01 3.9E-01 5.5E-01 2.0E+00 6.2E-01 1.7E+00 8.2E-04 7.4E-05 1.1E-04 3.5E-04 2.2E-06 8.5E-04 1.9E-04 3.5E-03
Standard Deviation 1.1E+01 3.0E+00 2.6E+00 2.0E+00 2.5E+00 1.3E+01 3.7E+00 1.3E+01 2.7E-03 2.0E-04 1.6E-04 6.1E-04 3.8E-06 2.7E-03 4.7E-04 1.3E-02
Contribution to Total 60% 11% 8% 15% 6% 80% 20% 100% 73% 3% 5% 19% 0% 81% 19% 100%
Nuclear Power Plant Statistics
NOx SOx
SUPPLY CHAIN LIFESPAN TOTAL SUPPLY CHAIN LIFESPAN TOTAL
Ups. Ops. Waste Const. Decom. SC LS System Ups. Ops. Waste Const. Decom. SC LS System
Mean 3.4E-02 7.7E-04 2.7E-03 8.9E-03 9.0E-04 3.7E-02 7.4E-03 3.9E-02 1.7E-02 1.5E-03 1.4E-03 3.3E-03 2.3E-03 2.0E-02 4.4E-03 2.3E-02
Uncertainty 6.3E-03 2.2E-04 4.7E-04 5.2E-03 3.4E-04 6.4E-03 3.6E-03 6.5E-03 3.5E-03 1.4E-03 4.3E-04 7.9E-04 5.3E-04 3.0E-03 1.1E-03 3.1E-03
Standard Deviation 2.4E-02 5.8E-04 8.2E-04 1.3E-02 8.4E-04 2.3E-02 1.1E-02 2.6E-02 9.9E-03 3.2E-03 7.5E-04 1.9E-03 1.3E-03 8.4E-03 3.2E-03 1.0E-02
Contribution to Total 72% 2% 6% 19% 2% 79% 21% 100% 67% 6% 5% 13% 9% 78% 22% 100%

Canadian Nuclear Association - Meta-analysis LCA of Power Generation Lifecycle Assessment Literature Review of Nuclear, Wind and Natural Gas Power Generation - October 9, 2014
H345621-236-02, Rev. E Page 90
© Hatch 2014 All rights reserved, including all rights relating to the use of this document or its contents.
Table 9. Summary of Statistics of Qualified Studies for Natural Gas Combined Cycle Power Plants
NGCC Power Plant Statistics
GHG PM
SUPPLY CHAIN LIFESPAN TOTAL SUPPLY CHAIN LIFESPAN TOTAL
Ups. Ops. Waste Const. Decom. SC LS System Ups. Ops. Waste Const. Decom. SC LS System
Mean 8.4E+01 3.9E+02 - 7.6E-01 1.7E-02 4.8E+02 1.2E+00 4.8E+02 3.7E-03 1.6E-02 - 1.1E-03 1.5E-05 2.0E-02 1.3E-03 2.1E-02
Uncertainty 4.0E+00 1.1E+01 - 3.6E-01 1.8E-03 1.0E+01 3.4E-01 1.0E+01 7.2E-04 1.8E-02 - 1.1E-03 1.8E-05 1.2E-02 6.6E-04 1.2E-02
Standard Deviation 2.9E+01 4.2E+01 - 7.1E-01 3.2E-03 4.7E+01 9.0E-01 4.7E+01 1.9E-03 3.1E-02 - 1.1E-03 1.8E-05 2.3E-02 1.1E-03 2.3E-02
Contribution to Total 18% 82% 0% 0% 0% 100% 0% 100% 18% 77% 0% 5% 0% 95% 5% 100%
NGCC Power Plant Statistics
NOx SOx
SUPPLY CHAIN LIFESPAN TOTAL SUPPLY CHAIN LIFESPAN TOTAL
Ups. Ops. Waste Const. Decom. SC LS System Ups. Ops. Waste Const. Decom. SC LS System
Mean 5.0E-01 1.2E-01 - 6.7E-04 2.1E-04 6.2E-01 2.1E-03 6.2E-01 4.0E-03 2.1E-03 - 1.2E-03 1.5E-05 6.0E-03 1.4E-03 7.1E-03
Uncertainty 2.1E-02 5.8E-02 - 3.4E-04 1.1E-04 2.7E-02 1.2E-03 2.7E-02 8.3E-04 1.1E-03 - 6.0E-04 7.5E-06 8.5E-04 2.2E-04 9.2E-04
Standard Deviation 5.5E-02 1.3E-01 - - - 6.9E-02 2.1E-03 6.9E-02 2.2E-03 2.1E-03 - - - 2.1E-03 3.8E-04 2.1E-03
Contribution to Total 80% 20% 0% 0% 0% 100% 0% 100% 55% 28% 0% 17% 0% 83% 17% 100%
Table 10. Summary of Statistics of Qualified Studies for Mix of Onshore Wind Turbines and Natural Gas Combined Cycle Power Plants
Mix Wind-NGCC Statistics
GHG PM
SUPPLY CHAIN LIFESPAN TOTAL SUPPLY CHAIN LIFESPAN TOTAL
Ups. Ops. Waste Const. Decom. SC LS System Ups. Ops. Waste Const. Decom. SC LS System
Mean 6.7E+01 3.1E+02 1.9E-02 3.1E+00 -2.8E-01 3.8E+02 3.0E+00 3.8E+02 2.9E-03 1.4E-02 1.1E-04 4.9E-03 -3.8E-04 1.6E-02 4.8E-03 2.0E-02
Uncertainty 3.2E+00 8.9E+00 9.7E-03 4.3E-01 1.4E-01 8.2E+00 3.8E-01 8.2E+00 5.8E-04 1.4E-02 5.5E-05 9.5E-04 3.1E-04 9.5E-03 7.5E-04 9.5E-03
Standard Deviation 2.3E+01 3.3E+01 - 1.4E+00 4.6E-01 3.7E+01 1.3E+00 3.7E+01 1.5E-03 2.4E-02 - 1.1E-03 5.3E-04 1.8E-02 1.5E-03 1.8E-02
Contribution to Total 18% 81% 0% 1% 0% 99% 1% 100% 13% 62% 1% 22% 2% 76% 24% 100%
Mix Wind-NGCC Statistics
NOx SOx
SUPPLY CHAIN LIFESPAN TOTAL SUPPLY CHAIN LIFESPAN TOTAL
Ups. Ops. Waste Const. Decom. SC LS System Ups. Ops. Waste Const. Decom. SC LS System
Mean 4.0E-01 9.9E-02 4.8E-05 8.0E-03 -5.0E-04 5.0E-01 8.5E-03 5.0E-01 3.2E-03 1.7E-03 1.4E-05 6.3E-03 -1.1E-03 5.0E-03 5.5E-03 1.1E-02
Uncertainty 1.7E-02 4.6E-02 2.4E-05 1.4E-03 9.1E-05 2.1E-02 1.4E-03 2.1E-02 6.6E-04 8.4E-04 7.2E-06 7.9E-04 4.8E-04 6.9E-04 3.5E-04 9.6E-04
Standard Deviation 4.4E-02 1.0E-01 - 1.9E-03 4.6E-05 5.5E-02 2.8E-03 5.5E-02 1.7E-03 1.7E-03 - 1.1E-03 8.4E-04 1.7E-03 8.0E-04 2.7E-03
Contribution to Total 79% 20% 0% 2% 0% 98% 2% 100% 26% 14% 0% 51% 9% 40% 60% 100%

Canadian Nuclear Association - Meta-analysis LCA of Power Generation Lifecycle Assessment Literature Review of Nuclear, Wind and Natural Gas Power Generation - October 9, 2014
H345621-236-02, Rev. E Page 91
© Hatch 2014 All rights reserved, including all rights relating to the use of this document or its contents.
Table 11. Summary of IR Statistics of Qualified Studies for Nuclear Power Plants
Nuclear Power Plants Statistics
IR
SUPPLY CHAIN LIFESPAN TOTAL
Ups. Ops. Waste Const. Decom. SC LS System
Mean 4.9E+02 9.8E+00 2.2E+02 8.5E-03 9.8E-03 6.4E+02 1.4E-02 8.1E+02
Uncertainty 1.6E+02 7.9E+00 2.0E+01 8.4E-04 1.7E-03 1.8E+02 2.7E-03 1.5E+02
Standard Deviation 5.1E+02 1.9E+01 2.9E+01 1.2E-03 2.4E-03 5.2E+02 5.5E-03 4.7E+02
Contribution to Total 68% 1% 30% 0% 0% 100% 0% 100%
Table 12. Summary of Statistics of Qualified Studies for Natural Gas Sources
GHG PM NOx SOx
Conv. Unconv. Shale Mix Conv. Unconv. Shale Mix Conv. Unconv. Shale Mix Conv. Unconv. Shale Mix
Mean 7.6E+01 8.9E+01 1.0E+02 8.4E+01 3.3E-03 3.9E-03 3.6E-03 3.7E-03 5.1E-01 4.8E-01 4.4E-01 5.0E-01 4.1E-03 3.9E-03 2.8E-03 4.0E-03
Uncertainty 6.6E+00 4.9E+00 5.3E+00 4.0E+00 1.5E-03 9.8E-04 4.3E-04 7.2E-04 2.5E-02 3.2E-02 5.9E-02 2.1E-02 2.0E-03 1.1E-03 1.3E-03 8.3E-04
Standard Deviation 2.9E+01 2.8E+01 2.1E+01 2.9E+01 2.2E-03 2.0E-03 6.1E-04 1.9E-03 3.5E-02 6.5E-02 8.4E-02 5.5E-02 2.8E-03 2.1E-03 1.8E-03 2.2E-03
Contribution to Total 7.6E+01 8.9E+01 1.0E+02 8.4E+01 3.3E-03 3.9E-03 3.6E-03 3.7E-03 5.1E-01 4.8E-01 4.4E-01 5.0E-01 4.1E-03 3.9E-03 2.8E-03 4.0E-03

Canadian Nuclear Association - Meta-analysis LCA of Power Generation Lifecycle Assessment Literature Review of Nuclear, Wind and Natural Gas Power Generation - October 9, 2014
H345621-236-02, Rev. E
© Hatch 2014 All rights reserved, including all rights relating to the use of this document or its contents.

Sheridan Science and Technology Park, 2800 Speakman Drive Mississauga, Ontario, Canada L5K 2R7
Tel +1 (905) 855 7600 Fax +1 (905) 855 8270


