
Hatching status before embryo transfer is not correlatd with implantation rate in chromosomally...
13
Human Reproduction, pp. 1–13, 2016 doi:10.1093/humrep/dew205 ORIGINAL ARTICLE Infertility Hatching status before embryo transfer is not correlated with implantation rate in chromosomally screened blastocysts Jorge Rodriguez-Purata 1, * , Julian Gingold 1 , Joseph Lee 1 , Michael Whitehouse 1 , Richard Slifkin 1 , Christine Briton-Jones 1 , Alan Copperman 1,2 , and Benjamin Sandler 1,2 1 Reproductive Medicine Associates of New York, 635 Madison Ave 10th Floor, New York, NY 10022, USA 2 Obstetrics, Gynecology and Reproductive Science, Icahn School of Medicine at Mount Sinai, Klingenstein Pavilion, 1176 Fifth Avenue, 9th Floor, New York, NY 10029, USA *Correspondence address. Tel: +(212) 756-5777, ext. 330; Fax: (212) 756-5770; E-mail: [email protected] Submitted on April 13, 2016; resubmitted on July 3, 2016; accepted on July 21, 2016 STUDY QUESTION: Do the reproductive outcomes from the transfer of fully hatched (FH) blastocysts differ from those of not fully hatched (NFH) blastocysts? SUMMARY ANSWER: Biochemical pregnancy rate (BPR), implantation rate (IR), live birth rate (LBR) and early pregnancy loss (EPL) rate are similar in FH and NFH single euploid blastocyst embryo transfers. WHAT IS KNOWN ALREADY : The use of extended culture and PGS often leads to transfer of an embryo that is well developed and frequently FH from the zona pellucida. Without the protection of the zona, an FH embryo could be vulnerable to trauma during the transfer procedure. To date, no other study has evaluated the reproductive competence of an FH blastocyst transfer. STUDY DESIGN, SIZE, DURATION: The retrospective study included 808 patients who underwent 808 cycles performed between September 2013 and July 2015 at a private academic IVF center. Of these, 436 cycles entailed transfer of a NFH blastocyst (n = 123 fresh trans- fer, n = 313 frozen/thawed embryo transfer (FET)) and 372 cycles entailed transfer of an FH blastocyst (n = 132 fresh, 240 FET). Fresh and FET cycles and associated clinical outcomes were considered separately. LBR was defined as the delivery of a live infant after 24 weeks of gestation. PARTICIPANTS/MATERIALS, SETTING, METHOD: Trophectoderm biopsies were performed on Day 5 (d5) or 6 (d6) for embryos meeting morphology eligibility criteria (set at ≥3BC). Morphologic grading was determined using a modified Gardner–Schoolcraft scale prior to transfer. A single euploid embryo was selected for transfer per cycle on either the morning of d6, for fresh transfers or 5 days after proges- terone supplementation for patients with transfer in an FET cycle. Embryos were classified as NFH (expansion Grade 3, 4 or 5) or FH (expan- sion Grade 6) cohorts. The main outcome measure was IR. MAIN RESULTS AND THE ROLE OF CHANCE: In the fresh transfer group, IR was similar between NFH and FH cycles (53.7% versus 55.3%, P = 0.99, odds ratio (OR) 0.9; 95% confidence interval (CI) 0.6–1.5). Secondary outcomes were also statistically similar between groups: BPR (65.9% versus 66.7%, OR 1.0; 95% CI: 0.6–1.6), LBR (43.1% versus 47.7%, P = 0.45, OR 1.2; 95% CI: 0.7–1.9) and EPL rate (22.8% versus 18.2%, OR 1.3; 95% CI: 0.7–2.4). After adjusting for age, BMI, endometrial thickness at the LH surge and oocytes retrieved in a logistic regression (LR) model, the hatching status remained not associated with IR (P > 0.05). In the FET cycles, IR was similar between NFH and FH cycles (62.6% versus 61.7%, OR 1.0; 95% CI: 0.7–1.5). Secondary outcomes were similar between groups: BPR (74.1% ver- sus 72.9%, respectively, OR 1.1; 95% CI: 0.7–1.6), LBR (55.0% versus 50.0%, OR 0.8; 95% CI: 0.6–1.1) and EPL rate (18.9% versus 22.9%, respectively, OR 0.8; 95% CI: 0.5–1.2). After adjusting for age, BMI, endometrial thickness at the LH surge and oocytes retrieved in an LR model, the hatching status was not shown to be associated with implantation (P > 0.05). © The Author 2016. Published by Oxford University Press on behalf of the European Society of Human Reproduction and Embryology. All rights reserved. For permissions, please e-mail: [email protected] Hum. Reprod. Advance Access published September 26, 2016 at New York University on September 28, 2016 http://humrep.oxfordjournals.org/ Downloaded from
Transcript of Hatching status before embryo transfer is not correlatd with implantation rate in chromosomally...
Human Reproduction, pp. 1–13, 2016
doi:10.1093/humrep/dew205
ORIGINAL ARTICLE Infertility
Hatching status before embryotransfer is not correlated withimplantation rate in chromosomallyscreened blastocystsJorge Rodriguez-Purata1,*, Julian Gingold1, Joseph Lee1,MichaelWhitehouse1, Richard Slifkin1, Christine Briton-Jones1,Alan Copperman1,2, and Benjamin Sandler1,21Reproductive Medicine Associates of New York, 635 Madison Ave 10th Floor, New York, NY 10022, USA 2Obstetrics, Gynecology andReproductive Science, Icahn School of Medicine at Mount Sinai, Klingenstein Pavilion, 1176 Fifth Avenue, 9th Floor, New York, NY 10029,USA
*Correspondence address. Tel: +(212) 756-5777, ext. 330; Fax: (212) 756-5770; E-mail: [email protected]
Submitted on April 13, 2016; resubmitted on July 3, 2016; accepted on July 21, 2016
STUDY QUESTION: Do the reproductive outcomes from the transfer of fully hatched (FH) blastocysts differ from those of not fullyhatched (NFH) blastocysts?
SUMMARY ANSWER: Biochemical pregnancy rate (BPR), implantation rate (IR), live birth rate (LBR) and early pregnancy loss (EPL) rateare similar in FH and NFH single euploid blastocyst embryo transfers.
WHAT IS KNOWN ALREADY : The use of extended culture and PGS often leads to transfer of an embryo that is well developed andfrequently FH from the zona pellucida. Without the protection of the zona, an FH embryo could be vulnerable to trauma during the transferprocedure. To date, no other study has evaluated the reproductive competence of an FH blastocyst transfer.
STUDY DESIGN, SIZE, DURATION: The retrospective study included 808 patients who underwent 808 cycles performed betweenSeptember 2013 and July 2015 at a private academic IVF center. Of these, 436 cycles entailed transfer of a NFH blastocyst (n = 123 fresh trans-fer, n = 313 frozen/thawed embryo transfer (FET)) and 372 cycles entailed transfer of an FH blastocyst (n = 132 fresh, 240 FET). Fresh and FETcycles and associated clinical outcomes were considered separately. LBR was defined as the delivery of a live infant after 24 weeks of gestation.
PARTICIPANTS/MATERIALS, SETTING, METHOD: Trophectoderm biopsies were performed on Day 5 (d5) or 6 (d6) for embryosmeeting morphology eligibility criteria (set at ≥3BC). Morphologic grading was determined using a modified Gardner–Schoolcraft scale priorto transfer. A single euploid embryo was selected for transfer per cycle on either the morning of d6, for fresh transfers or 5 days after proges-terone supplementation for patients with transfer in an FET cycle. Embryos were classified as NFH (expansion Grade 3, 4 or 5) or FH (expan-sion Grade 6) cohorts. The main outcome measure was IR.
MAIN RESULTS AND THE ROLE OF CHANCE: In the fresh transfer group, IR was similar between NFH and FH cycles (53.7% versus55.3%, P = 0.99, odds ratio (OR) 0.9; 95% confidence interval (CI) 0.6–1.5). Secondary outcomes were also statistically similar betweengroups: BPR (65.9% versus 66.7%, OR 1.0; 95% CI: 0.6–1.6), LBR (43.1% versus 47.7%, P = 0.45, OR 1.2; 95% CI: 0.7–1.9) and EPL rate(22.8% versus 18.2%, OR 1.3; 95% CI: 0.7–2.4). After adjusting for age, BMI, endometrial thickness at the LH surge and oocytes retrieved ina logistic regression (LR) model, the hatching status remained not associated with IR (P > 0.05). In the FET cycles, IR was similar betweenNFH and FH cycles (62.6% versus 61.7%, OR 1.0; 95% CI: 0.7–1.5). Secondary outcomes were similar between groups: BPR (74.1% ver-sus 72.9%, respectively, OR 1.1; 95% CI: 0.7–1.6), LBR (55.0% versus 50.0%, OR 0.8; 95% CI: 0.6–1.1) and EPL rate (18.9% versus22.9%, respectively, OR 0.8; 95% CI: 0.5–1.2). After adjusting for age, BMI, endometrial thickness at the LH surge and oocytes retrievedin an LR model, the hatching status was not shown to be associated with implantation (P > 0.05).
© The Author 2016. Published by Oxford University Press on behalf of the European Society of Human Reproduction and Embryology. All rights reserved.For permissions, please e-mail: [email protected]
Hum. Reprod. Advance Access published September 26, 2016 at N
ew Y
ork University on Septem
ber 28, 2016http://hum
rep.oxfordjournals.org/D
ownloaded from
LIMITATIONS, REASONS FOR CAUTION: Limitations include the retrospective design and data from a single institution. Additionally,the study was limited to patients that developed high-quality blastocysts suitable for biopsy.
WIDER IMPLICATIONS OF THE FINDINGS: The results suggest that FH embryos are not more fragile or less likely to implant whencompared to NFH counterparts. We found no evidence of altered IR or other clinical outcomes in the transfer of FH euploid embryos.
STUDY FUNDING/COMPETING INTEREST(S): JG is funded by MSTP grant T32 GM007280 (NIH). No additional funding wasreceived. There are no conflicts of interest to declare.
Key words: IVF / blastocyst hatching / comprehensive chromosomal screening / implantation / trophectoderm biopsy / preimplantationgenetic screening
IntroductionOver the past two decades, a greater understanding of humanoocyte and embryo development (Fragouli et al., 2013; Franasiaket al., 2014) has enhanced infertility treatment outcomes (Sunderamet al., 2012). Several techniques have been implemented to improveimplantation rates (IRs) (e.g. assisted hatching (Cohen et al., 1992),gamete/embryo cryopreservation (Cobo et al., 2012), extended cul-ture media (ECM) (Gardner et al., 1998) and PGS (Scott et al.,2013). However, the use of ECM and PGS often mandates the trans-fer of a more developed, fully hatched (FH) embryo. Of key interestis the fragility of expanded, chromosomally screened embryos andthe impact on reproductive outcome.Advancements in ECM (ASRM, 2013) have successfully enabled the
development of embryos to Day 5 (d5) or 6 (d6) after vaginal oocyteretrieval (VOR) (Thomas et al., 2010). This permits the identificationof blastocysts with little or no implantation potential (Glujovsky et al.,2012). While ECM studies raise questions of zona pellucida hardeningand the possible inability of an embryo to hatch (Cohen et al., 1992),little attention has been given to the impact of the transfer of an FHembryo.Embryo screening techniques have benefited from ECM. Ploidy
assessment via trophectoderm biopsy (Werner et al., 2015) canassist clinicians to objectively select a high-quality embryo (Scottet al., 2013). However, the use of ECM and PGS often leads totransfer of a more developed, and frequently FH, embryo(Hardarson et al., 2012). Additionally, laser-assisted biopsy techni-ques increase the likelihood of hatching (Jones et al., 2006).Without zona protection, an FH embryo is presumed to be vulner-able to trauma during transfer. The hatching process can occurbefore or at transfer in both fresh and frozen embryo transfer(FET) cycles, with embryos vitrified at expansion Grade 4 or 5(hereafter referred to as not-fully hatched (NFH)) often observedFH after rewarming.Hatching effect on clinical outcomes remains unknown.
Concerns that the high pressure to which blastocysts are exposedduring pipetting (Hiraoka et al., 2004) might rupture the trophecto-derm and induce blastocoelic fluid leakage have been raised.Although no study has adequately assessed this opinion, an FHeuploid embryo is expected to be more fragile and less likely toimplant than a NFH euploid embryo. With increasing utilization ofECM and PGS as part of a freeze-all strategy, an investigation ofthe impact of the transfer of an FH embryo on reproductive out-comes is particularly pressing.
Material andmethods
Study design and patient populationA single-center, retrospective cohort analysis of patients identified from anelectronic medical records database who completed an IVF cycle withquantitative-PCR (qPCR)–based PGS from September 2013 to July 2015was performed. Transferred embryos were classified as either NFH(expansion Grades 3–5) or FH (expansion Grade 6) according to their sta-tus right before transfer and to a center-modified Gardner and Schoolcraftscale (Gardner and Schoolcraft, 1999), which includes a D category forinner cell mass (ICM) (few cells, disorganized) and trophectoderm (veryfew cells). Embryos scored at <3BC were excluded as they were ineligiblefor biopsy. One euploid embryo was selected for transfer per cycle oneither the morning of d6 for fresh transfers or, for patients undergoing anFET, 5 days after progesterone supplementation. Included patientsrequired a normal endometrial cavity and a basal Day 3 FSH level of≤13 mIU/ml. If patients had multiple cycles, only the first cycle from eithercohort was included. Donor egg cycles were excluded.
Stimulation protocolPatients underwent controlled ovarian hyperstimulation (COH) for IVF asdescribed previously (Rodriguez-Purata et al., 2016). Oocyte maturationwas induced with recombinant hCG alone (Ovidrel®, EMD Serono,Rockland, MA, USA) or with 40 IU leuprolide acetate (Lupron®, AbbVieLaboratories, Chicago, IL, USA) concomitant with 1000 IU hCG(Novarel®, Ferring Pharmaceuticals, Parsippany, NJ, USA) in patients atrisk of ovarian hyperstimulation syndrome. Patients underwent VOR underultrasound guidance 36 hours post-surge and were inseminated by ICSIbecause of the possibility of genetic testing of the embryos.
Laboratory proceduresEmbryo culture techniqueEmbryos were cultured to the blastocyst stage as previously described(Rodriguez-Purata et al., 2016). On Day 3 (d3) of embryo development, allembryos underwent ‘assisted hatching’ (not to be confused with hatching/hatched status by the Gardner–Schoolcraft scale) by the creation of a25–30 µm opening in the zona pellucida with a 200–300 µs pulse from aZILOS-tk Laser (Hamilton Thorne Biosciences, Beverly, MA, USA) toboost trophectoderm herniation.
Embryo biopsy techniqueBlastocyst trophectoderm biopsies were performed on d5 and/or d6,contingent upon morphological eligibility (embryos ≥3BC). Embryo biopsywas carried out as described previously (Rodriguez-Purata et al., 2016).Two to nine trophectoderm cells were analyzed by qPCR (Treff et al.,
2 Rodriguez-Purata et al.
at New
York U
niversity on September 28, 2016
http://humrep.oxfordjournals.org/
Dow
nloaded from
2012). Since variability persists in hatching rate, not all d5 embryos are eli-gible for biopsy. Biopsy samples were placed in hypotonic wash buffer andsubmitted for immediate analysis in embryos biopsied on d5 and for lateranalysis in those embryos biopsied on d6. Day 5 samples were availablefor processing before 10:00 p.m., with results available by d6. Embryosbiopsied on d6 were vitrified after biopsy, and the results were availablewithin 2 weeks. Patients were encouraged to undergo freeze-all cycles; astrategy that allows for the availability of the genetic results of all embryosprior to transfer selection. Biopsied embryos received a genetic interpret-ation of euploid or aneuploid.
Cryopreservation–rewarming techniqueThe cryopreservation and rewarming technique has been described previ-ously (Rodriguez-Purata et al., 2016). After rewarming, embryo survivalwas determined according to the appearance of the blastomeres, zona pel-lucida and the ability of the blastocoel to re-expand. Degenerated embryoswere cataloged as non-surviving.
Study groupsFresh and FET cycles and associated clinical outcomes were consideredseparately.
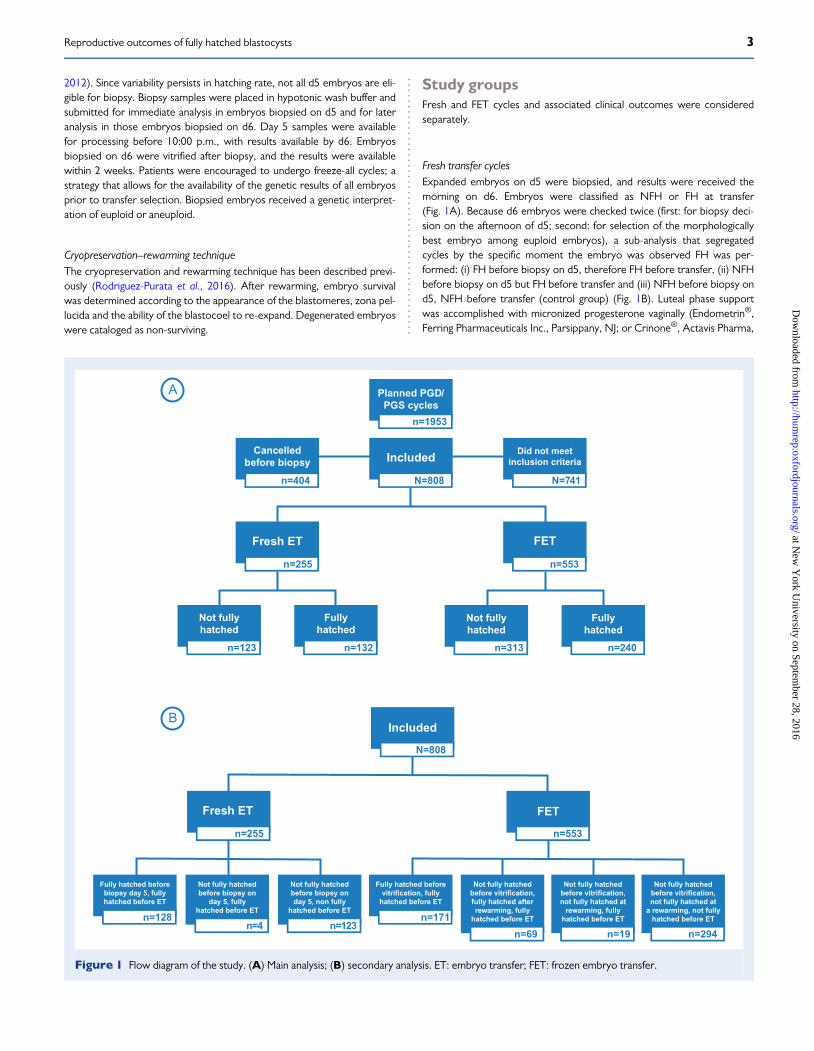
Fresh transfer cyclesExpanded embryos on d5 were biopsied, and results were received themorning on d6. Embryos were classified as NFH or FH at transfer(Fig. 1A). Because d6 embryos were checked twice (first: for biopsy deci-sion on the afternoon of d5; second: for selection of the morphologicallybest embryo among euploid embryos), a sub-analysis that segregatedcycles by the specific moment the embryo was observed FH was per-formed: (i) FH before biopsy on d5, therefore FH before transfer, (ii) NFHbefore biopsy on d5 but FH before transfer and (iii) NFH before biopsy ond5, NFH before transfer (control group) (Fig. 1B). Luteal phase supportwas accomplished with micronized progesterone vaginally (Endometrin®,Ferring Pharmaceuticals Inc., Parsippany, NJ; or Crinone®, Actavis Pharma,
Planned PGD/
PGS cycles
n=1953
Included
N=808
Cancelled
before biopsy
n=404
Did not meet
inclusion criteria
N=741
Not fully
hatched
n=123
Fully
hatched
n=132
Not fully
hatched
n=313
Fully
hatched
n=240
Fully hatched before
biopsy day 5, fully
hatched before ET
n=128
Not fully hatched
before biopsy on
day 5, fully
hatched before ET
n=4
Not fully hatched
before biopsy on
day 5, non fully
hatched before ET
n=123
Fully hatched before
vitrification, fully
hatched before ET
n=171
Not fully hatched
before vitrification,
fully hatched after
rewarming, fully
hatched before ET
n=69
Not fully hatched
before vitrification,
not fully hatched at
rewarming, fully
hatched before ET
n=19
Not fully hatched
before vitrification,
not fully hatched at
a rewarming, not fully
hatched before ET
n=294
Fresh ET
n=255
FET
n=553
Included
N=808
Fresh ET
n=255
FET
n=553
A
B
Figure 1 Flow diagram of the study. (A) Main analysis; (B) secondary analysis. ET: embryo transfer; FET: frozen embryo transfer.
3Reproductive outcomes of fully hatched blastocysts
at New
York U
niversity on September 28, 2016
http://humrep.oxfordjournals.org/
Dow
nloaded from
Parsippany, NJ, USA) and orally (Prometrium®, AbbVie Inc., NorthChicago, IL, USA) beginning the day after VOR.
FET cyclesThe transfer was performed under a synthetically prepared endomet-rium. Embryos used for an FET cycle were available after one of the fol-lowing scenarios: supernumerary euploid embryos biopsied on d5 andvitrified on d6 after a morphologically superior embryo were chosen forthe fresh transfer; supernumerary embryos biopsied on the morning ofd6 of the fresh cycle, therefore with a pending genetic result or after afreeze-all cycle in which all biopsied embryos were cryopreserved.Following menses, patients began oral estradiol (Estrace®; TevaPharmaceuticals, Sellersville, PA, USA) 2 mg twice daily for 1 week, then2 mg three times daily. Endometrial thickness was assessed weekly until athickness of ≥7 mm was observed. Immediately thereafter, 50 mg ofintramuscular progesterone daily (Progesterone injection®; WatsonPharma Inc., Parsippany, NJ, USA) was added. Thawing and transferringof the embryo was performed after 5 days of progesterone supplementa-tion. Embryos were classified as NFH or FH at transfer (Fig. 1A).Because embryos from FET cycles were checked three times beforetransfer (first: before vitrification; second: after rewarming; third: beforeFET), a sub-analysis was performed; according to the particular momentthe embryo was observed FH: (i) FH before vitrification, therefore FHafter rewarming and before transfer, (ii) NFH before vitrification but FHafter rewarming, therefore FH before transfer, (iii) NFH before vitrifica-tion, NFH at rewarming but FH before transfer and (iv) NFH before vitri-fication, NFH at rewarming and NFH before transfer (control group)(Fig. 1B).
OutcomemeasuresIR was considered the most temporally-related event to test the study‘snull hypothesis. It was calculated as a ratio of the number of gestationalsacs (GS) (determined by ultrasound ~9 days following a positive preg-nancy test) to the number of transferred euploid embryos. Monozygotictwins were characterized as one sac in this analysis. Secondary out-comes were biochemical pregnancy rate (BPR), live birth rate (LBR) andearly pregnancy loss (EPL) rate. A pregnancy was defined as the detec-tion of β-hCG ≥5 mIU/mL 9 days after the transfer. A live birth wasdefined as the delivery of a live infant after 24 weeks of gestation. EPLwas defined as a loss following a positive pregnancy test and/or detect-able GS.
Statistical methodsStatistical analysis was performed using SAS version 9.4 (SAS InstituteInc., Cary, NC, USA). Descriptive data were compared by unpairedtwo-sided t-test with significance at P < 0.05; results are expressed asmean and standard deviation with 95% confidence intervals (CI).Distributions between outcomes were assessed by chi square test (orFisher exact test for samples <10) with significance established atP < 0.05. The Clopper–Pearson interval was used to calculate binomialCI for all reported proportions. Adjusted odds ratios (ORs) and their95% CI for BPR, IR, LBR and EPL rate were calculated to evaluate therelative odds of each event compared with the reference group of NFHcycles. Study was designed with 85% power to detect a difference of20% in IR between NFH and FH embryos with a reference proportionof 50% and a two-tailed 5% significance level. The required sample sizewas computed to be 107 per group.
Univariate logistic regression (LR) analyses were performed to identifycandidate factors that were associated with implantation and would alsobe included in the multivariate regression. Candidate variables included
age, anti-Müllerian hormone, FSH, BMI, endometrial thickness at surge,peak estradiol at surge, number of oocytes retrieved, number of embryosbiopsied and number of embryos vitrified. We also constructed a multi-variate LR model including potential predictors of implantation regardlessof their association within a univariate model: age, BMI, endometrial thick-ness at surge and number of oocytes retrieved. The likelihood of implant-ation after IVF is presented as an OR with SE and 95% CI.
Regulatory approvalThis retrospective study was approved by the Western InstitutionalReview Board. Informed consent from patients was not obtained, butpatient information was anonymized and de-identified prior to analysis.
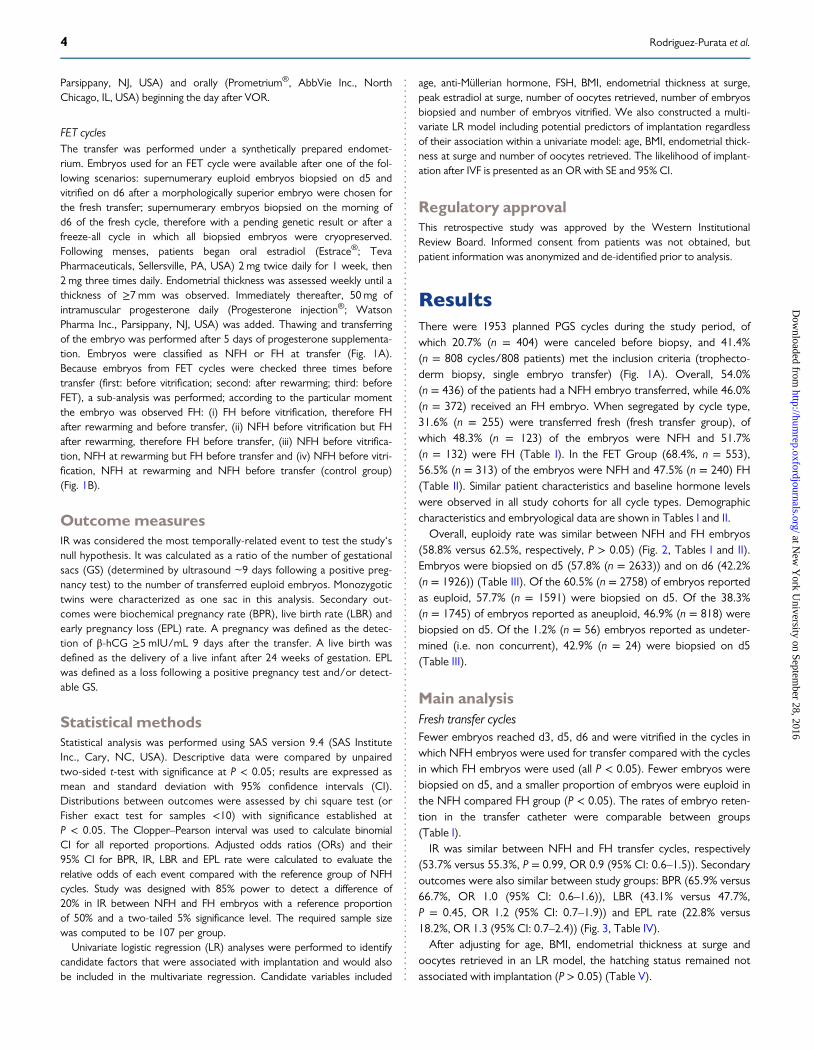
ResultsThere were 1953 planned PGS cycles during the study period, ofwhich 20.7% (n = 404) were canceled before biopsy, and 41.4%(n = 808 cycles/808 patients) met the inclusion criteria (trophecto-derm biopsy, single embryo transfer) (Fig. 1A). Overall, 54.0%(n = 436) of the patients had a NFH embryo transferred, while 46.0%(n = 372) received an FH embryo. When segregated by cycle type,31.6% (n = 255) were transferred fresh (fresh transfer group), ofwhich 48.3% (n = 123) of the embryos were NFH and 51.7%(n = 132) were FH (Table I). In the FET Group (68.4%, n = 553),56.5% (n = 313) of the embryos were NFH and 47.5% (n = 240) FH(Table II). Similar patient characteristics and baseline hormone levelswere observed in all study cohorts for all cycle types. Demographiccharacteristics and embryological data are shown in Tables I and II.Overall, euploidy rate was similar between NFH and FH embryos
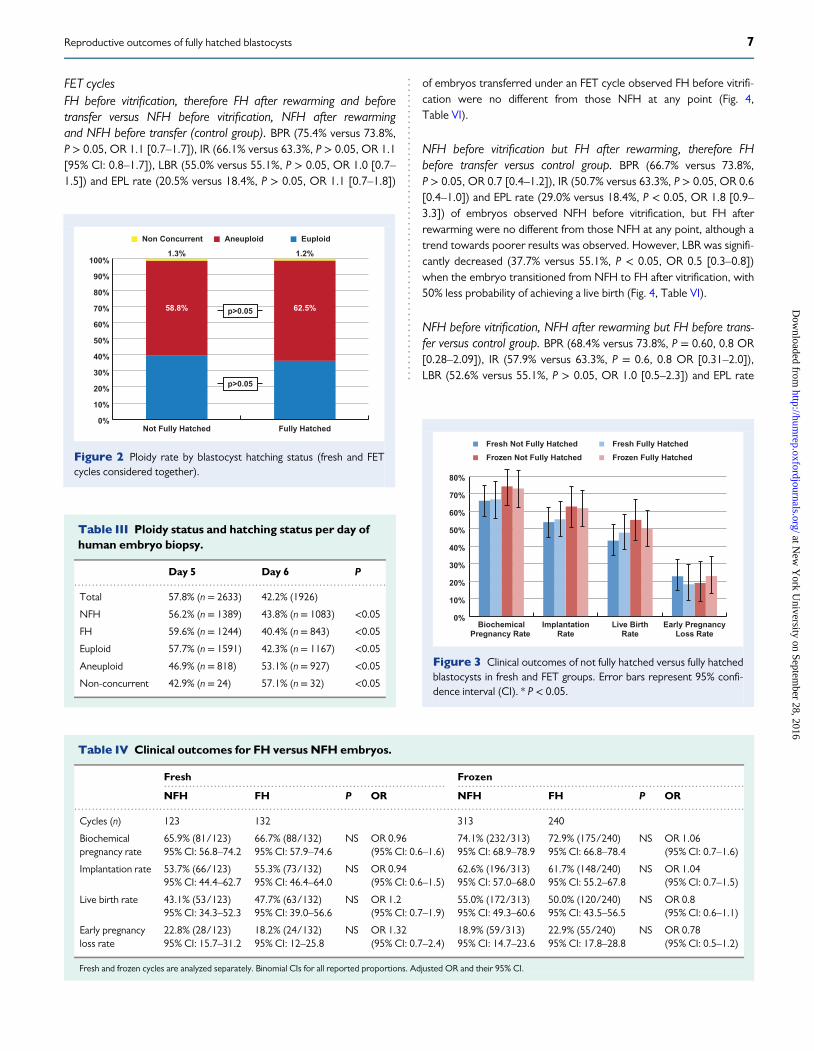
(58.8% versus 62.5%, respectively, P > 0.05) (Fig. 2, Tables I and II).Embryos were biopsied on d5 (57.8% (n = 2633)) and on d6 (42.2%(n = 1926)) (Table III). Of the 60.5% (n = 2758) of embryos reportedas euploid, 57.7% (n = 1591) were biopsied on d5. Of the 38.3%(n = 1745) of embryos reported as aneuploid, 46.9% (n = 818) werebiopsied on d5. Of the 1.2% (n = 56) embryos reported as undeter-mined (i.e. non concurrent), 42.9% (n = 24) were biopsied on d5(Table III).
Main analysisFresh transfer cyclesFewer embryos reached d3, d5, d6 and were vitrified in the cycles inwhich NFH embryos were used for transfer compared with the cyclesin which FH embryos were used (all P < 0.05). Fewer embryos werebiopsied on d5, and a smaller proportion of embryos were euploid inthe NFH compared FH group (P < 0.05). The rates of embryo reten-tion in the transfer catheter were comparable between groups(Table I).IR was similar between NFH and FH transfer cycles, respectively
(53.7% versus 55.3%, P = 0.99, OR 0.9 (95% CI: 0.6–1.5)). Secondaryoutcomes were also similar between study groups: BPR (65.9% versus66.7%, OR 1.0 (95% CI: 0.6–1.6)), LBR (43.1% versus 47.7%,P = 0.45, OR 1.2 (95% CI: 0.7–1.9)) and EPL rate (22.8% versus18.2%, OR 1.3 (95% CI: 0.7–2.4)) (Fig. 3, Table IV).After adjusting for age, BMI, endometrial thickness at surge and
oocytes retrieved in an LR model, the hatching status remained notassociated with implantation (P > 0.05) (Table V).
4 Rodriguez-Purata et al.
at New
York U
niversity on September 28, 2016
http://humrep.oxfordjournals.org/
Dow
nloaded from
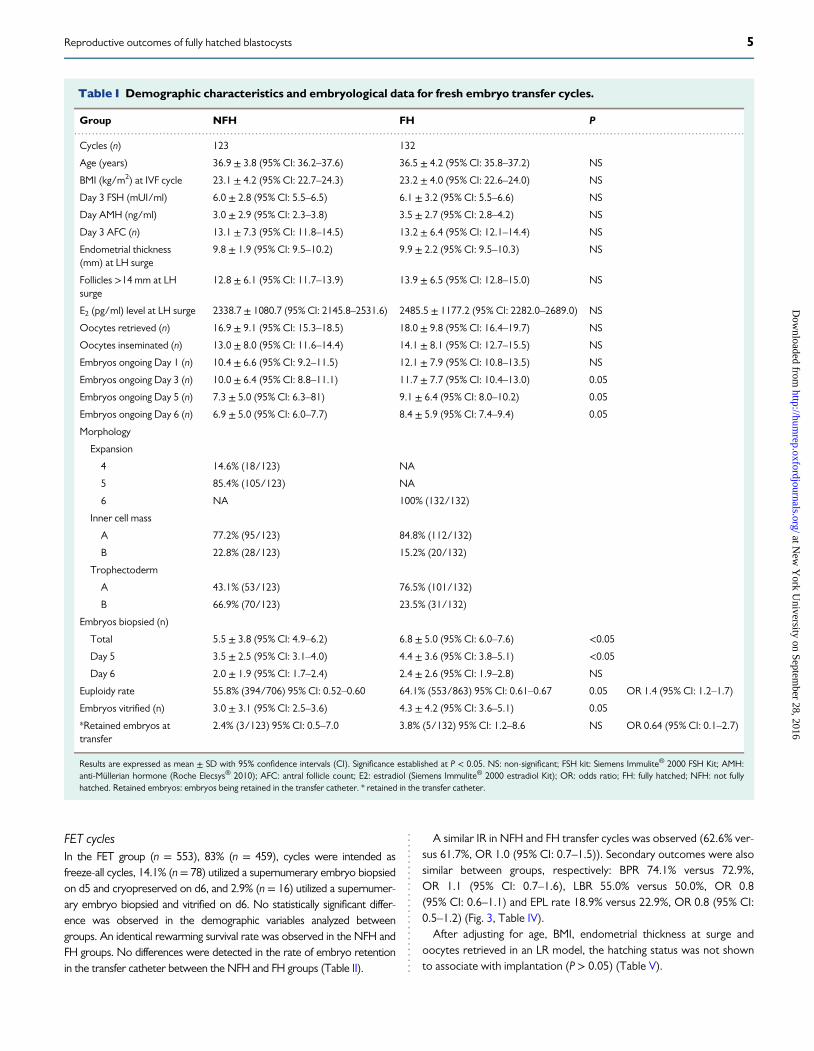
FET cyclesIn the FET group (n = 553), 83% (n = 459), cycles were intended asfreeze-all cycles, 14.1% (n = 78) utilized a supernumerary embryo biopsiedon d5 and cryopreserved on d6, and 2.9% (n = 16) utilized a supernumer-ary embryo biopsied and vitrified on d6. No statistically significant differ-ence was observed in the demographic variables analyzed betweengroups. An identical rewarming survival rate was observed in the NFH andFH groups. No differences were detected in the rate of embryo retentionin the transfer catheter between the NFH and FH groups (Table II).
A similar IR in NFH and FH transfer cycles was observed (62.6% ver-sus 61.7%, OR 1.0 (95% CI: 0.7–1.5)). Secondary outcomes were alsosimilar between groups, respectively: BPR 74.1% versus 72.9%,OR 1.1 (95% CI: 0.7–1.6), LBR 55.0% versus 50.0%, OR 0.8(95% CI: 0.6–1.1) and EPL rate 18.9% versus 22.9%, OR 0.8 (95% CI:0.5–1.2) (Fig. 3, Table IV).After adjusting for age, BMI, endometrial thickness at surge and
oocytes retrieved in an LR model, the hatching status was not shownto associate with implantation (P > 0.05) (Table V).
.............................................................................................................................................................................................
Table I Demographic characteristics and embryological data for fresh embryo transfer cycles.
Group NFH FH P
Cycles (n) 123 132
Age (years) 36.9 ± 3.8 (95% CI: 36.2–37.6) 36.5 ± 4.2 (95% CI: 35.8–37.2) NS
BMI (kg/m2) at IVF cycle 23.1 ± 4.2 (95% CI: 22.7–24.3) 23.2 ± 4.0 (95% CI: 22.6–24.0) NS
Day 3 FSH (mUI/ml) 6.0 ± 2.8 (95% CI: 5.5–6.5) 6.1 ± 3.2 (95% CI: 5.5–6.6) NS
Day AMH (ng/ml) 3.0 ± 2.9 (95% CI: 2.3–3.8) 3.5 ± 2.7 (95% CI: 2.8–4.2) NS
Day 3 AFC (n) 13.1 ± 7.3 (95% CI: 11.8–14.5) 13.2 ± 6.4 (95% CI: 12.1–14.4) NS
Endometrial thickness(mm) at LH surge
9.8 ± 1.9 (95% CI: 9.5–10.2) 9.9 ± 2.2 (95% CI: 9.5–10.3) NS
Follicles >14 mm at LHsurge
12.8 ± 6.1 (95% CI: 11.7–13.9) 13.9 ± 6.5 (95% CI: 12.8–15.0) NS
E2 (pg/ml) level at LH surge 2338.7 ± 1080.7 (95% CI: 2145.8–2531.6) 2485.5 ± 1177.2 (95% CI: 2282.0–2689.0) NS
Oocytes retrieved (n) 16.9 ± 9.1 (95% CI: 15.3–18.5) 18.0 ± 9.8 (95% CI: 16.4–19.7) NS
Oocytes inseminated (n) 13.0 ± 8.0 (95% CI: 11.6–14.4) 14.1 ± 8.1 (95% CI: 12.7–15.5) NS
Embryos ongoing Day 1 (n) 10.4 ± 6.6 (95% CI: 9.2–11.5) 12.1 ± 7.9 (95% CI: 10.8–13.5) NS
Embryos ongoing Day 3 (n) 10.0 ± 6.4 (95% CI: 8.8–11.1) 11.7 ± 7.7 (95% CI: 10.4–13.0) 0.05
Embryos ongoing Day 5 (n) 7.3 ± 5.0 (95% CI: 6.3–81) 9.1 ± 6.4 (95% CI: 8.0–10.2) 0.05
Embryos ongoing Day 6 (n) 6.9 ± 5.0 (95% CI: 6.0–7.7) 8.4 ± 5.9 (95% CI: 7.4–9.4) 0.05
Morphology
Expansion
4 14.6% (18/123) NA
5 85.4% (105/123) NA
6 NA 100% (132/132)
Inner cell mass
A 77.2% (95/123) 84.8% (112/132)
B 22.8% (28/123) 15.2% (20/132)
Trophectoderm
A 43.1% (53/123) 76.5% (101/132)
B 66.9% (70/123) 23.5% (31/132)
Embryos biopsied (n)
Total 5.5 ± 3.8 (95% CI: 4.9–6.2) 6.8 ± 5.0 (95% CI: 6.0–7.6) <0.05
Day 5 3.5 ± 2.5 (95% CI: 3.1–4.0) 4.4 ± 3.6 (95% CI: 3.8–5.1) <0.05
Day 6 2.0 ± 1.9 (95% CI: 1.7–2.4) 2.4 ± 2.6 (95% CI: 1.9–2.8) NS
Euploidy rate 55.8% (394/706) 95% CI: 0.52–0.60 64.1% (553/863) 95% CI: 0.61–0.67 0.05 OR 1.4 (95% CI: 1.2–1.7)
Embryos vitrified (n) 3.0 ± 3.1 (95% CI: 2.5–3.6) 4.3 ± 4.2 (95% CI: 3.6–5.1) 0.05
*Retained embryos attransfer
2.4% (3/123) 95% CI: 0.5–7.0 3.8% (5/132) 95% CI: 1.2–8.6 NS OR 0.64 (95% CI: 0.1–2.7)
Results are expressed as mean ± SD with 95% confidence intervals (CI). Significance established at P < 0.05. NS: non-significant; FSH kit: Siemens Immulite® 2000 FSH Kit; AMH:anti-Müllerian hormone (Roche Elecsys® 2010); AFC: antral follicle count; E2: estradiol (Siemens Immulite® 2000 estradiol Kit); OR: odds ratio; FH: fully hatched; NFH: not fullyhatched. Retained embryos: embryos being retained in the transfer catheter. * retained in the transfer catheter.
5Reproductive outcomes of fully hatched blastocysts
at New
York U
niversity on September 28, 2016
http://humrep.oxfordjournals.org/
Dow
nloaded from
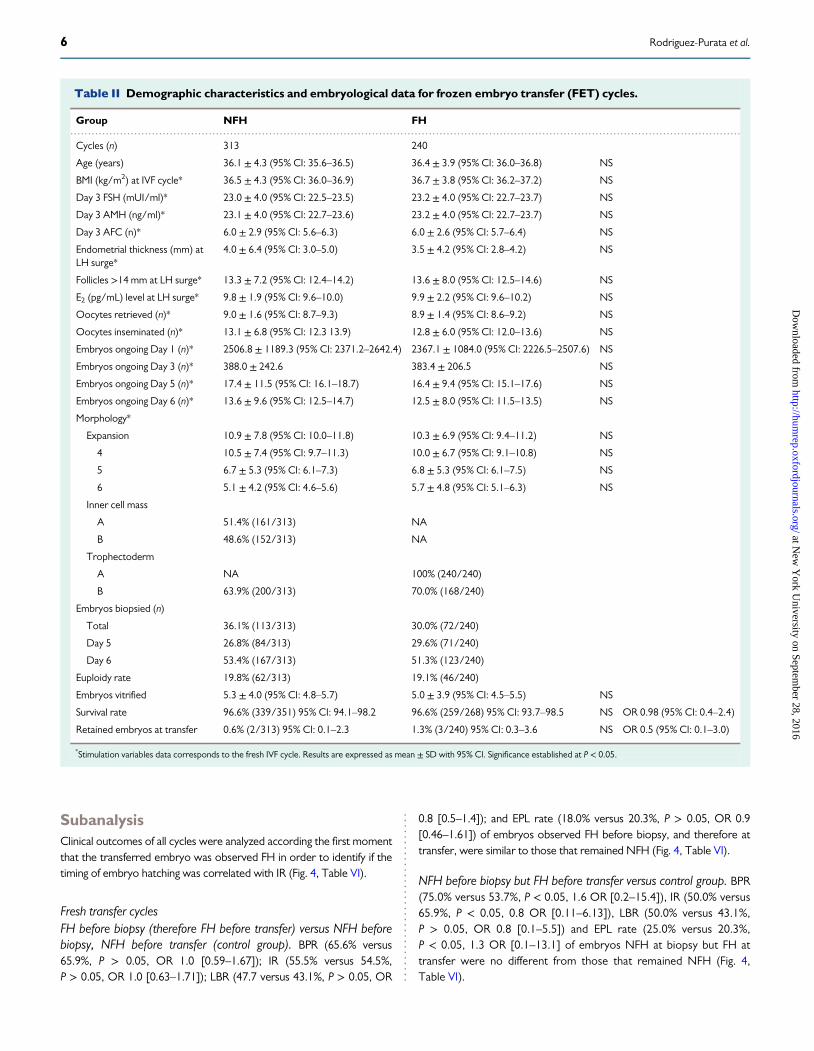
SubanalysisClinical outcomes of all cycles were analyzed according the first momentthat the transferred embryo was observed FH in order to identify if thetiming of embryo hatching was correlated with IR (Fig. 4, Table VI).
Fresh transfer cyclesFH before biopsy (therefore FH before transfer) versus NFH beforebiopsy, NFH before transfer (control group). BPR (65.6% versus65.9%, P > 0.05, OR 1.0 [0.59–1.67]); IR (55.5% versus 54.5%,P > 0.05, OR 1.0 [0.63–1.71]); LBR (47.7 versus 43.1%, P > 0.05, OR
0.8 [0.5–1.4]); and EPL rate (18.0% versus 20.3%, P > 0.05, OR 0.9[0.46–1.61]) of embryos observed FH before biopsy, and therefore attransfer, were similar to those that remained NFH (Fig. 4, Table VI).
NFH before biopsy but FH before transfer versus control group. BPR(75.0% versus 53.7%, P < 0.05, 1.6 OR [0.2–15.4]), IR (50.0% versus65.9%, P < 0.05, 0.8 OR [0.11–6.13]), LBR (50.0% versus 43.1%,P > 0.05, OR 0.8 [0.1–5.5]) and EPL rate (25.0% versus 20.3%,P < 0.05, 1.3 OR [0.1–13.1] of embryos NFH at biopsy but FH attransfer were no different from those that remained NFH (Fig. 4,Table VI).
.............................................................................................................................................................................................
Table II Demographic characteristics and embryological data for frozen embryo transfer (FET) cycles.
Group NFH FH
Cycles (n) 313 240
Age (years) 36.1 ± 4.3 (95% CI: 35.6–36.5) 36.4 ± 3.9 (95% CI: 36.0–36.8) NS
BMI (kg/m2) at IVF cycle* 36.5 ± 4.3 (95% CI: 36.0–36.9) 36.7 ± 3.8 (95% CI: 36.2–37.2) NS
Day 3 FSH (mUI/ml)* 23.0 ± 4.0 (95% CI: 22.5–23.5) 23.2 ± 4.0 (95% CI: 22.7–23.7) NS
Day 3 AMH (ng/ml)* 23.1 ± 4.0 (95% CI: 22.7–23.6) 23.2 ± 4.0 (95% CI: 22.7–23.7) NS
Day 3 AFC (n)* 6.0 ± 2.9 (95% CI: 5.6–6.3) 6.0 ± 2.6 (95% CI: 5.7–6.4) NS
Endometrial thickness (mm) atLH surge*
4.0 ± 6.4 (95% CI: 3.0–5.0) 3.5 ± 4.2 (95% CI: 2.8–4.2) NS
Follicles >14 mm at LH surge* 13.3 ± 7.2 (95% CI: 12.4–14.2) 13.6 ± 8.0 (95% CI: 12.5–14.6) NS
E2 (pg/mL) level at LH surge* 9.8 ± 1.9 (95% CI: 9.6–10.0) 9.9 ± 2.2 (95% CI: 9.6–10.2) NS
Oocytes retrieved (n)* 9.0 ± 1.6 (95% CI: 8.7–9.3) 8.9 ± 1.4 (95% CI: 8.6–9.2) NS
Oocytes inseminated (n)* 13.1 ± 6.8 (95% CI: 12.3 13.9) 12.8 ± 6.0 (95% CI: 12.0–13.6) NS
Embryos ongoing Day 1 (n)* 2506.8 ± 1189.3 (95% CI: 2371.2–2642.4) 2367.1 ± 1084.0 (95% CI: 2226.5–2507.6) NS
Embryos ongoing Day 3 (n)* 388.0 ± 242.6 383.4 ± 206.5 NS
Embryos ongoing Day 5 (n)* 17.4 ± 11.5 (95% CI: 16.1–18.7) 16.4 ± 9.4 (95% CI: 15.1–17.6) NS
Embryos ongoing Day 6 (n)* 13.6 ± 9.6 (95% CI: 12.5–14.7) 12.5 ± 8.0 (95% CI: 11.5–13.5) NS
Morphology*
Expansion 10.9 ± 7.8 (95% CI: 10.0–11.8) 10.3 ± 6.9 (95% CI: 9.4–11.2) NS
4 10.5 ± 7.4 (95% CI: 9.7–11.3) 10.0 ± 6.7 (95% CI: 9.1–10.8) NS
5 6.7 ± 5.3 (95% CI: 6.1–7.3) 6.8 ± 5.3 (95% CI: 6.1–7.5) NS
6 5.1 ± 4.2 (95% CI: 4.6–5.6) 5.7 ± 4.8 (95% CI: 5.1–6.3) NS
Inner cell mass
A 51.4% (161/313) NA
B 48.6% (152/313) NA
Trophectoderm
A NA 100% (240/240)
B 63.9% (200/313) 70.0% (168/240)
Embryos biopsied (n)
Total 36.1% (113/313) 30.0% (72/240)
Day 5 26.8% (84/313) 29.6% (71/240)
Day 6 53.4% (167/313) 51.3% (123/240)
Euploidy rate 19.8% (62/313) 19.1% (46/240)
Embryos vitrified 5.3 ± 4.0 (95% CI: 4.8–5.7) 5.0 ± 3.9 (95% CI: 4.5–5.5) NS
Survival rate 96.6% (339/351) 95% CI: 94.1–98.2 96.6% (259/268) 95% CI: 93.7–98.5 NS OR 0.98 (95% CI: 0.4–2.4)
Retained embryos at transfer 0.6% (2/313) 95% CI: 0.1–2.3 1.3% (3/240) 95% CI: 0.3–3.6 NS OR 0.5 (95% CI: 0.1–3.0)
*Stimulation variables data corresponds to the fresh IVF cycle. Results are expressed as mean ± SD with 95% CI. Significance established at P < 0.05.
6 Rodriguez-Purata et al.
at New
York U
niversity on September 28, 2016
http://humrep.oxfordjournals.org/
Dow
nloaded from
FET cyclesFH before vitrification, therefore FH after rewarming and beforetransfer versus NFH before vitrification, NFH after rewarmingand NFH before transfer (control group). BPR (75.4% versus 73.8%,P > 0.05, OR 1.1 [0.7–1.7]), IR (66.1% versus 63.3%, P > 0.05, OR 1.1[95% CI: 0.8–1.7]), LBR (55.0% versus 55.1%, P > 0.05, OR 1.0 [0.7–1.5]) and EPL rate (20.5% versus 18.4%, P > 0.05, OR 1.1 [0.7–1.8])
of embryos transferred under an FET cycle observed FH before vitrifi-cation were no different from those NFH at any point (Fig. 4,Table VI).
NFH before vitrification but FH after rewarming, therefore FHbefore transfer versus control group. BPR (66.7% versus 73.8%,P > 0.05, OR 0.7 [0.4–1.2]), IR (50.7% versus 63.3%, P > 0.05, OR 0.6[0.4–1.0]) and EPL rate (29.0% versus 18.4%, P < 0.05, OR 1.8 [0.9–3.3]) of embryos observed NFH before vitrification, but FH afterrewarming were no different from those NFH at any point, although atrend towards poorer results was observed. However, LBR was signifi-cantly decreased (37.7% versus 55.1%, P < 0.05, OR 0.5 [0.3–0.8])when the embryo transitioned from NFH to FH after vitrification, with50% less probability of achieving a live birth (Fig. 4, Table VI).
NFH before vitrification, NFH after rewarming but FH before trans-fer versus control group. BPR (68.4% versus 73.8%, P = 0.60, 0.8 OR[0.28–2.09]), IR (57.9% versus 63.3%, P = 0.6, 0.8 OR [0.31–2.0]),LBR (52.6% versus 55.1%, P > 0.05, OR 1.0 [0.5–2.3]) and EPL rate
0%
10%
20%
30%
40%
50%
60%
70%
80%
90%
100%
58.8% 62.5%
1.3% 1.2%
Not Fully Hatched Fully Hatched
Non Concurrent Aneuploid Euploid
p>0.05
p>0.05
Figure 2 Ploidy rate by blastocyst hatching status (fresh and FETcycles considered together).
........................................................................................
Table III Ploidy status and hatching status per day ofhuman embryo biopsy.
Day 5 Day 6 P
Total 57.8% (n = 2633) 42.2% (1926)
NFH 56.2% (n = 1389) 43.8% (n = 1083) <0.05
FH 59.6% (n = 1244) 40.4% (n = 843) <0.05
Euploid 57.7% (n = 1591) 42.3% (n = 1167) <0.05
Aneuploid 46.9% (n = 818) 53.1% (n = 927) <0.05
Non-concurrent 42.9% (n = 24) 57.1% (n = 32) <0.05
BiochemicalPregnancy Rate
ImplantationRate
Live BirthRate
Early PregnancyLoss Rate
Fresh Not Fully Hatched
Frozen Not Fully Hatched
Fresh Fully Hatched
Frozen Fully Hatched
0%
10%
20%
30%
40%
50%
60%
70%
80%
Figure 3 Clinical outcomes of not fully hatched versus fully hatchedblastocysts in fresh and FET groups. Error bars represent 95% confi-dence interval (CI). * P < 0.05.
............................................................................... .................................................................................
.............................................................................................................................................................................................
Table IV Clinical outcomes for FH versus NFH embryos.
Fresh Frozen
NFH FH P OR NFH FH P OR
Cycles (n) 123 132 313 240
Biochemicalpregnancy rate
65.9% (81/123)95% CI: 56.8–74.2
66.7% (88/132)95% CI: 57.9–74.6
NS OR 0.96(95% CI: 0.6–1.6)
74.1% (232/313)95% CI: 68.9–78.9
72.9% (175/240)95% CI: 66.8–78.4
NS OR 1.06(95% CI: 0.7–1.6)
Implantation rate 53.7% (66/123)95% CI: 44.4–62.7
55.3% (73/132)95% CI: 46.4–64.0
NS OR 0.94(95% CI: 0.6–1.5)
62.6% (196/313)95% CI: 57.0–68.0
61.7% (148/240)95% CI: 55.2–67.8
NS OR 1.04(95% CI: 0.7–1.5)
Live birth rate 43.1% (53/123)95% CI: 34.3–52.3
47.7% (63/132)95% CI: 39.0–56.6
NS OR 1.2(95% CI: 0.7–1.9)
55.0% (172/313)95% CI: 49.3–60.6
50.0% (120/240)95% CI: 43.5–56.5
NS OR 0.8(95% CI: 0.6–1.1)
Early pregnancyloss rate
22.8% (28/123)95% CI: 15.7–31.2
18.2% (24/132)95% CI: 12–25.8
NS OR 1.32(95% CI: 0.7–2.4)
18.9% (59/313)95% CI: 14.7–23.6
22.9% (55/240)95% CI: 17.8–28.8
NS OR 0.78(95% CI: 0.5–1.2)
Fresh and frozen cycles are analyzed separately. Binomial CIs for all reported proportions. Adjusted OR and their 95% CI.
7Reproductive outcomes of fully hatched blastocysts
at New
York U
niversity on September 28, 2016
http://humrep.oxfordjournals.org/
Dow
nloaded from
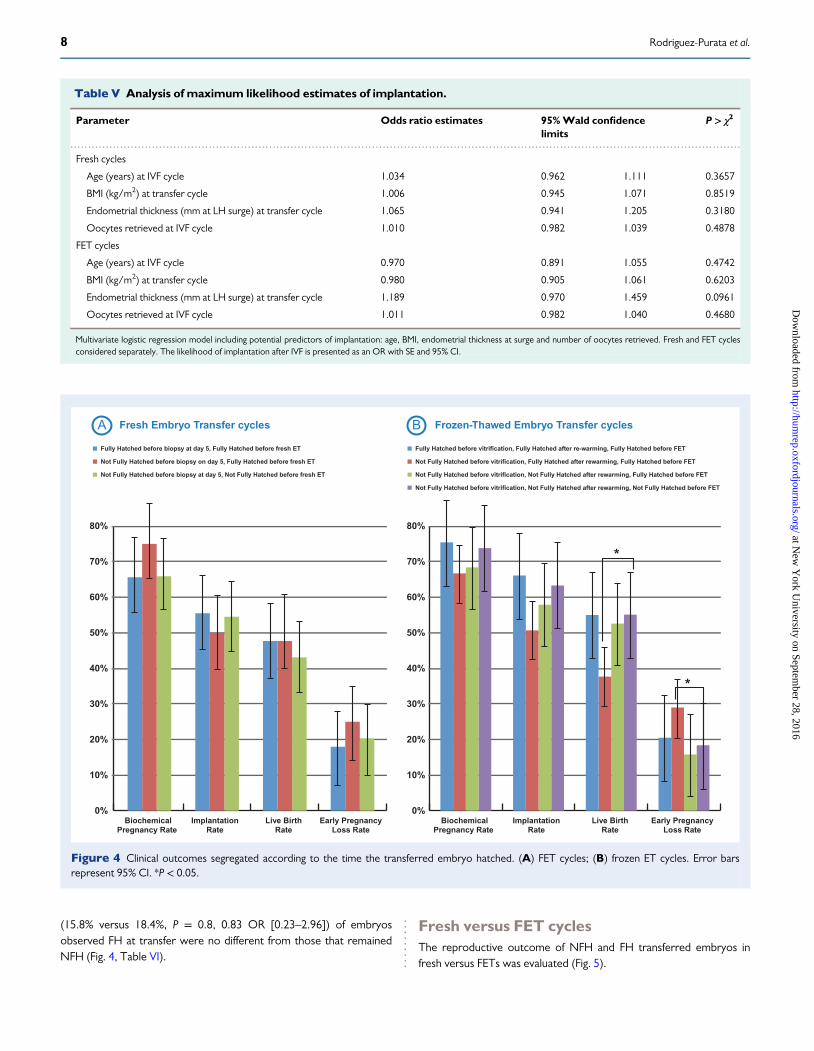
(15.8% versus 18.4%, P = 0.8, 0.83 OR [0.23–2.96]) of embryosobserved FH at transfer were no different from those that remainedNFH (Fig. 4, Table VI).
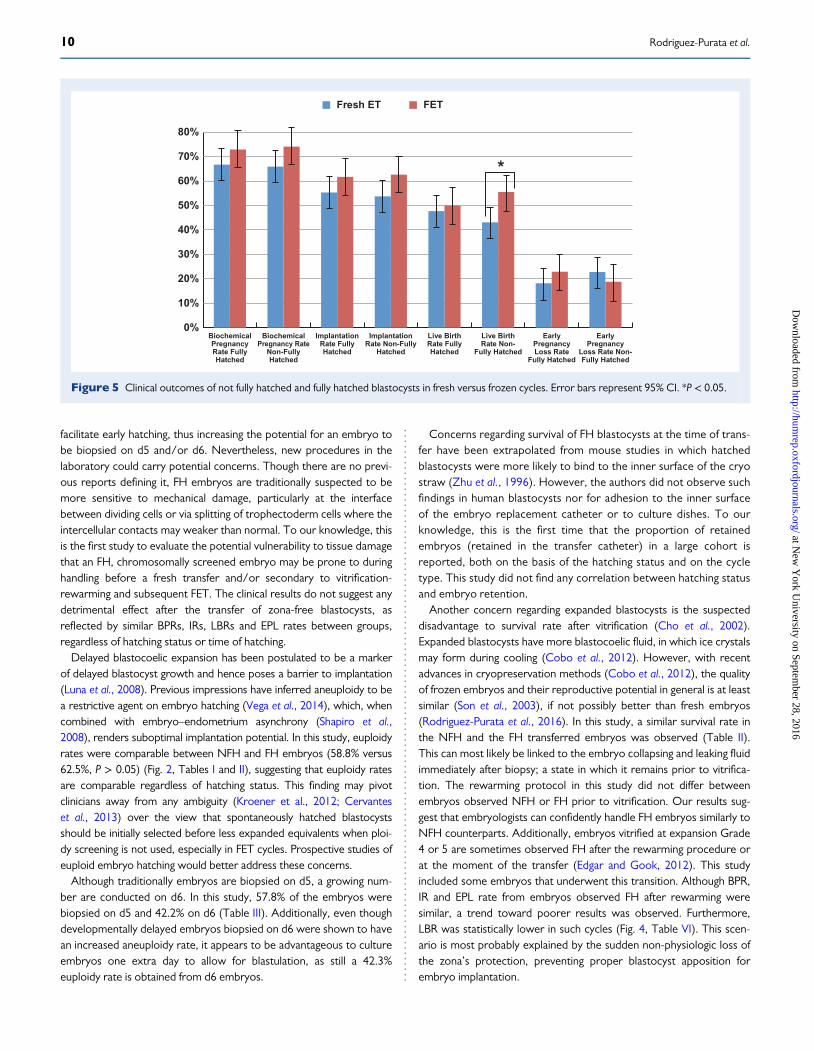
Fresh versus FET cyclesThe reproductive outcome of NFH and FH transferred embryos infresh versus FETs was evaluated (Fig. 5).
.............................................................................................................................................................................................
Table V Analysis of maximum likelihood estimates of implantation.
Parameter Odds ratio estimates 95%Wald confidencelimits
P > χ2
Fresh cycles
Age (years) at IVF cycle 1.034 0.962 1.111 0.3657
BMI (kg/m2) at transfer cycle 1.006 0.945 1.071 0.8519
Endometrial thickness (mm at LH surge) at transfer cycle 1.065 0.941 1.205 0.3180
Oocytes retrieved at IVF cycle 1.010 0.982 1.039 0.4878
FET cycles
Age (years) at IVF cycle 0.970 0.891 1.055 0.4742
BMI (kg/m2) at transfer cycle 0.980 0.905 1.061 0.6203
Endometrial thickness (mm at LH surge) at transfer cycle 1.189 0.970 1.459 0.0961
Oocytes retrieved at IVF cycle 1.011 0.982 1.040 0.4680
Multivariate logistic regression model including potential predictors of implantation: age, BMI, endometrial thickness at surge and number of oocytes retrieved. Fresh and FET cyclesconsidered separately. The likelihood of implantation after IVF is presented as an OR with SE and 95% CI.
Fully Hatched before biopsy at day 5, Fully Hatched before fresh ET
Not Fully Hatched before biopsy on day 5, Fully Hatched before fresh ET
Not Fully Hatched before biopsy at day 5, Not Fully Hatched before fresh ET
Fully Hatched before vitrification, Fully Hatched after re-warming, Fully Hatched before FET
Not Fully Hatched before vitrification, Fully Hatched after rewarming, Fully Hatched before FET
Not Fully Hatched before vitrification, Not Fully Hatched after rewarming, Fully Hatched before FET
Not Fully Hatched before vitrification, Not Fully Hatched after rewarming, Not Fully Hatched before FET
Fresh Embryo Transfer cyclesA Frozen-Thawed Embryo Transfer cyclesB
0%
10%
20%
30%
40%
50%
60%
70%
80%
0%
10%
20%
30%
40%
50%
60%
70%
80%
*
*
BiochemicalPregnancy Rate
ImplantationRate
Live BirthRate
Early PregnancyLoss Rate
BiochemicalPregnancy Rate
ImplantationRate
Live BirthRate
Early PregnancyLoss Rate
Figure 4 Clinical outcomes segregated according to the time the transferred embryo hatched. (A) FET cycles; (B) frozen ET cycles. Error barsrepresent 95% CI. *P < 0.05.
8 Rodriguez-Purata et al.
at New
York U
niversity on September 28, 2016
http://humrep.oxfordjournals.org/
Dow
nloaded from
When analyzing only NFH embryos, BPR (65.9% versus 74.1%,OR 1.5, 95% CI: 0.9–2.4), IR (53.7% versus 62.6%, OR 1.5, 95% CI:0.9–2.2) and EPL rate (22.8% versus 18.8%, OR 1.3, 95% CI: 0.8–2.2)were similar between groups with a trend towards more optimalresults in FET cycles. LBR after an FET of a NFH embryo was signifi-cantly higher compared with fresh transfer: 55.0% versus 43.1%,P < 0.05, being 1.6 times more likely to achieve a live birth after anFET cycle (OR 1.6 (95% CI: 1.1–2.4) P < 0.05).When comparing only FH embryos, BPR (66.7% versus 72.9%, OR
1.4, 95% CI: 0.9–2.1), IR (55.3% versus 61.7%, OR 1.3, 95% CI: 0.9–2.0),LBR (47.7% versus 50.0%, OR 0.9, 95% CI: 0.6–1.4) and EPL rate (18.2%versus 22.9%, OR 1.3, 95% CI: 0.8–2.9) were similar although a trendtowards superior outcomes was observed in the FET group.
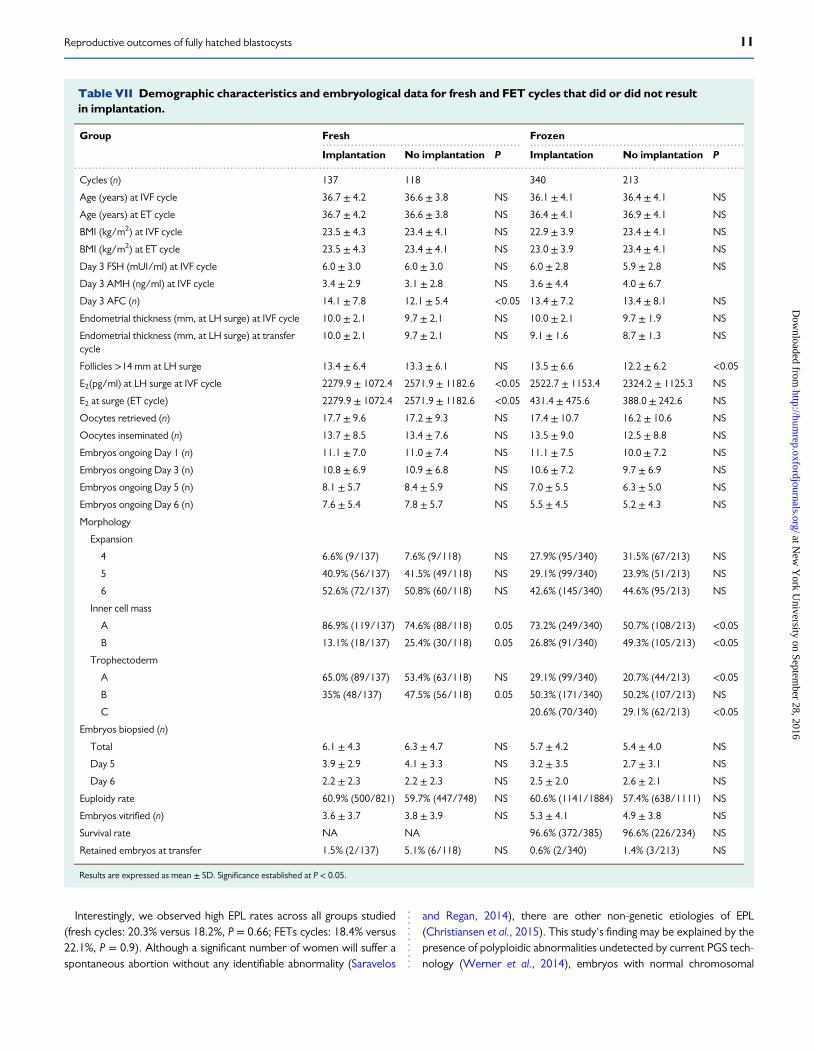
Implantation versus no implantationComparison of fresh cycles that did and did not result in implantationrevealed significant differences in the average number of antral follicles(14.1 ± 7.8 versus 12.1 ± 5.4, respectively), estradiol level at surge(2279.9 ± 1072.4 versus 2571.9 ± 1182.6) and proportion of embryoswith an ICM graded A (86.9% versus 74.6%) or trophectoderm graded B(35% versus 47.5%) (Table VII). After comparison of FET cycles thatdid and did not result in implantation, significant differences wereobserved in the number of follicles >14 mm at surge in the stimulationcycle (13.5 ± 6.6 versus 12.2 ± 6.2, respectively) and proportion ofembryos with an ICM graded A (73.2% versus 50.7%), trophectodermgraded A (29.1% versus 20.7%) and trophectoderm graded C (20.6%versus 29.1%) (Table VII).
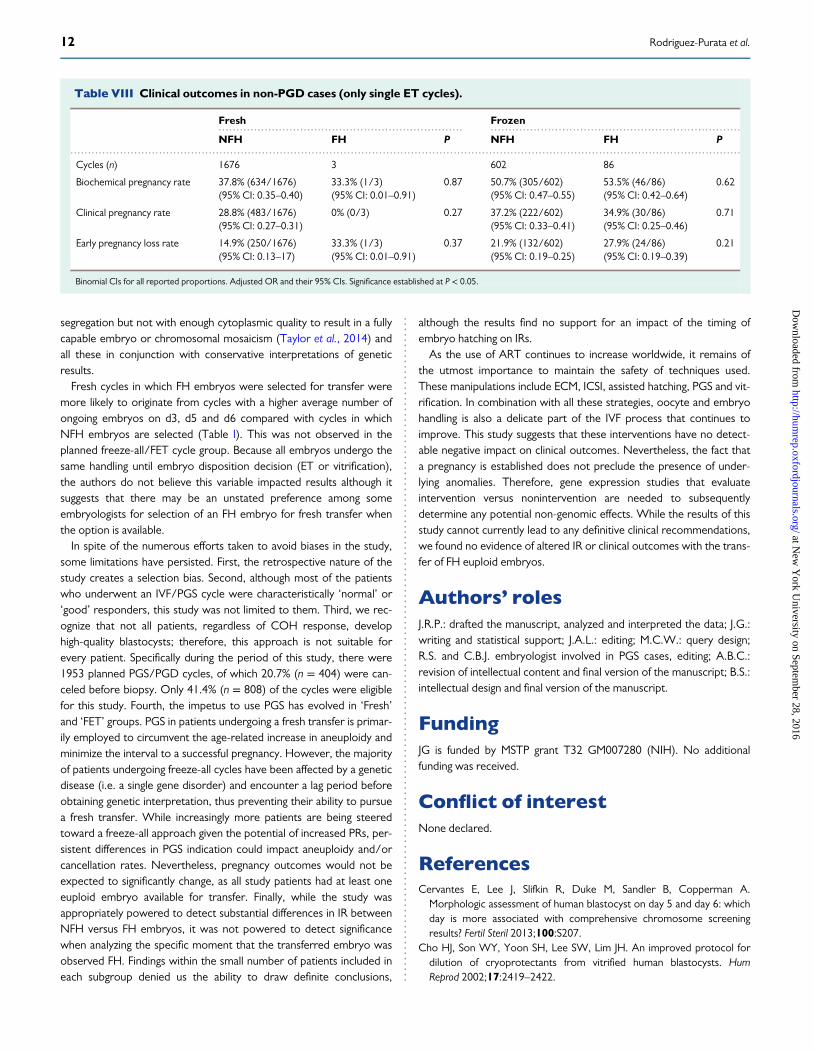
Clinical outcomes in non-PGD casesTable VIII shows the clinical outcomes in NFH versus FH of all freshand FET cycles (single embryo transferred, same study period). Nostatistically significant differences were observed.
DiscussionECM and PGS have become established procedures in reproductivemedicine, widely used to aid in selection of optimal embryos prior totransfer. Adoption of these strategies has increased the prevalence ofFH embryos, particularly at the time of transfer. This study was carriedout to understand if the transfer of an FH blastocyst was correlatedwith lower reproductive outcomes when compared to blastocyststransferred at expansion Grade 4 or 5. The findings from this analysissuggest that the presumed uncertainties of embryo vulnerability todamage or adverse outcomes if handled improperly are not wellfounded, and the deleterious effect of full blastocoelic expansion andzona pellucida loss in euploid embryos is, at best, limited. The resultsfrom this study suggest that FH embryos are not more fragile or lesslikely to implant when compared to NFH counterparts.Blastocyst hatching is a critical step in the sequence of physiologic
events that culminate in implantation. Although the current knowledgebase on spontaneous hatching is mainly derived from nonhuman stud-ies performed in vitro (Cole, 1967; Wright et al., 1976; Massip et al.,1982; Gonzales and Bavister, 1995; Montag et al., 2000; Niimura et al.,2010), failure to hatch may be one of the many factors limiting humanreproductive efficiency (ASRM, 2014). ECM, d3 laser-assisted hatchingand trophectoderm biopsy help bypass this potential barrier and
............................................................................................
.................................................................................................................
..........................................................................................................................................................................................................................................................
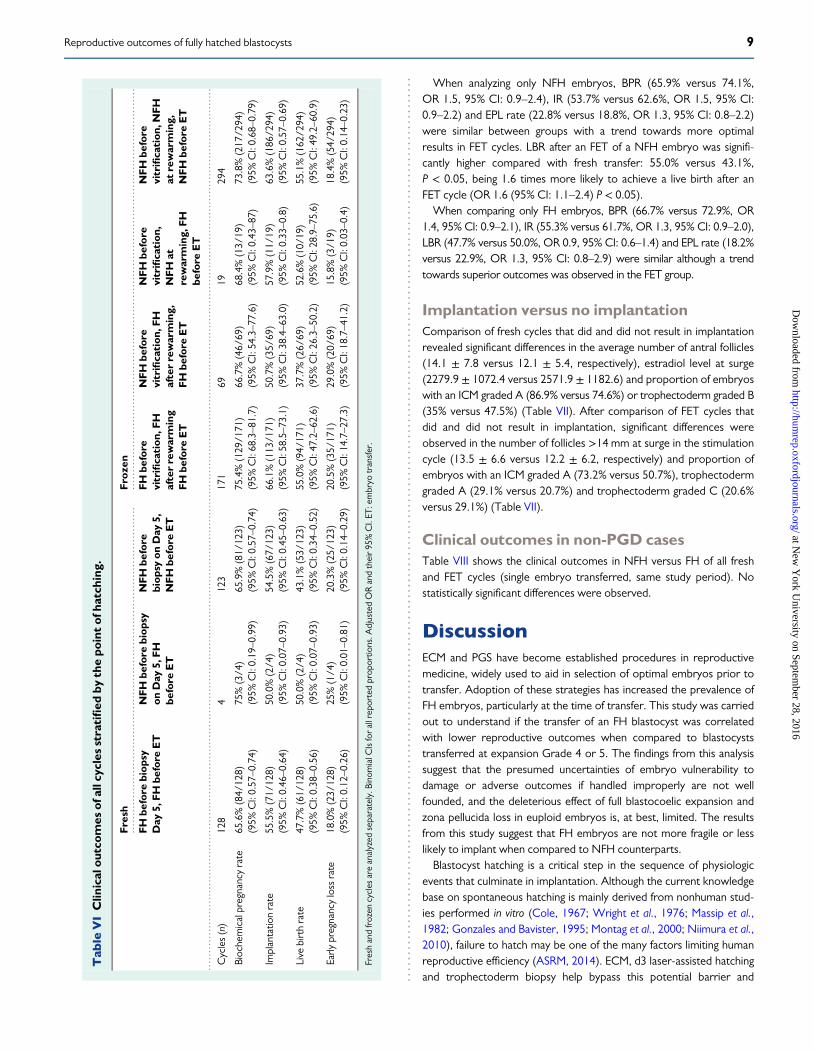
Tab
leVIClin
ical
outcom
esof
allcyclesstratified
bythepo
intof
hatching
.
Fresh
Fro
zen
FH
before
biop
syDay
5,FH
before
ET
NFH
before
biop
syon
Day
5,FH
before
ET
NFH
before
biop
syon
Day
5,NFH
before
ET
FH
before
vitrifica
tion
,FH
afterrewarming
FH
before
ET
NFH
before
vitrifica
tion
,FH
afterrewarming,
FH
before
ET
NFH
before
vitrifica
tion
,NFH
atrewarming,
FH
before
ET
NFH
before
vitrifica
tion
,NFH
atrewarming,
NFH
before
ET
Cycles(n)
128
4123
171
6919
294
Biochemicalpregnancyrate
65.6%(84/
128)
(95%
CI:0.57–0.74)
75%(3/4
)(95%
CI:0.19–0.99)
65.9%(81/
123)
(95%
CI:0.57–0.74)
75.4%(129/1
71)
(95%
CI:68.3–81.7)
66.7%(46/
69)
(95%
CI:54.3–77.6)
68.4%(13/
19)
(95%
CI:0.43–87)
73.8%(217/2
94)
(95%
CI:0.68–0.79)
Implantatio
nrate
55.5%(71/
128)
(95%
CI:0.46–0.64)
50.0%(2/4
)(95%
CI:0.07–0.93)
54.5%(67/
123)
(95%
CI:0.45–0.63)
66.1%(113/1
71)
(95%
CI:58.5–73.1)
50.7%(35/
69)
(95%
CI:38.4–63.0)
57.9%(11/
19)
(95%
CI:0.33–0.8)
63.6%(186/2
94)
(95%
CI:0.57–0.69)
Live
birthrate
47.7%(61/
128)
(95%
CI:0.38–0.56)
50.0%(2/4
)(95%
CI:0.07–0.93)
43.1%(53/
123)
(95%
CI:0.34–0.52)
55.0%(94/
171)
(95%
CI:47.2–62.6)
37.7%(26/
69)
(95%
CI:26.3–50.2)
52.6%(10/19)
(95%
CI:28.9–75.6)
55.1%(162/2
94)
(95%
CI:49.2–60.9)
Early
pregnancylossrate
18.0%(23/
128)
(95%
CI:0.12–0.26)
25%(1/4
)(95%
CI:0.01–0.81)
20.3%(25/
123)
(95%
CI:0.14–0.29)
20.5%(35/
171)
(95%
CI:14.7–27.3)
29.0%(20/
69)
(95%
CI:18.7–41.2)
15.8%(3/1
9)(95%
CI:0.03–0.4)
18.4%(54/
294)
(95%
CI:0.14–0.23)
Freshandfrozen
cycles
areanalyzed
separately.B
inom
ialC
Isforallreportedprop
ortio
ns.A
djustedORandtheir95%CI.ET
:embryo
transfer.
9Reproductive outcomes of fully hatched blastocysts
at New
York U
niversity on September 28, 2016
http://humrep.oxfordjournals.org/
Dow
nloaded from
facilitate early hatching, thus increasing the potential for an embryo tobe biopsied on d5 and/or d6. Nevertheless, new procedures in thelaboratory could carry potential concerns. Though there are no previ-ous reports defining it, FH embryos are traditionally suspected to bemore sensitive to mechanical damage, particularly at the interfacebetween dividing cells or via splitting of trophectoderm cells where theintercellular contacts may weaker than normal. To our knowledge, thisis the first study to evaluate the potential vulnerability to tissue damagethat an FH, chromosomally screened embryo may be prone to duringhandling before a fresh transfer and/or secondary to vitrification-rewarming and subsequent FET. The clinical results do not suggest anydetrimental effect after the transfer of zona-free blastocysts, asreflected by similar BPRs, IRs, LBRs and EPL rates between groups,regardless of hatching status or time of hatching.Delayed blastocoelic expansion has been postulated to be a marker
of delayed blastocyst growth and hence poses a barrier to implantation(Luna et al., 2008). Previous impressions have inferred aneuploidy to bea restrictive agent on embryo hatching (Vega et al., 2014), which, whencombined with embryo–endometrium asynchrony (Shapiro et al.,2008), renders suboptimal implantation potential. In this study, euploidyrates were comparable between NFH and FH embryos (58.8% versus62.5%, P > 0.05) (Fig. 2, Tables I and II), suggesting that euploidy ratesare comparable regardless of hatching status. This finding may pivotclinicians away from any ambiguity (Kroener et al., 2012; Cervanteset al., 2013) over the view that spontaneously hatched blastocystsshould be initially selected before less expanded equivalents when ploi-dy screening is not used, especially in FET cycles. Prospective studies ofeuploid embryo hatching would better address these concerns.Although traditionally embryos are biopsied on d5, a growing num-
ber are conducted on d6. In this study, 57.8% of the embryos werebiopsied on d5 and 42.2% on d6 (Table III). Additionally, even thoughdevelopmentally delayed embryos biopsied on d6 were shown to havean increased aneuploidy rate, it appears to be advantageous to cultureembryos one extra day to allow for blastulation, as still a 42.3%euploidy rate is obtained from d6 embryos.
Concerns regarding survival of FH blastocysts at the time of trans-fer have been extrapolated from mouse studies in which hatchedblastocysts were more likely to bind to the inner surface of the cryostraw (Zhu et al., 1996). However, the authors did not observe suchfindings in human blastocysts nor for adhesion to the inner surfaceof the embryo replacement catheter or to culture dishes. To ourknowledge, this is the first time that the proportion of retainedembryos (retained in the transfer catheter) in a large cohort isreported, both on the basis of the hatching status and on the cycletype. This study did not find any correlation between hatching statusand embryo retention.Another concern regarding expanded blastocysts is the suspected
disadvantage to survival rate after vitrification (Cho et al., 2002).Expanded blastocysts have more blastocoelic fluid, in which ice crystalsmay form during cooling (Cobo et al., 2012). However, with recentadvances in cryopreservation methods (Cobo et al., 2012), the qualityof frozen embryos and their reproductive potential in general is at leastsimilar (Son et al., 2003), if not possibly better than fresh embryos(Rodriguez-Purata et al., 2016). In this study, a similar survival rate inthe NFH and the FH transferred embryos was observed (Table II).This can most likely be linked to the embryo collapsing and leaking fluidimmediately after biopsy; a state in which it remains prior to vitrifica-tion. The rewarming protocol in this study did not differ betweenembryos observed NFH or FH prior to vitrification. Our results sug-gest that embryologists can confidently handle FH embryos similarly toNFH counterparts. Additionally, embryos vitrified at expansion Grade4 or 5 are sometimes observed FH after the rewarming procedure orat the moment of the transfer (Edgar and Gook, 2012). This studyincluded some embryos that underwent this transition. Although BPR,IR and EPL rate from embryos observed FH after rewarming weresimilar, a trend toward poorer results was observed. Furthermore,LBR was statistically lower in such cycles (Fig. 4, Table VI). This scen-ario is most probably explained by the sudden non-physiologic loss ofthe zona’s protection, preventing proper blastocyst apposition forembryo implantation.
BiochemicalPregnancyRate FullyHatched
BiochemicalPregnancy Rate
Non-FullyHatched
ImplantationRate FullyHatched
ImplantationRate Non-Fully
Hatched
Live BirthRate FullyHatched
Live BirthRate Non-
Fully Hatched
EarlyPregnancyLoss Rate
Fully Hatched
EarlyPregnancy
Loss Rate Non-Fully Hatched
Fresh ET FET
0%
10%
20%
30%
40%
50%
60%
70%
80%
*
Figure 5 Clinical outcomes of not fully hatched and fully hatched blastocysts in fresh versus frozen cycles. Error bars represent 95% CI. *P < 0.05.
10 Rodriguez-Purata et al.
at New
York U
niversity on September 28, 2016
http://humrep.oxfordjournals.org/
Dow
nloaded from
Interestingly, we observed high EPL rates across all groups studied(fresh cycles: 20.3% versus 18.2%, P = 0.66; FETs cycles: 18.4% versus22.1%, P = 0.9). Although a significant number of women will suffer aspontaneous abortion without any identifiable abnormality (Saravelos
and Regan, 2014), there are other non-genetic etiologies of EPL(Christiansen et al., 2015). This study‘s finding may be explained by thepresence of polyploidic abnormalities undetected by current PGS tech-nology (Werner et al., 2014), embryos with normal chromosomal
........................................................ ............................................................
.............................................................................................................................................................................................
Table VII Demographic characteristics and embryological data for fresh and FET cycles that did or did not resultin implantation.
Group Fresh Frozen
Implantation No implantation P Implantation No implantation P
Cycles (n) 137 118 340 213
Age (years) at IVF cycle 36.7 ± 4.2 36.6 ± 3.8 NS 36.1 ± 4.1 36.4 ± 4.1 NS
Age (years) at ET cycle 36.7 ± 4.2 36.6 ± 3.8 NS 36.4 ± 4.1 36.9 ± 4.1 NS
BMI (kg/m2) at IVF cycle 23.5 ± 4.3 23.4 ± 4.1 NS 22.9 ± 3.9 23.4 ± 4.1 NS
BMI (kg/m2) at ET cycle 23.5 ± 4.3 23.4 ± 4.1 NS 23.0 ± 3.9 23.4 ± 4.1 NS
Day 3 FSH (mUI/ml) at IVF cycle 6.0 ± 3.0 6.0 ± 3.0 NS 6.0 ± 2.8 5.9 ± 2.8 NS
Day 3 AMH (ng/ml) at IVF cycle 3.4 ± 2.9 3.1 ± 2.8 NS 3.6 ± 4.4 4.0 ± 6.7
Day 3 AFC (n) 14.1 ± 7.8 12.1 ± 5.4 <0.05 13.4 ± 7.2 13.4 ± 8.1 NS
Endometrial thickness (mm, at LH surge) at IVF cycle 10.0 ± 2.1 9.7 ± 2.1 NS 10.0 ± 2.1 9.7 ± 1.9 NS
Endometrial thickness (mm, at LH surge) at transfercycle
10.0 ± 2.1 9.7 ± 2.1 NS 9.1 ± 1.6 8.7 ± 1.3 NS
Follicles >14 mm at LH surge 13.4 ± 6.4 13.3 ± 6.1 NS 13.5 ± 6.6 12.2 ± 6.2 <0.05
E2(pg/ml) at LH surge at IVF cycle 2279.9 ± 1072.4 2571.9 ± 1182.6 <0.05 2522.7 ± 1153.4 2324.2 ± 1125.3 NS
E2 at surge (ET cycle) 2279.9 ± 1072.4 2571.9 ± 1182.6 <0.05 431.4 ± 475.6 388.0 ± 242.6 NS
Oocytes retrieved (n) 17.7 ± 9.6 17.2 ± 9.3 NS 17.4 ± 10.7 16.2 ± 10.6 NS
Oocytes inseminated (n) 13.7 ± 8.5 13.4 ± 7.6 NS 13.5 ± 9.0 12.5 ± 8.8 NS
Embryos ongoing Day 1 (n) 11.1 ± 7.0 11.0 ± 7.4 NS 11.1 ± 7.5 10.0 ± 7.2 NS
Embryos ongoing Day 3 (n) 10.8 ± 6.9 10.9 ± 6.8 NS 10.6 ± 7.2 9.7 ± 6.9 NS
Embryos ongoing Day 5 (n) 8.1 ± 5.7 8.4 ± 5.9 NS 7.0 ± 5.5 6.3 ± 5.0 NS
Embryos ongoing Day 6 (n) 7.6 ± 5.4 7.8 ± 5.7 NS 5.5 ± 4.5 5.2 ± 4.3 NS
Morphology
Expansion
4 6.6% (9/137) 7.6% (9/118) NS 27.9% (95/340) 31.5% (67/213) NS
5 40.9% (56/137) 41.5% (49/118) NS 29.1% (99/340) 23.9% (51/213) NS
6 52.6% (72/137) 50.8% (60/118) NS 42.6% (145/340) 44.6% (95/213) NS
Inner cell mass
A 86.9% (119/137) 74.6% (88/118) 0.05 73.2% (249/340) 50.7% (108/213) <0.05
B 13.1% (18/137) 25.4% (30/118) 0.05 26.8% (91/340) 49.3% (105/213) <0.05
Trophectoderm
A 65.0% (89/137) 53.4% (63/118) NS 29.1% (99/340) 20.7% (44/213) <0.05
B 35% (48/137) 47.5% (56/118) 0.05 50.3% (171/340) 50.2% (107/213) NS
C 20.6% (70/340) 29.1% (62/213) <0.05
Embryos biopsied (n)
Total 6.1 ± 4.3 6.3 ± 4.7 NS 5.7 ± 4.2 5.4 ± 4.0 NS
Day 5 3.9 ± 2.9 4.1 ± 3.3 NS 3.2 ± 3.5 2.7 ± 3.1 NS
Day 6 2.2 ± 2.3 2.2 ± 2.3 NS 2.5 ± 2.0 2.6 ± 2.1 NS
Euploidy rate 60.9% (500/821) 59.7% (447/748) NS 60.6% (1141/1884) 57.4% (638/1111) NS
Embryos vitrified (n) 3.6 ± 3.7 3.8 ± 3.9 NS 5.3 ± 4.1 4.9 ± 3.8 NS
Survival rate NA NA 96.6% (372/385) 96.6% (226/234) NS
Retained embryos at transfer 1.5% (2/137) 5.1% (6/118) NS 0.6% (2/340) 1.4% (3/213) NS
Results are expressed as mean ± SD. Significance established at P < 0.05.
11Reproductive outcomes of fully hatched blastocysts
at New
York U
niversity on September 28, 2016
http://humrep.oxfordjournals.org/
Dow
nloaded from
segregation but not with enough cytoplasmic quality to result in a fullycapable embryo or chromosomal mosaicism (Taylor et al., 2014) andall these in conjunction with conservative interpretations of geneticresults.Fresh cycles in which FH embryos were selected for transfer were
more likely to originate from cycles with a higher average number ofongoing embryos on d3, d5 and d6 compared with cycles in whichNFH embryos are selected (Table I). This was not observed in theplanned freeze-all/FET cycle group. Because all embryos undergo thesame handling until embryo disposition decision (ET or vitrification),the authors do not believe this variable impacted results although itsuggests that there may be an unstated preference among someembryologists for selection of an FH embryo for fresh transfer whenthe option is available.In spite of the numerous efforts taken to avoid biases in the study,
some limitations have persisted. First, the retrospective nature of thestudy creates a selection bias. Second, although most of the patientswho underwent an IVF/PGS cycle were characteristically ‘normal’ or‘good’ responders, this study was not limited to them. Third, we rec-ognize that not all patients, regardless of COH response, develophigh-quality blastocysts; therefore, this approach is not suitable forevery patient. Specifically during the period of this study, there were1953 planned PGS/PGD cycles, of which 20.7% (n = 404) were can-celed before biopsy. Only 41.4% (n = 808) of the cycles were eligiblefor this study. Fourth, the impetus to use PGS has evolved in ‘Fresh’and ‘FET’ groups. PGS in patients undergoing a fresh transfer is primar-ily employed to circumvent the age-related increase in aneuploidy andminimize the interval to a successful pregnancy. However, the majorityof patients undergoing freeze-all cycles have been affected by a geneticdisease (i.e. a single gene disorder) and encounter a lag period beforeobtaining genetic interpretation, thus preventing their ability to pursuea fresh transfer. While increasingly more patients are being steeredtoward a freeze-all approach given the potential of increased PRs, per-sistent differences in PGS indication could impact aneuploidy and/orcancellation rates. Nevertheless, pregnancy outcomes would not beexpected to significantly change, as all study patients had at least oneeuploid embryo available for transfer. Finally, while the study wasappropriately powered to detect substantial differences in IR betweenNFH versus FH embryos, it was not powered to detect significancewhen analyzing the specific moment that the transferred embryo wasobserved FH. Findings within the small number of patients included ineach subgroup denied us the ability to draw definite conclusions,
although the results find no support for an impact of the timing ofembryo hatching on IRs.As the use of ART continues to increase worldwide, it remains of
the utmost importance to maintain the safety of techniques used.These manipulations include ECM, ICSI, assisted hatching, PGS and vit-rification. In combination with all these strategies, oocyte and embryohandling is also a delicate part of the IVF process that continues toimprove. This study suggests that these interventions have no detect-able negative impact on clinical outcomes. Nevertheless, the fact thata pregnancy is established does not preclude the presence of under-lying anomalies. Therefore, gene expression studies that evaluateintervention versus nonintervention are needed to subsequentlydetermine any potential non-genomic effects. While the results of thisstudy cannot currently lead to any definitive clinical recommendations,we found no evidence of altered IR or clinical outcomes with the trans-fer of FH euploid embryos.
Authors’ rolesJ.R.P.: drafted the manuscript, analyzed and interpreted the data; J.G.:writing and statistical support; J.A.L.: editing; M.C.W.: query design;R.S. and C.B.J. embryologist involved in PGS cases, editing; A.B.C.:revision of intellectual content and final version of the manuscript; B.S.:intellectual design and final version of the manuscript.
FundingJG is funded by MSTP grant T32 GM007280 (NIH). No additionalfunding was received.
Conflict of interestNone declared.
ReferencesCervantes E, Lee J, Slifkin R, Duke M, Sandler B, Copperman A.Morphologic assessment of human blastocyst on day 5 and day 6: whichday is more associated with comprehensive chromosome screeningresults? Fertil Steril 2013;100:S207.
Cho HJ, Son WY, Yoon SH, Lee SW, Lim JH. An improved protocol fordilution of cryoprotectants from vitrified human blastocysts. HumReprod 2002;17:2419–2422.
..................................................................... ......................................................................
.............................................................................................................................................................................................
Table VIII Clinical outcomes in non-PGD cases (only single ET cycles).
Fresh Frozen
NFH FH P NFH FH P
Cycles (n) 1676 3 602 86
Biochemical pregnancy rate 37.8% (634/1676)(95% CI: 0.35–0.40)
33.3% (1/3)(95% CI: 0.01–0.91)
0.87 50.7% (305/602)(95% CI: 0.47–0.55)
53.5% (46/86)(95% CI: 0.42–0.64)
0.62
Clinical pregnancy rate 28.8% (483/1676)(95% CI: 0.27–0.31)
0% (0/3) 0.27 37.2% (222/602)(95% CI: 0.33–0.41)
34.9% (30/86)(95% CI: 0.25–0.46)
0.71
Early pregnancy loss rate 14.9% (250/1676)(95% CI: 0.13–17)
33.3% (1/3)(95% CI: 0.01–0.91)
0.37 21.9% (132/602)(95% CI: 0.19–0.25)
27.9% (24/86)(95% CI: 0.19–0.39)
0.21
Binomial CIs for all reported proportions. Adjusted OR and their 95% CIs. Significance established at P < 0.05.
12 Rodriguez-Purata et al.
at New
York U
niversity on September 28, 2016
http://humrep.oxfordjournals.org/
Dow
nloaded from
Christiansen OB, Nybo Andersen AM, Bosch E, Daya S, Delves PJ, HviidTV, Kutteh WH, Laird SM, Li TC, van der Ven K. Evidence-based inves-tigations and treatments of recurrent pregnancy loss. Fertil Steril 2005;83:821–839.
Cobo A, de los Santos MJ, Castello D, Gamiz P, Campos P, Remohi J.Outcomes of vitrified early cleavage-stage and blastocyst-stage embryosin a cryopreservation program: evaluation of 3,150 warming cycles. FertilSteril 2012;98:1138–1146. e1131.
Cohen J, Alikani M, Trowbridge T, Rosenwaks Z. Implantation enhancement byselective assisted hatching using zona drilling of human embryos with poorprognosis.Hum Reprod 1992;7:685–691.
Cole RJ. Cinemicrographic observations on the trophoblast and zona pellu-cida of the mouse blastocyst. J Embryol Exp Morphol 1967;17:481–490.
Edgar D, Gook D. A critical appraisal of cryopreservation (slow coolingversus vitrification) of human oocytes and embryos. Hum Reprod Update2012;18:536–554.
Fragouli E, Alfarawati S, Spath K, Jaroudi S, Sarasa J, Enciso M, Wells D.The origin and impact of embryonic aneuploidy. Hum Genet 2013;132:1001–1013.
Franasiak J, Forman E, Hong K, Werner M, Upham K, Treff N, Scott R. Jr. Thenature of aneuploidy with increasing age of the female partner: a review of15,169 consecutive trophectoderm biopsies evaluated with comprehensivechromosomal screening. Fertil Steril 2014;101:656–663.
Gardner DK, Schoolcraft WB. In vitro culture of human blastocysts. In:Jansen R, Mortimer D (eds). Towards Reproductive Certainty: Infertility andGenetics Beyond. Carnforth Parthenon Press, 1999,378–388.
Gardner DK, Vella P, Lane M, Wagley L, Schlenker T, Schoolcraft WB.Culture and transfer of human blastocysts increases implantation rates andreduces the need for multiple embryo transfers. Fertil Steril 1998;69:84–88.
Glujovsky D, Blake D, Farquhar C, Bardach A. Cleavage stage versusblastocyst stage embryo transfer in assisted reproductive technology.Cochrane Database Syst Rev 2012 Jul 11;7:CD002118.
Gonzales DS, Bavister BD. Zona pellucida escape by hamster blastocystsin vitro is delayed and morphologically different compared with zonaescape in vivo. Biol Reprod 1995;52:470–480.
Hardarson T, Van Landuyt L, Jones G. The blastocyst. Hum Reprod 2012;27:i72–i91.
Hiraoka K, Hiraoka K, Kinutani M, Kinutani K. Blastocoele collapse bymicropipetting prior to vitrification gives excellent survival and preg-nancy outcomes for human day 5 and 6 expanded blastocysts. HumReprod 2004;19:2884–2888.
Jones AE, Wright G, Kort HI, Straub RJ, Nagy ZP. Comparison oflaser-assisted hatching and acidified Tyrode’s hatching by evaluation ofblastocyst development rates in sibling embryos: a prospective rando-mized trial. Fertil Steril 2006;85:487–491.
Kroener L, Ambartsumyan G, Briton-Jones C, Dumesic D, Surrey M,Munné S, Hill D. The effect of timing of embryonic progression onchromosomal abnormality. Fertil Steril 2012;98:876–880.
Luna M, Copperman AB, Duke M, Ezcurra D, Sandler B, Barritt J. Humanblastocyst morphological quality is significantly improved in embryosclassified as fast on day 3 (≥10 cells), bringing into question currentembryological dogma. Fertil Steril 2008;89:358–363.
Massip A, Mulnard J, Vanderzwalmen P, Hanzen C, Ectors F. The behaviorof cow blastocyst in vitro: cinematographic and morphometric analysis. JAnat 1982;134:399–405.
Montag M, Koll B, Holmes P, van der Ven JM. Significance of the number ofembryonic cells and the state of the zona pellucida for hatching of mouseblastocysts in vitro versus in vivo. Biol Reprod 2000;62:1738–1744.
Niimura S, Ogata T, Okimura A, Sato T, Uchiyama Y, Seta T, NakagawaH, Nakagawa K, Tamura Y. Time-lapse videomicrographic observationsof blastocyst hatching in cattle. J Reprod Dev 2010;56:649–54.
Practice Committees of the ASRM and SART. Blastocyst culture and trans-fer in clinical-assisted reproduction: a committee opinion. Fertil Steril2013;99:667–672.
Practice Committees of the ASRM and SART. Role of assisted hatching inin vitro fertilization: a guideline. Fertil Steril 2014;102:348–351.
Rodriguez-Purata J, Lee J, Whitehouse M, Duke M, Grunfeld L, Sandler B,Copperman A, Mukherjee T. Reproductive outcome is optimized bygenomic embryo screening, vitrification, and subsequent transfer into aprepared synchronous endometrium. J Assist Reprod Genet 2016;33:401–412.
Saravelos SH, Regan L. Unexplained recurrent pregnancy loss. ObstetGynecol Clin North Am 2014;41:157–166.
Scott RT Jr, Upham KM, Forman EJ, Hong KH, Scott KL, Taylor D, Tao X,Treff NR. Blastocyst biopsy with CCS and fresh embryo transfer signifi-cantly increases IVF implantation and delivery rates: a randomized con-trolled trial. Fertil Steril 2013;100:697–703.
Shapiro BS, Daneshmand ST, Garner FC, Aguirre M, Ross R. Contrastingpatterns in IVF pregnancy rates among fresh autologous, fresh oocytedonor, and cryopreserved cycles with the use of day 5 or day 6 blasto-cysts may reflect differences in embryo-endometrium synchrony. FertilSteril 2008;89:20–26.
Son WY, Yoon SH, Yoon HJ, Lee SM, Lim JH. Pregnancy outcome fol-lowing transfer of human blastocysts vitrified on electron microscopygrids after induced collapse of the blastocoele. Hum Reprod 2003;18:137–139.
Sunderam S, Kissin DM, Flowers L, Anderson JE, Folger SG, Jamieson DJ,Barfield WD, Centers for Disease Control and Prevention (CDC).Assisted reproductive technology surveillance-United States, 2009.MMWR Surveill Summ 2012;61:1–23.
Taylor TH, Gitlin SA, Patrick JL, Crain JL, Wilson JM, Griffin DK. The origin,mechanisms, incidence and clinical consequences of chromosomalmosaicism in humans. Hum Reprod Update 2014;20:571–581.
Thomas MR, Sparks AE, Ryan GL, Van Voorhis BJ. Clinical predictors ofhuman blastocyst formation and pregnancy after extended embryo cultureand transfer. Fertil Steril 2010;94:543–548.
Treff NR, Tao X, Ferry KM, Su J, Taylor D, Scott RT Jr. Development andvalidation of an accurate quantitative real-time PCR-based assay forhuman blastocyst comprehensive chromosomal aneuploidy screening.Fertil Steril 2012;97:819–824.
Vega M, Breborowicz A, Moshier EL, McGovern PG, Keltz MD.Blastulation rates decline in a linear fashion from euploid to aneuploidembryos with single versus multiple chromosomal errors. Fertil Steril2014;102:394–398.
Werner MD, Leondires MP, Schoolcraft WB, Miller BT, Copperman AB,Robins ED, Arredondo F, Hickman TN, Gutmann J, Schillings WJ et al.Clinically recognizable error rate after the transfer of comprehensivechromosomal screened euploid embryos is low. Fertil Steril 2014;102:1613–1618.
Werner MD, Scott RT Jr, Treff NR. 24-chromosome PCR for aneuploidyscreening. Curr Opin Obstet Gynecol 2015;27(3):201–205.
Wright RW Jr, Anderson GB, Cupps PT, Drost M. Blastocyst expan-sion and hatching of bovine ova cultured in vitro. J Anim Sci 1976;43:170–174.
Zhu SE, Sakurai T, Edashige K, Machida T, Kasai M. Cryopreservation ofzona hatched mouse blastocysts. J Reprod Fertil 1996;1071:37–42.
13Reproductive outcomes of fully hatched blastocysts
at New
York U
niversity on September 28, 2016
http://humrep.oxfordjournals.org/
Dow
nloaded from