HASCOL RATIO ANALYSIS REPORT
50
HASCOL PETROLEUM LIMITED INTRODUCTION______________________________________________________________________________3 PURPOSE OF STUDY__________________________________________________________________________5 EXECUTIVE SUMMARY_______________________________________________________________________6 HASCOL PETROLEUM LIMITED_____________________________________________________________7 FUTURE GAME PLAN :___________________________________________________8 VISSION STATMENT:____________________________________________________8 FINANCIAL STATEMENTS_________________________________________________9 BALANCE SHEET: __________________________________________________________9 PROFIT AND LOSS ACCOUNT: _______________________________________________11 RATIO ANALYSIS:___________________________________________________________________________12 LEVERAGE RATIOS:__________________________________________________________________________13 LONG TERM DEBT RATIO:_______________________________________________13 INTERPRETATION__________________________________________________________13 CONCLUSION______________________________________________________________13 DEBT TO EQUITY RATIO:_______________________________________________14 INTERPRETATION__________________________________________________________14 CONCLUSION______________________________________________________________14 TOTAL DEBT RATIO:___________________________________________________15 INTERPRETATION__________________________________________________________15 CONCLUSION______________________________________________________________15 TIME INTEREST EARNED:_______________________________________________16 INTERPRETATION__________________________________________________________16 CONCLUSION______________________________________________________________16 CASH COVERAGE RATIO:________________________________________________17 INTERPRETATION__________________________________________________________17 CONCLUSION______________________________________________________________17 LIQUIDITY RATIOS:_________________________________________________________________________18 CURRENT RATIO_______________________________________________________18 INTERPRETATION__________________________________________________________18 CONCLUSION______________________________________________________________18 QUICK RATIO:________________________________________________________19 INTERPRETATION__________________________________________________________19 CONCLUSION______________________________________________________________19 1
-
Upload
naveed-farooq -
Category
Business
-
view
470 -
download
1
description
This is the report of HASCOL PETROLEUM'S PAKISTAN LTD ratios. It contains analysis of 3 years from 2011 to 2013. Hope this will benefit you in your finance studies and project.
Transcript of HASCOL RATIO ANALYSIS REPORT
HASCOL PETROLEUM LIMITED
INTRODUCTION______________________________________________________________3
PURPOSE OF STUDY__________________________________________________________5
EXECUTIVE SUMMARY_______________________________________________________6
HASCOL PETROLEUM LIMITED_______________________________________________7
FUTURE GAME PLAN :____________________________________________________________8
VISSION STATMENT:______________________________________________________________8
FINANCIAL STATEMENTS_________________________________________________________9BALANCE SHEET: _______________________________________________________________________9PROFIT AND LOSS ACCOUNT: ___________________________________________________________11
RATIO ANALYSIS:____________________________________________________________12
LEVERAGE RATIOS:_________________________________________________________13
LONG TERM DEBT RATIO:_______________________________________________________13INTERPRETATION______________________________________________________________________13CONCLUSION__________________________________________________________________________13
DEBT TO EQUITY RATIO:________________________________________________________14INTERPRETATION______________________________________________________________________14CONCLUSION__________________________________________________________________________14
TOTAL DEBT RATIO:_____________________________________________________________15INTERPRETATION______________________________________________________________________15CONCLUSION__________________________________________________________________________15
TIME INTEREST EARNED:________________________________________________________16INTERPRETATION______________________________________________________________________16CONCLUSION__________________________________________________________________________16
CASH COVERAGE RATIO:________________________________________________________17INTERPRETATION______________________________________________________________________17CONCLUSION__________________________________________________________________________17
LIQUIDITY RATIOS:__________________________________________________________18
CURRENT RATIO________________________________________________________________18INTERPRETATION______________________________________________________________________18CONCLUSION__________________________________________________________________________18
QUICK RATIO:___________________________________________________________________19INTERPRETATION______________________________________________________________________19CONCLUSION__________________________________________________________________________19
CASH RATIO:____________________________________________________________________20INTERPRETATION______________________________________________________________________20CONCLUSION__________________________________________________________________________20
NET WORKING CAPITAL:________________________________________________________21INTERPRETATION______________________________________________________________________21CONCLUSION__________________________________________________________________________21
1

HASCOL PETROLEUM LIMITED
NET WORKING CAPITAL TURNOVER:____________________________________________22INTERPRETATION______________________________________________________________________22CONCLUSION__________________________________________________________________________22
EFFICIENCY RATIOS________________________________________________________23
TOTAL ASSETS TURNOVER:______________________________________________________23INTERPRETATION______________________________________________________________________23CONCLUSION__________________________________________________________________________23
FIXED ASSETS TURNOVER:_______________________________________________________24INTERPRETATION______________________________________________________________________24CONCLUSION__________________________________________________________________________24
INVENTORY TURNOVER:________________________________________________________25INTERPRETATION______________________________________________________________________25CONCLUSION__________________________________________________________________________25
DAYS’ SALES IN INVENTORIES:__________________________________________________26INTERPRETATION______________________________________________________________________26CONCLUSION__________________________________________________________________________26
RECEIVABLE TURNOVER:_______________________________________________________27INTERPRETATION______________________________________________________________________27CONCLUSION__________________________________________________________________________27
DAYS SALES IN INVENTORIES:___________________________________________________28INTERPRETATION______________________________________________________________________28CONCLUSION__________________________________________________________________________28
PROFITABILITY RATIOS:_____________________________________________________29
NET PROFIT MARGIN:___________________________________________________________29INTERPRETATION______________________________________________________________________29CONCLUSION__________________________________________________________________________29
RETURN ON ASSETS:_____________________________________________________________30INTERPRETATION______________________________________________________________________30CONCLUSION__________________________________________________________________________30
RETURN ON EQUITY:____________________________________________________________31INTERPRETATION______________________________________________________________________31CONCLUSION__________________________________________________________________________31
EARNING PER SHARE:___________________________________________________________32INTERPRETATION______________________________________________________________________32CONCLUSION__________________________________________________________________________32
EQUITY MULTIPLIER:___________________________________________________________33INTERPRETATION______________________________________________________________________33CONCLUSION__________________________________________________________________________33
DUPONT ANALYSIS:______________________________________________________________34INTERPRETATION______________________________________________________________________34
2
HASCOL PETROLEUM LIMITED
INTRODUCTIONIn the current economic conditions, to understand the financial workings and get the assistance about the competition in business is the key to success. The analysis of financial statement is important to analyze the company’s performance. Financial statements tell about the past period and predict the future. Therefore, it is important to have the authentic information for correct decision making which leads to success.
Managers always refer the financial ratios because they the performance of business units and the company. Managers are also concerned with the company’s ability that whether it is able to finance its future expansion or not. The ratio analysis helps the financial analysts to study the performance of investments and determine the value of company by forecasting its future earnings.
In this report, we have been assigned a project in which the ratio analysis of the company is extracted and interpreted. In this report, we have tried our best to express our learning throughout the semester. The ratio analysis is extracted to show the company’s strength and weaknesses and determines whether the company is sufficiently liquid to meet its current obligations or not. It shows the company’s credit worthiness, efficient utilization of its assets and profitability.
This report analyzes the financial statements of Hascol Petroleum Limited for three years in which the contrast of company’s performance is also measured for each year. This report provides information obtained through ratio analysis regarding the profitability, liquidity and financial stability of Hascol Petroleum Limited for three years. This report will pay particular attention to the earning power, liquidity & credit management, inventory management and debt management. It will also highlight major strengths and weaknesses with explanation for observed changes. The report will also comment on the prospects of the company and make recommendations that would improve Hascol Petroleum Pakistan’s current performance.
3
HASCOL PETROLEUM LIMITED
PURPOSE OF STUDY
The purpose of this study is to analyze the financial statements of Hascol Petroleum and to extract and interpret the ratio analysis by the data provided in the financial statements. In this report, the applications of finance are applied through financial ratios and the results are interpreted to bring the light upon the performance of Hascol Petroleum. The financial ratios are taken of the three years and they are compared with the base year and thus, the performance of Hascol Petroleum is studied with the graphical representation. In accordance with the result, the prospects for the company and recommendations are passed on.
4
HASCOL PETROLEUM LIMITED
EXECUTIVE SUMMARYThe ratio analysis of Hascol Petroleum Limited has been extracted and interpreted for three years. Interpretation has been followed through by considering 2010 as base year. According to the analysis, Hascol Petroleum Limited is considered to be highly leveraged because of high long term debt ratio, high debt equity ratio and high total debt ratio. This indicates the higher risk for the company especially under the fluctuations of interest rates because the equity and capital and less than the company’s debt. Furthermore, time interest earned has increased but it is still too minimal to be considered as ideal. So, the company’s earnings are more than its interest payable but not the ideal one whereas the company’s ability to pay for its cash has been decreased as compare to the base year, therefore, little amount is left for other operations.
The liquidity ratios for Hascol show that the company is able to pay for its current liabilities with minor fluctuations over the years. The Quick Ratio analysis shows that the company’s present conditions are fair enough but not the ideal ones because the potential reservoir of cash (net working) capital becomes negative after meeting the current liabilities. The company’s cash reservoirs appear to be lower than its assets.
The efficiency ratio shows that the company has worked close to its capacity and the trend for asset turnover decreases whereas the average collection period has become quite efficient. The company’s ability to turnover its inventories has also increased by the period of time and the company possesses sufficient inventory to maintain its sales which benefits the company from the continuous appraisal in the cost of raw materials and inflation.
The profitability ratios show that the company’s operating profit margin has increased whereas gross profit margin has decreased. The utilization of assets has seen increasing trend whereas shareholder’s equity throughout the year has decreased. The Earnings per share have improved as compared to the base year.
The company depends on the activities Petroleum’s Products. Company’s sales are good but it also have an area to grow because new vehicles are increasing day by day in the country.
The interpretation of ratio analysis has also come with some recommendation to improve the company’s current condition. The company has become dependent on debt therefore, company should decrease its debt and start increasing its equity with the help of decreasing its expenses, becoming more cost efficient, increasing its sales volume and selling its outstanding number of shares.
5
HASCOL PETROLEUM LIMITED
HASCOL PETROLEUM LIMITED
Hascol Petroleum Limited is engaged in the purchase, storage and sale of petroleum products such as Fuel Oil, High Speed Diesel, Gasoline, Jet A-1, LPG and Lubricants.
The company was incorporated in 2001 under the Companies Ordinance 1984, primarily to take advantage of the petroleum sector deregulation and undertake a program for owning, leasing and renting oil storage facilities as well as importing petroleum products for its own account.
In February 2005 Hascol was granted a full marketing license by the Government of Pakistan and since then, Hascol has been engaged in developing a retail network under HASCOL brand and by 31st December 2012 we have commissioned two hundred retail outlets, in the three provinces of Pakistan. This number will rise to 250 by the end of 2013.
Hascol is also developing storage facilities at Machike and Shikarpur. Work is already completed at Shikarpur, and land has been acquired at Machike and work is in progress. At Keamari Hascol has leased tankage at Al-Rahim Terminal.
Hascol has in place Hospitality arrangements with Pakistan State Oil Company & Shell Pakistan for storage and handling of products at Keamari, Shikarpur, Machike and Sahiwal.
Prior to the incorporation of the company, the main personnel have been involved in the Pakistan oil industry for over thirty years, dealing with imports and marketing of refined products such as Gasoil, Fuel Oil, Kerosene, Gasoline and Base Oil. Hascol Petroleum Limited has, independently or through its associated company Hascombe Limited, extensive links with the domestic and international oil trading companies.
Hascol has concluded arrangements with Fuchs Lubricants of Germany to produce and market full range of Automotive / Industrial Lubricants & Greases. In the initial stages, Hascol is getting the lubricants blended under a Toll Blending Agreement and will subsequently put up its own blending plant in Karachi. Hascol is a major supplier of Lubricants to the Pakistan Army.
Hascol has started a Bunkering Division and will be able to provide bonded supplies of High Sulphur Fuel Oil (HSFO) and Marine Gas Oil (MGO) at Karachi and Port Qasim. Additionally, we have a full range of Fuchs Marine Lubricants at competitive prices.
Hascol has signed a Technical Services Agreement (TSA) with Emirates National Oil Company Limited (E.N.O.C) UAE, to start aircraft refueling services at Karachi and other main airports in
6
HASCOL PETROLEUM LIMITED
Pakistan. We have applied for land at Karachi Airport and as soon as Civil Aviation Authority allocates the land we will start aircraft refueling service.
Hascol has also started to market LPG as an automotive fuel through its retail network, and for this necessary license has been obtained from OGRA and supply arrangements have been made with well known LPG marketing companies in Pakistan.
FUTURE GAME PLAN :
HPL has double its sale volume and profitability on year to year basis. During the last three years this growth has resulted in the market share from 1% to 2.6% up to October 2013,from 2014 and onwards within 2 years the company has a target to achieve a volume of 1,000,000 MT with a market share of 5%.this growth will be achieve through
Completion of its Machike installation. Development of the installation at Mehmood kot . Increase in its retail outlets from 210 to 219 by the
end 0f 2016. Developed of air craft refueling station (JET-A1) at Karachi Airport. After PSO, HPL is
the only OMC which has got a TSA from an international operator to sell JET A-1 to airline.
Development of lubricants and grease plant by end of 2016.
VISSION STATMENT:
To developed a robust foundation of an oil marketing company ,with a well respected and are putted brand using innovation way of doing business in alignment with best business and our practice an “ZERO HARM CHATER”
7

HASCOL PETROLEUM LIMITED
FINANCIAL STATEMENTS
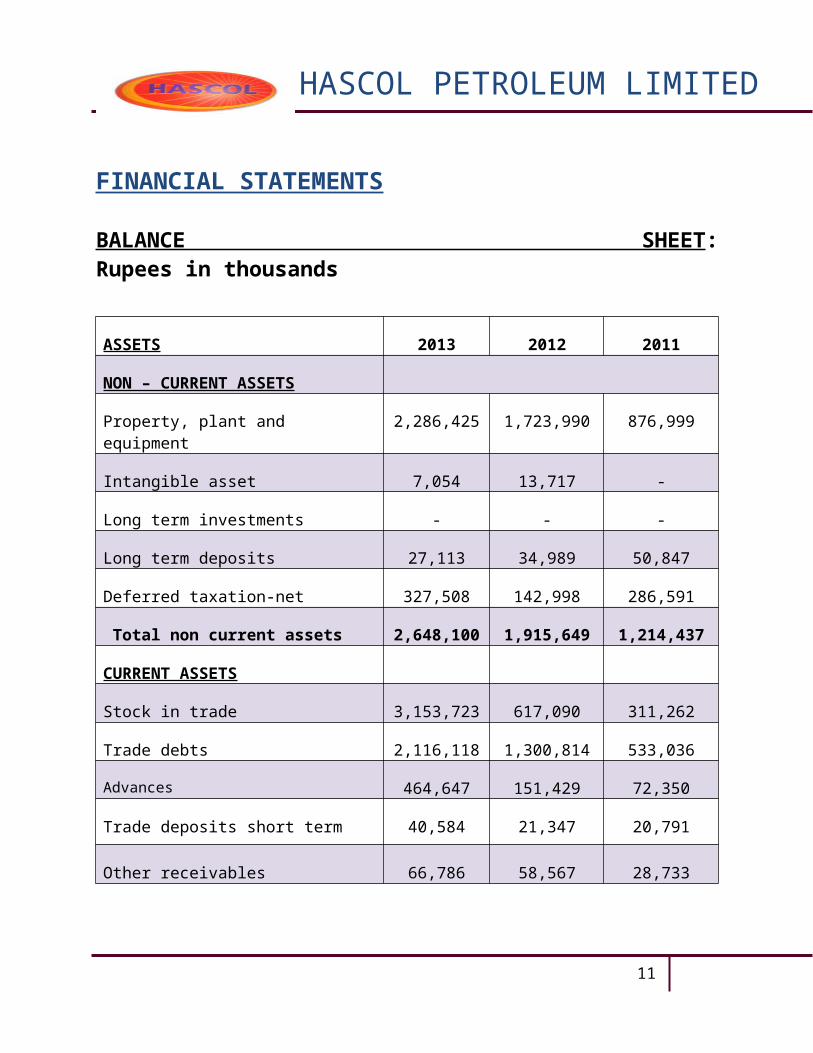
BALANCE SHEET: Rupees in thousands
ASSETS 2013 2012 2011
NON – CURRENT ASSETS
Property, plant and equipment 2,286,425 1,723,990 876,999
Intangible asset 7,054 13,717 -
Long term investments - - -
Long term deposits 27,113 34,989 50,847
Deferred taxation-net 327,508 142,998 286,591
Total non current assets 2,648,100 1,915,649 1,214,437
CURRENT ASSETS
Stock in trade 3,153,723 617,090 311,262
Trade debts 2,116,118 1,300,814 533,036
Advances 464,647 151,429 72,350
Trade deposits short term 40,584 21,347 20,791
Other receivables 66,786 58,567 28,733
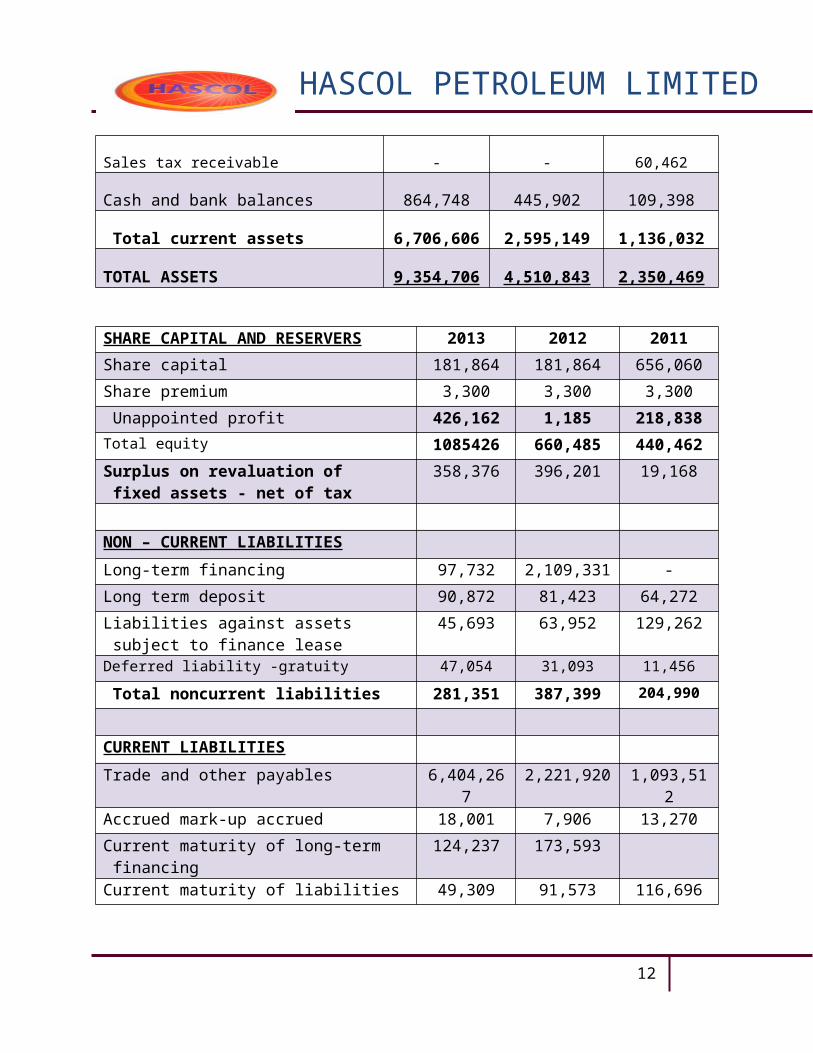
Sales tax receivable - - 60,462
Cash and bank balances 864,748 445,902 109,398
Total current assets 6,706,606 2,595,149 1,136,032
TOTAL ASSETS 9,354,706 4,510,843 2,350,469
8

HASCOL PETROLEUM LIMITED
SHARE CAPITAL AND RESERVERS 2013 2012 2011
Share capital 181,864 181,864 656,060
Share premium 3,300 3,300 3,300
Unappointed profit 426,162 1,185 218,838
Total equity 1085426 660,485 440,462
Surplus on revaluation of fixed assets - net of tax
358,376 396,201 19,168
NON – CURRENT LIABILITIES
Long-term financing 97,732 2,109,331 -
Long term deposit 90,872 81,423 64,272
Liabilities against assets subject to finance lease
45,693 63,952 129,262
Deferred liability -gratuity 47,054 31,093 11,456
Total noncurrent liabilities 281,351 387,399 204,990
CURRENT LIABILITIES
Trade and other payables 6,404,267 2,221,920 1,093,512
Accrued mark-up accrued 18,001 7,906 13,270
Current maturity of long-term financing
124,237 173,593
Current maturity of liabilities against assets
49,309 91,573 116,696
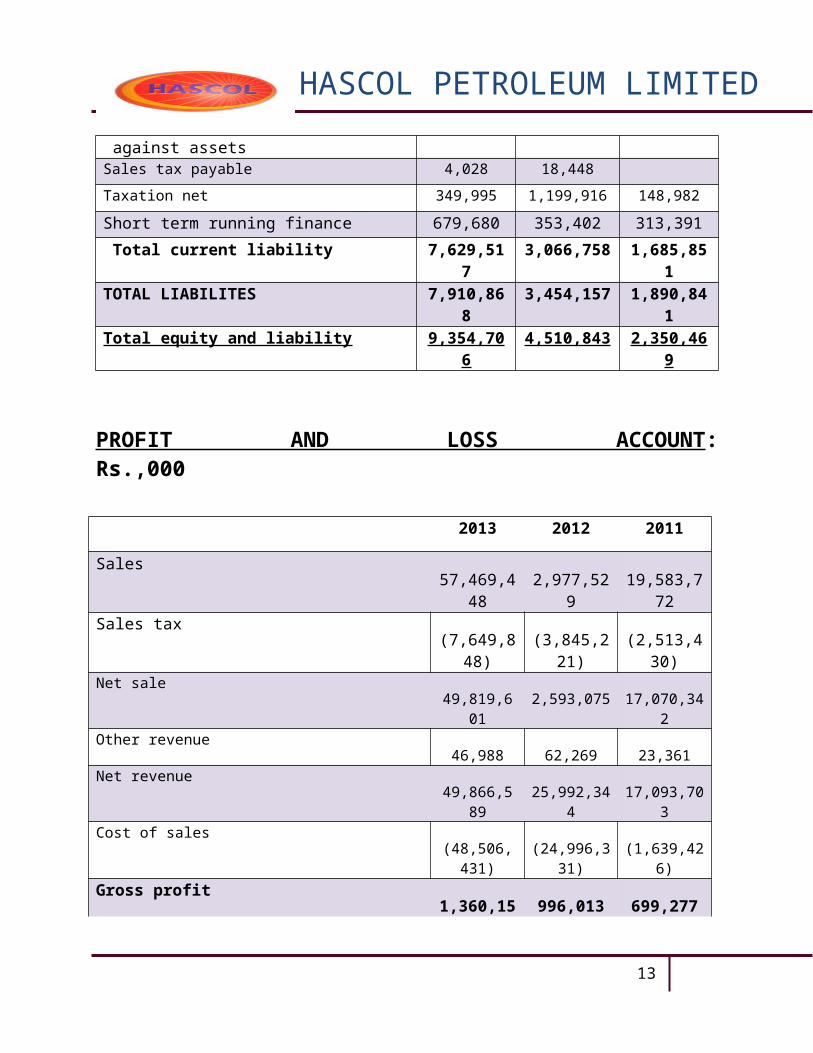
Sales tax payable 4,028 18,448
Taxation net 349,995 1,199,916 148,982
Short term running finance 679,680 353,402 313,391
Total current liability 7,629,517 3,066,758 1,685,851
TOTAL LIABILITES 7,910,868 3,454,157 1,890,841
Total equity and liability 9,354,706 4,510,843 2,350,469
9

HASCOL PETROLEUM LIMITED
PROFIT AND LOSS ACCOUNT: Rs.,000
2013 2012 2011
Sales 57,469,448 2,977,529 19,583,772
Sales tax(7,649,848) (3,845,221) (2,513,430)
Net sale49,819,601 2,593,075 17,070,342
Other revenue46,988 62,269 23,361
Net revenue49,866,589 25,992,344 17,093,703
Cost of sales(48,506,431) (24,996,331) (1,639,426)
Gross profit 1,360,158 996,013 699,277
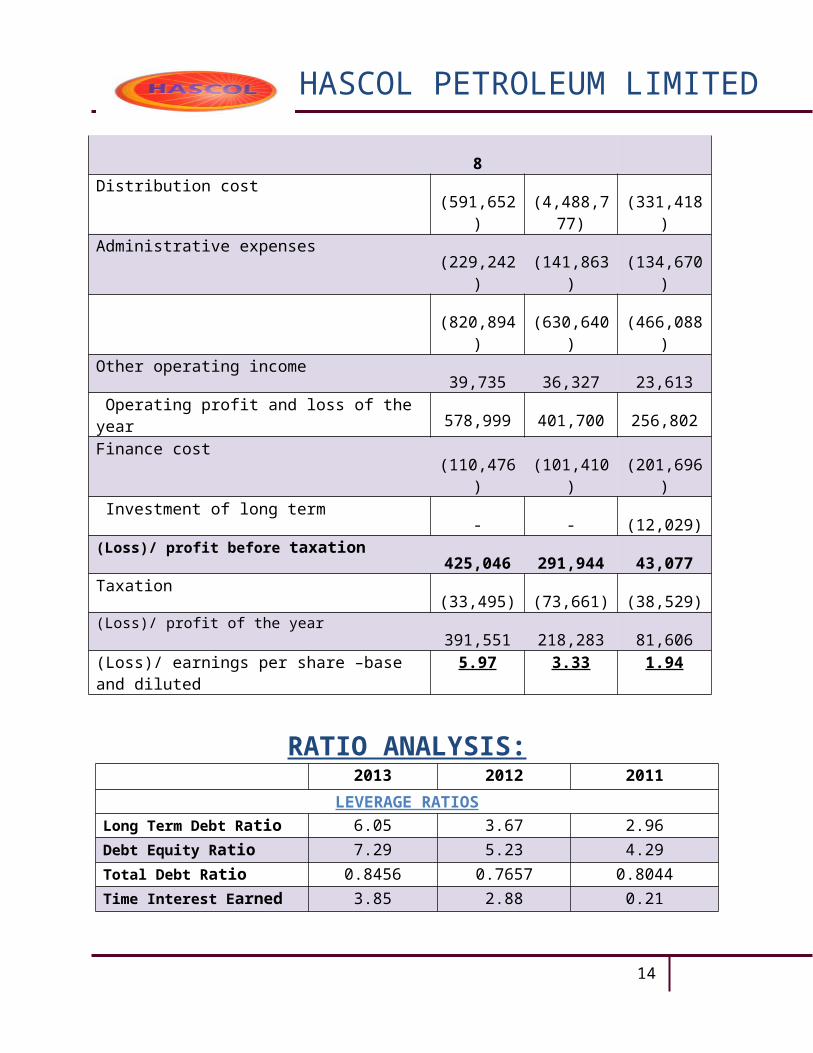
Distribution cost (591,652) (4,488,777) (331,418)
Administrative expenses (229,242) (141,863) (134,670)
(820,894) (630,640) (466,088)
Other operating income 39,735 36,327 23,613
Operating profit and loss of the year578,999 401,700 256,802
Finance cost (110,476) (101,410) (201,696)
Investment of long term- - (12,029)
(Loss)/ profit before taxation425,046 291,944 43,077
Taxation (33,495) (73,661) (38,529)
(Loss)/ profit of the year391,551 218,283 81,606
(Loss)/ earnings per share –base and diluted 5.97 3.33 1.94
10
HASCOL PETROLEUM LIMITED
RATIO ANALYSIS: 2013 2012 2011
LEVERAGE RATIOSLong Term Debt Ratio 6.05 3.67 2.96
Debt Equity Ratio 7.29 5.23 4.29
Total Debt Ratio 0.8456 0.7657 0.8044
Time Interest Earned 3.85 2.88 0.21
Cash Coverage Ratio 4.72 3.57 0.46
LIQUIDITY RATIOSCurrent Ratio 0.8790 0.8462 0.6739
Quick Ratio 0.4656 0.6450 0.4892
Cash Ratio 11.09% 14.54% 6.94%
Net Working Capital -922911 -471609 -549819
NWC turnover -53.98 -54.98 -31.05
EFFICIENCY RATIOSFixed assets turnover 21.07 15.54 16.13
Total Asset Turnover 5.32 5.75 7.26
Inventory Turnover 15.38 40.51 52.67
Days’ Sales in Inventories 23.73 days 9.01 days 6.93 day
Receivable turnover 27.16 22.89 36.74
Days sales in receivable 13.44days 15.94days 9.93days
PROFITABILITY RATIOSProfit Margin 0.78% 0.84% 0.47%
Return on Assets 4.18% 4.84% 3.47%
Earning per Share 5.97 3.33 1.93
Price earning ratio 1.67 3 5.15
Return on equity 0.36072 0.33049 0.18527
Equity multiplier 8.6182 6.7352 5.3364
DUPONT RATIODuPont Ratio 0.36072 0.33049 0.18527
11
HASCOL PETROLEUM LIMITED
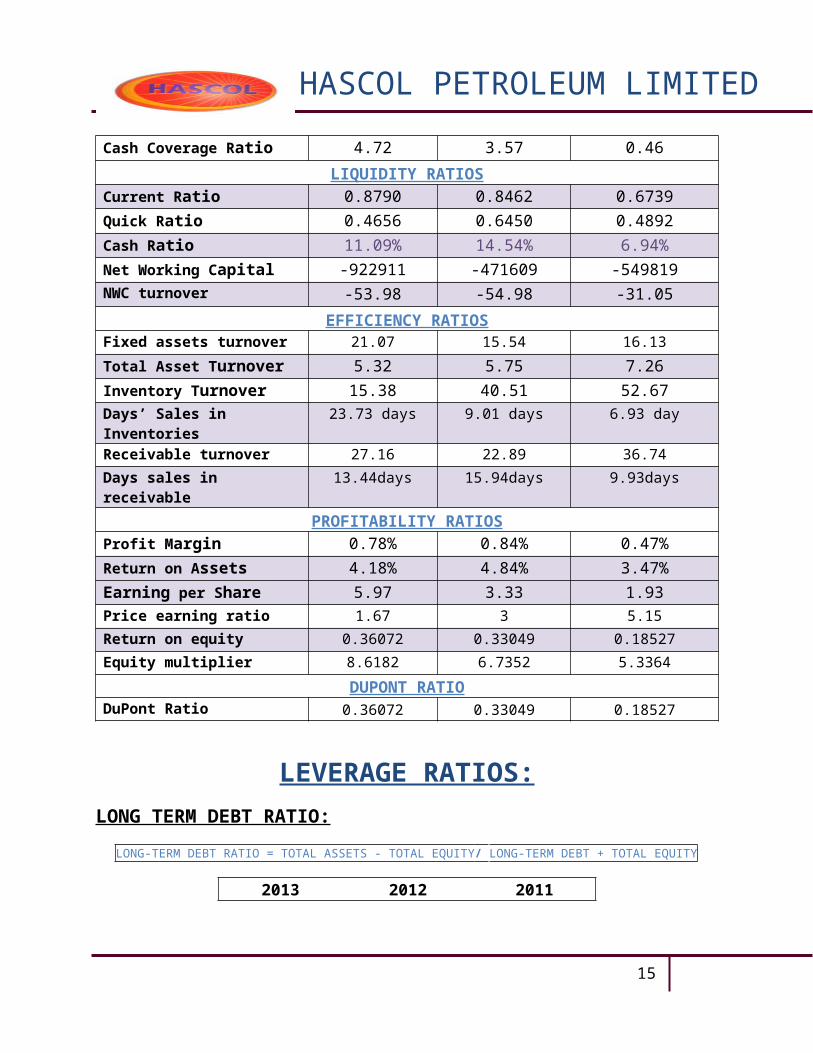
LEVERAGE RATIOS:LONG TERM DEBT RATIO:
LONG-TERM DEBT RATIO = TOTAL ASSETS - TOTAL EQUITY/ LONG-TERM DEBT + TOTAL EQUITY
2013 2012 20116.05 3.67 2.96
2011 2012 20130
1
2
3
4
5
6
7
Long term debit ratio
INTERPRETATION
In 2011, Long Term Debt Ratio is low which means that company is not highly leveraged because debt is 2.96 which shows that 2.96 of every rupee from capital is in the form of long term debt.
In 2012, Long Term Debt Ratio is the higher than the base year 2011, which shows that the large amount of capital is in form of long term debt as compared to year 2011.
In 2013, Long Term Debt Ratio has increased and it is still higher than the base year 2011 which represents that the increase exists in amount of capital in the form of long term debt as compared to the year 2011.
CONCLUSION
The Long Term Debt Ratio has increased, when we compare it with the past 3 year’s performance. Therefore, in order to decrease Long Term Debt Ratio, company should decrease its debt from its equity. In this way company’s leverage can be in a better position.
12
HASCOL PETROLEUM LIMITED
DEBT TO EQUITY RATIO:
DEBT / EQUITY RATIO=TOTAL DEBT / TOTAL EQUITY
2013 2012 20117.29 5.23 4.29
2011 2012 20130
1
2
3
4
5
6
7
8
DEBT EQUITY RATIO
INTERPRETATION
In 2011, the Debt Equity Ratio is higher which represents that debt is 4.29 higher than the equity which shows the higher risk for company in bad times.
In 2012, the Debt Equity Ratio for the company is higher as compared to the base year 2011 which represents that the debt is much higher than the equity and therefore, the risk is also the higher.
In 2013, the Debt equity Ratio for the company is higher as compared to the base year 2011 which represents the debt 7.29 times higher than its equity & has much increased than the equity and the risk has also increased for the company.
CONCLUSION
The Debt Equity Ratio is higher as compared to the three years’ analysis of the company. Therefore, in order to decrease the Debt Equity Ratio, the company should decrease its long term debt and increase its equity. As a matter of fact, equity can be increased by increasing revenues, decreasing expenses, selling and increasing outstanding number of shares etc.
13
HASCOL PETROLEUM LIMITED
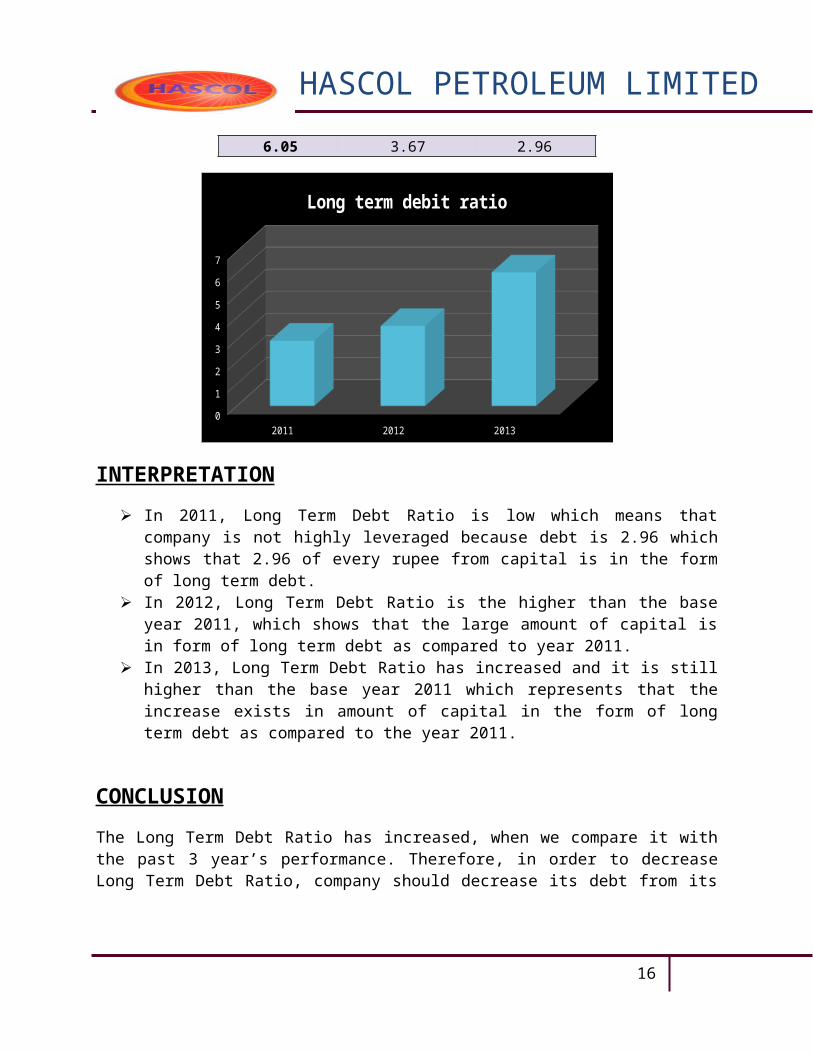
TOTAL DEBT RATIO:
TOTAL DEBT RATIO=TOTAL ASSETS –TOTAL EQUITY / TOTAL ASSETS
2013 2012 2011
0.8456 0.7657 0.8044
2011 2012 20130.72
0.74
0.76
0.78
0.8
0.82
0.84
0.86
TOTAL DEBT RATIO
INTERPRETATION
In 2011, the Total Debt Ratio is 0.8044 which shows that 0.8044 cents of every rupee from capital is in the form of total debt (short term debt and long term debt). This represents that the company is highly leveraged and fluctuations in interest rate will cause higher risk for the company as the equity is much lower than the total debt.
In 2012, the Total Debt Ratio had decreased a little as compared to the base year 2011 which shows that the debt and risk are decreased a little.
In 2013, the Total Debt Ratio for the company is increased as compared to the base year 2011, which represents that in 2013 the debt, and risk were high and equity was lower than the year 2011.
CONCLUSION
The Total Debt Ratio is higher but fluctuations are seen in the three years’ analysis of the company. Therefore, the company is considered to be as highly leveraged and in order to increased the total debt ratio, company should decrease its debt and Increase its equity which can be increased by generating revenues, decreasing expenses, selling and increasing outstanding number of shares etc.
14
HASCOL PETROLEUM LIMITED
TIME INTEREST EARNED:
TIME INTREST EARN RATIO=EBIT/INTEREST
2013 2012 20113.85 2.88 0.21
2011 2012 20130
0.5
1
1.5
2
2.5
3
3.5
4
TIMES INTEREST EARNED
INTERPRETATION
In 2011, the Time Interest Earned also knows as Margin of Safety is 0.21 times which shows that the earnings of the company are just 21% than its interest payable. This was the very dangerous financial situation for the company.
In 2012, the Time Interest Earned has increase which shows that the earnings of the company has increased as compared to the base year 2011 and the company is still able to meet its interest payable with its earnings by 2.88 times.
In 2013, the Time Interest Earned has increased as compared to the base year 2011 which shows that the earnings of the company have also increased.
CONCLUSION
The Time Interest Earned has fluctuation which shows that during the three years, the company’s ability to pay interest with the passage of time, the company managed to increase its Time Interest Earned and became able to pay its interest payable but the company still needs to increase its interest payable which can be increased by increasing the earnings of the company.
15
HASCOL PETROLEUM LIMITED
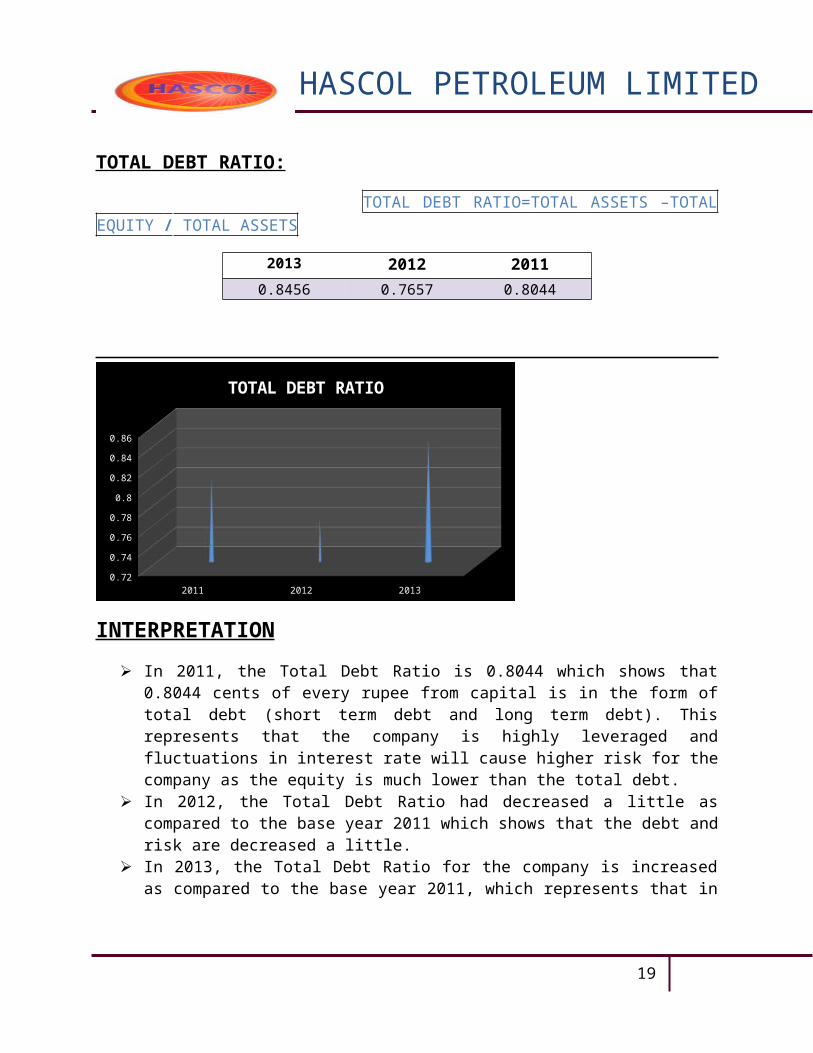
CASH COVERAGE RATIO:
CASH COVERAGE RATIO=EBIT+DEPRECIATON / INTEREST
2013 2012 20114.72 3.57 0.46
CASH COVERAGE RATIO
2013
2012
2011
INTERPRETATION
In 2011, the Cash Coverage Ratio shows that the company has the highest cash from the operations to pay its interest payments with cash is just 49%. 49% is not sufficient to pay because no amount will be left for other operations. Still company is not able to pay its interest payments.
In 2012, the Cash Coverage ratio is increased as compared to the base year 2011 which represents that the company’s ability to pay its interest payments with cash has increased.
In 2013, the Cash Coverage Ratio has increased as compared to the base year 2011 which shows that the company’s ability to pay its interest payments with its cash has also increased.
CONCLUSION
The Cash Coverage Ratio of the company through the overall analysis of three years shows the company’s ability to pay its interest was low in the beginning but with the passage of time, it started increasing. Improvements are seen in the last two year. Therefore, in order to increase the Cash Coverage Ratio, the company must increase its earnings and should make depreciation conservative because depreciation is the amount which never goes out of the company and its helps the company to decrease its payables.
16

HASCOL PETROLEUM LIMITED
LIQUIDITY RATIOS:
CURRENT RATIO
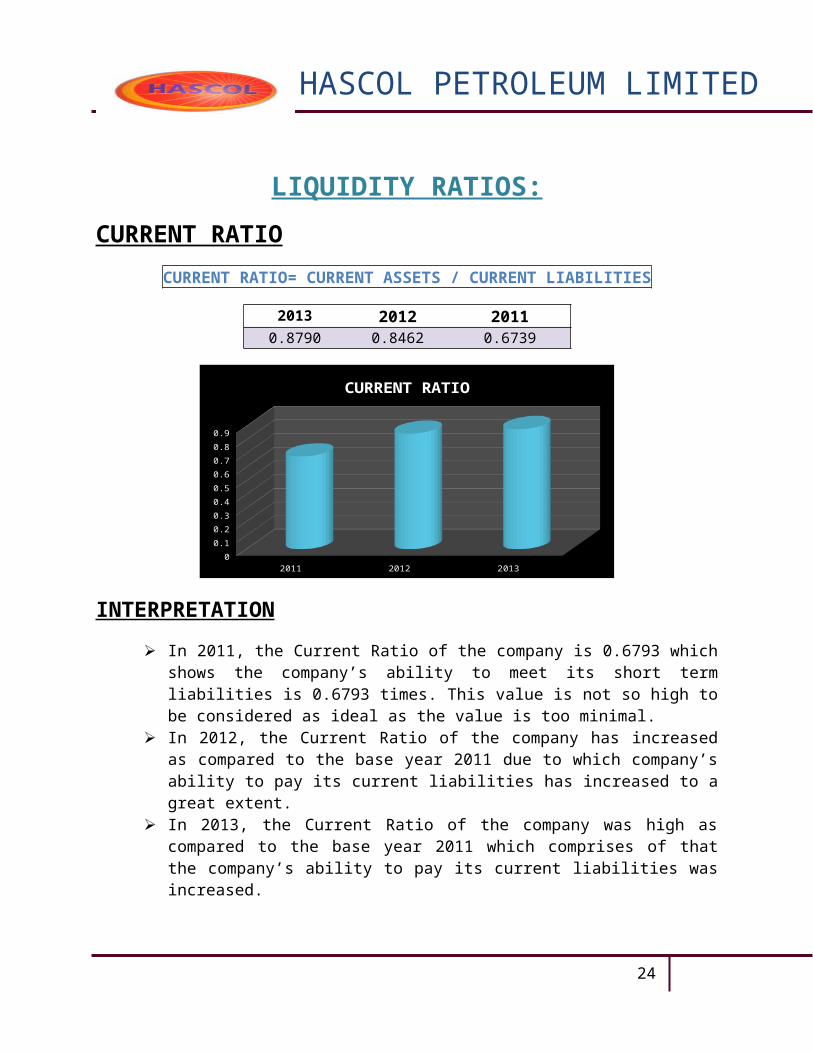
CURRENT RATIO= CURRENT ASSETS / CURRENT LIABILITIES
2013 2012 20110.8790 0.8462 0.6739
2011 2012 20130
0.1
0.2
0.3
0.4
0.5
0.6
0.7
0.8
0.9
CURRENT RATIO
INTERPRETATION
In 2011, the Current Ratio of the company is 0.6793 which shows the company’s ability to meet its short term liabilities is 0.6793 times. This value is not so high to be considered as ideal as the value is too minimal.
In 2012, the Current Ratio of the company has increased as compared to the base year 2011 due to which company’s ability to pay its current liabilities has increased to a great extent.
In 2013, the Current Ratio of the company was high as compared to the base year 2011 which comprises of that the company’s ability to pay its current liabilities was increased.
CONCLUSION
The Current Ratio has minor fluctuations over the time of three years which represents that the company is able to pay its current liabilities with the help of its current assets but this extent is not considered as ideal because the company’s liquidity is too minimal. Therefore, the company
17

HASCOL PETROLEUM LIMITED
must increase its current assets by increasing its receivables (increasing sale) & selling and increasing outstanding number of shares.
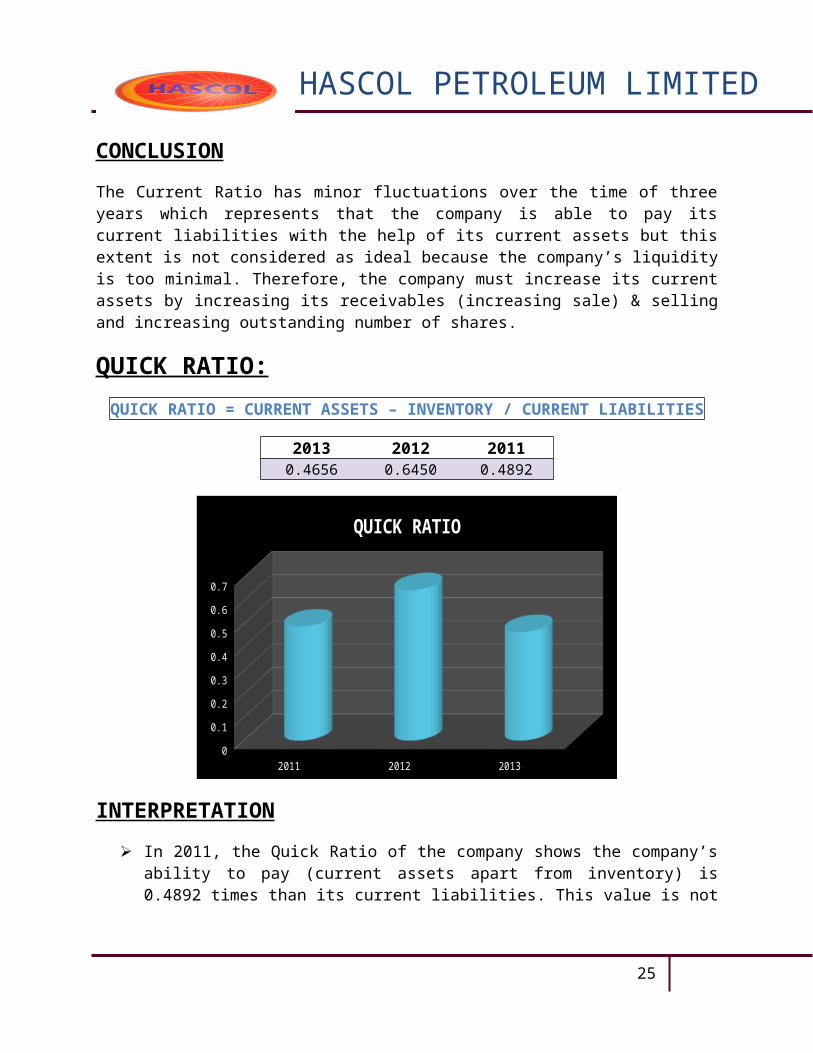
QUICK RATIO:
QUICK RATIO = CURRENT ASSETS – INVENTORY / CURRENT LIABILITIES
2013 2012 20110.4656 0.6450 0.4892
2011 2012 20130
0.1
0.2
0.3
0.4
0.5
0.6
0.7
QUICK RATIO
INTERPRETATION
In 2011, the Quick Ratio of the company shows the company’s ability to pay (current assets apart from inventory) is 0.4892 times than its current liabilities. This value is not so high to be considered as ideal as the value is too minimal.
In 2012, the Quick Ratio of the company is increased to a small extent as compared to the base year 2011 which shows that the company’s ability to pay its current liabilities has also increased.
In 2013, the Quick Ratio of the company is decreased as compared to the base year 2011 which shows that the company’s ability to pay its current liabilities has decreased.
CONCLUSION
The Quick Ratio of the company has slight fluctuations which show that over the period of three years’ the company’s ability to pay has not increased to a high extent apart from its inventories. Therefore, the company possesses low liquidity. However, the company can increase its liquidity
18
HASCOL PETROLEUM LIMITED
by increasing sales to increase its accounts receivables and by selling and increasing outstanding number of shares.
CASH RATIO:
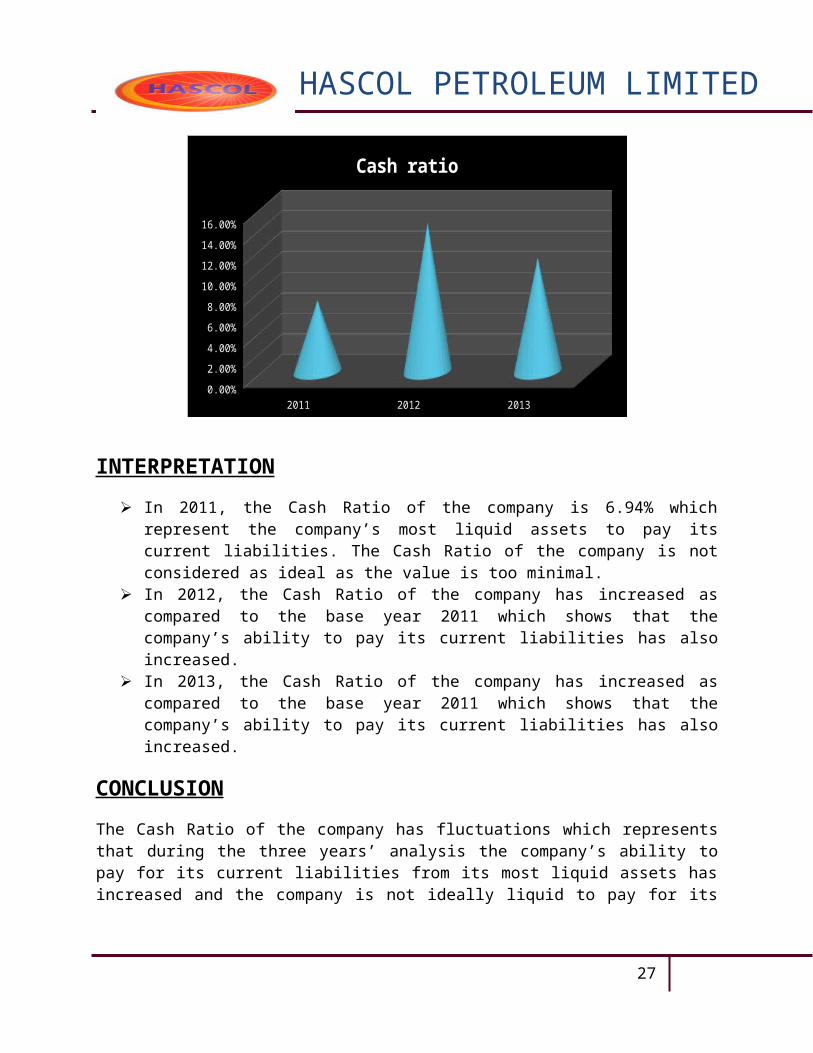
CASH RATIO = CASH / CURRENT LIABILITIES
2013 2012 201111.09% 14.54% 6.94%
2011 2012 20130.00%
2.00%
4.00%
6.00%
8.00%
10.00%
12.00%
14.00%
16.00%
Cash ratio
INTERPRETATION
In 2011, the Cash Ratio of the company is 6.94% which represent the company’s most liquid assets to pay its current liabilities. The Cash Ratio of the company is not considered as ideal as the value is too minimal.
In 2012, the Cash Ratio of the company has increased as compared to the base year 2011 which shows that the company’s ability to pay its current liabilities has also increased.
In 2013, the Cash Ratio of the company has increased as compared to the base year 2011 which shows that the company’s ability to pay its current liabilities has also increased.
CONCLUSION
The Cash Ratio of the company has fluctuations which represents that during the three years’ analysis the company’s ability to pay for its current liabilities from its most liquid assets has
19

HASCOL PETROLEUM LIMITED
increased and the company is not ideally liquid to pay for its current liabilities. Therefore, company should increase its cash by increasing sales and by selling and increasing outstanding number of shares.
NET WORKING CAPITAL:
NWC = CURRENT ASSETS – CURRENT LIABILITIES
2013 2012 2011-922911 -471609 -549819
2011 2012 2013
-1000000
-900000
-800000
-700000
-600000
-500000
-400000
-300000
-200000
-100000
0
NET WORKING CAPITAL
INTERPRETATION
In 2011, the Net Working Capital of the company is negative which represents that the company’s potential reservoir of cash is too low that the value has become negative after meeting the company’s current liabilities.
In 2012, the Net Working Capital of the company has decreased as compared to the base year 2011 and negativity has decreased to a large extent.
In 2013, the Net Working Capital of the company remains negative as compared to the base year 2011 and the negativity has increased to a great extent.
20

HASCOL PETROLEUM LIMITED
CONCLUSION
The Net Working Capital of the company has fluctuation over the period of three years’ analysis but during this time the Net Working Capital of the company has remained negative. Therefore, it is highly recommended that the company should increase its Net Working Capital by increasing its current assets which can be increased by increase in sales, accounts receivables & selling and increasing outstanding number of shares.
21
HASCOL PETROLEUM LIMITED
NET WORKING CAPITAL TURNOVER:
NWC TURNOVER = SALES / NWC
2013 2012 2011-53.98 -54.98 -31.05
2011 2012 2013
-60
-50
-40
-30
-20
-10
0
INTERPRETATION
In 2011, the Net Working Capital to Assets is -31.05 which represents the company’s un-potential reservoir of cash with proportion to the asset. Therefore, company’s cash reservoir is negative in response to its assets.
In 2012, the Net Working Capital to Assets has decreased to a great extent as compared to the base year 2011 and it has become negative which shows that the company’s cash reservoir too negative that is not even backed by the company’s total assets.
In 2013, the Net Working Capital to Assets has decreased to a great extent in comparison with the base year 2011 and it remained negative. Therefore, company’s cash reservoir is not able to be backed by company’s total assets.
CONCLUSION
The Net Working Capital to Assets of the company has fluctuations during the three years’ analysis which was negative at the start and then remained negative for the following years. However, it is highly recommended to increase the company’s Current Assets by increasing its accounts receivables & selling and increasing outstanding number of shares to make the company’s cash reservoir positive so that the Net Working Capital can also be increased.
22
HASCOL PETROLEUM LIMITED
EFFICIENCY RATIOS
TOTAL ASSETS TURNOVER:
TOTAL ASSETS TURNOVER = SALES / TOTAL ASSETS
2013 2012 2011
5.32 5.75 7.26
2011 2012 20130
1
2
3
4
5
6
7
8
TOTAL ASSETS TURNOVER
INTERPRETATION
In 2011, the Total Asset Turnover is 7.26 which represent that how hard the company’s assets are being put to use. Therefore, it’s obvious that each rupee of asset has produced 7.26 rupee of sale and the company is working close to its capacity.
In 2012, the Total Asset Turnover has decreased as compared to the base year 2011 which shows that the company has worked wider to its capacity.
In 2013, the Total Asset Turnover has decreased as compared to the base year 2011 which shows that the company has more decreased its assets for sales.
CONCLUSION
The Total Asset Turnover of the company has been analyzed for three years which shows that the company’s Total Asset Turnover was high in the beginning but it decreased during its following years. In order to further decrease of Total Asset Turnover, the company should increase its sales.
23
HASCOL PETROLEUM LIMITED
FIXED ASSETS TURNOVER:
FIXED ASSETS TURNOVER = SALES / TOTAL FIXED ASSETS
2013 2012 2011
21.07 15.54 16.13
2011 2012 20130
5
10
15
20
25
FIXED ASSETS TURNOVER
INTERPRETATION
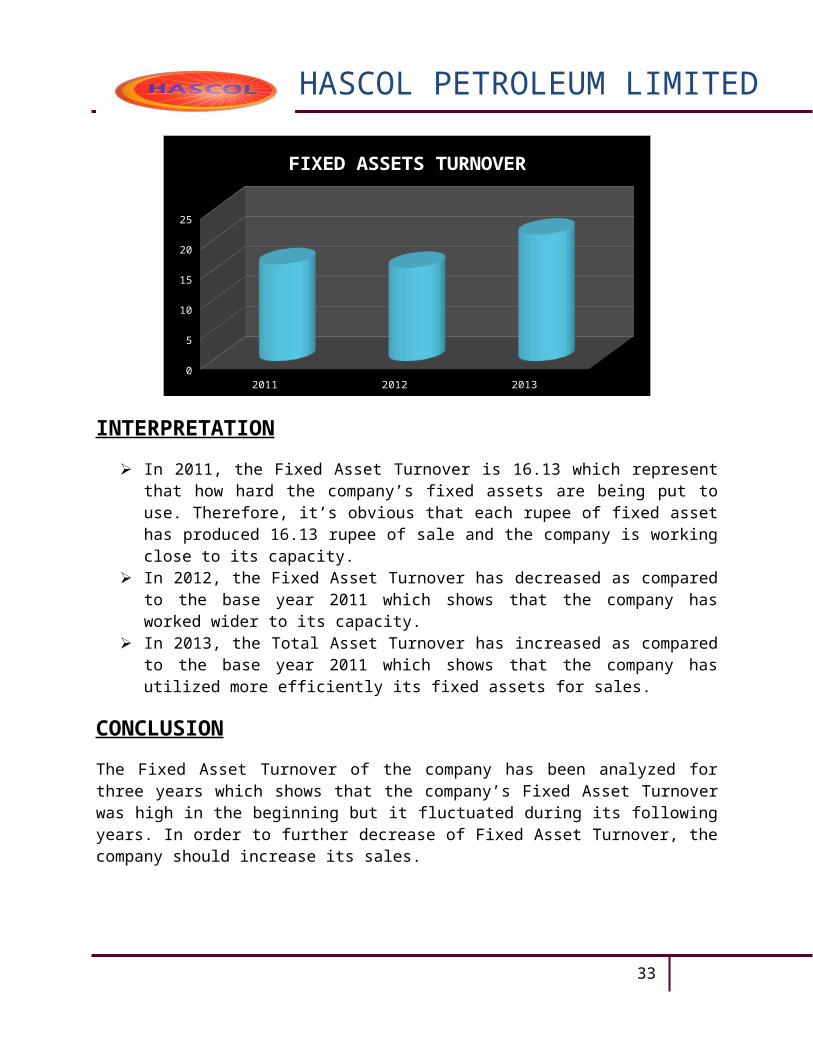
In 2011, the Fixed Asset Turnover is 16.13 which represent that how hard the company’s fixed assets are being put to use. Therefore, it’s obvious that each rupee of fixed asset has produced 16.13 rupee of sale and the company is working close to its capacity.
In 2012, the Fixed Asset Turnover has decreased as compared to the base year 2011 which shows that the company has worked wider to its capacity.
In 2013, the Total Asset Turnover has increased as compared to the base year 2011 which shows that the company has utilized more efficiently its fixed assets for sales.
CONCLUSION
The Fixed Asset Turnover of the company has been analyzed for three years which shows that the company’s Fixed Asset Turnover was high in the beginning but it fluctuated during its following years. In order to further decrease of Fixed Asset Turnover, the company should increase its sales.
24
HASCOL PETROLEUM LIMITED
INVENTORY TURNOVER:
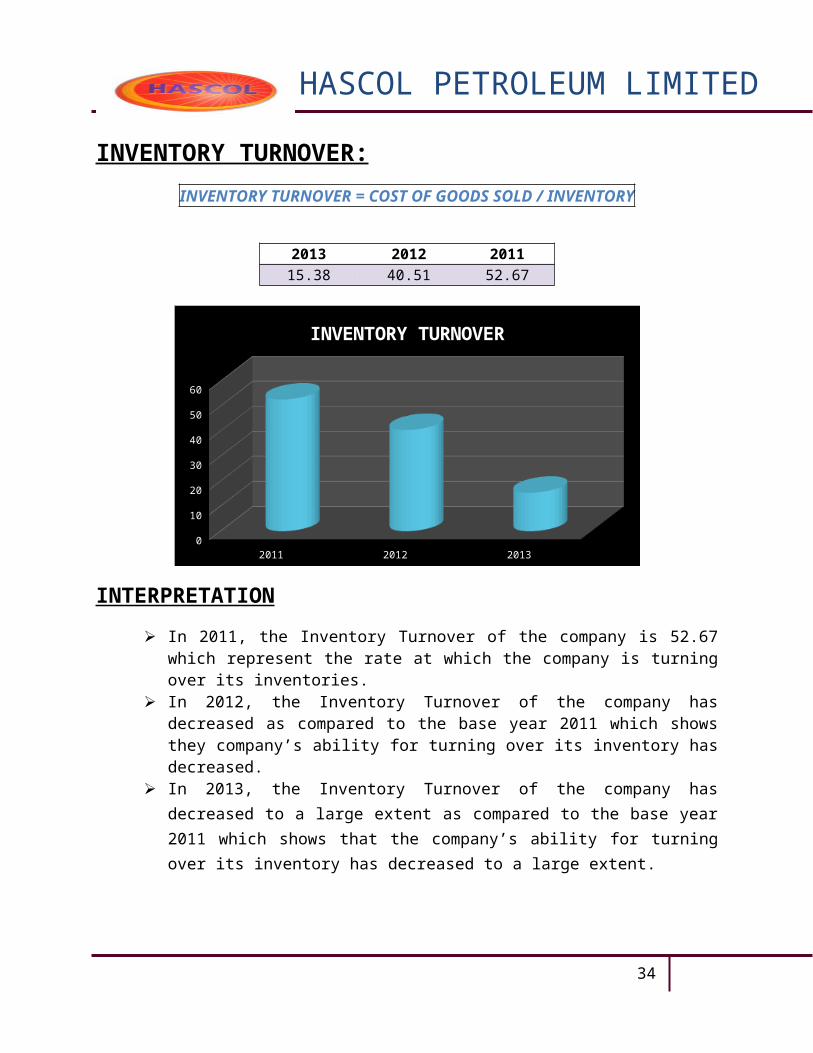
INVENTORY TURNOVER = COST OF GOODS SOLD / INVENTORY
2013 2012 2011
15.38 40.51 52.67
2011 2012 20130
10
20
30
40
50
60
INVENTORY TURNOVER
INTERPRETATION
In 2011, the Inventory Turnover of the company is 52.67 which represent the rate at which the company is turning over its inventories.
In 2012, the Inventory Turnover of the company has decreased as compared to the base year 2011 which shows they company’s ability for turning over its inventory has decreased.
In 2013, the Inventory Turnover of the company has decreased to a large extent as compared to the base year 2011 which shows that the company’s ability for turning over its inventory has decreased to a large extent.
CONCLUSION
The Inventory Turnover of the company has minor fluctuations during the analysis of three years’ which shows that the inventory turnover has decreased which is not a good remark. But to be a big player in the market, Hascol has increased its inventory to compete maximum in the market. It is also recommended, company should increase its sales volume which will increase its cost of goods sold which will lead to the increase in its Inventory Turnover.
25

HASCOL PETROLEUM LIMITED
DAYS’ SALES IN INVENTORIES :
DAY’S SALES IN INVENTORY = 365 / INVENTORY TURNOVER
2013 2011 201123.73 days 9.01 days 6.93 day
2011 2012 20130
5
10
15
20
25
DAYS SALES IN INVENTORY
INTERPRETATION
In 2011, the Days’ Sales in Inventories is 6.93 which represents that on average the company has not sufficient inventory to maintain sales for 6.93 days.
In 2012, the Days’ Sales in Inventories was increased as compared to the base year 2011 which represents that the company had more inventories to maintain its sales.
In 2013, the Days’ Sales in Inventories has increased as compared to the base year 2011 which shows that the inventory has increased but still has sufficient to maintain its sales.
CONCLUSION
The Days Sales in Inventories has been analyzed for three years’ which shows that throughout the analyzed period the company had sufficient inventories to meet its daily sales. Hascol has increased its inventory due to frequent strikes of Petroleum Transport Association. In Future if there is any further strikes, Hascol will be able to meet its current sale & no shortage will be faced by them during these strikes.
26
HASCOL PETROLEUM LIMITED
RECEIVABLE TURNOVER:
RECEIVABLE TURNOVER = SALES / A/C RECEIVABLE
2013 2012 2011
27.16 22.89 36.74
2011 2012 20130
5
10
15
20
25
30
35
40
RECEIVABLE TURNOVER
INTERPRETATION
In 2011, the Receivable Turnover of the company is 36.74 which represent company received 36.74 times its outstanding & reloaned it.
In 2012, the Receivable Turnover of the company has decreased as compared to the base year 2011 which shows they company’s ability to collect its outstanding has decreased.
In 2013, the Receivable Turnover of the company has decreased to a large extent as compared to the base year 2011 which shows that the company’s ability to collect its outstanding has decreased to a large extent.
CONCLUSION
The Receivable Turnover of the company has minor fluctuations during the analysis of three years’ which shows that the receivable turnover has decreased which is not a good remark. But to be a great competitor in the market, Hascol has changed its credit policy. It is also recommended, company should increase its Cash sales which will decrease the risk of bad debts which will lead to a better collection policy.
27

HASCOL PETROLEUM LIMITED
DAYS SALES IN INVENTORIES:
DAY’S SALES IN RECEIVALBES = 365 / RECEIABLE TURNOVER
2013 2011 201113.44 days 15.94 days 9.93 day
2011 2012 20130
2
4
6
8
10
12
14
16
DAYS SALES IN RECEIVABLES
INTERPRETATION
In 2011, the Days’ Sales in Receivables is 9.93 which represents that on average the company collects it’s outstanding in 9.93 days.
In 2012, the Days’ Sales in Receivables was increased as compared to the base year 2011 which represents that the company giving more leverage to its creditors.
In 2013, the Days’ Sales in Receivables has increased as compared to the base year 2011 which shows that the company has changed its credit policy & giving its customers a more leverage in payment.
CONCLUSION
The Days Sales in Receivables has been analyzed for three years’ which shows that throughout the analyzed period the company had allowed its debtors to pay their debts more easily. It will help him to create a better market, but it should collect its payment with a period of less than 15 days.
28
HASCOL PETROLEUM LIMITED
PROFITABILITY RATIOS:
NET PROFIT MARGIN :
NET PROFIT MARGIN = NET INCOME / SALES
2013 2012 2011
0.78% 0.84% 0.47%
2011 2012 20130.00%
0.10%
0.20%
0.30%
0.40%
0.50%
0.60%
0.70%
0.80%
0.90%
NET PROFIT MARGIN
INTERPRETATION
In 2011, the Net Profit Margin of the company is 0.47 % which represents that the company’s revenue (inclusive of debt) throughout the year is 0.47 % which determines that the company earns revenue and the company incurred less profit during the year.
In 2012, the Net Profit Margin of the company increased as compared to the base year 2011 which shows that the company’s revenue (inclusive of debt) increased.
In 2013, the Net Profit Margin of the company has increased as compared to the base year 2011 which shows that the company’s revenue (inclusive of debt) has also increased.
CONCLUSION
The Net Profit Margin of the Company has been analyzed for three years’ which shows fluctuations. Therefore, company should increase its Net Income by becoming more cost efficient & selling and increasing outstanding number of shares.
29

HASCOL PETROLEUM LIMITED
RETURN ON ASSETS:
ROA = NET INCOME / TOTAL ASSETS
2013 2012 2011
4.18% 4.84% 3.47%
2011 2012 20130.00%
0.50%
1.00%
1.50%
2.00%
2.50%
3.00%
3.50%
4.00%
4.50%
5.00%
RETURN ON ASSETS
INTERPRETATION
In 2011, the Return on Assets of the company is 3.47% which represents the return on company’s assets is 3.47. This return in considered as ideal.
In 2012, the Return on Assets of the company has increased compared to the base year 2011 which shows that the assets are more utilized in this year.
In 2013, the Return on Assets of the company has increased to be the positive as compared to the base year 2011 which shows that the assets are better utilized in this year.
CONCLUSION
The Return on Assets of the company has been analyzed for three years and it has been found that the company earned return on its assets but the return was minimal to be considered as ideal. However, the company’s assets are fully utilized. Therefore, company should increase its Net Income by becoming more cost efficient & selling and increasing outstanding number of shares.
30

HASCOL PETROLEUM LIMITED
RETURN ON EQUITY:
ROE = NET INCOME / TOTAL EQUITY
2013 2012 2011
0.36072 0.33049 0.18527
2011 2012 20130.00000
0.05000
0.10000
0.15000
0.20000
0.25000
0.30000
0.35000
0.40000
RETURN ON EQUITY
INTERPRETATION
In 2011, the Return on Equity of the company is 0.18527 which represents that the return on shareholder’s equity throughout the year.
In 2012, the Return on Equity of the company has a slight increase which shows that the return on shareholder’s equity has also slightly increased as compared to the base year 2011.
In 2013, the Return on Equity of the company has a slight increase which shows that the return on shareholder’s equity has also slightly increased as compared to the base year 2011.
CONCLUSION
The Return on Equity of the company has been analyzed for three years and it has been concluded that the company equity has increased during the period of time. Therefore it is highly recommended that the company should increase its Return on Equity by increasing its Net Income which can be increased by being more cost efficient & selling and increasing outstanding number of shares.
31
HASCOL PETROLEUM LIMITED
EARNING PER SHARE:
EPS = NET INCOME / OUTSTANDING SHARES
2013 2012 2011
5.97 3.33 1.93
2011 2012 20130
1
2
3
4
5
6
EARNING PER SHARE
INTERPRETATION
In 2011, the Earning per Share of the company is 1.93 which represents that the company’s earning with proportion to its shares in Rs.1.93 on every share. This is not an ideal condition.
In 2012, the Earning per Share of the company has increased as compared to the base year 2011 which represents that that company’s earnings with proportion to its shares has also slightly increased.
In 2013, the Earning per Share of the company has increased as compared to the base year 2011.
CONCLUSION
The Earning per Share of the company is analyzed for three years and it has been found that the company’s earning with proportion to its shares has fluctuations but still it has remained profit for the period of time. Therefore, it is recommended for the company to increase its Net Income to increase its earnings per Share by being more cost efficient and increasing its sales.
32
HASCOL PETROLEUM LIMITED
EQUITY MULTIPLIER:
EQUITY MULTIPLIER = TOTAL ASSETS / TOTAL EQUITY
2013 2012 2011
8.6182 6.8296 5.3364
2011 2012 20130
1
2
3
4
5
6
7
8
9
EQUITY MULTIPLIER
INTERPRETATION
In 2011, the Assets of the company are higher than its equity 5.3364 times which represents the company has tried to perform well as much it can do.
In 2012, the equity multiplier is in better position compared to base year 2011, this shows company’s strategy of utilizing its assets to maximize shareholder’s wealth.
In 2013, the Equity Multiplier has increased to almost 60% compared to its base year 2011.
CONCLUSION
The Equity Multiplier is a very important ratio to analyze the companies financing mix. Through analysis of HPL financials, we analyzed that the company is much depending on financing their assets through debt. It can also be concluded that The Hascol Petroleum has become more leveraged company. Therefore it is highly recommended that the company should get maximum amount of Cash by increasing its Net Income which can be increased by being more cost efficient & selling and increasing outstanding number of shares.
33
HASCOL PETROLEUM LIMITED
DUPONT ANALYSIS:
RETURN ON EQUITY - DUPONT ANALYSIS:
ROE = NET PROFIT MARGIN x TOTAL ASSETS TURNOVER x EQUITY MULTIPLIER
Year Net Income X Total Assets Turnover x Equity Multiplier = DuPont Value2011 0.4780% X 7.2625 x 5.3364 = 0.185272012 0.8418% x 5.7584 x 6.8296 = 0.330492013 0.7859% x 5.3256 x 8.6182 = 0.36072
2011 2012 20130.0000
0.0500
0.1000
0.1500
0.2000
0.2500
0.3000
0.3500
0.4000
DUPONT (RETURN ON EQUITY)
INTERPRETATION
In 2011, the ROE is much less because Net Profit Margin is just 0.4782% contributing a very low margin towards return on equity, Total Assets Turnover is much better than other years equity multiplier is also on average. Overall this year return on shareholders equity is much low.
In 2012, the company has performed well in area of Net Profit Margin as compared to the base year 2011 which resulted better return on equity, Total Assets Turnover has decreased compared to base year & in the area of assets over its equity, company also performed well. Overall the company has almost doubled its return on equity by performing well in the area of NPM.
In 2013, the Net Profit Margin of the company has also increased as compared to the base year 2011 which resulted higher return on equity, but this year the company performed very well in area of Equity Multiplier.
34
HASCOL PETROLEUM LIMITED
OTHER FACTORS AFFECTING COMPANY:
The factors affecting company’s performance except company’s ratio analysis are:
RELIANCE ON DEBT FINANCING: The Company has become reliant on debt financing due to which the company’s liquid position has become insecure.
POLITICAL UNCERTAINTY: Political Uncertainty has caused the progress of real estate and construction business due to which company’s business is at disadvantage.
LAW AND ORDER SITUATION: In Central and Northern Region of the country, law and order situation is not stable due to which business is negatively affected.
ADVERTISING COST: Advertisement has become more costly due to which operating expenses of the company are increased.
35