Has the Swedish Business Sector Become More ... · jobs. Bijnens and Konings (2018) use Belgian...
48
Research Institute of Industrial Economics P.O. Box 55665 SE-102 15 Stockholm, Sweden [email protected] www.ifn.se IFN Working Paper No. 1147, 2016 Has the Swedish Business Sector Become More Entrepreneurial than the U.S. Business Sector? Fredrik Heyman, Pehr-Johan Norbäck, Lars Persson and Fredrik Andersson
Transcript of Has the Swedish Business Sector Become More ... · jobs. Bijnens and Konings (2018) use Belgian...

Research Institute of Industrial Economics
P.O. Box 55665
SE-102 15 Stockholm, Sweden
www.ifn.se
IFN Working Paper No. 1147, 2016
Has the Swedish Business Sector Become More Entrepreneurial than the U.S. Business Sector? Fredrik Heyman, Pehr-Johan Norbäck, Lars Persson and Fredrik Andersson

1
Has the Swedish Business Sector Become More
Entrepreneurial than the US Business Sector?
Fredrik Heyman*, Pehr-Johan Norbäck*, Lars Persson* and Fredrik
Andersson*
November 2018
Abstract: Recent studies document a 30-year decline in various measures of entrepreneurship
in the U.S. Using detailed Swedish employer-employee data over the period 1990 to 2013, we
find young firms to be more prominent in the Swedish business sector than in the U.S. business
sector. Young Swedish firms, aged five years or less, account for more than half of all firms
during this period. We also observe an increase in Swedish entrepreneurial activity for start-
ups. However, increasing job destruction rates for young firms has implied a declining
employment share for younger firms from the mid-2000s. Moreover, most of the job creation
by young firms occurs in the expanding service sector. We discuss different explanations for
why Sweden appears not to have the same strong decline in entrepreneurial activity as the U.S.
has had during the last two decades. We argue that one important explanation is economic
reforms in Sweden in the 1990s that mitigated several hurdles to entrepreneurship.
JEL: J23, K23, L26, L51
Keywords: entrepreneurship, job dynamics, matched employer-employee data, industrial
structure and structural change
* Research Institute of Industrial Economics (IFN), P.O. Box 55665, SE-102 15 Stockholm, Sweden,
[email protected], [email protected], and [email protected].
Acknowledgements: We thank Magnus Henrekson, Ed Lazear, Assar Lindbeck, Roger Svensson
and Joacim Tåg for their helpful comments. Charlotta Olofsson and Alexandra Allard provided
excellent research assistance. Fredrik Heyman gratefully acknowledges financial support from the
Swedish Research Council for Health, Working Life and Welfare (FORTE), Torsten Söderbergs
Stiftelse and the Jan Wallander and Tom Hedelius stiftelse. Pehr-Johan Norbäck and Lars Persson
gratefully acknowledge financial support from the Jan Wallander and Tom Hedelius stiftelse and
Vinnova.

2
1. Introduction
Recent studies document a 30-year decline in various measures of entrepreneurship in the
United States (e.g., Decker et al., 2014, Hathaway and Litan, 2014). Decker et al. (2014) argue
that a likely reason for the decline in job dynamism in the U.S. has been the decline in the share
of young firms. In this paper, we argue that this has not been the case in Sweden. Young firms
have been more prominent in the Swedish business sector than in the U.S. business sector over
recent decades. Young Swedish firms (less than five years) accounted for more than half of all
firms, averaging approximately 55 percent per annum. During the same period, the share of
young firms in the U.S. fell from approximately 45 percent to less than 40 percent. We also
observe higher employment and job creation shares for young Swedish firms than for young
U.S. firms.
When studying firm and job dynamics more in detail, we find that the share of young
firms (less than five years) and their share of job creation in the business sector has been rather
stable over the period we study. In particular, we find that it is the start-up rate that has increased
in the Swedish business sector over this period. We also find that job destruction rates have
increased in particular for firms in their first year after entry. This increase in job destruction
for the very youngest firms has led to a small decline in the employment share for young firms
less than five years since the mid-2000s. Looking across sectors, most of the job creation by
young firms in Sweden has occurred in the expanding service sector, which contrasts with the
evidence for the U.S. where job creation by young firms has decreased in the service sector.
What could then explain why the Swedish business sector has been more entrepreneurial
over recent decades in comparison with the U.S. business sector? And, why do the signs of less
entrepreneurial activities that we find, appear later in Sweden? In this paper, we argue that the
implementation of an extensive business reform package conducive to entrepreneurial activity
after a severe economic crisis in Sweden during the 1980s and early 1990s is a likely
explanation. These reforms removed barriers to entry and growth for new firms in several
product and services markets and made the corporate ownership and labor markets more
flexible. This development of the business climate in Sweden contrasts the development of the
business climate in the U.S., as described by Zingales (2012) among others. He argues that the
U.S. has evolved into an economy that favors incumbents over entrants, becoming pro-business
instead of pro-market. We also discuss other potential explanations and highlight that a
complementary explanation is that the Information and Communication Technology (ICT)

3
driven structural change started later in Sweden, which could explain the stronger job creation
process in the service sector in Sweden compared to the US.
The remainder of this paper is structured as follows: section 2 reviews the related
literature; Section 3 presents the theoretical background; section 4 describes the data and
methods used for the empirical analysis; and sections 5 and 6 present the main results. In section
7, we discuss different explanations for why Sweden appears not to have the same decline in
entrepreneurial activity in the business sector as the US has had during the last two decades,
emphasizing the economic reforms that occurred in Sweden in the 1990s which mitigated
several hurdles to entrepreneurship. Section 8 presents the study’s conclusions.
2. Related Literature
Our paper is related to the literature on entrepreneurship and public policy. Entrepreneurship
activity and its productivity crucially depend on a country’s laws and policies, as argued, for
instance, by Henrekson and Johansson (2009), Minnitti (2008) and Parker (2007). Shane (2009)
notes that most start-ups fail and argues that policymakers should focus on reducing the
incentives to create these low-probability companies. Mason and Brown (2013) use data from
Scotland to suggest appropriate policies that would result in high-growth firms (HGFs). Román
et al. (2013) note that several micro-institutional factors such as social capital will interact with
macro-institutional factors such as labor market regulations to determine the outcome of
entrepreneurship policies. Autio and Rannikko (2016) examine the growth impact of a high-
growth entrepreneurship policy initiative in Finland over a six-year period. Using an eight-year
panel that started two years before the initiative was launched, they find that the initiative had
more than doubled the growth rates of treated firms. Mthanti and Ojah (2017) use cross-country
data to compute a measure of entrepreneurial orientation (EO) using risk-taking,
innovativeness, and proactiveness as proxies for entrepreneurship. They find that their measure
of entrepreneurial orientation is positively correlated with economic growth. We add to this
literature by arguing that large-scope business reforms that are conducive to entrepreneurial
activity can have substantial, long-lasting effects on the entrepreneurial activity in a country’s
business sector.1
1 Henrekson and Johansson (1999) examine the evolution of the size distribution of firms over time in Sweden for
a period spanning from the late 1960s to the early 1990s. They find poor development for intermediate-sized firms
(10–199 employees), which suggests that institutional barriers to firm growth in the Swedish business sector were
high during that period.
4
This paper further relates to the literature on entrepreneurship and job and firm
dynamics. A large literature on job and firm dynamics has shown that minor net employment
changes often are a result of substantial gross job flows (Davis et al. (1997). Haltiwanger et al.
(2013) analyze the relationship between net job creation and firm size and age. They find an
inverse relationship between firm size and net job growth. This result is consistent with, e.g.,
Neumark et al. (2011) who present evidence that small firms contribute disproportionately to
net employment growth. However, when controlling for firm age, Haltiwanger et al. (2013)
find that the relationship between firm size and job growth disappears.2 A similar result is found
in Heyman, Norbäck and Persson (2018). Age, rather than size, is the important characteristic
for job dynamics since start-ups and young businesses create the large bulk of new jobs. Using
micro-data for OECD countries, Criscuolo et al. (2014) show that young firms play an important
role in overall net job creation in the OECD regions but that there is also a great heterogeneity
across countries in the extent to which young firms are job creators. Recent studies document
a 30-year decline in various measures of entrepreneurship in the U.S. (see e.g., Decker et al.,
2014; Hathaway and Litan, 2014).
European business dynamism has been less studied. Bravo-Biosca et al. (2016) examine
cross-country differences in firm growth dynamics and how they are related to different
regulations and institutional settings. They show that less stringent employment protection and
well-functioning financial systems are linked to a more dynamic firm growth distribution.
Calvino et al. (2015) examine cross-country differences in start-up dynamics. Based on data
from the DynEmp v.2 database, they find that the large majority of start-up firms do not grow,
but that a very small share of successful start-ups creates a disproportionate amount of new
jobs. Bijnens and Konings (2018) use Belgian data to show that Belgium’s business sector has
experienced a similar decline in dynamism as the US business sector.
We add to the above literature by showing that in contrast to the US development, we
observe no decline―or in the case of employment shares―a smaller and later decline in
Sweden using different measures of entrepreneurial activity. We also look at firm and
employment dynamics for specific age categories which provides us with new knowledge on
business dynamism for young firms. In particular, we find an increase in start-up activity but
also an increase in job destruction immediately after entry. We also find that most of the job
creation by young firms occurs in the expanding service sector.
2 See also Anyadike-Danes et al. (2015), who use cross-country data and find that adding controls for age causes
the relationship between firm size and job growth to disappear.
5
Finally, our paper also relates to the literature on regulation, institutions and
entrepreneurship. Djankov (2009) surveys the literature on the relationship between entry
regulations on the one hand, and entrepreneurship and productivity on the other hand. The
presented evidence indicates economically significant effects with regard to entry rates and
productivity growth. Based on a comprehensive database of European firms, Klapper et al.
(2006) find that costly regulations hamper the creation of new firms, especially in industries
that should naturally have high barriers to entry. Branstetter et al. (2014) evaluate the
consequences of regulatory reform in Portugal, which reduced the cost of firm entry. They
report increased firm formation and employment, but mostly among ‘marginal firms’. Van Stel
et al. (2007) present cross-country evidence on the relationship between regulation and
entrepreneurship. They find that a minimum capital requirement to start a business lowers
entrepreneurship rates, as do labor market regulations. Ciccone and Papaioannou (2007) find
that countries where it takes less time to register new businesses have higher entry in industries
that have experienced expansionary global demand and technology shifts. Finally, Prantl (2012)
exploits a natural experiment in firm entry regulations. After German reunification, East and
West Germany faced different economic conditions but were subject to the same law that
imposes a substantial mandatory standard on entrepreneurs. Their main finding is that entry
regulations suppressed long-lived entrants in addition to short-lived entrants.3
We add to this literature by providing evidence that the Swedish business sector has
become relatively more entrepreneurial in comparison with the U.S. business sector after the
implementation of large-scope business reforms conducive to entrepreneurial activity.
3. Theoretical Background
Why do firm start-up dynamics and entrepreneurial activity differ over time and between
countries? The focus of this paper is that cross-country variation in start-up dynamics and
entrepreneurial activity reflects changes in the rules and regulations for entry and firm dynamics
in different countries over time. Why then might countries regulate entry and firm dynamics?
The industrial economics literature takes as its starting point the notion that unregulated markets
may experience strong market failures such as monopoly power and externalities. For instance,
3 See also Da Rin et al. (2011), Djankov et al. (2002) and Kneller and McGowan (2012) for evidence on the effects
of taxation on industry entry and exit rates. Carroll et al (2000; 2001) examine the effects of US tax reforms in the
1980s on the investment and hiring decisions of small businesses, finding significant effects.

6
governments may regulate entrants to make sure that consumers buy high-quality products from
“desirable” sellers; see Viscusi et al. (2005) for an overview and Arrunada (2007) and
Färnstrand et al. (2017) for specific contributions. In this stream of literature, differences and
changes in regulation originate from changes in technology and structural factors.4
The public choice theory takes as its starting point the notion that incumbents are able
to obtain regulations that create rents for themselves because they typically face lower
information and organizational costs than dispersed consumers (Stigler, 1971). Acemoglu
(2008) presents a model where political power is in the hands of major producers who erect
significant entry barriers against new entrepreneurs. Perotti and Volpin (2005) present a model
in which incumbents seek a low level of effective investor protection to prevent potential
entrants from raising capital. Incumbents succeed because they can promise larger contributions
to ruling politicians than the entrants due to the higher rents earned with less competition.
Regulation may also be pursued for the benefit of politicians and bureaucrats. Politicians use
regulation both to create rents and to extract them through campaign contributions, votes, and
bribes (Djankov et al., 2002). In this literature, differences and changes in political power and
outside forces that can change political power could then explain why entry regulation changes
over time and between countries.
In section 7, we will argue that during the 1990s, Sweden undertook a large set of
reforms of the business sector. These reforms were partly driven by a less substantial need for
regulations due to technological development ― but also by an increased understanding of the
economic cost of extensive regulation of the business sector. We will argue that these reforms
were highly influential in promoting and re-igniting entrepreneurial activity in the Swedish
business sector and could be an explanation for why business dynamism has not decreased in
Sweden as it has in the US. In the next section, will we carefully document the firm dynamics
and job creation and job destruction processes in Sweden in detail during the period 1990–2013
with a special focus on firm age.
4. Data Description
The empirical part of this paper is based on a comprehensive database from Statistics Sweden
covering the years 1990–2013. The database includes firm, establishment, and individual data
4 See, for instance, Acs and Audretsch (2005) and Santarelli and Vivarelli (2007) for overviews of firm dynamics
and market structure.
7
that are linked via unique identifiers. Detailed information on firms, establishments, and
employees enables us to thoroughly analyse questions regarding firm dynamics.
An important issue when studying firm and job dynamics is how to credibly follow firms
over time. Using organization numbers can be problematic because such numbers can change
for various reasons. For instance, internal firm reorganizations sometimes result in changes in
legal registration numbers, even though the employment composition remains the same. This
issue complicates the identification of entrants, expanding firms, contracting firms, and
shutdowns. To more reliably follow firms over time, we use additional data from Statistics
Sweden (FAD by the Swedish acronym). In each year, a firm is identified by both its legal
registration number as well as a survival code. Based on the employment composition in t
compared to that in t-1, firms are categorized as either remaining, new, or shutdown. The criteria
for each survival type are described in detail by Andersson and Arvidson (2001). Typically, if
the majority of workers remain, the firm is categorized as remaining. Each firm is assigned a
unique FAD identifier. If a firm is assigned a new legal registration number but is considered
remaining according to the FAD methodology, its FAD identifier does not change.
Thus, in this paper, we follow firms based on their FAD identifier, not their legal
registration number. These data make it possible to identify new firm entry and firm exits,
which means that we can analyse employment changes in (i) completely new units, (ii)
continuing units and (iii) exiting units.5 In our analysis we make use of codes in the FAD data
that assign if firms are completely new or are permanently exiting. By means of these codes,
employment changes should not reflect M&A activity since these activities should give rise to
changes that are not in accordance with (i) – (iii) above.
The FAD database also contains information on the registration year. Each firm is then
divided into a firm age category corresponding to its FAD age, not its legal age. Firms registered
in 1986 or before all have 1986 as their registration year, meaning that we are compelled to
restrict our sample by the number of firm age categories included. For instance, it is not until
the year 2000 and onward that we can safely say that a firm is actually 14 years old or older.
To make the results as reliable as possible, we also limit our analysis to firms with at least three
employees in a given year.6
5 See Andersson and Arvidsson (2011) for details on the FAD data. 6 Results are robust to using all firms instead of only firms with at least three employees. The only exception is
results on the skewness of the firm growth distribution. This is discussed below in the sub-section on post-entry
dynamics.

8
5. Business dynamism in Sweden: A comparison with the US
Business dynamism and the rate of business start-ups have been declining in recent decades in
the U.S., as shown by Decker et al. (2014). In this section, we first highlight the differences and
similarities between Sweden and the U.S. with respect to business dynamism. We then
undertake a more in-depth analysis of how business dynamism has evolved in Sweden over the
past two decades.
Share of Activity by Young Firms
Decker et al. (2014) provide evidence for a declining share of activity by young firms (defined
as five years old or less) in the U.S. Figure 1, which is constructed from their data, shows that
the share of young firms and their respective employment and job creation statistics have
declined over the last two decades for which we have comparable Swedish micro-data. Decker
et al. (2014) also show that this decline is secular going back to the early 1980s.
Historically, the start-up rate has been declining in Sweden as well. Figure 2, taken from
Braunerhjelm and Carlsson (1993), shows that the number of new manufacturing firms, as a
share of total firms, was halved from approximately 1950 to 1990. Going back to as far as the
1920s, the decline is even more apparent. Our micro-data do not go back further than 1990 and
are not entirely comparable with the data in Braunerhjelm and Carlsson (1993). However, as
shown below, our data, which again cover the last two decades, show fewer signs of a declining
share of entrants. This evolution thus seems to have been halted in the early 1990s.
-- Figures 1 and 2 about here --
Figure 3 shows the development in Sweden over the period 1990 to 2013 for the same
measures, but for different definitions of a young firm, as in Figure 1 (the share of young firms
and their respective employment and job creation), ranging from young firms being defined as
operating for five years or less as in Decker et al. (2014) to defining young firms as start-ups
(completely new firms).7
7 Note that we are using the same concept of job growth as in the methodology developed by Davis et al. (1996).

9
Generally, young firms appear to be more prominent in the Swedish business sector than
in the business sector in the U.S. We can see that in recent decades, young Swedish firms aged
five years or less accounted for more than half of all firms, steadily averaging approximately
55 percent per annum (top left panel). In the same period, the share of young firms in the U.S.
fell from approximately 45 percent to less than 40 percent. There is a similar pattern for the job
creation share, i.e., higher levels for young Swedish firms, more consistent over time, unlike in
the U.S., where the share of job creation in young firms has continuously fallen since the 1980s.
The evolution of the employment share of young firms in Sweden, however, do share some
similarities with the development in the US. While young firms account for a larger share of
employment in the business sector in Sweden, there is a downward trend in the share of
employment for young firms, with the exception for start-ups (bottom-right panel).
-- Figure 3 about here --
Looking in more detail at the contribution of different age groups among young firms
reveals some interesting patterns. In Figure 4, we again graph the share of firms and the share
of employment pertaining to start-ups (age zero), but then break up the remaining age groups
in Figure 3 into firms which have been in the market for one, two, three, four or five years,
respectively. While the levels between the different age groups vary, each group’s share of
firms is rather stable over time. Employment shares show more heterogeneity: while the
employment share for start-ups again is very stable over time, firms who are in their first year
after entry have seen their employment shares decline significantly after the new millennium.
Remaining age groups show a similar but less pronounced pattern.
-- Figure 4 about here --
Why do start-ups hold a stable share of employment while very young firms attract a
somewhat smaller share of employment over time? Figure 5 depicts job creation and job
destruction shares for each of the age group presented in Figure 4. The share of job creation in
start-ups (age 0) increases over time, except for the beginning of the period marking the
aftermath of the Swedish crises at the beginning of the 1990s. For firms, aged one year, we note
that while job creation slightly declines over time, there is a lasting increase in job destruction,
where the job destruction in each year exceeds job creation. At increasing firm age, churning
in terms of job creation and job destruction tapers off, becoming more similar across age groups.

10
-- Figure 5 about here --
What is then the source of the observed increase in job destruction among very young
firms after entry? Figure 6 shows annual and employment-weighted firm entry and firm exit
rates by firm age. Figure 6 shows no clear trends in the annual exit rates across age groups.
Figure 6 also explores and depicts the loss of employment or job destruction from firm exits
(employment-weighed). Job losses due to exits in the first year after entry appear to be very
important for explaining the decline in employment shares for young firms that we found in
Figure 3. In particular, firms of age one are associated with a strong increase in employment
losses from exits. When firms grow older, this pattern becomes less apparent. Finally, Figure 7
shows employment losses (job destruction) in continuing firms. After an initial peak generated
by the financial crises in Sweden that occurred in the early 1990s, job losses in continuing firms
show no clear trends.
The results in Figure 6 and 7 indicate that early exits appear to be the main driver of job
destruction for very young firms. The fact that the overall propensity to exit appears not to have
changed, while job destruction in very young firms seems to have increased over time, suggests
that early exits appear to be biased towards larger entrants. This pattern is consistent with the
theory proposed in Färnstrand et al. (2017) where more risky entry strategies (large scale entry)
are associated with a higher failure rate.
-- Figure 6 and 7 about here –
In sum, a major feature of the dynamism in the Swedish business sector stems from an
increasing number of start-ups and an increasing importance of early exit (biased towards larger
units).8 We now proceed to examine dynamism in broader sectors.
8 Note that from the construction of our data with so-called FAD codes (which tracks the individuals working in a
firm or a work place) we would argue that M&As are likely not the reason for the pattern of increased early exits
of larger entrants. In our analysis we make use of codes in the FAD data that assign if firm are completely new or
are permanently exiting. By means of these codes, employment changes should not reflect M&A activity.

11
Sector analysis
In what sectors do young firms create new jobs, and what types of jobs are created in
terms of workers’ educational background? To this end, we can extend the analysis of Swedish
firms by separating the effects by first sector (manufacturing, service, or other) and then by also
examining workers’ educational background in order to understand what type of jobs young
firms have been creating. Due to space limitations, we now focus on firms aged five years or
less, start-ups (new firms, i.e. firms at age 0) and very young firms (age 1).
Decker et al. (2014) report falling activity for young firms in the service sector. The
pattern is the opposite in Sweden, at least with respect to employment and job creation. As
shown in Figure 8, the activity of young firms is largest in the service sector. The share of
employment, firms, job creation and job destruction of young firms is notably much higher in
services than in manufacturing or other industries.
Our earlier findings on the dynamics in the entire business sector also appear at the
sector level. Employment shares for young firms decline after the millennium in both the
service and manufacturing sectors. Other dynamics patterns appear to be driven mainly by the
service sector. For instance, job creation from start-ups stem from the service sector, and job
destruction becomes increasingly important in the service sector consistent with the decline in
the share of employment of young firms in the service sector.
-- Figure 8 about here --
At the aggregate level, we noted that job destruction associated with exits appeared to
be the main reason for job losses after entry. We have also explored if this is the case also at
the sectoral level (graphs omitted due to space constraints). Our results indicate that exits one
year after entry increase over time in all sectors. While the steepness in the increase tends to be
largest in the manufacturing sector, exits after one year increase from a much higher level in
the service sector. In 2013, which is the last year in our data, about every third firm in the
service sector exited after only one year in business. At older ages, exit rates become more
stable in the service sector while they appear to increase over time in the two other sectors.
Skill heterogeneity
In light of the current process where globalization and new digital technologies have
heterogeneous effects on different types of workers, it is also interesting to explore the skill
12
dimension in job dynamics. To investigate what types of jobs are created by young firms, we
group employees into three different categories: (1) workers with at most nine years of
elementary education, (2) workers with one—two years of upper secondary education and (3)
workers with at least three years of post-secondary education. This separation of gross job flows
across educational attainment is absent in the business dynamism literature, where essentially
all of the evidence concerns the total number of jobs and, thus, does not distinguish between
the types of jobs that are created and destroyed.
Figure 9 shows the share of employment and the share of job creation for each
education category. To save space we only show results for young firms (firms who are five
years or younger). There is a similar pattern in job creation and employment that originate from
young firms for different types of jobs, here classified by education. The decline in the share of
workers with secondary and tertiary education who have an employment in young firms, is
somewhat stronger than what is observed for jobs with primary education.
-- Figure 9 about here --
Post-Entry Job Dynamism
Start-ups and young firms play an important role in U.S. job creation. Evidence from
the U.S. suggests that there is a distinct negative relationship between firm age and employment
growth within each age group. Looking at survivors, mature firms are associated with lower
rates of job creation than younger firms. While we do find similar trends in Sweden, the
relationship does not seem as strong as in the U.S. Net job creation among Swedish firms seems
to be rather stable for firms aged one to seven years old, unlike the U.S., where the rate drops
at a higher pace. As Figure 10 illustrates, it is not until Swedish firms grow older than eight
years of age, that we observe significantly lower rates of net job creation. Apart from the less
pronounced trend, we also observe much lower levels of job turnover in Sweden among the
very youngest firms, except for the first year after entry
-- Figure 10 about here --
As for exit dynamics, the trends are similar, but the levels are again lower in Sweden.
Both in the U.S. and Sweden, younger firms have a substantially higher exit rate than mature
firms, and job destruction by exiting firms is higher in the U.S. than in Sweden—again with the
exception of the first year after entry where job losses from exits in Sweden are remarkably
13
high. Thus, we find evidence that also young Swedish firms exhibit a relatively strong “up or
out” dynamic.
Unlike Decker et al. (2014), we are able to separate the “up or out” dynamics across
workers’ educational background. The results are presented in Figure 11. Again, we observe
that job destruction by exiting firms is falling with firm age—regardless of the types of jobs in
terms of educational groups. Not only are the trends similar, but the levels also seem to be very
similar across educational groups. However, when studying net job creation by continuing
firms, we observe major differences. It is clear that the development for workers with higher
education were more positive throughout our sample period from 2002–2013 than for workers
with primary education only. Nevertheless, net employment growth is almost uniform over age
groups for workers with tertiary education.
-- Figure 11 about here --
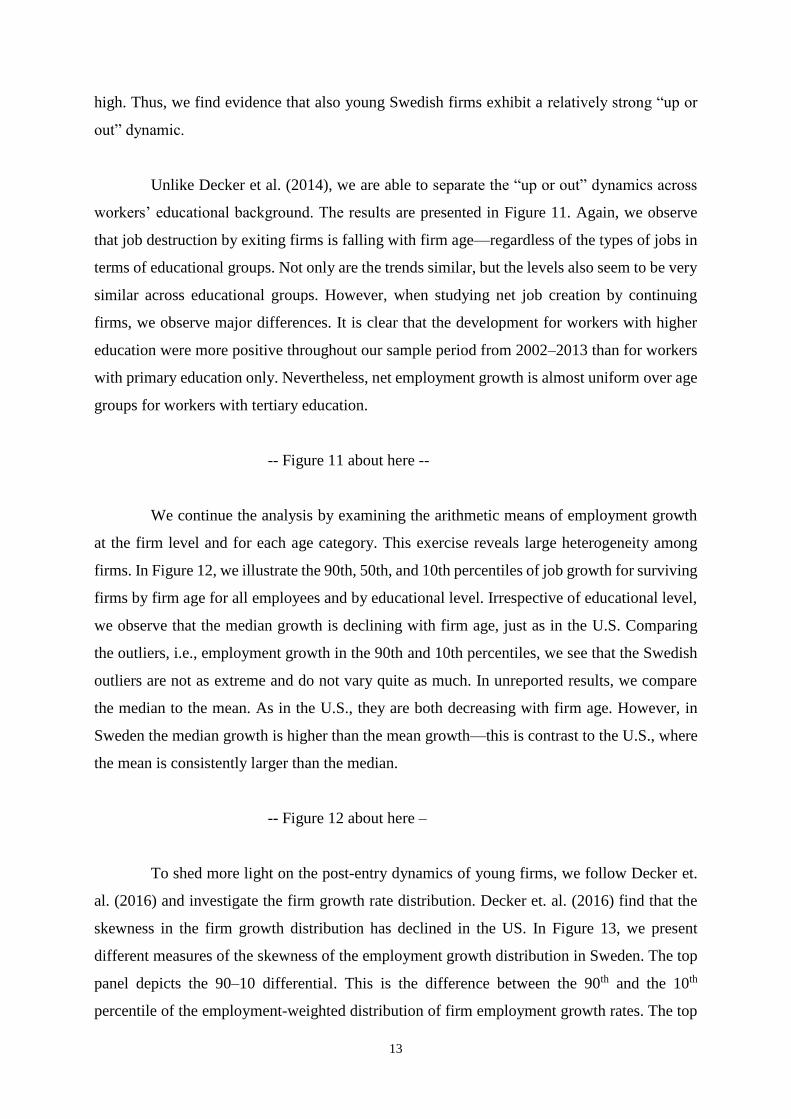
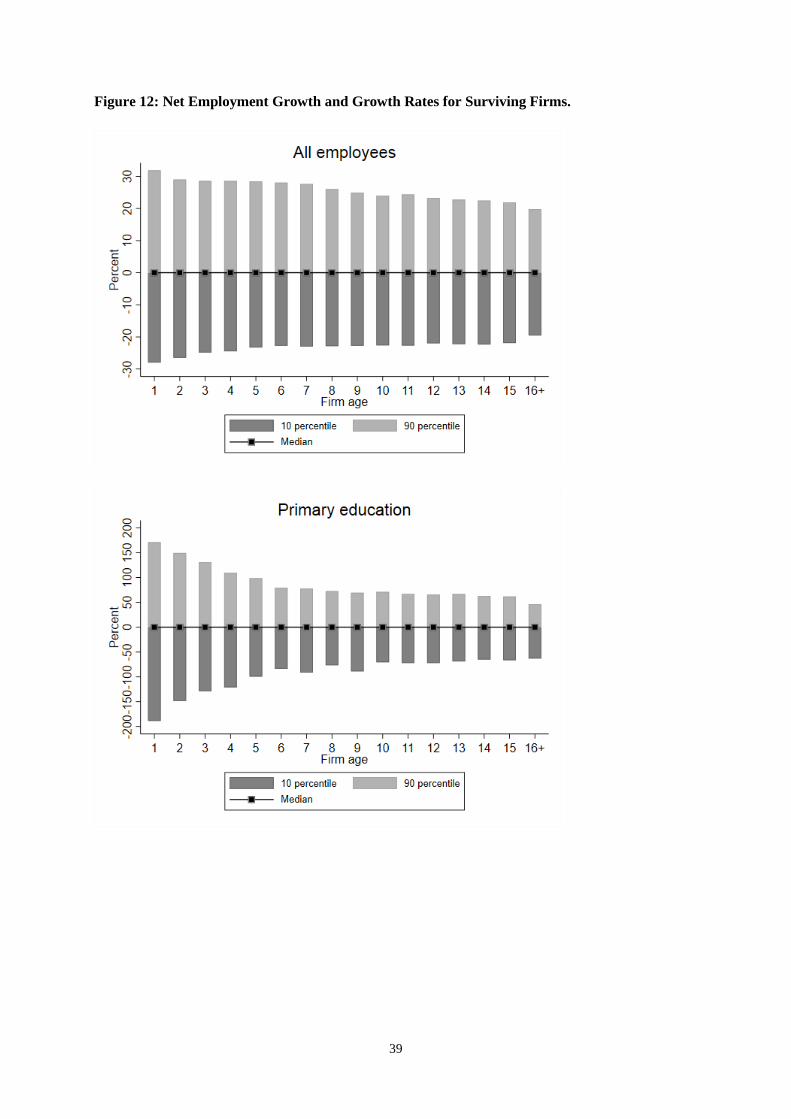
We continue the analysis by examining the arithmetic means of employment growth
at the firm level and for each age category. This exercise reveals large heterogeneity among
firms. In Figure 12, we illustrate the 90th, 50th, and 10th percentiles of job growth for surviving
firms by firm age for all employees and by educational level. Irrespective of educational level,
we observe that the median growth is declining with firm age, just as in the U.S. Comparing
the outliers, i.e., employment growth in the 90th and 10th percentiles, we see that the Swedish
outliers are not as extreme and do not vary quite as much. In unreported results, we compare
the median to the mean. As in the U.S., they are both decreasing with firm age. However, in
Sweden the median growth is higher than the mean growth—this is contrast to the U.S., where
the mean is consistently larger than the median.
-- Figure 12 about here –
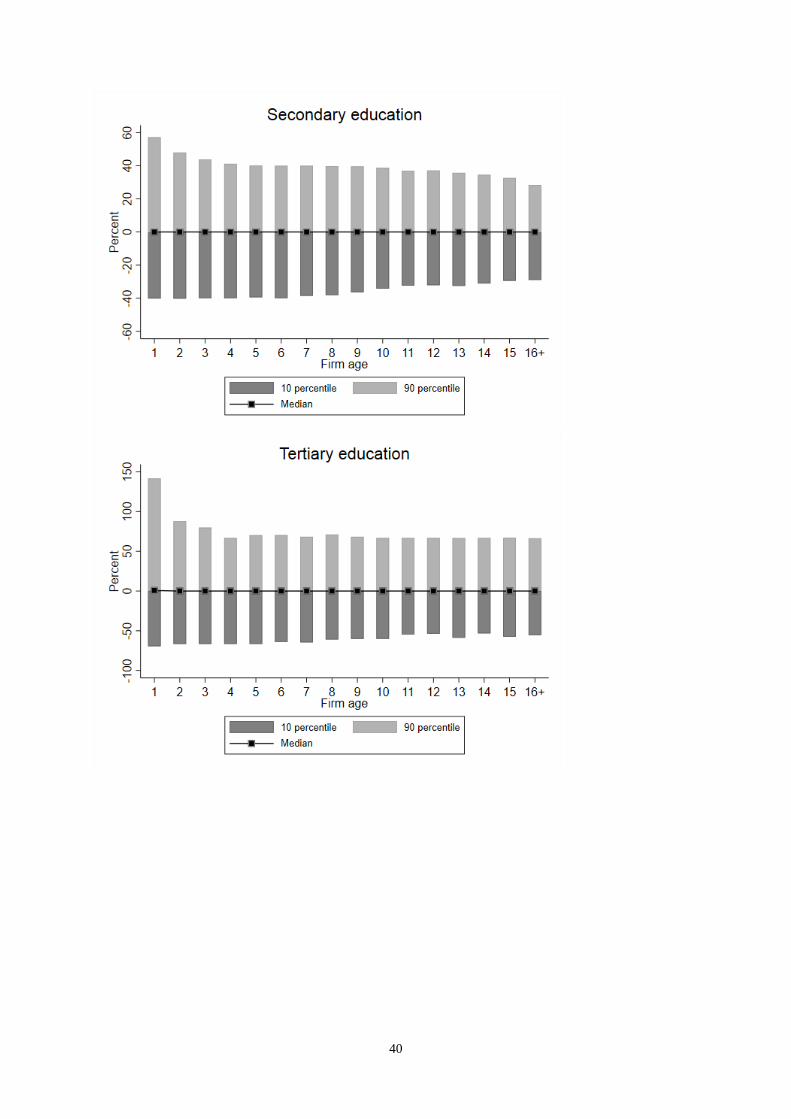
To shed more light on the post-entry dynamics of young firms, we follow Decker et.
al. (2016) and investigate the firm growth rate distribution. Decker et. al. (2016) find that the
skewness in the firm growth distribution has declined in the US. In Figure 13, we present
different measures of the skewness of the employment growth distribution in Sweden. The top
panel depicts the 90–10 differential. This is the difference between the 90th and the 10th
percentile of the employment-weighted distribution of firm employment growth rates. The top
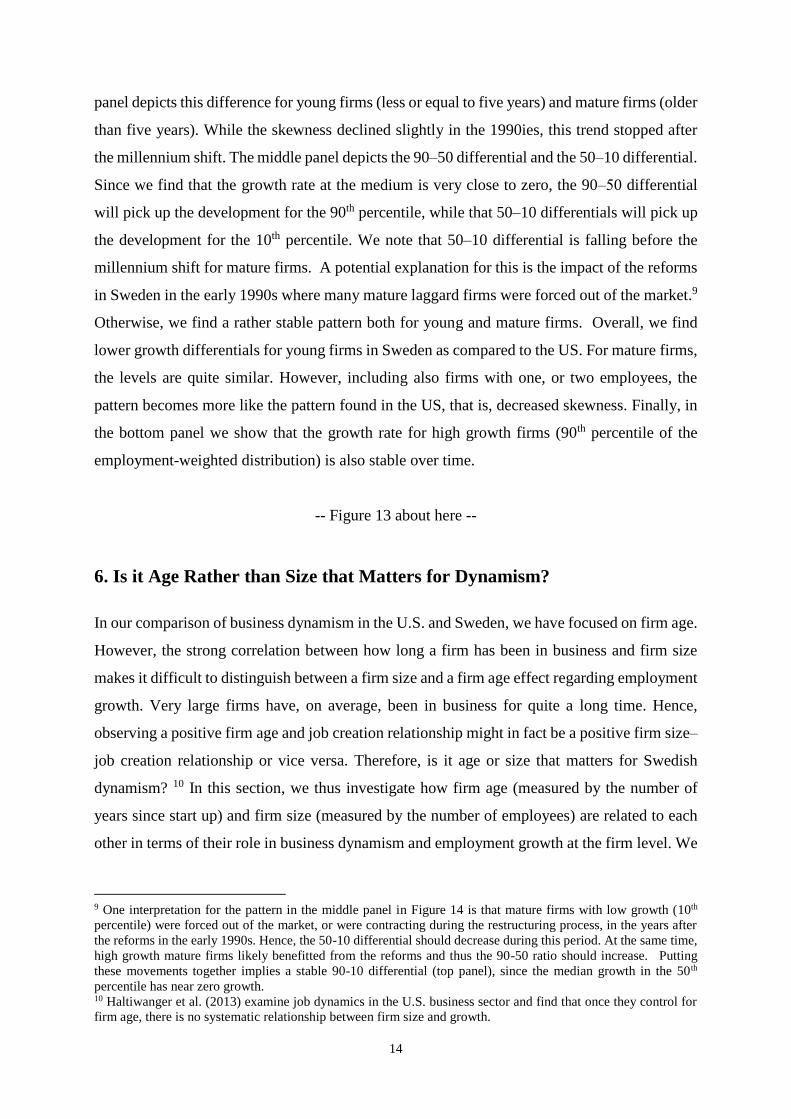
14
panel depicts this difference for young firms (less or equal to five years) and mature firms (older
than five years). While the skewness declined slightly in the 1990ies, this trend stopped after
the millennium shift. The middle panel depicts the 90‒50 differential and the 50‒10 differential.
Since we find that the growth rate at the medium is very close to zero, the 90‒50 differential
will pick up the development for the 90th percentile, while that 50‒10 differentials will pick up
the development for the 10th percentile. We note that 50‒10 differential is falling before the
millennium shift for mature firms. A potential explanation for this is the impact of the reforms
in Sweden in the early 1990s where many mature laggard firms were forced out of the market.9
Otherwise, we find a rather stable pattern both for young and mature firms. Overall, we find
lower growth differentials for young firms in Sweden as compared to the US. For mature firms,
the levels are quite similar. However, including also firms with one, or two employees, the
pattern becomes more like the pattern found in the US, that is, decreased skewness. Finally, in
the bottom panel we show that the growth rate for high growth firms (90th percentile of the
employment-weighted distribution) is also stable over time.
-- Figure 13 about here --
6. Is it Age Rather than Size that Matters for Dynamism?
In our comparison of business dynamism in the U.S. and Sweden, we have focused on firm age.
However, the strong correlation between how long a firm has been in business and firm size
makes it difficult to distinguish between a firm size and a firm age effect regarding employment
growth. Very large firms have, on average, been in business for quite a long time. Hence,
observing a positive firm age and job creation relationship might in fact be a positive firm size–
job creation relationship or vice versa. Therefore, is it age or size that matters for Swedish
dynamism? 10 In this section, we thus investigate how firm age (measured by the number of
years since start up) and firm size (measured by the number of employees) are related to each
other in terms of their role in business dynamism and employment growth at the firm level. We
9 One interpretation for the pattern in the middle panel in Figure 14 is that mature firms with low growth (10th
percentile) were forced out of the market, or were contracting during the restructuring process, in the years after
the reforms in the early 1990s. Hence, the 50-10 differential should decrease during this period. At the same time,
high growth mature firms likely benefitted from the reforms and thus the 90-50 ratio should increase. Putting
these movements together implies a stable 90-10 differential (top panel), since the median growth in the 50th
percentile has near zero growth. 10 Haltiwanger et al. (2013) examine job dynamics in the U.S. business sector and find that once they control for
firm age, there is no systematic relationship between firm size and growth.
15
then introduce workers’ educational background to the analysis to take into account job
heterogeneity.
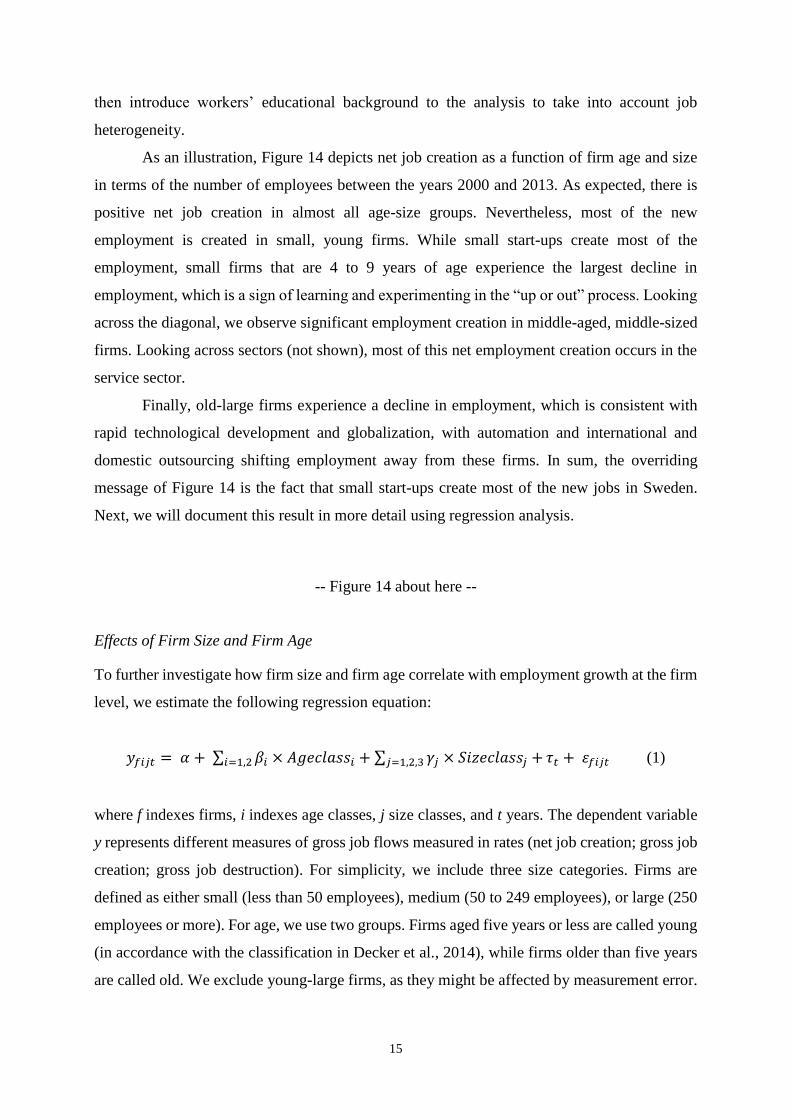
As an illustration, Figure 14 depicts net job creation as a function of firm age and size
in terms of the number of employees between the years 2000 and 2013. As expected, there is
positive net job creation in almost all age-size groups. Nevertheless, most of the new
employment is created in small, young firms. While small start-ups create most of the
employment, small firms that are 4 to 9 years of age experience the largest decline in
employment, which is a sign of learning and experimenting in the “up or out” process. Looking
across the diagonal, we observe significant employment creation in middle-aged, middle-sized
firms. Looking across sectors (not shown), most of this net employment creation occurs in the
service sector.
Finally, old-large firms experience a decline in employment, which is consistent with
rapid technological development and globalization, with automation and international and
domestic outsourcing shifting employment away from these firms. In sum, the overriding
message of Figure 14 is the fact that small start-ups create most of the new jobs in Sweden.
Next, we will document this result in more detail using regression analysis.
-- Figure 14 about here --
Effects of Firm Size and Firm Age
To further investigate how firm size and firm age correlate with employment growth at the firm
level, we estimate the following regression equation:
𝑦𝑓𝑖𝑗𝑡 = 𝛼 + ∑ 𝛽𝑖 × 𝐴𝑔𝑒𝑐𝑙𝑎𝑠𝑠𝑖 + ∑ 𝛾𝑗 × 𝑆𝑖𝑧𝑒𝑐𝑙𝑎𝑠𝑠𝑗 +𝑗=1,2,3𝑖=1,2 𝜏𝑡 + 휀𝑓𝑖𝑗𝑡 (1)
where f indexes firms, i indexes age classes, j size classes, and t years. The dependent variable
y represents different measures of gross job flows measured in rates (net job creation; gross job
creation; gross job destruction). For simplicity, we include three size categories. Firms are
defined as either small (less than 50 employees), medium (50 to 249 employees), or large (250
employees or more). For age, we use two groups. Firms aged five years or less are called young
(in accordance with the classification in Decker et al., 2014), while firms older than five years
are called old. We exclude young-large firms, as they might be affected by measurement error.
16
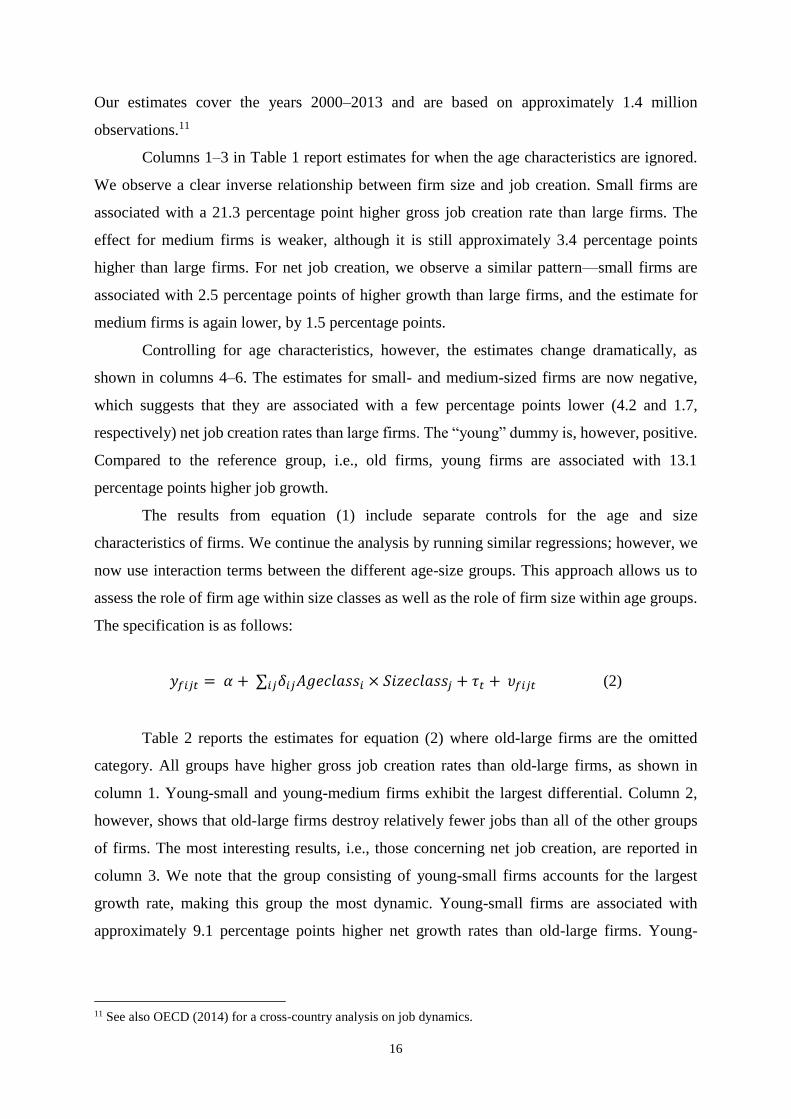
Our estimates cover the years 2000–2013 and are based on approximately 1.4 million
observations.11
Columns 1–3 in Table 1 report estimates for when the age characteristics are ignored.
We observe a clear inverse relationship between firm size and job creation. Small firms are
associated with a 21.3 percentage point higher gross job creation rate than large firms. The
effect for medium firms is weaker, although it is still approximately 3.4 percentage points
higher than large firms. For net job creation, we observe a similar pattern—small firms are
associated with 2.5 percentage points of higher growth than large firms, and the estimate for
medium firms is again lower, by 1.5 percentage points.
Controlling for age characteristics, however, the estimates change dramatically, as
shown in columns 4–6. The estimates for small- and medium-sized firms are now negative,
which suggests that they are associated with a few percentage points lower (4.2 and 1.7,
respectively) net job creation rates than large firms. The “young” dummy is, however, positive.
Compared to the reference group, i.e., old firms, young firms are associated with 13.1
percentage points higher job growth.
The results from equation (1) include separate controls for the age and size
characteristics of firms. We continue the analysis by running similar regressions; however, we
now use interaction terms between the different age-size groups. This approach allows us to
assess the role of firm age within size classes as well as the role of firm size within age groups.
The specification is as follows:
𝑦𝑓𝑖𝑗𝑡 = 𝛼 + ∑𝑖𝑗𝛿𝑖𝑗𝐴𝑔𝑒𝑐𝑙𝑎𝑠𝑠𝑖 × 𝑆𝑖𝑧𝑒𝑐𝑙𝑎𝑠𝑠𝑗 + 𝜏𝑡 + 𝜐𝑓𝑖𝑗𝑡 (2)
Table 2 reports the estimates for equation (2) where old-large firms are the omitted
category. All groups have higher gross job creation rates than old-large firms, as shown in
column 1. Young-small and young-medium firms exhibit the largest differential. Column 2,
however, shows that old-large firms destroy relatively fewer jobs than all of the other groups
of firms. The most interesting results, i.e., those concerning net job creation, are reported in
column 3. We note that the group consisting of young-small firms accounts for the largest
growth rate, making this group the most dynamic. Young-small firms are associated with
approximately 9.1 percentage points higher net growth rates than old-large firms. Young-
11 See also OECD (2014) for a cross-country analysis on job dynamics.
17
medium firms and old-medium firms also have higher net growth rates than old-large firms, but
on the contrary, old-small firms exhibit significantly lower net growth rates.
Note again that we follow the methodology of Davis et al. (1997), meaning that job
creation originates with either start-ups or expanding firms. Job destruction, on the other hand,
originates with either shutdowns or contracting firms. A possible explanation for the greater
dynamism among young firms, as demonstrated above, is the positive contribution of entry.
Hence, we repeat equations (1) and (2) but exclude entrants from the sample. As shown in
Tables 3 and 4, the estimates drop drastically for young firms, suggesting that the estimates in
Tables 1 and 2 indeed are driven by entrants. In fact, young firms now appear to have
approximately 30 percentage points lower net growth than old firms. We also observe a change
in sign for the young-small and young-medium firms. With entrants excluded, old-large firms
do in fact exhibit a greater growth rate than firms in the young-small and young-medium groups.
From the regression exercise above, we conclude that the main determinant in business
dynamism is firm age, not firm size. Entrants and young firms seem to play a major role in job
creation. Similar results can also be obtained when we divide the firms into five age categories
(aged 0–1 years, 2–3 years, 4–9 years, 10–13 years, or 14 years and older) and when analysing
differences across all firm age categories (results available upon request).
Thus, the firm size distribution in Sweden is not an important factor in explaining why
Sweden has avoided the same decline in entrepreneurship as the US over the recent decades. It
is firm age and not firm size that matters for Swedish dynamism.
7. Decline in Entrepreneurship: Why in the US but not in Sweden?
Why may entrepreneurial activity differ over time and between countries? There are several
possible sources for such differences. We will in this section discuss some possible explanations
for the observed over-time differences in entrepreneurial activity between Sweden and the US.
Differences in reform patterns?
A major difference between Sweden and the US is that a large reform package was
launched in Sweden during the early 1990s. During the 1970s and 1980s, Sweden was lagging

18
behind in productivity growth while experiencing high inflation and large budget deficits, and
in the early 1990s, Sweden was hit with a severe economic crisis. The 1991–1994 period was
characterized by a substantial decline in GDP and increasing unemployment. Previously, during
the 1980s, discussions about how to reform the Swedish welfare state had become increasingly
intensive. The centre-right government that came into power in 1991 was seemingly quick to
implement an economic policy based on extensive deregulation in response to the 1990 crisis.
Moreover, in 1993, the so-called Lindbeck Commission launched a large number of proposals
to improve the efficiency of the Swedish economy (SOU 1993:16). Some of these proposals
also concerned the business sector.12
We here describe crucial reforms that were implemented in the 1990s. We rely on
detailed descriptions of the Swedish business sector and the policy reforms that affected firms
in Sweden, as described by, e.g., Heyman, Norbäck and Persson (2015, 2018), and the
references therein.
Corporate Taxation Reforms in Sweden
Importantly, until 1991, the Swedish tax system favoured large firms and institutional
ownership (e.g., pension funds and insurance companies). The 1991 tax reform and subsequent
minor reforms considerably levelled the playing field for different combinations of owners and
sources of financing (Davis and Henrekson, 2000 and Edquist and Henrekson, 2013). The
reforms in the 1990s generated a tax system that was far more positive for individuals who
wished to start, develop, and act as controlling firm owners compared with the situation in the
1970s and 1980s.
However, only examining the (marginal) tax rates to judge a tax system’s effect on firm
performance is insufficient. Evaluating a tax system’s effect on corporate capital investment is
a complicated task. Many aspects, such as the project type and the financing form, need to be
considered. Here, the devil is in the details. A generally accepted method of evaluating a capital
tax system is to calculate the marginal effective tax rate (METR) on capital based on the method
originally presented by King and Fullerton (1984).
Devereux et al. (2002) use a simplified version of this method to compare the marginal
effective corporate taxes for a number of EU countries, Japan and the US in 1982 and 2001.
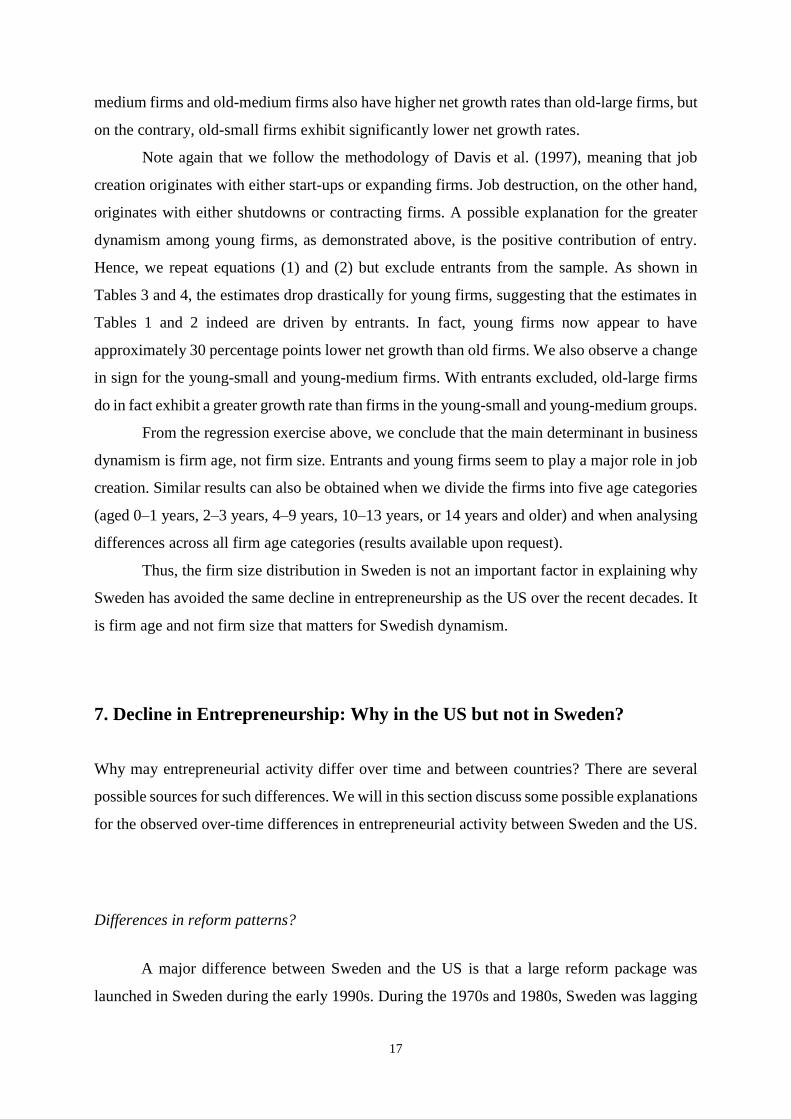
These comparisons are shown in Figure 15. The figure shows that Sweden had the second
12 See Lindbeck et al. (1994).
19
highest rate in 1982 at approximately 53 per cent but the second lowest rate in 2001 at
approximately 22 per cent. Hence, corporate taxes were reduced from very high levels to low
levels during the reforms of the 1990s.
-- Figure 15 about here --
Using the King and Fullerton (1984) approach, Stenkula et al. (2015) examine the
METR on capital for a longer period for Sweden. This study provides further evidence of
Sweden’s high METR for external capital (not retained earnings or institutional capital) in the
1980s (approximately 100 per cent) and its significant reduction in the 1991 tax reform. These
corporate and capital tax reforms created opportunities for firm development, particularly for
the growth of new small firms and firm formation.
The Deregulation of Product Markets in Sweden
The centre-right government that came to power in 1991 was seemingly intent on
implementing an economic policy based on extensive deregulation in response to the country’s
economic crisis in the 1990s. However, the possibility of making such reforms, e.g., the
deregulation of the air traffic system, the electricity market, and the postal service, had already
been thoroughly investigated, and government policies had previously been outlined in
government white papers prepared by the Social Democratic government in the late 1980s and
early 1990s. Moreover, in 1993 (SOU 1993:16), the so-called Lindbeck Commission presented
a number of proposals to improve the efficiency and functioning of markets in Sweden
(Lindbeck et al., 1994). Overall, the intensity of competition increased substantially in many
Swedish product markets during the 1990s.
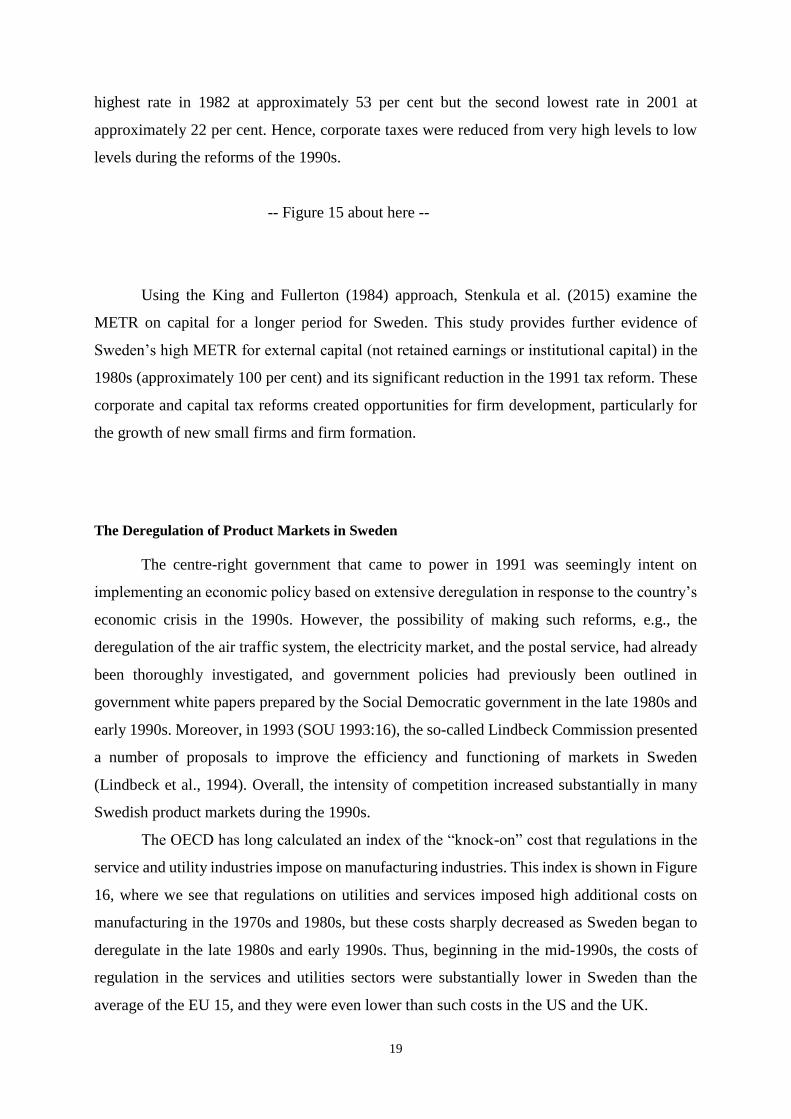
The OECD has long calculated an index of the “knock-on” cost that regulations in the
service and utility industries impose on manufacturing industries. This index is shown in Figure
16, where we see that regulations on utilities and services imposed high additional costs on
manufacturing in the 1970s and 1980s, but these costs sharply decreased as Sweden began to
deregulate in the late 1980s and early 1990s. Thus, beginning in the mid-1990s, the costs of
regulation in the services and utilities sectors were substantially lower in Sweden than the
average of the EU 15, and they were even lower than such costs in the US and the UK.

20
-- Figure 16 about here --
The OECD has also constructed indicators to measure developments in product market
regulation (PMR) across the OECD countries (Wölfl et al., 2009). Interestingly, the “barriers
to entrepreneurship” category has improved the most for Sweden. Between 1998 and 2008,
Swedish authorities made considerable improvements regarding licensing and permit systems
and communications. Moreover, simplifications of rules and procedures were made; legal
barriers were removed; and barriers to competition in network sectors and services were
reduced.
Importantly, these product market reforms made it easier for new firms to enter
industries as well as more difficult for old inefficient firms to remain in the product market.
Labor market reforms
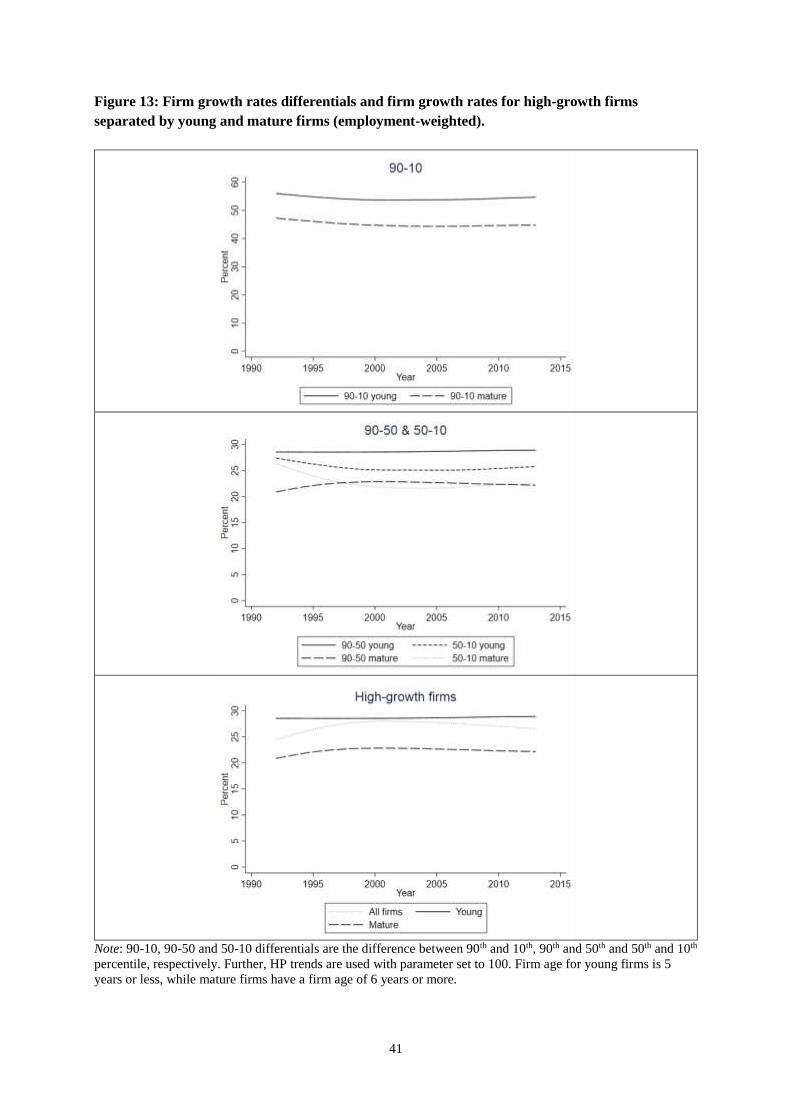
Figure 17 depicts the so-called Allard index of the strictness of employment protections
(Allard, 2005). This measure of the strictness of employment protections continued to increase
until the beginning of the 1990s. The average employment protection in the EU 15 countries
also increased over this period, though not to the same extent as in Sweden. The US labor
market continued to maintain a low level of employment protection.
-- Figure 17 about here --
Thus, the Swedish employment protection became substantially stricter in 1974. The
reason was that a new employment protection law (LAS) was implemented. The law mandated
that employees could not be fired without reasonable cause, such as abuse or a lack of work
opportunities. Insiders were also favored with respect to firing and hiring procedures through
the so-called “last in, first out” rule. Temporary contracts also became limited. However,
centralized bargaining for private-sector, blue-collar workers gradually broke down in the
1980s, and it was replaced by uncoordinated industry-level bargaining. Intermediate industry-
level bargaining is a form of collective bargaining that should be more conducive to wage
inflation. These actions made employment protection less strict. State-owned firms joined the
21
employers’ organization in 1994, which weakened the political influence in wage setting
(Nycander, 2008), and made employment protection even less strict. In 1997, the Industry
Agreement was concluded. The agreement included a system that continued industry-level
bargaining but with strong informal coordination based on pattern bargaining with the
manufacturing sector to conclude initial wage agreements in a bargaining round. This system
established a norm for wage increases for others to follow. The reformed wage-bargaining
system allowed for greater individual wage flexibility (Calmfors, 2012).
A major employment protection reform was implemented in 1992 that permitted staffing
agencies (Skedinger, 2010), and the regulations concerning temporary work were relaxed. This
development created what is referred to as the dual Swedish labor market, with strong
employment protections for regular workers and weak employment protections for temporary
workers. This reform was also evident in the Allard index of employment protection, which
declined significantly. Another measure of the strictness of employment protections from the
OECD demonstrates that the strictness of employment protections concerning temporary
contracts was significantly reduced in Sweden – from a very high level in 1985 to a very low
level in 2010. However, the strictness of the employment protections concerning regular
contracts remained at a relatively high level over the same period.
Summing up, these reforms removed barriers to entry and growth for new firms and
made the labor market more flexible. Reforms of the tax system created a system that made it
far more favorable to start and develop firms compared to the situation in the 1970s and 1980s.
Product market reforms were undertaken which not only made it easier for new firms to enter
the industries but also made it more difficult for inefficient firms to remain in the product
market. Labor market reforms were undertaken, which increased opportunities for firms to
better invest and reward human capital and for new, growing, productive firms to hire skilled
labor.
This development of a new business climate in Sweden since the early 1990s seems to
contrast with the development of the business climate in the U.S. as described by, among others,
Zingales (2012). First, the US business sector did not become as regulated as the Swedish
business sector in the 1970s and 1980s. Moreover, Zingales (2012) argues that during the last
decades that the U.S. has evolved into an economy that favors incumbents over entrants,
becoming “pro-business” instead of “pro-market”. Moreover, De Loecker and Eeckhout (2017),
who examines the evolution of U.S. mark-ups from 1950, find, among other things, that the
decline in job flows is driven by the rise of market power.

22
Differences in technological development?
An alternative explanation for why Sweden has not experienced the same slowdown of
entrepreneurial activity is that the technological shift over recent decades has stimulated
entrepreneurship in Sweden but not in the U.S. In particular, one could argue that technological
development typically first occurs in the U.S. and then in Sweden, which would imply that the
Swedish business sector, as a result, will be less entrepreneurial in the future. This explanation
seems consistent with the high entrepreneurial activity we document in the Swedish service
sector in comparison to the US service sector. Thus, it might be that the US has been early in
switching into a more service sector dominated economy and that Sweden soon will follow the
US in facing a slowdown in entrepreneurial activity.
However, Sweden has been in the forefront of the ICT driven industrial reorganization.
For instance, according to EU’s “Digital and society index” Sweden ranks as number two after
Denmark in Europe.13 In World Economic Forum’s “The Networked Readiness Index” Sweden
ranks as number three after Singapore and Finland14. Thus, Sweden, lagging behind in ICT
development, seems not to be the main explanation of the difference in the development in
business dynamism in Sweden and in the US.15
Differences in changes in the share of immigrants?
Another potential explanation is that immigrants are more likely to start new businesses
and that immigration flows have decreased in the U.S., while immigration flows has been
increasing in Sweden during the period under study. However, this explanation is unlikely,
since immigrants in Sweden are underrepresented as owners of firms with employees and
overrepresented as self-employed.16
Differences in changes in age structures or in population growth?
Yet another explanation is that the older societies become, the less entrepreneurial they
are, and the age structure in the U.S. may have changed in such a way that the U.S. is now less
prone to entrepreneurship compared to Sweden. Lazear, Liang and Wang (2014) analyze the
relationship between demographics and entrepreneurship using a human capital framework.
13 European Commission (2016), The Digital Economy and Society Index, https://ec.europa.eu/digital-single-
market/en/desi 14 World Economic Forum (2015), The global information technology report 2015,
http://www3.weforum.org/docs/WEF_Global_IT_Report_2015.pdf. 15 Interestingly, in their study of the Belgian business sector, Bijnens and Konings (2018) find preliminary
indications that industries with higher ICT intensity have experienced a steeper dynamism decline than other
industries. Belgium is not likely ahead of Sweden in adopting the new ICT. 16 Only about 13% of all firms with 0-49 employees have a foreign-born owner (Tillväxtanalys (2012)) whereas
Alden (2014) shows that most immigrant groups are overrepresented as self-employed.
23
Based on cross-country data from the Global Entrepreneurship Monitor, they find that a one-
standard-deviation decrease in the median age of a country increases the rate of
entrepreneurship by 2.5 percentage points, which is approximately 40 percent of the mean rate.
This seems as a potential part of the explanation for the slowdown of the entrepreneurial
activity in the US. Still, we see no evidence of a decrease in entrepreneurial activity is Sweden
despite an ageing population. The median age has increased in Sweden from 38.4 years in 1990
to 40.7 years in 2010. The corresponding numbers for the US are 32.9 in year 1990 and 37.2 in
2010.17
What role do population and working age population growth play for the evolution of
start-up rates in Sweden? Karahan et al. (2016) put forward that demographic shifts in the
growth rates of the labor supply is an important factor behind the declining start-up rates in the
US. They show empirically that the decline in growth rates of the labor supply explains a
significant share of the startup-up decline in the US during the last 30 years. While a detailed
empirical analysis is beyond the scope of this paper, we have correlated Swedish start-up rates
during the period 1996-2013 with different measures of labor supply. Using time-series data on
growth in the Swedish labor force and the Swedish working age population, we find no clear
correlations.18 However, it should be noted that the growth in the Swedish labor force and the
Swedish working age population has been stable over the period compared to the US where
these factors have varied more. Thus, Sweden’s high start-up rates are likely supported by a
stable population and labor force growth. A stable population and labor force growth might
however mask substantial regional differences. In future work, it would be interesting to explore
the regional dimension of population and labor force growth and start-up rates.
8. Summary and Conclusions
We take as our point of departure the more than 30-year decline in entrepreneurship dynamism
and activity by young firms documented in the U.S. (see e.g., Decker et al., 2014 and Hathaway
and Litan, 2014). Using detailed Swedish employer-employee data over the period 1990–2013,
we observe no decline or a smaller and later decline in Sweden for different measures of
entrepreneurial activity. In particular, we find an increase in the start-up activity. We also find
17 https://www.statista.com/statistics/375459/average-age-of-the-population-in-sweden/ and
https://www.statista.com/statistics/241494/median-age-of-the-us-population/. 18 Analysis available on request from authors.

24
an increase in job destruction rates in the year after entry (firms of age one). This increase in
job destruction starts to dominate the increase in start-up activity around 2005 giving rise to a
small decrease in employment share for young firms in the business sector. Moreover, we find
that most of the job creation by young firms occurs in the expanding service sector.
What can explain this different pattern? We have argued that a likely explanation for
the high entrepreneurial activity in the Swedish business sector was a set of policy reforms that
were initiated in the late 1980s but mostly implemented in the 1990s. Sweden went from having
one of the most regulated, static business sectors in the developed world in the late 1980s to
one of the more pro-entrepreneurial business regulation systems in the developed world. A
potential weakness in the dynamics of the Swedish business sector can be the relatively high
job destructions rates of firms of age 1 and 2. Moreover, it should also be noted that the reform
pace in business policy has substantially haltered in the Swedish business sector the last decades
suggesting that the recent trend of less dynamism in the Swedish business sector might be here
to stay.
A welfare analysis of the observed pattern would be of interest. If the different pace of
adjustment in Sweden and the US is due to differences in burdensome regulation and
institutions, this has potentially large adverse consequences for long-run job and productivity
growth. On the other hand, if the driving force is the implementation of ICT, then the welfare
consequences will be different. Research along these lines seems highly warranted.
In our analysis of Sweden, we focused on the total effect of the extensive and wide-
ranging business sector reforms. An interesting avenue for future research would be to examine
in greater detail the effects of the different reforms on entrepreneurial activity in the business
sector. Moreover, it would be interesting to see whether such reforms in isolation might be
sufficient to improve entrepreneurial activity or if it is a package that is needed to create a
strong, lasting effect.

25
References
Acemoglu, Daron (2008). “Oligarchic Versus Democratic Societies”. Journal of the European
Economic Association 6(1), 1–44.
Acs, Zoltan J. and David B. Audretsch (2005). “Entrepreneurship, Innovation and
Technological Change”. Foundations and Trends in Entrepreneurship 1(4), 149–195.
Aldén, Lina (2014). Företagande bland utrikes födda – en översikt och en policydiskussion.
Allard, G. 2005. “Measuring job security over time: in search of a historical indicator for EPL
(Employment Protection Legislation)”. Working Paper 05-17. Instituto de Empresa,
Madrid.
Andersson, Jan and Gunnar Arvidson (2001). Företagens och arbetsställenas dynamik (FAD).
Örebro: Statistics Sweden.
Anyadike-Danes, Michael, Carl-Magnus Bjuggren, Sandra Gottschalk, Werner Hölzl, Dan
Johansson, Mika Maliranta and Anja Myrann (2015). “An international cohort comparison
of size effects on job growth”. Small Business Economics, 44(4), 821-844.
Arrunada, Benito (2007). “Pitfalls to avoid when measuring institutions: Is Doing Business
damaging business?”. Journal of Comparative Economics 35(4), 729–47.
Autio, Erkko and Heikki Rannikko (2016). “Retaining winners: Can policy boost high-
growth entrepreneurship?”. Research Policy 45(1), 42-55.
Bijnens, Gert and Jozef Konings (2018). “Declining Business Dynamism”. CEPR Discussion
Paper No. DP12615.
Branstetter, Lee, Francisco Lima and Lowell J. Taylor (2014). “Do Entry Regulations Deter
Entrepreneurship and Job Creation? Evidence from Recent Reforms in Portugal”.
Economic Journal 124(577), 805–832.
Braunerhjelm, Pontus and Bo Carlsson (1993). “Entreprenörskap, småföretag och industriell
förnyelse 1968–1991”. Research Institute of Industrial Economics (IFN) Working Paper
No. 372. IFN, Stockholm.
Bravo-Biosca, Albert, Chiara Criscuolo and Carlo Menon (2016). “What drives the dynamics
of business growth?”. Economic Policy 31(88), 703-742.

26
Calmfors, L. 2012. “Sweden: from macroeconomic failure to macroeconomic success.”
Working Paper 3790, Category 6: Fiscal Policy, Macroeconomics and Growth. CESifo,
Munich.
Calvino, Flavino, Chaiara Criscuolo and Carlo Menon (2015). “Cross-country evidence on
start-up dynamics”, OECD Science, Technology and Industry Working Papers 2015 (6).
Carroll, Robert , Douglas Holtz-Eakin, Mark Rider and Harvey S. Rosen (2000). “Income
taxes and entrepreneurs' use of labor”, Journal of Labor Economics, 18(2), 324–351.
Carroll, Robert , Douglas Holtz-Eakin, Mark Rider and Harvey S. Rosen (2001). “Personal
income taxes and the growth of small firms”, Tax Policy and the Economy, 15, 121–148.
Criscuolo, Chiara, Peter N. Gal and Carlo Menon (2014). “The Dynamics of Employment
Growth: New Evidence from 18 Countries”. CEP Discussion Paper, Vol. 1274.
Ciccone, Antonio and Elias Papaioannou (2007). “Red Tape and Delayed Entry”. Journal of
the European Economic Association 5(2–3), 444–458.
Da Rin, Marco, Marina Di Giacomo, and Alessandro Sembenelli (2011). “Entrepreneurship,
firm entry, and the taxation of corporate income: evidence from Europe”, Journal of Public
Economics, 95(9), 1048–1066.
Davis, Steven J., John Haltiwanger and Scott Schuh (1997). Job Creation and Destruction.
Cambridge, MA: MIT Press.
Decker, Ryan, John Haltiwanger, Ron Jarmin and Javier Miranda (2014). “The Role of
Entrepreneurship in US Job Creation and Economic Dynamism”. Journal of Economic
Perspectives 28(3), 3–24.
De Loecker, Jan and Jan Eeckhout (2017). “The Rise of Market Power and the
Macroeconomic Implications”. Working Paper No. 23687, National Bureau of Economic
Research.
Devereux, Michael P., Rachel Griffith, and Alexander Klemm. 2002. “Corporate Income Tax
Reforms and Tax Competition.” Economic Policy 17(35), 449–495
Djankov, Simeon, Rafael La Porta, Florencio Lopez-de-Silanes and Andrei Shleifer (2002).
“The Regulation of Entry”. Quarterly Journal of Economics 117(1), 1–37.
Djankov, Simeon (2009). “The Regulation of Entry: A Survey”. World Bank Research
Observer 24(2), 183–203.

27
Edquist, Harald, and Magnus Henrekson. 2013. “Product market reforms and incentives to
innovate in Sweden.” In M. Choupres, and H. Edquist, eds., What can we learn from
economic reforms in Greece and Sweden? Brussels: European Liberal Forum.
European Commission (2016). The Digital Economy and Society Index.
Färnstrand Damsgaard, Erika, Per Hjertstrand, Pehr-Johan Norbäck, Lars Persson and Helder
Vasconcelos (2017). “Why Entrepreneurs Choose Risky R&D Projects–But Still Not
Risky Enough”. The Economic Journal 127(605), F164-F199.
Haltiwanger, John, Ron S. Jarmin and Javier Miranda (2013). “Who Creates Jobs? Small
Versus Large Versus Young”. The Review of Economics and Statistics 95(2), 347–361.
Hathaway, Ian and Robert Litan (2014). “The Other Aging of America: The Increasing
Dominance of Older Firms”. Brookings Institution Report July 2014. Washington, D.C.:
Brookings Institution.
Henrekson, Magnus and Dan Johansson (1999). “Institutional Effects on the Evolution of the
Size Distribution of Firms”. Small Business Economics 12(1), 11–23.
Henrekson, Magnus and Dan Johansson (2009). “Competencies and Institutions Fostering
High-Growth Firms”. Foundations and Trends in Entrepreneurship 5(1), 1–82.
Heyman, Fredrik, Pehr-Johan Norbäck and Lars Persson (2015). “The Turnaround of Swedish
Industry: Reforms, Firm Diversity and Job and Productivity Dynamics”. Research Institute
of Industrial Economics (IFN) Working Paper No. 1079. Stockholm: IFN.
Heyman, Fredrik, Pehr-Johan Norbäck and Lars Persson (2018). “Who Creates Jobs and Who
Creates Productivity? Small versus Large versus Young versus Old”. Economics Letters 164
(March), 50–57.
Karahan, Fatih, Benjamin Pugsley, and Aysegul Sahin. “Demographic Origins of the Startup
Deficit.” Technical Report. New York Fed, mimeo, 2016.
King, Mervyn A. and Don Fullerton (1984). The Taxation of Income from Capital: A
Comparative Study of the United States, the United Kingdom, Sweden and West Germany.
Chicago: University of Chicago Press.
Klapper, Leora, Luc Laeven and Raghuram Rajan (2006). “Entry Regulation as a Barrier to
Entrepreneurship”. Journal of Financial Economics 82(3), 591–629.

28
Kneller, Richard, and Danny McGowan (2012). “Tax policy and firm entry and exit
dynamics: evidence from OECD countries”, Working Papers No. 12006, Bangor Business
School, Prifysgol Bangor University (Cymru / Wales).
Lazear, Edward, James Liang and Hui Jackie Wang (2014). “Demographics and
Entrepreneurship”. Stanford Graduate School of Business Working Paper No. 4320.
Stanford, CA: Stanford Graduate School of Business.
Lindbeck, Assar, Per Molander, Torsten Persson, Olof Petersson, Agnar Sandmo, Birgitta
Swedenborg and Niels Thygesen (1994). Turning Around Sweden. Cambridge, MA: MIT
Press.
Mason, Colin and Ross Brown (2013). “Creating Good Public Policy to Support High-Growth
Firms”. Small Business Economics 40(2), 211–225.
Minniti, Maria (2008). “The Role of Government Policy on Entrepreneurial Activity:
Productive, Unproductive, or Destructive?”. Entrepreneurship Theory and Practice 32(5),
779–790.
Mthanti, Thanti and Kalu Ojah (2017). “Entrepreneurial orientation (EO): Measurement and
policy implications of entrepreneurship at the macroeconomic level”, Research Policy
46(4), 724-739.
Neumark, David, Brandon Wall and Junfu Zhang (2011). “Do Small Businesses Create More
Jobs? New Evidence for the United States from the National Establishment Time Series”.
The Review of Economics and Statistics 93(1), 16-29.
OECD (2014). The Dynamics of Employment Growth. Paris: OECD.
Parker, Simon C. (2007). “Law and the Economics of Entrepreneurship”. Comparative Labor
Law and Policy Journal 28(4), 695–716.
Perotti, Enrico and Paolo Volpin (2005). “Lobbying On Entry”. CEPR Discussion Paper No.
4519. London: CEPR.
Prantl, Susanne (2012). “The Impact of Firm Entry Regulation on Long-Living Entrants”.
Small Business Economics 39(1), 61–76.
Román, Concepción, Emilio Congregado and José María Millán (2013). “Start-Up Incentives:
Entrepreneurship Policy or Active Labour Market Programme?”. Journal of Business
Venturing 28(1), 151–175.
29
Santarelli, Enrico and Marco Vivarelli (2007). “Entrepreneurship and the Process of Firms’
Entry, Survival and Growth”. Industry and Corporate Change 16(3), 455–488.
Shane, Scott (2009). “Why Encouraging More People to Become Entrepreneurs is Bad Public
Policy”. Small Business Economics 33(2), 141–149.
Skedinger, P. 2010. Employment protection legislation. Evolution, effects, winners and losers.
Northampton, MA: Edward Elgar.
SOU (1993:16). Nya villkor för ekonomi och politik. Stockholm: Allmänna förlaget.
Stenkula, M., D. Johansson, and G. Du Rietz. 2015. “Capital income taxation of Swedish
households, 1862 to 2010.” Scandinavian Economic History Review 63 (2) : 154–77.
Stigler, George J. (1971). “The Theory of Economic Regulation”. Bell Journal of Economics
and Management Science 2(1), 3–21.
Tillväxtanalys (2012). Statligt stöd till näringslivet 2011. Report 2012:05. Östersund: Growth
Analysis.
Van Stel, André, David J. Storey and A. Roy Thurik (2007). “The Effect of Business
Regulations on Nascent and Young Business Entrepreneurship”. Small Business
Economics 28(2), 171–186.
Viscusi, W. Kip, John M. Vernon and Joseph E. Harington (2005). Economics of Regulation
and Antitrust. Cambridge, MA: MIT Press.
World Economic Forum (2015). The Global Information Technology Report 2015.
Wölfl, A., I. Wanner, T. Kozluk, and G. Nicoletti. 2009. “Ten years of product market reform
in OECD countries: insights from a revised PMR indicator.” Working Paper 695. OECD
Economic Department, OECD Publishing, Paris.
Zingales, Luigi (2012). A Capitalism for the People. New York, NY: Basic Books.

30
Figures
Figure 1: Declining Share of Activity from Young Firms in the US (firms aged 5 years or
less). Firms with at least one employee.
Source: Decker et al. (2014).
Figure 2: New Firms in the Swedish Manufacturing Sector (% of stock).
Source: Braunerhjelm and Carlsson (1993)
0
2
4
6
8
10
12
14
16
18
25
27
29
31
33
35
37
39
41
43
45P
ercent
Per
cent
Share of firms, (US, left)
Share of job creation (US, left)
Share of employment (US, right)
0
1
2
3
4
5
6
31
Figure 3: Share of Activity from Young Firms in Sweden.

32
Figure 4: Share of Activity from Young Firms in Sweden. Share of employment and
share of firms by firm age.
33
Figure 5: Share of Activity from Young Firms in Sweden. Share of job creation and job
destruction by firm age.

34
Figure 6: Annual & employment-weighted annual firm entry and firm exit rates by firm
age.

35
Figure 7: Annual job destruction rates for continuing firms by firm age.
Figure 8: Share of Activity from Young Firms in Sweden by Sector, 1996–2013.

36
Figure 9: Activity from Young Firms in Sweden by Education (share of employment and job
creation).

37
Figure 10: Up or Out Dynamic for Young Firms in Sweden, 2002–2013.
Note: In the lower panel, we exclude firms aged 1 year or less for aesthetic reasons—the rates are much higher
than for the remaining groups.
38
Figure 11: Up or Out Dynamic for Young Firms in Sweden by Education, 2002–2013.
Note: See Figure 10.
39
Figure 12: Net Employment Growth and Growth Rates for Surviving Firms.
40
41
Figure 13: Firm growth rates differentials and firm growth rates for high-growth firms
separated by young and mature firms (employment-weighted).
Note: 90-10, 90-50 and 50-10 differentials are the difference between 90th and 10th, 90th and 50th and 50th and 10th
percentile, respectively. Further, HP trends are used with parameter set to 100. Firm age for young firms is 5
years or less, while mature firms have a firm age of 6 years or more.

42
Figure 14: Net Job Creation by Age and Size, 2000–2013.
-0,2
-0,1
0
0,1
0,2
0,3
0,4
1 2 3 4 5
Net jobcreation
Firm age
3-9
10-49
50-199
200-499
500-

43
Figure 15: International evidence on effective marginal corporate tax rates.
Notes: Replication of author’s Figure 5, pg. 462, “Calculations based on a hypothetical investment in plant and
machinery for one period, financed by equity or retained earnings (but not debt). Taxation at the shareholder level
is not included. The project is expected to break even, i.e., there is no economic rent. Other assumptions are that
the real discount rate is 10 per cent, the inflation rate 3.5 per cent, and the depreciation rate is 12.25 per cent”.
Source: Devereux et al. (2002).
Figure 16: Regulation impacts, 1975–2007.
Notes: Measurement of potential costs of anti-competitive regulation in intermediate input sectors. The EU 15
values are based on our calculations, and they exclude Luxembourg. Source: OECD Indicators of Regulation
Impact. Figure 3 in Heyman, Norbäck and Persson (2018).
44
Figure 17: Employment protection legislation, 1950–2003.
Notes: Scale 0–5, the higher the index is, the stricter the employment protection legislation is. The EU 15 values
are based on our calculations, and they exclude Luxembourg. Source: Allard (2005). Figure 2 in Heyman, Norbäck
and Persson (2018).
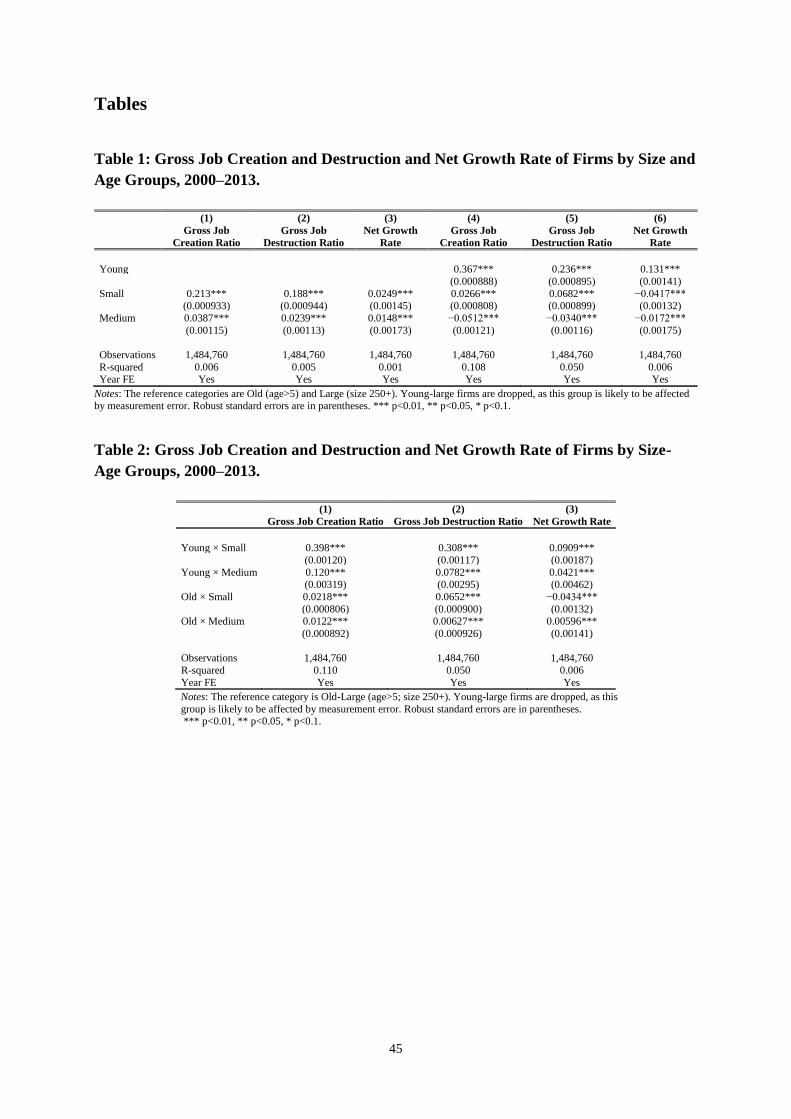
45
Tables
Table 1: Gross Job Creation and Destruction and Net Growth Rate of Firms by Size and
Age Groups, 2000–2013.
(1) (2) (3) (4) (5) (6)
Gross Job
Creation Ratio
Gross Job
Destruction Ratio
Net Growth
Rate
Gross Job
Creation Ratio
Gross Job
Destruction Ratio
Net Growth
Rate
Young 0.367*** 0.236*** 0.131***
(0.000888) (0.000895) (0.00141)
Small 0.213*** 0.188*** 0.0249*** 0.0266*** 0.0682*** −0.0417*** (0.000933) (0.000944) (0.00145) (0.000808) (0.000899) (0.00132)
Medium 0.0387*** 0.0239*** 0.0148*** −0.0512*** −0.0340*** −0.0172***
(0.00115) (0.00113) (0.00173) (0.00121) (0.00116) (0.00175)
Observations 1,484,760 1,484,760 1,484,760 1,484,760 1,484,760 1,484,760
R-squared 0.006 0.005 0.001 0.108 0.050 0.006
Year FE Yes Yes Yes Yes Yes Yes
Notes: The reference categories are Old (age>5) and Large (size 250+). Young-large firms are dropped, as this group is likely to be affected by measurement error. Robust standard errors are in parentheses. *** p<0.01, ** p<0.05, * p<0.1.
Table 2: Gross Job Creation and Destruction and Net Growth Rate of Firms by Size-
Age Groups, 2000–2013.
(1) (2) (3)
Gross Job Creation Ratio Gross Job Destruction Ratio Net Growth Rate
Young × Small 0.398*** 0.308*** 0.0909***
(0.00120) (0.00117) (0.00187)
Young × Medium 0.120*** 0.0782*** 0.0421*** (0.00319) (0.00295) (0.00462)
Old × Small 0.0218*** 0.0652*** −0.0434***
(0.000806) (0.000900) (0.00132) Old × Medium 0.0122*** 0.00627*** 0.00596***
(0.000892) (0.000926) (0.00141)
Observations 1,484,760 1,484,760 1,484,760
R-squared 0.110 0.050 0.006
Year FE Yes Yes Yes
Notes: The reference category is Old-Large (age>5; size 250+). Young-large firms are dropped, as this
group is likely to be affected by measurement error. Robust standard errors are in parentheses. *** p<0.01, ** p<0.05, * p<0.1.

46
Table 3: Gross Job Creation and Destruction and Net Growth Rate of Firms by Size and
Age Groups Excluding Entrants, 2000–2013.
(1) (2) (3) (4) (5) (6)
Gross Job
Creation Ratio
Gross Job
Destruction Ratio
Net
Growth
Rate
Gross Job
Creation Ratio
Gross Job
Destruction Ratio
Net
Growth
Rate
Young 0.0140*** 0.314*** −0.300***
(0.000216) (0.00104) (0.00112) Small 0.0277*** 0.213*** −0.185*** 0.0213*** 0.0695*** −0.0482***
(0.000789) (0.000970) (0.00137) (0.000793) (0.000904) (0.00132) Medium 0.0188*** 0.0246*** −0.0057*** 0.0155*** −0.0497*** 0.0652***
(0.000876) (0.00113) (0.00156) (0.000875) (0.00120) (0.00162)
Observations 1,349,168 1,349,168 1,349,168 1,349,168 1,349,168 1,349,168
R-squared 0.002 0.006 0.005 0.005 0.078 0.063
Year FE Yes Yes Yes Yes Yes Yes
Notes: See Table 1.
Table 4: Gross Job Creation and Destruction and Net Growth Rate of Firms by Size-
Age Groups Excluding Entrants, 2000–2013.
(1) (2) (3)
Gross Job Creation Ratio Gross Job Destruction Ratio Net Growth Rate
Young × Small 0.0350*** 0.388*** −0.353***
(0.000801) (0.00129) (0.00164) Young × Medium 0.0405*** 0.0835*** −0.0431***
(0.00130) (0.00306) (0.00354)
Old × Small 0.0216*** 0.0652*** −0.0436*** (0.000793) (0.000905) (0.00132)
Old × Medium 0.0121*** 0.00631*** 0.00582***
(0.000878) (0.000931) (0.00142)
Observations 1,349,168 1,349,168 1,349,168
R-squared 0.006 0.080 0.064
Year FE Yes Yes Yes
Notes: See Table 2.

47
Appendix
Table A1: Job Flows at the Firm Level, Percentages, 1990–2013.
Year NEW EXP NEW+EXP=JC EXIT DECL EXIT+DECL=JD NET=JC-JD JR=JC+JD
1991 2.53 4.17 6.70 2.43 6.73 9.16 −2.46 15.86
1992 2.62 3.21 5.84 3.29 9.42 12.71 −6.87 18.54
1993 2.60 3.32 5.92 3.11 9.55 12.66 −6.74 18.58
1994 2.86 6.53 9.39 2.47 4.28 6.75 2.64 16.14
1995 2.77 6.29 9.07 2.41 3.72 6.13 2.94 15.20
1996 2.28 4.84 7.12 2.26 4.64 6.90 0.22 14.01
1997 3.40 5.25 8.65 3.24 5.58 8.82 −0.17 17.47
1998 3.36 6.84 10.20 2.89 3.78 6.67 3.53 16.87
1999 4.17 5.96 10.13 3.47 4.54 8.01 2.12 18.14
2000 5.36 6.48 11.84 4.32 4.01 8.33 3.50 20.17
2001 4.17 5.38 9.55 3.84 4.73 8.57 0.97 18.12
2002 3.33 5.86 9.19 3.32 4.15 7.47 1.72 16.66
2003 2.97 4.76 7.73 2.97 5.13 8.10 −0.37 15.83
2004 3.11 5.50 8.60 2.92 4.49 7.41 1.19 16.02
2005 3.54 5.17 8.71 3.19 4.65 7.85 0.87 16.56
2006 4.22 5.78 10.00 3.65 3.99 7.65 2.35 17.65
2007 4.78 6.06 10.84 4.03 3.56 7.59 3.25 18.43
2008 4.39 5.16 9.55 3.51 4.03 7.53 2.02 17.08
2009 3.35 4.15 7.50 3.37 7.22 10.59 −3.09 18.08
2010 4.30 5.89 10.18 3.50 3.77 7.27 2.91 17.45
2011 4.49 5.42 9.91 4.29 4.04 8.34 1.58 18.25
2012 4.06 5.27 9.33 3.65 3.99 7.63 1.69 16.96
2013 4.05 5.01 9.06 3.69 4.32 8.00 1.06 17.06
Average 3.60 5.32 8.91 3.30 4.97 8.27 0.65 17.18