Has it Pierced or Yet To Pierce? A Critical Analysis of E ...
26
Feb.2017 155 IRA-International Journal of Management & Social Sciences ISSN 2455-2267; Vol.06, Issue 02 (2017) Pg. no. 155-180 Institute of Research Advances http://research-advances.org/index.php/RAJMSS Has it Pierced or Yet To Pierce? A Critical Analysis of E-Retailing’s Penetration into Rural India using Extended Technology Acceptance [TAM2] 1 N. Jaysheelan Research Scholar, Annamalai University, Annamalai Nagar, Chidambaram, Tamil Nadu, India. 2 Dr. R .Hariharan Assistant Professor, Centre for Rural Development, Annamalai University, Annamalai Nagar, Chidambaram, Tamil Nadu, India. 3 Dr. G. P. Dinesh B.E.[Mech], Ph.D Dean - Dept of Mgt Studies, Ballari Institute of Technology & Management, Jnana Gangotri Campus, Allipur (V), Hospet Road, Bellary – 583.104., Karnataka, India. Type of Review: Peer Reviewed. DOI: http://dx.doi.org/10.21013/jmss.v6.n2.p4 How to cite this paper: Jaysheelan, N., Hariharan, R., & Dinesh, G. (2017). Has it Pierced or Yet To Pierce? A Critical Analysis of E-Retailing‟s Penetration into Rural India using Extended Technology Acceptance [TAM2]. IRA-International Journal of Management & Social Sciences (ISSN 2455-2267), 6(2), 155-180. doi:http://dx.doi.org/10.21013/jmss.v6.n2.p4 © Institute of Research Advances This work is licensed under a Creative Commons Attribution-Non Commercial 4.0 International License subject to proper citation to the publication source of the work. Disclaimer: The scholarly papers as reviewed and published by the Institute of Research Advances (IRA) are the views and opinions of their respective authors and are not the views or opinions of the IRA. The IRA disclaims of any harm or loss caused due to the published content to any party.
Transcript of Has it Pierced or Yet To Pierce? A Critical Analysis of E ...
Feb.2017
155
IRA-International Journal of Management &
Social Sciences
ISSN 2455-2267; Vol.06, Issue 02 (2017)
Pg. no. 155-180
Institute of Research Advances
http://research-advances.org/index.php/RAJMSS
Has it Pierced or Yet To Pierce? A Critical
Analysis of E-Retailing’s Penetration into
Rural India using Extended Technology
Acceptance [TAM2] 1N. Jaysheelan
Research Scholar, Annamalai
University, Annamalai Nagar,
Chidambaram, Tamil Nadu, India.
2Dr. R .Hariharan
Assistant Professor, Centre for Rural
Development, Annamalai University,
Annamalai Nagar, Chidambaram,
Tamil Nadu, India.
3Dr. G. P. Dinesh B.E.[Mech], Ph.D
Dean - Dept of Mgt Studies, Ballari Institute of Technology & Management, Jnana
Gangotri Campus, Allipur (V), Hospet Road, Bellary – 583.104., Karnataka, India.
Type of Review: Peer Reviewed.
DOI: http://dx.doi.org/10.21013/jmss.v6.n2.p4
How to cite this paper: Jaysheelan, N., Hariharan, R., & Dinesh, G. (2017). Has it Pierced or Yet To Pierce? A Critical
Analysis of E-Retailing‟s Penetration into Rural India using Extended Technology Acceptance
[TAM2]. IRA-International Journal of Management & Social Sciences (ISSN 2455-2267), 6(2),
155-180. doi:http://dx.doi.org/10.21013/jmss.v6.n2.p4
© Institute of Research Advances
This work is licensed under a Creative Commons Attribution-Non Commercial 4.0
International License subject to proper citation to the publication source of the work.
Disclaimer: The scholarly papers as reviewed and published by the Institute of Research
Advances (IRA) are the views and opinions of their respective authors and are not the
views or opinions of the IRA. The IRA disclaims of any harm or loss caused due to the
published content to any party.
IRA-International Journal of Management & Social Sciences
156
ABSTRACT
Genesis: Gone are those days when markets were associated with transactions involving physical cash;
due to demonetization of high value currency notes India is now witnessing a giant leap of transformation
towards digital economy. Cash transactions get replaced by mobile wallets, e-payments, bank transfers,
online payments etc. this brings in greater degree of transparency into the system through high degree
accountability of transactions.
Cashless economy needs adoption of technology [mobile internet] to proceed smoothly; urban India is
positively skewed towards digital economy, but rural India is not well equipped and educated to adopt,
use and substitute the physical transaction mechanisms with digital transaction mechanisms.
Major stake holders of rural weekly markets are farmers whose literacy rates and financial status are
often scaled below par. Access to smart phone is certainly increasing among rural consumers, but to
what extent they are willing to adopt the mobile internet technology as a means for executing financial
transactions is a debatable question.
In order to steer the rural consumer’s trajectory towards digital payment mode in rural India, it is
important to understand the factors/forces influencing the acceptance of technology among rural
consumers, thereby strategies can be devised to sail over the tide of resistance easily.
Approach: A survey was conducted using The Extended Technology Acceptance Model [TAM2] to
ascertain the various factors/forces that are responsible for resistance towards acceptance of mobile
internet technology as a means for executing their financial transactions, particularly in the rural weekly
markets of Ballari district.
Methods: Measurement of the facets of TAM2 such as (intention to use, perceived usefulness, perceived
ease of use, subjective norms, voluntariness, image) was done and subjected to rigorous data processing
and analysis using the relevant statistical tools such as, KMO Test, Bartlett’s Test, cronbach’s alpha,
Factor Analysis, mean, standard deviation and percentage analysis.
Results: The assessment unearthed the various factors/forces affecting the rural consumer’s intentions
towards acceptance of mobile internet technology as a means for executing their financial transactions,
among which, safety, security, intangibility aspect, credibility and accessibility of money in electronic
form were prominent.
Conclusion/Recommendations: Rural consumers lack necessary equipments [smart phones] and
knowledge of usage which act as a major bottleneck blocking the inroads of digital economy in rural
markets; along with many factors/forces result in resistance towards adoption of mobile internet
technology for executing their financial transactions. Recommendations include all those initiatives that
results in acceptance of technology among rural consumers such as, ensuring security, safety, credibility
of transactions, accessibility of digital money etc.
The rest of the paper is maneuvered with following sequence, Part 1: Introduction to the concept of
digital economy; Part 2: Review of literature; Part 3: Gap Analysis; Part 4: Objectives of the study; Part
5: Research methodology; Part 6: Data analysis; Part 7: Findings; Part 8: Conclusion &
Recommendations.
Part 1: Introduction
Information is power. Nowhere is this aphorism truer than in developing countries. Vast populations in
India live in rural areas and are subject to the vagaries of their highly inefficient and information
asymmetric markets, marked in particular by the tremendous uncertainty and risk of doing business. As
Geertz (1978) wrote of isolated rural villages, “information is poor, scarce, mal-distributed, inefficiently
communicated and intensely valued. The level of ignorance about everything from product quality and
going prices to market possibilities and production costs is very high.” A smoothly functioning market
requires the following elements to be in place: the smooth flow of information, property rights, trust,
competitive markets and those side effects on third parties are curtailed (McMillan, 2002).

IRA-International Journal of Management & Social Sciences
157
There is no doubt that the use of wireless and mobile networks and devices is growing. From the 1990s
onwards, we have been witnessing a great shift in methods of doing business with the emergence of the
electronic commerce (e-commerce). Academics, businesses, and even individuals have been focusing on
this new is conducted via a mobile network” When users conduct e-commerce such as e-banking or
purchase products, they do not need to use a personal computer system. Indeed, they can simply use some
mobile handheld devices such as Personal Digital Assistants (PDA) and mobile phones to conduct various
e-commerce activities. In the past, these mobile devices or technologies were regarded as a kind of luxury
for individuals. However, this situation has changed. The market for mobile technologies has seen
significant growth in the past few years.
Post demonetization of high value currency by Prime Minister of India Mr.Narendra Modi, India
encountered huge cash crunch and far reaching crisis. Organized sector is able to sail over the tide due to
the existence of e-transaction mechanisms; whereas weekly rural markets are relatively un-organized in
India and therefore are victim of this temporary cash crunch crisis. In such situations digital economy
entails most promising and reliable solution in coming days for the present crisis. Since majority of the
rural population in India are illiterate or semi literate, the understanding of the digital economy, e-
commerce, mobile commerce, online transactions are not so concrete, which leads to substantial
resistance in adaption of digital economy as an alternative means for traditional mechanisms. There exist
numerous myths, mis-conceptions about the digital commerce and its potential usage among the rural
population of India. It is therefore of paramount importance to identify the factors/forces responsible for
resistance in adoption of digital mechanisms among rural farmers; such that strategies can be suggested to
overcome them.
Hence this paper tries to identify the factors / forces responsible for resistance to adoption of mobile
internet technology for payments among stake holders of rural weekly markets using Extended
Technology Acceptance Model [TAM2], thereby suggest suitable marketing strategies to sail over the tide
with ease.
Part 2 Review of Literature Consider a fast moving and continuously growing industry, say fashion industry per say. This industry
has witnessed tremendous changes and the changes are volatile in nature and certain factors have caused
this change (Kilduff, 2005). The industry doesn't compete only in terms of price now and is facing tough
competition from low labor countries (Jones, 2002). Not only in fashion, but in any fast developing
industry or market sourcing and buying decisions get multiplied with the speed with which the decisions
have to be made and innovation introduced. Consumers expect and thrive on constant change, so new
products have to be made available to them in a frequent basis (Bruce and Daly, 2006). Whene in
Senegal, after the emergence of weekly markets called loumas, along with implementation of neo-liberal
policies in 1980‟s, the community relations among the farmers and their kin strengthened, contrary to the
belief that market dissolution, new trading practices and free market policies weakens the weakens the
community relations. In fact the spatial and temporal patterning of loumas has helped strengthening the
intra-community bonds. Since the inception of loumas, farmers in Senegal could limit their travel of
going their home zone. In loumas, farmers interact voraciously with the extra-local merchants, who are
usually considered as outsiders and are not allowed to permanently settle in local villages. And since,
loumas occur only once a week, farmers benefit a lot from daily, multi-dimensional interactions with each
other (Perry, 2000). The weekly markets are generally the outcomes of natural progress whereby certain
villages and cities specialize in their functions and become commercial hubs for their surrounding areas.
The weekly markets provide an integrated yet dynamic force to the socio-economic life of the area.
In an age of online trading and shopping, India like many other developing countries still successfully
continues to develop the idea of conventional physical idea of market (Joshi and Ruparel, 2016).

IRA-International Journal of Management & Social Sciences
158
Part 3: Research Gaps
The weekly markets of India are formed and are conducted in every state, every city, town, district and
almost all the villages and they form a major part of the national GDP figure. They not only add the
national income figure but provide socio-economic stability to the people at the grass root level. India
being an agrarian country, and still in the path of development, where only 5-8% of the people using
smartphones (Wiener, 2015), it is a necessity to protect and promote the traditional markets of the
country until they are self-sufficient and can compete with the rest of the competitors. But not much, in
fact negligible study has been done in examining and exploring the nature, scope, resonance behind the
existence of weekly markets. No substantial study has been done in identifying the factors responsible for
formation of weekly markets and how these markets carry out their buying-selling transactions; this
research study aims to capture the characteristics, scope and viability of weekly markets of India towards
adapting digital economy with specific reference to weekly markets at the district level.
Part 4: Objectives of the Study 1. To ascertain the awareness about the mobile internet based commerce among the participants of
rural weekly markets.
2. To determine the factors/forces responsible for resistance towards mobile internet based
commerce among the participants of rural weekly markets using TAM2 model.
3. To suggest suitable strategies to overcome the resistance and augment the acceptance of digital
economy.
Part 5: Methodology:
Four villages namely “Sandur, Kottur Kudligi and Kamalapur have been chosen for the purpose of study.
Random sampling procedure was followed to select sample respondents from the sampling area, looking
into convenience 10 respondents were randomly selected from the above villages amounting to total
sample size of 40. The basic research design is based on primary source of data; however, secondary
sources are also taken into consideration. Data were collected from the above respondents, using
interview schedule specifically designed for the purpose; Tabulated data was analyzed with the help of
statistical techniques such as, Correlation coefficients, Mean, Variance, Standard Deviation, Factor
analysis and simple percentages. The questionnaire was structured using the Technology Acceptance
Model [TAM2] a social-psychological model which attempts to predict and understand people‟s
acceptance of new technology in specific contexts.
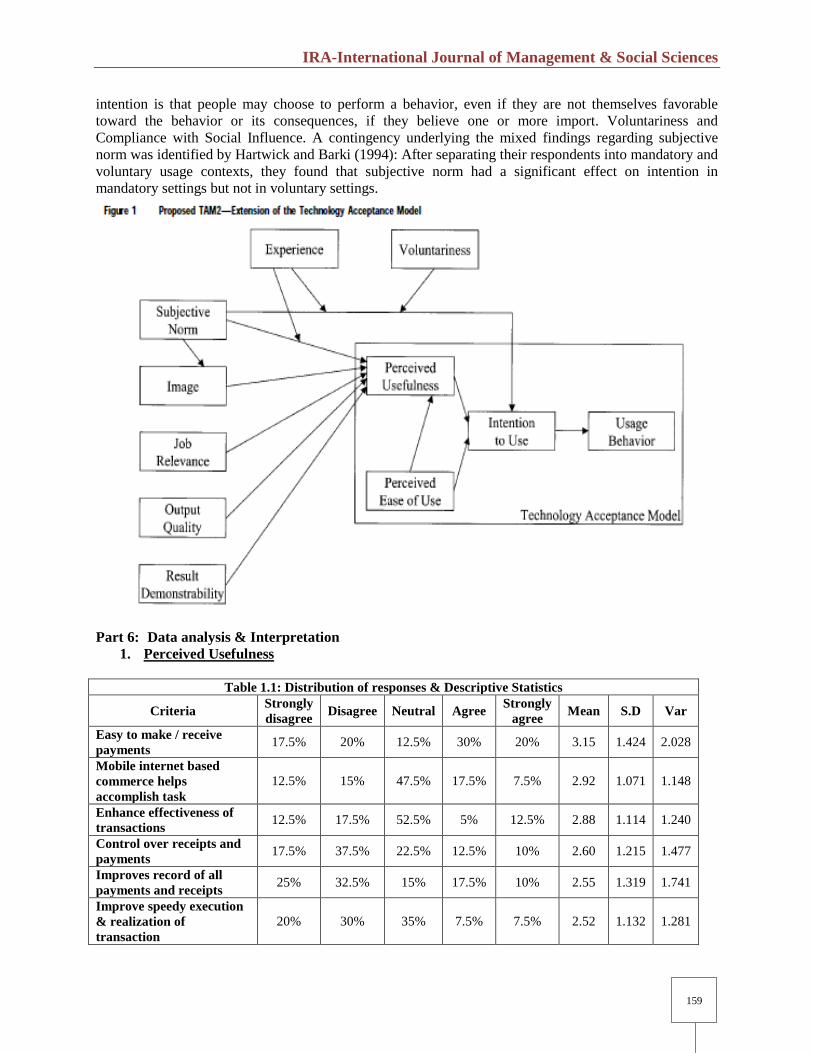
Section 6: Theoretical Background of Technology Acceptance Model [TAM2]:
Despite impressive advances in technology, the troubling problem of underutilized technology continues.
Low usage of technology has been identified as a major factor underlying the “productivity paradox”
surrounding lackluster returns from investments in technology (Sichel 1997). Understanding and creating
the conditions under which technology will be embraced by the individuals remains a high-priority
research issue. Significant progress has been made over the last decade in explaining and predicting user
acceptance of technology at work. In particular, substantial theoretical and empirical support has
accumulated in favor of the Technology Acceptance Model (TAM2) (Davis 1989, Davis et al. 1989).
According to TAM2, perceived usefulness is also influenced by perceived ease of use because, other
things being equal, the easier the technology are to use the more useful it can be. TAM2 reflects the
impacts of three interrelated social forces impinging on an individual facing the opportunity to adopt or
reject a new technology: subjective norm, voluntariness, and image. Subjective Norm. we tap into social
influences via subjective norm, defined as a “person‟s perception that most people who are important to
him think he should or should not perform the behavior in question” (Fishbein and Ajzen 1975, p. 302).
Subjective norm is included as a direct determinant of behavioral intention in TRA (Fishbein and Ajzen
1975) and the subsequent TPB (Ajzen 1991). The rationale for a direct effect of subjective norm on
IRA-International Journal of Management & Social Sciences
159
intention is that people may choose to perform a behavior, even if they are not themselves favorable
toward the behavior or its consequences, if they believe one or more import. Voluntariness and
Compliance with Social Influence. A contingency underlying the mixed findings regarding subjective
norm was identified by Hartwick and Barki (1994): After separating their respondents into mandatory and
voluntary usage contexts, they found that subjective norm had a significant effect on intention in
mandatory settings but not in voluntary settings.
Part 6: Data analysis & Interpretation
1. Perceived Usefulness
Table 1.1: Distribution of responses & Descriptive Statistics
Criteria Strongly
disagree Disagree Neutral Agree
Strongly
agree Mean S.D Var
Easy to make / receive
payments 17.5% 20% 12.5% 30% 20% 3.15 1.424 2.028
Mobile internet based
commerce helps
accomplish task
12.5% 15% 47.5% 17.5% 7.5% 2.92 1.071 1.148
Enhance effectiveness of
transactions 12.5% 17.5% 52.5% 5% 12.5% 2.88 1.114 1.240
Control over receipts and
payments 17.5% 37.5% 22.5% 12.5% 10% 2.60 1.215 1.477
Improves record of all
payments and receipts 25% 32.5% 15% 17.5% 10% 2.55 1.319 1.741
Improve speedy execution
& realization of
transaction
20% 30% 35% 7.5% 7.5% 2.52 1.132 1.281

IRA-International Journal of Management & Social Sciences
160
Descriptive Statistics
The first output from the analysis is a table of descriptive statistics for all the variables under investigation. Typically, the mean, standard deviation
and variance are given. Looking at the mean, one can conclude that „ease of purchase‟ is the most important variable that influences the rural
consumer‟s behaviour towards e-retailing, as it has the highest mean of 3.15.
Correlation Coefficient The correlation coefficient between a variable and itself is always 1, hence the principal diagonal of the correlation
matrix contains 1s. The correlation coefficients above and below the principal diagonal are the same.
Table 1.2: Correlation Matrix
Easy to make /
receive
payments
Mobile internet
based commerce
helps accomplish
task
Enhance
effectiveness
of
transactions
Improves record
of all payments
and receipts
Improves
record of all
payments and
receipts
Improve speedy
execution & realization
of transaction
Easy to make / receive
payments 1.000 -.260 -.093 .012 .114 .099
Mobile internet based
commerce helps
accomplish task
-.260 1.000 -.168 -.130 -.275 -.336
Enhance effectiveness
of transactions -.093 -.168 1.000 .093 -.201 .077
Control over receipts
and payments .012 -.130 .093 1.000 .157 .216
Improves record of all
payments and receipts .114 -.275 -.201 .157 1.000 .227
Improve speedy
execution & realization
of transaction
.099 -.336 .077 .216 .227 1.000
IRA-International Journal of Management & Social Sciences
161
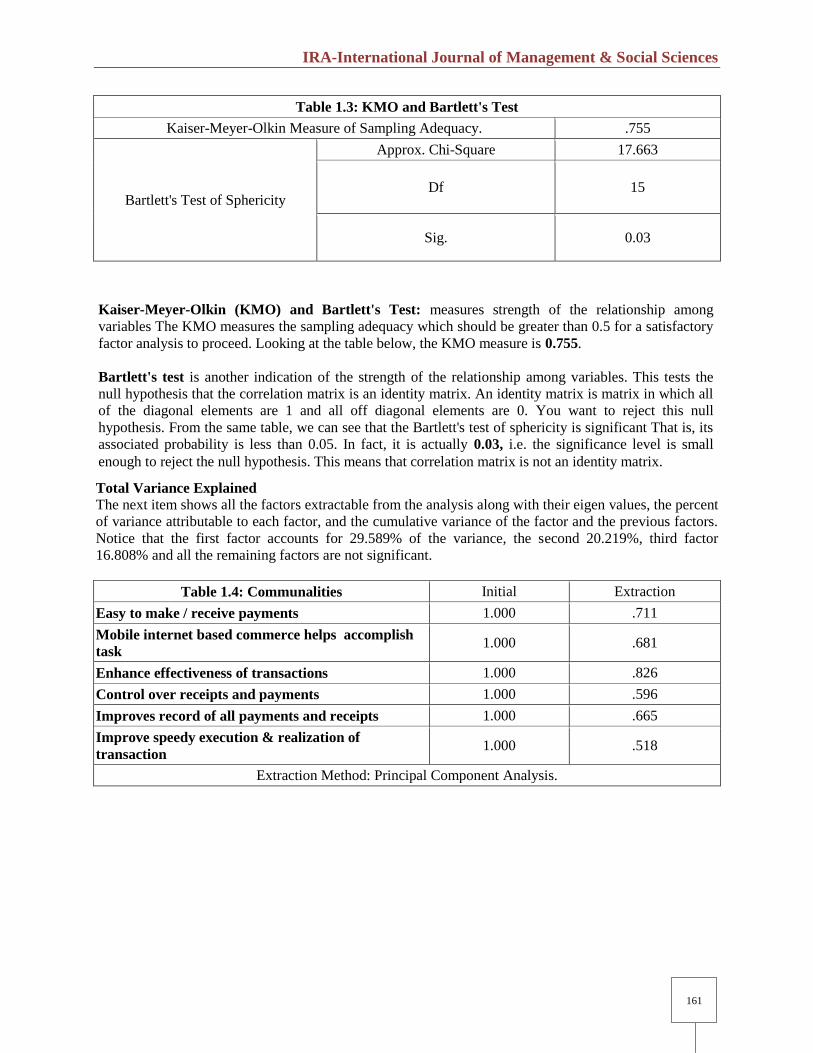
Table 1.3: KMO and Bartlett's Test
Kaiser-Meyer-Olkin Measure of Sampling Adequacy. .755
Bartlett's Test of Sphericity
Approx. Chi-Square 17.663
Df 15
Sig. 0.03
Communalities
The next item from the output is a table of communalities which shows how much of the variance in the
variables has been accounted for by the extracted factors. For instance over 82% of the variance in
„enhances effectiveness of transactions‟ is accounted for while 71% of the variance in „easy to
make/receive payments‟ is accounted for.
Total Variance Explained
The next item shows all the factors extractable from the analysis along with their eigen values, the percent
of variance attributable to each factor, and the cumulative variance of the factor and the previous factors.
Notice that the first factor accounts for 29.589% of the variance, the second 20.219%, third factor
16.808% and all the remaining factors are not significant.
Table 1.4: Communalities Initial Extraction
Easy to make / receive payments 1.000 .711
Mobile internet based commerce helps accomplish
task 1.000 .681
Enhance effectiveness of transactions 1.000 .826
Control over receipts and payments 1.000 .596
Improves record of all payments and receipts 1.000 .665
Improve speedy execution & realization of
transaction 1.000 .518
Extraction Method: Principal Component Analysis.
Kaiser-Meyer-Olkin (KMO) and Bartlett's Test: measures strength of the relationship among
variables The KMO measures the sampling adequacy which should be greater than 0.5 for a satisfactory
factor analysis to proceed. Looking at the table below, the KMO measure is 0.755.
Bartlett's test is another indication of the strength of the relationship among variables. This tests the
null hypothesis that the correlation matrix is an identity matrix. An identity matrix is matrix in which all
of the diagonal elements are 1 and all off diagonal elements are 0. You want to reject this null
hypothesis. From the same table, we can see that the Bartlett's test of sphericity is significant That is, its
associated probability is less than 0.05. In fact, it is actually 0.03, i.e. the significance level is small
enough to reject the null hypothesis. This means that correlation matrix is not an identity matrix.
IRA-International Journal of Management & Social Sciences
162
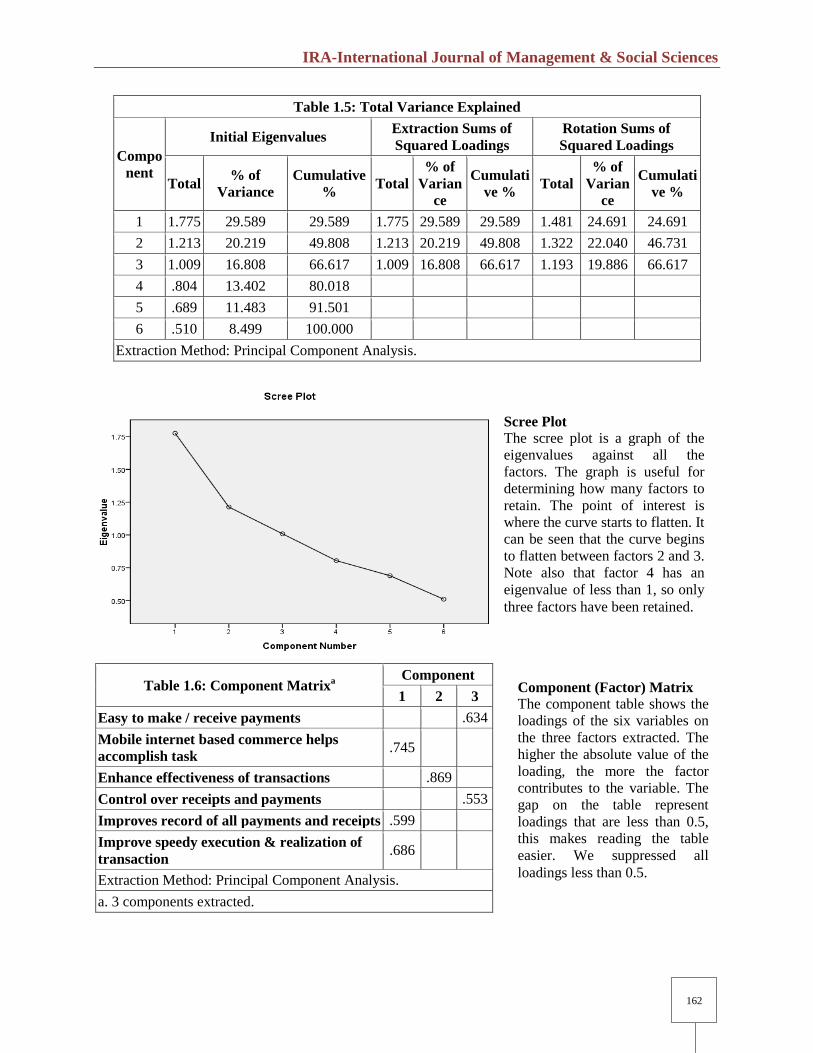
Table 1.5: Total Variance Explained
Compo
nent
Initial Eigenvalues Extraction Sums of
Squared Loadings
Rotation Sums of
Squared Loadings
Total % of
Variance
Cumulative
% Total
% of
Varian
ce
Cumulati
ve % Total
% of
Varian
ce
Cumulati
ve %
1 1.775 29.589 29.589 1.775 29.589 29.589 1.481 24.691 24.691
2 1.213 20.219 49.808 1.213 20.219 49.808 1.322 22.040 46.731
3 1.009 16.808 66.617 1.009 16.808 66.617 1.193 19.886 66.617
4 .804 13.402 80.018
5 .689 11.483 91.501
6 .510 8.499 100.000
Extraction Method: Principal Component Analysis.
Table 1.6: Component Matrixa
Component
1 2 3
Easy to make / receive payments .634
Mobile internet based commerce helps
accomplish task .745
Enhance effectiveness of transactions .869
Control over receipts and payments .553
Improves record of all payments and receipts .599
Improve speedy execution & realization of
transaction .686
Extraction Method: Principal Component Analysis.
a. 3 components extracted.
Scree Plot
The scree plot is a graph of the
eigenvalues against all the
factors. The graph is useful for
determining how many factors to
retain. The point of interest is
where the curve starts to flatten. It
can be seen that the curve begins
to flatten between factors 2 and 3.
Note also that factor 4 has an
eigenvalue of less than 1, so only
three factors have been retained.
Component (Factor) Matrix
The component table shows the
loadings of the six variables on
the three factors extracted. The
higher the absolute value of the
loading, the more the factor
contributes to the variable. The
gap on the table represent
loadings that are less than 0.5,
this makes reading the table
easier. We suppressed all
loadings less than 0.5.
IRA-International Journal of Management & Social Sciences
163
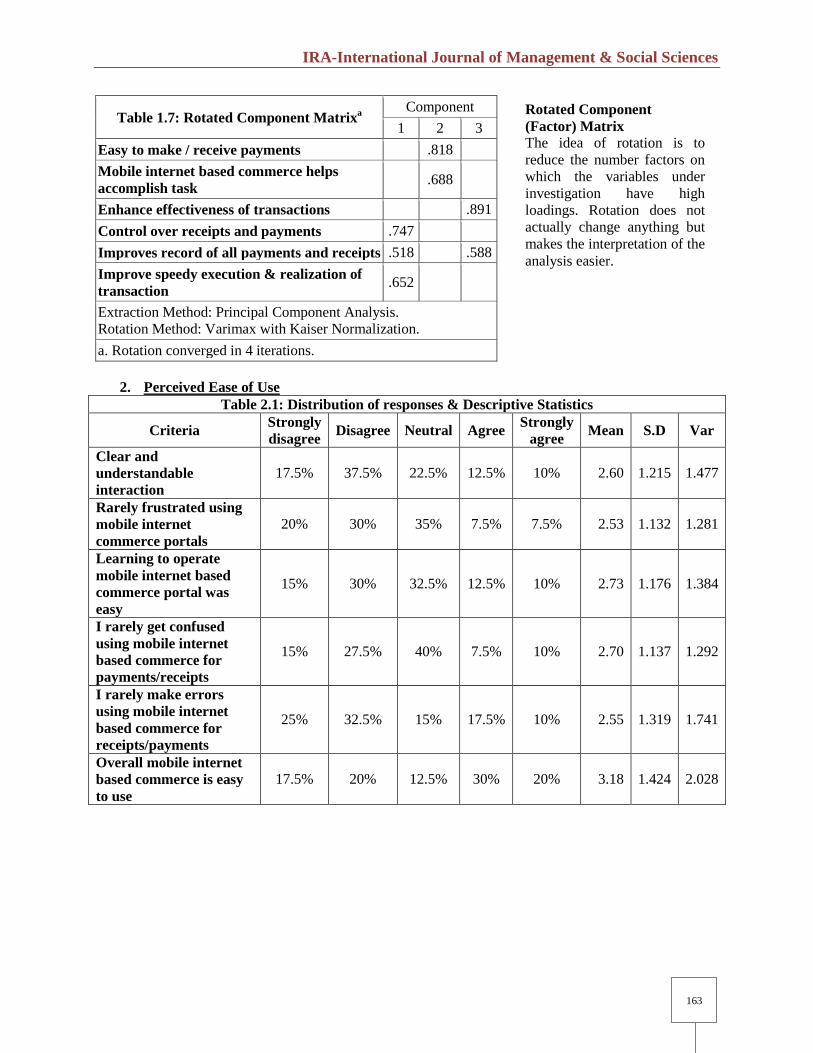
Table 1.7: Rotated Component Matrixa
Component
1 2 3
Easy to make / receive payments .818
Mobile internet based commerce helps
accomplish task .688
Enhance effectiveness of transactions .891
Control over receipts and payments .747
Improves record of all payments and receipts .518 .588
Improve speedy execution & realization of
transaction .652
Extraction Method: Principal Component Analysis.
Rotation Method: Varimax with Kaiser Normalization.
a. Rotation converged in 4 iterations.
2. Perceived Ease of Use
Table 2.1: Distribution of responses & Descriptive Statistics
Criteria Strongly
disagree Disagree Neutral Agree
Strongly
agree Mean S.D Var
Clear and
understandable
interaction
17.5% 37.5% 22.5% 12.5% 10% 2.60 1.215 1.477
Rarely frustrated using
mobile internet
commerce portals
20% 30% 35% 7.5% 7.5% 2.53 1.132 1.281
Learning to operate
mobile internet based
commerce portal was
easy
15% 30% 32.5% 12.5% 10% 2.73 1.176 1.384
I rarely get confused
using mobile internet
based commerce for
payments/receipts
15% 27.5% 40% 7.5% 10% 2.70 1.137 1.292
I rarely make errors
using mobile internet
based commerce for
receipts/payments
25% 32.5% 15% 17.5% 10% 2.55 1.319 1.741
Overall mobile internet
based commerce is easy
to use
17.5% 20% 12.5% 30% 20% 3.18 1.424 2.028
Rotated Component
(Factor) Matrix
The idea of rotation is to
reduce the number factors on
which the variables under
investigation have high
loadings. Rotation does not
actually change anything but
makes the interpretation of the
analysis easier.
IRA-International Journal of Management & Social Sciences
164
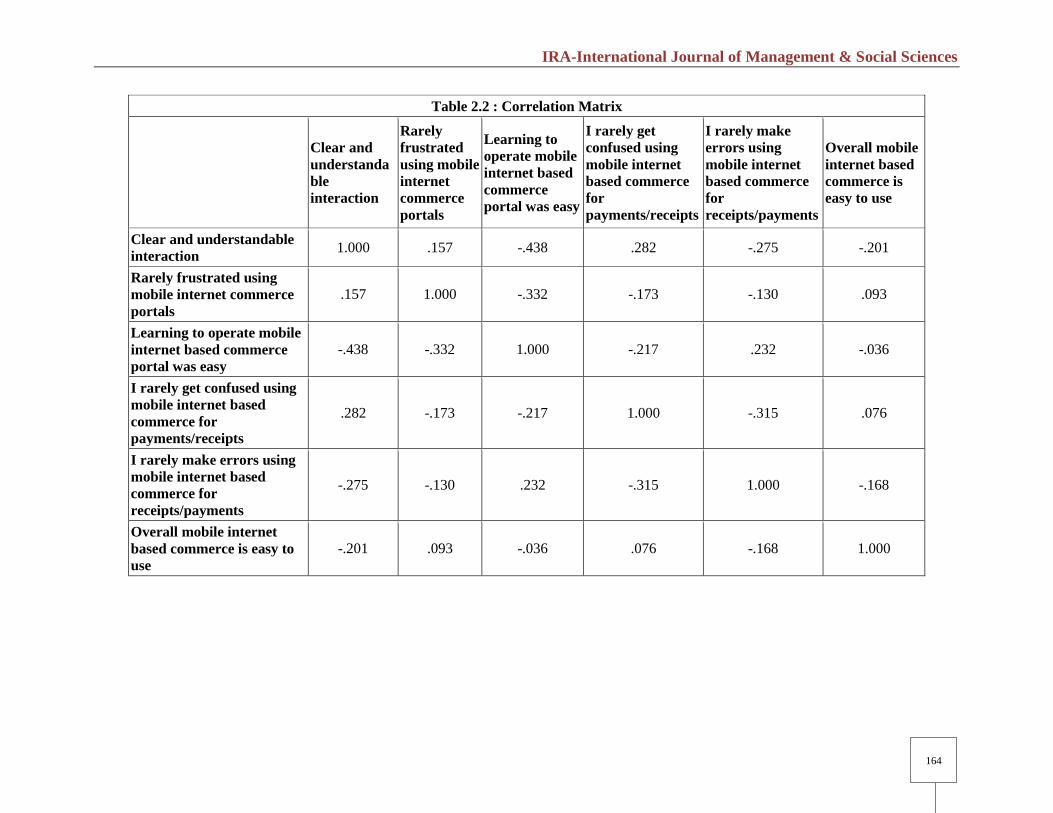
Table 2.2 : Correlation Matrix
Clear and
understanda
ble
interaction
Rarely
frustrated
using mobile
internet
commerce
portals
Learning to
operate mobile
internet based
commerce
portal was easy
I rarely get
confused using
mobile internet
based commerce
for
payments/receipts
I rarely make
errors using
mobile internet
based commerce
for
receipts/payments
Overall mobile
internet based
commerce is
easy to use
Clear and understandable
interaction 1.000 .157 -.438 .282 -.275 -.201
Rarely frustrated using
mobile internet commerce
portals
.157 1.000 -.332 -.173 -.130 .093
Learning to operate mobile
internet based commerce
portal was easy
-.438 -.332 1.000 -.217 .232 -.036
I rarely get confused using
mobile internet based
commerce for
payments/receipts
.282 -.173 -.217 1.000 -.315 .076
I rarely make errors using
mobile internet based
commerce for
receipts/payments
-.275 -.130 .232 -.315 1.000 -.168
Overall mobile internet
based commerce is easy to
use
-.201 .093 -.036 .076 -.168 1.000

IRA-International Journal of Management & Social Sciences
165
Table 2.3: Communalities Initial Extraction
Clear and understandable
interaction 1.000 .734
Rarely frustrated using mobile
internet commerce portals 1.000 .811
Learning to operate mobile internet
based commerce portal was easy 1.000 .647
I rarely get confused using mobile
internet based commerce for
payments/receipts
1.000 .750
I rarely make errors using mobile
internet based commerce for
receipts/payments
1.000 .568
Overall mobile internet based
commerce is easy to use 1.000 .843
Extraction Method: Principal Component Analysis.
Table 2.5: Communalities Initial Extractio
n
Clear and understandable interaction 1.000 .734
Rarely frustrated using mobile internet commerce portals 1.000 .811
Learning to operate mobile internet based commerce portal was
easy 1.000 .647
I rarely get confused using mobile internet based commerce for
payments/receipts 1.000 .750
I rarely make errors using mobile internet based commerce for
receipts/payments 1.000 .568
Overall mobile internet based commerce is easy to use 1.000 .843
Extraction Method: Principal Component Analysis.
Table 2.4: KMO and Bartlett's Test
Kaiser-Meyer-Olkin Measure of
Sampling Adequacy. .658
Bartlett's Test
of Sphericity
Approx. Chi-
Square 29.279
Df 15
Sig. 0.04

IRA-International Journal of Management & Social Sciences
166
Table 2.6: Total Variance Explained
Compo
nent
Initial Eigenvalues Extraction Sums of
Squared Loadings
Rotation Sums of Squared
Loadings
Total
% of
Varian
ce
Cumulat
ive % Total
% of
Varianc
e
Cumulat
ive % Total
% of
Varianc
e
Cumulat
ive %
1 1.951 32.521 32.521 1.951 32.521 32.521 1.635 27.251 27.251
2 1.223 20.391 52.912 1.223 20.391 52.912 1.530 25.505 52.756
3 1.177 19.613 72.525 1.177 19.613 72.525 1.186 19.769 72.525
4 .689 11.484 84.009
5 .495 8.245 92.254
6 .465 7.746 100.000
Extraction Method: Principal Component Analysis.
3. Subjective Norms
Table 3.1: Distribution of responses and descriptive statistics
Criteria Strongly
disagree Disagree Neutral Agree
Strongly
agree Mean S.D Var
My influencers think I
should use mobile
internet based commerce
for transactions
-- 10% 50% 40% -- 2.70 .648 .421
My important people
think I should use 5% 20% 52.5% 15% 7.5% 3.00 .934 .872
Table 2.7: Component Matrixa
Component
1 2 3
Clear and understandable
interaction .738
Rarely frustrated using mobile
internet commerce portals .800
Learning to operate mobile
internet based commerce
portal was easy
-.752
I rarely get confused using
mobile internet based
commerce for
payments/receipts
.537 -.677
I rarely make errors using
mobile internet based
commerce for
receipts/payments
-.637
Overall mobile internet based
commerce is easy to use .916
Extraction Method: Principal Component Analysis.

IRA-International Journal of Management & Social Sciences
167
mobile internet based
commerce
My immediate
influencers think I
should use mobile
internet based commerce
-- 10% 50% 40% -- 2.70 .648 .421
My close friends think I
should use mobile
internet based commerce
-- 15% 52.5% 32.5% -- 2.82 .675 .456
My peers think I should
use mobile internet
based commerce
17.5% 20% 12.5% 30% 20% 3.15 1.424 2.028
My opinion leaders
think I should use
mobile internet based
commerce
47.5% 35% 12.5% 5% -- 4.25 .870 .756
Table 3.2 : Correlation Matrix
My
influencers
think I
should use
mobile
internet
based
commerce
for
transactions
My
important
people think
I should use
mobile
internet
based
commerce
My
immediate
influencers
think I
should use
mobile
internet
based
commerce
My close
friends
think I
should use
mobile
internet
based
commerce
My peers
think I
should use
mobile
internet
based
commerce
My opinion
leaders
think I
should use
mobile
internet
based
commerce
My influencers
think I should use
mobile internet
based commerce
for transactions
1.000 -.169 1.000 -.064 .106 .136
My important
people think I
should use mobile
internet based
commerce
-.169 1.000 -.169 .041 .039 .221
My immediate
influencers think I
should use mobile
internet based
commerce
1.000 -.169 1.000 -.064 .106 .136

IRA-International Journal of Management & Social Sciences
168
My close friends
think I should use
mobile internet
based commerce
-.064 .041 -.064 1.000 -.025 .033
My peers think I
should use mobile
internet based
commerce
.106 .039 .106 -.025 1.000 .259
My opinion
leaders think I
should use mobile
internet based
commerce
.136 .221 .136 .033 .259 1.000
Table 3.5: Total Variance Explained
Compo
nent
Initial Eigenvalues Extraction Sums of Squared
Loadings
Rotation Sums of Squared
Loadings
Total % of
Variance
Cumulati
ve % Total
% of
Variance
Cumulati
ve % Total
% of
Variance
Cumulati
ve %
1 2.110 35.167 35.167 2.110 35.167 35.167 2.079 34.650 34.650
2 1.354 22.562 57.729 1.354 22.562 57.729 1.385 23.079 57.729
3 .997 16.609 74.338
4 .889 14.818 89.156
5 .651 10.844 100.000
6 2.653 4.422 100.000
Extraction Method: Principal Component Analysis.
Table 3.3: KMO and Bartlett's Test
Kaiser-Meyer-Olkin Measure of
Sampling Adequacy. .723
Bartlett's Test
of Sphericity
Approx. Chi-
Square 31.356
Df 15
Sig. 0.05
Table 3.4: Communalities Initial Extraction
My influencers think I should use
mobile internet based commerce for
transactions
1.000 .966
My important people think I should
use mobile internet based commerce 1.000 .461
My immediate influencers think I
should use mobile internet based
commerce
1.000 .968
My close friends think I should use
mobile internet based commerce 1.000 .032
My peers think I should use mobile
internet based commerce 1.000 .388
My opinion leaders think I should use
mobile internet based commerce 1.000 .651

IRA-International Journal of Management & Social Sciences
169
Table 3.7: Rotated Component Matrixa Component
1 2
My influencers think I should use E-retailing .975
My important people think I should use E-retailing .570
My immediate influencers think I should use e-
retailing .975
My close friends think I should use e-retailing
My peers think I should use e-retailing .612
My opinion leaders think I should use e-retailing .803
Extraction Method: Principal Component Analysis.
Rotation Method: Varimax with Kaiser Normalization.
a. Rotation converged in 3 iterations.
Table 3.6: Component Matrixa
Component
1 2
My influencers think I should use
E-retailing .980
My important people think I should
use E-retailing .633
My immediate influencers think I
should use e-retailing .980
My close friends think I should use
e-retailing
My peers think I should use e-
retailing .576
My opinion leaders think I should
use e-retailing .769
IRA-International Journal of Management & Social Sciences
170
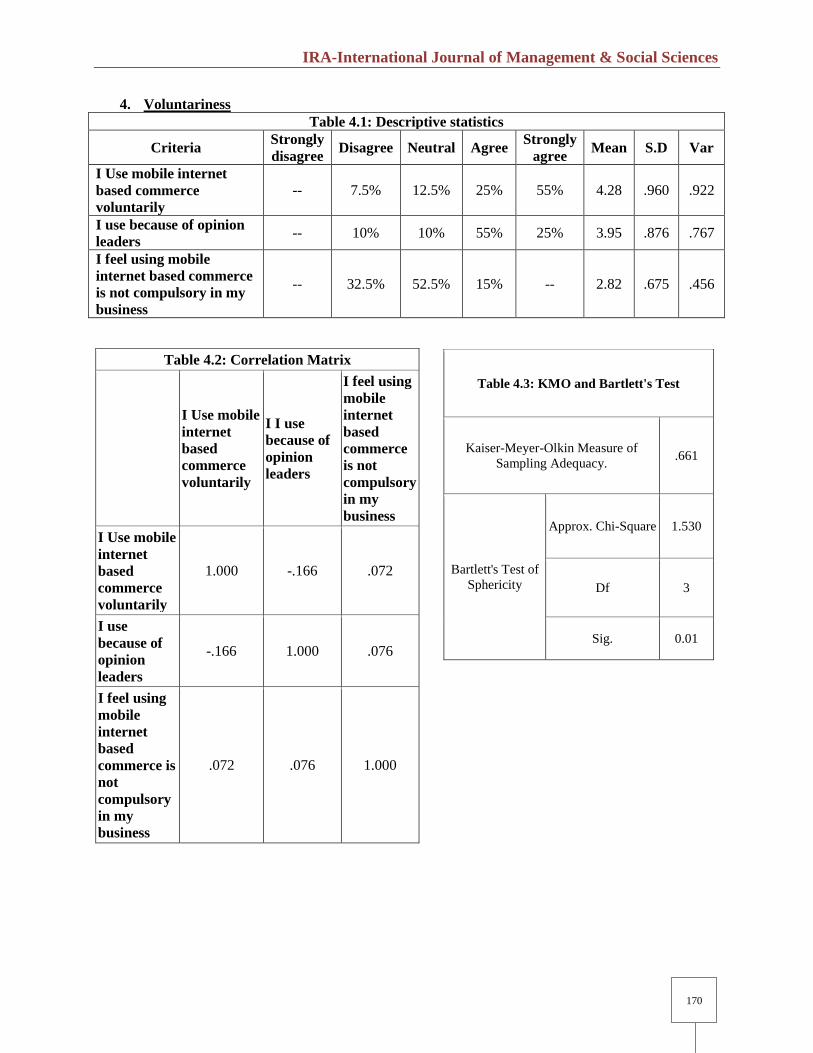
4. Voluntariness
Table 4.1: Descriptive statistics
Criteria Strongly
disagree Disagree Neutral Agree
Strongly
agree Mean S.D Var
I Use mobile internet
based commerce
voluntarily
-- 7.5% 12.5% 25% 55% 4.28 .960 .922
I use because of opinion
leaders -- 10% 10% 55% 25% 3.95 .876 .767
I feel using mobile
internet based commerce
is not compulsory in my
business
-- 32.5% 52.5% 15% -- 2.82 .675 .456
Table 4.2: Correlation Matrix
I Use mobile
internet
based
commerce
voluntarily
I I use
because of
opinion
leaders
I feel using
mobile
internet
based
commerce
is not
compulsory
in my
business
I Use mobile
internet
based
commerce
voluntarily
1.000 -.166 .072
I use
because of
opinion
leaders
-.166 1.000 .076
I feel using
mobile
internet
based
commerce is
not
compulsory
in my
business
.072 .076 1.000
Table 4.3: KMO and Bartlett's Test
Kaiser-Meyer-Olkin Measure of
Sampling Adequacy. .661
Bartlett's Test of
Sphericity
Approx. Chi-Square 1.530
Df 3
Sig. 0.01
IRA-International Journal of Management & Social Sciences
171
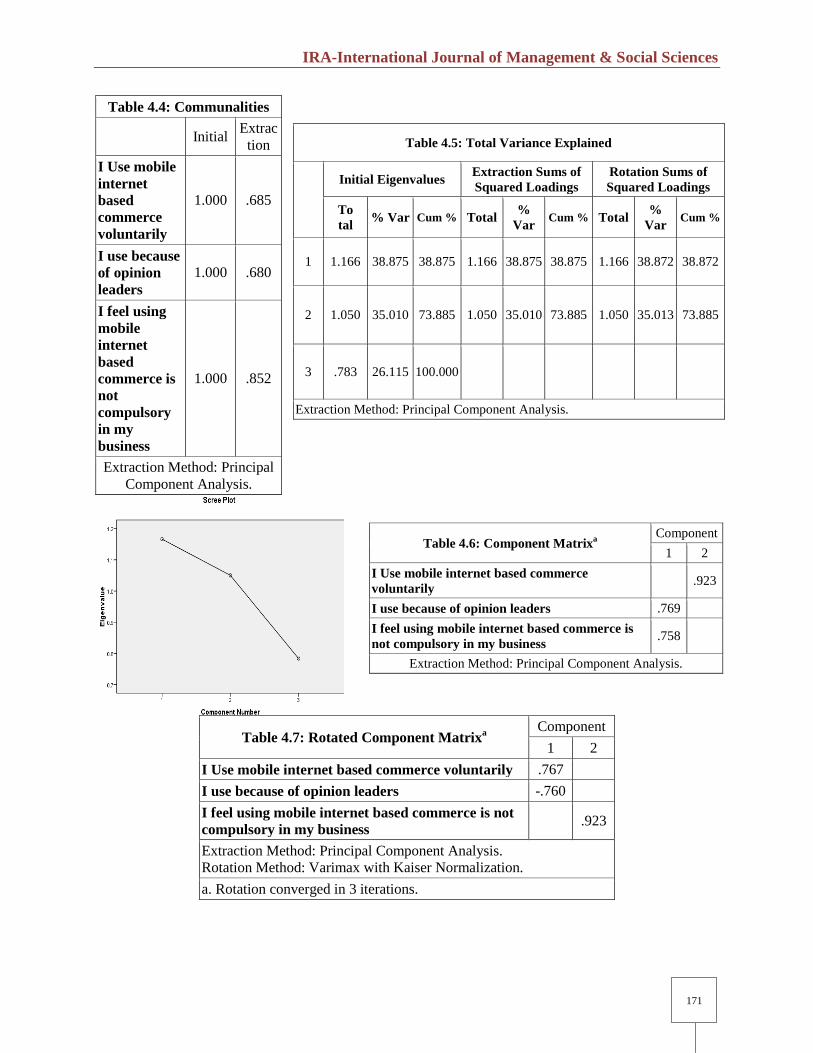
Table 4.4: Communalities
Initial Extrac
tion
I Use mobile
internet
based
commerce
voluntarily
1.000 .685
I use because
of opinion
leaders
1.000 .680
I feel using
mobile
internet
based
commerce is
not
compulsory
in my
business
1.000 .852
Extraction Method: Principal
Component Analysis.
Table 4.7: Rotated Component Matrixa
Component
1 2
I Use mobile internet based commerce voluntarily .767
I use because of opinion leaders -.760
I feel using mobile internet based commerce is not
compulsory in my business .923
Extraction Method: Principal Component Analysis.
Rotation Method: Varimax with Kaiser Normalization.
a. Rotation converged in 3 iterations.
Table 4.5: Total Variance Explained
Initial Eigenvalues Extraction Sums of
Squared Loadings
Rotation Sums of
Squared Loadings
To
tal % Var Cum % Total
%
Var Cum % Total
%
Var Cum %
1 1.166 38.875 38.875 1.166 38.875 38.875 1.166 38.872 38.872
2 1.050 35.010 73.885 1.050 35.010 73.885 1.050 35.013 73.885
3 .783 26.115 100.000
Extraction Method: Principal Component Analysis.
Table 4.6: Component Matrixa
Component
1 2
I Use mobile internet based commerce
voluntarily .923
I use because of opinion leaders .769
I feel using mobile internet based commerce is
not compulsory in my business .758
Extraction Method: Principal Component Analysis.

IRA-International Journal of Management & Social Sciences
172
5. Behavioral Intention
Table 5.1: Distribution of responses & Descriptive Statistics
Criteria Strongly
disagree Disagree Neutral Agree
Strongly
agree Mean S.D Var
Intend to
continue using
mobile internet
based
commerce for
payments /
receipts
-- 40% -- 15% 45% 4.30 .723 .523
Intend to
frequently use
mobile internet
based
commerce
-- 17.5% -- 5% 72.5% 1.63 1.148 1.317
Table 5.2: Correlation Matrix
Intend to continue e-
retailing
Intend to frequently use e-
retailing
Intend to continue using mobile
internet based commerce for
payments / receipts 1.000 .108
Intend to frequently use mobile
internet based commerce .108 1.000
Table 5.3: KMO and Bartlett's Test
Kaiser-Meyer-Olkin Measure of
Sampling Adequacy. .779
Bartlett's Test of
Sphericity
Approx. Chi-
Square .441
Df 1
Sig. 0.04
Table 5.5: Total Variance Explained
Compo
nent
Initial Eigenvalues Extraction Sums of Squared Loadings
Total % of Variance Cumulative % Total % of Variance Cumulative %
1 1.108 55.406 55.406 1.108 55.406 55.406
2 .892 44.594 100.000
Extraction Method: Principal Component
Analysis.
Table 5.4: Communalities Initial Extraction
Intend to continue using
mobile internet based
commerce for payments /
receipts
1.000 .554
Intend to frequently use
mobile internet based
commerce 1.000 .537
Extraction Method: Principal Component Analysis.
IRA-International Journal of Management & Social Sciences
173
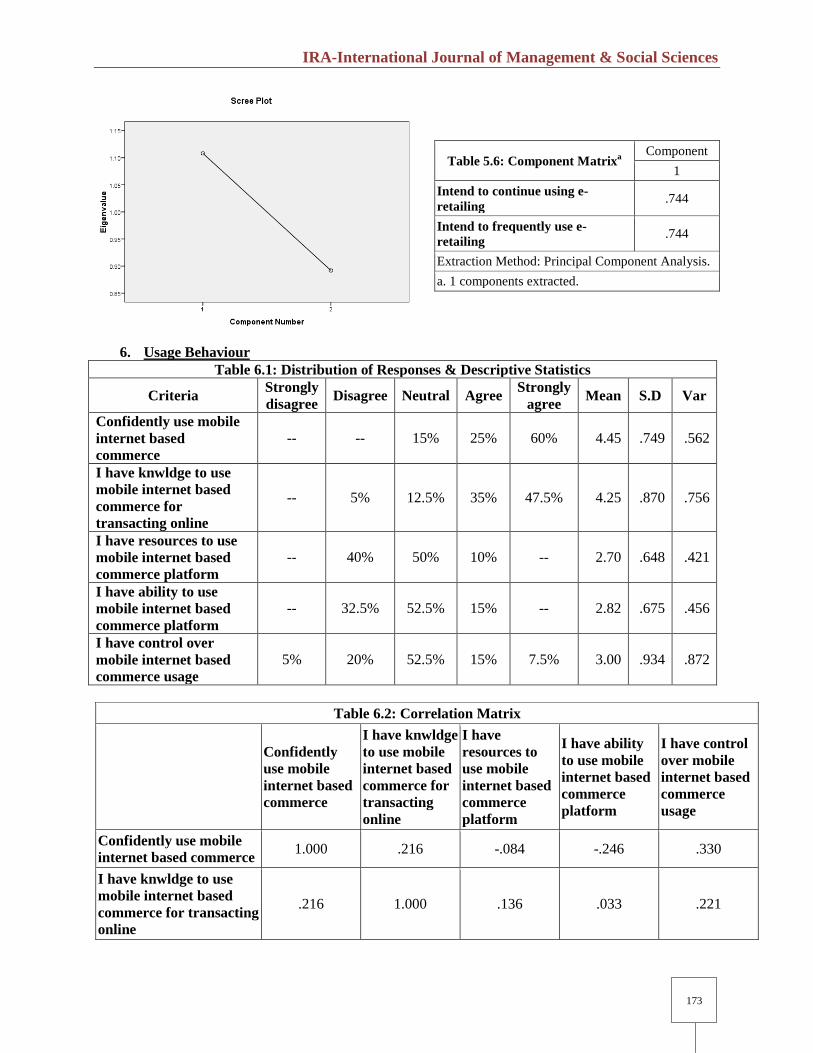
6. Usage Behaviour
Table 6.1: Distribution of Responses & Descriptive Statistics
Criteria Strongly
disagree Disagree Neutral Agree
Strongly
agree Mean S.D Var
Confidently use mobile
internet based
commerce
-- -- 15% 25% 60% 4.45 .749 .562
I have knwldge to use
mobile internet based
commerce for
transacting online
-- 5% 12.5% 35% 47.5% 4.25 .870 .756
I have resources to use
mobile internet based
commerce platform
-- 40% 50% 10% -- 2.70 .648 .421
I have ability to use
mobile internet based
commerce platform
-- 32.5% 52.5% 15% -- 2.82 .675 .456
I have control over
mobile internet based
commerce usage
5% 20% 52.5% 15% 7.5% 3.00 .934 .872
Table 6.2: Correlation Matrix
Confidently
use mobile
internet based
commerce
I have knwldge
to use mobile
internet based
commerce for
transacting
online
I have
resources to
use mobile
internet based
commerce
platform
I have ability
to use mobile
internet based
commerce
platform
I have control
over mobile
internet based
commerce
usage
Confidently use mobile
internet based commerce 1.000 .216 -.084 -.246 .330
I have knwldge to use
mobile internet based
commerce for transacting
online
.216 1.000 .136 .033 .221
Table 5.6: Component Matrixa
Component
1
Intend to continue using e-
retailing .744
Intend to frequently use e-
retailing .744
Extraction Method: Principal Component Analysis.
a. 1 components extracted.
IRA-International Journal of Management & Social Sciences
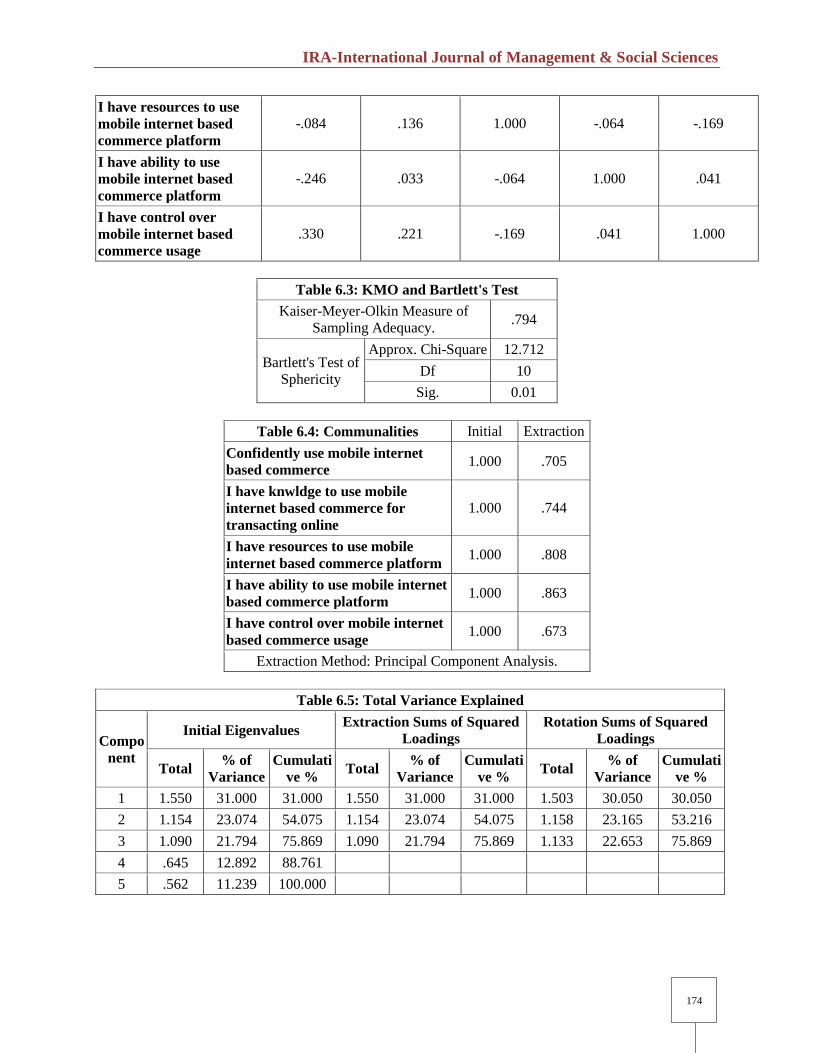
174
I have resources to use
mobile internet based
commerce platform
-.084 .136 1.000 -.064 -.169
I have ability to use
mobile internet based
commerce platform
-.246 .033 -.064 1.000 .041
I have control over
mobile internet based
commerce usage
.330 .221 -.169 .041 1.000
Table 6.3: KMO and Bartlett's Test
Kaiser-Meyer-Olkin Measure of
Sampling Adequacy. .794
Bartlett's Test of
Sphericity
Approx. Chi-Square 12.712
Df 10
Sig. 0.01
Table 6.4: Communalities Initial Extraction
Confidently use mobile internet
based commerce 1.000 .705
I have knwldge to use mobile
internet based commerce for
transacting online
1.000 .744
I have resources to use mobile
internet based commerce platform 1.000 .808
I have ability to use mobile internet
based commerce platform 1.000 .863
I have control over mobile internet
based commerce usage 1.000 .673
Extraction Method: Principal Component Analysis.
Table 6.5: Total Variance Explained
Compo
nent
Initial Eigenvalues Extraction Sums of Squared
Loadings
Rotation Sums of Squared
Loadings
Total % of
Variance
Cumulati
ve % Total
% of
Variance
Cumulati
ve % Total
% of
Variance
Cumulati
ve %
1 1.550 31.000 31.000 1.550 31.000 31.000 1.503 30.050 30.050
2 1.154 23.074 54.075 1.154 23.074 54.075 1.158 23.165 53.216
3 1.090 21.794 75.869 1.090 21.794 75.869 1.133 22.653 75.869
4 .645 12.892 88.761
5 .562 11.239 100.000
IRA-International Journal of Management & Social Sciences
175
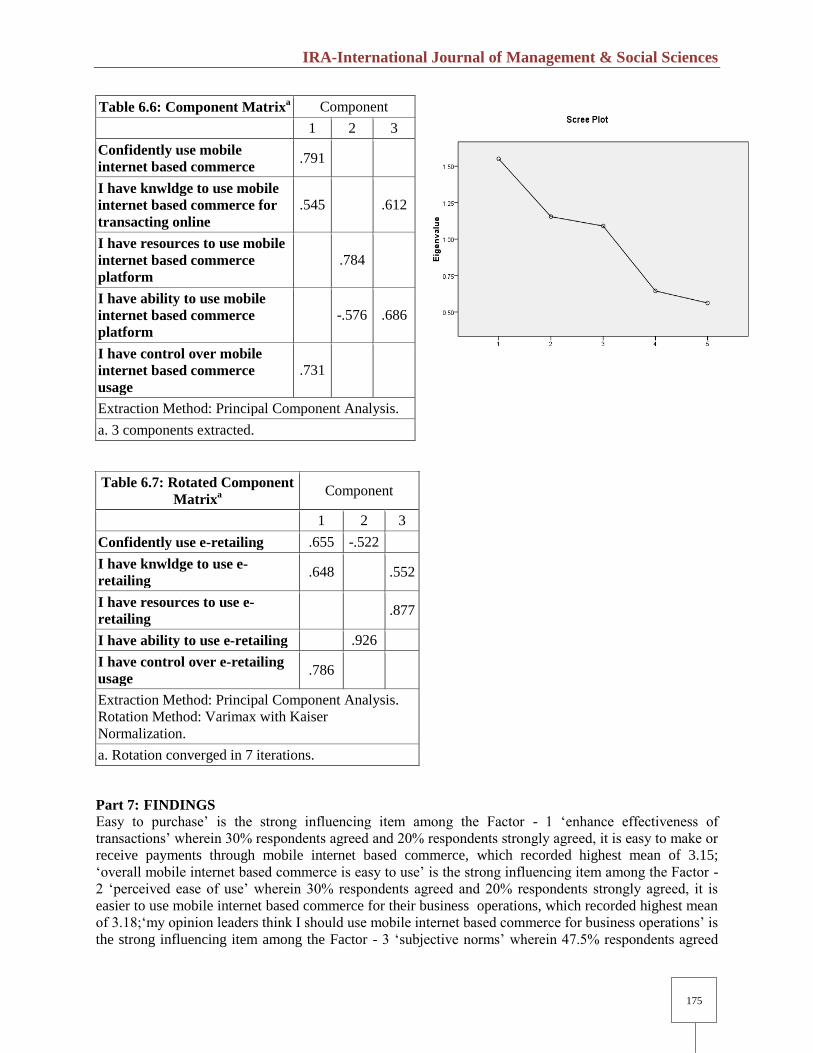
Table 6.6: Component Matrixa Component
1 2 3
Confidently use mobile
internet based commerce .791
I have knwldge to use mobile
internet based commerce for
transacting online
.545 .612
I have resources to use mobile
internet based commerce
platform
.784
I have ability to use mobile
internet based commerce
platform
-.576 .686
I have control over mobile
internet based commerce
usage
.731
Extraction Method: Principal Component Analysis.
a. 3 components extracted.
Table 6.7: Rotated Component
Matrixa
Component
1 2 3
Confidently use e-retailing .655 -.522
I have knwldge to use e-
retailing .648 .552
I have resources to use e-
retailing .877
I have ability to use e-retailing .926
I have control over e-retailing
usage .786
Extraction Method: Principal Component Analysis.
Rotation Method: Varimax with Kaiser
Normalization.
a. Rotation converged in 7 iterations.
Part 7: FINDINGS Easy to purchase‟ is the strong influencing item among the Factor - 1 „enhance effectiveness of
transactions‟ wherein 30% respondents agreed and 20% respondents strongly agreed, it is easy to make or
receive payments through mobile internet based commerce, which recorded highest mean of 3.15;
„overall mobile internet based commerce is easy to use‟ is the strong influencing item among the Factor -
2 „perceived ease of use‟ wherein 30% respondents agreed and 20% respondents strongly agreed, it is
easier to use mobile internet based commerce for their business operations, which recorded highest mean
of 3.18;„my opinion leaders think I should use mobile internet based commerce for business operations‟ is
the strong influencing item among the Factor - 3 „subjective norms‟ wherein 47.5% respondents agreed

IRA-International Journal of Management & Social Sciences
176
and 5% respondents strongly agreed, that their opinion leaders think they should use mobile internet
based commerce for making their business transactions, which recorded highest mean of 4.25; „I use
mobile internet based commerce voluntarily‟ is the strong influencing item among the Factor - 4
„voluntariness‟ wherein 55% respondents agreed and 25% respondents strongly agreed, that they opted
for using the mobile internet based commerce voluntarily, which recorded highest mean of 4.28; „I use
mobile internet based commerce voluntarily‟ is the strong influencing item among the Factor - 5
„behavioral intention‟ wherein 55% respondents agreed and 25% respondents strongly agreed, that they
opted for using the mobile internet based commerce voluntarily, which recorded highest mean of 4.28; „I
intend to continue using mobile internet based commerce‟ is the strong influencing item among the Factor
- 6 „usage behavior‟ wherein 15% respondents agreed and 55% respondents strongly agreed, that they
have an intention to continue using mobile internet based commerce for their receipts and payments,
which recorded highest mean of 4.30;
Findings - Factor Analysis
Kaiser-Meyer-Olkin (KMO) test: measures strength of the relationship among variables The KMO
measures the sampling adequacy which should be greater than 0.5 for a satisfactory factor analysis to
proceed. Looking at the tables – Table 1.3, Table 2.4, Table 3.3, Table 4.3, Table 5.3, & Table 6.3, the
KMO measure is 0.755, 0.658, 0.723, 0.661, 0.771, 0.794 respectively are above 0.5, affirming for
satisfactory factor analysis to proceed.
Bartlett's test is another indication of the strength of the relationship among variables. This tests the null
hypothesis that the correlation matrix is an identity matrix. An identity matrix is matrix in which all of the
diagonal elements are 1 and all off diagonal elements are 0. You want to reject this null hypothesis. From
the same tables from – Table 1.3, Table 2.4, Table 3.3, Table 4.3, Table 5.3, & Table 6.3, we can see that
the Bartlett's test of sphericity is significant That is, its associated probability is less than 0.05. In fact, it is
actually 0.03, 0.04, 0.05, 0.01, 0.04 & 0.01 i.e. the significance level is small enough to reject the null
hypothesis. This means that correlation matrix is not an identity matrix.
Communalities:
The next item from the output is a table of communalities which shows how much of the variance in the
variables has been accounted for by the extracted factors. From the tables – Table 1.4 over 82% of the
variance in „enhances effectiveness of transactions‟ is accounted for, Table 2.3 over 84% of the variance
in „overall mobile internet based commerce is easy to use‟ is accounted for, Table 3.4 over 96% of the
variance in „my influencers think I should use mobile internet based commerce‟ is accounted for, Table
4.4 over 85% of the variance in „I use mobile internet based commerce voluntarily‟ is accounted for,
Table 5.4 over 55% of the variance in „I intend to continue using mobile internet based commerce‟ is
accounted for, Table 6.4 over 86% of the variance in „I have ability to use mobile internet based
commerce‟ is accounted for.
Total Variance Explained
The next item shows all the factors extractable from the analysis along with their eigenvalues, the percent
of variance attributable to each factor, and the cumulative variance of the factor and the previous factors.
Notice that from Table 1.5 - the first factor accounts for 29.589% of the variance, the second 20.219%,
third factor 16.808% and all the remaining factors are not significant as they have eigenvalues of less than
one, hence only 3 items are retained; Table 2.6 - the first factor accounts for 32.521% of the variance, the
second 20.391%, third factor 19.613% and all the remaining factors are not significant as they have
eigenvalues of less than one hence only 3 items are retained; Table 3.5 - the first factor accounts for
35.167% of the variance, the second 22.562% and all the remaining factors are not significant as they
have eigenvalues of less than one hence only 2 items are retained; Table 4.5 - the first factor accounts for
38.875% of the variance, the second 35.010% and all the remaining factors are not significant as they
have eigenvalues of less than one hence only 2 items are retained; Table 5.5 - the first factor accounts for
IRA-International Journal of Management & Social Sciences
177
55.406% of the variance and all the remaining factors are not significant as they have eigenvalues of less
than one hence only 1 item is retained; Table 6.5 - the first factor accounts for 31.000% of the variance,
the second 23.074%, third factor 21.794% and all the remaining factors are not significant as they have
eigenvalues of less than one, hence only 3 items are retained.
Part 8: Conclusion and Strategic Marketing Imperatives
The advent of technology has brought in radical changes in the business arena, physical payments are
expected to overwhelm by virtual mobile internet based commerce; but the level of acceptance of the
mobile internet based commerce is not uniform across urban and rural markets. The acceptance of the
mobile internet based commerce as preferred alternative for making payments and receipts among the
rural consumers is overshadowed by many factors/forces; the findings of this research provide sufficient
theoretical evidence using Extended Technology Acceptance Model, the extent of influence exerted by
various factors on the acceptance of mobile internet based commerce among rural consumers. In order to
enhance the usage of e-retailing among the rural markets the following strategic marketing initiatives are
suggested.
Company owned e-tailing hubs: villages having population more than 1000, banks and payment bank
companies should set up e-hubs, wherein a trained employee will be posted helping the illiterate and
semiliterate rural people in making and receiving payments online.
Content Vernacularization: create a website portal in vernacular languages to make website portal more
accessible and usable for the rural consumer.
Selective offering: provide the relevant and selective services which are frequently required, , needed and
used by rural consumers.
User friendly interface: rural consumer‟s ability to use web portals is limited compared to urban
counterparts. Thus design web portal which is simple, high degree graphical user interface to encourage
rural consumers to use mobile internet based commerce for making online receipts and payments
frequently.
Rural advocacy: study revealed significant impact of rural opinion leaders in influencing the attitude of
rural consumers towards mobile internet based commerce; thus usage of rural local opinion leaders as
advocates for building trust, confidence and credibility is suggested.
Micro-Target an Online Audience: E-commerce is basically about establishing a “territory”: defining
and designing a site to reach an audience with a common interest or characteristic. Whatever your product
or service, define your company‟s niche markets that you can penetrate online with specialized offerings.
Personalize Site visitors are demanding one-of-a-kind experiences that cater to their needs and interests.
Technology is available, even to smaller players, to capture individual user‟s interests and preferences and
generate a pleasant and easy experience led by individualized promotions tailored to them.
Invest in Mobile Mobile commerce is growing at a rate of over 130 percent annually. If you lack a robust
mobile commerce platform, you will see a dramatic drop off in revenue over the next several years. To
stay competitive, you need to offer mobile-accessible services such as payment/receipt status, real-time
notifications, click-to-call, maps, and other services information.
Mere focus on urban markets is not sufficient for long run sustainable growth, vast rural market offers
huge untapped market potential; thus forging towards rural markets paves path to witness exponential
growth, affluence and progression of the e-retailing company.

IRA-International Journal of Management & Social Sciences
178
References:
1. Arnold, J., Robertson, I. T., & Cooper, C. L. (1991). Work Psychology: Understanding human
behaviour in the workplace. Financial Times/Prentice Hall.
2. Angulo-Ruiz, F., Donthu, N., Prior, D., & Rialp, J. (2014). The financial contribution of customer-
oriented marketing capability. Journal of the Academy of Marketing Science, 42(4), 380-399.
3. Ajzen, I., 1985. From intentions to actions: a theory of planned behavior. Action-control: From
Cognition to Behaviour. Heidelberg: Springer, 11-39.
4. Biondo, A. E., Giarlotta, A., Pluchino, A., & Rapisarda, A. (2016). Perfect Information vs Random
Investigation: Safety Guidelines for a Consumer in the Jungle of Product Differentiation. PloS
one, 11(1), e0146389.
5. Bray, J. P., 2008. Consumer Behaviour Theory: approaches and models.
6. Bruce, M., & Daly, L. (2006). Buyer behaviour for fast fashion. Journal of Fashion Marketing and
Management: An International Journal, 10(3), 329-344.
7. Blackwell, R., Miniard, P.F; 2001. Consumer Behavior. 9th ed. Orlando: Harcourt.
8. Bozinoff, L., 1982. A script theoretic approach to information processing: an energy conservation
application. . In: Advances in Consumer Research IX. Twelfth Annual Conference ed. Missouri:
Association for Consumer Research
9. Cannon, J., McCarthy, J., & Perreault, W. (2008). Basic marketing. A marketing strategy planning
approach. New York: McGraw-Hill.
10. Chegut, A. M., Eichholtz, P. M., & Rodrigues, P. J. (2015). Spatial dependence in international
office markets. The Journal of Real Estate Finance and Economics, 51(2), 317-350.
11. Cohen, S. A., Prayag, G., & Moital, M. (2014). Consumer behaviour in tourism: Concepts,
influences and opportunities. Current Issues in Tourism, 17(10), 872-909.
12. Cron, W. L., Marshall, G. W., Singh, J., Spiro, R. L., & Sujan, H. (2005). Salesperson selection
training and development: trends implications and research opportunities. The Journal of Personal
Selling & Sales Management, 25(2), 123–136.
13. Cross, M.E., Brashear, T., E.E. Rigdon, and D.N. Bellenger (2007), “Customer Orientation and
Salesperson Performance”, European Journal of Marketing, 41 (7-8), 821-835
14. Cziko, G., 2000. The Things We Do: Using the Lessons of Bernard and Darwin to Understand the
What, How, and Why of Our Behavior
15. Donaldson, B. (2007). Sales management: theory and practice. Palgrave Macmillan.
16. Erasmus, A. C., Boshoff,G; 2001. Consumer decision-making models within the discipline of
consumer science: a critical approach. Journal of Family Ecology and Consumer Sciences, 29, 82-
90.
17. Eysenck, M. and Keane,M.T., 2000. Cognitive psychology: a student's handbook. 4th Ed. ed.
London: Lawrence Erlbaum
18. Freud, S., 1923. Das Ich und das Es, Internationaler Psycho-analytisher Verlag, Lepzig, Vienna,
and Zurich. English translation, The Ego and the Id, Joan Riviere (trans.), Hogarth Press and
Institute of Psycho-analysis, London, UK, 1927. Revised for The Standard Edition of the
Complete Psychological Works of Sigmund Freud, James Strachey (ed.), W.W.Norton and
Company, New York, NY, 1961.
19. From Today, „Weekly Markets‟ for Farmers. The Indian Express, 2014
20. Fishbein, M., Ajzen, I., 1975. Beleif, attitude, intention and behavior: An introduction to theory
and research. Reading, MA.: Addison-Wesley
21. Foxall, G., 1990. Consumer Psychology in Behavioural Perspective. London: Routledge.
22. Futrell, C.M. (2002) Fundamentals of Selling: Customers for Life, 7th Edition, New York:
McGraw-Hill.
23. Gereffi, G., 1994, The Organization of Buyer-Driven Global Commodity Chains: How US
Retailers Shape Overseas Production Networks, Gereffi and Korzeniewicz (eds.) (95–122).
IRA-International Journal of Management & Social Sciences
179
24. Gordon, G.L., D.C.Weilbaker, R.E. Ridnour, and K. Judson (2008), “The Idea Generation Stage of
the New Product Development Process: Can Key Account Management Systems Help?” Journal
of Selling & Major Account Management, 8( 2), 26-42.
25. Hanan, M. (2004). Consultative Selling: The Hanan Formula for High-Margin Sales at High
Levels. New York: Amacom.
26. Hines, C., Ames,A., 2000. Ethical consumerism - a research study conducted for the co-operative
bank. In: London: Mori.
27. Hogg, M. A., & Terry, D. J. (Eds.). (2014). Social identity processes in organizational contexts.
Psychology Press.
28. Howard, J. A., Seth,J.N; 1969. The Theory of Buyer Behaviour. London: John Wiley and Sons,
Inc.
29. Hillner, K. P., 1984. History and Systems of Modern Psychology: A Conceptual Approach. New
York: Gardner Press.
30. Jacoby, J., 2002. Stimulus-Organism-Response Reconsidered: An Evolutionary Step in Modeling
(Consumer) Behavior. Journal of Consumer Psychology, 12, (1) 51-57.
31. Sheth, J.N;1975, "Toward a Model of Individual Choice Behavior
32. Jobber, D., & Lancaster, G. (2009). Selling and Sales Management 8 th ed FT Prentice Hall
Pearson.
33. Johnston, M. W., & Marshall, G. W. (2005). Relationship selling and sales management.
Irwin/McGraw-Hill.
34. Jones, E., Chonko, L. B., & Roberts, J. A. (2004). Sales force obsolescence: Perceptions from
sales and marketing executives of individual organizational and environmental factors. Industrial
Marketing Management, 33(5), 439–456
35. Jones, R. (2002). The Apparel Industry, Blackwell Science Ltd, Aylesbury.
36. Joshi, A., & Ruparel, P. (2016). India. In Angel Financing in Asia Pacific: A Guidebook for
Investors and Entrepreneurs (pp. 151-169). Emerald Group Publishing Limited.
37. Judson, K., Schoenbachler, D. D., Gordon, G. L., Ridnour, R. E., & Weilbaker, D. C. (2006). The
new product development process: Let the voice of the salesperson be heard. The Journal of
Product and Brand Management, 15(3), 194–202.
38. Kilduff, P. (2005), “Patterns of strategic adjustment in the US textile and apparel industries since
1979”, Journal of Fashion Marketing and Management, Vol. 9 No. 2, pp. 180-95.
39. Krugman, Herbert E. (1965), "The Impact of Television Advertising: Learning Without
Involvement," Public Opinion Quarterly, 29(4), 349-356.
40. Kohli, A.K., and B.J. Jaworski (1990), “Market Orientation: the Construct, Research Propositions,
and Managerial Implications”, Journal of Marketing, 54 (2), 1-18.
41. Kotler, P, & Armstrong, G, (2006). Principle of marketing, 7th Edition, Prentice Hall.
42. Kotler, P., & Armstrong, G. (2010). Principles of marketing. Pearson education
43. Kotler, P., Rackham, N., & Krishnaswamy, S. (2006). Ending the war between sales and
marketing. Harvard Business Review, 84(7/8), 68.
44. Levi, D. (2015). Group dynamics for teams. Sage Publications.
45. Lovelock, C., & Wirtz, J. (2011). Marketing de servicios. Pearson Educación de México SA de
CV.
46. Manning, G. L., Reece, B. L., & Dujmović, Z. (2007). Suvremena prodaja: stvaranje vrijednosti za
kupca. Mate.
47. Moital, M. L., 2007. An Evaluation of the factors influencing the adoption of e-commerce in the
purchasing of leisure travel by the residents of Cascais, Portugal. In: Bournemouth University
48. Möller, K., & Parvinen, P. (2015). An impact-oriented implementation approach in business
marketing research: Introduction to the Special Issue on “Implementing Strategies and Theories of
B2B Marketing and Sales Management”. Industrial Marketing Management, 45, 3-11.
49. Nicholls, A., Lee, C.M., 2006. Purchase decision-making in fair trade and the ethcial purchase
'gap': 'Is there a fair trade twix?' Journal of Strategic Marketing, 14, (4) 369-386.
IRA-International Journal of Management & Social Sciences
180
50. Nye, R. D., 1979. What is B.F. Skinner really saying? In: New York: Prentice-Hall.
51. Pederson, Carlton A., Milburn D. Wright, and Barton Weitz (1988), Selling: Principles and
Methods. Homewood, IL; Irwin Inc.
52. Perry, D. (2000) „Rural weekly markets and the dynamics of time, space and community in
Senegal‟, The Journal of Modern African Studies, 38(3), pp. 461–485.
53. Peter, P. J. and Olson,J., 2008. Consumer Behavior and Marketing Strategy. Singapore: McGraw
Hill
54. Ram, P., & Almodovar, C. (2003). U.S. Patent Application No. 10/527,400.
55. Ribeaux, P., & Poppleton, S. E. (1978). Psychology and Work: an introduction. Macmillan.
56. Schmitz, H.,1998, Responding to Global Competitive Pressure: Local Co-operation and Upgrading
in the Sinos Valley, Brazil, Institute of Development Studies, University of Sussex, Brighton, IDS
Working Paper, No.82.
57. Schiffman, L. G. and Kanuk L.L., 2007. Consumer Behavior. 9th ed. New Jersey: Prentice Hall.
58. Sheth, J. N. (1975, June). Toward a Model of Individual Choice Behavior. In ESOMAR Seminar
on Modeling.
59. Simon, H., 1991. Models of my Life. New York: Basic Books; Harper Collins.
60. Simon H., 1997. Administrative Behavior: A Study of Decision-Making Processes in
Administrative Organizations. 4th ed.New York: The Free Press.
61. Skinner, B. F., 1938. The behavior of organisms. An Experimental Analysis. In: New York:
Appleton-Century
62. Speier, C., & Venkatesh, V. (2002). The hidden minefields in the adoption of sales force
automation technologies. The Journal of Marketing, 66(3), 98–111.
63. Sternberg, R. J., 1996. Cognitive Psychology. Orlando: Harcourt.
64. Stewart, J., 1994. The psychology of decision making. Decision Making: an Integrated Approach.
London: Pitman,
65. Sugars, C. (2006). Marketing Ambivalence. Canadian cultural poesies: Essays on Canadian
culture, (5), 121.
66. Wang, B., Li, H., & Li, M. (2013, June). Privacy-preserving public auditing for shared cloud data
supporting group dynamics. In Communications (ICC), 2013 IEEE International Conference
on (pp. 1946-1950). IEEE.
67. Walker, Orville, Boyd, Harper W. Jr, Larreche, Jean Claude (2003), “Marketing Strategy,
Planning and Implementation”, page 335, Mc. Graw-Hill International.
68. Watson, J. B. (1913). Psychology as the behaviorist views it. Psychological review, 20(2), 158.
69. Watson, J. B., & Rayner, R. (1920). Conditioned emotional reactions. Journal of experimental
Psychology, 3(1), 1.
70. Wiener, M. (2015). State politics in India. Princeton University Press.
71. Zinkhan, G. M., 1992. Human Nature and Models of Consumer Decision Making. Journal of
Advertising, 21, (4)