HARYANA POWER SECTOR AN OVERVIEW - … POWER SECTOR AN OVERVIEW Haryana became the first fully...
24
HARYANA POWER SECTOR AN OVERVIEW ! ! ! ! ! ! ! ! ! ! Haryana became the first fully electrified State in November 1970. Generation capacity increased to 4072.30 MW in 2007 from 343 MW in 1967. Sub-Stations have increased to 560 in 2007 from 47 in 1967. Transmission and Distribution lines have increased to about 195000 KMs in 2007 from about 1800 KMs in 1967. Connected load has increased to 11693 MW in 2007 from 372 MW in the year 1967. Number of consumers increased to more than 41 lac in 2007 from about 3 lac in 1967. State has the maximum density of Agriculture tubewells in the country i.e. 10 tubewells per square Km area and has 475000 tubewells in 2007 compared to 20190 in 1967. About 50% of available power is provided to rural sector against national average of 26%. Average daily availability of power has increased to 665 LUs per day in 2007 from about 18 LUs per day in 1967. Per capita consumption of electricity has increased to 660 Units in 2007 from 57 Units in 1967. ! ! ! ! ! ! ! ! ! ! Haryana became the in November 1970. increased to in 2007 from in 1967. have increased to in 2007 from in 1967. have increased to about in 2007 from about in 1967. has increased to in 2007 from in the year 1967. increased to more than 41 lac in 2007 from about 3 lac in 1967. State has the maximum in the country i.e. 10 tubewells per square Km area and has tubewells in 2007 compared to in 1967. About of available power is provided to rural sector against national average of of power has increased to per day in 2007 from about per day in 1967. of electricity has increased to in 2007 from in 1967. first fully electrified State Generation capacity 4072.30 MW 343 MW Sub-Stations 560 47 Transmission and Distribution lines 195000 KMs 1800 KMs Connected load 11693 MW 372 MW Number of consumers density of Agriculture tubewells 475000 20190 50% 26%. Average daily availability 665 LUs 18 LUs Per capita consumption 660 Units 57 Units
Transcript of HARYANA POWER SECTOR AN OVERVIEW - … POWER SECTOR AN OVERVIEW Haryana became the first fully...

HARYANA POWER SECTORAN OVERVIEW
�
�
�
�
�
�
�
�
�
�
Haryana became the first fully electrified State in
November 1970.Generation capacity increased to 4072.30 MW in
2007 from 343 MW in 1967.Sub-Stations have increased to 560 in 2007 from
47 in 1967.Transmission and Distribution lines have
increased to about 195000 KMs in 2007 from
about 1800 KMs in 1967.Connected load has increased to 11693 MW in
2007 from 372 MW in the year 1967.Number of consumers increased to more than 41
lac in 2007 from about 3 lac in 1967.State has the maximum density of Agriculture
tubewells in the country i.e. 10 tubewells per
square Km area and has 475000 tubewells in 2007
compared to 20190 in 1967.About 50% of available power is provided to rural
sector against national average of 26%.Average daily availability of power has increased
to 665 LUs per day in 2007 from about 18 LUs per
day in 1967.Per capita consumption of electricity has
increased to 660 Units in 2007 from 57 Units in
1967.
�
�
�
�
�
�
�
�
�
�
Haryana became the in
November 1970.increased to in
2007 from in 1967.have increased to in 2007 from
in 1967.have
increased to about in 2007 from
about in 1967.has increased to in
2007 from in the year 1967.increased to more than 41
lac in 2007 from about 3 lac in 1967.State has the maximum
in the country i.e. 10 tubewells per
square Km area and has tubewells in 2007
compared to in 1967.About of available power is provided to rural
sector against national average ofof power has increased
to per day in 2007 from about per
day in 1967.of electricity has
increased to in 2007 from in
1967.
first fully electrified State
Generation capacity 4072.30 MW
343 MWSub-Stations 560
47Transmission and Distribution lines
195000 KMs
1800 KMsConnected load 11693 MW
372 MWNumber of consumers
density of Agriculture
tubewells
475000
2019050%
26%.Average daily availability
665 LUs 18 LUs
Per capita consumption
660 Units 57 Units
THE REFORM PATH�
�
�
�
�
�
�
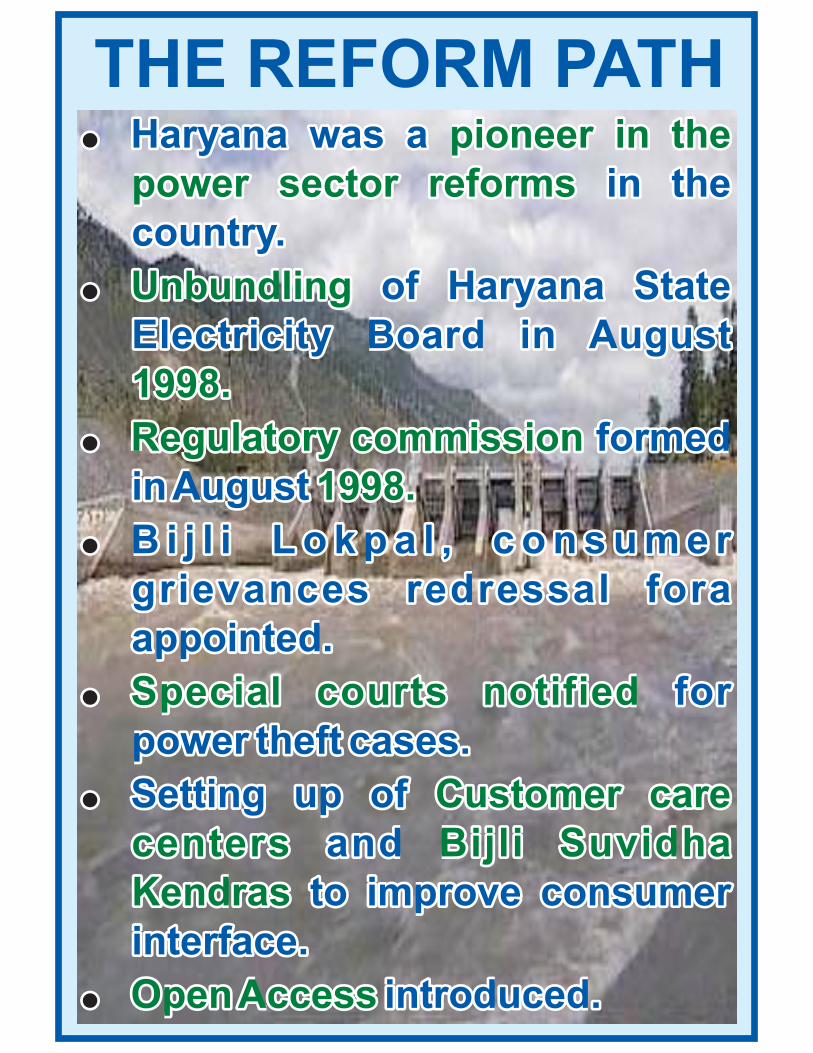
Haryana was a pioneer in the
power sector reforms in the
country.
Unbundling of Haryana State
Electricity Board in August
1998.
Regulatory commission formed
inAugust 1998.
B i j l i L o k p a l , c o n s u m e r
grievances redressal fora
appointed.
Special courts notified for
power theft cases.
Setting up of Customer care
centers and Bijli Suvidha
Kendras to improve consumer
interface.
OpenAccess introduced.
�
�
�
�
�
�
�
Haryana was a
in the
country.
of Haryana State
Electricity Board in August
formed
inAugust
B i j l i L o k p a l , c o n s u m e r
grievances redressal fora
appointed.
for
power theft cases.
Setting up of
and
to improve consumer
interface.
introduced.
pioneer in the
power sector reforms
Unbundling
1998.
Regulatory commission
1998.
Special courts notified
Customer care
centers Bijli Suvidha
Kendras
OpenAccess

PERFORMANCE IMPROVEMENT ANDOPERATIONAL EFFICIENCY-GENERATION
HIGHLIGHTS OF PERFORMANCE
DURING THE YEAR
2006-07
• HIGHEST ANNUAL PLF OF 78.78% SINCE
FORMATION OF HPGCL.
• HIGHEST ANNUAL PLF OF 91.09% FOR 210/ 250
MW UNITS, PTPS, PANIPAT.
• LOWEST AUXILIARY CONSUMPTION OF 9.80%
SINCE FORMATION OF HPGCL.
• LOWEST SPECIFIC COAL CONSUMPTION OF 721
gm PER UNIT SINCE FORMATIOIN OF HPGCL.
• LOWEST SPECIFIC OIL CONSUMPTION OF 1.85 ml
PER UNIT SINCE FORMATION OF HPGCL.
HIGHLIGHTS OF PERFORMANCE
DURING THE YEAR
2006-07
• HIGHEST ANNUAL SINCE
FORMATION OF HPGCL.
• HIGHEST ANNUAL FOR 210/ 250
MW UNITS, PTPS, PANIPAT.
• LOWEST AUXILIARY CONSUMPTION OF
SINCE FORMATION OF HPGCL.
• LOWEST SPECIFIC COAL CONSUMPTION OF
PER UNIT SINCE FORMATIOIN OF HPGCL.
• LOWEST SPECIFIC OIL CONSUMPTION OF
PER UNIT SINCE FORMATION OF HPGCL.
PLF OF 78.78%
PLF OF 91.09%
9.80%
721
gm
1.85 ml
Parameters 2000-01 2006-07
Installed Capacity (MW) 863.30 1587.40
Generation (MUs) 3792 10780
Plant Load Factor (%) 49.73 78.78
Auxiliary Consumption (%) 11.80 9.80
Coal Consumption 816 721
(gms/kwh)
Oil Consumption 5.97 1.85
(ml/kwh)
Parameters 2000-01 2006-07
Installed Capacity (MW) 863.30 1587.40
Generation (MUs) 3792 10780
Plant Load Factor (%) 49.73 78.78
Auxiliary Consumption (%) 11.80 9.80
Coal Consumption 816 721
(gms/kwh)
Oil Consumption 5.97 1.85
(ml/kwh)

PERFORMANCE IMPROVEMENT ANDOPERATIONAL EFFICIENCY-TRANSMISSION�
�
�
�
DURING THE LAST 2 YEARS 42
NEW SUB-STATIONS WERE
COMMISSIONED 139 EXISTING
SUB-STATIONS AUGMENTED
AND 913 KM TRANSMISSION
LINES CONSTRUCTED BY
ADDING 2082 MVA CAPACITY
WITH AN INVESTMENT OF Rs.
340 CRORE.
TOTAL TRANSMISSION LOSSES
REDUCED FROM 5.91 % IN 2002
TO 4.83 % IN THE YEAR 2007.
INTRA STATE TRANSMISSION
LOSSES REDUCED FROM 4.11 %
IN 2002 TO 2.95 % IN 2007.
T R A N S M I S S I O N S Y S T E M
AVAILABILITY 99.62% IN 2006-07.
,
�
�
�
�
DURING THE LAST 2 YEARS
NEW SUB-STATIONS WERE
COMMISSIONED EXISTING
SUB-STATIONS AUGMENTED
AND KM TRANSMISSION
LINES CONSTRUCTED BY
ADDING MVA CAPACITY
WITH AN INVESTMENT OF Rs.
CRORE.
TOTAL TRANSMISSION LOSSES
REDUCED FROM IN 2002
TO IN THE YEAR 2007.
INTRA STATE TRANSMISSION
LOSSES REDUCED FROM
IN 2002 TO IN 2007.
T R A N S M I S S I O N S Y S T E M
AVAILABILITY IN 2006-07.
,
42
139
913
2082
340
5.91 %
4.83 %
4.11 %
2.95 %
99.62%

INITIATIVES TO REDUCE TECHNICAL &COMMERCIAL LOSSES-DISTRIBUTION
TECHNICAL LOSSESTECHNICAL LOSSES
�
�
�
�
�
�
�
�
IMPROVEMENT IN HT/LT RATIO AND SYSTEM TO
MATCH LOAD REQUIREMENTS.
DT METERING TO ENSURE ENERGYAUDIT.
IMPLEMENTATION OF HVDS.
INTRODUCTION OF AMORPHOUS CORE
DISTRIBUTIONTRANSFORMERS.
SEGREGATION OF RURAL DOMESTIC LOAD FROM
AGRICULTURE LOAD.
INSTALLATION OF CAPACITORS.
FEEDER WISE DEPLOYMENT OF STAFF.
REPLACEMENT OF BARE CONDUCTOR WITH ABC
CABLES/ARMOURED CABLE.
�
�
�
�
�
�
�
�
IMPROVEMENT IN HT/LT RATIO AND SYSTEM TO
MATCH LOAD REQUIREMENTS.
DT METERING TO ENSURE
IMPLEMENTATION OF
INTRODUCTION OF AMORPHOUS CORE
DISTRIBUTIONTRANSFORMERS.
OF RURAL DOMESTIC LOAD FROM
AGRICULTURE LOAD.
INSTALLATION OF CAPACITORS.
FEEDER WISE DEPLOYMENT OF STAFF.
REPLACEMENT OF BARE CONDUCTOR WITH ABC
CABLES/ARMOURED CABLE.
ENERGYAUDIT.
HVDS.
SEGREGATION
COMMERCIAL LOSSESCOMMERCIAL LOSSES
�
�
�
�
�
�
�
�
�
�
CHECKING OF CONSUMER PREMISES.
REGULARIZATION OF KUNDI CONNECTIONS.
METER SEALINGAND CALIBRATION.
DISCONNECTION OF DEFAULTING CONSUMERS.
VOLUNTARY DISCLOSURE SCHEME.
SHIFTING OF METERS OUTSIDE CONSUMER
PREMISES.
IMPROVING CONSUMER INTERFACE.
SPOT BILLING.
MULTI MODAL BILL COLLECTION FACILITY.
MONITORING LARGE CONSUMERS.
�
�
�
�
�
�
�
�
�
�
CHECKING OF
REGULARIZATION OF KUNDI CONNECTIONS.
METER SEALINGAND CALIBRATION.
DISCONNECTION OF DEFAULTING CONSUMERS.
VOLUNTARY DISCLOSURE SCHEME.
OUTSIDE CONSUMER
PREMISES.
IMPROVING CONSUMER INTERFACE.
MULTI MODAL BILL COLLECTION FACILITY.
MONITORING LARGE CONSUMERS.
CONSUMER PREMISES.
SHIFTING OF METERS
SPOT BILLING.

FIRST CFL VILLAGE OF HARYANABINOLA IN DISTT. GURGAON
• Load reduced to half during peakload hours.Deficiencies of distribution system automatically removed.Both transformers now have spare capacity.
••
�
�
�
�
�
�
�
700 Compact Fluorescent Lamps have been
provided in 98 houses to replace inefficient
incandescent bulbs.
Load has reduced to 50% during peakload
hours.
Binola has two distribution transformers for
power supply. After providing CFL, load on one
transformer has reduced from 120 Ampere to 70
Ampere and on the other from 98 Ampere to 48
Ampere.
The incidence of interruption in power supply
due to blowing off of fuses, damage of
transformer, and system contraints has been
reduced.
Voltage profile in all the three phases of both the
transformers is optimal, leading to quality
supply.
After the present load is met, capacity in the two
transformers is now available for new
connections.
CFL use in the households has reduced the
energy bills of the households.
�
�
�
�
�
�
�
700 Compact Fluorescent Lamps
Load has reduced to 50%
load
reduced from 120 Ampere to 70
Ampere from 98 Ampere to 48
Ampere
interruption in power supply
reduced
Voltage profile
optimal
capacity
now available
CFL use reduced the
energy bills
have been
provided in 98 houses to replace inefficient
incandescent bulbs.
during peakload
hours.
Binola has two distribution transformers for
power supply. After providing CFL, on one
transformer has
and on the other
.
The incidence of
due to blowing off of fuses, damage of
transformer, and system contraints has been
.
in all the three phases of both the
transformers is , leading to quality
supply.
After the present load is met, in the two
transformers is for new
connections.
in the households has
of the households.
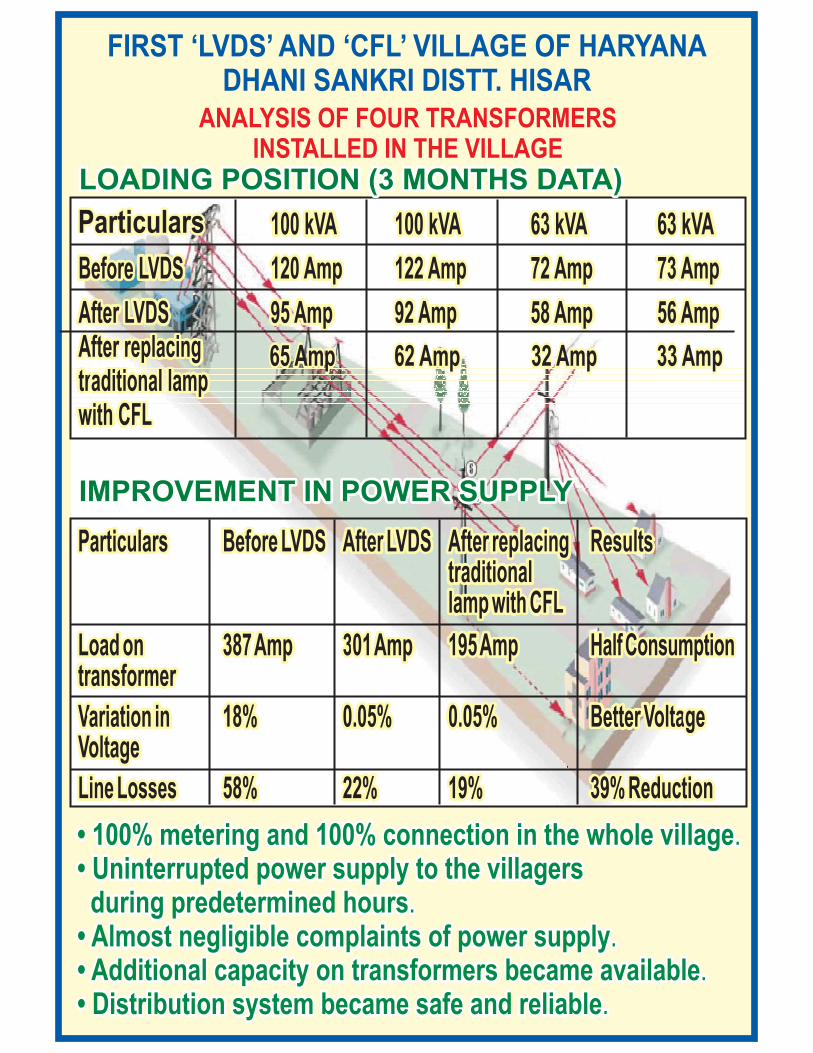
FIRST ‘LVDS’ AND ‘CFL’ VILLAGE OF HARYANADHANI SANKRI DISTT. HISAR
ANALYSIS OF FOUR TRANSFORMERSINSTALLED IN THE VILLAGE
• 100% metering and 100% connection in the whole village• Uninterrupted power supply to the villagersduring predetermined hours
• Almost negligible complaints of power supply• Additional capacity on transformers became available• Distribution system became safe and reliable
.
..
..
• 100% metering and 100% connection in the whole village• Uninterrupted power supply to the villagersduring predetermined hours
• Almost negligible complaints of power supply• Additional capacity on transformers became available• Distribution system became safe and reliable
.
..
..
IMPROVEMENT IN POWER SUPPLYIMPROVEMENT IN POWER SUPPLY
LOADING POSITION (3 MONTHS DATA)LOADING POSITION (3 MONTHS DATA)
ParticularsParticulars
65 Amp65 Amp 62 Amp62 Amp 32 Amp32 Amp 33 Amp33 Amp

INNOVATIVE SCHEME FOR SETTLEMENT OFRURAL ELECTRICITY ARREARS
�
�
�
�
�
�
Govt. of Haryana announced thescheme for settlement of arrears ofrural domestic and agriculturalconsumers w.e.f 17.06.2005.Defaulting consumers given anopportunity to get their outstandingdues waived by regularly paying theircurrent electricity bills for a period of20 months.Out o f 13 .87 lac de fau l t ingconsumers, 9.2 lac consumers joinedthe scheme.88.2 % of defaulting agriculturalconsumers and 62% of defaultingdomestic consumers have returned tothe mainstream and become payingconsumers.Total amount frozen for the waiver isRs. 1206.18 crore*.The current dues recovered areRs.333.79 crore.
�
�
�
�
�
�
Govt. of Haryana announced thescheme for ofrural domestic and agriculturalconsumers .Defaulting consumers given anopportunity to get their
by regularly paying theircurrent electricity bills for a period of20 months.Out o f de fau l t ingconsumers,the scheme.
of defaultingand of defaulting
haveand become paying
consumers.Total for the waiver is
The are
settlement of arrears
w.e.f 17.06.2005
outstandingdues waived
13 .87 lac9.2 lac consumers joined
88.2 % agriculturalconsumers 62%domestic consumers returned tothe mainstream
amount frozenRs. 1206.18 crore*.
current dues recoveredRs.333.79 crore.
* As on 28.02.2007

PROJECTED LOAD GROWTHIN HARYANA
Year 2005-06 2006-07 2007-08 2008-09 2009-10 2010-11 2011-12
Projected Demand(MW) with 14%Growth
4951(base)
5644 6434 7335 8362 9533 10867
4951
5644
6434
7335
8362
9533
10867

PROJECTED CAPACITY AVAILABLILITY (MW)Year 2005-06 2006-07 2007-08 2008-09 2009-10 2010-11 2011-12
EXISTING CAPACITY
PROPOSED CAPACITY
State Owned 1587.40 1587.40 1587.40 1587.40 1587.40 1587.40 1587.40
Projects
Central sector 1514.40
& others
BBMB & IP 937.50
1514.40 1514.40 1514.40 1514.40 1514.40 1514.40
937.50 937.50 937.50 937.50 937.50 937.50
DCRTPP, 600 600 600 600 600
Yamuna Nagar
Hisar TPS 1100 1100 1100
Jhajjar Case-2 1150 1150
Aravali STPS, 750 750
Jhajjar
Faridabad Gas 432 432
Yamuna Nagar 300
Extn.
Additional 12 204 455 994 1231 2867
availability
through
PPA with
IPPs' CPSU
Total Capacity 4039.30 4051.30 4843.30 5094.30 6733.30 9302.30 11238.30
(MW)

LOAD & CAPACITY GROWTH(MW) CURVE
9302
9533
Demand with 14% Annual Growth
MW

11 FIVE YEAR PLAN INVESTMENTSTH
PROJECTS/SCHEMES
Generation
New Generation Projects
Renovation & Modernisation
Other Works
Total Generation
Transmission
Construction of 6 No. 400KV, 34 No. 220KV, 46 No. 132KV and 46 No. 66KV New Sub Stations
Augmentation of Existing Sub Stations
SLDC
Total Transmission
Distribution
773..19
2203.45
1946.45
1654.00
6577.09
24316.82
New 33 KV S/Stn., Aug. of 33 KV S/Stn., New 33 KV Lines and HT Capacitors.
Bi/Trifurcation of 11 KV Feeders, Aug. and addition of new DTs alongwith
11 KV and LT lines, Aug. of 11 KV and LT lines, strengthening of Dist. system
under RGGVY, providing AB cables, NABARD works and APDRP works
Segregeration of Rural domestic load from rural agriculture load, Providing
HVDS/LVDS, Providing Area Load Despatch Centre, Consumers metering,
DT metering, Feeders Metering, prepaid metering.
Demand side management activities
Total Distribution
Grand Total (Generation + Transmission + Distribution)
Amount(Rs. Crore)
9272.91
769.10
25.80
10042.01
7207.72
290.00
200.00
7697.72
Govt. of Haryana will provide equity support of Rs. 4687 crore

GENERATION CAPACITY ADDITIONPROGRAMME IN THE STATE
DURING 11 PLAN (2007-12)th
Sr.No.Sr.No. Name of ProjectName of Project Capacity in MWCapacity in MW CommissioningSchedule
CommissioningSchedule
1.1.
2.2.
3.3.
4.4.
5.5.
Deenbandhu Chootu RamThermal Power ProjectDeenbandhu Chootu RamThermal Power Project
Hisar Thermal Power ProjectHisar Thermal Power Project
Aravali Super Thermal PowerProject, Jhajjar (JV betweenNTPC, Delhi & Haryana)
Aravali Super Thermal PowerProject, Jhajjar (JV betweenNTPC, Delhi & Haryana)
Jhajjar Thermal PowerProject (Case-2)Jhajjar Thermal PowerProject (Case-2)
Yamuna Nagar ExtensionYamuna Nagar Extension
TOTAL CAPACITY ADDITIONTOTAL CAPACITY ADDITION
2×300 MW2×300 MW
2×600 MW2×600 MW
3×500 MW(Haryana Share750 MW)
3×500 MW(Haryana Share750 MW)
1150 MW1150 MW
300 MW300 MW
4000 MW4000 MW
2011-122011-12
2010-112010-11
Unit-I : 19.11.2007Unit-II : 19.02.2008Unit-I : 19.11.2007Unit-II : 19.02.2008
Unit-I : 28.12.2009Unit-II : 28.03.2010Unit-I : 28.12.2009Unit-II : 28.03.2010
Unit-I : 15.04.2010Unit-II : 15.06.2010Unit-III : 15.08.2010
Unit-I : 15.04.2010Unit-II : 15.06.2010Unit-III : 15.08.2010

PROCUREMENT OF POWER THROUGHTARIFF BASED COMPETITIVE BIDDING
UNDER CASE-1 AND CASE-2CASE-1
• TARIFF BASED COMPETITIVE BIDS
INVITED FOR 2000 MW POWER.
• 14 BIDDERS QUALIFIED.
• PROCESS OF CONSULTATION ON
F O R F I N A L I S AT I O N O F R F P
DOCUMENTS.
• LIKELY AVAILABILITY OF POWER
FROM THE PROJECTS : 2010-11
ONWARDS.
CASE-2
• TARIFF BASED COMPETITIVE BIDS
INVITED FOR SETTING UP A 1150 ±
15% MW COAL BASED PROJECT AT
JHAJJAR.
• 19 BIDS IN RESPONSE TO RFQ ARE
BEING EXAMINED.
• LIKELY AVAILABILITY OF POWER
FROMTHEPROJECT:DURING2010-11.
CASE-1
CASE-2
• TARIFF BASED COMPETITIVE BIDS
INVITED FOR 2000 MW POWER.
• 14 BIDDERS QUALIFIED.
• PROCESS OF CONSULTATION ON
F O R F I N A L I S AT I O N O F R F P
DOCUMENTS.
• LIKELY AVAILABILITY OF POWER
FROM THE PROJECTS : 2010-11
ONWARDS.
• TARIFF BASED COMPETITIVE BIDS
INVITED FOR SETTING UP A 1150 ±
15% MW COAL BASED PROJECT AT
JHAJJAR.
• 19 BIDS IN RESPONSE TO RFQ ARE
BEING EXAMINED.
• LIKELY AVAILABILITY OF POWER
FROMTHEPROJECT:DURING2010-11.
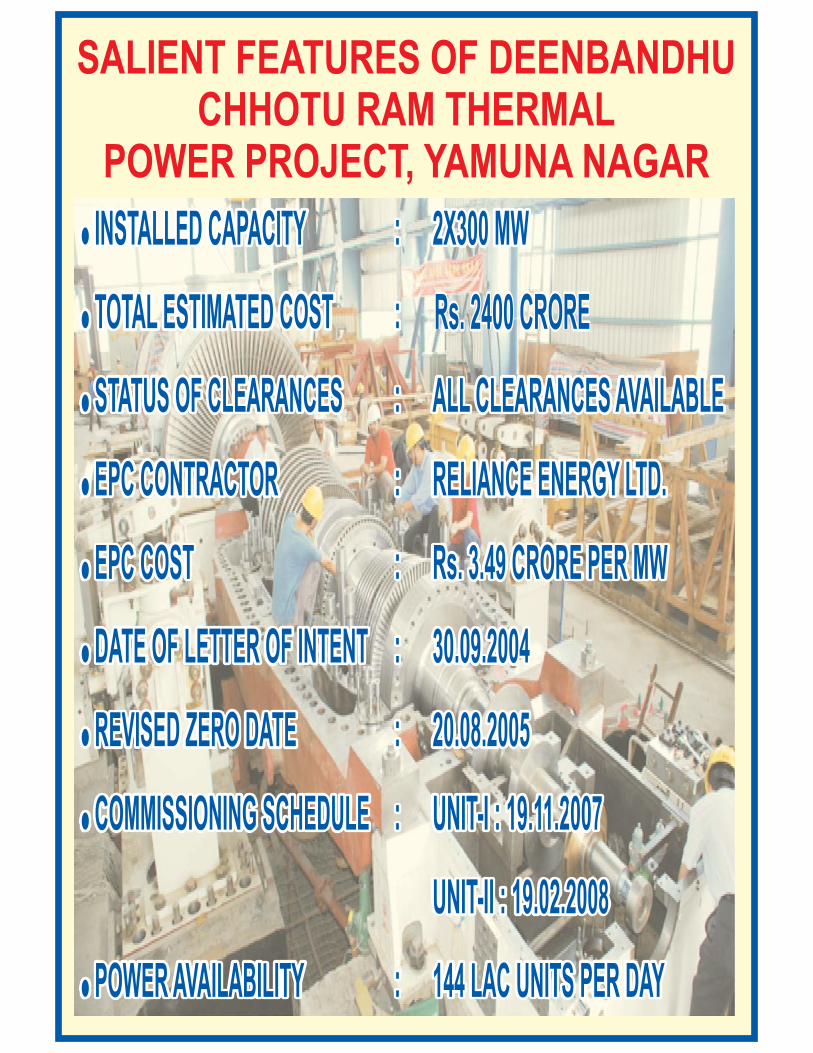
SALIENT FEATURES OF DEENBANDHUCHHOTU RAM THERMAL
POWER PROJECT, YAMUNA NAGAR
Rs. 2400 CRORERs. 2400 CRORE

YAMUNA NAGAR
PROJECT SCHEDULE - Unit-2
YAMUNA NAGAR
PROJECT SCHEDULE - Unit-1
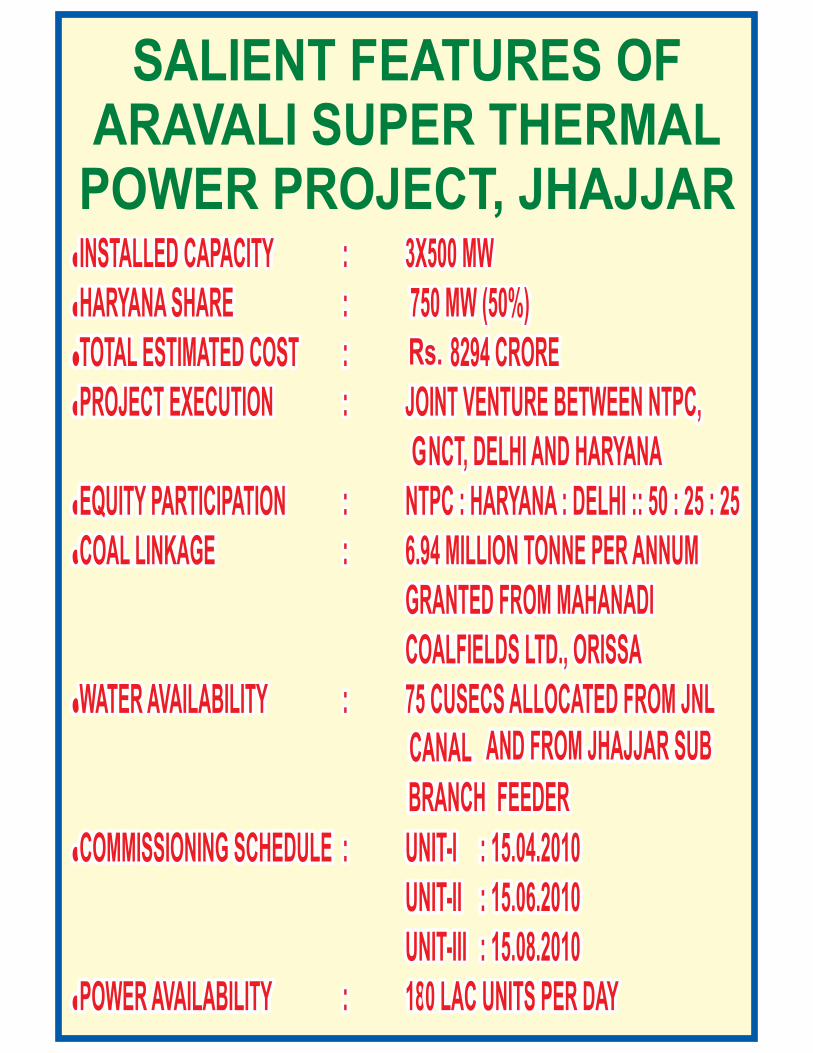
SALIENT FEATURES OFARAVALI SUPER THERMAL
POWER PROJECT, JHAJJAR
Rs.Rs.
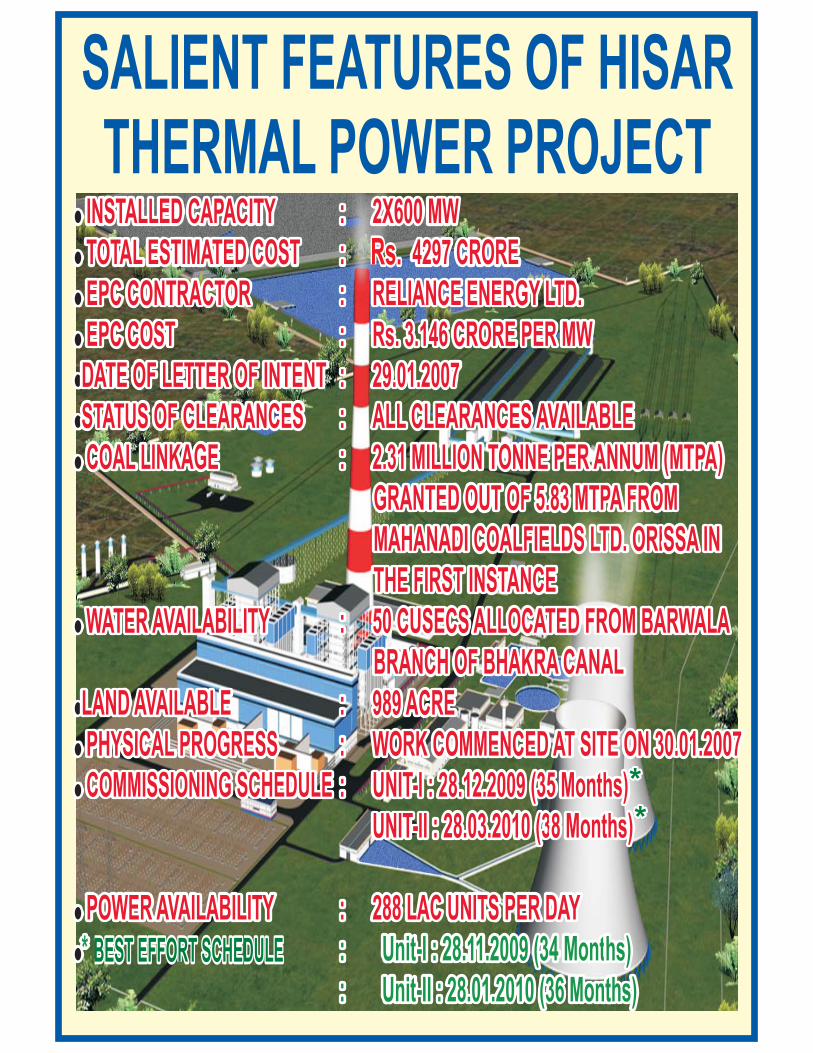
SALIENT FEATURES OF HISARTHERMAL POWER PROJECT
Rs.Rs.
**
**
BEST EFFORT SCHEDULEBEST EFFORT SCHEDULE
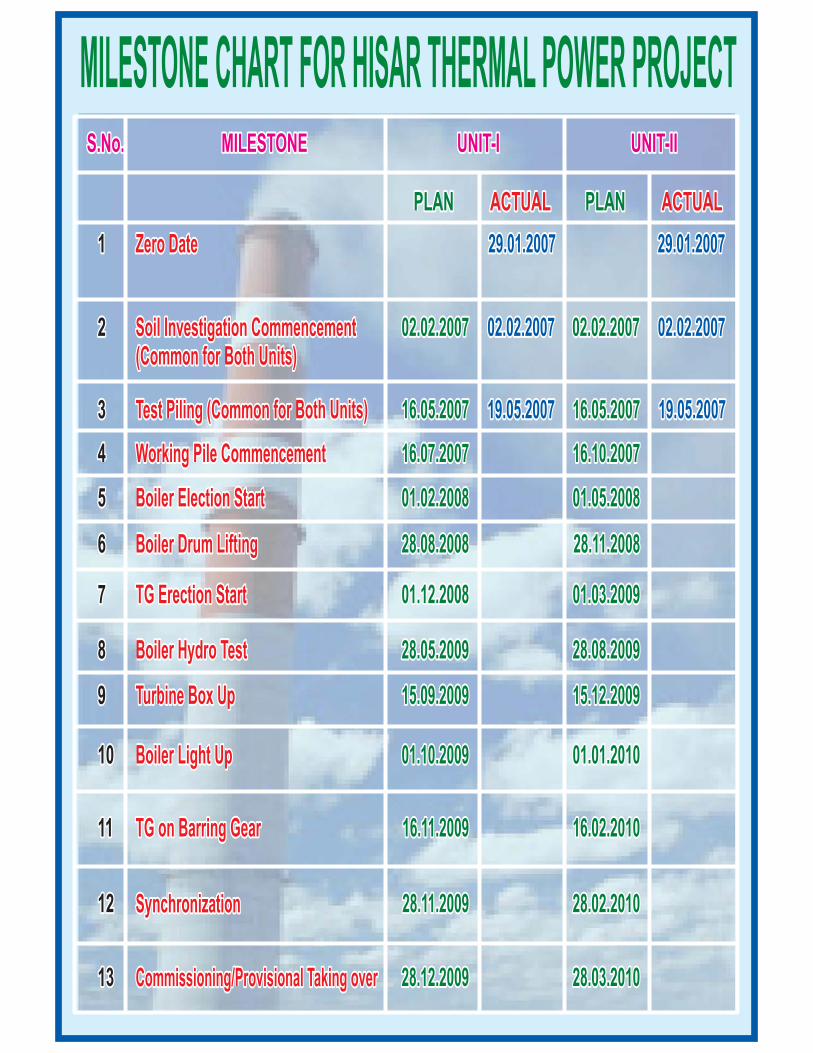
MILESTONE CHART FOR HISAR THERMAL POWER PROJECTS.No.S.No. MILESTONEMILESTONE UNIT-IUNIT-I UNIT-IIUNIT-II
PLANPLAN ACTUALACTUAL PLANPLAN ACTUALACTUAL
11 Zero DateZero Date 29.01.200729.01.2007 29.01.200729.01.2007
22 Soil Investigation Commencement(Common for Both Units)Soil Investigation Commencement(Common for Both Units)
02.02.200702.02.200702.02.200702.02.2007 02.02.200702.02.2007 02.02.200702.02.2007
33 Test Piling (Common for Both Units)Test Piling (Common for Both Units) 19.05.200719.05.200716.05.200716.05.2007 19.05.200719.05.200716.05.200716.05.2007
44 Working Pile CommencementWorking Pile Commencement 16.07.200716.07.2007 16.10.200716.10.2007
55 Boiler Election StartBoiler Election Start 01.02.200801.02.2008 01.05.200801.05.2008
66 Boiler Drum LiftingBoiler Drum Lifting 28.08.200828.08.2008 28.11.200828.11.2008
77 TG Erection StartTG Erection Start 01.12.200801.12.2008 01.03.200901.03.2009
88 Boiler Hydro TestBoiler Hydro Test 28.05.200928.05.2009 28.08.200928.08.2009
99 Turbine Box UpTurbine Box Up 15.09.200915.09.2009 15.12.200915.12.2009
1010 Boiler Light UpBoiler Light Up 01.10.200901.10.2009 01.01.201001.01.2010
1111 TG on Barring GearTG on Barring Gear 16.11.200916.11.2009 16.02.201016.02.2010
1212 SynchronizationSynchronization 28.11.200928.11.2009 28.02.201028.02.2010
1313 Commissioning/Provisional Taking overCommissioning/Provisional Taking over 28.12.200928.12.2009 28.03.201028.03.2010

HARYANA’S FIRST CFL FEEDERBHUNA
(DISTT. SIRSA)INFORMATION
Name of Villages on the feeder :Total number of consumers : 1250Total number of CFLs used : 5760Length of feeder : 18 kilometres
• Bhuna, Chakka, Gidara and Ghoranwali•••
BENEFITS OF INSTALLATION OF CFLSi. Load reduced to 50% during peak load hours.ii. All the 12 transformers have, now, spare capacity.iii. Complaints of interruptions in supply reduced considerably.iv. Increase in redundancy of the system.v. Sustainability of techno-economic system.vi. Stability of load.vii. Reduction in line losses.
Date
1
3
5
7
9
11
13
15
17
2
4
6
8
10
12
14
16
18
01.05.06
02.05.06
03.05.06
04.05.06
05.05.06
06.05.06
07.05.06
08.05.06
09.05.06
01.05.07
02.05.07
03.05.07
04.05.07
05.05.07
06.05.07
07.05.07
08.05.07
09.05.07
19.00. Hrs.
100
160
100
110
120
120
135
150
145
70
70
85
50
70
40
100
70
50
20.00 Hrs
110
160
120
110
120
120
100
130
125
60
90
80
100
60
80
80
60
80
21.00 Hrs.
100
160
120
110
120
120
100
130
125
60
60
60
70
60
60
90
60
70
Load in Amps
REDUCTION IN LOAD PATTERN COMPARED TO 2006


BEE Refrigerator Label
The Stars highlighted in color indicate therelative efficiency of the Refrigerator.More the savings in Energy and Money
This is the average amount of electricityused by the refrigerator in a year.
This is under standard testconditions, your energy use may varydepending on actual usage.
Addit ional information about therefrigerator:The Brand, Type, Model number, Year ofManufacture and the Volume.
is the total spaceenclosed within the refrigerator.
is the actual spaceavailable
(in kWhper year)
(See Energy Saving Tips on the backpage)
Gross volume
Storage volume

BEE E L RNERGY ABEL FOR EFRIGERATORS
• Refrigerator is likely to be one of the largest single power consumer in your home.Refrigerator efficiency has made enormous strides in the past few years. The most efficientmodels available today are significantly more energy efficient, and still improving. Thetypical refrigerator has a life span of 15 to 20 years. The cost of running over that timeperiod will easily be several times the initial purchase price, so paying somewhat moreinitially for higher efficiency offers a solid payback.
•
•
•
•
•
•
When you buy a new refrigerator, buy the most efficient model available. A listing ofenergy efficient appliances can be found at the Bureau of Energy Efficiency's website -
&
Smaller models will obviously use less energy than larger models. Generally, the largerthe refrigerator, the greater the energy consumption. Don't buy a refrigerator that's larger than you need. But onelarge refrigerator will use less energy than two smaller ones with the same total volume.
Models with top- or bottom-mounted freezers average 12% less energy use than side-by-side designs.
Features like through-the-door ice, chilled water, or automatic ice-makers increase the energy consumption,purchase price and also greatly increase energy use and are far more likely to need service and repair.Avoid thesecostly, troublesome options.
Be willing to pay a bit more initially for lower operating costs. A five-star refrigerator that costs more initially, but costs less per year tooperate due to better construction and insulation, will pay for itself in less than four years compared to a two-star refrigerator.
Recycle older or second refrigerators. Don't keep the old, inefficient refrigerator running in the occasional refreshments. It could costyou significantly more per year in electricity.
www.bee-nic.in www.energymanagertraning.com
BEE Refrigerator Label
The Stars highlighted in color indicate the relative efficiency of theRefrigerator. More the savings in Energy and Money
This is the average amount of electricity used by the refrigerator in a year.This is under standard test conditions, your energy use
may vary depending on actual usage.
Additional information about the refrigerator:
The Brand, Type, Model number, Year of Manufacture and the Volume.
is the total space enclosed within the refrigerator.
is the actual space available to you for use.
(in kWh per year)
(See Energy Saving Tips on the back page)
Gross volume
Storage volume
R E S TEFRIGERATOR NERGY AVING IPS
Setup
Operation
Maintenance
• Position your refrigerator away from a heat source such as an oven, a dishwasher, or direct sunlight from a window.• Leave at least 30 centimeters all around the refrigerator (or as recommended by the manufacturer) to allow air to circulate around the
refrigerator (condenser coils), and heat to escape from the compressor and condensing coil. If the heat can't escape, the refrigerator'scooling system will work harder and use more energy.
• Make sure the door seals are airtight. Check your refrigerator's door seal by closing the door on a clean piece of paper. If it's held tightlyin place, the seal's OK; if not, the door should be adjusted or the seal replaced. On fridges with magnetic seals, put a flashlight inside thefridge some evening, turn off the room lights, and check for light leaking through the seal. Replace the gasket if damaged.
• Allow hot foods to cool before putting them in the refrigerator.• Cover liquids and wrap foods stored in the fridge. Uncovered foods release moisture (and get dried out), which makes the compressor
work harder.• Don't set your refrigerator's temperature too low. The colder it gets the more it costs to run. Set the temperature for only as cold as you
need; check manufacturer's recommendations.• Don't overfill the refrigerator, as this blocks air circulation. Conversely, a full freezer will perform better than an empty one.• Minimize the amount of time the refrigerator door is open.• Open the fridge door as infrequently and briefly as possible to keep the cold air in. The more the door is opened, the more energy your
refrigerator will use.• Know what you're looking for when you open the refrigerator door. Open your fridge with a purpose. Do not spend time and waste
electricity by opening the refrigerator to browse through its contents.• Turn off the automatic ice maker. It's more efficient to make ice in ice trays.
• Clean your refrigerator's coils (back) and air intake grill (below the doors) every 3 months. When dust builds up on refrigerator'scondenser coils, the motor works harder and uses more electricity. With clean coils the waste heat is carried off faster, and the fridgeruns shorter cycles
• Don't let freezers build up more than 6 mm of frost. Defrost regularly to keep freezers working their best. (For Direct Cool Refrigerators)• Clean the door gasket and sealing surface on the fridge.• Check to see if you have a power-saving switch or a summer-winter switch. Many refrigerators have a small heater (yes, a heater!)
inside the walls to prevent condensation build-up on the fridge walls. If yours does, switch it to the power-saving (winter) mode.