Harvest Power Canada Ltd. Air Quality Assessment for ...
47
Submitted by: Levelton Consultants Ltd. 150 – 12791 Clarke Place Richmond, BC V6V 2H9 T: 604.278.1411 F: 604.278.1042 [email protected] Date: October 15 th , 2013 Levelton File #: EE12-1250-00 Report By: Kyle Howe, M.Sc. Reviewed by: Chris Koscher, B.Sc.(Hons.), EP Harvest Power Canada Ltd. Air Quality Assessment for Harvest Power (Richmond, BC): Cogeneration and Flare
Transcript of Harvest Power Canada Ltd. Air Quality Assessment for ...
Submitted by:
Levelton Consultants Ltd.
150 – 12791 Clarke Place
Richmond, BC V6V 2H9
T: 604.278.1411
F: 604.278.1042
Date: October 15th, 2013
Levelton File #: EE12-1250-00
Report By: Kyle Howe, M.Sc. Reviewed by: Chris Koscher, B.Sc.(Hons.), EP
Harvest Power Canada Ltd.
Air Quality Assessment for Harvest Power (Richmond, BC): Cogeneration and Flare

October 15th, 2013
Johanna van den Broeke Officer, Air Quality Permitting Specialist Metro Vancouver
Environmental Regulation & Enforcement Division
4330 Kingsway
Burnaby, BC V5H 4G8
Dear Johanna:
Regarding: Air Quality Assessment for Harvest Power (Richmond, BC): Cogeneration and
Flare
Levelton Consultants Ltd. (Levelton) is pleased to submit the attached revised air quality
assessment report for Harvest Power Canada Ltd.’s facility in Richmond, BC which evaluates
potential ambient air quality impacts from cogeneration and flaring emissions.
Sincerely, Levelton Consultants Ltd.
Per: Chris Koscher, B.Sc.(Hons.), EP Senior Air Quality Specialist 604.207.5133 [email protected]
Attachment: Air Quality Assessment Report

P a g e | i
Harvest Power Canada Ltd.
Air Quality Assessment for Harvest Power (Richmond, BC): Cogeneration and Flare EE12-1250-00
Table of Contents
page
1. INTRODUCTION ............................................................................................... 1
2. AMBIENT AIR QUALITY OBJECTIVES ..................................................................... 1
3. BACKGROUND AMBIENT AIR QUALITY ................................................................... 2
4. SOURCE PARAMETERS ...................................................................................... 5
4.1 Cogeneration ............................................................................................... 5
4.2 Flare ......................................................................................................... 5
5. CALMET AND CALPUFF MODELLING METHODOLOGY ................................................ 7
5.1 Modelling Domain ......................................................................................... 7
5.2 Building Downwash ........................................................................................ 8
5.3 Conversion from NOx to NO2 ............................................................................ 10
6. DISPERSION MODELLING RESULTS ..................................................................... 11
6.1 Cogeneration .............................................................................................. 11
6.2 Flare ........................................................................................................ 14
7. CONCLUSION ................................................................................................ 16
8. REFERENCES ................................................................................................ 16
APPENDIX A: MODELLING METHODOLOGY ................................................................... 17
A-1. LOCAL CLIMATE AND METEOROLOGY ................................................................. 18
A-1.1 Temperature .............................................................................................. 18
A-1.2 Wind ........................................................................................................ 21
A-1.3 Conclusion from Comparison of Meteorological Data to Climate Normals ..................... 24
A-2. MODELLING METHODOLOGY ............................................................................ 24
A-2.1 Model Selection ........................................................................................... 24
A-2.2 CALMET ..................................................................................................... 25
A-2.2.1 CALMET Modelling Domain ........................................................................ 25
A-2.2.2 Terrain Elevation and Land Use Data ........................................................... 27
A-2.2.3 Meteorological Data ................................................................................ 27
A-2.2.4 CALMET Model Options ............................................................................. 28
P a g e | ii
Harvest Power Canada Ltd.
Air Quality Assessment for Harvest Power (Richmond, BC): Cogeneration and Flare EE12-1250-00
A-2.2.5 CALMET Quality Assurance and Control ......................................................... 29
A-2.3 CALPUFF ................................................................................................... 38
A-2.3.1 CALPUFF Model Options ........................................................................... 38
A-2.3.2 Model Domain and Receptors ..................................................................... 38
A-2.3.3 Building Downwash ................................................................................. 41
A-3. REFERENCES ................................................................................................ 41
List of Figures
Figure 3-1 Lower Fraser Valley Air Quality Monitoring Network (2011) and Harvest Power
(shown as a white star) .......................................................................... 3
Figure 5-1 CALMET and CALPUFF Modelling Domains .................................................... 8
Figure 5-2 Facility Buildings and Point Sources........................................................... 9
Figure 5-3 NO2/NOx Ratio versus 1-hour Average NOx Observations from Metro Vancouver
Station T18 (Burnaby South) ................................................................... 10
Figure 6-1 Predicted Maximum 1-hour NO2 (100% conversion) for the CHP ........................ 13
Figure 6-2 Predicted Maximum 1-hour SO2 from the Normal Operations Scenario for the
Flare ............................................................................................... 15
Figure A-1 Temperature Normals for MSC Vancouver International Airport (1971-2000) ........ 19
Figure A-2 2000-2001 Temperature Observations for MSC Vancouver International Airport .... 20
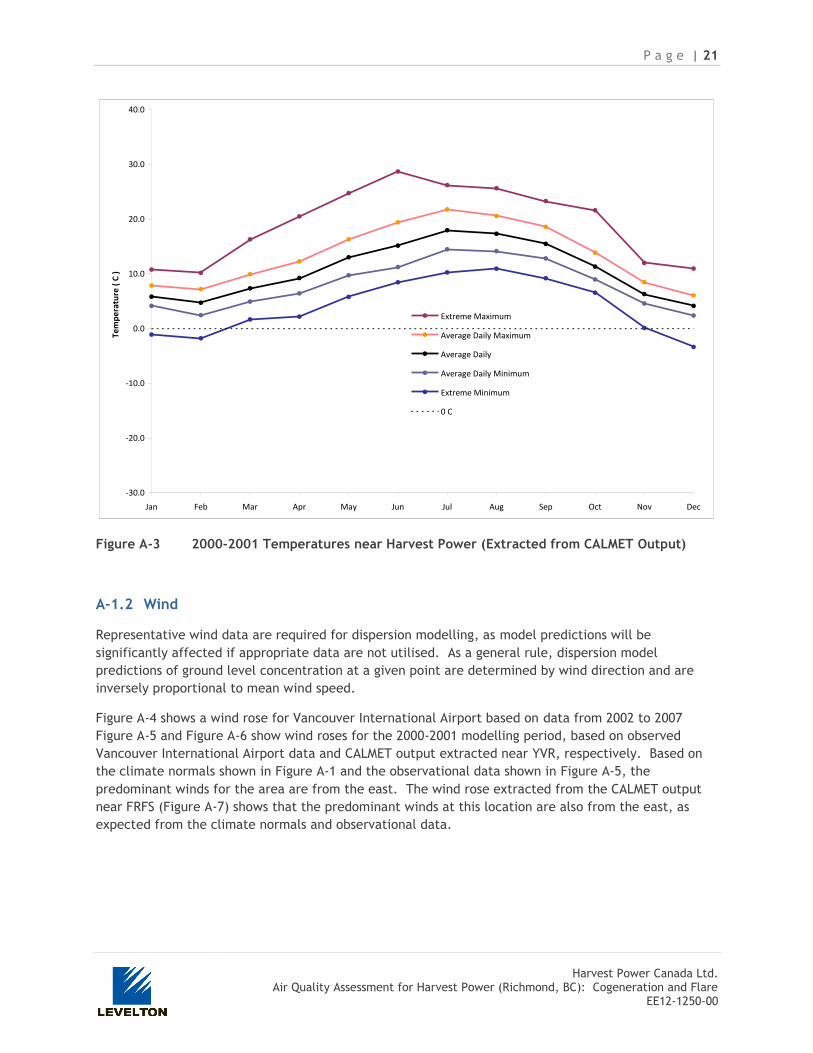
Figure A-3 2000-2001 Temperatures near Harvest Power (Extracted from CALMET
Output) ............................................................................................ 21
Figure A-4 2002-2007 Windrose for MSC Vancouver International Airport .......................... 22
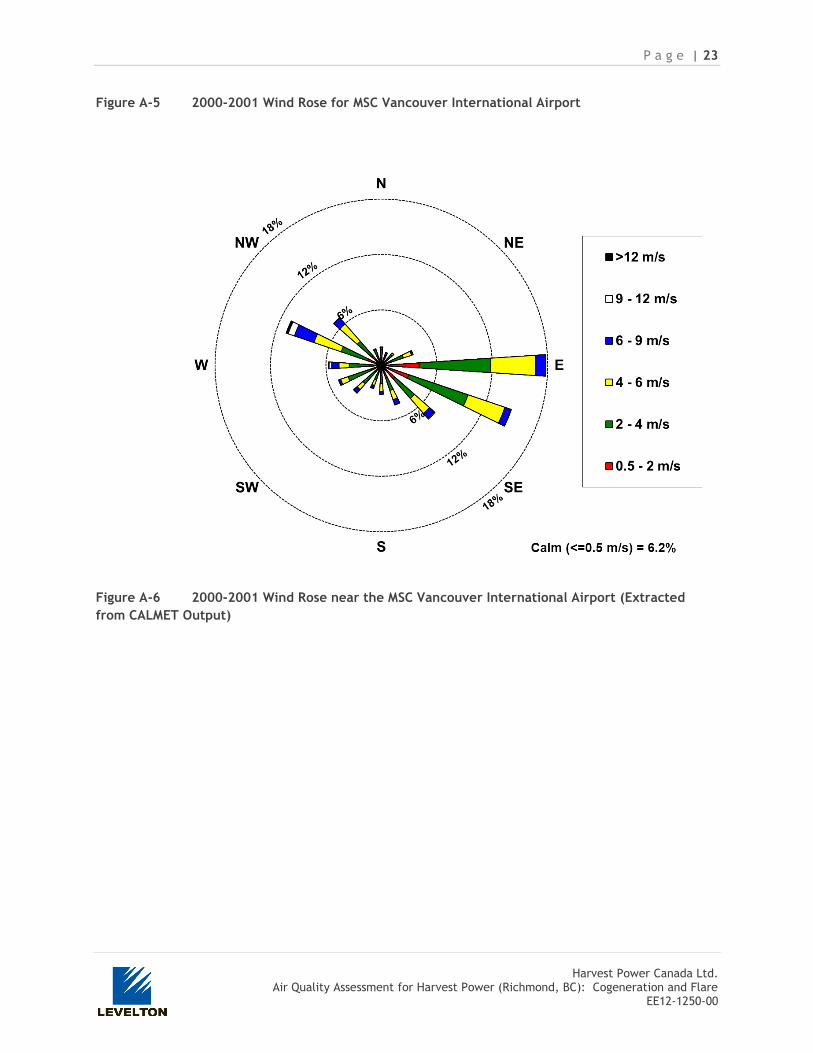
Figure A-5 2000-2001 Wind Rose for MSC Vancouver International Airport ......................... 23
Figure A-6 2000-2001 Wind Rose near the MSC Vancouver International Airport
(Extracted from CALMET Output) ............................................................. 23
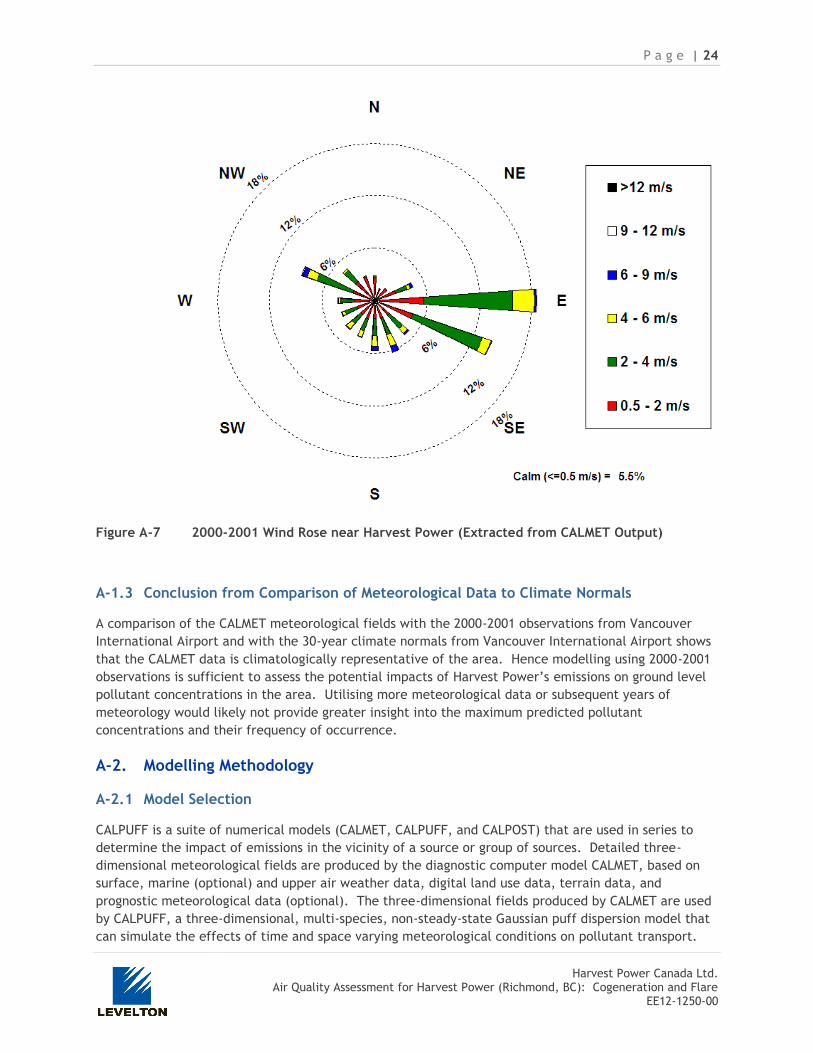
Figure A-7 2000-2001 Wind Rose near Harvest Power (Extracted from CALMET Output) ........ 24
Figure A-8 Map Displaying the CALMET and CALPUFF Modelling Domain ............................ 26
Figure A-9 Example Wind Field Generated by CALMET for the 10 m Level for the Hour
Ending at 11:00 on November 10, 2000 ..................................................... 30
Figure A-10 Frequency Distribution of Surface (10 m level) Winds for Surface Stations and
near Harvest Power (CALMET) ................................................................ 31
Figure A-11 Average Monthly Wind Speeds at Surface (10 m level) for Surface Stations and
Harvest Power (CALMET) ....................................................................... 32
P a g e | iii
Harvest Power Canada Ltd.
Air Quality Assessment for Harvest Power (Richmond, BC): Cogeneration and Flare EE12-1250-00
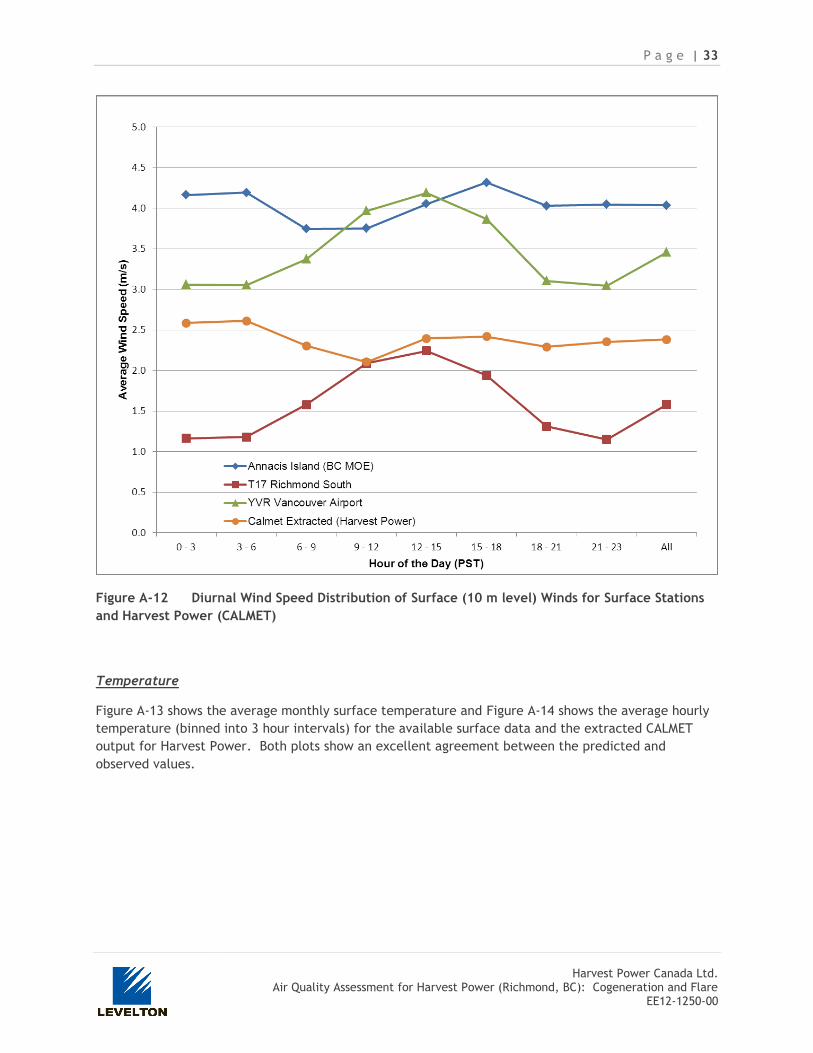
Figure A-12 Diurnal Wind Speed Distribution of Surface (10 m level) Winds for Surface
Stations and Harvest Power (CALMET) ....................................................... 33
Figure A-13 Monthly Temperatures at Surface Stations and Harvest Power (CALMET) ............ 34
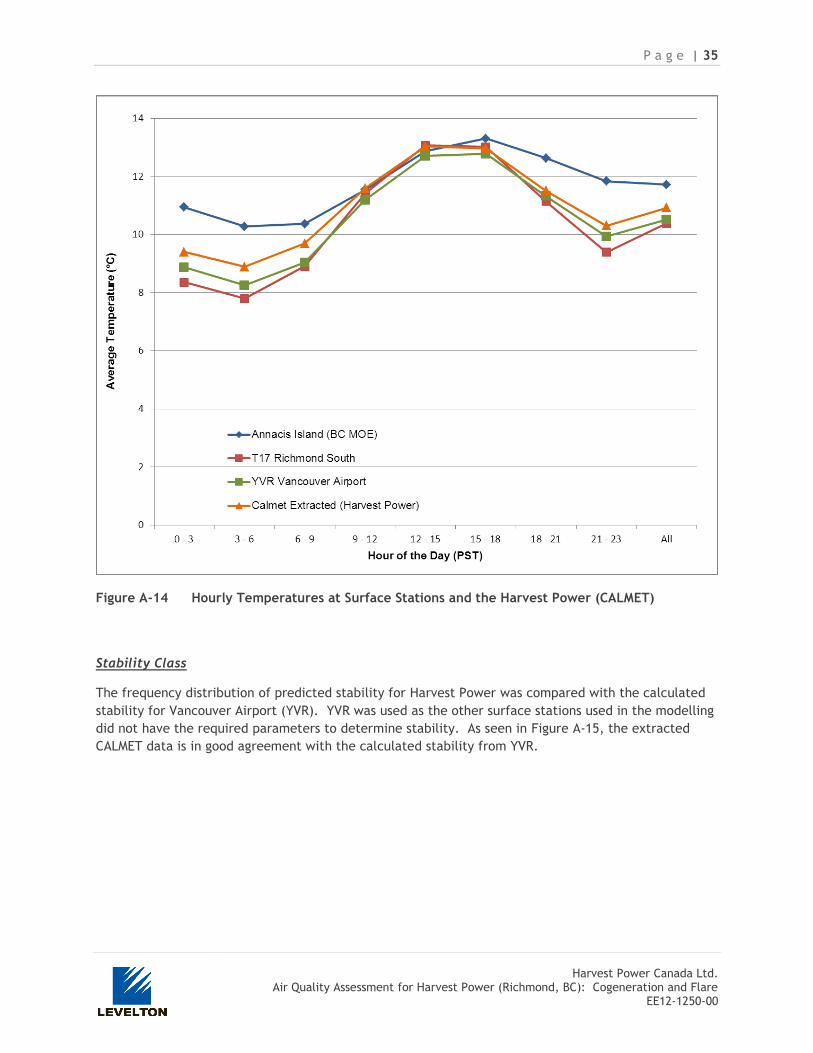
Figure A-14 Hourly Temperatures at Surface Stations and the Harvest Power (CALMET) ......... 35
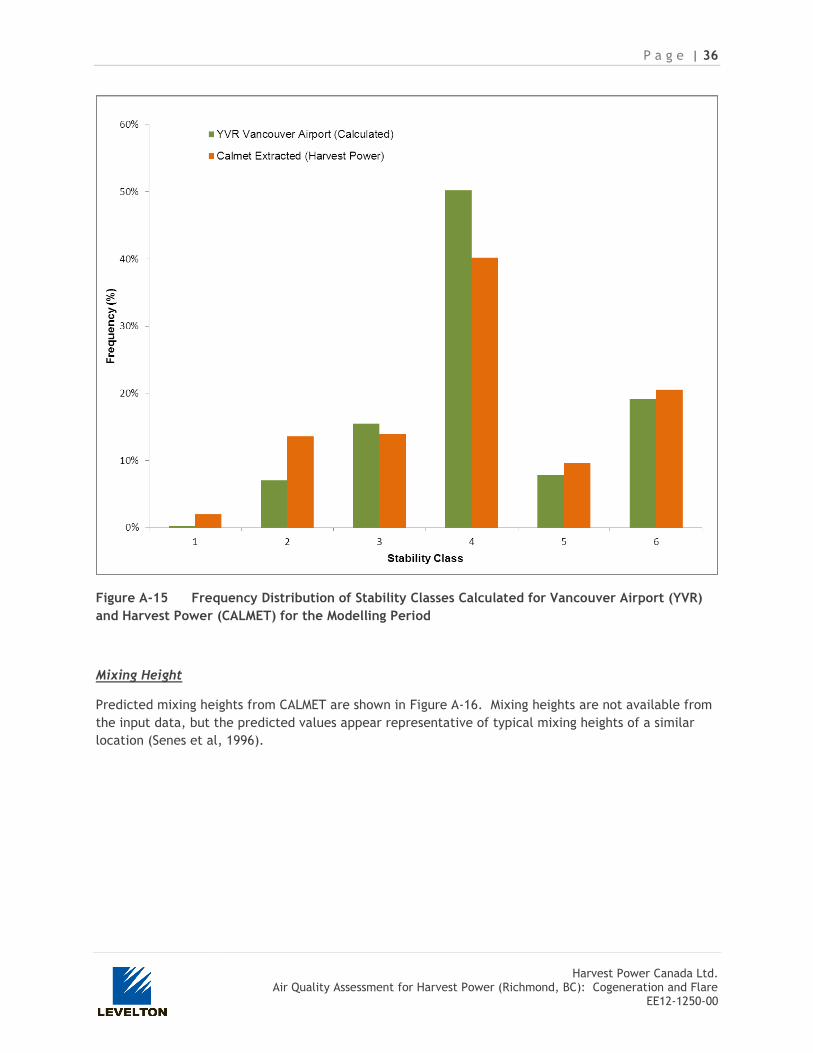
Figure A-15 Frequency Distribution of Stability Classes Calculated for Vancouver Airport
(YVR) and Harvest Power (CALMET) for the Modelling Period ........................... 36
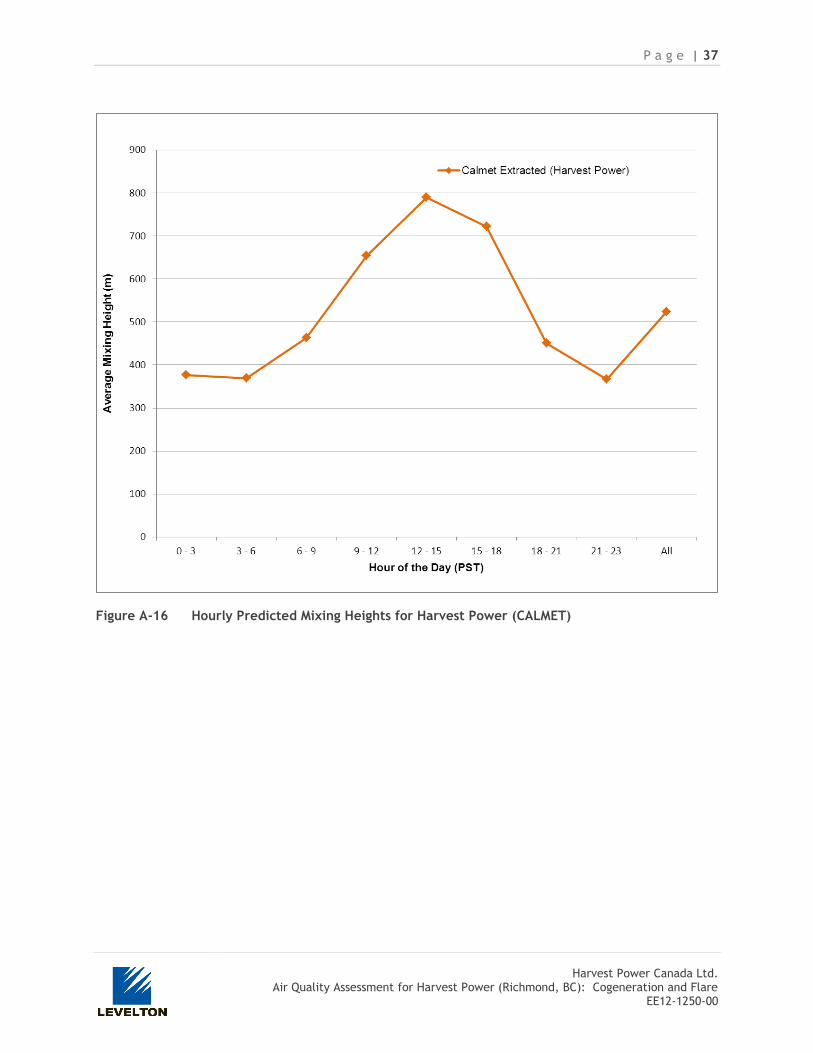
Figure A-16 Hourly Predicted Mixing Heights for Harvest Power (CALMET) .......................... 37
Figure A-17 Receptor Grid for Harvest Power Modelling ................................................ 39
Figure A-18 Layout of Harvest Power with Buildings Used in BPIP Denoted in Blue ................ 40
List of Tables
Table 2-1 Summary of Ambient Air Quality Objectives ................................................ 2
Table 3-1 Maximum 1-hour concentration from ambient monitoring stations (T13, T17,
T18) from 2008 - 2012 ........................................................................... 3
Table 3-2 Maximum 8-hour concentration from ambient monitoring stations (T13, T18)
from 2008 - 2012 ................................................................................. 3
Table 3-3 Maximum 24-hour concentration from ambient monitoring stations (T13, T17,
T18) from 2008 - 2012 ........................................................................... 4
Table 3-4 98th percentile 24-hour concentration from ambient monitoring stations (T13,
T17, T18) from 2008 - 2012 ..................................................................... 4
Table 3-5 Maximum annual average concentration from ambient monitoring stations
(T13, T17, T18) from 2008 - 2012 ............................................................. 4
Table 3-6 Summary of Background Ambient Air Quality Concentrations for Air Quality
Assessment ........................................................................................ 5
Table 4-1 Stack Parameters and Emissions from Cogeneration (CHP) ............................... 5
Table 4-2 Physical Stack Parameters of the Flare ...................................................... 6
Table 4-3 Gas Composition, Effective Stack Parameters and SO2 Emission Rate for Flare ...... 6
Table 5-1 Building dimensions used in BPIP .............................................................. 9
Table 6-1 Predicted Concentrations from the CHP .................................................... 12
Table 6-2 Predicted SO2 Concentrations from the Flare .............................................. 14
Table A-0-1 Heights of CALMET Model Layers ............................................................. 27
Table A-0-2 Surface Meteorological Stations Used for CALMET Input ................................. 28
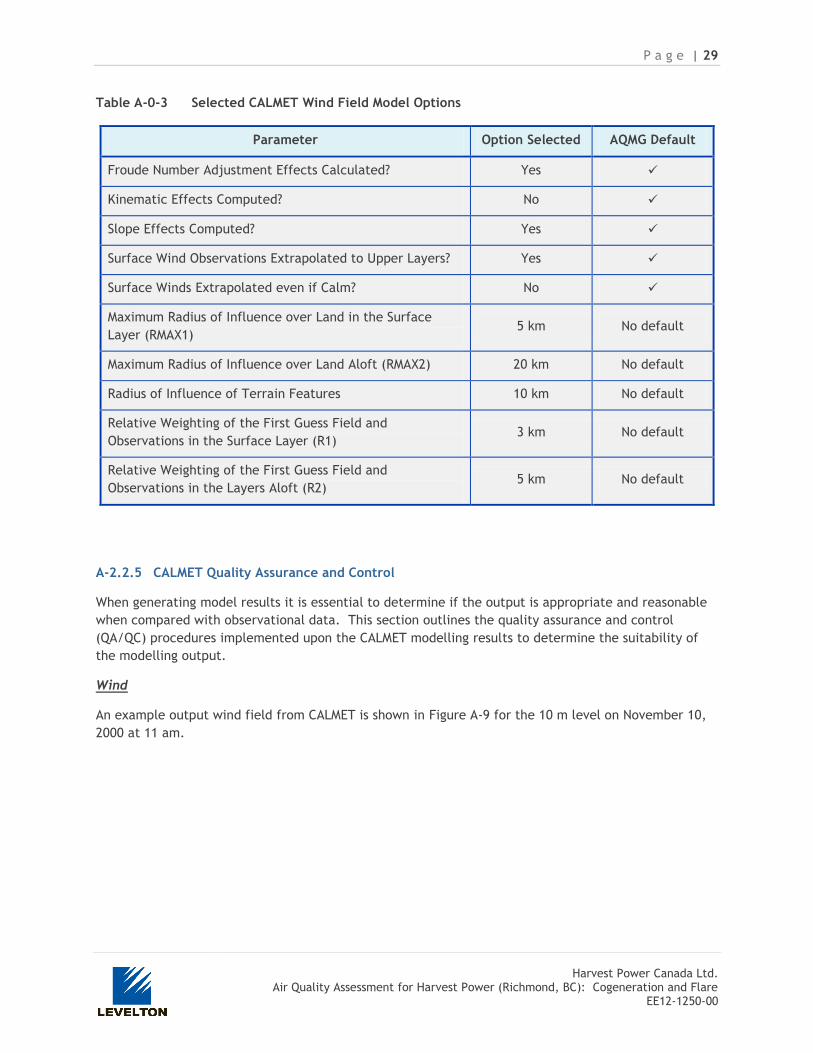
Table A-0-3 Selected CALMET Wind Field Model Options ................................................ 29
Table A-0-4 Selected Dispersion Options Used in CALPUFF Modelling................................. 38
P a g e | iv
Harvest Power Canada Ltd.
Air Quality Assessment for Harvest Power (Richmond, BC): Cogeneration and Flare EE12-1250-00
© 2013 ALL RIGHTS RESERVED
THIS DOCUMENT IS PROTECTED BY COPYRIGHT LAW AND MAY NOT BE REPRODUCED IN ANY
MANNER, OR FOR ANY PURPOSE, EXCEPT BY WRITTEN PERMISSION OF LEVELTON
CONSULTANTS LTD.

P a g e | 1
Harvest Power Canada Ltd.
Air Quality Assessment for Harvest Power (Richmond, BC): Cogeneration and Flare EE12-1250-00
1. Introduction
Harvest Power Canada Ltd. (Harvest Power) owns and operates a food scrap and yard debris
composting, and cogeneration facility in Richmond, BC (the facility was previously known as Fraser
Richmond Soil and Fibre (FRSF)). The facility is located at 7028 York Road (latitude 49º 9’ 38.20” N,
123 º 2’ 14.36” W; or 497279 m E, 5445311 m N in Universal Transverse Mercator (UTM), grid zone 10
coordinates, NAD83 reference).
Harvest Power holds contracts with a number of municipalities around the Lower Mainland to collect
food scraps and other compostable materials such as yard trimmings. The Harvest Power site consists
of multiple piles of compost at various stages of aging. As the piles reach maturity, they are then
moved to a screening area where they are separated by size and either sold as soil or re-introduced
into the aging piles. In addition to the composting operations, there is a cogeneration power plant
which converts biogas produced by the decay of food waste into electricity.
Harvest Power engaged Levelton Consultants Ltd. (Levelton) to conduct air dispersion modelling to
predict potential air quality impacts from their Harvest’s operations as a requirement of Approval
A1054-2012-01 with Metro Vancouver. This assessment focuses on the air quality impacts from the
cogeneration unit (Combined Heat and Power (CHP)) and the flare. Further air dispersion modelling
and assessment work will be completed in the near term to assess the air quality impacts from the
composting operations on the site.
2. Ambient Air Quality Objectives
The federal and provincial governments, as well as Metro Vancouver, have developed ambient air
quality objectives to promote long-term protection of public health and the environment. Federally,
two objective values have been recommended using the categories "maximum desirable" and "maximum
acceptable". The "maximum desirable” objective is the most stringent federal standard. British
Columbia has established similar sets of objective values, designated as levels A, B and C, with level A
being the most stringent. Level A is typically applied to new and proposed discharges to the
environment, and is usually the same as the federal "maximum desirable" objective. Metro
Vancouver’s ambient air quality objectives are based on current knowledge regarding air quality and
health, and take into consideration relevant objectives from around the world and the ability to
achieve those objectives within the Metro Vancouver region.
Table 2-1 summarizes the ambient air quality objectives for the species modelled in this study.

P a g e | 2
Harvest Power Canada Ltd.
Air Quality Assessment for Harvest Power (Richmond, BC): Cogeneration and Flare EE12-1250-00
Table 2-1 Summary of Ambient Air Quality Objectives
Averaging
Period
British Columbia Objective * Federal Objective ** Metro
Vancouver
Objective
(µg/m3)
Most
Stringent
Objective
(µg/m3)
Level A
(µg/m3)
Level B
(µg/m3)
Level C
(µg/m3)
Maximum
Desirable
(µg/m3)
Maximum
Acceptable
(µg/m3)
Sulphur Dioxide (SO2)
1-hour 450 900 900-1300 450 900 450 450
3-hour 375 665 - - - - 375
24-hour 160 260 360 150 300 125 125
Annual 25 50 80 30 60 30 25
Nitrogen Dioxide (NO2)
1-hour - - - - 400 200 200
Annual - - - 60 100 40 40
Carbon Dioxide (CO)
1-hour 14300 28000 35000 15000 35000 30000 14300
8-hour 5500 11000 14300 6000 15000 10000 5500
Particulate Matter (PM2.5)
24-hour 25 28*** 25**** 25****
Annual 8 10*** 8 8
Particulate Matter (PM10)
24-hour - 50 - - - 50 50
Annual - - - - - 20 20
*Concentrations given at 20ºC, 101.3 kPa, dry basis
**Concentrations given at 25ºC, 101.3 kPa, dry basis
***Canadian Ambient Air Quality Standards
****Based on rolling average
Source: British Columbia Ministry of Environment (http://www.bcairquality.ca/reports/pdfs/aqotable.pdf)
Environment Canada (http://www.ec.gc.ca/rnspa-naps/default.asp?lang=En&n=24441DC4-1)
Metro Vancouver (http://www.metrovancouver.org/about/publications/Publications/AQMPSeptember2005.pdf)
Canadian Ambient Air Quality Standards (http://ec.gc.ca/default.asp?lang=En&n=56D4043B-1&news=A4B2C28A-2DFB-
4BF4-8777-ADF29B4360BD)
3. Background Ambient Air Quality
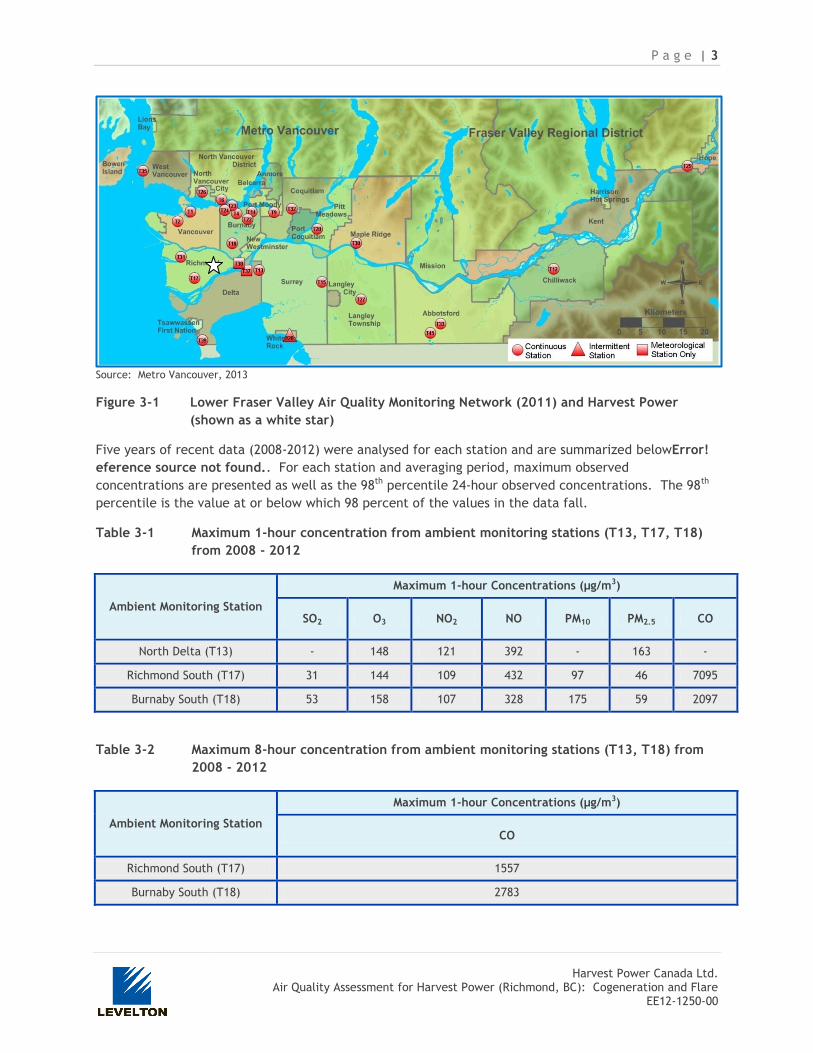
Metro Vancouver operates an extensive network of ambient air quality and meteorological monitoring
stations (Figure 3-1). Data from three monitoring stations (T13 North Delta, T17 Richmond South and
T18 Burnaby South) were used for characterizing the background air quality in the area surrounding
Harvest Power. The red circles, triangle and squares identify the stations and the white star identifies
the approximate location of Harvest Power’s facility. The monitoring stations were chosen based on
their proximity to Harvest Power and the air quality parameters monitored.
P a g e | 3
Harvest Power Canada Ltd.
Air Quality Assessment for Harvest Power (Richmond, BC): Cogeneration and Flare EE12-1250-00
Source: Metro Vancouver, 2013
Figure 3-1 Lower Fraser Valley Air Quality Monitoring Network (2011) and Harvest Power
(shown as a white star)
Five years of recent data (2008-2012) were analysed for each station and are summarized belowError!
eference source not found.. For each station and averaging period, maximum observed
concentrations are presented as well as the 98th percentile 24-hour observed concentrations. The 98th
percentile is the value at or below which 98 percent of the values in the data fall.
Table 3-1 Maximum 1-hour concentration from ambient monitoring stations (T13, T17, T18)
from 2008 - 2012
Ambient Monitoring Station
Maximum 1-hour Concentrations (µg/m3)
SO2 O3 NO2 NO PM10 PM2.5 CO
North Delta (T13) - 148 121 392 - 163 -
Richmond South (T17) 31 144 109 432 97 46 7095
Burnaby South (T18) 53 158 107 328 175 59 2097
Table 3-2 Maximum 8-hour concentration from ambient monitoring stations (T13, T18) from
2008 - 2012
Ambient Monitoring Station
Maximum 1-hour Concentrations (µg/m3)
CO
Richmond South (T17) 1557
Burnaby South (T18) 2783
P a g e | 4
Harvest Power Canada Ltd.
Air Quality Assessment for Harvest Power (Richmond, BC): Cogeneration and Flare EE12-1250-00
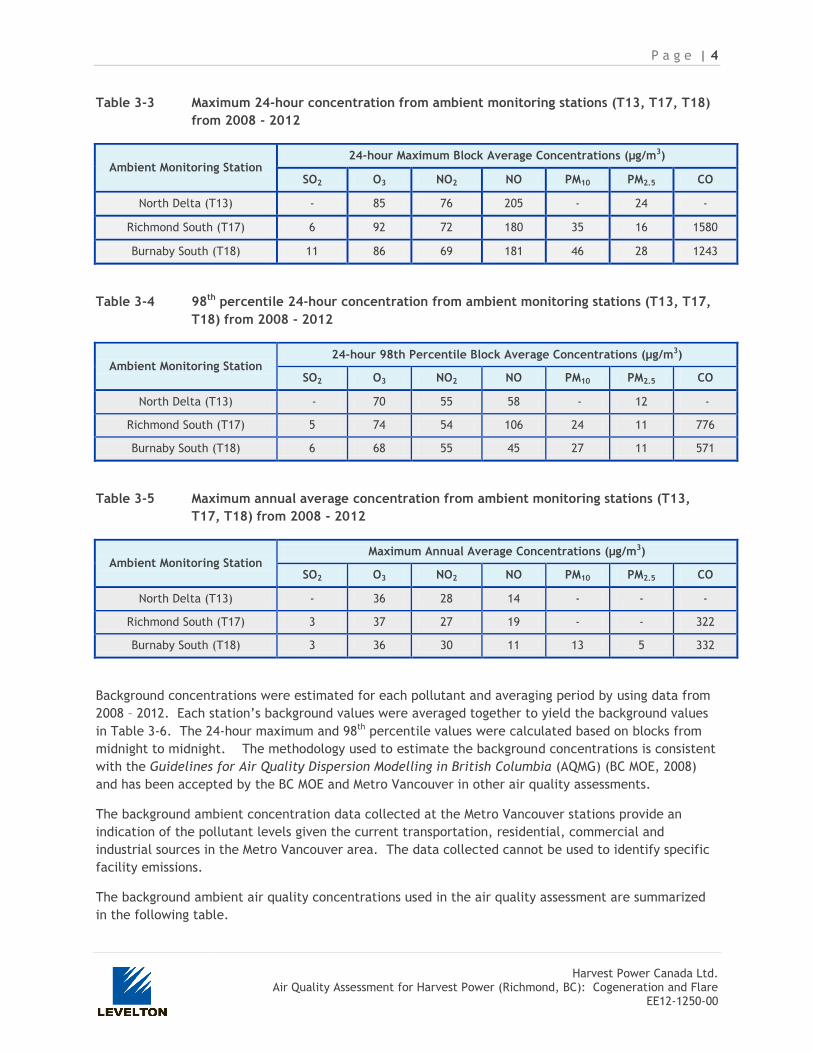
Table 3-3 Maximum 24-hour concentration from ambient monitoring stations (T13, T17, T18)
from 2008 - 2012
Ambient Monitoring Station 24-hour Maximum Block Average Concentrations (µg/m3)
SO2 O3 NO2 NO PM10 PM2.5 CO
North Delta (T13) - 85 76 205 - 24 -
Richmond South (T17) 6 92 72 180 35 16 1580
Burnaby South (T18) 11 86 69 181 46 28 1243
Table 3-4 98th percentile 24-hour concentration from ambient monitoring stations (T13, T17,
T18) from 2008 - 2012
Ambient Monitoring Station 24-hour 98th Percentile Block Average Concentrations (µg/m3)
SO2 O3 NO2 NO PM10 PM2.5 CO
North Delta (T13) - 70 55 58 - 12 -
Richmond South (T17) 5 74 54 106 24 11 776
Burnaby South (T18) 6 68 55 45 27 11 571
Table 3-5 Maximum annual average concentration from ambient monitoring stations (T13,
T17, T18) from 2008 - 2012
Ambient Monitoring Station Maximum Annual Average Concentrations (µg/m3)
SO2 O3 NO2 NO PM10 PM2.5 CO
North Delta (T13) - 36 28 14 - - -
Richmond South (T17) 3 37 27 19 - - 322
Burnaby South (T18) 3 36 30 11 13 5 332
Background concentrations were estimated for each pollutant and averaging period by using data from
2008 – 2012. Each station’s background values were averaged together to yield the background values
in Table 3-6. The 24-hour maximum and 98th percentile values were calculated based on blocks from
midnight to midnight. The methodology used to estimate the background concentrations is consistent
with the Guidelines for Air Quality Dispersion Modelling in British Columbia (AQMG) (BC MOE, 2008)
and has been accepted by the BC MOE and Metro Vancouver in other air quality assessments.
The background ambient concentration data collected at the Metro Vancouver stations provide an
indication of the pollutant levels given the current transportation, residential, commercial and
industrial sources in the Metro Vancouver area. The data collected cannot be used to identify specific
facility emissions.
The background ambient air quality concentrations used in the air quality assessment are summarized
in the following table.
P a g e | 5
Harvest Power Canada Ltd.
Air Quality Assessment for Harvest Power (Richmond, BC): Cogeneration and Flare EE12-1250-00
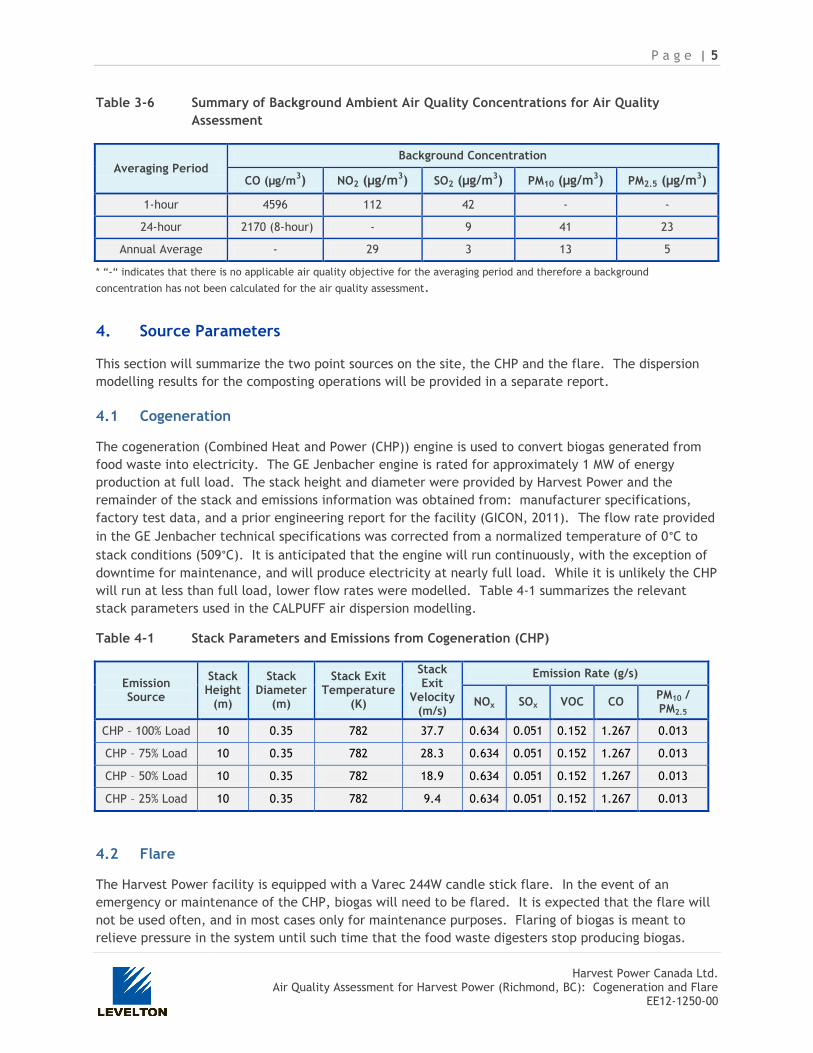
Table 3-6 Summary of Background Ambient Air Quality Concentrations for Air Quality
Assessment
Averaging Period Background Concentration
CO (µg/m3) NO2 (µg/m3) SO2 (µg/m3) PM10 (µg/m3) PM2.5 (µg/m3)
1-hour 4596 112 42 - -
24-hour 2170 (8-hour) - 9 41 23
Annual Average - 29 3 13 5
* “-“ indicates that there is no applicable air quality objective for the averaging period and therefore a background
concentration has not been calculated for the air quality assessment.
4. Source Parameters
This section will summarize the two point sources on the site, the CHP and the flare. The dispersion
modelling results for the composting operations will be provided in a separate report.
4.1 Cogeneration
The cogeneration (Combined Heat and Power (CHP)) engine is used to convert biogas generated from
food waste into electricity. The GE Jenbacher engine is rated for approximately 1 MW of energy
production at full load. The stack height and diameter were provided by Harvest Power and the
remainder of the stack and emissions information was obtained from: manufacturer specifications,
factory test data, and a prior engineering report for the facility (GICON, 2011). The flow rate provided
in the GE Jenbacher technical specifications was corrected from a normalized temperature of 0°C to
stack conditions (509°C). It is anticipated that the engine will run continuously, with the exception of
downtime for maintenance, and will produce electricity at nearly full load. While it is unlikely the CHP
will run at less than full load, lower flow rates were modelled. Table 4-1 summarizes the relevant
stack parameters used in the CALPUFF air dispersion modelling.
Table 4-1 Stack Parameters and Emissions from Cogeneration (CHP)
Emission Source
Stack Height
(m)
Stack Diameter
(m)
Stack Exit Temperature
(K)
Stack Exit
Velocity (m/s)
Emission Rate (g/s)
NOx SOx VOC CO PM10 / PM2.5
CHP – 100% Load 10 0.35 782 37.7 0.634 0.051 0.152 1.267 0.013
CHP – 75% Load 10 0.35 782 28.3 0.634 0.051 0.152 1.267 0.013
CHP – 50% Load 10 0.35 782 18.9 0.634 0.051 0.152 1.267 0.013
CHP – 25% Load 10 0.35 782 9.4 0.634 0.051 0.152 1.267 0.013
4.2 Flare
The Harvest Power facility is equipped with a Varec 244W candle stick flare. In the event of an
emergency or maintenance of the CHP, biogas will need to be flared. It is expected that the flare will
not be used often, and in most cases only for maintenance purposes. Flaring of biogas is meant to
relieve pressure in the system until such time that the food waste digesters stop producing biogas.

P a g e | 6
Harvest Power Canada Ltd.
Air Quality Assessment for Harvest Power (Richmond, BC): Cogeneration and Flare EE12-1250-00
The maximum biogas throughput was given as 265 m3/hr (GICON, 2011) and the raw biogas
concentration will consist of:
60-75% CH4
40-25% CO2
2000 – 3000 ppm (without desulphurization).
Prior to the biogas entering the CHP or flare, it will pass through a desulphurization unit which has a
manufacturer’s guaranteed output value of 100ppm H2S in the biogas. Therefore, for this assessment,
two flaring scenarios have been considered. The first is normal operations where the H2S content of
the gas is 100ppm and the second scenario is an upset condition where the biogas does not pass
through the desulphurization unit and has an H2S concentration of 3000ppm.
Both flaring scenarios presented in the report assumes approximately 75% CH4 and 25% CO2. Other
modelling scenarios were run to determine the sensitivity of the model to the change in gas
concentrations (ie. ~ 60% CH4, 40% CO2) and the results are of the same magnitude.
The physical stack height and diameter were provided by Harvest Power. Effective stack parameters
for the flare were then calculated based on the guidance provided in the AQMG. Furthermore, the
stack’s exit velocity and temperature for modelling were assumed to be 20 m/s and 1273 K respectively
based on the AQMG recommendations.
The physical stack parameters are outlined in Table 4-2 and the input parameters considered in
modelling are shown in Table 4-3.
Table 4-2 Physical Stack Parameters of the Flare
Physical Stack Parameters
Stack Height (m) 4.0
Flow Rate (m3/hr) 265
Flow Rate (MMscf/d) 0.225
Table 4-3 Gas Composition, Effective Stack Parameters and SO2 Emission Rate for Flare
Scenario Gas Composition Effective
Stack Height (m)
Effective Stack
Diameter (m)
Exit Velocity (m/s)*
Exit Temperature
(K)*
SO2 Emission Rate (g/s)
CO2 CH4 H2S
Normal Conditions
25% 74.99% 0.01% 6.29 0.44 20 1273 0.0199
Upset Conditions
25% 74.70% 0.3% 6.29 0.44 20 1273 0.5977
*AQMG recommended value for flare
P a g e | 7
Harvest Power Canada Ltd.
Air Quality Assessment for Harvest Power (Richmond, BC): Cogeneration and Flare EE12-1250-00
5. CALMET and CALPUFF Modelling Methodology
Air dispersion modelling was conducted following the methods recommended by the BC MOE in the
AQMG and with input from Metro Vancouver on the Detailed Model Plan for Harvest Power Richmond
Facility (Levelton, 2013). This section presents a brief summary of the modelling methods. A detailed
description is provided in Appendix A.
The CALPUFF model suite was used for this analysis. CALPUFF is a suite of numerical models (CALMET,
CALPUFF, and CALPOST) that are used in series to determine the impact of emissions in the vicinity of
a source or group of sources. Detailed three-dimensional meteorological fields were produced by the
diagnostic computer model CALMET (v5.8, EPA approved), based on surface and upper air weather
data, digital land use data, terrain data, and prognostic meteorological data. The three-dimensional
fields produced by CALMET were used by CALPUFF (v5.8, EPA approved), a three-dimensional, multi-
species, non-steady-state Gaussian puff dispersion model that can simulate the effects of time and
space varying meteorological conditions on pollutant transport. Finally CALPOST, a statistical
processing program, was used to summarize and tabulate the pollutant concentrations calculated by
CALPUFF.
The three-dimensional CALMET meteorological fields were generated using meteorological data from
numerous surface stations and upper air stations, prognostic meteorological data from the Mesoscale
Compressible Community (MC2) model, and digital terrain and land use data.
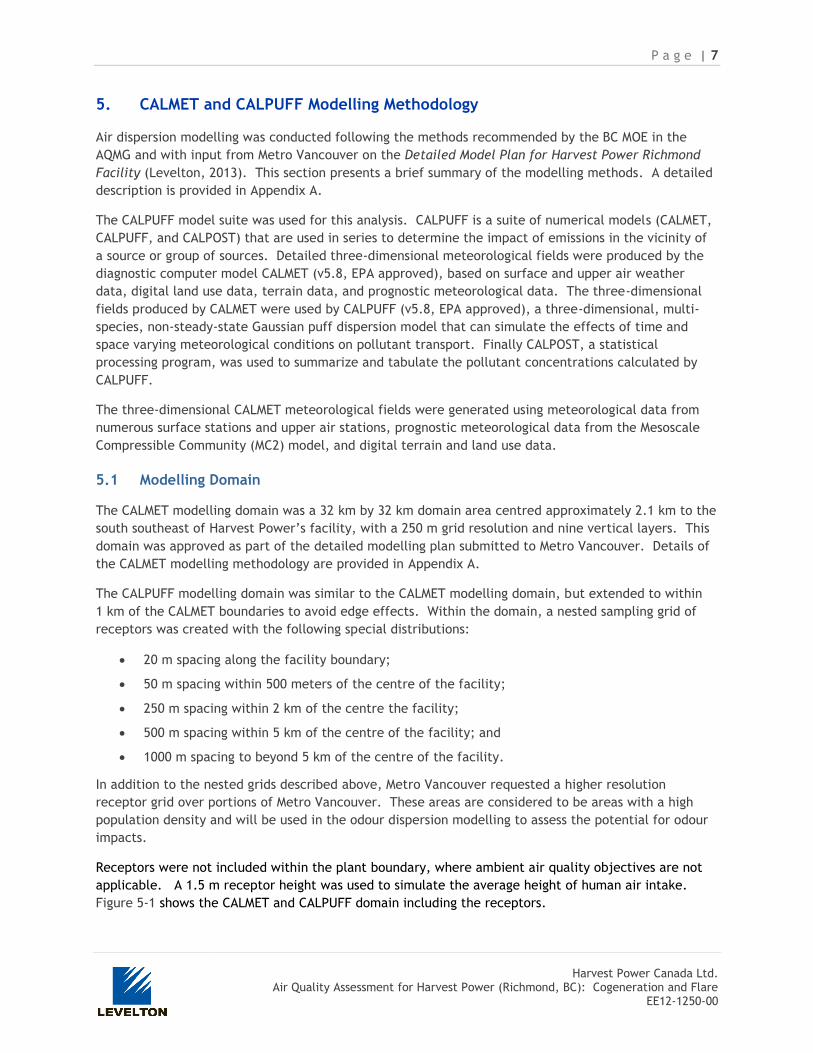
5.1 Modelling Domain
The CALMET modelling domain was a 32 km by 32 km domain area centred approximately 2.1 km to the
south southeast of Harvest Power’s facility, with a 250 m grid resolution and nine vertical layers. This
domain was approved as part of the detailed modelling plan submitted to Metro Vancouver. Details of
the CALMET modelling methodology are provided in Appendix A.
The CALPUFF modelling domain was similar to the CALMET modelling domain, but extended to within
1 km of the CALMET boundaries to avoid edge effects. Within the domain, a nested sampling grid of
receptors was created with the following special distributions:
20 m spacing along the facility boundary;
50 m spacing within 500 meters of the centre of the facility;
250 m spacing within 2 km of the centre the facility;
500 m spacing within 5 km of the centre of the facility; and
1000 m spacing to beyond 5 km of the centre of the facility.
In addition to the nested grids described above, Metro Vancouver requested a higher resolution
receptor grid over portions of Metro Vancouver. These areas are considered to be areas with a high
population density and will be used in the odour dispersion modelling to assess the potential for odour
impacts.
Receptors were not included within the plant boundary, where ambient air quality objectives are not
applicable. A 1.5 m receptor height was used to simulate the average height of human air intake.
Figure 5-1 shows the CALMET and CALPUFF domain including the receptors.
P a g e | 8
Harvest Power Canada Ltd.
Air Quality Assessment for Harvest Power (Richmond, BC): Cogeneration and Flare EE12-1250-00
Figure 5-1 CALMET and CALPUFF Modelling Domains
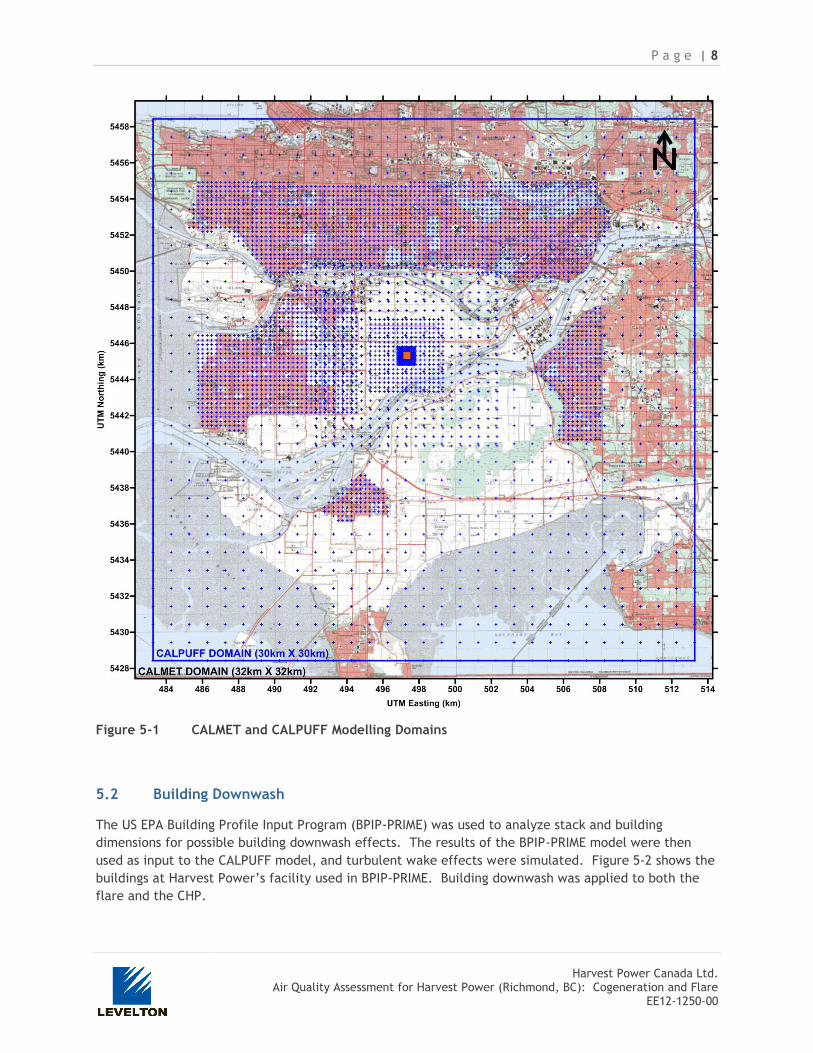
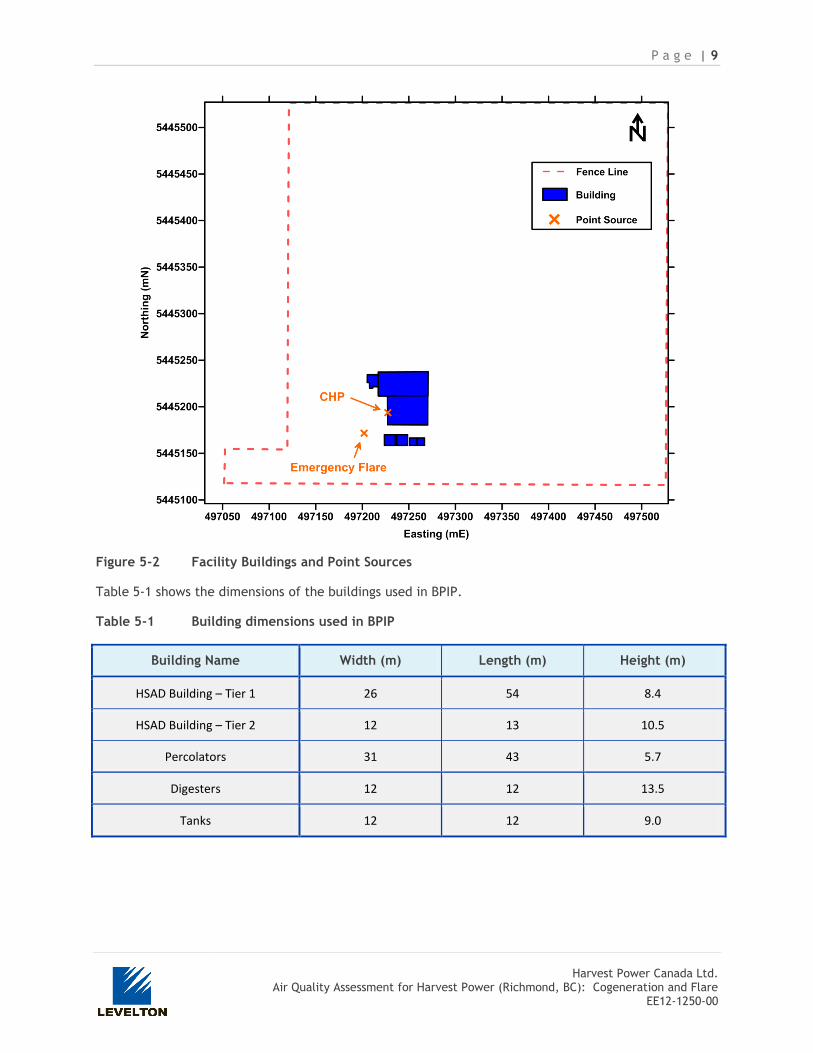
5.2 Building Downwash
The US EPA Building Profile Input Program (BPIP-PRIME) was used to analyze stack and building
dimensions for possible building downwash effects. The results of the BPIP-PRIME model were then
used as input to the CALPUFF model, and turbulent wake effects were simulated. Figure 5-2 shows the
buildings at Harvest Power’s facility used in BPIP-PRIME. Building downwash was applied to both the
flare and the CHP.
P a g e | 9
Harvest Power Canada Ltd.
Air Quality Assessment for Harvest Power (Richmond, BC): Cogeneration and Flare EE12-1250-00
Figure 5-2 Facility Buildings and Point Sources
Table 5-1 shows the dimensions of the buildings used in BPIP.
Table 5-1 Building dimensions used in BPIP
Building Name Width (m) Length (m) Height (m)
HSAD Building – Tier 1 26 54 8.4
HSAD Building – Tier 2 12 13 10.5
Percolators 31 43 5.7
Digesters 12 12 13.5
Tanks 12 12 9.0

P a g e | 10
Harvest Power Canada Ltd.
Air Quality Assessment for Harvest Power (Richmond, BC): Cogeneration and Flare EE12-1250-00
5.3 Conversion from NOx to NO2
The ambient air quality objectives refer to NO2 (not NOx), and the CALPUFF model does not account for
NOx to NO2 conversion. In accordance with the AQMG, if 100% NOx conversion leads to exceedances of
the ambient air quality objectives then the Ambient Ratio (AR) method should be implemented to
convert predicted NOx concentrations into NO2 concentrations. The AR method utilizes representative
hourly NOx and NO2 monitoring data to characterize the NO2:NOx ratio given the ambient NOx
concentration. The method then applies this ratio to the model predicted NOx emissions from the
facility.
Ambient air quality data from Metro Vancouver station T18 (Burnaby South) was used to calculate the
ratio of NO2/NOx. The resulting ratio was validated against NO2/NOx ratios and ambient air quality
from Metro Vancouver stations T13 (North Delta) and T17 (Richmond South). For the 1-hour averaging
period an exponential equation of the form y = axb was fit to the upper envelope of observed NO2/NOx
versus NOx, where a and b are empirically determined constants. The resulting equation was used to
determine the ratio of NO2/NOx subject to the constraints that the equation is only valid for NOx values
where the corresponding NO2/NOx ratio is not less than 0.1, or greater than 1. A conversion of 100% of
NOx to NO2 was applied for NO2/NOx values greater than 1. Figure 5-3 illustrates the dependence of
NO2/NOx ratio on ambient NOx air quality. For the annual averaging period 100% conversion was
considered.
Figure 5-3 NO2/NOx Ratio versus 1-hour Average NOx Observations from Metro Vancouver
Station T18 (Burnaby South)
P a g e | 11
Harvest Power Canada Ltd.
Air Quality Assessment for Harvest Power (Richmond, BC): Cogeneration and Flare EE12-1250-00
6. Dispersion Modelling Results
6.1 Cogeneration
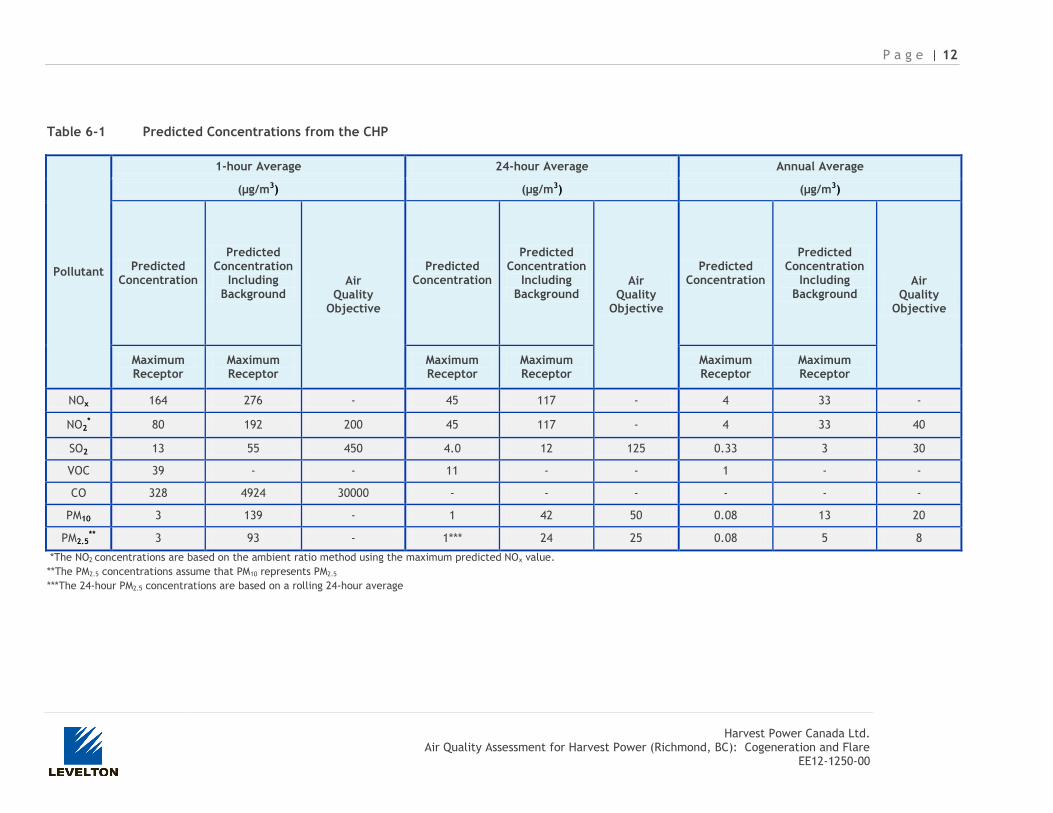
Table 6-1 shows a summary of the predicted maximum concentration from the air dispersion model and
includes the respective background values. All of the modeled species with background fall below the
applicable ambient air quality objectives, with the exception of the 1-hour NOx result assuming 100%
conversion from NOx to NO2 where eight fence line receptors were predicted to exceed the 200 µg/m3
ambient air quality objective when including the 1-hour NO2 background of 112 µg/m3. The BC
Modelling Guidelines stipulate that if under 100% NOx to NO2 conversion leads to an exceedance of an
air quality objective, that the ambient ratio method be applied, as defined in Section 5.3. Applying
the ambient ratio method to calculate the 1-hour NO2 results, all of the predicted concentrations are
below the most stringent ambient air quality objectives.
In addition, if the maximum predicted concentrations below in Table 6-1 are added to the respective
background concentrations summarized in Table 3-6, all values are below the most stringent ambient
air quality objectives.
Levelton also considered three additional scenarios with reduced flows of 25%, 50% and 75% in order to
determine the potential impacts from the CHP unit if it is not run at full load. These three scenarios
used the maximum guaranteed emissions (Section 4.1) and all three scenarios had predicted
concentrations under ambient air quality guidelines. Additionally, Harvest Power has indicated that it
is very unlikely that the CHP unit would be run at less than full load. Therefore, only the 100% load
results are presented below.
Figure 6-1 shows the predicted maximum 1-hour NO2 (100% conversion) concentrations from the CHP.
P a g e | 12
Harvest Power Canada Ltd.
Air Quality Assessment for Harvest Power (Richmond, BC): Cogeneration and Flare EE12-1250-00
Table 6-1 Predicted Concentrations from the CHP
Pollutant
1-hour Average 24-hour Average Annual Average
(µg/m3) (µg/m3) (µg/m3)
Predicted Concentration
Predicted Concentration
Including Background
Air Quality
Objective
Predicted Concentration
Predicted Concentration
Including Background
Air Quality
Objective
Predicted Concentration
Predicted Concentration
Including Background
Air Quality
Objective
Maximum Receptor
Maximum Receptor
Maximum Receptor
Maximum Receptor
Maximum Receptor
Maximum Receptor
NOx 164 276 - 45 117 - 4 33 -
NO2* 80 192 200 45 117 - 4 33 40
SO2 13 55 450 4.0 12 125 0.33 3 30
VOC 39 - - 11 - - 1 - -
CO 328 4924 30000 - - - - - -
PM10 3 139 - 1 42 50 0.08 13 20
PM2.5** 3 93 - 1*** 24 25 0.08 5 8
*The NO2 concentrations are based on the ambient ratio method using the maximum predicted NOx value.
**The PM2.5 concentrations assume that PM10 represents PM2.5
***The 24-hour PM2.5 concentrations are based on a rolling 24-hour average

P a g e | 13
Harvest Power Canada Ltd.
Air Quality Assessment for Harvest Power (Richmond, BC): Cogeneration and Flare EE12-1250-00
Contours are 5, 10, 20 and 40 µg/m3.
Figure 6-1 Predicted Maximum 1-hour NO2 (100% conversion) for the CHP

P a g e | 14
Harvest Power Canada Ltd.
Air Quality Assessment for Harvest Power (Richmond, BC): Cogeneration and Flare EE12-1250-00
6.2 Flare
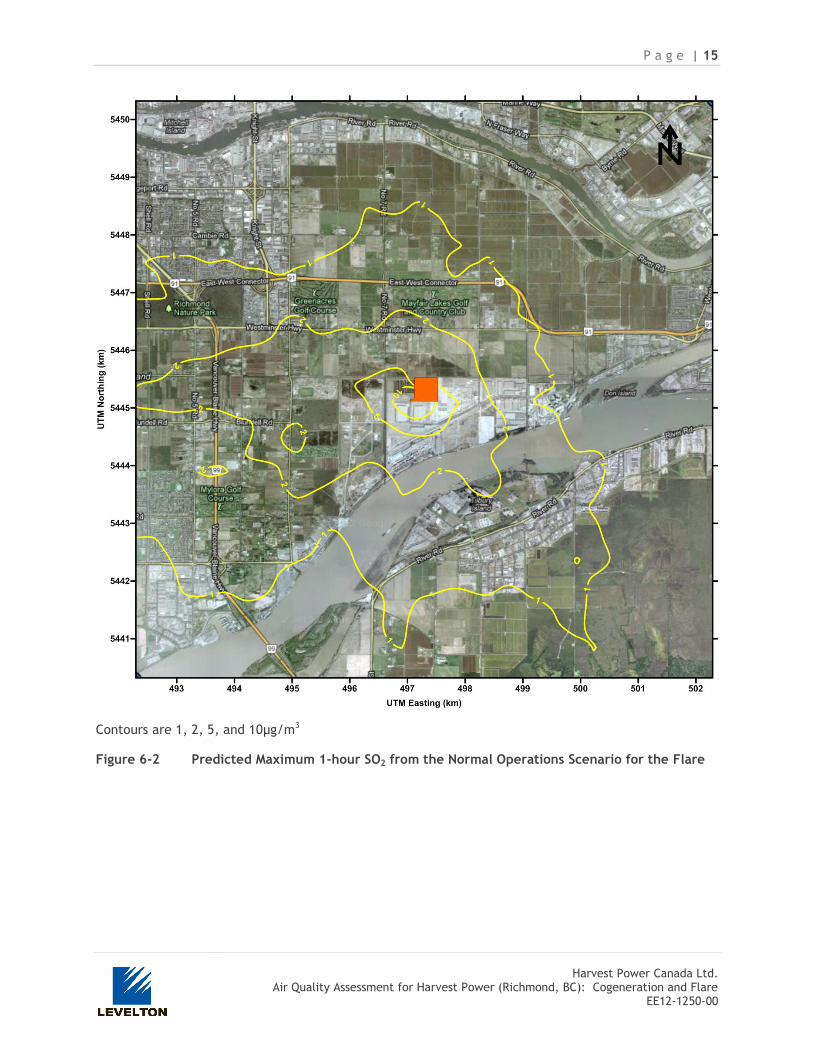
Table 6-2 summarizes the predicted SO2 concentrations for both the normal and upset scenarios for the
flare. Due to the nature of how the flare operates, only the 1-hour and 24-hour averages are
presented below. It is very unlikely that the flare will be operational for a continuous 24-hour period,
so this a conservative estimate of SO2 concentrations. Additionally, it is not expected that the
desulphurization unit will be bypassed and flaring events operate under the normal operation scenario.
Predicted maximum SO2 concentrations are well below all applicable objectives.
In addition, if the maximum predicted concentrations below in Table 6-2 are added to the respective
background concentrations summarized in Table 3-6, all values are below the most stringent ambient
air quality objectives.
Table 6-2 Predicted SO2 Concentrations from the Flare
Scenario
1-hour Average (µg/m3) 24-hour Average (µg/m3)
Predicted SO2 Concentration
Predicted SO2 Concentration
Including Background
Air Quality
Objective (µg/m3)
Predicted SO2 Concentration
Predicted SO2 Concentration
Including Background
Air Quality
Objective (µg/m3)
Maximum Receptor
Maximum Receptor
Maximum Receptor
Maximum Receptor
Normal Conditions
55 97 450 16 25 125
Upset Conditions
164 206 450 47 56 125
Figure 6-2 shows the predicted maximum 1-hour SO2 concentrations from the flare.
P a g e | 15
Harvest Power Canada Ltd.
Air Quality Assessment for Harvest Power (Richmond, BC): Cogeneration and Flare EE12-1250-00
Contours are 1, 2, 5, and 10µg/m3
Figure 6-2 Predicted Maximum 1-hour SO2 from the Normal Operations Scenario for the Flare

P a g e | 16
Harvest Power Canada Ltd.
Air Quality Assessment for Harvest Power (Richmond, BC): Cogeneration and Flare EE12-1250-00
7. Conclusion
Levelton Consultants Ltd. (Levelton) was engaged by Harvest Power to conduct air dispersion modelling
in support of their draft permit application for their facility located in Richmond, BC. Harvest Power is
a composting facility which receives organic waste (food scraps and yard debris) from around the Lower
Mainland. This assessment focuses on the air quality impacts from the cogeneration unit (Combined
Heat and Power (CHP)) and flare. Further air dispersion modelling and assessment work will be
completed in the near term to assess the air quality impacts from the composting operations on the
site.
Air dispersion modelling was conducted using the CALPUFF model suite considering a climatologically
representative meteorological data set of just over one year in duration. Stack and emissions for the
cogeneration unit and flare were determined as outlined in Section 4.
Based on the predicted model results, plus calculated background ambient air quality concentrations
for the Criteria Air Contaminants (CACs) considered for this assessment, no ambient air quality
objectives were exceeded from emissions from the cogeneration unit or flare.
8. References
BC Ministry of Environment (Environmental Protection Division, Environmental Quality Branch, Air
Protection Section), 2008. Guidelines for Air Quality Dispersion Modelling in British Columbia
http://www.env.gov.bc.ca/epd/bcairquality/reports/pdfs/air_disp_model_08.pdf
GICON, 2011. FRSF Process Technology Emissions. Prepared by GICON for Harvest Power.
Levelton, 2012. Detailed Model Plan for Harvest Power Richmond Facility. Submitted / approved by
Metro Vancouver January 30th, 2013.
Metro Vancouver, Air Quality Policy and Management Division, 2013. 2011 Lower Fraser Valley Air
Quality Monitoring Report.
http://www.metrovancouver.org/about/publications/Publications/AmbientAirQuality2011.pdf
Scire, Joseph S. et al., 2000a. A User’s Guide for the CALMET Meteorological Model (Version 5). Earth
Tech Inc.
Scire, Joseph S. et al., 2000b. A User’s Guide for the CALPUFF Dispersion Model (Version 5). Earth
Tech Inc.

P a g e | 17
Harvest Power Canada Ltd.
Air Quality Assessment for Harvest Power (Richmond, BC): Cogeneration and Flare EE12-1250-00
Appendix A: Modelling Methodology
P a g e | 18
Harvest Power Canada Ltd.
Air Quality Assessment for Harvest Power (Richmond, BC): Cogeneration and Flare EE12-1250-00
A-1. Local Climate and Meteorology
To assess the local climate in the area of Harvest Power, 30-year climate normals were obtained from
the Meteorological Service of Canada (MSC) for Vancouver International Airport (YVR). The
meteorological fields generated by the CALMET model were compared to these climate normals and to
observed YVR meteorological data for the June 13, 2000 – July 7, 2001 modelling period, in order to
determine the suitability of the CALMET data for the dispersion modelling.
A-1.1 Temperature
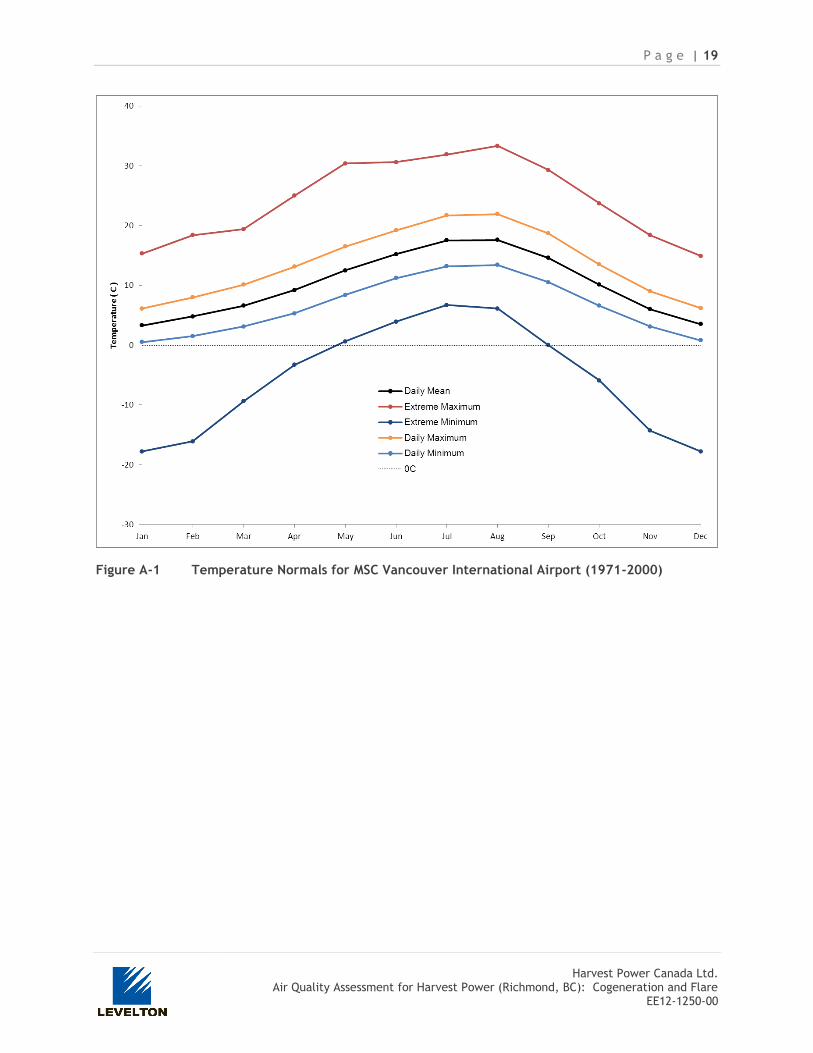
Ambient temperatures recorded at Vancouver International Airport from 1971 to 2000, and for the
2000-2001 modelling period are shown in Figure A-1and Figure A-2. The temperatures extracted from
the CALMET output near FRFS are shown in Figure A-3. The mean daily temperatures listed in the
figures were calculated by averaging the daily mean temperature over the entire monitoring period for
each month. The mean daily maximum and minimum temperatures were calculated by averaging daily
maximum and minimum temperatures for the month. The extreme maximum and minimum
temperatures are the maximum and minimum temperatures for the monthly period.
The mean, maximum and minimum extracted CALMET temperatures are within the climate normals for
the area as outlined by the data from Vancouver International Airport, and are in good agreement with
the observed temperatures at Vancouver International Airport for the 2000-2001 modelling period.
Thus, the temperature data set employed in this analysis is a good representation of statistically
normal conditions for the airshed.
P a g e | 19
Harvest Power Canada Ltd.
Air Quality Assessment for Harvest Power (Richmond, BC): Cogeneration and Flare EE12-1250-00
Figure A-1 Temperature Normals for MSC Vancouver International Airport (1971-2000)

P a g e | 20
Harvest Power Canada Ltd.
Air Quality Assessment for Harvest Power (Richmond, BC): Cogeneration and Flare EE12-1250-00
Figure A-2 2000-2001 Temperature Observations for MSC Vancouver International Airport
P a g e | 21
Harvest Power Canada Ltd.
Air Quality Assessment for Harvest Power (Richmond, BC): Cogeneration and Flare EE12-1250-00
Figure A-3 2000-2001 Temperatures near Harvest Power (Extracted from CALMET Output)
A-1.2 Wind
Representative wind data are required for dispersion modelling, as model predictions will be
significantly affected if appropriate data are not utilised. As a general rule, dispersion model
predictions of ground level concentration at a given point are determined by wind direction and are
inversely proportional to mean wind speed.
Figure A-4 shows a wind rose for Vancouver International Airport based on data from 2002 to 2007
Figure A-5 and Figure A-6 show wind roses for the 2000-2001 modelling period, based on observed
Vancouver International Airport data and CALMET output extracted near YVR, respectively. Based on
the climate normals shown in Figure A-1 and the observational data shown in Figure A-5, the
predominant winds for the area are from the east. The wind rose extracted from the CALMET output
near FRFS (Figure A-7) shows that the predominant winds at this location are also from the east, as
expected from the climate normals and observational data.
-30.0
-20.0
-10.0
0.0
10.0
20.0
30.0
40.0
Jan Feb Mar Apr May Jun Jul Aug Sep Oct Nov Dec
Tem
pe
ratu
re (
C )
Extreme Maximum
Average Daily Maximum
Average Daily
Average Daily Minimum
Extreme Minimum
0 C

P a g e | 22
Harvest Power Canada Ltd.
Air Quality Assessment for Harvest Power (Richmond, BC): Cogeneration and Flare EE12-1250-00
Figure A-4 2002-2007 Windrose for MSC Vancouver International Airport
P a g e | 23
Harvest Power Canada Ltd.
Air Quality Assessment for Harvest Power (Richmond, BC): Cogeneration and Flare EE12-1250-00
Figure A-5 2000-2001 Wind Rose for MSC Vancouver International Airport
Figure A-6 2000-2001 Wind Rose near the MSC Vancouver International Airport (Extracted
from CALMET Output)
P a g e | 24
Harvest Power Canada Ltd.
Air Quality Assessment for Harvest Power (Richmond, BC): Cogeneration and Flare EE12-1250-00
Figure A-7 2000-2001 Wind Rose near Harvest Power (Extracted from CALMET Output)
A-1.3 Conclusion from Comparison of Meteorological Data to Climate Normals
A comparison of the CALMET meteorological fields with the 2000-2001 observations from Vancouver
International Airport and with the 30-year climate normals from Vancouver International Airport shows
that the CALMET data is climatologically representative of the area. Hence modelling using 2000-2001
observations is sufficient to assess the potential impacts of Harvest Power’s emissions on ground level
pollutant concentrations in the area. Utilising more meteorological data or subsequent years of
meteorology would likely not provide greater insight into the maximum predicted pollutant
concentrations and their frequency of occurrence.
A-2. Modelling Methodology
A-2.1 Model Selection
CALPUFF is a suite of numerical models (CALMET, CALPUFF, and CALPOST) that are used in series to
determine the impact of emissions in the vicinity of a source or group of sources. Detailed three-
dimensional meteorological fields are produced by the diagnostic computer model CALMET, based on
surface, marine (optional) and upper air weather data, digital land use data, terrain data, and
prognostic meteorological data (optional). The three-dimensional fields produced by CALMET are used
by CALPUFF, a three-dimensional, multi-species, non-steady-state Gaussian puff dispersion model that
can simulate the effects of time and space varying meteorological conditions on pollutant transport.

P a g e | 25
Harvest Power Canada Ltd.
Air Quality Assessment for Harvest Power (Richmond, BC): Cogeneration and Flare EE12-1250-00
Finally CALPOST, a statistical processing program, is used to summarize and tabulate the pollutant
concentrations calculated by CALPUFF.
A-2.2 CALMET
The CALMET (version 5.8, EPA approved) model was executed to calculate meteorological fields for the
period from June 13, 2000 to July 7, 2001. This modelling period was chosen in order to utilize
available three-dimensional prognostic meteorological data from the Mesoscale Compressible
Community (MC2) model, provided by the University of British Columbia, to improve the performance
of the CALMET model. Meteorological input data was used from 19 surface stations and two upper air
stations. The meteorological data and CALMET output for this modelling period were analysed and
compared with climate normals to ensure that this modelling period is climatologically representative,
as discussed in Section C-1. A description of the CALMET methods and data sets follows. This
methodology presented in this section applies to the original modelling domain. Identical methodology
applies to the larger domain used for NO2 modelling.
A-2.2.1 CALMET Modelling Domain
The Universal Transverse Mercator (UTM, NAD 83) co-ordinate system was used for this model
application. The CALMET domain was a 32 km by 32 km area, as shown in Figure A-8. The extracted
MC2 domain encompassed a slightly larger area around the CALMET domain. Within the CALMET
modelling domain a 250 m grid resolution was used. The CALMET modelling domain and grid resolution
were chosen to encompass the main topographical features for generating the CALMET three-
dimensional diagnostic meteorological fields. On the vertical axis, nine atmospheric layers were
included in order to capture the expected paths of the plumes from the modelled source. The heights
of these layers are given in Table A-0-1.

P a g e | 26
Harvest Power Canada Ltd.
Air Quality Assessment for Harvest Power (Richmond, BC): Cogeneration and Flare EE12-1250-00
Note: Location of Harvest Power is indicated by the orange box.
Figure A-8 Map Displaying the CALMET and CALPUFF Modelling Domain

P a g e | 27
Harvest Power Canada Ltd.
Air Quality Assessment for Harvest Power (Richmond, BC): Cogeneration and Flare EE12-1250-00
Table A-0-1 Heights of CALMET Model Layers
Vertical Layer
Number
Height at Top of Layer
(m)
1 20
2 40
3 80
4 140
5 200
6 500
7 1000
8 2000
9 4000
A-2.2.2 Terrain Elevation and Land Use Data
Digital terrain and land use data covering the model domain was included in the CALMET input data
set. Digital terrain files with a 1:50000 scale were used to generate the CALMET grid cells. Land use
characteristics for each grid cell based on LandData BC data sets were used. The BC land use class
codes were translated into the land use class codes used by CALMET according to the procedures in the
BC Air Quality Modelling Guidelines (AQMG) (BC MOE, 2008).
A-2.2.3 Meteorological Data
Surface meteorological stations that record hourly data include those operated by the Meteorological
Service of Canada (MSC), the BC MOE and Metro Vancouver (previously GVRD). Data from nineteen
surface stations, listed in Table A-0-2, were used as input to the CALMET model. Upper air data from
the vicinity of the area was used from the Port Hardy station, operated by Environment Canada, and
the Quillayute, Washington station, operated by the US National Weather Service.
In its normal mode, CALMET requires a measured data value for every hour from at least one
meteorological station in order to simulate the three-dimensional fields. Missing data procedures were
implemented, when required, as per the AQMG.
As a supplement to the observational data, three-dimensional meteorological fields from the MC2
prognostic model were used (provided by the University of British Columbia). The MC2 prognostic data
was used as input into CALMET as the “initial estimate” field. The "initial estimate" wind field is
calculated by interpolating the winds to the fine CALMET scale and then adjusting them for terrain and
land-use effects. Utilising the MC2 data in this fashion allows for maximum use of actual surface data,
while allowing the MC2 data to replace the surface extrapolated data described in the upper air
section, and thus overall, an improved wind field is generated, both at the surface and aloft.

P a g e | 28
Harvest Power Canada Ltd.
Air Quality Assessment for Harvest Power (Richmond, BC): Cogeneration and Flare EE12-1250-00
Table A-0-2 Surface Meteorological Stations Used for CALMET Input
Surface Meteorological Station Operated By:
T02 Kitsilano - Vancouver Metro Vancouver
T04 Kensington Park - Burnaby Metro Vancouver
T06 Second Narrows - North Vancouver Metro Vancouver
T09 Rocky Point Park - Port Moody Metro Vancouver
T13 North Delta Metro Vancouver
T14 Burnaby Mountain Metro Vancouver
T15 Surrey East Metro Vancouver
T17 Richmond South Metro Vancouver
T18 Burnaby South Metro Vancouver
T20 Pitt Meadows Metro Vancouver
T23 Capitol Hill - Burnaby Metro Vancouver
T24 Burnaby North Metro Vancouver
T26 Mahon Park - North Vancouver Metro Vancouver
T30 Maple Ridge Metro Vancouver
T32 Coquitlam Metro Vancouver
Vancouver Airport MSC
Whistler MSC
Annacis Island BC MOE
Squamish BC MOE
A-2.2.4 CALMET Model Options
The CALMET model has a number of user-specified input switches and options that determine how the
model handles terrain effects, interpolation of observational input data, etc. The differences in the
modelled and measured meteorological fields were examined for a short time frame, and this analysis
was used to determine which model options were appropriate for modelling of impacts over the whole
year.
Table A-0-3 outlines the options that were used that have not been previously described. The current
recommended AQMG default parameters were used whenever applicable.
P a g e | 29
Harvest Power Canada Ltd.
Air Quality Assessment for Harvest Power (Richmond, BC): Cogeneration and Flare EE12-1250-00
Table A-0-3 Selected CALMET Wind Field Model Options
Parameter Option Selected AQMG Default
Froude Number Adjustment Effects Calculated? Yes
Kinematic Effects Computed? No
Slope Effects Computed? Yes
Surface Wind Observations Extrapolated to Upper Layers? Yes
Surface Winds Extrapolated even if Calm? No
Maximum Radius of Influence over Land in the Surface
Layer (RMAX1) 5 km No default
Maximum Radius of Influence over Land Aloft (RMAX2) 20 km No default
Radius of Influence of Terrain Features 10 km No default
Relative Weighting of the First Guess Field and
Observations in the Surface Layer (R1) 3 km No default
Relative Weighting of the First Guess Field and
Observations in the Layers Aloft (R2) 5 km No default
A-2.2.5 CALMET Quality Assurance and Control
When generating model results it is essential to determine if the output is appropriate and reasonable
when compared with observational data. This section outlines the quality assurance and control
(QA/QC) procedures implemented upon the CALMET modelling results to determine the suitability of
the modelling output.
Wind
An example output wind field from CALMET is shown in Figure A-9 for the 10 m level on November 10,
2000 at 11 am.

P a g e | 30
Harvest Power Canada Ltd.
Air Quality Assessment for Harvest Power (Richmond, BC): Cogeneration and Flare EE12-1250-00
Note: Location of Harvest Power is indicated by the
Figure A-9 Example Wind Field Generated by CALMET for the 10 m Level for the Hour Ending
at 11:00 on November 10, 2000

P a g e | 31
Harvest Power Canada Ltd.
Air Quality Assessment for Harvest Power (Richmond, BC): Cogeneration and Flare EE12-1250-00
Data was extracted from the Level 1 (10 m level) CALMET output for a grid cell located at the facility
site. This data was then compared with the closest surface stations used in the modelling (Annacis
Island and T17 - Richmond South), as well as MSC Vancouver International Airport. The frequency
distribution of measured surface winds for the surface stations and the predicted values from the
extracted CALMET point are shown below in Figure A-10. The CALMET output follows a similar trend to
that of the surface stations, with wind speed frequencies generally falling in between those observed
at the surface stations.
Figure A-10 Frequency Distribution of Surface (10 m level) Winds for Surface Stations and near
Harvest Power (CALMET)

P a g e | 32
Harvest Power Canada Ltd.
Air Quality Assessment for Harvest Power (Richmond, BC): Cogeneration and Flare EE12-1250-00
Figure A-11 and Figure A-12 below show monthly and diurnal variations respectively for the surface
stations and the extracted CALMET point. The extracted point falls between the values measured at
the surface stations, and follows similar trends to the nearby Annacis Island station.
Figure A-11 Average Monthly Wind Speeds at Surface (10 m level) for Surface Stations and
Harvest Power (CALMET)
P a g e | 33
Harvest Power Canada Ltd.
Air Quality Assessment for Harvest Power (Richmond, BC): Cogeneration and Flare EE12-1250-00
Figure A-12 Diurnal Wind Speed Distribution of Surface (10 m level) Winds for Surface Stations
and Harvest Power (CALMET)
Temperature
Figure A-13 shows the average monthly surface temperature and Figure A-14 shows the average hourly
temperature (binned into 3 hour intervals) for the available surface data and the extracted CALMET
output for Harvest Power. Both plots show an excellent agreement between the predicted and
observed values.

P a g e | 34
Harvest Power Canada Ltd.
Air Quality Assessment for Harvest Power (Richmond, BC): Cogeneration and Flare EE12-1250-00
Figure A-13 Monthly Temperatures at Surface Stations and Harvest Power (CALMET)
P a g e | 35
Harvest Power Canada Ltd.
Air Quality Assessment for Harvest Power (Richmond, BC): Cogeneration and Flare EE12-1250-00
Figure A-14 Hourly Temperatures at Surface Stations and the Harvest Power (CALMET)
Stability Class
The frequency distribution of predicted stability for Harvest Power was compared with the calculated
stability for Vancouver Airport (YVR). YVR was used as the other surface stations used in the modelling
did not have the required parameters to determine stability. As seen in Figure A-15, the extracted
CALMET data is in good agreement with the calculated stability from YVR.
P a g e | 36
Harvest Power Canada Ltd.
Air Quality Assessment for Harvest Power (Richmond, BC): Cogeneration and Flare EE12-1250-00
Figure A-15 Frequency Distribution of Stability Classes Calculated for Vancouver Airport (YVR)
and Harvest Power (CALMET) for the Modelling Period
Mixing Height
Predicted mixing heights from CALMET are shown in Figure A-16. Mixing heights are not available from
the input data, but the predicted values appear representative of typical mixing heights of a similar
location (Senes et al, 1996).
P a g e | 37
Harvest Power Canada Ltd.
Air Quality Assessment for Harvest Power (Richmond, BC): Cogeneration and Flare EE12-1250-00
Figure A-16 Hourly Predicted Mixing Heights for Harvest Power (CALMET)
P a g e | 38
Harvest Power Canada Ltd.
Air Quality Assessment for Harvest Power (Richmond, BC): Cogeneration and Flare EE12-1250-00
A-2.3 CALPUFF
The CALPUFF (version 5.8, EPA approved) model was executed to simulate dispersion of emissions from
the various sources at Harvest Power. This methodology presented in this section applies to the
original modelling domain. Identical methodology applies to the larger domain used for NO2 modelling
but with more receptors over residential areas.
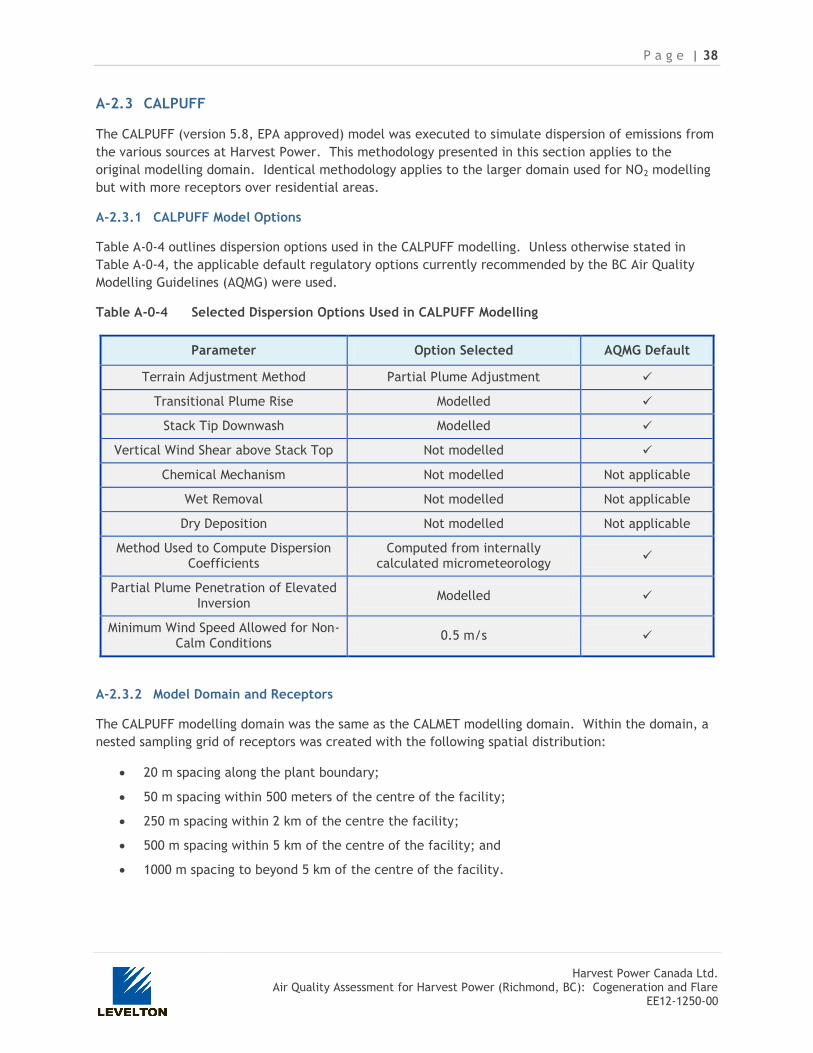
A-2.3.1 CALPUFF Model Options
Table A-0-4 outlines dispersion options used in the CALPUFF modelling. Unless otherwise stated in
Table A-0-4, the applicable default regulatory options currently recommended by the BC Air Quality
Modelling Guidelines (AQMG) were used.
Table A-0-4 Selected Dispersion Options Used in CALPUFF Modelling
Parameter Option Selected AQMG Default
Terrain Adjustment Method Partial Plume Adjustment
Transitional Plume Rise Modelled
Stack Tip Downwash Modelled
Vertical Wind Shear above Stack Top Not modelled
Chemical Mechanism Not modelled Not applicable
Wet Removal Not modelled Not applicable
Dry Deposition Not modelled Not applicable
Method Used to Compute Dispersion Coefficients
Computed from internally calculated micrometeorology
Partial Plume Penetration of Elevated Inversion
Modelled
Minimum Wind Speed Allowed for Non-Calm Conditions
0.5 m/s
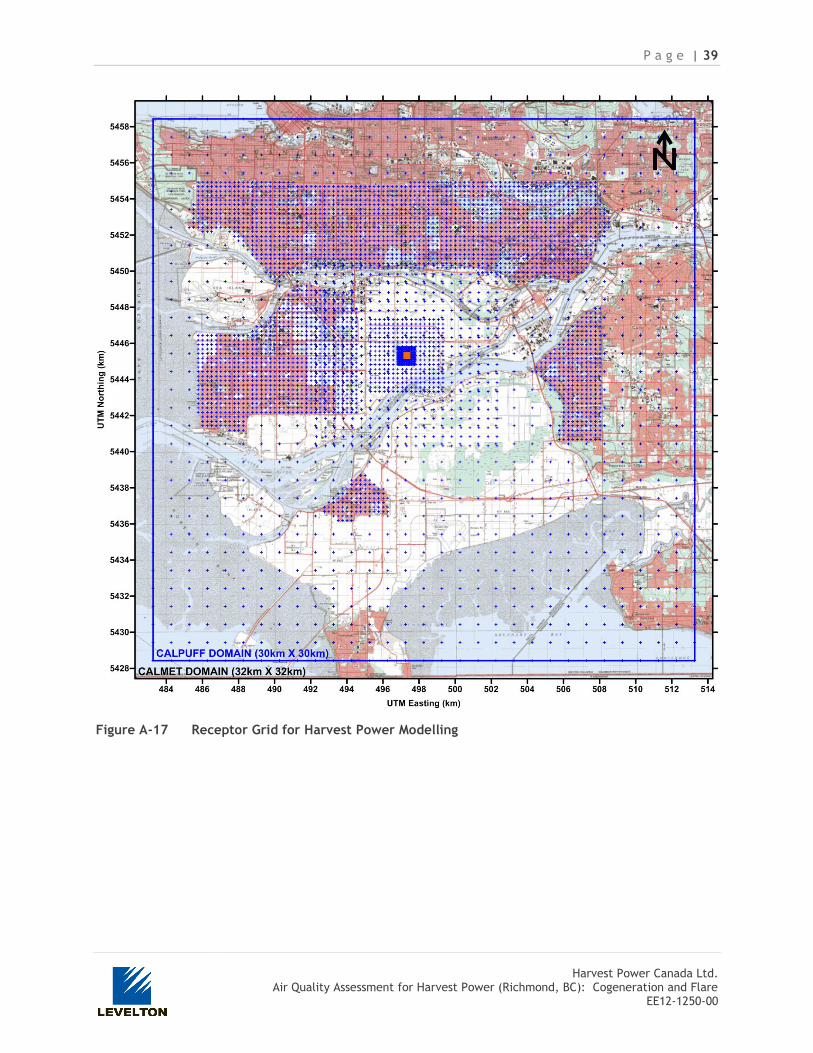
A-2.3.2 Model Domain and Receptors
The CALPUFF modelling domain was the same as the CALMET modelling domain. Within the domain, a
nested sampling grid of receptors was created with the following spatial distribution:
20 m spacing along the plant boundary;
50 m spacing within 500 meters of the centre of the facility;
250 m spacing within 2 km of the centre the facility;
500 m spacing within 5 km of the centre of the facility; and
1000 m spacing to beyond 5 km of the centre of the facility.
P a g e | 39
Harvest Power Canada Ltd.
Air Quality Assessment for Harvest Power (Richmond, BC): Cogeneration and Flare EE12-1250-00
Figure A-17 Receptor Grid for Harvest Power Modelling

Harvest Power Canada Ltd.
Air Quality Assessment for Harvest Power (Richmond, BC): Cogeneration and Flare EE12-1250-00
Figure A-18 Layout of Harvest Power with Buildings Used in BPIP Denoted in Blue
Harvest Power Canada Ltd.
Air Quality Assessment for Harvest Power (Richmond, BC): Cogeneration and Flare EE12-1250-00
A-2.3.3 Building Downwash
The dispersion of stack emissions near an elevated source can be significantly affected by the
building downwash effect. Building downwash refers to the turbulent wake caused by a structure
as the wind blows by it. To ensure the correct analysis of plume dispersion from Harvest Power,
the US EPA Building Profile Input Program (BPIP-PRIME) was used to analyze stack and building
dimensions for possible building wake effects. The BPIP-PRIME model determines the appropriate
height and cross wind projection of all buildings that affect plume dispersion from a stack for:
buildings within a distance of 5 times the lesser of its width or peak height from the stack, and
stacks below the Good Engineering Practice height (HGEP) calculated as:
HGEP = Hb + 1.5 x L
where: Hb is the building height
L is the lesser of the building height or the projected building width.
The BPIP-PRIME model was run using building locations and dimensions provided by Harvest Power.
The results of the BPIP-PRIME model were then used as input to the CALPUFF model, and turbulent
wake effects were simulated. As Figure C-17 shows, nearly every building was used in the BPIP
program.
A-3. References
BC Ministry of Environment (Environmental Protection Division, Environmental Quality Branch, Air
Protection Section), 2008. Guidelines for Air Quality Dispersion Modelling in British
Columbia
http://www.env.gov.bc.ca/epd/bcairquality/reports/pdfs/air_disp_model_08.pdf
Scire, Joseph S. et al., 2000a. A User’s Guide for the CALMET Meteorological Model (Version 5).
Earth Tech Inc.
Scire, Joseph S. et al., 2000b. A User’s Guide for the CALPUFF Dispersion Model (Version 5). Earth
Tech Inc.
Senes et al, 1997. A Mixing Height Study for North America (1987 – 1991).