HARVARD-SMITHSONIAN CENTER FOR ASTROPHYSICS CAMBRIDGE MA …€¦ · · 2010-07-08Detection and...
116
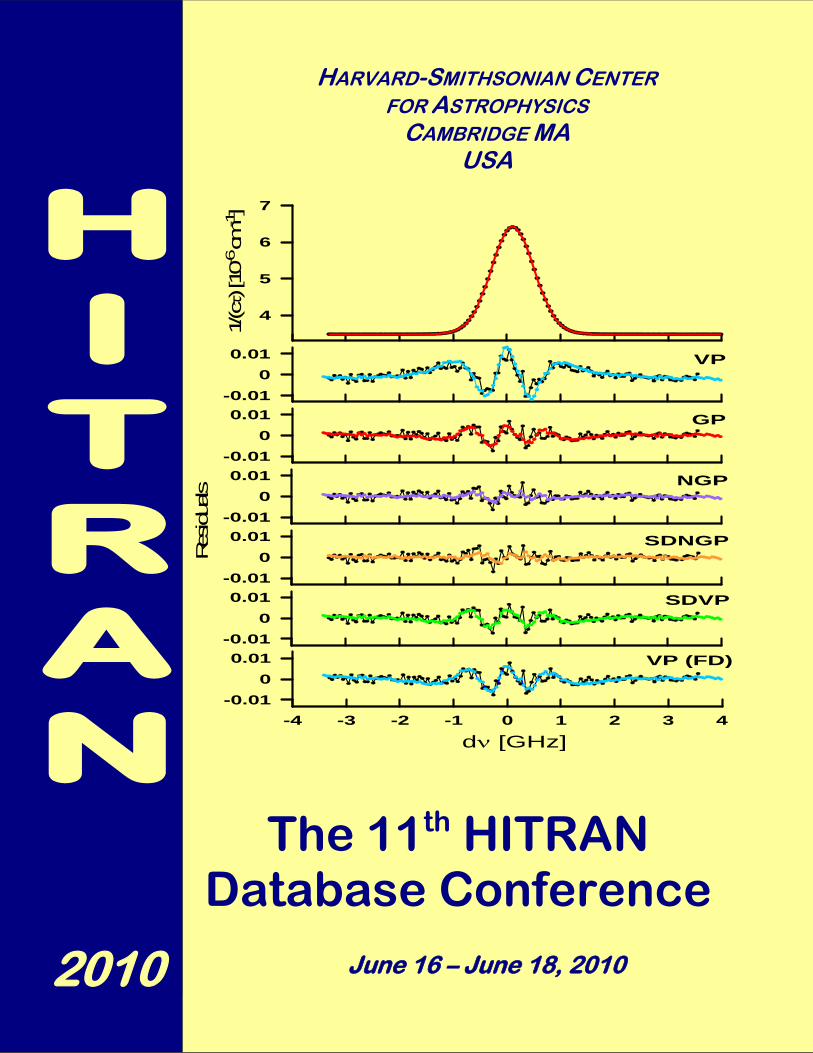
H I T R A N 2010 HARVARD-SMITHSONIAN CENTER FOR ASTROPHYSICS CAMBRIDGE MA USA The 11 th HITRAN Database Conference June 16 – June 18, 2010 -0.01 0 0.01 -0.01 0 0.01 -0.01 0 0.01 Residuals -0.01 0 0.01 -0.01 0 0.01 4 5 6 7 1/(c )[10 -6 cm -1 ] VP GP NGP SDNGP SDVP -4 -3 -2 -1 0 1 2 3 4 d [GHz] -0.01 0 0.01 VP (FD)
Transcript of HARVARD-SMITHSONIAN CENTER FOR ASTROPHYSICS CAMBRIDGE MA …€¦ · · 2010-07-08Detection and...
H I T R A N
2010
HARVARD-SMITHSONIAN CENTER FOR ASTROPHYSICS
CAMBRIDGE MA USA
The 11th HITRAN Database Conference
June 16 – June 18, 2010
-0.01
0
0.01
-0.01
0
0.01
-0.01
0
0.01
Res
idua
ls
-0.01
0
0.01
-0.01
0
0.01
4
5
6
7
1/(c)
[10-
6 cm
-1]
VP
GP
NGP
SDNGP
SDVP
-4 -3 -2 -1 0 1 2 3 4
d [GHz]
-0.01
0
0.01 VP (FD)
The following companies contributed to the HITRAN 2010 Conference:
ONTAR Corp. 9 Village Way
North Andover MA 01845 USA
TOPTICA Photonics, Inc. 1286 Blossom Drive
Victor NY 14564 USA
GATS, Inc. 11864 Canon Blvd
Suite 101 Newport News VA 23606
USA
ABB Bomem, Inc. 585 boulevard Charest Est
Suite 300 Québec PQ, G1K 9H4
CANADA
Elsevier Radarweg 29
Amsterdam 1043 NX NETHERLANDS Publisher of the
Journal of Quantitative Spectroscopy and Radiative Transfer (JQSRT)
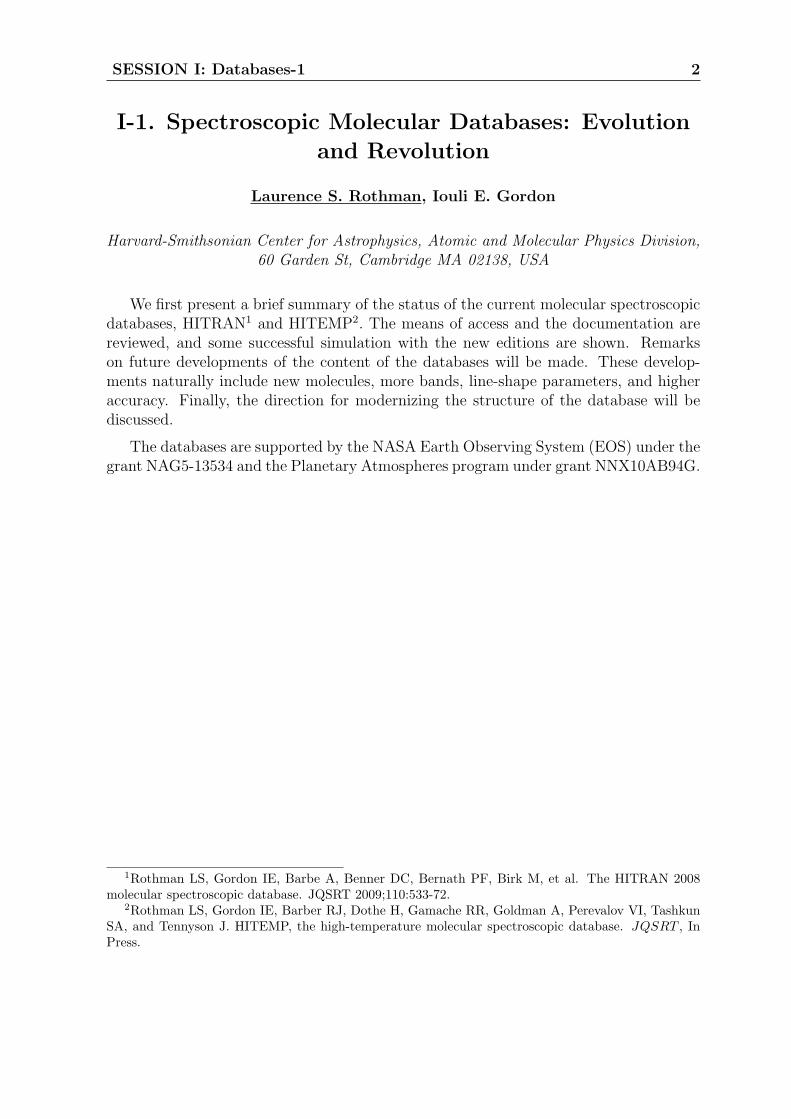
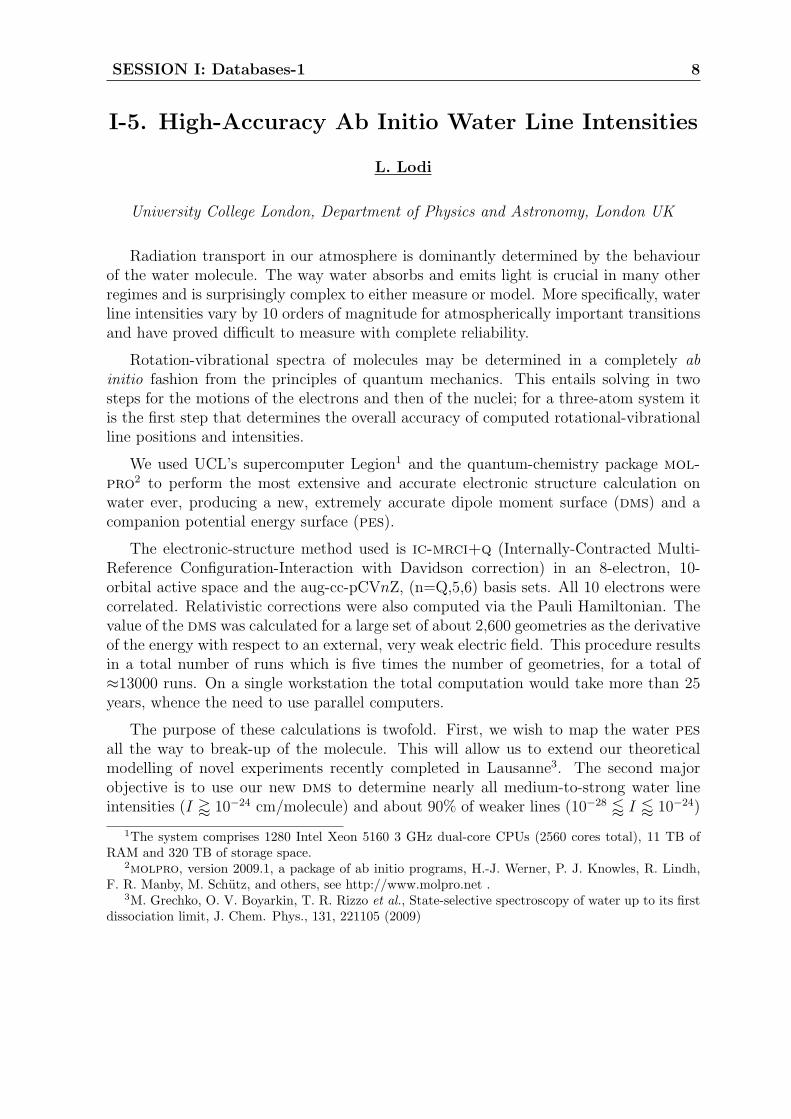
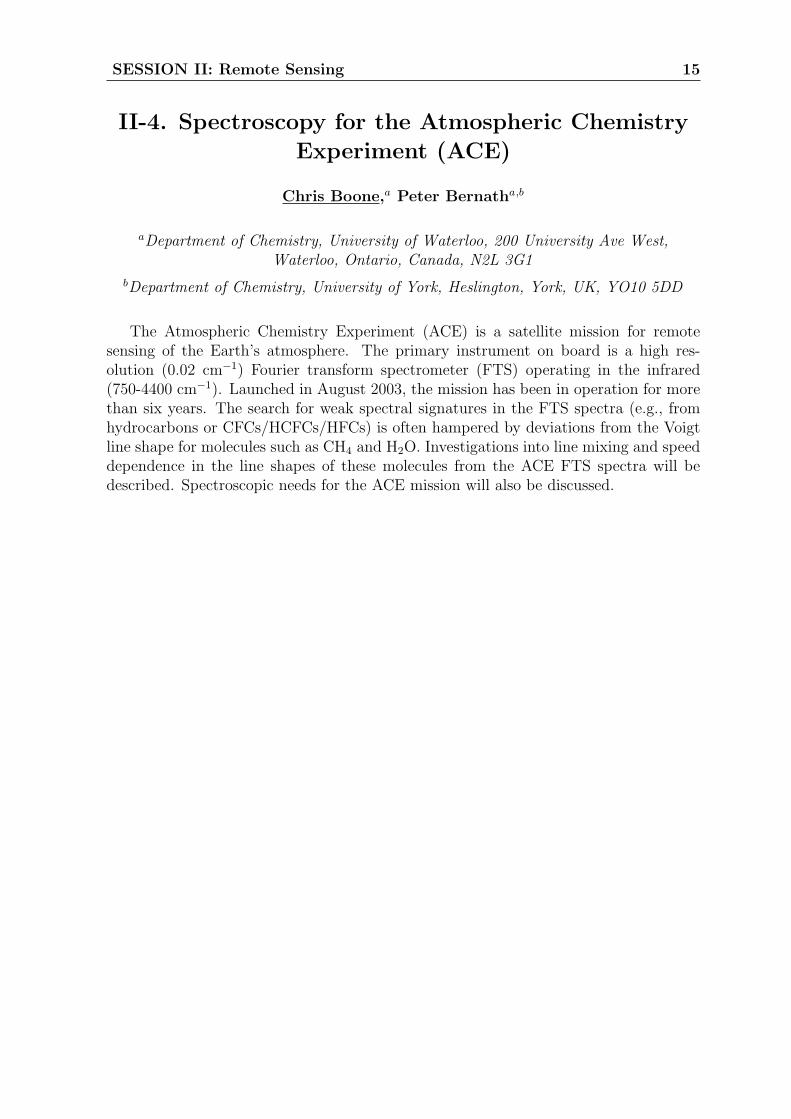
Front page: This image shows an example of different fits of line-shape profiles to the oxygen line at 14546.008755 cm-1, as well as implementation of advanced signal-to-noise reduction techniques. The issue of line shape is one of the salient topics at this year’s HITRAN conference. The figure was taken from the poster presented at the 20th International Symposium on Spectral Lineshapes, June 6-11, 2010, Memorial University of Newfoundland by A. Cygan, et al.
The HITRAN Project has been funded by grants from the National Aeronautics and Space Administration.

DAY 1, Wednesday 16 June
SESSION I: Databases-1 1
I-1. Spectroscopic Molecular Databases: Evolution and RevolutionL. S. Rothman, I. E. Gordon . . . . . . . . . . . . . . . . . . . . . . . . . . . 2
I-2. The GEISA Database 2009 Edition: Update Description and Assessmentof Spectroscopic Parameters Through Hyperspectral Remote Sensing Ap-plicationsN. Jacquinet, L. Crepeau, V. Capelle, N. Scott, R. Armante, A. Chedin . . . . . . 3
I-3. Blended HITRAN and other Spectra Databases for Modeling Emission-based LIDARD. Plutov, D. K. Killinger . . . . . . . . . . . . . . . . . . . . . . . . . . . . 5
I-4. Calculating the Spectroscopic Behaviour of Hot MoleculesJ. Tennyson . . . . . . . . . . . . . . . . . . . . . . . . . . . . . . . . . . . 7
I-5. High-Accuracy Ab Initio Water Line IntensitiesL. Lodi . . . . . . . . . . . . . . . . . . . . . . . . . . . . . . . . . . . . . 8
I-6. CDSD-4000: High-Temperature Spectroscopic CO2 DatabankS. Tashkun,V. I. Perevalov . . . . . . . . . . . . . . . . . . . . . . . . . . . . 10
SESSION II: Remote Sensing 11
II-1. Line Parameters and Forward Calculation for Retrieving Carbon Dioxideand Methane from GOSAT DataT. Yokota, Y. Yoshida, I. Morino, N. Kikuchi . . . . . . . . . . . . . . . . . . . 12
II-2. MIPAS: New Results and Spectroscopy IssuesJ. Orphal, J. Plieninger, M. Hoepfner, G. Stiller, T. von Clarmann, Norbert Glatthor,
U. Grabowski, S. Kellmann, M. Kiefer, A. Linden . . . . . . . . . . . . . . . . . 13
II-3. The Atmospheric Chemistry Experiment, ACE: Status and SpectroscopicIssuesP. F. Bernath . . . . . . . . . . . . . . . . . . . . . . . . . . . . . . . . . . 14
II-4. Spectroscopy for the Atmospheric Chemistry Experiment (ACE)C. Boone, P. Bernath . . . . . . . . . . . . . . . . . . . . . . . . . . . . . . 15
II-5. Spectroscopic Issues in the Data Analysis of REFIR-PAD MeasurementsPerformed During the 2009 Ground-Based CampaignsGiovanni Bianchini, Luca Palchetti . . . . . . . . . . . . . . . . . . . . . . . . 16
II-6. Polar Mesospheric Clouds and Cosmic Dust: Three Years of SOFIEMeasurementsM. McHugh, M. Hervig, L. Gordley, L. Deaver . . . . . . . . . . . . . . . . . . . 17
II-7. LBL Models: State of the Art and PerspectiveB. A. Fomin . . . . . . . . . . . . . . . . . . . . . . . . . . . . . . . . . . . 18
i
SESSION III: Laboratory Spectroscopy-1 19
III-1. The Absorption Spectrum of Methane Between 1.27 and 1.71 µm ByHigh Sensitivity CRDS at 80 K and 300 K. Importance of the CH3DContribution in the 1.58 µm Transparency WindowSamir Kassi, Le Wang, Alain Campargue . . . . . . . . . . . . . . . . . . . . . 20
III-2. The 4ν3 Spectral Region of MethaneD. Chris Benner, V. Malathy Devi, J. J. O’Brien, S. Shaji, P. T. Spickler, C. P. Houck,
J. A. Coakley, Kasie J. Haga . . . . . . . . . . . . . . . . . . . . . . . . . . . 22
III-3. Line Strengths and Self-Broadening of Pure Rotational Lines of CarbonMonoxide and Nitrous Oxide Measured by Terahertz Time-Domain SpectroscopyW. Aenchbacher, M. Naftaly, R. Dudley . . . . . . . . . . . . . . . . . . . . . . 23
III-4. Submillimeter-Wave and Far-Infrared Spectroscopy of High-J Transitionsof AmmoniaS. Yu, J. C. Pearson, B. J. Drouin, and K. Sung, O. Pirali, M. Vervloet, M.-A. Martin,
C. P. Endres, T. Shiraishi, K. Kobayashi, F. Matsushima . . . . . . . . . . . . . . 24
Poster Session I 27
PI-1. Study of H216O Line Intensities around 8800 cm−1
C. Oudot, L. Regalia, L. Daumont, X. Thomas, P. Von Der Heyden, D. Decatoire,
L. Wang . . . . . . . . . . . . . . . . . . . . . . . . . . . . . . . . . . . . . 28
PI-2. Line List of HD18O Rotation-Vibration Transitions for Atmospheric Ap-plicationsS. N. Mikhailenko, O. V. Naumenko, S. A. Tashkun, A.-W. Liu, S.-M. Hu . . . . . . 29
PI-3. SMPO Line List of 16O3 in the Range 6000-7000 cm−1
M.-R. De Backer-Barilly, S.N. Mikhailenko, A. Campargue, Vl. G. Tuyterev, A. Barbe,
S. Kassi . . . . . . . . . . . . . . . . . . . . . . . . . . . . . . . . . . . . . 30
PI-4. CRDS of 16O3 in the Range 7000-8000 cm−1 : First RovibrationalAssignments of the ν1+2ν2+5ν3 (7130 cm
−1), 6ν1+ν3 (7442 cm−1), 5ν1+2ν2+ν3
(7579 cm−1), and ν1+3ν2+5ν3 (7686 cm−1) BandsS. Kassi, A. Barbe, M.-R. De Backer-Barilly, Vl. G. Tuyterev, A. Campargue . . . . 31
PI-5. High Sensitivity CRDS of the a1∆g←X3Σ−g Band of Oxygen near 1.27
µm: Magnetic Dipole and Electric Quadrupole Transitions in DifferentBands of Six IsotopologuesS. Kassi, O. M. Leshchishina, L. Wang, I. E. Gordon, L. S. Rothman, A. Campargue . 32
PI-6. First High Resolution Analysis of the 4ν1+ν3 Band of Nitrogen Dioxidenear 1.5 µmA. Perrin, S.Kassi, A.Campargue . . . . . . . . . . . . . . . . . . . . . . . . . 33
ii
PI-7. The COF2 Rotational Spectrum near 1 THz and the Infrared SpectrumRevisited; Improved Molecular Constants for the Ground and First ExcitedStates of ν2, ν3, ν5, and ν6Edward A. Cohen, Brian J. Drouin, and Linda R. Brown . . . . . . . . . . . . . . 34
PI-8. Revised Line-Strengths and Peak-Positions for cis-HONO at 1660 cm−1
Using a New CW-QC TILDASB. H. Lee, E. C. Wood, M. S. Zahniser, J. B. McManus, D. D. Nelson, S. C. Herndon,
J. H. Shorter, J. C. Wormhoudt, S. C. Wofsy, J. W. Munger . . . . . . . . . . . . 35
PI-9. Detection and Quantification of OH Radical by Emission and AbsorptionTHz SpectroscopyA. Cuisset, S. Eliet, F. Hindle, G. Mouret, R. Bocquet, O. Pirali, M. A. Martin, M.
Vervloet . . . . . . . . . . . . . . . . . . . . . . . . . . . . . . . . . . . . . 36
PI-10. Far Infrared High Resolution Rovibrational Spectroscopy of DimethylsulfoxydeA. Cuisset, I. Smirnova, R. Bocquet, F. Hindle, G. Mouret, D. A. Sadovskii, O. Pirali,
P. Roy . . . . . . . . . . . . . . . . . . . . . . . . . . . . . . . . . . . . . . 37
PI-11. Simulation of Snow Spectral Albedo at 0.4-2.5 micron: Updated withNew Measurement of the Refractive Index of IceJ. Mao, B.-C. Gao . . . . . . . . . . . . . . . . . . . . . . . . . . . . . . . . 38
PI-12. Gas Turbine Engine Soot Particle Emissions and Aerosol Interaction inExperimentally Simulated High Altitude ConditionsM. Hilton, M. A. Welch, M. P. Johnson . . . . . . . . . . . . . . . . . . . . . . 39
PI-13. Improving Radiative Forcing Estimates in GCM Radiation CodesD. Paynter . . . . . . . . . . . . . . . . . . . . . . . . . . . . . . . . . . . . 40
DAY 2, Thursday 17 June
SESSION IV: Databases-2 41
IV-1. Error Propagation from Line Parameters to Spectra Simulations. Il-lustration on High Temperature MethaneJ. P. Champion and C. Wenger . . . . . . . . . . . . . . . . . . . . . . . . . . 42
IV-2. High-Lying Rotational Levels of Water Obtained by FIR EmissionSpectroscopyL. H. Coudert, M.-A. Martin, O. Pirali, D. Balcon, M. Vervloet . . . . . . . . . . . 44
IV-3. Assignment of the 5ν4 and ν2+4ν4 band system of 12CH4 in the Region6287-6550 cm−1
A. V. Nikitin, X. Thomas, L. Regalia, L. Daumont, P. Von Der Heyden, Vl. G. Tyuterev,
A. Liu, S. Kassi, A. Campargue . . . . . . . . . . . . . . . . . . . . . . . . . . 45
IV-4. Towards New Line List of Magnetic Dipole and Electric QuadrupoleTransitions in the a1∆g←X3Σ−
g Band of OxygenI. E. Gordon, L. S. Rothman, S. Kassi, A. Campargue, G. C. Toon . . . . . . . . . 46
iii
IV-5. Update for Methyl Chloride at 3 µmC. Bray, A. Perrin, D. Jacquemart, N. Lacome . . . . . . . . . . . . . . . . . . . 47
IV-6. Indices of Refraction of Absorptive Aerosol - Their Importance andComplexityS. T. Massie . . . . . . . . . . . . . . . . . . . . . . . . . . . . . . . . . . . 48
SESSION V: Line Shapes 49
V-1. The Importance of Being Earnest about Line ShapesC. E. Miller and L. R. Brown . . . . . . . . . . . . . . . . . . . . . . . . . . . 50
V-2. Improvements, Corrections and New Developments in SemiclassicalTheories of Collisional Line BroadeningJ. Buldyreva . . . . . . . . . . . . . . . . . . . . . . . . . . . . . . . . . . . 51
V-3. Spectral shapes modeling and remote sensing of greenhouse gases:Toward the OCO and GOSAT experiments and future HITRAN issuesJean-Michel Hartmann . . . . . . . . . . . . . . . . . . . . . . . . . . . . . . 53
V-4. An Improved Version of the CO2 Line-mixing Database and Software:Update and ExtensionA. L. Laraia, J. Lamouroux, R. R. Gamache, H. Tran, L. S. Rothman, I. E. Gordon,
J.-M. Hartmann . . . . . . . . . . . . . . . . . . . . . . . . . . . . . . . . . 55
V-5. The Collision-Broadened Line Shape of CO2 via the Complex Robert-Bonamy Method: The Complexity of SimplicityJ. Lamouroux, A. L. Laraia, R. R. Gamache . . . . . . . . . . . . . . . . . . . . 56
V-6. Uncertainties Associated with Theoretically Calculated N2 BroadenedHalf-Widths of H2O LinesQ. Ma, R. H. Tipping, R. R. Gamache . . . . . . . . . . . . . . . . . . . . . . 57
V-7. Complex Robert-Bonamy Calculation of H2O Broadened by N2, O2 andAir Made with Realistic TrajectoriesJ. Lamouroux, A. L. Laraia, R. R. Gamache, Q. Ma, R. H. Tipping . . . . . . . . . 58
V-8. N2 Collisional Broadening of Methane in the THz Region Measured atthe SOLEIL SynchrotronV. Boudon, T. Gabard, O. Pirali, P. Roy, J.-B. Brubach, L. Manceron, J. Vander Auwera 59
V-9. N2-broadened13CH4 at 80 to 296 K
M. A. H. Smith, K. Sung, L. R. Brown, T. J. Crawford, A. W. Mantz, V. Malathy Devi,
D. Chris Benner . . . . . . . . . . . . . . . . . . . . . . . . . . . . . . . . . 60
V-10. Formaldehyde Broadening Coefficients: the 5.7µm AND 3.6µm BandsD. Jacquemart, N. Lacome, A. Laraia, R.R. Gamache, A. Perrin, F. Kwabia Tchana . 61
iv
Poster Session 2 63
PII-1. High Resolution Fourier Transform Spectroscopy in the 1.57 µm RegionUsing a Frequency Comb Laser SourceK. Sung, P. Chen, T. J. Crawford . . . . . . . . . . . . . . . . . . . . . . . . . 64
PII-2. Development of an External-Cavity Quantum Cascade Laser SpectrometerV. Zeninari, D. Mammez, J. Cousin, L. Joly, B. Parvitte . . . . . . . . . . . . . . 65
PII-3. High-Resolution Diode Laser Spectroscopy of C2H2, H2O, CO2 and theirIsotopologues and Application to TDLAS a Tunable Near Infrared DiodeLaser Spectrometer for the Martian PHOBOS-GRUNT Space MissionV. Zeninari, J. Li, J. Cousin, B. Parvitte, L. Joly, G. Durry . . . . . . . . . . . . . 66
PII-4. Pressure Broadening Coefficients of HCl and DCl for the Venus AtmosphereT. Foldes and J. Vander Auwera . . . . . . . . . . . . . . . . . . . . . . . . . 67
PII-5. Recent Collisional Broadening Studies at PhLAM in the MillimeterRange: Temperature Dependencies and Line Shapes AnalysisG. Wlodarczak and F. Rohart . . . . . . . . . . . . . . . . . . . . . . . . . . 68
PII-6. New Absorption Bands of the Carbon Dioxide Isotopologues in VenusSpectraS. Robert, R. Drummond, A. Mahieux, V. Wilquet, A. C. Vandaele, J. Vander Auwera,
Yu. Borkov, V. I. Perevalov, S. A. Tashkun, J .- L. Bertaux . . . . . . . . . . . . . 69
PII-7. A Modified Version of the HITRAN Database for High TemperatureDiagnostics and Plume Signature ApplicationsW. J. Phillips, D. G. Brown . . . . . . . . . . . . . . . . . . . . . . . . . . . 70
PII-8. Predicting half-widths and line shifts for water vapor transitions on theHITEMP databaseR. R. Gamache, L. S. Rothman, I. E. Gordon . . . . . . . . . . . . . . . . . . . 71
PII-9. Modelling Water Spectra and their Contribution to the Water VapourContinuumM. J. Barber, R. E. A. Kelly, J. Tennyson . . . . . . . . . . . . . . . . . . . . . 72
PII-10. Water Vapor Line Measurements to Improve the Continuum Contributionin the THz RegionD. F. Plusquellic, V. B. Podobedov, K. Siegrist, G. T. Fraser, K. O. Douglass,a E. Gerecht,
and Q. Ma . . . . . . . . . . . . . . . . . . . . . . . . . . . . . . . . . . . . 73
PII-11. High Resolution Investigation of the Ethane Spectrum at 7 micron(1430 cm−1)C. Di Lauro, F. Lattanzi, K. Sung, L. R. Brown, J. Vander Auwera, A. W. Mantz,
M. A. H. Smith . . . . . . . . . . . . . . . . . . . . . . . . . . . . . . . . . 74
PII-12. Calculated Line Intensities for the Deuterated Isotopologues of theHydrogen Sulphide: Range of Fundamentals and First PolyadsV. G. Tyuterev, J. Lamouroux, S. A. Tashkun . . . . . . . . . . . . . . . . . . . 75
v
PII-13. Critical Evaluation of the Vibrational-Rotational Transitions of HydrogenSulfide and its Isotopologues from 0 to 16500 cm−1
O. V. Naumenko, L. R. Brown, A. Campargue, S.-M. Hu, E. R. Polovtseva, A. Z. Fazliev,
S. A. Tashkun . . . . . . . . . . . . . . . . . . . . . . . . . . . . . . . . . . 76
PII-14. Line Parameters of the H35Cl R(3) Absorption Line in the FirstOvertone at up to 10 barV. Ebert, P. Ortwein, W. Woiwode, M. Gisi, S. Wagner . . . . . . . . . . . . . . 77
DAY 3, Friday 18 June
SESSION VI: Database structure 79
VI-1. Information System to Access HITRAN via the InternetY. L. Babikov, S. N. Mikhailenko, S. A. Tashkun, I. E. Gordon, L. S. Rothman . . . 80
VI-2. New Tools for Storing and Accessing Spectroscopic Data: the Developmentof an XML Schema for the HITRAN DatabaseC. Hill and J. Tennyson . . . . . . . . . . . . . . . . . . . . . . . . . . . . . 81
VI-3. Publishing Tools for a Distributed Information SystemA.Z. Fazliev, N.A. Lavrentiev, and A.I. Privezentsev . . . . . . . . . . . . . . . . 82
VI-4. JPL Catalog Upgrades: New Tools, New Formats and New InterfacesB. J. Drouin, S. Yu, J. C. Pearson . . . . . . . . . . . . . . . . . . . . . . . . 83
VI-5. SPECTRAFACTORY.NET: a Database of Molecular Model Spectra forAstronomersJ. Cami and A. J. Markwick . . . . . . . . . . . . . . . . . . . . . . . . . . . 84
VI-6. Representing Scientific Databases OnlineA. J. Markwick . . . . . . . . . . . . . . . . . . . . . . . . . . . . . . . . . 85
SESSION VII: Planetary Atmospheres 87
VII-1. Recent Advances in the Spectroscopy of Planetary and ExoplanetaryAtmospheres : What is out There?P. Drossart . . . . . . . . . . . . . . . . . . . . . . . . . . . . . . . . . . . 88
VII-2. Titan’s Neutral Atmospheric Chemistry from the Astronomical Pointof ViewA. Coustenis . . . . . . . . . . . . . . . . . . . . . . . . . . . . . . . . . . . 89
VII-3. High-Resolution Analysis of Various Propane Bands: Modeling ofTitan’s Infrared SpectrumJ.-M. Flaud . . . . . . . . . . . . . . . . . . . . . . . . . . . . . . . . . . . 90
vi
SESSION VIII: Laboratory Spectroscopy-2 91
VIII-1. High-Resolution Tunable Diode Laser Spectroscopic Parameters forAtmospheric Applications and Comparisons with HITRANV. Zeninari, B. Parvitte, L. Joly, G. Durry . . . . . . . . . . . . . . . . . . . . 92
VIII-2. Laser Spectroscopic Study of Ozone in the 100⇐000 Band for theSWIFT InstrumentM. Guinet, D. Mondelain, C. Janssen, C. Camy-Peyret . . . . . . . . . . . . . . . 93
VIII-3. New Acetone Absorption Cross Sections for ACE RetrievalsN. D. C. Allen, J. J. Harrison, P. F. Bernath . . . . . . . . . . . . . . . . . . . 94
VIII-4. Infrared Absorption Cross Sections of ClOOCl - Laboratory Work andApplication in MIPAS-B MeasurementsM. Birk, G. Wagner, H. Oelhaf, G. Wetzel . . . . . . . . . . . . . . . . . . . . . 95
VIII-5. Spectral Line Parameters in the ν9 Band of EthaneV. Malathy Devi, D. Chris Benner, C. P. Rinsland, M. A. H. Smith, R. L. Sams,
T. A. Blake, J.-M. Flaud, K. Sung, L. R. Brown, A. W. Mantz . . . . . . . . . . . 96
VIII-6. A THz Photomixing Synthesizer Based on a Fiber Frequency CombDedicated to High Resolution Spectroscopy of Atmospheric CompoundsA. Cuisset, F. Hindle, G. Mouret, C. Yang, S. Eliet, R. Bocquet . . . . . . . . . . 97
VIII-7. Toward a Global Model of Low-Lying Vibrational States of CH3CN:Overview and Interactions in the v4 = 1 State at 920 cm−1 with NearbyStatesH. S. P. Muller, B. J. Drouin, J. C. Pearson, L. R. Brown, I. Kleiner, R. L. Sams . . 98
Author Index . . . . . . . . . . . . . . . . . . . . . . . . . . . . . . . . . . . . 99
vii

viii

SESSION I: Databases-1
1
SESSION I: Databases-1 2
I-1. Spectroscopic Molecular Databases: Evolution
and Revolution
Laurence S. Rothman, Iouli E. Gordon
Harvard-Smithsonian Center for Astrophysics, Atomic and Molecular Physics Division,60 Garden St, Cambridge MA 02138, USA
We first present a brief summary of the status of the current molecular spectroscopicdatabases, HITRAN1 and HITEMP2. The means of access and the documentation arereviewed, and some successful simulation with the new editions are shown. Remarkson future developments of the content of the databases will be made. These develop-ments naturally include new molecules, more bands, line-shape parameters, and higheraccuracy. Finally, the direction for modernizing the structure of the database will bediscussed.
The databases are supported by the NASA Earth Observing System (EOS) under thegrant NAG5-13534 and the Planetary Atmospheres program under grant NNX10AB94G.
1Rothman LS, Gordon IE, Barbe A, Benner DC, Bernath PF, Birk M, et al. The HITRAN 2008molecular spectroscopic database. JQSRT 2009;110:533-72.
2Rothman LS, Gordon IE, Barber RJ, Dothe H, Gamache RR, Goldman A, Perevalov VI, TashkunSA, and Tennyson J. HITEMP, the high-temperature molecular spectroscopic database. JQSRT , InPress.

SESSION I: Databases-1 3
I-2. The GEISA Database 2009 Edition: Update
Description and Assessment of Spectroscopic
Parameters Through Hyperspectral Remote Sensing
Applications
N. Jacquinet, L. Crepeau, V. Capelle, N. Scott, R. Armante, A. Chedin
Laboratoire de Meteorologie Dynamique, Ecole Polytechnique, 91128 Palaiseau, France,http://ara.lmd.polytechnique.fr
The updated 2009 edition of GEISA1 (Gestion et Etude des Informations Spectro-scopiques Atmosphriques; Management and Study of Atmospheric Spectroscopic In-formation), a computer-accessible system comprising three independent sub-databasesdevoted respectively to: line transition parameters, infrared and ultraviolet/visible ab-sorption cross-sections, microphysical and optical properties of atmospheric aerosols willbe summarized. In this edition, 50 molecules are involved in the line transition parame-ters sub-database, including 111 isotopes, for a total of 3,807,997 entries, in the spectralrange from 10−6 to 35,877.031 cm−1.The successful performances of the new generation of hyperspectral sounders dependultimately on the accuracy to which the spectroscopic parameters of the optically activeatmospheric gases are known, since they constitute an essential input to the forward ra-diative transfer models that are used to interpret their observations. Currently, GEISA isinvolved in activities related to the assessment of the capabilities of IASI (Infrared Atmo-spheric Sounding Interferometer on board the METOP European satellite http://earth-sciences.cnes.fr/IASI) through the GEISA/IASI database2 derived from GEISA. Sincethe Metop (http://www.eumetsat.int) launch (October 19th 2006), GEISA/IASI is thereference spectroscopic database for the validation of the level-1 IASI data, using the4A radiative transfer model3 (4A/LMD http://ara.lmd.polytechnique.fr; 4A/OP co-developed by LMD and Noveltis http://www.noveltis.fr, with the support of CNES).Also, GEISA is involved in planetary research, i.e.: modelling of Titans atmosphere, inthe comparison with observations performed by Voyager, or by ground-based telescopes,and by the instruments on board the Cassini-Huygens mission.Highlights will be given on a selection of problems that pertains to current status ofthe line parameters affecting IASI hyperspectral remote sensing applications. A specialeffort has been given in the validation of the updated parameters and the evaluation ofthe subsequent impact on radiative transfer simulations. Results of comparisons ”calc-obs” based on IASI observations and 4AOP simulations will be presented.
1Jacquinet-Husson N., N.A. Scott, A. Chedin,L. Crepeau, R. Armante, V. Capelle, J. Orphal,A. Coustenis, C. Boonne, N. Poulet-Crovisier, et al. JQSRT, 109, 1043-1059, 2008.
2Jacquinet-Husson N., N.A. Scott, A. Chedin, K. Garceran, R. Armante, et al. JQSRT, 95, 429-67,2005.
3Scott, N.A. and A. Chedin, 1981. J. Appl. Meteor., 20,556-564

SESSION I: Databases-1 4
GEISA, continuously developed and maintained at LMD (Laboratoire de MeteorologieDynamique, France) since 1976, is implemented on the CNES/CNRS (France) ”Ether”Products and Services Centre WEB site (http://ether.ipsl.jussieu.fr), where all archivedspectroscopic data can be handled through general and user friendly associated man-agement software facilities. More than 350 researchers are registered for on line use ofGEISA.
SESSION I: Databases-1 5
I-3. Blended HITRAN and other Spectra Databases
for Modeling Emission-based LIDAR
Denis Plutov and Dennis K. Killinger
University of South Florida, Department of Physics, 4202 East Fowler Ave, PHY 114,Tampa, FL 33620
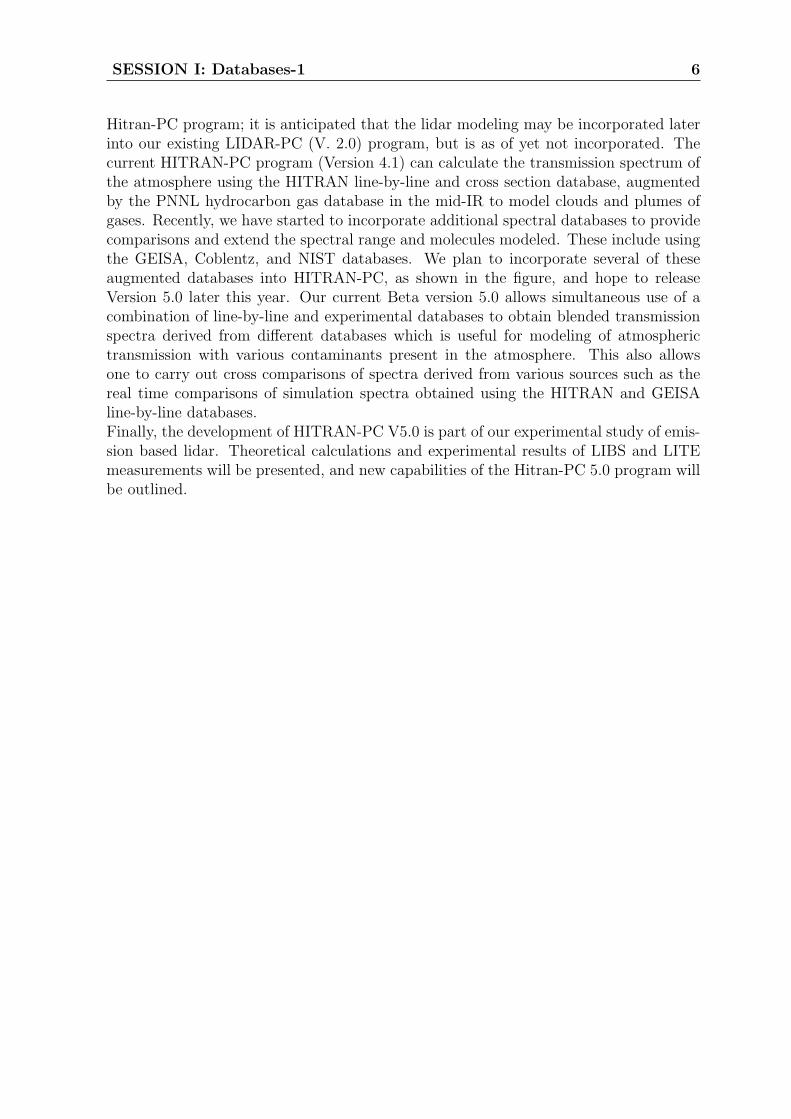
Emission based lidar is a stand-off laser remote sensing technique that uses the exci-tation laser to produce a spectral emission signature at a distant target that can bedetected and analyzed to determine the concentration and composition of the distanttarget. Examples of this technique include Laser-Induced-Thermal-Emission (LITE),Laser-Induced-Breakdown Spectroscopy (LIBS), and remote Raman Lidar, all of whichare being studied for the remote sensing of a wide range of target substances and chem-ical species. In order to study and successfully model these atmospheric remote sensinglidar techniques, we have developed a modeling approach used to predict the detectedpower and S/N as a function of detection range and wavelength which depends upon theuse of the HITRAN database augmented by other spectral databases in order to pre-dict the spectral transmission of the emission spectrum back toward the lidar telescopedetector system.
The modeling approach is summarized in the figure above, and is based on a modifiedone-way lidar equation that uses the atmospheric transmission spectra obtained with our
SESSION I: Databases-1 6
Hitran-PC program; it is anticipated that the lidar modeling may be incorporated laterinto our existing LIDAR-PC (V. 2.0) program, but is as of yet not incorporated. Thecurrent HITRAN-PC program (Version 4.1) can calculate the transmission spectrum ofthe atmosphere using the HITRAN line-by-line and cross section database, augmentedby the PNNL hydrocarbon gas database in the mid-IR to model clouds and plumes ofgases. Recently, we have started to incorporate additional spectral databases to providecomparisons and extend the spectral range and molecules modeled. These include usingthe GEISA, Coblentz, and NIST databases. We plan to incorporate several of theseaugmented databases into HITRAN-PC, as shown in the figure, and hope to releaseVersion 5.0 later this year. Our current Beta version 5.0 allows simultaneous use of acombination of line-by-line and experimental databases to obtain blended transmissionspectra derived from different databases which is useful for modeling of atmospherictransmission with various contaminants present in the atmosphere. This also allowsone to carry out cross comparisons of spectra derived from various sources such as thereal time comparisons of simulation spectra obtained using the HITRAN and GEISAline-by-line databases.Finally, the development of HITRAN-PC V5.0 is part of our experimental study of emis-sion based lidar. Theoretical calculations and experimental results of LIBS and LITEmeasurements will be presented, and new capabilities of the Hitran-PC 5.0 program willbe outlined.
SESSION I: Databases-1 7
I-4. Calculating the Spectroscopic Behaviour of Hot
Molecules
Jonathan Tennyson
Department of Physics and Astronomy, University College London, London, WC1E6BT, UK
Spectroscopic information on hot or highly excited molecules is vital for many applicationboth in our own atmosphere and in astrophysics. Since the number of lines requiredfor modelling the spectrum of a small molecule such as water increases hugely as thetemperature rises; it is not possible to obtain all the data necessary from directly fromlaboratory measurements.
My group is systematically calculating linelists of rotation-vibration transitions forhot molecules. Our BT2 linelist1 for water forms part of the input for the 2010 editionof HITEMP2, which also includes data on CO2, CO, NO and OH. We have recentlycomplete a companion linelist for hot HDO3.
Our recent focus has been on ammonia for which room temperature4 and hot5 linelistshave been completed. These data are being used in astrophysical applications particu-larly to do with extrasolar planets and brown dwarfs. Comparisons with HITRAN forammonia suggests that the current database has significant omissions, errors and, as iswell-known, many unassigned lines. We have started systematically working throughthese problems and have so far re-assigned some 900 transitions.
A summary of our vibration-rotation data for hot molecules can be found at exo-mol.com.
1R. J. Barber, J. Tennyson, G. J. Harris and R. N. Tolchenov, Mon. Not. R. Astr. Soc., 368, 1087(2006).
2Rothman LS, Gordon IE, Barber RJ, Dothe H, Gamache RR, Goldman A, Perevalov VI, TashkunSA, and Tennyson J. HITEMP, the high-temperature molecular spectroscopic database. JQSRT , InPress.
3B.A. Voronin, J. Tennyson, R.N. Tolchenov, A.A. Lugovskoy and S.N. Yurchenko, Mon. Not. R.astr. Soc., 402, 492 (2010).
4S.N. Yurchenko, R.J. Barber, A. Yachmenev, W. Theil, P. Jensen and J. Tennyson, J. Phys. Chem.A, 113, 11845 (2009).
5S.N. Yurchenko, R.J. Barber and J. Tennyson, Mon. Not. R. Astr. Soc., to be submitted.
SESSION I: Databases-1 8
I-5. High-Accuracy Ab Initio Water Line Intensities
L. Lodi
University College London, Department of Physics and Astronomy, London UK
Radiation transport in our atmosphere is dominantly determined by the behaviourof the water molecule. The way water absorbs and emits light is crucial in many otherregimes and is surprisingly complex to either measure or model. More specifically, waterline intensities vary by 10 orders of magnitude for atmospherically important transitionsand have proved difficult to measure with complete reliability.
Rotation-vibrational spectra of molecules may be determined in a completely abinitio fashion from the principles of quantum mechanics. This entails solving in twosteps for the motions of the electrons and then of the nuclei; for a three-atom system itis the first step that determines the overall accuracy of computed rotational-vibrationalline positions and intensities.
We used UCL’s supercomputer Legion1 and the quantum-chemistry package mol-pro2 to perform the most extensive and accurate electronic structure calculation onwater ever, producing a new, extremely accurate dipole moment surface (dms) and acompanion potential energy surface (pes).
The electronic-structure method used is ic-mrci+q (Internally-Contracted Multi-Reference Configuration-Interaction with Davidson correction) in an 8-electron, 10-orbital active space and the aug-cc-pCVnZ, (n=Q,5,6) basis sets. All 10 electrons werecorrelated. Relativistic corrections were also computed via the Pauli Hamiltonian. Thevalue of the dms was calculated for a large set of about 2,600 geometries as the derivativeof the energy with respect to an external, very weak electric field. This procedure resultsin a total number of runs which is five times the number of geometries, for a total of≈13000 runs. On a single workstation the total computation would take more than 25years, whence the need to use parallel computers.
The purpose of these calculations is twofold. First, we wish to map the water pesall the way to break-up of the molecule. This will allow us to extend our theoreticalmodelling of novel experiments recently completed in Lausanne3. The second majorobjective is to use our new dms to determine nearly all medium-to-strong water lineintensities (I ' 10−24 cm/molecule) and about 90% of weaker lines (10−28 / I / 10−24)
1The system comprises 1280 Intel Xeon 5160 3 GHz dual-core CPUs (2560 cores total), 11 TB ofRAM and 320 TB of storage space.
2molpro, version 2009.1, a package of ab initio programs, H.-J. Werner, P. J. Knowles, R. Lindh,F. R. Manby, M. Schutz, and others, see http://www.molpro.net .
3M. Grechko, O. V. Boyarkin, T. R. Rizzo et al., State-selective spectroscopy of water up to its firstdissociation limit, J. Chem. Phys., 131, 221105 (2009)

SESSION I: Databases-1 9
with an error better than ±1%. Comparison with recent, ultra-high accuracy exper-iments4 indicates that this ambitious objective is achievable. The intensities of somespectroscopic lines, so-called ‘resonances’, are extremely sensitive to the dms employedand cannot be reliably calculated with the same degree of accuracy. Resonances wereidentified by comparing line intensities produced using different sets of nuclear-motionwave functions.
Together with experimentally-based line positions and energy levels obtained bythe marvel strategy5, our studies hold the promise to significantly improve standarddatabase compilations of water transitions including HITRAN6.
4D. Lisak, D. K. Havey and J. T. Hodges, Spectroscopic line parameters of water vapor for rotation-vibration transitions near 7180 cm−1, Phys. Rev. A, 79, 052507 (2009)
5J. Tennyson J, P. F. Bernath, L. R. Brown et al., IUPAC critical evaluation of the rotational-vibrational spectra of water vapor. Part I-Energy levels and transition wavenumbers for (H2O)-O-17and (H2O)-O-18, J. Quant. Spect. Rad. Transf., 110, 573-596 (2009)
6L. S. Rothman, I. E. Gordon, A. Barbe et al., The HITRAN 2008 molecular spectroscopic database,J. Quant. Spect. Rad. Transf., 110, 533-572 (2009)

SESSION I: Databases-1 10
I-6. CDSD-4000: High-Temperature Spectroscopic
CO2 Databank
Sergey A. Tashkun and Varery I. Perevalov
Laboratory of Theoretical Spectroscopy, V.E. Zuev Institute of Atmospheric Optics,634021, Tomsk, RUSSIA
A high-temperature version of the Carbon Dioxide Spectroscopic Databank calledCDSD-4000 is presented. Reference temperature of the bank is 4000 K and an intensitycutoff is 10−27 cm/molecule. CDSD-4000 is an enlarged and improved version of theCDSD-1000 databank 1 and it will be included into the HITEMP database 2. Thedatabank is aimed at industrial and astrophysical applications. A number of comparisonsof measured high-temperature spectra with those simulated using CDSD-4000 will bediscussed.
This work is supported by a RFBR grant 09-05-93105. SAT acknowledges financialsupport from a joint RFBR (09-05-92508) and CRDF (RUG1-2954-TO-09) grant.
1S. A. Tashkun, V. I. Perevalov, J. L. Teffo, A. D. Bykov and N. N. Lavrentieva JQSRT 82, 165(2003)
2L. S. Rothman, I. E. Gordon, R. J. Barber, H. Dothe, R. R. Gamache, A. Goldman, V. I. Perevalov,S. A. Tashkun, J. Tennyson JQSRT, in press (2010)

SESSION II: Remote Sensing
11
SESSION II: Remote Sensing 12
II-1. Line Parameters and Forward Calculation for
Retrieving Carbon Dioxide and Methane from
GOSAT Data
Tatsuya Yokota,a Yukio Yoshida,a Isamu Morino,a Nobuhiro Kikuchib
aCGER, National Institute for Environmental Studies (NIES), Tsukuba, 305-8506Japan
bFujitsu FIP Co. @GOSAT DHF, NIES, 305-8506 Japan
Greenhouse gases Observing SATellite (GOSAT) was successfully launched on Jan-uary 23, 2009. GOSAT Level 2 data products (versions 00.50 and 00.80) of carbondioxide and methane have been distributed to general users since February 18, 2010.Column abundances of carbon dioxide from 1.6 micron band are retrieved by usingline parameters of HITRAN 2008 database. Column abundances of methane from 1.67micron band are retrieved by using line parameters of Lyulin et al. (2009). We arenow improving the retrieval method by using GOSAT oxygen A-band spectral data aswell as carbon dioxide 1.6 and 2.0 micron bands by adopting a line mixing methodsdeveloped by J.-M. Hartman’s group. GOSAT data retrieval status, known issues, andimprovement plan of the retrieval algorithm will be also presented.
SESSION II: Remote Sensing 13
II-2. MIPAS: New Results and Spectroscopy Issues
Johannes Orphal, Johannes Plieninger, Michael Hoepfner, Gabriele Stiller,Thomas von Clarmann, Norbert Glatthor, Udo Grabowski, Sylvia
Kellmann, Michael Kiefer, and Andrea Linden
Institute for Meteorology and Climate Research (IMK), Karlsruhe Institute ofTechnology (KIT), Karlsruhe, Germany
The MIPAS instrument on the European ENVISAT satellite was launched in March2002 and has already produced over 8 years of scientific data. MIPAS is an infrared limb-emission sounder (Fourier-transform spectrometer) covering the spectral range from 4.15to 14.6 microns with over 50000 spectral elements. The MIPAS data have been used inmany scientific studies of atmospheric chemistry and dynamics. Here, we will presentresults obtained recently at IMK, like the first detection of bromine nitrate (BrONO2) inthe stratosphere in 2009, and the discovery of a “tape recorder” effect of isotopic water(HDO) in 2010. We will then discuss some issues related to the quality of spectroscopicreference data.
SESSION II: Remote Sensing 14
II-3. The Atmospheric Chemistry Experiment,
ACE: Status and Spectroscopic Issues
P. F. Bernath
Department of Chemistry, University of York, Heslington, York, YO10 5DD, UK
The Canadian ACE (Atmospheric Chemistry Experiment) mission has a high res-olution (0.02 cm−1) Fourier transform spectrometer (FTS) in low earth orbit. Theprimary ACE mission goal is the study ozone chemistry in the stratosphere althoughit is making a wide range of other measurements, for example, of organic moleculesin the troposphere. A status report will be presented with an overview of a numberof current science topics. For example, the rapid transport of pollution into the up-per troposphere and lower stratosphere by the Asian monsoon [Randel et al., Science328, 611 (2010)] will be discussed. New laboratory measurements of infrared absorp-tion cross sections of organics as well as ACE retrievals will be covered. An ACE solaratlas in the 750–4400 cm−1 spectral region [Hase et al., JQSRT 111, 521 (2010), seehttp://www.ace.uwaterloo.ca/solaratlas.html] has been prepared and a set of 5 highsignal-to-noise atmospheric atlases will be described.
SESSION II: Remote Sensing 15
II-4. Spectroscopy for the Atmospheric Chemistry
Experiment (ACE)
Chris Boone,a Peter Bernatha,b
aDepartment of Chemistry, University of Waterloo, 200 University Ave West,Waterloo, Ontario, Canada, N2L 3G1
bDepartment of Chemistry, University of York, Heslington, York, UK, YO10 5DD
The Atmospheric Chemistry Experiment (ACE) is a satellite mission for remotesensing of the Earth’s atmosphere. The primary instrument on board is a high res-olution (0.02 cm−1) Fourier transform spectrometer (FTS) operating in the infrared(750-4400 cm−1). Launched in August 2003, the mission has been in operation for morethan six years. The search for weak spectral signatures in the FTS spectra (e.g., fromhydrocarbons or CFCs/HCFCs/HFCs) is often hampered by deviations from the Voigtline shape for molecules such as CH4 and H2O. Investigations into line mixing and speeddependence in the line shapes of these molecules from the ACE FTS spectra will bedescribed. Spectroscopic needs for the ACE mission will also be discussed.
SESSION II: Remote Sensing 16
II-5. Spectroscopic Issues in the Data Analysis of
REFIR-PAD Measurements Performed During the
2009 Ground-Based Campaigns
Giovanni Bianchini, Luca Palchetti
Consiglio Nazionale delle Ricerche, Istituto di Fisica Applicata “Nello Carrara”, ViaMadonna del Piano 10, 50019 Sesto Fiorentino, Italy.
The REFIR-PAD (Radiation Explorer in the Far-InfraRed - Prototype for Appli-cations and Development) spectroradiometer is capable to perform spectrally resolvedatmospheric radiance measurements in the 100-1400 cm−1 spectral range, with a nominalresolution of 0.5 cm−1.
The REFIR-PAD instrument during 2009 took part to two ground-based campaigns:between 22nd and 29th of April, 2009 from the ARM Pagosa Springs Staging Facility(2329 m a.s.l., Colorado, USA), and between August and October 2009 from Cerro Toco,in the Chilean Andes (5383 m a.s.l.). During these campaigns the instrument performedmeasurements in a widely varying range of atmospheric conditions, with total watervapor column amounts from 0.25 mm to about 1 cm, in clear sky conditions and inpresence of thin cirrus clouds.
REFIR-PAD measured downwelling long-wave radiation (DLR) spectra were ana-lyzed through a retrieval code based on the LBLRTM version 11.7 forward model (withAER version 2.4 spectral database) and the MINUIT function minimization routinesavailable from CERN.
The choice of atmospheric variables to be fitted has been optimized keeping intoaccount the sensitivity of zenith-looking radiance spectra to atmospheric physical pa-rameters, obtained from the Jacobian matrices of the DLR. The set of variables obtainedwith this procedure includes cloud optical depth, and 4 points at selected altitudes forthe water vapor and temperature vertical profiles. The atmospheric profiles used in theretrieval are then obtained rescaling the initial guess profile above the higher point, andlinearly interpolating the profile between the fitted points.
The main atmospheric parameter that can be retrieved from the DLR spectra isthe total precipitable water vapor (PWV), to which the instrument has the maximumsensitivity, with relative errors generally lesser than 10% and typically of the order of5%. Further information about water vapor distribution with height can be extractedfrom the 4 fitted levels.
While residuals from a single fit are generally in good agreement with the measure-ment uncertainty, the averaging of fitting residuals on the timescale of a measurementday (about 20-30 spectra) shows interesting spectral features that are above uncertaintyand can be used to refine water vapor continuum model and spectroscopy, in particularin the far-infrared region.
SESSION II: Remote Sensing 17
II-6. Polar Mesospheric Clouds and Cosmic Dust:
Three Years of SOFIE Measurements
Martin McHugh, Mark Hervig, Larry Gordley, Lance Deaver
GATS Inc., 11864 Canon Blvd., Suite 101, Newport News, VA 23606, USA
The Solar Occultation for Ice Experiment (SOFIE), aboard the Aeronomy of Ice inthe Mesosphere (AIM) satellite, has been collecting atmospheric transmittance measure-ments in the polar mesopause region since May 2007. These measurements are used toretrieve vertical profiles of water vapor, ozone, methane, carbon dioxide, nitric oxide,temperature, and polar mesospheric cloud (PMC) extinction. Additionally, SOFIE hasprovided the first satellite observations of meteoric smoke in the middle atmosphere.This data set has revealed interesting new details about the formation, characteristicsand variability of PMCs, with temperature and water vapor identified as critical factorsin explaining cloud variability. For example, the unusually early onset of the 2009-2010cloud season in the southern hemisphere has been linked to colder temperatures andenhanced water vapor concentrations. Also, SOFIE observations of meteoric smoke par-ticles indicate reduced smoke abundance during polar summer when PMCs are present.While the observed smoke variations are in agreement with model predictions, questionsremain about the exact connection between PMCs and smoke. In this presentation wedescribe the SOFIE instrument and the science retrieval algorithms, and highlight someof the recent findings from these data.

SESSION II: Remote Sensing 18
II-7. LBL Models: State of the Art and Perspective
B. A. Fomin
Central Aerological Observatory (CAO), 3 Pervomayskaya st., Dolgoprudny, MoscowRegion, 141700 RUSSIA
I present the current version of the Fast Line-By-Line Model (FLBLM) aimed atvalidations of radiation codes for climate models and remote sensing. In this version areused the HITRAN- 2008 database and the MT CKD-2.1 water vapor continuum modelsand can be taken into account the non-LTE and Line-Mixing effects by means of a pair ofindependent methods. Then spectroscopic parameters and models required by radiative-transfer modeling as well as effect of their recent improvement on LBL calculation arediscussed. Also is considered state of the art of radiative-transfer modeling by means ofthe latest intercomparisons of radiation codes. Finally perspective of application of theLBL models to remote sensing, climate problems and education is discussed. This workwas supported by grants from RFBR (08-01-00024 and 09-01-00071, Russia).

SESSION III: LaboratorySpectroscopy-1
19
SESSION III: Laboratory Spectroscopy-1 20
III-1. The Absorption Spectrum of Methane
Between 1.27 and 1.71 µm By High Sensitivity
CRDS at 80 K and 300 K. Importance of the CH3D
Contribution in the 1.58 µm Transparency Window
Samir Kassi, Le Wang and Alain Campargue
Laboratoire de Spectrometrie Physique (CNRS, UMR 5588), Universite Joseph Fourierde Grenoble, BP 87, 38402 Saint-Martin-d’Heres Cedex, France
The high resolution absorption spectrum of methane has been recorded between 1.27and 1.71 µm by high sensitivity laser absorption spectroscopy at room temperatureand at 80 K. In the high absorbing regions surrounding the transparency window at1.58 µm, the spectra at 80 K were obtained by differential absorption spectroscopyusing a specifically designed cryogenic cell and several tens DFB diode lasers 1. Thisexperimental approach provided a sufficient sensitivity (αmin ∼ 10−6cm−1) in the highenergy part of the tetradecad (5850 - 6180 cm−1) 1,2,3 and in the icosad region (6700 -7700 cm−1) 4,5,6. In the 1.58 µm transparency window corresponding to the 6165 -6750 cm−1 gap, a much higher sensitivity was achieved by combining the CW-CRDStechnique with the same cryogenic cell7. The sensitivity achieved at 80 K and roomtemperature (αmin ∼ 3 × 10⁻¹⁰cm−1) allowed measuring line intensities as weak as3 × 10−29 cm/molecule i.e. three orders of magnitude smaller than the intensity cutoff of the HITRAN line list of methane. Of importance for planetary applications, isthe observed important temperature variation of the transmission in the transparencywindow 8,9.
A list of more than 28000 transitions with intensity as weak as 1×10⁻²⁹ cm/moleculewas constructed from the recordings at 296 and 80 K. The low energy values of thetransitions observed both at 80 K and at room temperature were systematically derivedfrom the variation of their line intensities1−9. The quality of the obtained empirical low
1S. Kassi, B. Gao, D. Romanini, A. Campargue, Phys. Chem. Chem. Phys. 10 (2008) 4410.2B. Gao, S. Kassi, A. Campargue, J. Mol. Spectrosc. 253 (2009) 55.3L. Wang, S. Kassi, A. Campargue, J. Quant. Spectrosc. Radiat. Transfer. 111 (2010) 1130.4E. Sciamma-O’Brien, S. Kassi, B. Gao, A. Campargue, J. Quant. Spectrosc. Radiat. Transfer. 110
(2009) 951.5A. Campargue, Le Wang, S. Kassi, M. Masat, O. Votava, J. Quant. Spectrosc. Radiat. Transfer.
111 (2010) 1130.6O. Votava, M. Masat,P. Pracna, S. Kassi, A. Campargue, Phys. Chem. Chem. Phys. 12 (2010)
3145.7S. Kassi, D. Romanini, A. Campargue, Chem. Phys. Lett. 477 (2009) 17.8L. Wang, S. Kassi, A. W. Liu, S. M. Hu, A. Campargue, J. Mol. Spectrosc. in press
http://dx.doi.org/10.1016/j.jms.2010.02.005.9A. Campargue, L. Wang, A. W. Liu, S. M. Hu, S. Kassi, Chem. Phys. Submitted
SESSION III: Laboratory Spectroscopy-1 21
energy values is demonstrated by the marked propensity of the empirical low J valuesof CH4 to be close to integers. The line lists associated to the low energy values allowaccounting for most of the temperature dependence of methane absorption between thesetwo temperatures.
In the 1.58 µm transparency window, a number of CH3D transitions were identifiedby comparison with a spectrum of CH3D recorded separately by Fourier TransformSpectroscopy. From simulations of the CH3D and methane spectra at low resolution,the CH3D isotopologue has be found to contribute by up to 30% of the absorption inthe region. In view of future applications, we point out the importance of taking intoaccount the variation of the CH3D/CH4 relative abundance according to the studiedabsorption medium in order to satisfactorily account for the methane transmission inthe considered transparency window8,9.
SESSION III: Laboratory Spectroscopy-1 22
III-2. The 4ν3 Spectral Region of Methane
D. Chris Benner,a V. Malathy Devi,a J. J. O’Brien,b S. Shaji,b
P. T. Spickler,c C. P. Houck,c J. A. Coakley,c Kasie J. Hagac
aDepartment of Physics, College of William and Mary, Williamsburg, VA 23187-8795
bDepartment of Chemistry and Biochemistry, University of Missouri - St. Louis,St. Louis, MO 63121-4400
cDepartment of Physics, Bridgewater College, Bridgewater, VA 22812
The near infrared bands of methane were the first observed in the outer planets andTitan. In this spectral region very long paths within the atmospheres of these objectsmake scattering and pressure and temperature inhomogeneities important. The spec-trum is complex, and long absorption paths in the laboratory are difficult to cool to outersolar system temperatures. At room temperature many significant spectral lines appearper Doppler width, so the absorption is usually modeled statistically using unrealistic as-sumptions. These models generally do not provide transmissions that are multiplicative,so scattering and inhomogeneous atmospheres cannot be properly modeled.
The intracavity laser spectrometer at the University of Missouri-St. Louis was usedto obtain low temperature (99-161K), low pressure (0.12-7.13 Torr), long path (3.14-5.65km) and high resolution ( 0.01 cm−1 HWHM) spectra of methane covering the entire890nm feature (10925-11500 cm−1), the deepest band in the CCD spectral region. Atthese temperatures the spectral lines originating from higher energy levels are not visible,and the Doppler width is substantially smaller than at room temperature. The resultis a dense, but manageable spectrum from which line positions, intensities and lowerstate energies are derived on a line by line basis by the College of William and Marymultispectrum nonlinear least squares fitting program1. The results allow the simulationof the methane spectrum at infinite resolution at temperatures less than ∼160K, evenfor complex atmospheric paths.2
1D. Chris Benner, C. P. Rinsland, V. M. Devi, M. A. H. Smith, and D. A. Atkins, JQSRT 1995;53:705-21.
2Support for the work at William and Mary was provided by NASA through grant NNX08AF06G.Support for the work at UM-St. Louis provided by NASA through grant NAG5-12013, from NSFthrough grant CHE-0213356 and by the University of Missouri Research Board. Partial Support forthe work at Bridgewater College was provided from an AAS Small Research Grant.
SESSION III: Laboratory Spectroscopy-1 23
III-3. Line Strengths and Self-Broadening of Pure
Rotational Lines of Carbon Monoxide and Nitrous
Oxide Measured by Terahertz Time-Domain
Spectroscopy.
W. Aenchbacher1,a M. Naftaly,b R. Dudleyb
aDrexel University, Dept. of Electrical and Computer Engineering, Philadelphia, PA19103, USA
bNational Physical Laboratory, Hampton Road, Teddington, Middlesex TW11 0LW, UK
Terahertz time-domain spectroscopy was used to obtain the line intensities and self-broadening parameters of pure rotational lines of CO and N2O. The technique yields adirect measurement of an absorption spectrum from 0.2 THz to 3 THz, which is linear inamplitude, therefore allowing the profiles of multiple lines to be observed and quantified.The transitions studied in CO were from J ′ = 3← 2 to J ′ = 22← 21, and in N2O fromJ ′ = 9← 8 to J ′ = 52← 51. The gas spectra were measured at elevated pressures in therange of 0.7-5 bar for CO and 0.7-1.7 bar for N2O. The measured absorption spectra wereanalyzed assuming a Lorentzian lineshape and using a multiple-peak fitting procedure.The obtained values of the line intensities and self-broadening parameters are in goodagreement with the HITRAN database.
SESSION III: Laboratory Spectroscopy-1 24
III-4. Submillimeter-Wave and Far-Infrared
Spectroscopy of High-J Transitions of Ammonia
Shanshan Yu,a John C. Pearson,a Brian J. Drouin,a and Keeyoon Sunga,Olivier Pirali,b Michel Vervloet,b Marie-Aline Martin,b Christian P. Endres,c
Tetsuro Shiraishi,d Kaori Kobayashi,d and Fusakazu Matsushimad
aJet Propulsion Laboratory, California Institute of Technology, Pasadena, California91109, USA
bLigne AILES–Synchrotron SOLEIL, L’Orme des Merisiers Saint-Aubin, 91192Gif-sur-Yvette, France
cI. Physikalisches Institut, Universitat zu Koln, 50937 Koln, Germany
dDepartment of Physics, University of Toyama, Gofuku, Toyama 930-8555, Japan
Ammonia has large-amplitude inversion motion, which makes it particularly nonrigid and difficult to model with quantum mechanics. Additionally, the excited inversionstates couple strongly to other vibrational modes resulting in a very complex spectrum.Current experimental dataset have been limited to low quantum numbers (J of about20), and the spectrum of ammonia in many vibrational states has defied analyses toexperimental accuracy. The previous attempt at a global analysis of the v2 = 2 andv4 = 1 states ignored the available 2v2 − v4 microwave data and achieved a standarddeviation of 0.003 cm−1,12 which is an order of magnitude larger than experimental ac-curacy. There is only one available analysis on the v1 and v3 fundamental bands,3 andthe standard deviation of the fit (0.085 cm−1) was about two hundred times larger thanthe experimental line position uncertainty (about 0.0005 cm−1).
Ammonia has been observed in the interstellar medium up to J = 18 and morehighly excited transitions are expected to appear in hot exoplanets and brown dwarfs.Modeling exoplanet atmospheres and brown dwarf stars with relatively high tempera-tures (1000-3000K) requires consideration of ammonia hot bands to model the flux fromthese objects. As a result, there is a large effort to assign the high J spectrum. Thereis ongoing ab initio work at NASA Ames and University College London to create a fullpotential surface. Currently, ab initio calculations are available for levels up to J = 20but these remain untested in 2v2 and v4 above J = 15.
1C. Cottaz, I. Kleiner, G. Tarrago, L.R. Brown, J.S. Margolis, R.L. Poynter, H.M. Pickett, T.Fouchet, P. Drossart, and E. Lellouch, J. Mol. Spectrosc. 203, 285 (2000).
2H. Sasada, Y. Endo, E. Hirota, R.L. Poynter, and J.S. Margolis, J. Mol. Spectrosc. 151, 33 (1992).3I. Kleiner, L.R. Brown, G. Tarrago, Q.-L. Kou, N. Picque, G. Guelachvili, V. Dana, and J-Y.
Mandin, J. Mol. Spectrosc. 193, 46 (1999).
SESSION III: Laboratory Spectroscopy-1 25
In this work, numerous spectroscopic techniques were employed to study its high Jtransitions in the ground, v2 = 1, 2 and v4 = 1 states. Measurements were carried outusing a frequency multiplied submillimeter spectrometer at JPL, a tunable far-infraredspectrometer at University of Toyama, and a high resolution Bruker IFS 125 Fouriertransform spectrometer at Synchrotron SOLEIL. Highly excited ammonia was observedwith a radio frequency discharge and a DC discharge, which allowed assignments of tran-sitions with J up to 35. 177 ground state and v2 = 1 inversion transitions were observedwith microwave accuracy in the 0.3-4.7 THz region. Of these, 125 were observed forthe first time, including 26 ∆K = 3 transitions. Over 2000 far-infrared transitions wereassigned to the ground state and v2 = 1 inversion bands as well as the v2 fundamentalband. Of these, 1912 were assigned for the first time, including 222 ∆K = 3 transitions.The accuracy of these measurements has been estimated to be 0.0003 to 0.0006 cm−1.A reduced RMS of 0.9 was obtained for a global fit of the ground and v2 = 1 states,which includes the lines assigned in this work and the previously available microwave,terahertz, far-infrared and mid-infrared data. A global analysis of the ground, v2 = 1, 2and v4 = 1 states is still in progress, and we will present the most recent fitting resultsto date.

SESSION III: Laboratory Spectroscopy-1 26

Poster Session 1
27
Poster Session 1 28
PI-1. Study of H216O Line Intensities around 8800
cm−1
C. Oudot,a L. Regalia,a L. Daumont,a X. Thomas,a P. Von Der Heyden,a
D. Decatoire,a Le Wangb
aGroupe de Spectrometrie Moleculaire et Atmospherique, UMR 6089, Faculte dessciences, BP 1039, 51687 REIMS CEDEX2 - FRANCE
bLaboratoire de Spectrometrie Physique 140 Avenue de la Physique- BP87 38 SaintMartin d’Heres-France
A precise knowledge of spectroscopic parameters for atmospheric molecules is neces-sary for the control and the modeling of the Earth’s atmosphere. The water vapor playsa special role as it participates to the global radiative balance of the atmosphere.
Our laboratory (GSMA) is engaged since many years in the study of H216O vapor
and its isotopologues. The work presented here is a part of a huge work being performedin the range between 6600 and 9300 cm-1 which should complete the systematic studyof natural abundance water vapor from 4200 to 26 000 cm−1.1,2,3. We focused on thelines around 8800 cm−1. In the HITRAN database, data reported for this region is takenfrom the work of Mandin (1988)4,5 and several articles pointed out problems on the lineintensities.
Several spectra were recorded with the GSMA Fourier Transform Spectrometer,6
using sample of water vapor in natural abundance and with absorption path length of 4m up to 1200 meters.
Our new intensity measurements have been compared to the HITRAN20087 databaseand recent literature data8.
1M. Carleer et al, J. Chem. Phys, 111 (1999) 2444.2M.-F. Merienne et al, JQSRT, 82 (2003) 99.3A. Jenouvrier et al, JQSRT, 105 (2007) 326.4J.-Y. Mandin et al, Can. J. Phys, 66 (1988) 997.5J.-Y. Mandin et al, J. Mol. Spectrosc, 132 (1988) 352.6L. Regalia et al, JQSRT, 111 (2010) 826.7L. S. Rothman et al, JQSRT, 109 (2009) 139.8R. Tolchenov and J. Tennyson, J. Mol. Spectrosc, 231 (2005) 23.
Poster Session 1 29
PI-2. Line List of HD18O Rotation-Vibration
Transitions for Atmospheric Applications
Semen N. Mikhailenko,a Olga V. Naumenko,a Sergey A. Tashkun,a
An-Wen Liu,b Shui-Ming Hub
aLaboratory of Theoretical Spectroscopy, V.E. Zuev Institute of Atmospheric Optics,634021, Tomsk, RUSSIA
bHefei National Laboratory for Physical Sciences at Microscale, University of Scienceand Technology of China, Hefei, CHINA
The HD18O molecule was detected recently in the upper Earths atmosphere 1. Wepresent and discuss a line list of HD18O aimed at atmospheric applications. The linelist is based on the theoretical line list by Partridge and Schwenke 2, 3 and experimentalenergy levels 4, 5. Rotation-vibration spectrum of HD18O, taking into account the naturalconcentration of this molecule (6.23*10−7) and intensity cutoff of 10−30 cm/molecule at296 K., covers the 0-14 000 cm−1 spectral region.
This study was supported by Grant nos. 06-03-3914 and 10-0591176 of RFBR (Rus-sia) and by Grant nos. 20903085 and 10574124 of NSFC (China). Work of SNM and SATwas also partly supported by CRDF (USA) Grant RUG1-2954-TO-09 and by RFBR.Grant 09-05-92508.
1Z. Zelinger et al., Molecular Physics, 104, 2815, (2006).2H. Partridge and D. W. Schwenke, J.Chem.Phys 106, 4618 (1997).3D. W. Schwenke and H. Partridge, J.Chem.Phys 113, 6592 (2000).4S. N. Mikhailenko et al., JQSRT, 110, 597 (2009).5S. N. Mikhailenko et al., The 65th International Symposium on Molecular Spectroscopy, OSU,
Columbus, Ohio, USA, June 21-25 2010.

Poster Session 1 30
PI-3. SMPO Line List of 16O3 in the Range
6000-7000 cm−1
.
M.-R. De Backer-Barilly,a S.N. Mikhailenko,b A. Campargue,c
Vl. G. Tuyterev,a A. Barbe,a S. Kassic
aGroupe de Spectrometrie Moleculaire et Atmospherique, U.M.R. CNRS 6089,Universite de REIMS, Moulin de la Housse, B.P. 1039, 51687 REIMS cedex 2,
FRANCE
bLTS, Institute of Atmospheric Optics, 634055 TOMSK, RUSSIA
cLaboratoire de Spectrometrie Physique, U.M.R. CNRS 5588, Universite JosephFourier B.P. 87, 38402 Saint Martin d’Heres cedex, FRANCE
Since 2004, the high energy levels (>6000 cm−1) of 16O3 have been investigatedthanks to the CW-CRDS technique developped in Grenoble. The spectra have beenanalysed in Reims. Up to now, 22 bands have been assigned in the 6000-7000 cm−1
spectral range. This represents 7315 observed transitions corresponding to 3863 energylevels. All the studies have been published.
From Hamiltonian and dipole moment models, all the observed transitions are cal-culated allowing to generate line lists. But the rms of the fits are larger than theexperimental accuracy, due to the difficulty of modelling these high energy levels.
In these conditions, the calculated transitions reported in the line lists are replacedby the “calculated ones” replacing the upper state energy levels by those derived fromthe observations.
The line lists concerned with this spectral range will be introduced in the SMPOdatabase devoted to the ozone molecule.
This work is financially supported by VAMDC EU Project.
Poster Session 1 31
PI-4. CRDS of 16O3 in the Range 7000-8000 cm−1 :
First Rovibrational Assignments of the ν1+2ν2+5ν3
(7130 cm−1), 6ν1+ν3 (7442 cm−1), 5ν1+2ν2+ν3
(7579 cm−1), and ν1+3ν2+5ν3 (7686 cm−1) Bands.
S. Kassi,a A. Barbe,b M.-R. De Backer-Barilly,b Vl. G. Tuyterev,b
A. Camparguea
aLaboratoire de Spectrometrie Physique, U.M.R. CNRS 5588, Universite JosephFourier B.P. 87, 38402 Saint Martin d’Heres cedex, FRANCE
bGroupe de Spectrometrie Moleculaire et Atmospherique, U.M.R. CNRS 6089,Universite de REIMS, Moulin de la Housse, B.P. 1039, 51687 REIMS cedex 2,
FRANCE
The high resolution CRDS spectra of 16O3 have been recorded from 7000 to 7900cm−1. In this newly investigated spectral range, thousands of lines were detected. An-other difficulty of the analysis is the large number of cold bands predicted in this spectralrange : sixty two 1 as the dissociation of ozone is low (8000 cm−1), difficulty due to theabsence of band intensities predictions. Up to now, we have assigned 4 A-type bandseasily recognizable to their shape, with compressed R branch. They are:
ν1+2ν2+5ν3 at 7130 cm−1, 219 transitions assigned, with Jmax=29, Kamax=8,
6ν1+ν3 at 7442 cm−1, 38 transitions assigned, with Jmax = 17, Kamax= 3,
5ν1+2ν2+ν3 at 7579 cm−1, 138 transitions assigned, with Jmax = 22, Kamax=4,
ν1+3ν2+5ν3 at 7686 cm−1, 172 transitions assigned, with Jmax = 26, Kamax=4.
For each of these bands, we present the preliminary results for Hamiltonian and dipolemoment parameters, the statistics of the fits, comparisons with theoretical predictionsof band centers and rotational constants. We have generated line-lists of calculatedtransitions, in which calculated energy levels have been replaced by “observed ones”.Several examples of agreement between observed spectra and synthetic ones are shown.
This work is financially supported by VAMDC EU Project.
1Vl.G. Tyuterev, S.A. Tashkun, H. Seghir, SPIE Proceedings , 5311, 164-175, (2004).
Poster Session 1 32
PI-5. High Sensitivity CRDS of the a1∆g←X3Σ−gBand of Oxygen near 1.27 µm: Magnetic Dipole and
Electric Quadrupole Transitions in Different Bands
of Six Isotopologues
S. Kassi,a O. M. Leshchishina,a L. Wang,a
I. E. Gordon,b L. S. Rothman,b A. Camparguea
aUniversite Joseph Fourier/CNRS, Laboratoire de Spectrometrie Physique, 38402 SaintMartin d’Heres, FRANCE
bHarvard-Smithsonian Center for Astrophysics, Atomic and Molecular PhysicsDivision, Cambridge MA 02138-1516, USA
The knowledge of accurate spectroscopic parameters for a1∆g←X3Σ−g band of molec-
ular oxygen near 1.27 µm is very important in the field of remote sensing. Although,this band was studied by spectroscopists for over a century a lot of discrepancies stillremain in the previously reported line positions and intensities. In this work the CW-Cavity Ring Down Spectroscopy (CW-CRDS) technique has been used to record thehigh sensitivity absorption spectrum of this band. The spectra were obtained between7640 and 7917 cm−1 with “natural” oxygen and with samples highly enriched in 18O and17O. They measured transitions belong to the a1∆g←X3Σ−
g (0-0) bands of 16O2,16O18O,
16O17O, 17O18O, 18O2 and17O2. The (0-0) bands of
16O2 and18O2 show (previously un-
detected) electric quadrupole transitions with line intensities ranging from 1×10⁻³⁰ to1.9×10−28 cm/molecule. They are accompanied by the a1∆g←X3Σ−
g (1-1) hot bandswhich are also reported for the first time. Lines of the isotopologues containing 17O atomwere observed to be plagued with unresolved hyperfine structure, especially in the 17O2
spectrum. Accurate spectroscopic parameters for the observed bands were derived froma global fit of the experimental line positions, combined with microwave and Ramanmeasurements available in the literature.
Poster Session 1 33
PI-6. First High Resolution Analysis of the 4ν1+ν3Band of Nitrogen Dioxide near 1.5 µm
A. Perrin,a S.Kassi,b A.Campargueb
aLaboratoire Inter Universitaire des Systemes Atmospheriques (LISA), CNRS,Universites Paris Est and Paris 7, 61 Av du General de Gaulle, 94010 Creteil Cedex
France
bLaboratoire de Spectrometrie Physique (associated with CNRS, UMR 5588), UniversiteJoseph Fourier de Grenoble, B.P. 87, 38402 Saint-Martin-d’Heres Cedex, France
The high-resolution absorption spectrum of the 4ν1+ν3 band of the 14N16O2 moleculewas recorded by CW-Cavity Ring Down Spectroscopy between 6575 and 6700 cm−1.The assignments involve energy levels of the (4,0,1) vibrational state with rotationalquantum numbers up toKa= 8 and N = 48. A large majority of the spin-rotation energylevels were reproduced within their experimental uncertainty using a theoretical modelwhich takes explicitly into account the Coriolis interactions between the spin rotationallevels of the (4,0,1) vibrational state and those of the (4,2,0) and of (0,9,0) dark states,the anharmonic interactions between the (4,2,0) and (0,9,0) states together with theelectron spin-rotation resonances within the (4,0,1), (4,2,0) and (0,9,0) states. Precisevibrational energies, rotational, spin-rotational, and coupling constants were determinedfor the (4,2,0), (0,9,0), (4,0,1) triad of interacting states. Using these parameters andthe value of the transition dipole moment operator determined from a fit of a selection ofexperimental line intensities, the synthetic spectrum of the 4ν1+ν3 band was generated.
Poster Session 1 34
PI-7. The COF2 Rotational Spectrum near 1 THz
and the Infrared Spectrum Revisited; Improved
Molecular Constants for the Ground and First
Excited States of ν2, ν3, ν5, and ν6
Edward A. Cohen, Brian J. Drouin, and Linda R. Brown
Jet Propulsion Laboratory, California Institute of Technology, Pasadena, CA91109-8099
The rotational spectrum of COF2 has been observed near 1 THz as part of a continuingprogram to precisely characterize the spectra of atmospheric molecules. THz spectra ofthe ground, ν2, ν3, ν5, and ν6 states have been assigned, combined with other availablerotational data and high resolution infrared data, and fit in a single calculation up toJ ≈ 90 for a wide range of Kc. The spectrum of naturally abundant 13COF2 in itsground vibrational state has also been observed and fit separately, although the range ofquantum states is smaller due to interference from the nearby normal species. WatsonIII l S or Ir A parameters produce essentially the same quality of the fit. These resultsallow more accurate prediction of high J infrared spectra of the fundamental vibrationsbelow 1000 cm−1. The fits will be described and some examples of rotational and infraredspectra will be shown.

Poster Session 1 35
PI-8. Revised Line-Strengths and Peak-Positions for
cis-HONO at 1660 cm−1 Using a New CW-QC
TILDAS
Ben H. Lee,a Ezra C. Wood,b Mark S. Zahniser,b J. Barry McManus,b
David D. Nelson,b Scott C. Herndon,b Joanne H. Shorter,b
Joda C. Wormhoudt,b Steven C. Wofsy,a J. William Mungera
aHarvard University, School of Engineering and Applied Sciences, Cambridge, Ma,U.S.A.
bAerodyne Research, Inc., Center for Atmospheric and Environmental Chemistry,Billerica, Ma, U.S.A.
Nitrous acid, HONO, is a significant source of atmospheric HOx and the production ofHONO may be responsible for the recycling of deposited NOy back into the atmospherein active form. Many current techniques rely on wet-chemical extractive methods, butare potentially prone to interferences and have not always shown good agreement withoptical techniques1. Spectroscopy offers an alternative method with greater specificity,however, the rotational-vibrational transitions of HONO in the mid-infrared region arenot well studied. We present results from an experiment using a new tunable continuous-wave quantum cascade laser absorption spectrometer. We measured the cis-HONOspectra between 1659 and 1660 cm-1 and the trans-HONO spectra near 1275 cm−1
(both at a resolution of about 0.001 cm−1). Absolute mixing ratios of total HONO weredetermined by catalytic conversion to NO followed by calibrated absorption spectroscopy.The effective line-strengths for cis-HONO near 1660 cm−1 were about a factor of 2.5smaller than those listed in the ATMOS database, but line-strengths for trans-HONOaround 1275 cm−1 agreed well with reported values.
1J. Kleffmann, J. C. Lorzer, P. Wiesen, C. Kern, S. Trick, R. Volkamer, M. Rodenas and K. Wirtz,Atmospheric Environment, 40, March 2006.

Poster Session 1 36
PI-9. Detection and Quantification of OH Radical
by Emission and Absorption THz Spectroscopy
Arnaud Cuisset,a Sophie Eliet,a Francis Hindle,a Gael Mouret,a
Robin Bocquet,a Olivier Pirali,b Marie Aline Martin,b Michel Vervloetb
aLaboratoire de Physico-Chimie de l’Atmosphere, Universite du Littoral Cote d’Opale,189A Ave. Maurice Schumann, 59140 Dunkerque, France
bLigne AILES (Advance InfraRed Line Exploited for Spectroscopy), synchrotronSOLEIL, L’Orme des Merisiers, Saint Aubin, BP 48, 91192 Gif-sur-Yvette, France.
OH radical is an important compound for both atmospherical and astrophysicalchemistry. Therefore improving the spectroscopic knowledge of this unstable specieis important to quantify its abundance in different environments. In this study, theresults obtained with emission FTIR spectroscopy and continuous-wave THz absorptionspectroscopy demonstrate their ability for the measurement of accurate lines positionsand intensities of the OH radical . In both experiments, the radical was producedin cold plasma created by an electrodless radio-frequency discharge in a continuousflow of H2O. The first experiment was performed with the Bruker IFS 125HR Fouriertransform interferometer connected to the far infrared AILES beamline at SOLEIL.The high resolution (resolution = 0.004 cm−1 , 120 GHz) emission spectrum of OH hasbeen recorded between 1,5 and 18 THz (50 and 600 cm−1 ). We observed pure rotationaltransitions of the OH radical in the vibrational states v=0,1,2 with a frequency accuracybetter than 4·10−4 cm−1 (12 GHz). The emission spectrum permitted to resolve the spin-orbit and the Λ-doubling effects.
The rotational lines absorption of OH radical were recorded in the THz domain at1.8 and 2.5 THz (60 and 85 cm−1 ) with a cw-THz spectrometer. The THz radiationwas generated by optoelectronic conversion of an optical beatnote of two laser diodeson a photomixer. This high resolution THz technique allowed to study OH at very lowpressures close to the Doppler limit and to resolve the hyperfine rotational structure nonobserved in the FTIR measurements.
This study highlights the complementary between the two techniques for the de-termination of experimental parameters such as the thermodynamical and rotationaltemperatures of the plasma which are necessary for an accurate quantification of OH.
Poster Session 1 37
PI-10. Far Infrared High Resolution Rovibrational
Spectroscopy of Dimethylsulfoxyde
Arnaud Cuisset,a Irina Smirnova,a Robin Bocquet,a Francis Hindle,a GaelMouret,a Dmitrii A. Sadovskii,a Olivier Pirali,b Pascale Royb
aLaboratoire de Physico-Chimie de l’Atmosphere, Universite du Littoral Cote d’Opale,189A Ave. Maurice Schumann, 59140 Dunkerque, France
bLigne AILES (Advance InfraRed Line Exploited for Spectroscopy), synchrotronSOLEIL, L’Orme des Merisiers, Saint Aubin, BP 48, 91192 Gif-sur-Yvette, France.
In addition to its importance for industrial and environmental studies, the monitoringof DiMethylSulfOxyde (DMSO, (CH3)2SO) concentrations is of considerable interest forcivil protection. The existing high resolution gas phase spectroscopic data of DMSOonly cover the pure rotational transitions in the ground state.1 In the Far-IR domain,the low-frequency rovibrational transitions have never previously been resolved.2 Thehigh brightness of the AILES beamline of the synchrotron SOLEIL and the instrumentalsensitivity provided by the multipass cell allowed to measure these transitions for thefirst time.3 1581 A-type and C-type transitions in the ν11 band have been assigned and25 molecular constants of Watson’s s-form hamiltonian developed to degree 8 have beenfitted within the experimental accuracy.
The use of then synchrotron radiation has opened many possibilities for new spectro-scopic studies. Together with several other recent studies, our successful measurementand analysis of DMSO convincingly demonstrates the potential of the AILES beamlinefor high resolution FIR spectroscopy.
Thus our present work is just at the beginning of unraveling the rovibrational struc-ture of low frequency bending and torsional vibrational states of DMSO and yieldingimportant comprehensive structural and spectroscopic information on this molecule.
1L. Margules, R. A. Motienko, E. A. Alekseev, J. Demaison,J. Molec. Spectrosc.,260,(23),20092V. Typke, M. Dakkouri, J. Molec. Struct.,599,(177),20013A. Cuisset, L. Nanobashvili, I. Smirnova, R. Bocquet, F. Hindle, G. Mouret, O. Pirali, P. Roy,
D. Sadovskii,Chem. Phys. Lett.,accepted for publication
Poster Session 1 38
PI-11. Simulation of Snow Spectral Albedo at
0.4-2.5 micron: Updated with New Measurement of
the Refractive Index of Ice
Jianping Mao,a Bo-Cai Gaoa,b
aGoddard Earth Sciences and Technology Center, NASA Goddard Space Flight Center,Greenbelt, MD 20771
bRemote Sensing Division, Naval Research Laboratory, Washington, DC 20375
The large uncertainty exists in the previous snow spectral albedo models, especially inthe near infrared where snow has strong absorption and direct measurement is hardto achieve due to the interface with water vapor and carbon dioxide absorption bands.This work updated the refractive index of ice in the solar spectra (0.4-2.5 micron) withnew lab measurements and developed a physical approach to simulate snow spectralalbedo and bi-directional reflectance. New calculations show the general improvementof snow albedo simulation in the near infrared wavelength >1.4 micron and the dramaticreduction of uncertainty peaking at 1.85 micron.
Poster Session 1 39
PI-12. Gas Turbine Engine Soot Particle Emissions
and Aerosol Interaction in Experimentally
Simulated High Altitude Conditions
Moira Hilton,a Michael Antony Welch,a Mark Peter Johnsonb
aJ.J.Thomson Physical Laboratory, The University of Reading, Whiteknights, Reading,RG6 6AF, United Kingdom
bRolls Royce PLC, P.O.BOX 31,Victory Road, Derby DE24 8BJ, United Kingdom
To further the understanding of the impact of aviation on the atmosphere the conden-sation of water vapour on soot particles and aerosols emitted by gas turbine engines in theupper atmosphere was studied under laboratory conditions. Changes in size distribution,morphology and chemical composition of particles /aerosols emitted from gas turbineengine exhausts were monitored when they interacted with a simulated tropopause atmo-sphere. These laboratory experiments were designed to investigate particulate precursorsfor cloud formation and the evolution of hydrocarbon species immediately downstreamfrom aircraft engines. Small volume samples of the exhaust emissions of a small gasturbine engine (SGTE) combusting aviation fuel (kerosene) were introduced into the 75dm3 volume aerosol chamber at the NERC Molecular Spectroscopy Facility (MSF) inthe Rutherford Appleton Laboratory, UK. Before the exhaust sample was injected, theatmosphere inside the aerosol cell was conditioned by filling with dry air at constant,known pressures, humidity and temperatures equivalent to the atmosphere at an alti-tude of 6km and at 10km. The hot exhaust gases were injected into cell and allowed tointeract with the air and water vapour present at different temperatures, and pressure.Vacuum pumps extracted the excess gases inside the aerosol cell and maintained theinternal air pressure at nominated values.
A Scanning Mobility Particle Sizer (SMPS) measured particle size distribution andcounted particle numbers. Particle size/surface/volume distribution changes with dilu-tion and the growth of cloud condensation nuclei were studied over the size range 10nmto 1000nm. A Bruker IFS 66 FTIR spectrometer was setup to monitor ice formationand hydrocarbon and other contents of the aerosol cell.
Reproducible particle size distributions and FTIR measurements indicated creationof simulated contrails in the aerosol cell. Differences in unburnt hydrocarbon (UHC)concentrations were observed for the same engine operating conditions at different sim-ulated altitudes corresponding to changes in particle size distribution. At higher simu-lated altitudes the UHCs may be contributing to the growth in numbers at of larger sizeparticles.
Poster Session 1 40
PI-13. Improving Radiative Forcing Estimates in
GCM Radiation Codes
David Paynter
GFDL, Princeton, NJ, 08540
Nearly all GCM and line by line (LBL) radiation codes make use of the HITRANdatabase. Collins et al. (2006) compared the forcing estimates of 16 GCM and 5 LBLcodes in clear-sky conditions. For each scenario the GCM codes produced a large rangeof estimates. However, there was good agreement between the different LBL codes. Thisraises the question of what factors lead to GCM radiation codes performing poorly whenestimating radiative forcing. This work has focused on the longwave spectral region, andexamines which parameterizations used in GCM band models are most likely to lead toerrors in forcing estimates. Particular emphasis is placed upon the approximationsmade in the GFDL SEA code. However, many of the results are applicable to differentGCM radiation codes. The results demonstrate that most errors are due to a mixtureof excluding certain spectral regions and improper treatment of the overlap betweenabsorbers.

SESSION IV: Databases-2
41

SESSION IV: Databases-2 42
IV-1. Error Propagation from Line Parameters to
Spectra Simulations. Illustration on High
Temperature Methane
Jean Paul Champion and Christian Wenger
Laboratoire Interdisciplinaire Carnot de Bourgogne (ICB), UMR 5209 CNRS -Universit de Bourgogne, 9 Av. A. Savary, BP 47870, F-21078 DIJON, France.
([email protected], [email protected])
Astrophysical investigations generally need both complete and accurate spectroscop-ic databases. Despite continuous efforts in experimental and theoretical spectroscopicinvestigations, the lack of data in some spectral regions of interest is one of the mainlimitation of the presently available spectroscopic databases. Unfortunately informa-tion about missing data relevant to specific experimental conditions is rarely directlyaccessible from spectroscopic databases (focusing naturally on available data). Such in-formation relies essentially on theoretical investigations which are equally limited to thepresent state of the art of modelling.
The purpose of the talk is to show how multi-resolution models and rigorous erroranalyses can help overcoming such deficiencies. Rather than ignoring the spectral regionsfor which high-resolution line by line modeling is presently inaccessible, low-resolutionmodeling can be exploited for the sake of exhaustivity which represents a major issuein many astrophysical applications. In parallel, a rigorous quantitative estimation ofuncertainties, also essential for applications, represents the second key feature of thisapproach.
The error propagation from predicted line positions and intensities onto simulatedspectra will be described in detail based on multi-resolution global analyses using aneffective Hamiltonian approach. The procedure makes extensive use of statistical nu-merical experiments. It is illustrated on methane which is present in the atmospheres ofmany astrophysical objects. The modeling of the methane absorption coefficient in thenear infrared and/or at high temperature remains a challenge mainly due to the intrinsiccomplexity of its ro-vibrational spectrum. The extremely large density of levels in highlyexcited polyads makes it very difficult (if not to say impossible) to envisage line by linemodeling above say 10 000 cm−1 (http://hal.archives-ouvertes.fr/hal-00277904/fr/). Infact, the present state of the art of high-resolution modeling is limited approximately tothe spectral region below around 5 000 cm−1.
The example of methane at high temperature (Tvib = 2000 K and Trot = 296 K) willbe presented as a typical situation where transitions from several hot band systems withquite different accuracies have to be considered in the same spectral window. Typicalconfidence bands for the absorption coefficient and transmission signal are plotted in the
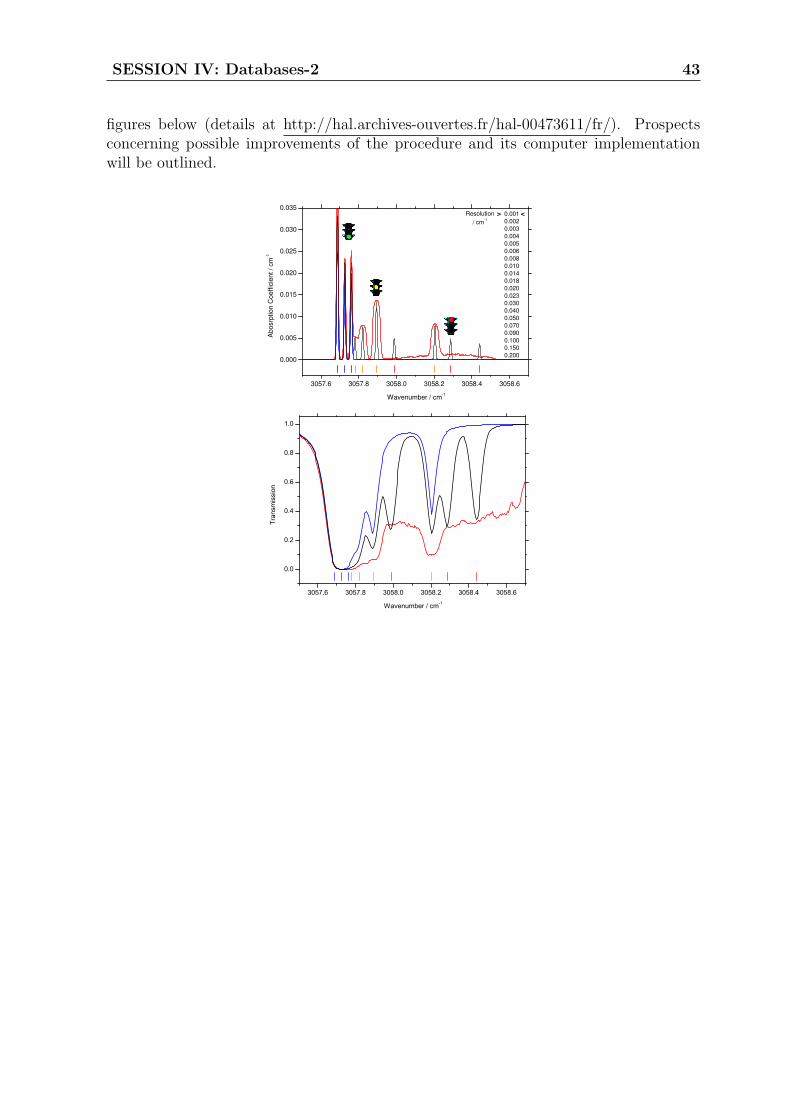
SESSION IV: Databases-2 43
figures below (details at http://hal.archives-ouvertes.fr/hal-00473611/fr/). Prospectsconcerning possible improvements of the procedure and its computer implementationwill be outlined.
3057.6 3057.8 3058.0 3058.2 3058.4 3058.6
0.000
0.005
0.010
0.015
0.020
0.025
0.030
0.035
0.001
0.002
0.003
0.004
0.005
0.006
0.008
0.010
0.014
0.018
0.020
0.023
0.030
0.040
0.050
0.070
0.090
0.100
0.150
0.200
Abosrp
tion C
oeffic
ient / cm
-1
Wavenumber / cm-1
Resolution
/ cm-1
> <
3057.6 3057.8 3058.0 3058.2 3058.4 3058.6
0.0
0.2
0.4
0.6
0.8
1.0
Tr
ansm
issi
on
Wavenumber / cm-1
SESSION IV: Databases-2 44
IV-2. High-Lying Rotational Levels of Water
Obtained by FIR Emission Spectroscopy
L. H. Coudert,a M.-A. Martin,b O. Pirali,b D. Balcon,b and M. Vervloetb
aLISA, CNRS/Universites Paris Est et Paris Diderot, 61 Avenue du General deGaulle, 94010 Creteil, France
bLigne AILES – Synchrotron SOLEIL, L’Orme des Merisiers, 91192 Gif-sur-Yvette,France
In an attempt to compute an accurate linelist for the water molecule, the high resolutionemission spectrum of water vapor has been recorded between 50 and 600 cm−1 usinga Bruker IFS 125HR Fourier transform interferometer and a continuous flow of watervapor rovibrationaly excited by an electrodless radio-frequency discharge.1 More than6000 pure rotational lines within the eight first vibrational states were assigned up toJ = 35. Rotational as well as rovibrational lines were identified for higher lying statesbelonging to the first hexad. About 1000 pure rotational transitions within vibrationalstates of the first hexad were assigned for the first time.
The new data, along with a large body of high-resolution data,2 was fitted usingthe bending-rotation theoretical approach3 to compute line positions. In a preliminaryanalysis, the wavenumbers of 4185 new transitions involving all vibrational states upto the first triad were accounted for up to J = 27 with a root mean square value of0.87 × 10−3 cm−1. Work is still in progress and we are hoping to account for the newdata up to the second triad and beyond.
In the paper, the new data will be presented and the results of the line positionanalysis will be given. The observed minus calculated residuals obtained in the presentanalysis will be compared to those retrieved using other calculated4 or experimental5
rovibrational energies.
1Pirali and Vervloet, Chem. Phys. Letters 423 (2006) 376.2Coudert, Wagner, Birk, Baranov, Lafferty, and Flaud, J. Mol. Spec. 251 (2008) 339.3Coudert, J. Mol. Spec. 181 (1997) 246.4Partridge and Schwenke, J. Chem. Phys. 106 (1997) 4618; and Barber, Tennyson, Harris, and
Tolchenov, Mon. Not. R. Astron. Soc. 368 (2006) 1087.5Tennyson, Zobov, Williamson, and Polyansky, J. Phys. Chem. Ref. Data 30 (2001) 735.
SESSION IV: Databases-2 45
IV-3. Assignment of the 5ν4 and ν2 + 4ν4 band
system of 12CH4 in the Region 6287-6550 cm−1.
A. V. Nikitin,a X. Thomas,a L. Regalia,a L. Daumont,a
P. Von Der Heyden,a Vl. G. Tyuterev,a A. Liu,b S. Kassi,b A. Campargueb
aGroupe de Spectromtrie Molculaire et Atmosphrique, UMR CNRS 6089, Universit deReims, U.F.R. Sciences, B.P. 1039, 51687 Reims Cedex 2, France
bLaboratoire de Spectromtrie Physique (associated with CNRS, UMR 5588), UniversitJoseph Fourier de Grenoble, B.P. 87, 38402 Saint-Martin-dHres Cedex, France.
This paper reports a first assignment of rovibrational transitions of the 5ν4 andν2 + 4ν4
12CH4 band systems in the range 6287-6550 cm−1 which is usually referred toas a part of the 1.6µm methane transparency window. Five experimental data sourcesfor methane were used for the analyses in this range: two line lists came from themeasurements of line positions and line intensities on spectra recorded by Cavity RingDown Spectroscopy in Grenoble at T= 297 K and 79 K and the other measurementscame from the analyses of the three long path Fourier Transform Spectra recorded inReims (L=1603 m, P= 1-34 mbar). In order to determine the dipole transition momentparameters and quantify the intensity borrowing due to the resonance interactions wehad to include in the fitted model also some lines of stronger ν1 + 3ν4 and ν2 + 4ν4
bands. For this purpose we measured additional 180 lines outside this range in FTSspectra though the analysis of these bands is not complete. About 1941 experimentalline positions and 1465 line intensities were fitted with RMS standard deviations of0.003 cm−1 and 14%, respectively. A line list of 7877 12CH4 calculated and observedtransitions which are considered as dominant ones in the region 6287-6550 cm−1 wasconstructed. This is the first high-resolution analysis and modeling of 5-quanta bandsystems for a five-atomic molecule close to experimental accuracy. A support from ANRCH4-at-Titan and from GDRI SAMIA collaboration programs is acknowledged.
SESSION IV: Databases-2 46
IV-4. Towards New Line List of Magnetic Dipole
and Electric Quadrupole Transitions in the
a1∆g←X3Σ−g Band of Oxygen
I. E. Gordon,a L. S. Rothman,a S. Kassi,b A. Campargue,b G. C. Toonc
aHarvard-Smithsonian Center for Astrophysics, Atomic and Molecular PhysicsDivision, Cambridge MA 02138-1516, USA
bUniversite Joseph Fourier/CNRS, Laboratoire de Spectrometrie Physique, 38402 SaintMartin d’Heres, FRANCE
cJet Propulsion Laboratory, California Institute of Technology, 4800 Oak Grove Drive,Pasadena, CA 91109, USA
The spectroscopic parameters for the a1∆g←X3Σ−g band of molecular oxygen near
1.27 µm were given in HITRAN almost since the inception of the database. This bandis of fundamental importance in the field of remote sensing. Although, the spectralparameters were updated several times numerous uncertainties have remained. Eventhe most recent update (November, 2009), that was proven to be superior to previousversions of HITRAN in the atmospheric retrievals 1, leaves room for improvement. Thisincludes not only correction of the existing parameters (for instance the J-dependenceof line intensities for 16O18O) but also accounting for electric quadrupole transitions.The addition of the ∆J=±2 electric quadrupole transitions was recently shown to beimportant 2. Also one has to evaluate, the correlation between the overlapping ∆J=±1,0 magnetic dipole and electric quadrupole lines. The (1-1) band of 16O2 and (0-0) bandof 16O17O have intensities similar to quadrupole transitions, and therefore the referencespectroscopic data for these species is required. In order to provide accurate inputparameters for calculation of line lists the CW-Cavity Ring Down Spectroscopy (CW-CRDS) technique has been used to record the high sensitivity absorption spectrum ofthis band. The spectra were obtained between 7640 and 7917 cm−1 with “natural”oxygen and the absolute intensities of 377 oxygen transitions were measured. Theyinclude the a1∆g←X3Σ−
g (0-0) bands of 16O2,16O18O and 16O17O. The (0-0) bands of
16O2 contain electric quadrupole transitions with line intensities ranging from 1×10⁻³⁰
to 1.9×10⁻²⁸ cm/molecule. The lines from (1-1) band were also measured.
1Washenfelder RA, Toon GC, Blavier J-F, Yang Z, Allen NT, Wennberg PO, et al. Carbon dioxidecolumn abundances at the Wisconsin Tall Tower site. J Geophys Res D 2006;111:22305.
2Gordon IE, Kassi S, Campargue A, Toon GC. First identification of the electric quadrupole tran-sitions of oxygen in the solar and laboratory spectra. JQSRT 2010;111:1174-1183.
SESSION IV: Databases-2 47
IV-5. Update for Methyl Chloride at 3 µm
C. Bray,a A. Perrin,b D. Jacquemart,a N. Lacomea
aUniversite Pierre et Marie Curie-Paris 6; CNRS; Laboratoire de Dynamique,Interactions et Reactivite (LADIR), UMR 7075, Case Courrier 49, 4 Place Jussieu,
75252 Paris Cedex 05, France
bLaboratoire Inter Universitaire des Systemes Atmospheriques (LISA), CNRS,Universites Paris Est and Paris 7, 61 Av du General de Gaulle, 94010 Creteil Cedex
France
Methyl chloride (CH3Cl) is one of the most abundant chlorine-containing moleculesin the atmosphere. For this reason a recent update was performed in HITRAN for thismolecule in the 0-2600 cm−1 region by Nikitin et al.1. CH3Cl has a rather strong signa-ture at 3 µm which has been used recently by the Atmospheric Chemistry Experiment(ACE) satellite mission to produce the first study of the global distribution of methylchloride in the upper troposphere and stratosphere 2. However it was mentioned thatthe CH3Cl line parameters are of very low quality in this spectral region in the HITRANor GEISA databases 3. In this work we present a complete update of the line positionsand of the (absolute) line intensities for CH3
35Cl and CH337Cl in the 3 µm region. At
LADIR about 4000 line positions and 500 line intensities were measured for CH335Cl
and CH337Cl using new high resolution FTS spectra (Bruker IFS 120) of methyl chlo-
ride. The theoretical model accounts for the interactions coupling the ν1 (l=0), ν4 (l=1),2ν3+ν5 (l=1), 2ν5 (l=2) and 3ν6 (l=1 and l=3) vibrational states. In addition line shapestudies are in progress.
1A.Nikitin, J.P.Champion and H.Burger, J. Mol. Spectr. 230, 174 (2005)2N.Weigum, C.Mcelcheran, K.A.Walker,J.R.Taylor, G.C.Toon, G.Manney and Y.Wang, TI09 64th
Molecular Symposium Columbus 20093M.Morillon-Chappey, and G.Graner J. Mol. Spectr 31, 155 (1969); P.Jensen, S.Brodensen,
G.Guelachvili, J. Mol. Spect. 88, 378 (1981)

SESSION IV: Databases-2 48
IV-6. Indices of Refraction of Absorptive Aerosol -
Their Importance and Complexity
Steven T. Massie
National Center for Atmospheric Research, PO Box 3000, Boulder, Colorado, 80307
Absorptive indices of refraction of desert dust, black carbon, and fire smoke areimportant because they produce aerosol effects in which altitude dependent absorptionof radiation occurs on regional scales. Atmospheric warming, the lifting of material inthe troposphere and stratosphere, perturbations of atmospheric stability, and changesin rainfall rates and drought occurrences, are attributable to the presence of absorptiveaerosol. Aerosol properties, however, are very complex. Aerosol is known to evolvein its physical characteristics such as size, optical, and hydroscopic properties. Thispresentation looks at how well one can specify the indices of refraction of absorptiveaerosol, and makes recommendations for improvements in these indices for the HITRANcompilation.

SESSION V: Line Shapes
49

SESSION V: Line Shapes 50
V-1. The Importance of Being Earnest about Line
Shapes
Charles E. Miller and Linda R. Brown
Jet Propulsion Laboratory, California Institute of Technology, 4800 Oak GroveDr.,Pasadena, CA 91109, U.S.A.
Recent advances in theoretical and experimental spectroscopy demonstrate that phys-ical inadequacies in standard Voigt molecular line shape models degrade laboratoryand atmospheric spectral curve-fitting retrievals even for state-of-the-art spectrometers.More sophisticated physics associated with molecular collisions (line mixing, speed de-pendence, narrowing etc.) are generally known, but the atmospheric and laboratoryspectroscopy communities lack a comprehensive (validated) software required to com-pute the very accurate synthetic spectra needed for the retrieval process. For the remotesensing of important greenhouse gases (e.g. CO2, CH4 and H2O), these deficiencies mustbe corrected in order to achieve abundances with the 0.3% accuracies required for climatechange science. We need an international effort to correct this situation.1
1The research described in this paper was performed the Jet Propulsion Laboratory, CaliforniaInstitute of Technology, under contracts and cooperative agreements with the National Aeronauticsand Space Administration.
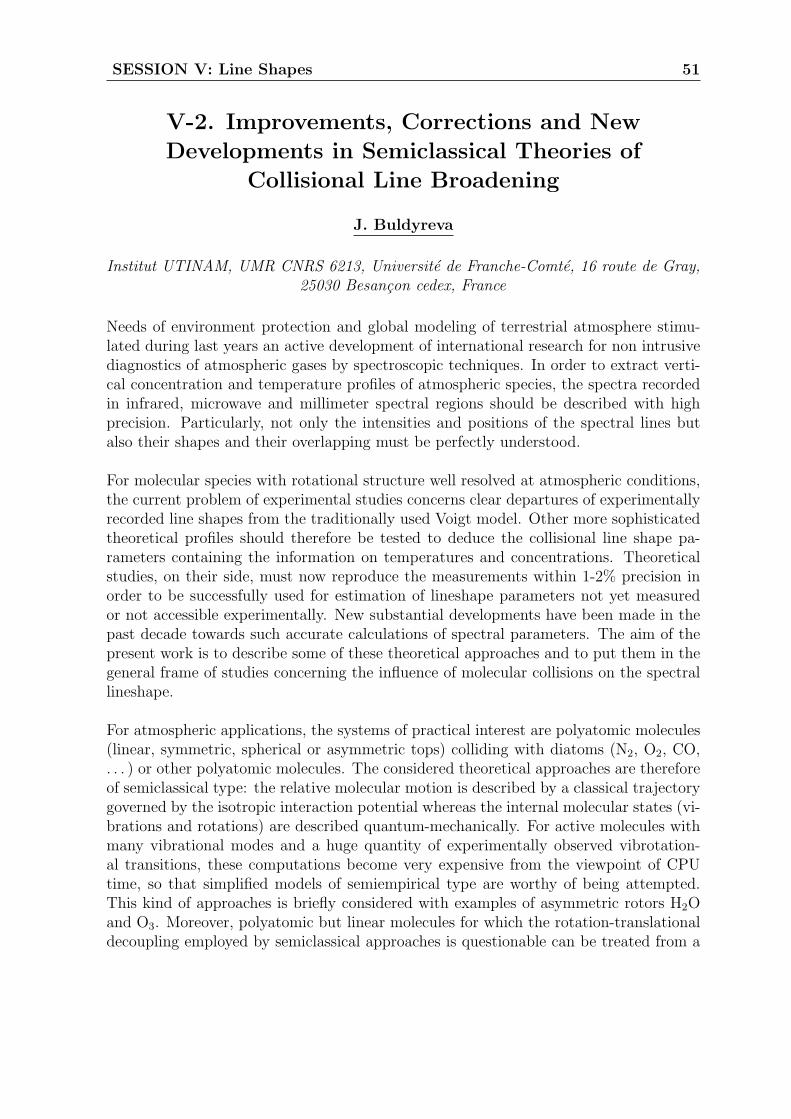
SESSION V: Line Shapes 51
V-2. Improvements, Corrections and New
Developments in Semiclassical Theories of
Collisional Line Broadening
J. Buldyreva
Institut UTINAM, UMR CNRS 6213, Universite de Franche-Comte, 16 route de Gray,25030 Besancon cedex, France
Needs of environment protection and global modeling of terrestrial atmosphere stimu-lated during last years an active development of international research for non intrusivediagnostics of atmospheric gases by spectroscopic techniques. In order to extract verti-cal concentration and temperature profiles of atmospheric species, the spectra recordedin infrared, microwave and millimeter spectral regions should be described with highprecision. Particularly, not only the intensities and positions of the spectral lines butalso their shapes and their overlapping must be perfectly understood.
For molecular species with rotational structure well resolved at atmospheric conditions,the current problem of experimental studies concerns clear departures of experimentallyrecorded line shapes from the traditionally used Voigt model. Other more sophisticatedtheoretical profiles should therefore be tested to deduce the collisional line shape pa-rameters containing the information on temperatures and concentrations. Theoreticalstudies, on their side, must now reproduce the measurements within 1-2% precision inorder to be successfully used for estimation of lineshape parameters not yet measuredor not accessible experimentally. New substantial developments have been made in thepast decade towards such accurate calculations of spectral parameters. The aim of thepresent work is to describe some of these theoretical approaches and to put them in thegeneral frame of studies concerning the influence of molecular collisions on the spectrallineshape.
For atmospheric applications, the systems of practical interest are polyatomic molecules(linear, symmetric, spherical or asymmetric tops) colliding with diatoms (N2, O2, CO,. . . ) or other polyatomic molecules. The considered theoretical approaches are thereforeof semiclassical type: the relative molecular motion is described by a classical trajectorygoverned by the isotropic interaction potential whereas the internal molecular states (vi-brations and rotations) are described quantum-mechanically. For active molecules withmany vibrational modes and a huge quantity of experimentally observed vibrotation-al transitions, these computations become very expensive from the viewpoint of CPUtime, so that simplified models of semiempirical type are worthy of being attempted.This kind of approaches is briefly considered with examples of asymmetric rotors H2Oand O3. Moreover, polyatomic but linear molecules for which the rotation-translationaldecoupling employed by semiclassical approaches is questionable can be treated from a

SESSION V: Line Shapes 52
purely classical point of view where the relative trajectory defined by the full anisotropicpotential is no more planar and energy transfer between translations and rotations canoccur. The efficiency of this method is demonstrated for infrared absorption spectra ofC2H2 molecule.
SESSION V: Line Shapes 53
V-3. Spectral shapes modeling and remote sensing
of greenhouse gases: Toward the OCO and GOSAT
experiments and future HITRAN issues
Jean-Michel Hartmann
Laboratoire Interuniversitaire des Systmes Atmosphriques (LISA) CNRS (UMR 7583),Universits Paris XII et Paris VII Universit Paris XII, 94010 Crteil Cedex, FRANCE;
Recent advances in the modeling of absorption by oxygen, carbon dioxide, and methanein the regions retained for remote sensing by the Orbiting Carbon Observatory (OCO)and Greenhouse gases Observation SATellite (GOSAT) will be presented. It will beshown that the usual Voigt profile is inadequate and line-mixing and collision inducedabsorption processes must be properly taken into account for meaningful results con-cerning the total pressure and species atmospheric amounts. These statements raise thequestion, which will be discussed, of the evolution of the HITRAN database to includethe relevant parameters.

SESSION V: Line Shapes 54
SESSION V: Line Shapes 55
V-4. An Improved Version of the CO2 Line-mixing
Database and Software: Update and Extension
Anne L. Laraia,a Julien Lamouroux,a Robert R. Gamache,a Ha Tran,b
Laurence S. Rothman,c Iouli E. Gordon,c Jean-Michel Hartmannb
aUniversity of Massachusetts School of Marine Sciences, Department ofEnvironmental, Earth, and Atmospheric Sciences, One University Avenue,University
of Massachusetts Lowell, Lowell, MA 01854-5045,USA
bUniversite Paris 12, Lab. Interuniversitaire des Systemes Atmospheriques, Creteil,FRANCE
cHarvard-Smithsonian Center for Astrophysics,Atomic and Molecular PhysicsDivision,Cambridge MA, USA
In a previous series of studies, a model and the database/software1 to calculate CO2-airabsorption coefficients taking into account the effect of line-mixing was introduced andtested. Here we present the update recently made2 to the database and the software.The spectroscopic data were taken from the 2008 version of the HITRAN database3.When needed transitions with J” up to 70, or to the Jmax of HITRAN, were addedwhenever possible using the CDSD-2964 database, and the high-temperature CDSD-10005 database. The extensions made within the new database by adding the air-inducedpressure shifts, the CO2-H2O half-widths and their temperature dependence, will also bedescribed. The quality of the new database is demonstrated by the agreement obtainedbetween the calculations and the laboratory spectra measurements in the 1.5-2.3µmregion.
1F. Niro, K. Jucks, and J.-M. Hartmann, J. Quant. Spectrosc. Radiat. Transf. 95, 116-127 (2005)2J. Lamouroux, H. Tran, A. L. Laraia, R. R. Gamache, L. S. Rothman, I. E. Gordon, and J.-
M. Hartmann, J. Quant. Spectrosc. Radiat. Transf., in press (2010)3L. .S. Rothman, I. E. Gordon, A. Barbe, D. C. Benner, et al., J. Quant. Spectrosc. Radiat. Transf.
110, 533-572 (2009)4S. A. Tashkun, V. I. Perevalov, J. L. Teffo. In: Agnes Perrin, Najate Ben Sari-Zizi, Jean Demaison,
editors. 161-169 (2006), in Remote Sensing of the Atmosphere for Environmental Security, Springer,Netherlands. (The 2008 updated version was used, available at: ftp.iao.ru/pub/CDSD-2008/296.)
5S. A. Tashkun, V. I. Perevalov, J.-L. Teffo, A. D. Bykov, and N. N. Lavrentieva, J. Quant.Spectrosc. Radiat. Transf. 82, 165-96 (2003) (The 2008 updated version was used, available at:ftp.iao.ru/pub/CDSD-2008/1000).
SESSION V: Line Shapes 56
V-5. The Collision-Broadened Line Shape of CO2
via the Complex Robert-Bonamy Method: The
Complexity of Simplicity
Julien Lamouroux, Anne L. Laraia, Robert R. Gamache
University of Massachusetts School of Marine Sciences, Department of Environmental,Earth, and Atmospheric Sciences, One University Avenue,University of Massachusetts
Lowell, Lowell, MA 01854-5045,USA
Calculations of the pressure-broadened half-width and pressure-induced line shiftare made for CO2 with N2, O2, air, and CO2 as the buffer gas. It will be shown thatthe intermolecular potential for these systems is unusually simple, which has lead tomany problems and complications in the calculations. The temperature and velocitydependence of the calculations and many of the pitfalls encountered will be discussed.Comparison with measurements of both the half-width and line shift will be shown andthe future direction of the work presented.
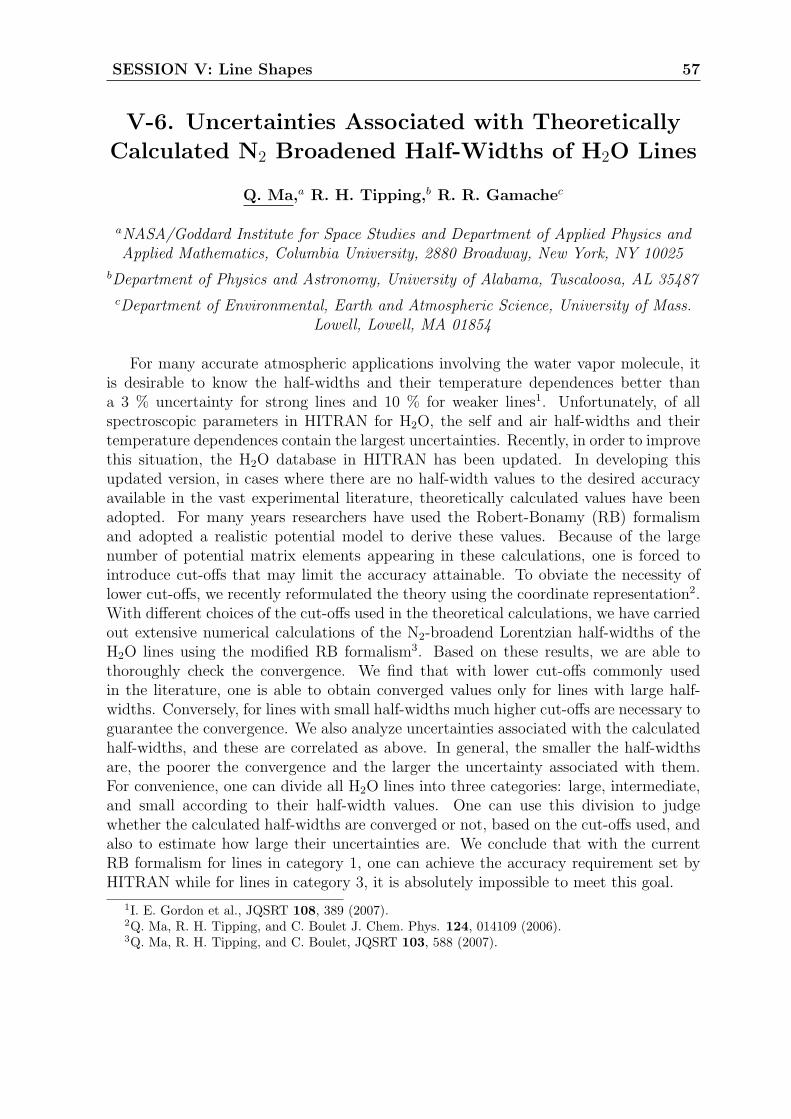
SESSION V: Line Shapes 57
V-6. Uncertainties Associated with Theoretically
Calculated N2 Broadened Half-Widths of H2O Lines
Q. Ma,a R. H. Tipping,b R. R. Gamachec
aNASA/Goddard Institute for Space Studies and Department of Applied Physics andApplied Mathematics, Columbia University, 2880 Broadway, New York, NY 10025
bDepartment of Physics and Astronomy, University of Alabama, Tuscaloosa, AL 35487
cDepartment of Environmental, Earth and Atmospheric Science, University of Mass.Lowell, Lowell, MA 01854
For many accurate atmospheric applications involving the water vapor molecule, itis desirable to know the half-widths and their temperature dependences better thana 3 % uncertainty for strong lines and 10 % for weaker lines1. Unfortunately, of allspectroscopic parameters in HITRAN for H2O, the self and air half-widths and theirtemperature dependences contain the largest uncertainties. Recently, in order to improvethis situation, the H2O database in HITRAN has been updated. In developing thisupdated version, in cases where there are no half-width values to the desired accuracyavailable in the vast experimental literature, theoretically calculated values have beenadopted. For many years researchers have used the Robert-Bonamy (RB) formalismand adopted a realistic potential model to derive these values. Because of the largenumber of potential matrix elements appearing in these calculations, one is forced tointroduce cut-offs that may limit the accuracy attainable. To obviate the necessity oflower cut-offs, we recently reformulated the theory using the coordinate representation2.With different choices of the cut-offs used in the theoretical calculations, we have carriedout extensive numerical calculations of the N2-broadend Lorentzian half-widths of theH2O lines using the modified RB formalism3. Based on these results, we are able tothoroughly check the convergence. We find that with lower cut-offs commonly usedin the literature, one is able to obtain converged values only for lines with large half-widths. Conversely, for lines with small half-widths much higher cut-offs are necessary toguarantee the convergence. We also analyze uncertainties associated with the calculatedhalf-widths, and these are correlated as above. In general, the smaller the half-widthsare, the poorer the convergence and the larger the uncertainty associated with them.For convenience, one can divide all H2O lines into three categories: large, intermediate,and small according to their half-width values. One can use this division to judgewhether the calculated half-widths are converged or not, based on the cut-offs used, andalso to estimate how large their uncertainties are. We conclude that with the currentRB formalism for lines in category 1, one can achieve the accuracy requirement set byHITRAN while for lines in category 3, it is absolutely impossible to meet this goal.
1I. E. Gordon et al., JQSRT 108, 389 (2007).2Q. Ma, R. H. Tipping, and C. Boulet J. Chem. Phys. 124, 014109 (2006).3Q. Ma, R. H. Tipping, and C. Boulet, JQSRT 103, 588 (2007).

SESSION V: Line Shapes 58
V-7. Complex Robert-Bonamy Calculation of H2O
Broadened by N2, O2 and Air Made with Realistic
Trajectories
Julien Lamouroux,a Anne L. Laraia,a Robert R. Gamache,a Qiancheng Ma,b
Richard H. Tippingc
aUniversity of Massachusetts School of Marine Sciences, Department ofEnvironmental, Earth, and Atmospheric Sciences, One University Avenue,University
of Massachusetts Lowell, Lowell, MA 01854-5045,USA
bNASA/Goddard Institute for Space Studies and Department of Applied Physics andApplied Mathematics, Columbia University, 2880 Broadway, New York, New York
10025, USA
cDepartment of Physics and Astronomy, University of Alabama, Tuscaloosa, AL 35487,USA
In the present work Complex Robert-Bonamy (CRB) calculations of the pressure-broadened half-width and the pressure induced line shift are made for 1639 transitionsin the rotation band of water vapor for N2 and O2 as perturbing gases. The half-width and line shift were calculated using the average over the Maxwell-Boltzmanndistribution of velocities at seven temperatures in the range 200K - 700K. The air-broadened half widths were determined for each temperature by using the standardformula γair = 0.79 ∗ γN2 + 0.21 ∗ γO2 . These calculations employed realistic trajecto-ries determined by solving Hamiltons Equations of motion where the potential is takenas the isotropic part of the atom-atom intermolecular potential expended at 8th order.We present the comparisons of these new calculations with former ones1 that used theRobert-Bonamy second-order in time trajectory model. The comparisons of both cal-culations with measurements from the database of measured half-widths2 updated in20083 and the recent recommended data of Delamere et al.4 is also discussed. The useof trajectories determined using Hamilton’s Equations of motion improved agreementwith measurement for almost all transitions. Given the recent work of Ma et al.5 weexpect that the improved agreement for intermediate to narrow lines will only come oncethe order and rank of the intermolecular potential are increased and a better potentialmodel is used.
1R. R. Gamache, and A. L. Laraia, J. Mol. Spectrosc. 257, 116-127 (2009)2R. R. Gamache, and J.-M. Hartmann, Can. J. Chem. 82, 1013-1027 (2004)3A. L. Laraia, R. R. Gamache, and J.-M. Hartmann, unpublished data (2008)4J. S. Delamere, S. A. Clough, V. Payne, E. J. Mlawer, D. D. Turner, and R. R. Gamache, J.
Geophys. Res., accepted (2009)5Q. Ma, R. H. Tipping, and R. R. Gamache, Mol. Phys., submitted (2010)

SESSION V: Line Shapes 59
V-8. N2 Collisional Broadening of Methane in the
THz Region Measured at the SOLEIL Synchrotron
V. Boudon,a T. Gabard,a O. Pirali,b P. Roy,b J.-B. Brubach,b L. Manceron,c
J. Vander Auwerad
aInstitut Carnot de Bourgogne, UMR 5209 CNRS-Universite de Bourgogne, 9. Av. A.Savary, BP 47870, F-21078 Dijon Cedex, France
bLigne AILES – Synchrotron SOLEIL, L’Orme des Merisiers, F-91192 Gif-sur-Yvette,France
cLaboratoire de Dynamique, Interactions et Reactivite, UMR 7075 – Universit Pierreet Marie Curie – CNRS, Case 49, 4 Place Jussieu, F-75252, Paris Cedex, France
dService de Chimie Quantique et Photophysique, Universite Libre de Bruxelles, CP160/09, 50 avenue F.D. Roosevelt, B-1050 Brussels, Belgium
Recently, we recorded the THz centrifugal distortion-induced spectrum of methane usingsynchrotron radiation at the SOLEIL facility. Intensities of pure rotation lines of CH4
were precisely measured, from which the induced dipole moment of this weak spectrum,of great interest for planetology, was accurately inferred.1 This study should in particularhelp to measure methane concentrations in Titan’s atmosphere.2
Here, we continue the work by presenting spectra of CH4/N2 mixtures, again recordedwith a 150 m optical path in a White cell and a Bruker IFS 125 HR FTIR spectrometerat the AILES beamline of SOLEIL. More precisely, the spectra were recorded with 5 %of CH4 in N2 at various total pressures (ca. 100, 200, 400, 600 and 800 mbar). Thesespectra will allow to measure collisional broadening and shift coefficients, as well asline-mixing parameters, with N2 as a perturber (like in Titan’s atmosphere).
1V. Boudon, O. Pirali, P. Roy, J.-B. Brubach, L. Manceron and J. Vander Auwera, J. Quant.Spectrosc. Radiat. Transfer , in press (2010)
2A. Coustenis, R. K. Achterberg, B. J. Conrath et al., Icarus 189, 35–62 (2007).

SESSION V: Line Shapes 60
V-9. N2-broadened13CH4 at 80 to 296 K
M. A. H. Smith,a K. Sung,b L. R. Brown,b T. J. Crawford,b A. W. Mantz,c
V. Malathy Devi,d D. Chris Bennerd
aScience Directorate, NASA Langley Research Center, Hampton, VA 23681
bJet Propulsion Laboratory, California Institute of Technology, 4800 Oak GroveDr.,Pasadena, CA 91109
cDept. of Physics, Astronomy and Geophysics, Connecticut College, New London, CT06320
dThe College of William and Mary, Williamsburg, VA 23187
High-resolution spectra of the ν4 fundamental band of 13CH4 broadened by N2 attemperatures relevant to the atmosphere of Titan (80 K to 296 K) have been recordedusing new temperature-controlled absorption cells installed in the sample compartmentof a Bruker IFS-125HR Fourier Transform spectrometer (FTS) at the Jet PropulsionLaboratory (JPL). Early analysis of these spectra using multispectrum fitting has deter-mined half widths, pressure-induced shifts, line mixing parameters and their temperaturedependences for R-branch transitions from R(0) through R(6). The analysis for theseJ-manifolds examined in detail whether or not the N2-broadened half width coefficientsfollow the simple exponential temperature-dependence over the entire temperature rangefrom 80 K to 296 K. The results are compared with other published measurements ofN2- and air-broadened methane parameters.1
1Research described in this paper was performed at Connecticut College, the College of Williamand Mary, NASA Langley Research Center and the Jet Propulsion Laboratory, California Instituteof Technology, under contracts and cooperative agreements with the National Aeronautics and SpaceAdministration.
SESSION V: Line Shapes 61
V-10. Formaldehyde Broadening Coefficients: the
5.7µm AND 3.6µm Bands
D. Jacquemart,a N. Lacome,a A. Laraia,b R.R. Gamache,b A. Perrin,c
F. Kwabia Tchanac
aUniversite Pierre et Marie Curie-Paris 6; CNRS; Laboratoire de Dynamique,Interactions et Reactivite (LADIR), UMR 7075, Case Courrier 49, 4 Place Jussieu,
75252 Paris Cedex 05, France
bUniversity of Mass Lowell, Department of Environmental, Earth and AtmosphericSciences, Lowell, MA 01854, USA
cUniversite Paris 12; CNRS; Laboratoire Inter Universitaire des SystemesAtmospheriques (LISA), UMR 7583, 61 Av du General de Gaulle, 94010 Creteil Cedex
France
The goal of this study was to achieve absolute line intensities and reliable line broad-ening parameters for the strong 5.7 µm and 3.6 µm bands of formaldehyde (H2CO) andto generate, for both spectral regions, a complete linelist for atmospheric applications.
High-resolution Fourier transform spectra were recorded at LADIR for the whole 1600- 3200 cm−1 spectral range and for different path-length-pressure products conditions.Using these spectra, a large set of H2CO individual line intensities1 and of self- andN2-broadening linewidths2 were measured.
The linelist of positions and intensities based on this worka has been included in theHITRAN 2008 database. This presentation will be focused on the retrieved linewidths(self and by N2). Empirical expansions and theoretical calculations (semi-classicalRobert-Bonamy formalism) have been performed and compared to the measurements.Rotational dependences have been studied, and the temperature dependence of the N2-broadening coefficients has been calculated.
1A. Perrin, D. Jacquemart, F. Kwabia-Tchana, and N. Lacome, JQSRT 110,700-716,2009.2D. Jacquemart, A. Laraia F. Kwabia-Tchana, R.R. Gamache A. Perrin and N. Lacome, JQSRT
111,1209-1222,2010.

SESSION V: Line Shapes 62

Poster Session II
63
Poster Session II 64
PII-1. High Resolution Fourier Transform
Spectroscopy in the 1.57 µm Region Using a
Frequency Comb Laser Source
Keeyoon Sung, Pin Chen, Timothy J. Crawford
Jet Propulsion Laboratory, California Institute of Technology, 4800 Oak GroveDr.,Pasadena, CA 91109, U.S.A.
A limiting factor to high-resolution Fourier-transform infrared spectrometry (FT-IR)is available photon flux with a conventional light source such as tungsten or Globarlamp. This is particularly problematic when studying weak absorption features requir-ing long path, multi-pass cells, which have low optical throughput at their maximumpath length (often on the order of 20%). We report the implementation of a frequencycomb laser with the Bruker 125 HR Fourier transform spectrometer at JPL. The laser(PolarOnyx, Model: Mercury 1000-100-100) generates a frequency comb spanning the6200 - 6600 cm−1 spectral range, with a tooth spacing of 0.0015 cm−1 and average outputpower of 120 mW. The output was attenuated and coupled into the spectrometer viasingle-mode optical fibers. Instrumental line shape (ILS) function has been investigatedwith the nominal aperture diameter of 0.1 mm, and compares well against the ILS func-tion for a conventional continuum light source. The CO2 spectrum at the 1.57 µm isused to test the performance of the new system, whose preliminary results are presentedalong with discussion on potential applications of the laser source for other species inthe spectral region.1
1The research at the Jet Propulsion Laboratory, California Institute of Technology was performedunder contracts and grants with National Aeronautics and Space Administration. In particular, weacknowledge the NASA Planetary Instrument Definition and Development program.
Poster Session II 65
PII-2. Development of an External-Cavity Quantum
Cascade Laser Spectrometer
Virginie Zeninari, Dominique Mammez, Julien Cousin, Lilian Joly,Bertrand Parvitte
Groupe de Spectrometrie Moleculaire et Atmospherique, Universite de ReimsChampagne-Ardenne, Fac des Sciences, Moulin de la Housse, BP 1039, 51687 Reims
Cedex 2, Email : [email protected]
The laser team of GSMA in Reims has previously developed various tunable diode laserspectrometers in the infrared in order to measure spectroscopic parameters. However atunable diode laser spectrometer is usually limited to the study of less than 10 cm−1.This problem is related to the Distributed FeedBack system integrated on the Fabry-Perot chip laser in order to obtain a single-mode emission. Thus usual spectroscopicparameters retrieved by tunable diode laser spectroscopy cannot significantly contributeto databases such as HITRAN.
In this poster we will present the current developments of an external-cavity quantumcascade laser spectrometer. The main objective is to use the main part of the curve gainof the laser to obtain a single-mode emission (up to 200 cm−1). For that purpose weare working with the Alcatel-Thales III-V lab from Palaiseau (France) which developsthe laser chips and the mandatory anti-reflection coatings. First results and tests willbe presented.
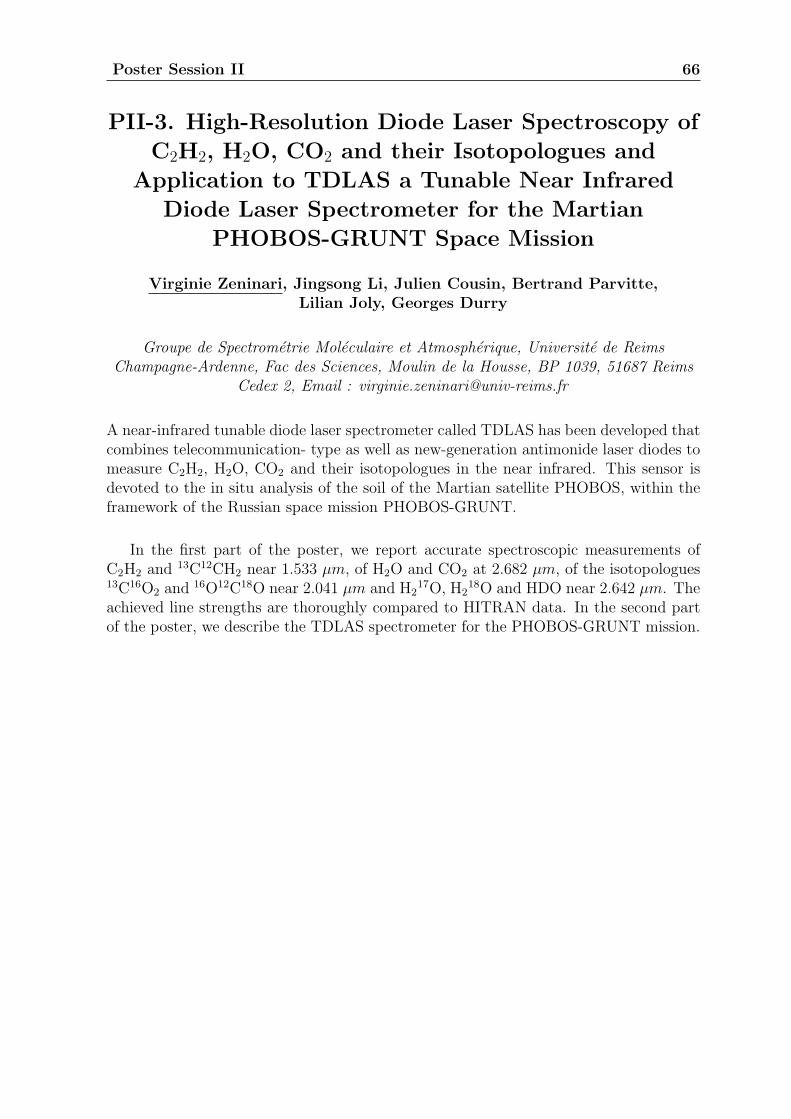
Poster Session II 66
PII-3. High-Resolution Diode Laser Spectroscopy of
C2H2, H2O, CO2 and their Isotopologues and
Application to TDLAS a Tunable Near Infrared
Diode Laser Spectrometer for the Martian
PHOBOS-GRUNT Space Mission
Virginie Zeninari, Jingsong Li, Julien Cousin, Bertrand Parvitte,Lilian Joly, Georges Durry
Groupe de Spectrometrie Moleculaire et Atmospherique, Universite de ReimsChampagne-Ardenne, Fac des Sciences, Moulin de la Housse, BP 1039, 51687 Reims
Cedex 2, Email : [email protected]
A near-infrared tunable diode laser spectrometer called TDLAS has been developed thatcombines telecommunication- type as well as new-generation antimonide laser diodes tomeasure C2H2, H2O, CO2 and their isotopologues in the near infrared. This sensor isdevoted to the in situ analysis of the soil of the Martian satellite PHOBOS, within theframework of the Russian space mission PHOBOS-GRUNT.
In the first part of the poster, we report accurate spectroscopic measurements ofC2H2 and 13C12CH2 near 1.533 µm, of H2O and CO2 at 2.682 µm, of the isotopologues13C16O2 and
16O12C18O near 2.041 µm and H217O, H2
18O and HDO near 2.642 µm. Theachieved line strengths are thoroughly compared to HITRAN data. In the second partof the poster, we describe the TDLAS spectrometer for the PHOBOS-GRUNT mission.
Poster Session II 67
PII-4. Pressure Broadening Coefficients of HCl and
DCl for the Venus Atmosphere
T. Foldes and J. Vander Auwera
Service de Chimie Quantique et Photophysique, Universite Libre de Bruxelles, CP160/09, 50 avenue F.D. Roosevelt, B-1050 Brussels, Belgium
Recent observations in the 2.2 to 4.3 µm range by the Solar Occultation InfraRed Spec-trometer (SOIR) aboard the ESA VENUS EXPRESS spacecraft include the detectionof HCl and the first vertical profile of HCl in the atmosphere of Venus.1 Since precisespectroscopic data of pressure broadened lineshapes of HCl in such an environment arepresently missing, we recorded CO2 broadened spectra of the 1 − 0 band of HCl near2886 cm−1 at several pressures between 150 and 700 Torr, using a high-resolution Fouriertransform spectrometer. Similarly, we also recorded CO2 pressure broadened spectra ofthe 1 − 0 band of DCl near 2089 cm−1. Pressure broadening coefficients are extractedby least-squares fitting of Voigt and Rautian-Sobel’man profiles with the Gaussian com-ponent and self broadening parameters fixed to the Doppler width and values reportedin the literature,2 respectively. Results will be presented and discussed.
1J.L. Bertaux et al., A warm layer in Venus’ cryosphere and high-altitude measurements of HF, HCl,H2O and HDO, Nature 450 (2007) 646-649.
2A.S. Pine and A. Fried, Self-broadening in the fundamental bands of HF and HCl, J. Mol. Spectrosc.114 (1985) 148-162.
Poster Session II 68
PII-5. Recent Collisional Broadening Studies at
PhLAM in the Millimeter Range: Temperature
Dependencies and Line Shapes Analysis
Georges Wlodarczak and Francois Rohart
Laboratoire de Physique des Lasers, Atomes et Molcules, UMR Lille1-CNRS 8523,Universit de Lille 1 Btiment P5, F-59655 Villeneuve d’Ascq cedex, France; E-mail:
Remote sensing detection of molecular species of Earth and planetary atmospheresrequires a good knowledge of collisional relaxation rates, of their pressure and temper-ature dependencies as well as of the profiles of considered lines. Since several years,our laboratory has been involved in the study of the influence of molecular collisions onspectral lineshapes. We present a review of our recent results obtained in the millimeterrange, namely in the case of atmospheric interest molecules (CO 1, 2, NO 3, N2O
4, 5,O3
6, 7, 8, CH3Cl9, CH3CN
10, HCN 11,). Major results include dependencies of relaxationrates on the temperature and on the K-quantum number, as well as detailed studies oflineshape deviations from the usual Voigt profile. All these experimental results havebeen confirmed by intercomparisons with measurements from other laboratories and bytheoretical calculations.
1D. Priem, F. Rohart, J.-M. Colmont, G. Wlodarczak, J.-P. Bouanich, J. Mol. Structure, 517-518,435-454 (2000).
2J. -M. Colmont, L. Nguyen, F. Rohart, G. Wlodarcza, J. Mol. Spectrosc., 246, 86-97 (2007).3J.-M. Colmont, J.-F. D’Eu, F. Rohart, G. Wlodarczak, J. Buldyreva, J. Mol. Spectrosc., 208,
197-208 (2001).4F. Rohart, J.-M. Colmont, G. Wlodarczak, and J.-P. Bouanich, J. Mol. Spectrosc., 222, 159-171
(2003).5L. Nguyen, J. Buldyreva, J.-M. Colmont, F. Rohart, G. Wlodarczak, and E.A. Alekseev, Mol.
Physics 104, 2701-2710 (2006).6D. Priem, J.-M. Colmont, F. Rohart, G. Wlodarczak, R.-R. Gamache, J. Mol. Spectrosc., 204,
204-215 (2000).7J.-M. Colmont, B. Bakri, F. Rohart, G. Wlodarczak, J. Demaison, G. Cazzoli, L. Dore and C.
Puzzarini, J. Mol. Spectrosc., 231, 171-187 (2005).8F. Rohart, G. Wlodarczak, J.-M. Colmont, G. Cazzoli, L. Dore, C. Puzzarini, J. Mol. Spectrosc.,
251, 282-292 (2008).9J.-M. Colmont, F. Rohart, G. Wlodarczak, and J.-P. Bouanich, J. Mol. Structure, 780-781, 268-276
(2006).10J.-M. Colmont, F. Rohart, G. Wlodarczak, and J.-P. Bouanich, J. Mol. Spectrosc., 238, 98-107
(2006).11F. Rohart, L. Nguyen, J. Buldyreva, J.-M. Colmont, G. Wlodarczak, J. Mol. Spectrosc., 246,
213-227 (2007).
Poster Session II 69
PII-6. New Absorption Bands of the Carbon
Dioxide Isotopologues in Venus Spectra
S. Robert,a R. Drummond,a A. Mahieux,a V. Wilquet,a A. C. Vandaele,a
J. Vander Auwera,b Yu. Borkov,c V. I. Perevalov,c S. A. Tashkun,c
J .- L. Bertauxd
aBelgian Institute for Space Aeronomy, 3 Ave Circulaire, 1180 Brussels, Belgium
bUniversite Libre de Bruxelles, 50 Ave F.D. Roosevelt, CP 160/09, 1050 Brussels,Belgium
cV.E. Zuev Institute of Atmospheric Optics SB RAS, 1, Academician Zuev square,Tomsk 634021, Russia.
dService d’Aeronomie du CNRS, Verrieres-le-Buisson, France; IPSL, UniversiteUVSQ, 78280 Guyancourt, France
We present new absorption bands of carbon dioxide isotopologues detected by theSOIR instrument on board Venus Express. The SOIR instrument combines an echellespectrometer and an Acousto-Optical Tunable Filter for order selection. It performssolar occultation measurements in the IR region (2.2 - 4.3 µm) at a resolution of 0.12 –0.18 cm−1. The wavelength range probed by SOIR allows a detailed chemical inventoryof the Venus atmosphere above the cloud layer (65 to 150 km) to be made with emphasison the vertical distribution of gases.
The sensitivity of the SOIR instrument and the high concentration of CO2 on Venus,coupled with the long absorption paths sounded during solar occultations, enable us todetect weak absorption bands of rare CO2 isotopologues.
So far we identified the 20001 – 00001 band of 16O13C18O and the 21101 – 01101band of 16O12C18O in the SOIR spectra. Rotational analyses were performed for thesetwo new bands and also for the 01111 – 00001 band of 16O12C18O, already reported byour group1.
A systematic study of the recorded spectra is under way and preliminary results willbe discussed from a spectroscopical point of view.
1V. Wilquet, A. Mahieux, A.C. Vandaele, V.I. Perevalov, S.A. Tashkun, A. Fedorova, O. Korablev,F. Montmessin, R. Dahoo and J.-L. Bertaux, J.Q.S.R.T. 109, (2008) 895-905.
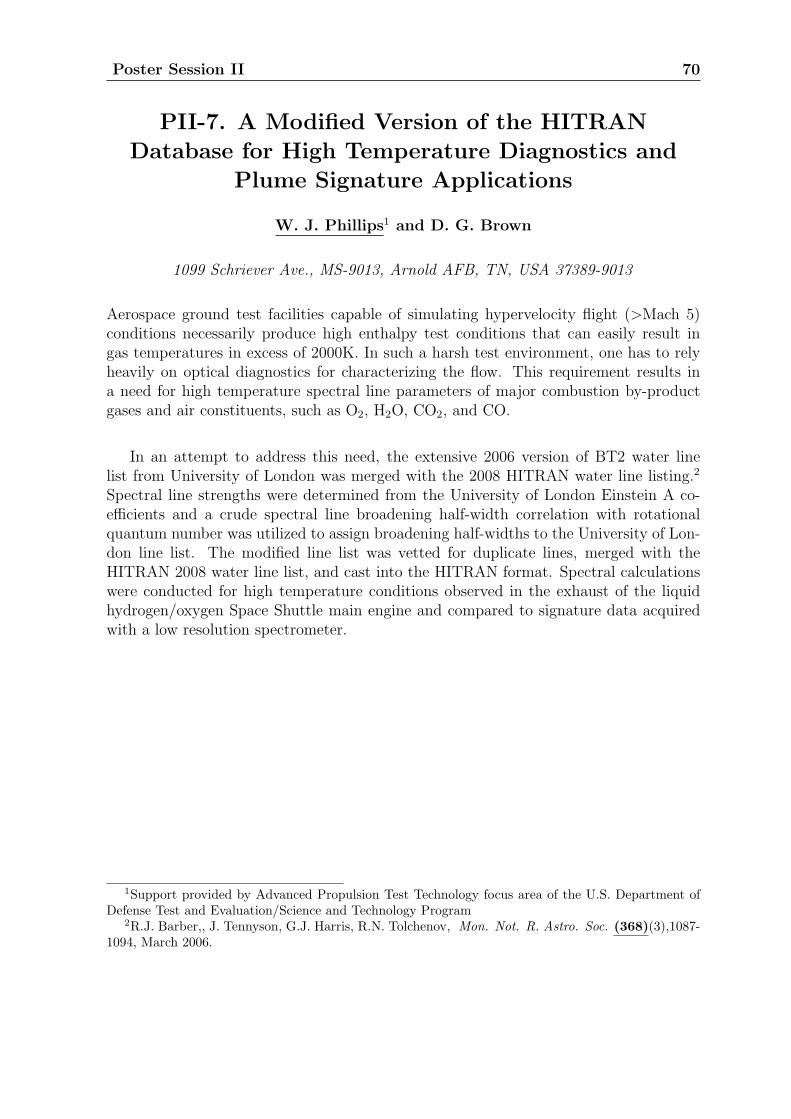
Poster Session II 70
PII-7. A Modified Version of the HITRAN
Database for High Temperature Diagnostics and
Plume Signature Applications
W. J. Phillips1 and D. G. Brown
1099 Schriever Ave., MS-9013, Arnold AFB, TN, USA 37389-9013
Aerospace ground test facilities capable of simulating hypervelocity flight (>Mach 5)conditions necessarily produce high enthalpy test conditions that can easily result ingas temperatures in excess of 2000K. In such a harsh test environment, one has to relyheavily on optical diagnostics for characterizing the flow. This requirement results ina need for high temperature spectral line parameters of major combustion by-productgases and air constituents, such as O2, H2O, CO2, and CO.
In an attempt to address this need, the extensive 2006 version of BT2 water linelist from University of London was merged with the 2008 HITRAN water line listing.2
Spectral line strengths were determined from the University of London Einstein A co-efficients and a crude spectral line broadening half-width correlation with rotationalquantum number was utilized to assign broadening half-widths to the University of Lon-don line list. The modified line list was vetted for duplicate lines, merged with theHITRAN 2008 water line list, and cast into the HITRAN format. Spectral calculationswere conducted for high temperature conditions observed in the exhaust of the liquidhydrogen/oxygen Space Shuttle main engine and compared to signature data acquiredwith a low resolution spectrometer.
1Support provided by Advanced Propulsion Test Technology focus area of the U.S. Department ofDefense Test and Evaluation/Science and Technology Program
2R.J. Barber,, J. Tennyson, G.J. Harris, R.N. Tolchenov, Mon. Not. R. Astro. Soc. (368)(3),1087-1094, March 2006.
Poster Session II 71
PII-8. Predicting half-widths and line shifts for
water vapor transitions on the HITEMP database
Robert R. Gamache,a Laurence S. Rothman,b Iouli E. Gordonb
aUniversity of Massachusetts School of Marine Sciences and Department ofEnvironmental, Earth, and Atmospheric Sciences, One University Avenue,University
of Massachusetts Lowell, Lowell, MA 01854-5045,USA
bHarvard-Smithsonian Center for Astrophysics, Atomic and Molecular PhysicsDivision, Cambridge MA 02138-1516, USA
The HITEMP database1 provides molecular spectroscopic parameters for high-temperaturemodeling of the spectra of molecules in the gas phase. Currently there are 5 molecularspecies on the database; H2O, CO2, CO, NO, OH. For H2O there are now transitionsthat have rotational quantum numbers up to J=50 and many transitions where thevibrational quantum numbers and prolate and oblate limit pseudo-quantum numbers(Ka and Kc) are not known. Line shape parameters are not available for most of thesetransitions. We have developed a method to determine these line shape parameters forthe 3 most abundant isotopologues of water based on the Semi-empirical approach ofJacquemart etal.2 and an algorithm that estimates the number of vibrational quantaexchanged in the transition. Thus, vibrational dependence of the line shape parame-ters, which has been found to be important for H2O
3, is taken into account for manytransitions. When the parameters are not available from this new algorithm, averagehalf-widhts as a function of J” are determined from a polynomial fit of validated calculat-ed data. The results of the new algorithm and the J-averaged half-widths are comparedwith the values found on the 2008 version of the HITRAN database.
1L.S. Rothman, I.E. Gordon, R.J. Barber, H. Dothe, R.R. Gamache, A. Goldman, V.I. Perevalov,S.A. Tashkun, J. Tennyson J. Quant. Spectrosc. Radiat. Transf., in press, 2010
2David Jacquemart, Robert Gamache, Laurence S. Rothman, J. Quant. Spectrosc. Radiat. Transf.96, 205-239, 2005.
3Robert. R. Gamache and Jean-Michel Hartmann, J. Quant. Spectrosc. Radiat. Transf. 83,119-147, 2004.
Poster Session II 72
PII-9. Modelling Water Spectra and their
Contribution to the Water Vapour Continuum
Matthew J. Barber, Ross E. A. Kelly, Jonathan Tennyson
Department of Physics and Astronomy, University College London, London, WC1E6BT, UK
Recent concerns regarding possible climate change have prompted a need for greateranalysis of a component of the water vapour spectrum known as the water continuum.Although this can be reasonably modelled by empirical fit, the physical basis for itis not well understood which might hide significant dependencies on variable such astemperature and pressure. Theories regarding its origin include contribution from thefar wings of poorly profiled known absorption lines, weak absorption lines, and polymericwater molecules such as dimers, trimers, etc. Assessing the contribution from the waterdimer has always been problematic because the size and position of spectral featuresvaries considerably depending on the models used.
Although the HITRAN database contains a comprehensive water line list, this iscut off at a relatively high intensity in many regions. As such, we have produced anenhanced water line list from both theoretical sources, particularly the BT2 line listproduced earlier at UCL, and recent experimental measurements particularly in weakregions with little HITRAN data. This extended list allows us to explain some spectralfeatures that cannot be accounted for by the HITRAN database alone.
Additionally, using quantum chemistry models, it is possible to produce an ab initiospectrum for the water dimer, although this is computationally very expensive due tothe large number (of the order of billions) of possible states and the even larger numberof transitions between them. However, using a Franck-Condon style approach, we canapproximate a band spectrum for the water dimer, simulating the rotational structureby other means.
Poster Session II 73
PII-10. Water Vapor Line Measurements to Improve
the Continuum Contribution in the THz Region
D. F. Plusquellic,a V. B. Podobedov,a K. Siegrist,a G. T. Fraser,a
K. O. Douglass,a E. Gerecht,a and Q. Mab
aNational Institute of Standards and Technology, Physics Lab, Biophysics Group,Gaithersburg, MD 20899, USA
bNASA Goddard Institute for Space Studies, and Department of Applied Physics andApplied Mathematics, Columbia University, 2880 Broadway, New York, NY 10025,
USA
Experimental THz measurements of the linewidths, integrated intensities, pressure andtemperature-induced lineshift parameters for several water vapor lines in the range abovethe 45 cm−1 atmospheric transmittance window are reported. The measurements wereperformed using a THz photomixer spectrometer in a single-pass absorption cell forpressures from 0.13 kPa to 1 kPa (1 to 8 Torr) H2O vapor and up to 80 kPa (600 Torr)N2 or O2 over a temperature range from 293 to 328 K. The reduced uncertainties asso-ciated with the local contributions of these water vapor lines will enable more accuratedeterminations of the continuum contribution throughout this region. We also reporton a new method based on chirped pulse methods 1 that will improve the accuracy oflineshape measurements in the THz region.
1B. C. Dian, G. G. Brown, K. O. Douglass, F. S. Rees, J. E. Johns, P. Nair, R. D. Suenram andB. H. Pate, PNAS, 105, 12696 (2008)
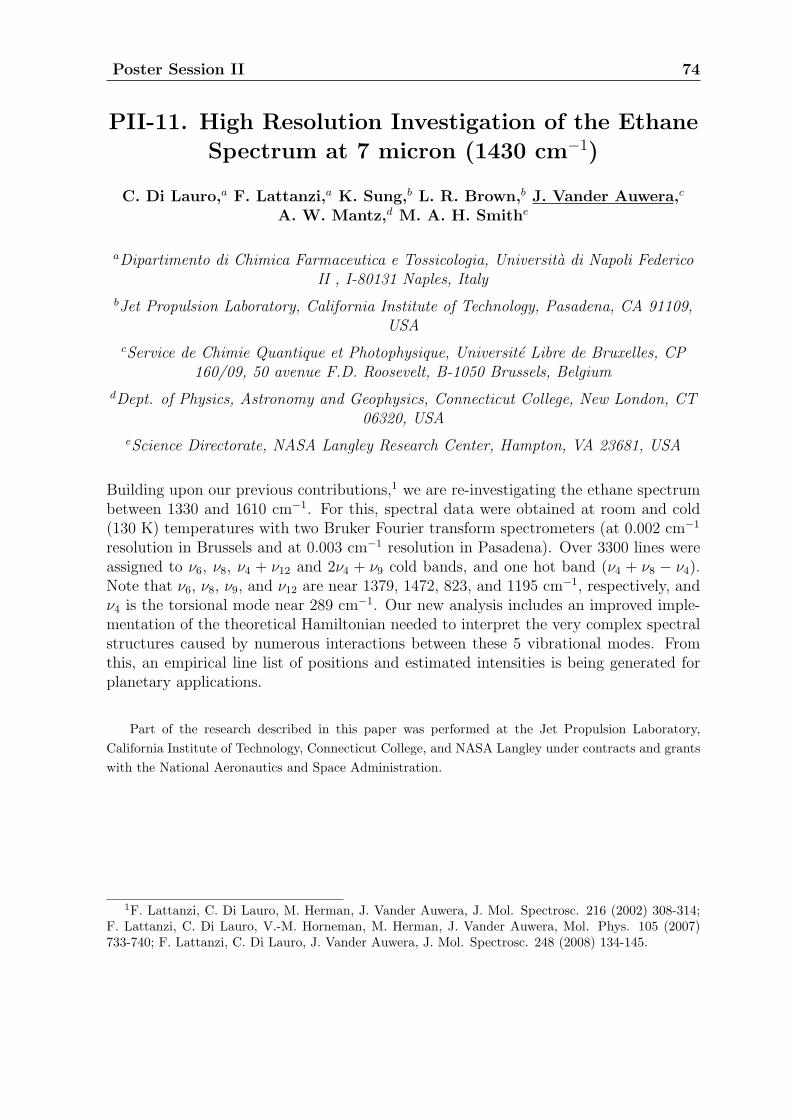
Poster Session II 74
PII-11. High Resolution Investigation of the Ethane
Spectrum at 7 micron (1430 cm−1)
C. Di Lauro,a F. Lattanzi,a K. Sung,b L. R. Brown,b J. Vander Auwera,c
A. W. Mantz,d M. A. H. Smithe
aDipartimento di Chimica Farmaceutica e Tossicologia, Universita di Napoli FedericoII , I-80131 Naples, Italy
bJet Propulsion Laboratory, California Institute of Technology, Pasadena, CA 91109,USA
cService de Chimie Quantique et Photophysique, Universite Libre de Bruxelles, CP160/09, 50 avenue F.D. Roosevelt, B-1050 Brussels, Belgium
dDept. of Physics, Astronomy and Geophysics, Connecticut College, New London, CT06320, USA
eScience Directorate, NASA Langley Research Center, Hampton, VA 23681, USA
Building upon our previous contributions,1 we are re-investigating the ethane spectrumbetween 1330 and 1610 cm−1. For this, spectral data were obtained at room and cold(130 K) temperatures with two Bruker Fourier transform spectrometers (at 0.002 cm−1
resolution in Brussels and at 0.003 cm−1 resolution in Pasadena). Over 3300 lines wereassigned to ν6, ν8, ν4 + ν12 and 2ν4 + ν9 cold bands, and one hot band (ν4 + ν8 − ν4).Note that ν6, ν8, ν9, and ν12 are near 1379, 1472, 823, and 1195 cm−1, respectively, andν4 is the torsional mode near 289 cm−1. Our new analysis includes an improved imple-mentation of the theoretical Hamiltonian needed to interpret the very complex spectralstructures caused by numerous interactions between these 5 vibrational modes. Fromthis, an empirical line list of positions and estimated intensities is being generated forplanetary applications.
Part of the research described in this paper was performed at the Jet Propulsion Laboratory,
California Institute of Technology, Connecticut College, and NASA Langley under contracts and grants
with the National Aeronautics and Space Administration.
1F. Lattanzi, C. Di Lauro, M. Herman, J. Vander Auwera, J. Mol. Spectrosc. 216 (2002) 308-314;F. Lattanzi, C. Di Lauro, V.-M. Horneman, M. Herman, J. Vander Auwera, Mol. Phys. 105 (2007)733-740; F. Lattanzi, C. Di Lauro, J. Vander Auwera, J. Mol. Spectrosc. 248 (2008) 134-145.
Poster Session II 75
PII-12. Calculated Line Intensities for the
Deuterated Isotopologues of the Hydrogen Sulphide:
Range of Fundamentals and First Polyads
Vladimir G. Tyuterev,a Julien Lamouroux,b S. A. Tashkunc
aG. S. M. A. UMR CNRS 6089, Universite de Reims, B.P. 1039, 51687 Reims Cedex2, France
bUniversity of Massachusetts School of Marine Sciences, Department ofEnvironmental, Earth, and Atmospheric Sciences, One University Avenue,University
of Massachusetts Lowell, Lowell, MA 01854-5045,USA
cInstitute of Atmospheric Optics, RAN, 1, av. Akademicheskii, 634055 Tomsk, Russia
We study the effect of isotopic substitutions on the line intensities in the hydro-gen sulphide molecule. The infrared line intensities were calculated from the ab initiodipole moment surfaces using two independent methods : variational calculations1 andhigh-order contact transformations2,3. Results are compared with experimental FTSmeasurements made in Reims University1,4,5. The theoretical line list in the Hitran for-mat was generated for the D2S triad bands. A support from IDRIS computer centre ofCNRS France and from GDRI SAMIA collaboration program is acknowledged.
1Vl. G. Tyuterev, L. Regalia-Jarlot, D. W. Schwenke, S. A. Tashkun, and Y. G. Borkov, ComptesRendus Physique 5, 189-199 (2004)
2Vl. G. Tyuterev, S. A. Tashkun, and H. Seghir, SPIE 5311, 164-175 (2004), doi:10.1117/12.5456413J. Lamouroux, S. A. Tashkun, and Vl. G. Tyuterev, Chem. Phys. Lett. 452, 225-231 (2008)4J. Lamouroux, L. Regalia-Jarlot, Vl. G. Tyuterev, X. Thomas, P. Von der Heyden, S. A. Tashkun,
and Yu. Borkov, J. Mol. Spectrosc. 250, 117-125(2008)5J. Lamouroux, L. Regalia-Jarlot, and Vl. G. Tyuterev, to be published
Poster Session II 76
PII-13. Critical Evaluation of the
Vibrational-Rotational Transitions of Hydrogen
Sulfide and its Isotopologues from 0 to 16500 cm−1
O. V. Naumenko1,a L.R. Brown2,b A. Campargue3,c S.-M. Hu4,d
E. R. Polovtseva,a A. Z. Fazliev5,a and S. A. Tashkuna
aV.E. Zuev Institute of Atmospheric Optics SB RAS, Zuev Square, 1, Tomsk 634021,Russia
bJet Propulsion Laboratory, California Institute of Technology, Mailstop 183-601, 4800Oak Grove Drive, Pasadena, CA 91109, USA
cLaboratoire de Spectrometrie Physique (Associated with CNRS, UMR 5588),Universite Joseph Fourier de Grenoble, B.P. 87, 38402 Saint-Martin-d’Heres Cedex,
France
dHefei National Laboratory for Physical Sciences at Microscale, Department ofChemical Physics, University of Science and Technology of China, Hefei 230026, China
More than 30000 rovibrational transitions of the H232S, H2
34S, H233S, HD32S and D2
32Smolecules from 35 literature sources have been collected and critically evaluated based onthe effective Hamiltonian calculations in the 0-16500 cm−1 spectral region. The consis-tent set of rovibrational energy levels has been derived for each considered isotopologuefrom the solution of the Rydberg-Ritz system of linear equations using the RITZ com-puter code. For the main isotope species H2
32S , more than 7000 precise energy levels andassociated uncertainties have been obtained. The (000) energy levels have been modeledwith an accuracy close to experimental value using the generationfunctions approach.Detailed and accurate absorption spectra of the H2
32S, H234S, and H2
33S molecules havebeen generated in the 2000-7000 cm−1 region from the derived sets of the experimentalupper and lower energy levels and transitions intensities calculated within the effectiveHamiltonian approach using published dipole moment parameters. The numerical infor-mation obtained has been deposited in Internet accessible information system W@DIS(http://wadis.saga.iao.ru).
1The supports by RFBR (grant 10-05-91176), and by the Groupement de Recherche InternationalSAMIA between CNRS (France), RFBR (grant 09-05-93105, Russia) and CAS (China) are acknowl-edged
2Part of the research at the Jet Propulsion Laboratory, California Institute of Technology wasperformed under contracts and grants with National Aeronautics and Space Administration
3The support by the Groupement de Recherche International SAMIA between CNRS (France),RFBR (Russia) and CAS (China) is acknowledged
4The support by the Groupement de Recherche International SAMIA between CNRS (France),RFBR (Russia) and CAS (China) is acknowledged
5The support by RFBR research grant 08-07-00318 is gratefully acknowledged

Poster Session II 77
PII-14. Line Parameters of the H35Cl R(3)
Absorption Line in the First Overtone at up to
10 bar
V. Ebert,a,b,c P. Ortwein,a,b W. Woiwode,b M. Gisi,b S. Wagnerb
aPhysikalisch-Technische Bundesanstalt, Bundesallee 100, 38116 Braunschweig,Germany
bInstitute of Physical Chemistry, University of Heidelberg, INF 253, 69120 Heidelberg,Tel.: +49-6221-545004, [email protected], www.gasanalysis.org
cCenter of Smart Interfaces, Technische Universitt Darmstadt, Petersenstraße 32,64287 Darmstadt
The detection of HCl plays an important role in atmospheric chemistry as well as in com-bustion and gasification processes. A sensitive HCl measurement especially in gasifica-tion processes with high process temperatures and pressures requires a precise knowledgeof the spectroscopic line parameters. In particular self and foreign broadening coefficientsare of great interest, especially due to the discrepancies in pressure broadening coeffi-cients and line strength between HITRAN 2004 and recent data by De Rosa 1. Using anew vertical cavity surface emitting laser (VCSEL) at 1.74µm with a wide current tun-ing range of 10 cm-1 a highly sensitive TDLAS spectrometer was developed to realizean analysis of the H35Cl R(3) absorption line. This high resolution spectrometer wasused to determine the line strength S(T0)=12.53(11)·10−21 cm−1/(molec·cm−2) and theself broadening coefficient γ0
HCl=0.021787(61) cm−1/atm of the R(3) absorption line inthe first overtone (2←0) rovibrational band for H35Cl. Furthermore we present the firstlaser-based high-pressure study on the pressure broadening coefficients of HCl by He, N2
and O2 covering pressures of up to 1 MPa (γ0N2=0.07292(5) cm−1/atm, γ0
He=0.02113(1)cm−1/atm, γ0
O2=0.03978(6) cm−1/atm). The results are compared to previously avail-
able low pressure data. Further comparisons with FT-IR based line parameter studiescovering the entire overtone band are in progress.
1M. De Rosa, C. Nardini, C. Piccolo, C. Corsi, F. D’Amato, Pressure Broadening and shift oftransitions of the first overtone of HCl, Appl. Phys. B 72, 245-248 (2001).

Poster Session II 78

SESSION VI: Database Structure
79
SESSION VI: Database Structure 80
VI-1. Information System to Access HITRAN via
the Internet
Yury L. Babikov,a Semen N. Mikhailenko,a Sergey A. Tashkun,a
Iouli E. Gordon,b Laurence S. Rothmanb
aV.E. Zuev Institute of Atmospheric Optics, 634021, Tomsk, RUSSIA
bHarvard-Smithsonian Center for Astrophysics, Atomic and Molecular PhysicsDivision, Cambridge MA 02318, USA
We present an information system to access the HITRAN database via the Internet.The system consists of two major components HITRAN/SQL and HITRAN on theWeb. HITRAN/SQL is a relational database based on the HITRAN data. Access to thedata is controled by the MySQL database management system. HITRAN on the Webis a software engineering tool based on the Model-View-Controller (MVC) architecture.Within the MVC approach the data model of an application, the user interface andthe operating logic are considered as separate components so that updating of one ofthe components has minimum influence on others. A spectroscopic information systemSPECTRA 1 developed in V.E. Zuev Institute of Atmospheric Optics SB RAS is aprototype realization of MVC. SPECTRA is available via the site spectra.iao.ru as wellas via HITRAN site www.cfa.harvard.edu/hitran/ under menu item ’other lists’. Amongfunctionality of the system we can to note the following:
1 survey of the content of the HITRAN databank;
2 calculation and visualization for a given gas mixture and selected conditions (spec-tral region, line profile, apparatus function, temperature, pressure, resolution, etc) stickintensity spectra, absorption/transmission coefficients, etc as function of wavenumberor line length;
3 spectra convolution with a given apparatus function;
4 downloading results in various formats on a user’s computer and sending them viae-mail;
5 detailed bibliography in an appropriate domain.
Authors thank financial support from a joint CRDF (RUG1-2954-TO-09) and RFBR(09-05-92508) grant.
1S. N. Mikhailenko, Yu. L. Babikov, V. F. Golovko, Atmos.Ocean.Opt., 18, 685 (2005)
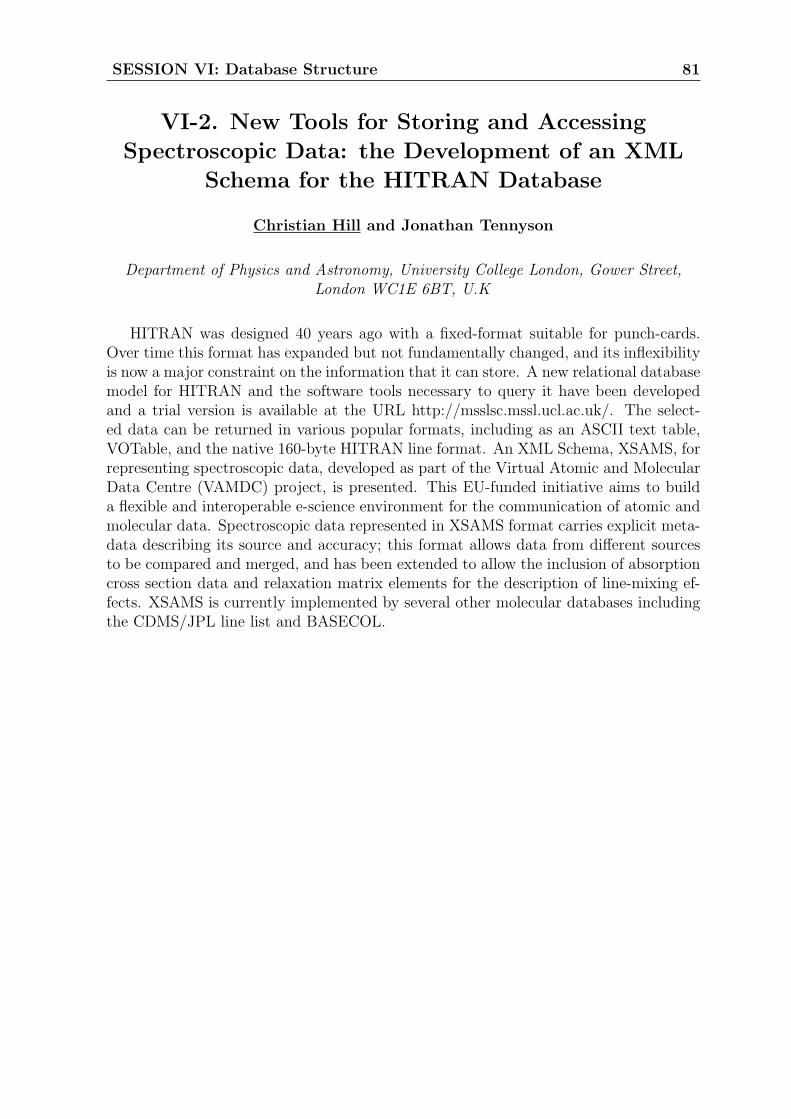
SESSION VI: Database Structure 81
VI-2. New Tools for Storing and Accessing
Spectroscopic Data: the Development of an XML
Schema for the HITRAN Database
Christian Hill and Jonathan Tennyson
Department of Physics and Astronomy, University College London, Gower Street,London WC1E 6BT, U.K
HITRAN was designed 40 years ago with a fixed-format suitable for punch-cards.Over time this format has expanded but not fundamentally changed, and its inflexibilityis now a major constraint on the information that it can store. A new relational databasemodel for HITRAN and the software tools necessary to query it have been developedand a trial version is available at the URL http://msslsc.mssl.ucl.ac.uk/. The select-ed data can be returned in various popular formats, including as an ASCII text table,VOTable, and the native 160-byte HITRAN line format. An XML Schema, XSAMS, forrepresenting spectroscopic data, developed as part of the Virtual Atomic and MolecularData Centre (VAMDC) project, is presented. This EU-funded initiative aims to builda flexible and interoperable e-science environment for the communication of atomic andmolecular data. Spectroscopic data represented in XSAMS format carries explicit meta-data describing its source and accuracy; this format allows data from different sourcesto be compared and merged, and has been extended to allow the inclusion of absorptioncross section data and relaxation matrix elements for the description of line-mixing ef-fects. XSAMS is currently implemented by several other molecular databases includingthe CDMS/JPL line list and BASECOL.
SESSION VI: Database Structure 82
VI-3. Publishing Tools for a Distributed
Information System
A.Z. Fazliev1, N.A. Lavrentiev, and A.I. Privezentsev
V.E. Zuev Institute of Atmospheric Optics SB RAS, Zuev Square, 1, Tomsk 634021,Russia
At present the competitive mechanisms of acquisition, interchange and retrieval ofmolecular spectroscopy digital data are e-mail, ftp-servers and the information systemsbased on Internet technologies. The information systems unite their resources by inter-changing the data or by executing the queries to the resources of third-party informationsystems and thus turning into distributed information system2, or socializing the meta-data of these systems, in a virtual data center3.
The creation of collective use tools requires the unification of resources. In our reportsome features of publication tools, partially developed by our group in the framework ofVAMDC project4, are discussed. Two of them, namely, data validity and data manipu-lation, are the main topic of the report.
The verification of formal constraints on the physical quantities published in papersand their information representation in composite data sources is of particular interest inproblems of data validity. The following two types of constraints are discussed. The firstone is the restrictions on the values of physical quantities derived from the mathematicalmodel of processes, in particular, selection rules. The results of the verification of morethan 700 primary data sources related to water spectroscopy are discussed. Another typeof restrictions relate to the fact of data publication (existence constraint). The results ofthe checkup applied to Hitran data for a series of water isotopomers are discussed. Thesecheckups are based on the data collected by IUPAC group5. The problem of creationof an information system containing a complete set of published data for a series ofatmospheric molecules is discussed. The state of the art of the problem developed inIAO SB RAS is described.
Data manipulation tools are oriented on the data preparation for the solution ofinverse problems of spectroscopy and the calculation of spectral functions. The toolsprovide the data retrieval in DIS, data transformation to different formats, and theexecution of a set of binary operations. The tools will provide end-users possibility todevelop and correct the composite data sets on the basis of published information. Thetypical restrictions used in these operations are discussed.
1The support by EU FP7 ”Research Infrastructures - INFRA-2008-1.2.2” is gratefully acknowledged2A.D. Bykov, A.Z. Fazliev, N.N. Filippov et al., Geophysical Research Abstracts, SRef-ID: 1607-
7962/gra/EGU2007-A-01906, 9, 01906 (2007)3M.-L. Dubernet, Abstracts of Reports, XVI Symposium on High resolution Molecular Spectroscopy,
2009, Listvyanka, p.63 (2009)4Virtual Atomic and Molecular Data Centre, http://vamdc.eu5J.Tennyson, P.F.Bernath, L.R.Brown et al., JQSRT, 110, 573 (2009)
SESSION VI: Database Structure 83
VI-4. JPL Catalog Upgrades: New Tools, New
Formats and New Interfaces
Brian J. Drouin, Shanshan Yu, John C. Pearson
Jet Propulsion Laboratory, California Institute of Technology, Pasadena, CA91109-8099
A makeover of the JPL Millimeter and Submillimeter Spectral Line Catalog hasbegun. This process is intended to provide ‘single-line-access’ to users and virtual as-tronomy facilities through a server/query interface. In order to provide these users withthe maximum amount of reliability and trace-ability, the database format (traditionallyascii-text files on an http/ftp server) has been expanded to include data and data-sourcesin a format where the measurement data is listed independently of the model predictedline information. This information, although still accessible through the source text-files, is also compiled into a MySQL database. This methodology allows merging ofmeasurement and prediction to be done at the meta-data level and gives the user quickaccess to the literature source.
Several databases (inlcuding the NIST rest frequencies and CDMS) with common in-formation are each following a common methodology outlined for unified access to usersvia a ‘virtual observatory’. Along with common formats, a special internet protocol,‘Single-Line-Access-Protocol’ (SLAP) is to be instituted on the web-servers where thesedatabases reside. This should enable the next generation of spectroscopic tools (i.e. at-mospheric and astrophysical models) to be built on a flexible data layer which can accessnew database additions and changes without the need for localizing the information.
Through the upgrade process we intend to update and improve the current listings ofthe JPL catalog, with an emphasis on the trace-ability of the data to its source literature.The advent of grand modeling tools that support ever larger projects has the potential ofleaving the data sources long forgotten. We intend to vitalize and encourage the linkingof spectroscopic observations to the fundamental laboratory spectroscopy that forms thefoundation of remote sensing.
SESSION VI: Database Structure 84
VI-5. SPECTRAFACTORY.NET: a Database of
Molecular Model Spectra for Astronomers
Jan Camia and Andrew J. Markwickb
aDepartment of Physics & Astronomy, University of Western Ontario, London,ON N6A 3K7, Canada
bJodrell Bank Centre for Astrophysics, School of Physics & Astronomy, University ofManchester, Manchester, UK
SpectraFactory.net is a homogeneous database of synthetic molecular absorption andemission spectra from the optical to mm wavelengths that is aimed at providing observa-tional astronomers with an intuitive tool to identify spectral features of molecular origin.All spectra are calculated in the LTE limit from several molecular line lists (includingHITRAN), and are presented at various spectral resolving powers corresponding to sever-al specific astronomical instruments, including various ground-based observatories (e.g.Gemini, ESO-VLT) as well as space-based instruments (e.g. ISO, Spitzer, Herschel).The database is available online at http://www.spectrafactory.net, where users canfreely browse, search, display and download the spectra. Additional model spectra canbe requested for (automatic) calculation and inclusion. The database already containsover half a million model spectra for 39 molecules (96 different isotopologues) over thewavelength range 350nm – 3mm (≈ 3 – 30000 cm−1).
SpectraFactory contains model spectra for a large range of temperatures and columndensities that are relevant for various astrophysical purposes, but in particular for theidentification and first-order analysis of molecular bands in spectroscopic astronomicalobservations. We will show a few examples of how these spectra have been used invarious astrophysical contexts, discuss limitations and species on our “wish list”, andbriefly look at future updates and tools.
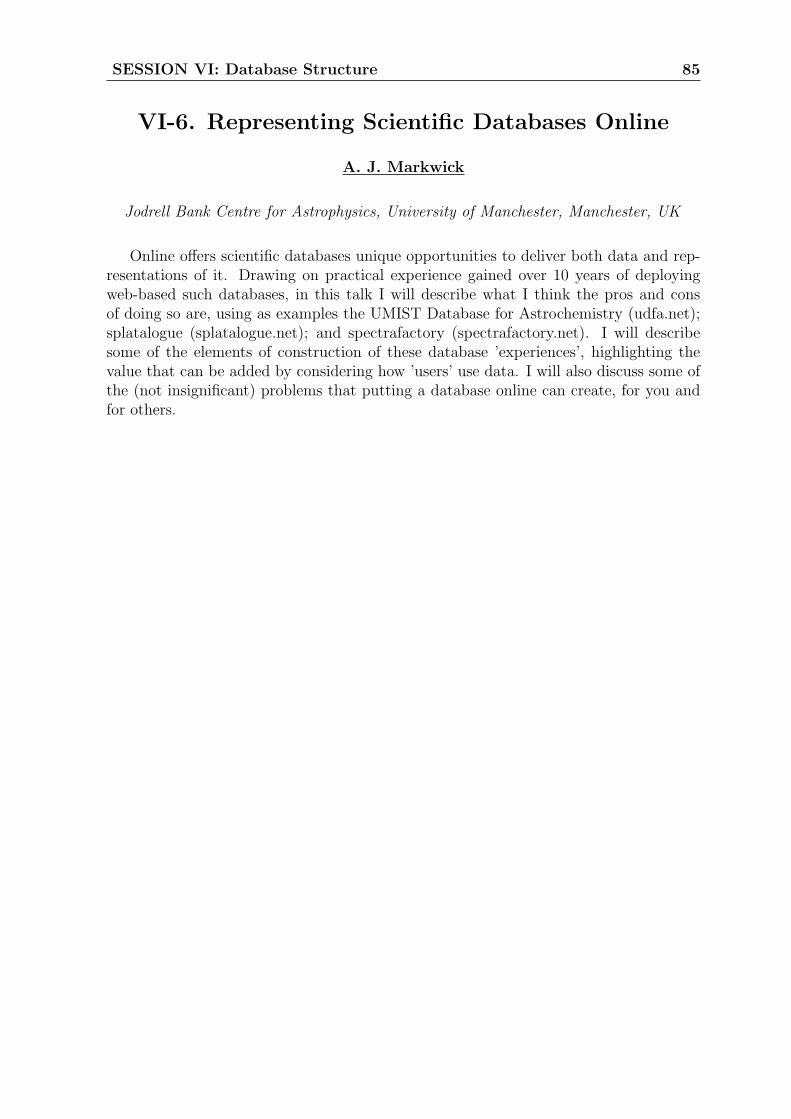
SESSION VI: Database Structure 85
VI-6. Representing Scientific Databases Online
A. J. Markwick
Jodrell Bank Centre for Astrophysics, University of Manchester, Manchester, UK
Online offers scientific databases unique opportunities to deliver both data and rep-resentations of it. Drawing on practical experience gained over 10 years of deployingweb-based such databases, in this talk I will describe what I think the pros and consof doing so are, using as examples the UMIST Database for Astrochemistry (udfa.net);splatalogue (splatalogue.net); and spectrafactory (spectrafactory.net). I will describesome of the elements of construction of these database ’experiences’, highlighting thevalue that can be added by considering how ’users’ use data. I will also discuss some ofthe (not insignificant) problems that putting a database online can create, for you andfor others.

SESSION VI: Database Structure 86

SESSION VII: PlanetaryAtmospheres
87
SESSION VII: Planetary Atmospheres 88
VII-1. Recent Advances in the Spectroscopy of
Planetary and Exoplanetary Atmospheres : What is
out There?
Pierre Drossart
LESIA, Observatoire de Paris, 5, place Jules Janssen, 92195 Meudon, France
Since the early times of planetary spectroscopy with the detection of CH4 on Jupiter(Herzberg, 1938), molecular spectroscopy has been essential to planetary atmospheresinvestigations. Both disciplines have presented a joint development and improvementsof the techniques in planetary spectroscopy, together with laboratory and theoreticalspectroscopy is an example of a fruitful interdisciplinary co-evolution.
Current questions in planetary atmospheres are now also shifted towards the un-derstanding of exoplanets, where recent detections at low spectral resolution of H2O,CH4, CO2 or CO (Tinetti et al, 2010) raise new questions about planetary evolution.Modeling of exoplanets poses a new challenge to spectroscopists, by requiring models athigh temperature and shorter wavelength in the near infrared, implying to analyze hotbands and high-J rotational levels sometimes neglected in previous studies.
Despite a higher complexity in band analysis, with more combination bands and hotbands of simple molecules, or the detection of minor species of heavier molecules, thefrontier of extended molecular spectroscopic database has moved towards near-infraredrange, giving access to new studies for Venus, Giant Planets or Exoplanets deep atmo-spheres.
Some examples will be given from recent observations by space probes, includingHershel ESA space telescope.
SESSION VII: Planetary Atmospheres 89
VII-2. Titan’s Neutral Atmospheric Chemistry from
the Astronomical Point of View
Athena Coustenis
LESIA, Paris-Meudon Observatory, 5, place Jules Janssen, 92195 Meudon Cedex,France; [email protected]
Our understanding of Titan’s atmospheric chemical composition has recently beenenhanced by the data returned by the Cassini instruments. Spectra recorded by theComposite Infrared Spectrometer (CIRS) aboard the Cassini spacecraft became avail-able during the Titan flybys spanning three years now since SOI (Flasar et al., 2005;1
Teanby et al., 2006, 2007;2 Vinatier et al., 2007;3 Nixon et al., 2008;4 Coustenis et al.,2007,2008a5). The spectra characterize various regions on Titan with a variety of emis-sion angles, and they pertain to the region between 70 and 500 km in altitude roughly.The 3 CIRS focal planes (covering the 10-1500 cm−1 spectral range with apodized reso-lutions of 2.54 or 0.53 cm−1 ) give access to the thermal structure and the composition ofTitan, containing several signatures of identified molecules: hydrocarbons (CH4, CH3D,C2H2, C2HD, C2H4, C2H6, C3H4, C3H8, C4H2, C6H6, nitriles (HCN, HC3N) and oxygencompounds (H2O, CO and CO2). In addition, several isotopes of C, N and O have beendetected. The meridional variations of the trace constituents are tied to predictions bydynamical-photochemical models (Crespin et al., 2008;6 Lavvas et al., 20077). I willreview our current understanding of the chemical composition in Titan’s stratospherefrom space and ground-based observations. The latter concern mainly the near-IR rangefrom 0.8 to 5 micron, where a precise knowledge of the methane opacity is required tobe able to infer other parameters, such as the surface composition. Titan studies requiremore and more precise information on the spectroscopic parameters in order to ren-der models more accurate and performing. In trying to characterize Titans atmospherefrom ground-based, ISO (Coustenis et al., 2006) or Cassini data one finds lacks in suchparameters for known molecules, but also for the possible candidates predicted by pho-tochemical models and laboratory simulations. I will discuss our current understanding(and lack thereof) of such input and in particular of the methane absorption coefficientsin the near-IR and of the spectroscopic parameters for some molecules which could beuseful for identifying new molecules in Jupiter, Saturn or Titan data
1Flasar et al., 2005, Science 308, 975.2Teanby et al., 2006, Icarus 181, 243; 2008, Icarus, 193, 595.3Vinatier et al., 2007, Icarus, 188, 120.4Nixon et al., 2008, 195, 778; 2009, Icarus, in press5Coustenis et al., 2006, Icarus 180, 176; 2007, Icarus, 189, 35, 2008; Icarus 197, 539, 2010; Icarus, in
press.6Crespin et al., 2008, Icarus, 197, 556.7Lavvas et al., 2008, Plan. Space Sci., 56, 27-99.

SESSION VII: Planetary Atmospheres 90
VII-3. High-Resolution Analysis of Various Propane
Bands: Modeling of Titan’s Infrared Spectrum
J.-M. Flaud
Laboratoire Inter Universitaire des Systemes Atmospheriques, CNRS, UniversiteParis Est et Paris 7, 61 Av du General de Gaulle, 94010 Creteil Cedex France
Optical measurements of atmospheric minor constituents are carried out using spec-trometers working in the UV, visible, infrared and microwave spectral ranges. In allcases the quality of the analysis and of the interpretation of the atmospheric spectra re-quires the best possible knowledge of the molecular parameters of the species of interest.To illustrate this point we will concentrate on recent laboratory studies of propane.
Propane gas, which was first detected in the atmosphere of Titan by the Voyager1IRIS spectrometer during the 1980 encounter, remains the heaviest saturated hydro-carbon (alkane) found there to date. The Composite Infrared Spectrometer (CIRS)instrument carried on-board the Cassini spacecraft possesses a much improved spectraland spatial resolution, and sensitivity over IRIS showing then clearly for the first timea multitude of propane bands. Thanks to a new line atlas for three bands of propaneat shorter wavelengths (6-8 µm) it proved possible to model these weaker bands andto check the measurements made by CIRS using the “usual” 13 µm band alone. Wewill present the CIRS spectra showing all the visible propane bands and will report onthe progress in the modelling of the 6-8 and 13 µm bands, and give an update on thepropane abundance in the Titan atmosphere.

SESSION VIII: Laboratoryspectroscopy-2
91
SESSION VIII: Laboratory spectroscopy-2 92
VIII-1. High-Resolution Tunable Diode Laser
Spectroscopic Parameters for Atmospheric
Applications and Comparisons with HITRAN
Virginie Zeninari, Bertrand Parvitte, Lilian Joly, Georges Durry
Groupe de Spectrometrie Moleculaire et Atmospherique, Universite de ReimsChampagne-Ardenne, Fac des Sciences, Moulin de la Housse, BP 1039, 51687 Reims
Cedex 2, Email : [email protected]
High resolution laboratory tunable diode laser spectrometers are nowadays commonlyused to obtain accurate line rovibrational spectroscopic parameters in the infrared suchas line strengths, self- and air-pressure broadening parameters, and their variation withtemperature. Such a spectrometer presents the advantage to record one single lineat high resolution (> 1000 points/spectrum) in ≈10 ms. Thus the thermodynamicparameters (pressure, concentration, temperature) remain stable during the recording.These advantages are combined to a statistical study of the line parameters at variouspressures, then parameters given at 296K can be compared to HITRAN.
Several tunable diode laser spectrometers have been developed in the GSMA laserteam since approximately ten years. These spectrometers have been applied to severalspecific line parameters studies for atmospheric applications. Numerous examples willbe presented: H2O in the 1.39 µm region and CO2 in the 1.60 µm region for the SDLAinstrument, H2O, CO2 and their isotopologues for the TDLAS instrument, N2O in the 7.9µm region for the SPIRALE instrument and CO2 near 2.05 µm for LIDAR applications.Accurate air pressure-shifts measurements for this region are still in progress. All theseresults will be thoroughly compared to HITRAN parameters.
To conclude, one can note that high resolution tunable diode laser spectroscopy havethe main drawback to study only few lines in front of a whole vibrational band usuallyobtained with a Fourier-Transform instrument. Thus we currently develop an external-cavity laser to obtain a broadely tunable laser. This type of source will permit to studyall ro-vibrational line parameters of an entire band at high resolution includind lineshape studies.

SESSION VIII: Laboratory spectroscopy-2 93
VIII-2. Laser Spectroscopic Study of Ozone in the
100⇐000 Band for the SWIFT Instrument
Mickael Guinet, Didier Mondelain, Christof Janssen and ClaudeCamy-Peyret
Laboratoire de Physique Molculaire pour l’Atmosphre et l’Astrophysique, UMR 7092,CNRS / UPMC Univ Paris 06, F-75005, Paris, France
A complete spectroscopic study of 15 strong ozone lines in the 1132.5− 1134.5 cm−1 spec-tral range has been undertaken in the framework of the development of the StratosphericWind Interferometer For Transport studies (SWIFT),1 led by the Canadian Space Agen-cy. Measurements have been performed with an interferometrically stabilized tunablediode laser spectrometer. Absolute line positions and intensities have been determinedwith high accuracy (4× 10⁻⁵ cm−1 and 1 to 2%, respectively). Self- and air-broadeningcoefficients at 296 K have been obtained with an accuracy of 1%. The air-shifting co-efficient and its temperature dependence have also been measured for unblended linestogether with the temperature dependence of the air-broadening. We also performed anabsolute measurement of the UV cross section at 253.65 nm. This value is in agreementwith the value of Mauersberger 2 and lower (1.4%) than the currently recommended val-ue of Hearn3. UV and IR absorption signals have been measured simultaneously. Usingour UV value to calibrate the ozone concentration, we find line intensities that are 2.2%higher than HITRAN 2008 and they are higher by 2.6% if we use Mauersbergers UVcross section. This inconsistency of 3.6% between currently recommended IR intensities(HITRAN08) and UV cross sections3,4 is in support of a previous study 5.
1Guinet M., Mondelain D., Janssen C., Camy-Peyret C. JQSRT 11, 961–972, 2010.2Mauersberger K., Hanson D., Barnes J., Morton J. J. Geophys. Res. 92, 8480–8482, 1987.3Hearn A. G. Proc. Phys. Soc. 78, 932–940, 1961.4Bass A. M., Paur R. J. Ozone Symposium, Greece, 1984.5Picquet-Varrault B., Orphal J., Doussin J.-F., Carlier P., Flaud J.-M. J. Phys. Chem. A 109,
10081014, 2005.

SESSION VIII: Laboratory spectroscopy-2 94
VIII-3. New Acetone Absorption Cross Sections for
ACE Retrievals
N. D. C. Allen, J. J. Harrison, P. F. Bernath
Department of Chemistry, University of York, Heslington, York, YO10 5DD, UnitedKingdom
ACE (Atmospheric Chemistry Experiment) is a Canadian-led mission on board thesatellite SCISAT-1. The satellite has a Fourier Transform Spectrometer (FTS) whichcollects high resolution spectra in the infrared region of the electromagnetic spectrum(750-4400 cm−1) using the solar occultation technique in order to detect a wide rangeof trace chemical species. The retrieval of these species relies upon the use of theHITRAN database for spectroscopic line parameters and absorption cross sections.
There is growing scientific interest in the remote detection of Volatile Organic Com-pounds (VOCs) in the atmosphere and the effect their emissions have on air quality. Thesignificance of these species arises from their participation in a large number of photo-chemical reactions including the production of tropospheric ozone, which is governed bythe mixing ratios of both nitrogen oxides (NOx) and VOCs.
Acetone (C3H6O) is an abundant Oxygenated Volatile Organic Compound (OVOC)with a free tropospheric background concentration of up to 0.5 ppb in clean air at North-ern mid-latitudes. Acetone has a large biogenic source including plant growth and decay,as well as oxidation of organic precursors such as terpenes. This tropospheric tracer gashas a lifetime estimated to be between 10 and 20 days and can be used to detect biomassplumes.
The global acetone budget is poorly constrained and, like many larger VOCs, there isinsufficient laboratory spectroscopic data. A new set of high resolution acetone infraredabsorption cross sections have been recorded and the spectroscopic data will be added tothe HITRAN database. A full global distribution of acetone is being retrieved from ACE.
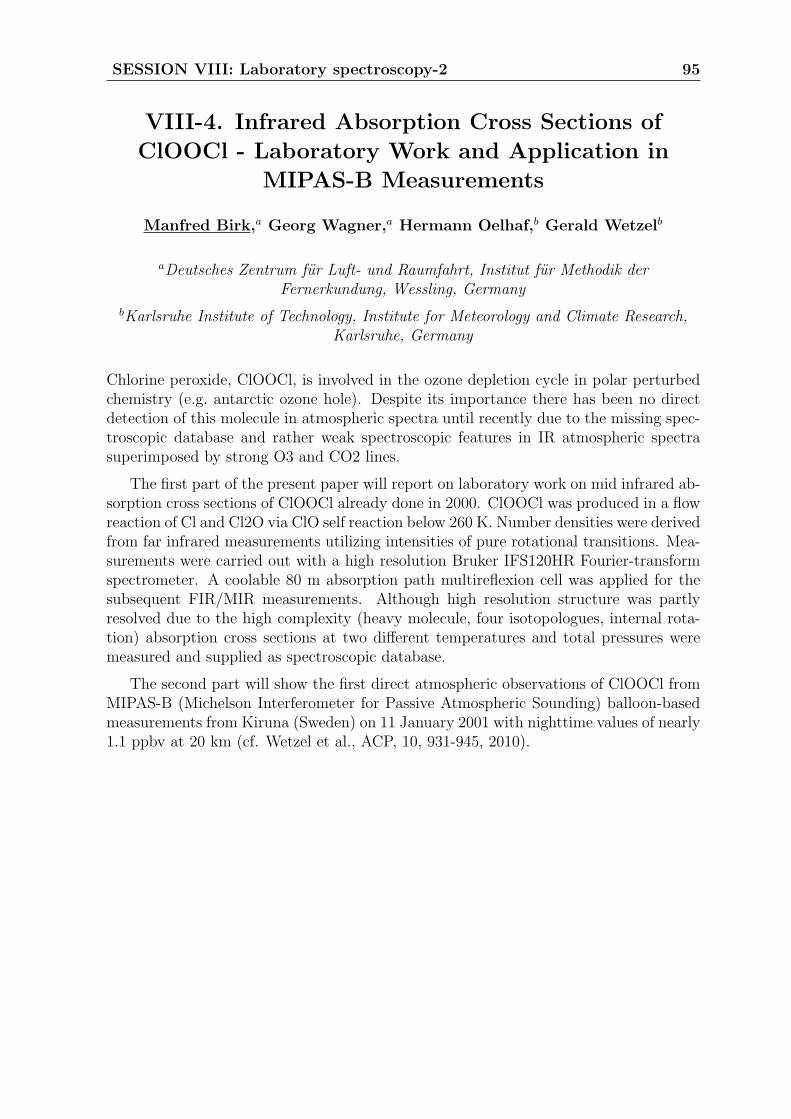
SESSION VIII: Laboratory spectroscopy-2 95
VIII-4. Infrared Absorption Cross Sections of
ClOOCl - Laboratory Work and Application in
MIPAS-B Measurements
Manfred Birk,a Georg Wagner,a Hermann Oelhaf,b Gerald Wetzelb
aDeutsches Zentrum fur Luft- und Raumfahrt, Institut fur Methodik derFernerkundung, Wessling, Germany
bKarlsruhe Institute of Technology, Institute for Meteorology and Climate Research,Karlsruhe, Germany
Chlorine peroxide, ClOOCl, is involved in the ozone depletion cycle in polar perturbedchemistry (e.g. antarctic ozone hole). Despite its importance there has been no directdetection of this molecule in atmospheric spectra until recently due to the missing spec-troscopic database and rather weak spectroscopic features in IR atmospheric spectrasuperimposed by strong O3 and CO2 lines.
The first part of the present paper will report on laboratory work on mid infrared ab-sorption cross sections of ClOOCl already done in 2000. ClOOCl was produced in a flowreaction of Cl and Cl2O via ClO self reaction below 260 K. Number densities were derivedfrom far infrared measurements utilizing intensities of pure rotational transitions. Mea-surements were carried out with a high resolution Bruker IFS120HR Fourier-transformspectrometer. A coolable 80 m absorption path multireflexion cell was applied for thesubsequent FIR/MIR measurements. Although high resolution structure was partlyresolved due to the high complexity (heavy molecule, four isotopologues, internal rota-tion) absorption cross sections at two different temperatures and total pressures weremeasured and supplied as spectroscopic database.
The second part will show the first direct atmospheric observations of ClOOCl fromMIPAS-B (Michelson Interferometer for Passive Atmospheric Sounding) balloon-basedmeasurements from Kiruna (Sweden) on 11 January 2001 with nighttime values of nearly1.1 ppbv at 20 km (cf. Wetzel et al., ACP, 10, 931-945, 2010).
SESSION VIII: Laboratory spectroscopy-2 96
VIII-5. Spectral Line Parameters in the ν9 Band of
Ethane
V. Malathy Devi,a D. Chris Benner,a C. P. Rinsland,b M. A. H. Smith,b
R. L. Sams,c T. A. Blake,c J.-M. Flaud,d K. Sung,e L. R. Brown,e
A. W. Mantzf
aThe College of William and Mary, Williamsburg, VA 23187, U.S.A.
bScience Directorate, NASA Langley Research Center, Hampton, VA 23681, U.S.A.
cPacific Northwest National Laboratory, Richland, WA 99352, U.S.A.
dLaboratoire Interuniversitaire des Systems Atmospheriques, C.N.R.S., UMR 7583,Universits Paris Est and Paris 7, 94010 Cretiel Cedex, France
eJet Propulsion Laboratory, California Institute of Technology, Pasadena, CA 91109,U.S.A.
fDept. of Physics, Astronomy and Geophysics, Connecticut College, New London, CT06320, U.S.A.
Spectral line parameters, including line center positions, absolute line intensities,self- and N2-broadened halfwidth coefficients, and the temperature dependences of thesehalfwidth coefficients, have been measured for more than 1330 transitions in the ν9band of ethane (C2H6) by applying a multispectrum nonlinear least squares analysistechnique.1 We analyzed a total of 43 high-resolution (0.00156-0.005 cm−1) infraredabsorption spectra recorded with two different Bruker Fourier transform spectrometers(at PNNL and at JPL) at various sample path lengths, pressures and temperatures. Theν9 fundamental of C2H6 is the strongest band in the terrestrial spectral window, and itis often used for ethane identification and abundance determination in remote sensing ofplanetary atmospheres. Torsional splittings are fairly large (dependent upon J,K) andmeasurable in several rQ and pQ sub-band structures. However, in the case of the rQ0
sub-band the two split components are completely obscured because of the overlap ofDoppler-broadened J transitions. The results from the present study2 will be comparedwith other published data.
1D. Chris Benner, C. P. Rinsland, V. M. Devi, M. A. H. Smith, and D. A. Atkins, JQSRT 1995;53:705-21.
2The spectra were recorded at the Jet Propulsion Laboratory (JPL) and at the W. R. Wiley Envi-ronmental Molecular Sciences Laboratory, a national user facility located at Pacific Northwest NationalLaboratory (PNNL) sponsored by the Department of Energy’s Office of Biological and EnvironmentResearch. PNNL is operated for the United States Department of Energy by the Battelle MemorialInstitute under Contract DE-AC05-76RLO1830. The research at the College of William and Mary,NASA Langley Research Center, Connecticut College and the Jet Propulsion Laboratory, CaliforniaInstitute of Technology, was performed under contracts and cooperative agreements with the NationalAeronautics and Space Administration.

SESSION VIII: Laboratory spectroscopy-2 97
VIII-6. A THz Photomixing Synthesizer Based on a
Fiber Frequency Comb Dedicated to High
Resolution Spectroscopy of Atmospheric
Compounds
Arnaud Cuisset, Francis Hindle, Gael Mouret, Chun Yang, Sophie Eliet,Robin Bocquet
Laboratoire de Physico-Chimie de l’Atmosphere, Universite du Littoral Cote d’Opale,189A Ave. Maurice Schumann, 59140 Dunkerque, France
To date the principal application for photomixing sources has been for high resolutionspectroscopy of gases due to the large tuning range and spectral purity. New develop-ments of the opto-electronic THz spectrometer have been performed in order to obtaina powerfull tool for high-resolution spectroscopy. The combination of two extended cav-ity laser diodes and fast charge carrier lifetime semiconductor materials has allowed acontinuous-wave THz spectrometer to be constructed based on optical heterodyning.Unlike many THz sources, this instrument gives access to all frequencies in the range0.3 to 3.5 THz with a resolution of 1 MHz. Amongst the spectroscopic applications ofthis spectrometer, precise recording of pure rotational high J line profiles of OCS andHCN have been performed, allowing the determination of new broadening parametersinclude in HITRAN2008.1,2 With an improved sensitivity by means of a THz propaga-tion in a multipass cell, the rotational spectra of numerous molecules such as OH, H2S,H2CO, HCOOH, NH3, H2CCHCl, SO(CH3)2... have been measured with this spectrom-eter. One limitation of the THz spectrometer was accuracy with which the generatedfrequency is known. Recently, this obstacle have been overcome with the construction ofa photomixing spectrometer where the two pump lasers are phase locked to two modesof a repetition rate stabilized frequency doubled fiber laser frequency comb.3 In orderto achieve a tuning range in excess to 100 MHz a third cw laser was required in the newconfiguration of the THz spectrometer. To assess the performance of this instrument,the frequencies of the pure rotational transitions of OCS molecules have been measuredbeetween 0,8 to 1,2 THz. A rms inferior to 100 kHz, deduced from the fitted frequencies,demonstrates that the accuracy of the THz photomixing synthesizer is now competitivewith the accuracy of the microwave and submillimeter techniques.
1S. Matton, F. Rohart, R. Bocquet , D. Bigourd, A. Cuisset, F. Hindle, G. Mouret, J. Mol. Spectrosc.,2006, 239: 182.
2C. Yang, J. Buldyreva, I. E. Gordon, F. Rohart, A. Cuisset, G. Mouret, R. Bocquet, F. Hindle,J.Quant. Spectrosc. Radiat. Transfer, 2008, 109: 2857.
3G. Mouret, F. Hindle, A. Cuisset, C. Yang, R. Bocquet, M. Lours, D. Rovera, Opt. Express, 2009,17: 22031.
SESSION VIII: Laboratory spectroscopy-2 98
VIII-7. Toward a Global Model of Low-Lying
Vibrational States of CH3CN: Overview and
Interactions in the v4 = 1 State at 920 cm−1 with
Nearby States
Holger S. P. Muller,a B. J. Drouin,b J. C. Pearson,b L. R. Brown,b
I. Kleiner,c R. L. Samsd
aI. Physikalisches Institut, Universitat zu Koln, 50937 Koln
bJet Propulsion Laboratory, California Institute of Technology, Pasadena, CA 91109,USA
cLISA, Universite Paris 12 & Paris 7 & CNRS, 94010 Creteil, France
dPNNL, Richland, WA 99352, USA
Methyl cyanide, CH3CN, is an important interstellar molecule, in particular in hotand dense molecular cores, and it may play a role in the atmospheres of planets or ofTitan. Therefore, we have recorded extensive rotational and rovibrational spectra up to∼ 1.6THz and ∼ 1500 cm−1, respectively. The present investigation extends our analysisof states with v8 ≤ 2 at vibrational energies below 740 cm−1,1 which will be summarizedbriefly, and takes into consideration findings from an analysis of the ν4 band and thehigher-lying ν7 (at ∼1042 cm−1) and 3ν1
8 (at ∼1078 cm−1) bands.2 The rotational dataextend to J = 87 and K = 15, infrared assignments currently extend to 55 and 12,respectively. Parameters affecting only v7 = 1 or v8 = 3 as well as some additionalinteraction parameters were kept fixed to values from (b). The largest perturbations ofv4 = 1 are caused by a ∆k = 0, ∆l = 3 interaction with v8 = 3 at K = 8. Despite theinclusion of the interaction parameter and a centrifugal distortion correction, residualsamount to more than 200 MHz very close to the resonance. Removal of these residualsprobably requires explicit inclusion of v8 = 3 data. Several additional perturbationsexist at lower as well as higher K with v8 = 2, v7 = 1 and v8 = 3. Higher valuesof K are difficult to reproduce in spite of an extensive set of distortion parameterswhich, at highest orders, have rather large magnitudes, possibly indicating unaccountedinteractions which would probably occur with states even higher than v8 = 3.
1H. S. P. Muller et al., contribution WG03, presented at the 62nd International Symposium onMolecular Spectroscopy, June 18−22, 2007, Columbus, Ohio, USA.
2A.-M. Tolonen et al., J. Mol. Spectrosc. 160 (1993) 554−565.

AUTHOR INDEX 99
Author Index
Aenchbacher W., . . . . . . . . . . . . . . . . . . . . 23Allen N. D. C., . . . . . . . . . . . . . . . . . . . . . . 94Armante R., . . . . . . . . . . . . . . . . . . . . . . . . . . 3
Babikov Yu. L., . . . . . . . . . . . . . . . . . . . . . 80Balcon D., . . . . . . . . . . . . . . . . . . . . . . . . . . .44Barbe A., . . . . . . . . . . . . . . . . . . . . . . . . 30, 31Barber M. J., . . . . . . . . . . . . . . . . . . . . . . . . 72Benner D. C., . . . . . . . . . . . . . . . . 22, 60, 96Bernath P. F., . . . . . . . . . . . . . . . .14, 15, 94Bertaux J.-L., . . . . . . . . . . . . . . . . . . . . . . . 69Bianchini G., . . . . . . . . . . . . . . . . . . . . . . . . 16Birk M., . . . . . . . . . . . . . . . . . . . . . . . . . . . . . 95Blake T. A., . . . . . . . . . . . . . . . . . . . . . . . . . 96Bocquet R., . . . . . . . . . . . . . . . . . . 36, 37, 97Boone C., . . . . . . . . . . . . . . . . . . . . . . . . . . . 15Borkov Yu., . . . . . . . . . . . . . . . . . . . . . . . . . 69Boudon V., . . . . . . . . . . . . . . . . . . . . . . . . . . 59Bray C., . . . . . . . . . . . . . . . . . . . . . . . . . . . . . 47Brown D. G., . . . . . . . . . . . . . . . . . . . . . . . . 70Brown L. R., . . 34, 50, 60, 74, 76, 96, 98Brubach J.-B., . . . . . . . . . . . . . . . . . . . . . . .59Buldyreva J., . . . . . . . . . . . . . . . . . . . . . . . . 51
Cami J., . . . . . . . . . . . . . . . . . . . . . . . . . . . . . 84Campargue A., . . . . 20, 30–33, 45, 46, 76Camy-Peyret C., . . . . . . . . . . . . . . . . . . . . 93Capelle V., . . . . . . . . . . . . . . . . . . . . . . . . . . . 3Chedin A.,. . . . . . . . . . . . . . . . . . . . . . . . . . . .3Champion J.-P, 42Chen P., . . . . . . . . . . . . . . . . . . . . . . . . . . . . .64Coakley J.A., . . . . . . . . . . . . . . . . . . . . . . . . 22Cohen E. A., . . . . . . . . . . . . . . . . . . . . . . . . 34Coudert L.H., . . . . . . . . . . . . . . . . . . . . . . . 44Cousin J., . . . . . . . . . . . . . . . . . . . . . . . 65, 66Coustenis A., . . . . . . . . . . . . . . . . . . . . . . . . 89Crepeau L., . . . . . . . . . . . . . . . . . . . . . . . . . . .3Crawford T. J., . . . . . . . . . . . . . . . . . . 60, 64Cuisset A., . . . . . . . . . . . . . . . . . . . 36, 37, 97
Daumont L., . . . . . . . . . . . . . . . . . . . . . 28, 45
Deaver L., . . . . . . . . . . . . . . . . . . . . . . . . . . . 17Decatoire D., . . . . . . . . . . . . . . . . . . . . . . . . 28De Backer-Barilly M.-R., . . . . . . . . .30, 31Di Lauro C.,. . . . . . . . . . . . . . . . . . . . . . . . .74Douglass K. O., . . . . . . . . . . . . . . . . . . . . . 73Drossart P., . . . . . . . . . . . . . . . . . . . . . . . . . 88Drouin B. J., . . . . . . . . . . . . . 24, 34, 83, 98Drummond R., . . . . . . . . . . . . . . . . . . . . . . 69Dudley R., . . . . . . . . . . . . . . . . . . . . . . . . . . 23Durry G., . . . . . . . . . . . . . . . . . . . . . . . . 66, 92
Ebert V., . . . . . . . . . . . . . . . . . . . . . . . . . . . . 77Eliet S., . . . . . . . . . . . . . . . . . . . . . . 36, 37, 97Endres C.P., . . . . . . . . . . . . . . . . . . . . . . . . . 24
Foldes T., . . . . . . . . . . . . . . . . . . . . . . . . . . . 67Fazliev A. Z., . . . . . . . . . . . . . . . . . . . . 76, 82Flaud J.-M., . . . . . . . . . . . . . . . . . . . . . 90, 96Fomin B.A., . . . . . . . . . . . . . . . . . . . . . . . . . 18Fraser G. T., . . . . . . . . . . . . . . . . . . . . . . . . 73
Gabard T., . . . . . . . . . . . . . . . . . . . . . . . . . . 59Gamache R. R.,. . . . . . . . . . .55–58, 61, 71Gao B. C., . . . . . . . . . . . . . . . . . . . . . . . . . . 38Gerecht E., . . . . . . . . . . . . . . . . . . . . . . . . . . 73Gisi M., . . . . . . . . . . . . . . . . . . . . . . . . . . . . . 77Glatthor N., . . . . . . . . . . . . . . . . . . . . . . . . . 13Gordley L., . . . . . . . . . . . . . . . . . . . . . . . . . . 17Gordon I. E., . . . . . . . 2, 32, 46, 55, 71, 80Grabowski U., . . . . . . . . . . . . . . . . . . . . . . . 13Guinet M., . . . . . . . . . . . . . . . . . . . . . . . . . . 93
Haga K. J., . . . . . . . . . . . . . . . . . . . . . . . . . . 22Harrison J. J., . . . . . . . . . . . . . . . . . . . . . . . 94Hartmann J.-M., . . . . . . . . . . . . . . . . . 53, 55Herndon S. C., . . . . . . . . . . . . . . . . . . . . . . 35Hervig M.,. . . . . . . . . . . . . . . . . . . . . . . . . . .17Hill C., . . . . . . . . . . . . . . . . . . . . . . . . . . . . . . 81Hilton M., . . . . . . . . . . . . . . . . . . . . . . . . . . . 39Hindle F., . . . . . . . . . . . . . . . . . . . . 36, 37, 97Hoepfner M., . . . . . . . . . . . . . . . . . . . . . . . . 13Houck C. P.,. . . . . . . . . . . . . . . . . . . . . . . . .22

AUTHOR INDEX 100
Hu S.-M., . . . . . . . . . . . . . . . . . . . . . . . . 29, 76
Jacquemart D., . . . . . . . . . . . . . . . . . . 47, 61Jacquinet N., . . . . . . . . . . . . . . . . . . . . . . . . . 3Janssen C., . . . . . . . . . . . . . . . . . . . . . . . . . . 93Johnson M. P., . . . . . . . . . . . . . . . . . . . . . . 39Joly L., . . . . . . . . . . . . . . . . . . . . . . 65, 66, 92
Kassi S., . . . . . . . . . . . . . . 20, 30–33, 45, 46Kellmann S., . . . . . . . . . . . . . . . . . . . . . . . . 13Kelly R. E. A., . . . . . . . . . . . . . . . . . . . . . . 72Kiefer M., . . . . . . . . . . . . . . . . . . . . . . . . . . . 13Kikuchi N., . . . . . . . . . . . . . . . . . . . . . . . . . . 12Killinger D. K., . . . . . . . . . . . . . . . . . . . . . . . 5Kleiner I., . . . . . . . . . . . . . . . . . . . . . . . . . . . 98Kobayashi K., . . . . . . . . . . . . . . . . . . . . . . . 24Kwabia Tchana F., . . . . . . . . . . . . . . . . . . 61
Lacome N., . . . . . . . . . . . . . . . . . . . . . . 47, 61Lamouroux J., . . . . . . . . . . . . 55, 56, 58, 75Laraia A. L., . . . . . . . . . . . . . 55, 56, 58, 61Lattanzi F., . . . . . . . . . . . . . . . . . . . . . . . . . 74Lee B. H., . . . . . . . . . . . . . . . . . . . . . . . . . . . 35Leshchishina O. M., . . . . . . . . . . . . . . . . . 32Li J., . . . . . . . . . . . . . . . . . . . . . . . . . . . . . . . . 66Linden A., . . . . . . . . . . . . . . . . . . . . . . . . . . .13Liu A., . . . . . . . . . . . . . . . . . . . . . . . . . . . . . . 45Liu A.-W., . . . . . . . . . . . . . . . . . . . . . . . . . . 29Lodi L., . . . . . . . . . . . . . . . . . . . . . . . . . . . . . . 8
Ma Q., . . . . . . . . . . . . . . . . . . . . . . . 57, 58, 73Mahieux A., . . . . . . . . . . . . . . . . . . . . . . . . . 69Malathy Devi V.,. . . . . . . . . . . . .22, 60, 96Mammez D., . . . . . . . . . . . . . . . . . . . . . . . . 65Manceron L., . . . . . . . . . . . . . . . . . . . . . . . . 59Mantz A. W., . . . . . . . . . . . . . . . . 60, 74, 96Mao J., . . . . . . . . . . . . . . . . . . . . . . . . . . . . . .38Markwick A. J.,. . . . . . . . . . . . . . . . . .84, 85Martin M.-A., . . . . . . . . . . . . . . . . 24, 36, 44Massie S. T., . . . . . . . . . . . . . . . . . . . . . . . . 48Matsushima F., . . . . . . . . . . . . . . . . . . . . . .24McHugh M., . . . . . . . . . . . . . . . . . . . . . . . . .17McManus J. B., . . . . . . . . . . . . . . . . . . . . . 35Mikhailenko S. N., . . . . . . . . . . . 29, 30, 80Miller C. E., . . . . . . . . . . . . . . . . . . . . . 50, 60
Mondelain D., . . . . . . . . . . . . . . . . . . . . . . . 93Morino I., . . . . . . . . . . . . . . . . . . . . . . . . . . . 12Mouret G., . . . . . . . . . . . . . . . . . . . 36, 37, 97Munger J. W., . . . . . . . . . . . . . . . . . . . . . . .35Muller H. S. P.,. . . . . . . . . . . . . . . . . . . . . .98
Naftaly M., . . . . . . . . . . . . . . . . . . . . . . . . . . 23Naumenko O. V., . . . . . . . . . . . . . . . . 29, 76Nelson D. D., . . . . . . . . . . . . . . . . . . . . . . . .35Nikitin A. V., . . . . . . . . . . . . . . . . . . . . . . . 45
O’Brien J. J., . . . . . . . . . . . . . . . . . . . . . . . .22Oelhaf H., . . . . . . . . . . . . . . . . . . . . . . . . . . . 95Orphal J., . . . . . . . . . . . . . . . . . . . . . . . . . . . 13Ortwein P., . . . . . . . . . . . . . . . . . . . . . . . . . . 77
Palchetti L., . . . . . . . . . . . . . . . . . . . . . . . . . 16Parvitte B., . . . . . . . . . . . . . . . . . . 65, 66, 92Paynter D., . . . . . . . . . . . . . . . . . . . . . . . . . . 40Pearson J.C., . . . . . . . . . . . . . . . . .24, 83, 98Perevalov V. I., . . . . . . . . . . . . . . . . . . 10, 69Perrin A., . . . . . . . . . . . . . . . . . . . . 33, 47, 61Phillips W. J., . . . . . . . . . . . . . . . . . . . . . . . 70Pirali O., . . . . . . . . . . . . . 24, 36, 37, 44, 59Plieninger J., . . . . . . . . . . . . . . . . . . . . . . . . 13Plusquellic D. F., . . . . . . . . . . . . . . . . . . . . 73Plutov D., . . . . . . . . . . . . . . . . . . . . . . . . . . . . 5Podobedov V. B.,. . . . . . . . . . . . . . . . . . . .73Polovtseva E. R., . . . . . . . . . . . . . . . . . . . . 76
Regalia L., . . . . . . . . . . . . . . . . . . . . . . . 28, 45Rinsland C. P., . . . . . . . . . . . . . . . . . . . . . . 96Robert S., . . . . . . . . . . . . . . . . . . . . . . . . . . . 69Rohart F., . . . . . . . . . . . . . . . . . . . . . . . . . . . 68Rothman L. S., . . . . . 2, 32, 46, 55, 71, 80Roy P., . . . . . . . . . . . . . . . . . . . . . . . . . . 37, 59
Sadovskii D. A., . . . . . . . . . . . . . . . . . . . . . 37Sams R. L., . . . . . . . . . . . . . . . . . . . . . . 96, 98Scott N., . . . . . . . . . . . . . . . . . . . . . . . . . . . . . 3Shaji S., . . . . . . . . . . . . . . . . . . . . . . . . . . . . . 22Shiraishi T., . . . . . . . . . . . . . . . . . . . . . . . . . 24Shorter J. H., . . . . . . . . . . . . . . . . . . . . . . . .35Siegrist K., . . . . . . . . . . . . . . . . . . . . . . . . . . 73Smirnova I., . . . . . . . . . . . . . . . . . . . . . . . . . 37
AUTHOR INDEX 101
Smith M. A. H., . . . . . . . . . . . . . .60, 74, 96Spickler P.T., . . . . . . . . . . . . . . . . . . . . . . . . 22Stiller G., . . . . . . . . . . . . . . . . . . . . . . . . . . . 13Sung K., . . . . . . . . . . . . . . 24, 60, 64, 74, 96
Tashkun S. A., . . . . 10, 29, 69, 75, 76, 80Tennyson J., . . . . . . . . . . . . . . . . . . 7, 72, 81Thomas X., . . . . . . . . . . . . . . . . . . . . . . 28, 45Tipping R. H., . . . . . . . . . . . . . . . . . . . 57, 58Toon G. C., . . . . . . . . . . . . . . . . . . . . . . . . . 46Tran H., . . . . . . . . . . . . . . . . . . . . . . . . . . . . . 55Tyuterev Vl. G., . . . . . . . . . 30, 31, 45, 75
Vandaele A. C., . . . . . . . . . . . . . . . . . . . . . 69Vander Auwera J., . . . . . . . . 59, 67, 69, 74Vervloet M., . . . . . . . . . . . . . . . . . 24, 36, 44von Clarmann T., . . . . . . . . . . . . . . . . . . . 13Von Der Heyden P., . . . . . . . . . . . . . .28, 45
Wagner G., . . . . . . . . . . . . . . . . . . . . . . . . . . 95Wagner S., . . . . . . . . . . . . . . . . . . . . . . . . . . 77Wang L., . . . . . . . . . . . . . . . . . . . . . 20, 28, 32Welch M. A., . . . . . . . . . . . . . . . . . . . . . . . . 39Wenger C., . . . . . . . . . . . . . . . . . . . . . . . . . . 42Wetzel G., . . . . . . . . . . . . . . . . . . . . . . . . . . . 95Wilquet V., . . . . . . . . . . . . . . . . . . . . . . . . . 69Wlodarczak G.,. . . . . . . . . . . . . . . . . . . . . .68Wofsy S. C., . . . . . . . . . . . . . . . . . . . . . . . . . 35Woiwode W., . . . . . . . . . . . . . . . . . . . . . . . . 77Wood E. C., . . . . . . . . . . . . . . . . . . . . . . . . . 35Wormhoudt J. C., . . . . . . . . . . . . . . . . . . . 35
Yang C., . . . . . . . . . . . . . . . . . . . . . . . . . . . . 97Yokota T., . . . . . . . . . . . . . . . . . . . . . . . . . . .12Yoshida Y., . . . . . . . . . . . . . . . . . . . . . . . . . .12Yu S., . . . . . . . . . . . . . . . . . . . . . . . . . . . 24, 83
Zahniser M. S., . . . . . . . . . . . . . . . . . . . . . . 35Zeninari V., . . . . . . . . . . . . . . . . . . 65, 66, 92

NOTES 102

PI-14. Analysis of spectral line parameters of 1.27 micron band for laser
absorption spectrometer based atmospheric oxygen measurements
Narasimha S. Prasad,a and V. Malathi Devi,b
aNASA Langley Research Center, 5 N. Dryden St., MS 468, Hampton, VA 23681 bDepartment of Physics, College of William and Mary, Williamsburg,
VA 23187-8795 NASA Langley Research Center is involved in the development of a novel laser absorption
spectrometer for oxygen measurements to satisfy requirements of the proposed Active Sensing of CO2 Emissions over Nights, Days, & Seasons (ASCENDS) mission. The goals of ASCENDS mission is to quantify global spatial distribution of atmospheric CO2 on scales of weather models as well as terrestrial and oceanic sources and sinks of CO2 during day/night over all seasons. Enhanced understanding of CO2 sources and sinks in the global carbon cycle is required for refining climate models. As such, ASCENDS mission is anticipated to provide a scientific basis for future projections of CO2 sources and sinks through data‐driven enhancements of Earth‐system process modeling. ASCENDS will deliver laser based remote sensing measurements of CO2 mixing ratios (XCO2) day and night, at all latitudes, and during all seasons. The plan is to have several simultaneous measurements to be made that include CO2 number density tropospheric column and O2 number density column. O2 sensing helps in determining surface pressure that is required for converting CO2 to XCO2.
Currently, CO2 column measurements using the 1.57 µm spectral band are being
successfully carried out from airborne platforms. The 1.27 micron band has been selected for surface pressure measurements using O2 Laser Absorption Spectrometer due to architectural advantages and cross‐section values. However, lines in this band are being carefully analyzed for optimal design of laser based instrumentation. For precision concentration measurements, the selected O2 lines have to be highly insensitive to atmospheric parameters while providing optimal SNR values. Accordingly, influence of atmospheric parameters on the measurement of optical depth to select optimal oxygen lines is being investigated.
Accurate measurements of spectral line parameters for the 1.27 µm O2 band are extremely difficult to make. Neglecting parameters such as line mixing, line narrowing and speed dependence in the spectrum analysis will adversely affect the accuracy of the retrieved parameters and hence will seriously hamper the retrievals of O2 atmospheric concentration/mixing ratio. At best Voigt profiles can produce parameters that only have meaning at the 1% level even from for less complicated spectra. For high resolution oxygen measurements the situation is worse due to the strong influence of line mixing. The ultimate goal of our ongoing efforts is to be able to retrieve accurate O2 abundance from atmospheric remote sensing spectra with a high precision of ~0.5% that has not been achieved so far. To achieve this goal, we have undertaken a systematic and careful laboratory analysis of the O2 spectra in the 1.27 µm and successfully apply its spectroscopic line parameters to atmospheric remote sensing measurements. Accordingly, we are investigating methodologies to collect high resolution O2 line spectra in the laboratory under carefully controlled pressure and temperature conditions. The various line parameters will be retrieved by fitting all spectra simultaneously. Calibration of the line parameters (including line center positions, absolute intensities, and other important line shape coefficients for Lorentz broadening, pressure‐induced shifts, line mixing, speed dependence and/or line narrowing and their temperature dependences) near 1.27 µm to the accuracy required for the O2 sensor will be carried out. In this paper, preliminary results of sensitivity analysis of oxygen absorption Lines in the 1.27 µm spectral band followed by near term plans for experimental and subsequent spectral analysis will be presented.
VII-4. Mid and Far-Infrared Spectroscopy in Astrophysics
José Cernicharo
CAB. INTA-CSIC. Crta Torrejón Km 4. 28005 Madrid, Spain The Herschel satellite was launched in May 2009 and is equipped with
spectroscopic instruments in the submillimeter and far-IR domains. It the last months it has provided a huge amount of spectroscopic data of interstellar and circumstellar sources. I will present some of these results, together with mid-infrared high spectral resolution observations taken with ground based facilities.
In order to interpret these data, astrophysicists need an important input from
the spectroscopic community such as more complete spectroscopic databases in the mid and far infrared domains, line intensities, and collisional rates.
CO
NFER
EN
CE
PR
OG
RA
M
DA
Y1,W
ednesd
ay
16
June
7:30
Reg
istr
atio
n
9:00
WE
LC
OM
E..
....
....
....
....
....
....
....
....
....
...L
aure
nce
S.R
othm
an
SE
SSIO
NI:
Dat
abas
es-1
Cha
ir:
A.Bar
be
9:10
Spec
tros
copi
cM
olec
ular
Dat
abas
es:
Evo
luti
onan
dR
evol
utio
n..
....
....
...
...
....
....
....
....
....
....
....
....
....
....
....
....
....
....
..L.S.
Rot
hman
9:25
The
GE
ISA
Dat
abas
e20
09E
diti
on:
Upd
ate
Des
crip
tion
and
Ass
essm
ent
ofSp
ectr
osco
pic
Par
amet
ers
Thr
ough
Hyp
ersp
ectr
alR
emot
eSe
nsin
gA
pplic
atio
ns..
....
....
....
....
....
....
....
....
....
....
....
...N
.Ja
cqui
net
9:40
Ble
nded
HIT
RA
Nan
dot
herSp
ectr
aD
atab
ases
forM
odel
ing
Em
issi
on-b
ased
LID
AR
....
....
....
....
....
....
....
....
....
....
....
....
....
....
..D
.P
luto
v
9:55
Cal
cula
ting
the
Spec
tros
copi
cB
ehav
iour
ofH
otM
olec
ules
....
J.Ten
nyso
n
10:2
5H
igh-
Acc
urac
yab
init
ioW
ater
Lin
eIn
tens
itie
s..
....
....
....
....
..L.Lod
i
10:4
0C
DSD
-400
0:H
igh-
Tem
pera
ture
Spec
tros
copi
cC
O2
Dat
aban
k.S.
A.Tas
hkun
10:5
5C
offee
Bre
ak
SE
SSIO
NII
:R
emot
eSen
sing
Cha
ir:
K.C
hanc
e
11:1
5Lin
ePar
amet
ers
and
Forw
ard
Cal
cula
tion
for
Ret
riev
ing
Car
bon
Dio
xide
and
Met
hane
from
GO
SAT
data
....
....
....
....
....
....
....
....
T.Y
okot
a
11:4
5M
IPA
S:N
ewR
esul
tsan
dSp
ectr
osco
pyIs
sues
....
....
....
....
...J
.O
rpha
l
12:0
0T
heA
tmos
pher
icC
hem
istr
yE
xper
imen
t,A
CE
:St
atus
and
Spec
tros
copi
cIs
sues
....
....
....
....
....
....
....
....
....
....
....
....
....
....
P.F.B
erna
th
12:1
5Sp
ectr
osco
pyfo
rth
eA
tmos
pher
icC
hem
istr
yE
xper
imen
t(A
CE
)C
.B
oone
12:3
0Lun
chSe
rved
13:4
5Sp
ectr
osco
pic
Issu
esin
the
Dat
aA
naly
sis
ofR
EFIR
-PA
DM
easu
rem
ents
Per
form
edD
urin
gth
e20
09G
roun
d-B
ased
Cam
paig
ns..
....
...G
.B
ianc
hini
14:0
0Pol
arM
esos
pher
icC
loud
san
dC
osm
icD
ust:
Thr
eeY
ears
ofSO
FIE
Mea
sure
men
ts..
....
....
....
....
....
....
....
....
....
....
....
...M
.M
cHug
h
14:1
5LB
LM
odel
s:St
ate
ofth
eA
rtan
dPer
spec
tive
....
....
....
...B
.A
.Fo
min
14:3
0C
offee
Bre
ak SE
SSIO
NII
I:Lab
orat
ory
Spec
tros
copy-1
Cha
ir:
L.R
.Bro
wn
14:4
5T
heA
bsor
ptio
nSp
ectr
umof
Met
hane
Bet
wee
n1.
27an
d1.
71µm
byH
igh
Sens
itiv
ity
CR
DS
at80
Kan
d30
0K
.Im
port
ance
ofth
eC
H3D
Con
trib
utio
nin
the
1.58
µm
Tra
nspa
renc
yW
indo
w..
....
....
....
....
....
.A.C
ampa
rgue
15:1
5T
he4ν
3Sp
ectr
alR
egio
nof
Met
hane
....
....
....
....
....
.D.C
hris
Ben
ner
15:3
0Lin
eSt
reng
ths
and
Self-
Bro
aden
ing
ofP
ure
Rot
atio
nal
Lin
esof
Car
bon
Mon
oxid
ean
dN
itro
usO
xide
Mea
sure
dby
Ter
aher
tzT
ime-
Dom
ain
Spec
tros
copy
....
....
....
....
....
....
....
....
....
....
....
..W
.A
ench
bach
er
15:4
5Su
bmill
imet
er-W
ave
and
Far-
Infr
ared
Spec
tros
copy
ofH
igh-
JTra
nsit
ions
ofA
mm
onia
....
....
....
....
....
....
....
....
....
....
....
....
....
....
....
S.Y
u
16:0
0-18
:00
PO
ST
ER
SESSIO
N1
DA
Y2,T
hurs
day
17
June
SE
SSIO
NIV
:D
atab
ases
-2
Cha
ir:
M.A
.H
.Sm
ith
9:00
Err
orP
ropa
gati
onfr
omLin
ePar
amet
ers
toSp
ectr
aSi
mul
atio
ns.
Illu
stra
tion
onH
igh
Tem
pera
ture
Met
hane
....
....
....
....
....
....
....
.J.-P.
Cha
mpi
on
9:30
Hig
h-Lyi
ngR
otat
iona
lLev
els
ofW
ater
Obt
aine
dby
FIR
Em
issi
onSp
ectr
osco
py..
....
....
....
....
....
....
....
....
....
....
....
....
.L.C
oude
rt
9:45
Ass
ignm
ent
ofth
e5ν
4an
dν
2+
4ν4
band
syst
emof
12C
H4
inth
eR
egio
n62
87-6
550
cm−
1..
....
....
....
....
....
....
....
....
....
....
.Vl.
G.T
yute
rev
10:0
0Tow
ards
New
Lin
eLis
tof
Mag
neti
cD
ipol
ean
dE
lect
ric
Qua
drup
ole
Tra
nsit
ions
inth
ea1∆
g←
X3Σ− g
Ban
dof
Oxy
gen
....
....
....
.I.E
.G
ordo
n
10:1
5U
pdat
efo
rM
ethy
lC
hlor
ide
at3
µm
....
....
....
....
....
....
....
A.Per
rin
10:3
0In
dice
sof
Ref
ract
ion
ofA
bsor
ptiv
eA
eros
ol-
The
irIm
port
ance
and
Com
plex
ity
....
....
....
....
....
....
....
....
....
....
....
....
....
..S.
Mas
sie
10:4
5C
offee
Bre
ak

SE
SSIO
NV
:Lin
eShap
es
Cha
ir:
P.F.Ber
nath
11:0
0T
heIm
port
ance
ofB
eing
Ear
nest
abou
tLin
eSh
apes
....
....
.L.R
.B
row
n
11:1
0Im
prov
emen
ts,C
orre
ctio
nsan
dN
ewD
evel
opm
ents
inSe
mic
lass
ical
The
orie
sof
Col
lisio
nalLin
eB
road
enin
g..
....
....
....
....
....
....
....
..J.
Bul
dyre
va
11:4
0Sp
ectr
alSh
apes
Mod
elin
gan
dR
emot
eSe
nsin
gof
Gre
enho
use
Gas
es:
Tow
ard
the
OC
Oan
dG
OSA
TE
xper
imen
tsan
dFu
ture
HIT
RA
NIs
sues
....
....
....
...
....
....
....
....
....
....
....
....
....
....
....
....
....
....
J.-M
.H
artm
ann
12:1
0A
nIm
prov
edV
ersi
onof
the
CO
2Lin
e-m
ixin
gD
atab
ase
and
Soft
war
e:U
pdat
ean
dE
xten
sion
....
....
....
....
....
....
....
....
....
....
A.L.Lar
aia
12:2
5Lun
chSe
rved
Cha
ir:
J.-M
.Fla
ud
13:4
5T
heC
ollis
ion-
Bro
aden
edLin
eSh
ape
ofC
O2
via
the
Com
plex
Rob
ert-
Bon
amy
Met
hod:
The
Com
plex
ity
ofSi
mpl
icity
....
....
....
R.R
.G
amac
he
14:0
0U
ncer
tain
ties
Ass
ocia
ted
wit
hT
heor
etic
ally
Cal
cula
ted
N2
Bro
aden
edH
alf-
Wid
ths
ofH
2O
Lin
es..
....
....
....
....
....
....
....
....
....
....
....
..Q
.M
a
14:1
5C
ompl
exR
ober
t-B
onam
yC
alcu
lati
onof
H2O
Bro
aden
edby
N2,O
2an
dA
irM
ade
wit
hR
ealis
tic
Tra
ject
orie
s..
....
....
....
....
....
....
...J
.Lam
ouro
ux
14:3
0N
2C
ollis
iona
lB
road
enin
gof
Met
hane
inth
eT
Hz
Reg
ion
Mea
sure
dat
the
SOLE
ILSy
nchr
otro
n..
....
....
....
....
....
....
....
....
....
....
.V.B
oudo
n
14:4
5N
2-b
road
ened
13C
H4
at80
to29
6K
....
....
....
....
....
..M
.A
.H
.Sm
ith
15:0
0Fo
rmal
dehy
deB
road
enin
gC
oeffi
cien
ts:
the
5.7µ
man
d3.
6µm
Ban
ds..
....
....
....
....
....
....
....
....
....
....
....
....
....
D.Ja
cque
mar
t
15:1
5-17
:15
PO
ST
ER
SESSIO
N2
18:3
0Ban
quet
DA
Y3,Fri
day
18
June
SE
SSIO
NV
I:D
atab
ase
Str
uct
ure
Cha
ir:
I.E.G
ordo
n
9:00
Info
rmat
ion
Syst
emto
Acc
ess
HIT
RA
Nvi
ath
eIn
tern
et..
...Y
u.L.B
abik
ov
9:15
New
Too
lsfo
rSt
orin
gan
dA
cces
sing
Spec
tros
copi
cD
ata:
the
Dev
elop
men
tof
anX
ML
Sche
ma
for
the
HIT
RA
ND
atab
ase
....
....
....
....
....
..C
.H
ill
9:30
Pub
lishi
ngToo
lsfo
ra
Dis
trib
uted
Info
rmat
ion
Syst
em..
....
..A
.Z.Fa
zlie
v
9:45
JPL
Cat
alog
Upg
rade
s:N
ewToo
ls,
New
Form
ats
and
New
Inte
rfac
es..
....
....
....
....
....
....
....
....
....
....
....
....
...B
.J.
Dro
uin
10:0
0SP
EC
TR
AFA
CT
ORY
.NE
T:
aD
atab
ase
ofM
olec
ular
Mod
elSp
ectr
afo
rA
stro
nom
ers
....
....
....
....
....
....
....
....
....
....
....
....
....
...J
.C
ami
10:1
5R
epre
sent
ing
Scie
ntifi
cD
atab
ases
Onl
ine
....
....
....
....
....
A.M
arkw
ick
10:3
0C
offee
Bre
ak SE
SSIO
NV
II:P
lanet
ary
Atm
ospher
es
Cha
ir:
J.Van
der
Auw
era
10:4
5R
ecen
tA
dvan
ces
inth
eSp
ectr
osco
pyof
Pla
neta
ryan
dE
xopl
anet
ary
Atm
osph
eres
:W
hat
isou
tT
here
?..
....
....
....
....
....
....
...P
.D
ross
art
11:1
5T
itan
’sN
eutr
alA
tmos
pher
icC
hem
istr
yfr
omth
eA
stro
nom
ical
Poi
ntof
Vie
w..
....
....
....
....
....
....
....
....
....
....
....
....
....
...A
.C
oust
enis
11:4
5H
igh-
Res
olut
ion
Ana
lysi
sof
Var
ious
Pro
pane
Ban
ds:
Mod
elin
gof
Tit
an’s
Infr
ared
Spec
trum
....
....
....
....
....
....
....
....
....
....
....
J.-M
.Fla
ud
12:1
5Lun
chSe
rved
SE
SSIO
NV
III:
Lab
orat
ory
Spec
tros
copy-2
Cha
ir:
D.Ja
cque
mar
t
13:2
5H
igh-
Res
olut
ion
Tun
able
Dio
deLas
erSp
ectr
osco
pic
Par
amet
ers
for
Atm
osph
eric
App
licat
ions
and
Com
pari
sons
wit
hH
ITR
AN
....
.V.Zen
inar
i
13:4
5Las
erSp
ectr
osco
pic
Stud
yof
Ozo
nein
the
100⇐
000
Ban
dfo
rth
eSW
IFT
Inst
rum
ent
....
....
....
....
....
....
....
....
....
....
....
....
....
..M
.G
uine
t
14:0
0N
ewA
ceto
neA
bsor
ptio
nC
ross
Sect
ions
for
AC
ER
etri
eval
s..
....
N.A
llen
14:1
5In
frar
edA
bsor
ptio
nC
ross
Sect
ions
ofC
lOO
Cl
-Lab
orat
ory
Wor
kan
dA
pplic
atio
nin
MIP
AS-
BM
easu
rem
ents
....
....
....
....
....
....
....
M.B
irk
14:3
0Sp
ectr
alLin
ePar
amet
ers
inth
eν 9
Ban
dof
Eth
ane
....
..V
.M
alat
hyD
evi
14:4
5A
TH
zP
hoto
mix
ing
Synt
hesi
zer
Bas
edon
aFib
erFr
eque
ncy
Com
bD
edic
ated
toH
igh
Res
olut
ion
Spec
tros
copy
ofA
tmos
pher
icC
ompo
unds
....
....
....
....
....
....
....
....
....
....
....
....
....
.A.C
uiss
et
15:0
0Tow
ard
aG
loba
lM
odel
ofLow
-Lyi
ngV
ibra
tion
alSt
ates
ofC
H3C
N:
Ove
rvie
wan
dIn
tera
ctio
nsin
the
v 4=
1St
ate
at92
0cm
−1
wit
hN
earb
ySt
ates
....
....
....
....
....
....
....
....
....
....
....
....
....
..H
olge
rS.
P.M