![Portable Stereo Component System RX-CT65€¦ · To resume recording, press [ PAUSE] again. • Changes to volume and tone will not affect the recording. • Wind up the leader tape](https://static.fdocuments.us/doc/165x107/5fa31c9417762b49311983ed/portable-stereo-component-system-rx-ct65-to-resume-recording-press-pause-again.jpg)
HART: The Human Affect Recording Tool - Columbia Universityrsb2162/SigDoc2015.pdf · HART: The...
6
HART: The Human Affect Recording Tool Jaclyn Ocumpaugh 1 , Ryan S. Baker 2 , Ma Mercedes Rodrigo 3 , Aatish Salvi 4 , Martin van Velsen 5 , Ani Aghababyan 6 , & Taylor Martin 7 Teachers College, Columbia University 1,2 , University of Ateno 3 , Worcester Polytechnic Institute 1,2,4 , Carnegie Mellon University 5 , & Utah State University 6,7 525 West 120 th Streetmjh New York, NY 10027 1-212-678-3854 [email protected] 1 ABSTRACT This paper evaluates the Human Affect Recording Tool (HART), a Computer Assisted Direct Observation (CADO) application that facilitates scientific sampling. HART enforces an established method for systematic direct observation in Educational Data Mining (EDM) research, the Baker Rodrigo Ocumpaugh Monitoring Protocol [25] [26]. This examination provides insight into the design of HART for rapid data collection for both formative classroom assessment and educational research. It also discusses the possible extension of these tools to other domains of affective computing and human computer interaction. Categories and Subject Descriptors H.5.2 [User Interfaces]: User-Centered Design. General Terms Measurement, Documentation, Design, Human Factors. Keywords Computer Assisted Direct Observation (CADO), time sampling, user experience, Context Awareness, BROMP, Systematic Direct Observations, Minimal Attention User Interfaces, experience sampling, human computer interaction, educational data mining 1. INTRODUCTION The Human Affect Recording Tool (HART), now in version 8.8, is a tool for collecting data on student engagement that is used for educational improvement and basic research. Specifically, it is a Computer Assisted Direct Observation (CADO) tool [12] [33], which facilitates systematic direct observation [14]. Designed for the Android platform, HART was developed with funding from the Pittsburgh Science of Learning Center (PSLC) to enforce the Baker Rodrigo Ocumpaugh Monitoring Protocol (BROMP), an established field method for studying student engagement in authentic learning settings. In this way, BROMP (discussed in detail in §3) mirrors the recent emphasis on emotional UX design (cf. [21]), but stresses the collection of experiences specific to learning. HART’s design improves the speed and accuracy of BROMP, where observers code students’ behavior and affect; this data is then used to understand and improve learning experiences. HART has now been used in over 40 studies of student engagement, most of which have investigated student behavior and affect in the context of educational software [5], but it has recently been extended to other educational settings. For example, BROMP (and HART) has been used to study the effect of kindergarten classroom design on student engagement [11] and to help teachers in India identify more engaging pedagogical strategies [15]. BROMP’s success in education research suggests that would be quite easy to adapt to other domains, helping communication designers dealing with high-volume ambient data to scale down to more meaningful, humane measures of user experiences [23], and HART’s design is flexible enough that it could also be adapted for this purpose. In this paper, we provide a short review of literature on other CADO designs and a brief overview of BROMP to contextualize the design choices made in HARTs construction. We then discuss details of HART’s design, including technical aspects about its code, information about the user interface that BROMP-certified observers access during fieldwork, methods for harvesting data once fieldwork concludes, and information about modifications that could extend HARTs use to other research domains. 2. Observational Data Collection Software In many fields, the design of data collection tools is not discussed. Although instrument design is understood to impact the kind of data that can be collected, these methodological details are not prioritized during the publication process. In fact, [19] report that even the existence of tools is more likely to be shared through informal channels than scholarly work. The rise of ubiquitous computing has changed this slightly, but in general software for data collection has followed this trend. Extensive UI research examines design principles in industrial and consumer contexts (cf. [18], [17]), but less work is published on design for scientific field observations. This is not to say that scholars have ignored technology’s potential for simplifying record keeping or enforcing complicated observation schedules. Even before modern computing was a pervasive part of daily lives, scientists using direct observation protocols used printer-calculators to record [9], [34], [34] and low-tech alerts to unobtrusively signal observation times [28]. A few scholars in the psychological sciences have written about the benefits of CADOs (cf. [1] [29]). For example, written records may be illegible or incomplete, whereas CADOs can improve internal consistency by enforcing specific coding schemes and preventing missing data (see [1]). Compact CADOs may be less obtrusive than paper-and-pencil methods [13], improving the quality of the observational data, which also increases their validity. CADOs are also known to improve the speed and accuracy of coding; [19] found CADO data collection to be 23% Permission to make digital or hard copies of all or part of this work for personal or classroom use is granted without fee provided that copies are not made or distributed for profit or commercial advantage and that copies bear this notice and the full citation on the first page. To copy otherwise, or republish, to post on servers or to redistribute to lists, requires prior specific permission and/or a fee. Conference’10, Month 1–2, 2010, City, State, Country. Copyright 2010 ACM 1-58113-000-0/00/0010 …$15.00.
-
Upload
nguyentruc -
Category
Documents
-
view
220 -
download
2
Transcript of HART: The Human Affect Recording Tool - Columbia Universityrsb2162/SigDoc2015.pdf · HART: The...

HART: The Human Affect Recording Tool Jaclyn Ocumpaugh1, Ryan S. Baker2, Ma Mercedes Rodrigo3, Aatish Salvi4, Martin van Velsen5,
Ani Aghababyan6, & Taylor Martin7 Teachers College, Columbia University1,2, University of Ateno3, Worcester Polytechnic Institute1,2,4, Carnegie Mellon
University5, & Utah State University6,7 525 West 120th Streetmjh
New York, NY 10027 1-212-678-3854
ABSTRACT This paper evaluates the Human Affect Recording Tool (HART), a Computer Assisted Direct Observation (CADO) application that facilitates scientific sampling. HART enforces an established method for systematic direct observation in Educational Data Mining (EDM) research, the Baker Rodrigo Ocumpaugh Monitoring Protocol [25] [26]. This examination provides insight into the design of HART for rapid data collection for both formative classroom assessment and educational research. It also discusses the possible extension of these tools to other domains of affective computing and human computer interaction.
Categories and Subject Descriptors H.5.2 [User Interfaces]: User-Centered Design.
General Terms Measurement, Documentation, Design, Human Factors.
Keywords Computer Assisted Direct Observation (CADO), time sampling, user experience, Context Awareness, BROMP, Systematic Direct Observations, Minimal Attention User Interfaces, experience sampling, human computer interaction, educational data mining
1. INTRODUCTION The Human Affect Recording Tool (HART), now in version 8.8, is a tool for collecting data on student engagement that is used for educational improvement and basic research. Specifically, it is a Computer Assisted Direct Observation (CADO) tool [12] [33], which facilitates systematic direct observation [14]. Designed for the Android platform, HART was developed with funding from the Pittsburgh Science of Learning Center (PSLC) to enforce the Baker Rodrigo Ocumpaugh Monitoring Protocol (BROMP), an established field method for studying student engagement in authentic learning settings. In this way, BROMP (discussed in detail in §3) mirrors the recent emphasis on emotional UX design (cf. [21]), but stresses the collection of experiences specific to learning. HART’s design improves the speed and accuracy of BROMP, where observers code students’ behavior and affect; this data is then used to understand and improve learning experiences.
HART has now been used in over 40 studies of student engagement, most of which have investigated student behavior and affect in the context of educational software [5], but it has recently been extended to other educational settings. For example, BROMP (and HART) has been used to study the effect of kindergarten classroom design on student engagement [11] and to help teachers in India identify more engaging pedagogical strategies [15]. BROMP’s success in education research suggests that would be quite easy to adapt to other domains, helping communication designers dealing with high-volume ambient data to scale down to more meaningful, humane measures of user experiences [23], and HART’s design is flexible enough that it could also be adapted for this purpose.
In this paper, we provide a short review of literature on other CADO designs and a brief overview of BROMP to contextualize the design choices made in HARTs construction. We then discuss details of HART’s design, including technical aspects about its code, information about the user interface that BROMP-certified observers access during fieldwork, methods for harvesting data once fieldwork concludes, and information about modifications that could extend HARTs use to other research domains.
2. Observational Data Collection Software In many fields, the design of data collection tools is not discussed. Although instrument design is understood to impact the kind of data that can be collected, these methodological details are not prioritized during the publication process. In fact, [19] report that even the existence of tools is more likely to be shared through informal channels than scholarly work. The rise of ubiquitous computing has changed this slightly, but in general software for data collection has followed this trend. Extensive UI research examines design principles in industrial and consumer contexts (cf. [18], [17]), but less work is published on design for scientific field observations.
This is not to say that scholars have ignored technology’s potential for simplifying record keeping or enforcing complicated observation schedules. Even before modern computing was a pervasive part of daily lives, scientists using direct observation protocols used printer-calculators to record [9], [34], [34] and low-tech alerts to unobtrusively signal observation times [28]. A few scholars in the psychological sciences have written about the benefits of CADOs (cf. [1] [29]). For example, written records may be illegible or incomplete, whereas CADOs can improve internal consistency by enforcing specific coding schemes and preventing missing data (see [1]). Compact CADOs may be less obtrusive than paper-and-pencil methods [13], improving the quality of the observational data, which also increases their validity. CADOs are also known to improve the speed and accuracy of coding; [19] found CADO data collection to be 23%
Permission to make digital or hard copies of all or part of this work for personal or classroom use is granted without fee provided that copies are not made or distributed for profit or commercial advantage and that copies bear this notice and the full citation on the first page. To copy otherwise, or republish, to post on servers or to redistribute to lists, requires prior specific permission and/or a fee. Conference’10, Month 1–2, 2010, City, State, Country. Copyright 2010 ACM 1-58113-000-0/00/0010 …$15.00.
faster than paper methods, with markedly fewer errors. Moreover, CADOs eliminate the chance of transfer errors that may occur when paper data is transcribed to electronic mediums for further analysis. Such features lead some to suggest that CADOs offer financial benefits [32].
One notable discussion on CADO design is [27], who looked at an application used in both ethology and archeology. Although not presented as formalized design principles, [27]’s discussion of dynamic user configurations stressed that designers should pay meticulous attention to the mobility of the user (not just the device), recommending design choices that provided Minimal Attention User Interfaces (MAUIs) and appropriate levels of contextual awareness. Presenting an example of research studying wild giraffes, they advocated a form-follows-function design practice that specifically addresses the limited attention capacity and high-speed interactions of an observer making rapid observations of a wild animal. Whether chasing wildlife (e.g., [27]) or surreptitiously watching wily 5th graders pretending to work (in BROMP research), it is clear that contextual awareness (automatically documenting information for the user) and other MAUI design choices can improve coding validity.
3. BROMP The Baker Rodrigo Ocumpaugh Monitoring Protocol (formerly, the Baker Rodrigo Observation Method Protocol [25]), or BROMP 2.0 [26], is an observational method for collecting UX data in classrooms. BROMP-certified observers are trained in the coding of common indicators of student engagement and in appropriate classroom observation strategies. (Certification entails achieving high inter-rater reliability with an expert coder—see [26].) Coders strictly adhere to a momentary time sampling method (coding students individually in a pre-determined order) and coding standards acquired in training. Currently, there are over 150 BROMP-certified coders in 3 different countries.
BROMP observers use HART for field observations, entering information about the field site (e.g., Name of School) and each student (Student ID or pseudonym). HART then presents each Student ID with drop-down menus for coding behavioral and affective indicators of engagement. Students are coded individually in the order they were entered into HART. Observers have 20 seconds to make a judgment, but code only the first behavior and affective state that they see (e.g., on-task & bored or off-task & frustrated). Students who are out of their seat or who leave the classroom are coded as ?/?; ? is also used if behavior or affect is still ambiguous after 20 seconds, since it is likely that anything seen after that point may result from a change in state. Observers start by selecting the appropriate engagement codes for the first student, then continue until the last student is coded; coding then restarts at the first student and continues in this fashion until the observation period ends, usually the end of class.
BROMP codes were first used at the PSLC, a large NSF-funded research center, for studying student engagement with educational software. Formalized in [4], BROMP assumes that behavior and affect are at least partially orthogonal (i.e., they might influence one another or be subject to similar influences, but they can be studied separately). Therefore, each are recorded simultaneously, distinguishing bored and off-task students from bored and on-task students. PSLC coding schemes reflect prior research on relevant engagement indicators [8]. Behavior categories include on-task, on-task conversation, off-task, gaming the system, and ?. Affective categories include boredom, confusion, engaged concentration, frustration, and ?. However other coding schemes
have been used in order to accommodate indicators that are unique to particular learning experiences. For example, when studying EcoMUVE (a game-like environmental-education software), we recorded categories like delight, which is known to impact student learning but is infrequent in some educational settings [8] and creative metanarrative, a behavior which had not been previously documented [7]. Likewise, when studying a software tutor for Army field medicine, we coded constructs (e.g., intentional friendly fire) that are atypical of students’ educational experience with, say, middle school math tutors [3]. BROMP has been used to study students’ experience with the educational software in over a dozen online systems [26], leading to better understanding of engagement’s effect on learning and improved software designs.
4. HART 4.1 Technical Details The Human Affective Recording Tool (HART) was designed for Android after BROMP coding (e.g., [2]) had already been in use for five years. The Android platform met cost considerations (they are often cheaper and more durable than other tablets) and provides strong support for app development and dissemination. Written in Java, HART is fully open-source. It synchronizes to internet time using an NTP server, so that data can synchronize to internet-based educational software, with 1-2 second error. Thus, HART facilitates extremely accurate temporal records, allowing researchers to determine exactly what a student was doing within the software at the exact time that he or she was coded. This allows us to show, for example, that bored students are less likely to ask for hints in a math tutor like ASSISTments [24] and more likely to play with the submarine’s “zoom” function in a science tutor like EcoMUVE [6]. As of this writing, HART data has facilitated this sort of research on student engagement for 12 online learning systems, but time-stamp information is also useful for momentary time sampling estimates of the prevalence of specific emotions or behaviors, since it documents both the duration of the field session and sampling frequency.
Another benefit to its technical design is that HART immediately saves data to the Android SD card, as opposed to systems that rely heavily on RAM storage [16], [29]. Since apps occasionally crash and field conditions can be imperfect, this design is significant: HART data has survived system and application crashes/errors, dead batteries, and even missing batteries (though battery loss does frustrate further data collection). Once collected, data can be emailed directly from the app or harvested via USB cable.
HART is freely available both on the second author’s webpage (http://www.columbia.edu/~rsb2162/bromp.html) and the US Army Research Laboratory’s Generalized Intelligent Framework for Tutoring. Designed for BROMP, HART supports the use of up to 3 coding schemes, which can be customized with xml scripting. Thus it is easily adapted to sampling methods in other fields.
4.2 User Interface for Field Work HART’s compact interface allows researchers to quickly input data about the fieldwork setting before observations begin. In this section, we discuss the design principles reflected in HART’s layout, including the interface designed for inputting basic field information and the interface designed for inputting observations.
4.2.1 Fieldwork Information Page 1 The first screen in HART contains a drop-down menu and three textboxes. BROMP observers typically choose the 2-mode option (for using 2 coding schemes) from the drop-down menu, but a
single-mode and 3-mode option are available for other research objectives. Observers enter their own name into the User Name textbox and name the learning activity being observed in the Software Package textbox. Finally, they enter a password in a third textbox before pressing OK to move to the next screen.
4.2.2 Fieldwork Information Page 2 The second HART screen also collects information about the forthcoming observation session. Textboxes labeled Name of School and Name of Class are self-explanatory when working in schools, and the open-ended input accommodates information for other research domains. Observers also use a textbox in this screen to enter the number of students they will observe. (HART only permits numeric data here.) Recent modifications to HART allow observers to adjust this number before a session begins, but once a coder hits Start Recording (§4.2.5), it cannot be altered.
4.2.3 Fieldwork Information Page 3 This screen’s options are contingent on mode. If the 2-mode option was selected on page 1 (§4.2.1), 2 drop-down menus are used to choose from 9 behavior schemes and 8 affective schemes. In the 3-mode option, an additional scheme is selected with a third menu. Coding schemes from prior research are pre-loaded, and custom schemes can be added via xml scripting. In some schemes user-defined codes allow observers the flexibility to add codes for unexpected behaviors or affective states in the field (see [7]).
4.2.4 Entering Student (User) Information After submitting information about the fieldwork context, HART prompts the observer to enter an identifier, or Student ID, for each student, automatically assigning a Student Number to each. During setup, this is presented as Student Number [current] of [total] above the Student ID textbox, helping observers to confirm that they are inputting students in the correct order. A Next buttons below the textbox advances observers to the subsequent student until they have completed the ID entry, and the addition of a Previous button has improved this process. Before HART 6.0, the accuracy of ID entry could not be checked or corrected during set-up. Correcting mislabeled IDs is still a clumsy process (and is still restricted to setup), but this is nonetheless an advantage over earlier designs where observers had to wait until coding had begun to check for ID accuracy.
Several BROMP observers have requested the option to upload a list of IDs before fieldwork begins, but we have not added this feature due to accuracy concerns. Experience has shown that teacher-provided seating charts are often inaccurate, and student absences also create complexities. Furthermore, the current design requires observers to associate each student ID with a face at the start of class. This process makes coders more likely to notice when students switch seats or leave the room, improving the odds that the correct student is coded when HART prompts the observer with that ID later in the class.
4.2.5 Synchronizing and Starting Observations Once all IDs are entered, HART presents the observer with a Start Recording button. This screen also provides a check box for observers who would like the app to immediately synchronize to NTP time, ensuring the most accurate timestamp for each observation. This design feature was added in v6.0, to allow observers to bypass synchronization in settings where mobile internet and WiFi are unavailable or unreliable. (In these cases, observers synchronize prior to travel to the field site; significant changes in cell phone skew from NTP time over the course of a single day have been very rare.) If the observer successfully
attempts synchronization, the app automatically advances to the data collection phase. If it fails, observers can endeavor to toggle phone settings (e.g., airplane mode) before re-attempting. Those willing to skip synchronization must assent in order to continue.
4.2.6 Data Collection/Observation Screens Once the Start Recording button is hit, HART presents Student IDs one at a time, in order, for observers to code. HART follows MAUI design principles, automatically-generating contextually-relevant information so that the user can focus attention on observations rather than data management.
4.2.6.1 Presentation of Student Information At the top of each observation screen, HART’s context aware design automatically generates values to assist coder accuracy. These include the Student Number, the Number of Observations Completed (updated after each code), and the Student ID entered at the beginning of the session. Since observers typically follow a somewhat linear pattern around the classroom (going up and down rows of desks, depending on classroom layout) when inputting IDs, it is easy to start with student #1 and count to the student being observed. However, students are prone to leave class, switch seats, or otherwise moving around, which can be challenging when trying to keep track of them solely with HART. (This is especially true at the start of observations; the longer observers spend with students, the more likely they are to correctly associate IDs with faces.) To address this issue, many observers supplement HART with a seating chart matching the classroom layout (drawn by the observer to ensure accurate interpretation). In classrooms where several different observations occur in a day, observers have found it useful to ink a layout and pencil Student Numbers onto corresponding desks, crossing out empty chairs to ensure they notice when students move or leave. Because of HART’s MAUI, an experienced observer can easily balance the device on a clipboard with a seating chart underneath.
Some observers have suggested that tablet computer innovations could facilitate an elaborate re-design of HART, allowing coders to create an interactive seating chart during setup. Though more technologically advanced than paper seating charts used now, such a design could increase setup time, reducing the amount of data collected. Furthermore, it could make the observer more obtrusive since tablet screens are harder to obscure from curious students than cell phones. In our experience, some students are curious about the link between Student IDs being entered into the device at the start of the class and the observer’s later activities, but this is rare. BROMP training provides extensive direction on reducing observer effects (ensuring that even the most inquisitive students struggle to identify who/what is being observed), but seating charts on tablet screens could be more difficult to conceal.
4.2.6.2 Countdown Clock Under the student information on each observation screen is a countdown clock that resets to 3 minutes each time HART advances to the next observation. This serves as a guideline for BROMP observers who are trained to code within 20 seconds.
Other clock designs were tested. HART 1.0 required observers to signal when an observation started and automatically advanced to the next observation after 20 seconds whether or not they were done entering codes. However, in line with previous research [35], early observers reported that this cumbersome and anxiety-inducing design distracted from their primary task—accurately and unobtrusively observing students in sometimes chaotic classroom conditions. Specifically, they complained that when
they moved to better view of students or paused to accommodate learning activities or changing classroom conditions, the automatic advance function skipped several students. Keeping track of automatic advances required observers to focus on HART to avoid coding information about the wrong student, but it also presented other problems for accuracy. Coders who accidentally selected a wrong drop-down code were often advanced before they could correct it, inducing coder anxiety (an emotion that is not conducive to reliable coding). Later designs also tested a 20-second countdown clock that did not automatically advance, but we found the longer countdown was better able to accommodate these potential disruptions.
Currently, observers are trained to note the clock, but nothing occurs if it expires. This may occasionally result in less systematic sampling intervals, but it has increased accuracy. Moreover, we find that coders often do not need the full 20 seconds to make an observation. By the time they are BROMP-certified, they are quite adept at maintaining a fast-paced flow (3-5 sec./obs. under appropriate classroom conditions).
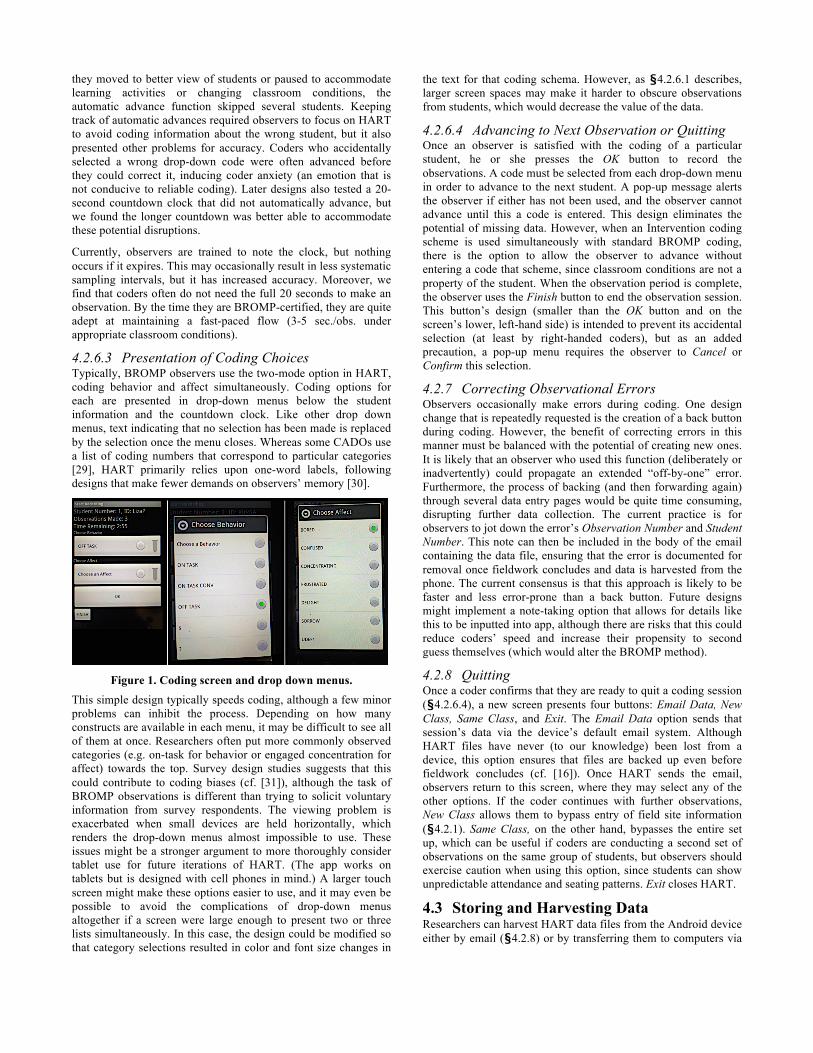
4.2.6.3 Presentation of Coding Choices Typically, BROMP observers use the two-mode option in HART, coding behavior and affect simultaneously. Coding options for each are presented in drop-down menus below the student information and the countdown clock. Like other drop down menus, text indicating that no selection has been made is replaced by the selection once the menu closes. Whereas some CADOs use a list of coding numbers that correspond to particular categories [29], HART primarily relies upon one-word labels, following designs that make fewer demands on observers’ memory [30].
Figure 1. Coding screen and drop down menus.
This simple design typically speeds coding, although a few minor problems can inhibit the process. Depending on how many constructs are available in each menu, it may be difficult to see all of them at once. Researchers often put more commonly observed categories (e.g. on-task for behavior or engaged concentration for affect) towards the top. Survey design studies suggests that this could contribute to coding biases (cf. [31]), although the task of BROMP observations is different than trying to solicit voluntary information from survey respondents. The viewing problem is exacerbated when small devices are held horizontally, which renders the drop-down menus almost impossible to use. These issues might be a stronger argument to more thoroughly consider tablet use for future iterations of HART. (The app works on tablets but is designed with cell phones in mind.) A larger touch screen might make these options easier to use, and it may even be possible to avoid the complications of drop-down menus altogether if a screen were large enough to present two or three lists simultaneously. In this case, the design could be modified so that category selections resulted in color and font size changes in
the text for that coding schema. However, as §4.2.6.1 describes, larger screen spaces may make it harder to obscure observations from students, which would decrease the value of the data.
4.2.6.4 Advancing to Next Observation or Quitting Once an observer is satisfied with the coding of a particular student, he or she presses the OK button to record the observations. A code must be selected from each drop-down menu in order to advance to the next student. A pop-up message alerts the observer if either has not been used, and the observer cannot advance until this a code is entered. This design eliminates the potential of missing data. However, when an Intervention coding scheme is used simultaneously with standard BROMP coding, there is the option to allow the observer to advance without entering a code that scheme, since classroom conditions are not a property of the student. When the observation period is complete, the observer uses the Finish button to end the observation session. This button’s design (smaller than the OK button and on the screen’s lower, left-hand side) is intended to prevent its accidental selection (at least by right-handed coders), but as an added precaution, a pop-up menu requires the observer to Cancel or Confirm this selection.
4.2.7 Correcting Observational Errors Observers occasionally make errors during coding. One design change that is repeatedly requested is the creation of a back button during coding. However, the benefit of correcting errors in this manner must be balanced with the potential of creating new ones. It is likely that an observer who used this function (deliberately or inadvertently) could propagate an extended “off-by-one” error. Furthermore, the process of backing (and then forwarding again) through several data entry pages would be quite time consuming, disrupting further data collection. The current practice is for observers to jot down the error’s Observation Number and Student Number. This note can then be included in the body of the email containing the data file, ensuring that the error is documented for removal once fieldwork concludes and data is harvested from the phone. The current consensus is that this approach is likely to be faster and less error-prone than a back button. Future designs might implement a note-taking option that allows for details like this to be inputted into app, although there are risks that this could reduce coders’ speed and increase their propensity to second guess themselves (which would alter the BROMP method).
4.2.8 Quitting Once a coder confirms that they are ready to quit a coding session (§4.2.6.4), a new screen presents four buttons: Email Data, New Class, Same Class, and Exit. The Email Data option sends that session’s data via the device’s default email system. Although HART files have never (to our knowledge) been lost from a device, this option ensures that files are backed up even before fieldwork concludes (cf. [16]). Once HART sends the email, observers return to this screen, where they may select any of the other options. If the coder continues with further observations, New Class allows them to bypass entry of field site information (§4.2.1). Same Class, on the other hand, bypasses the entire set up, which can be useful if coders are conducting a second set of observations on the same group of students, but observers should exercise caution when using this option, since students can show unpredictable attendance and seating patterns. Exit closes HART.
4.3 Storing and Harvesting Data Researchers can harvest HART data files from the Android device either by email (§4.2.8) or by transferring them to computers via
USB cables. Files—stored in a single HART folder—are automatically labeled with date and field site input (§4.2.2). File names start with the Name of School and Name of Class, followed by the date/time in M-D-Y-Hr-Min-Sec format. This automaticity follows CADO design principles from prior research, preserving key contextual data without additional attentional resources from the user [22], and the systematic label offers other functional advantages. By fronting field information, humans can quickly identify, extract, and organize data for particular projects, improving research productivity. The date/time stamp provides redundancy for this purpose (data collected on the same day/week is often part of the same project) while also enhancing specificity (since even observers coding the same class are unlikely to synchronize to the NTP server at the same 100th of a second).
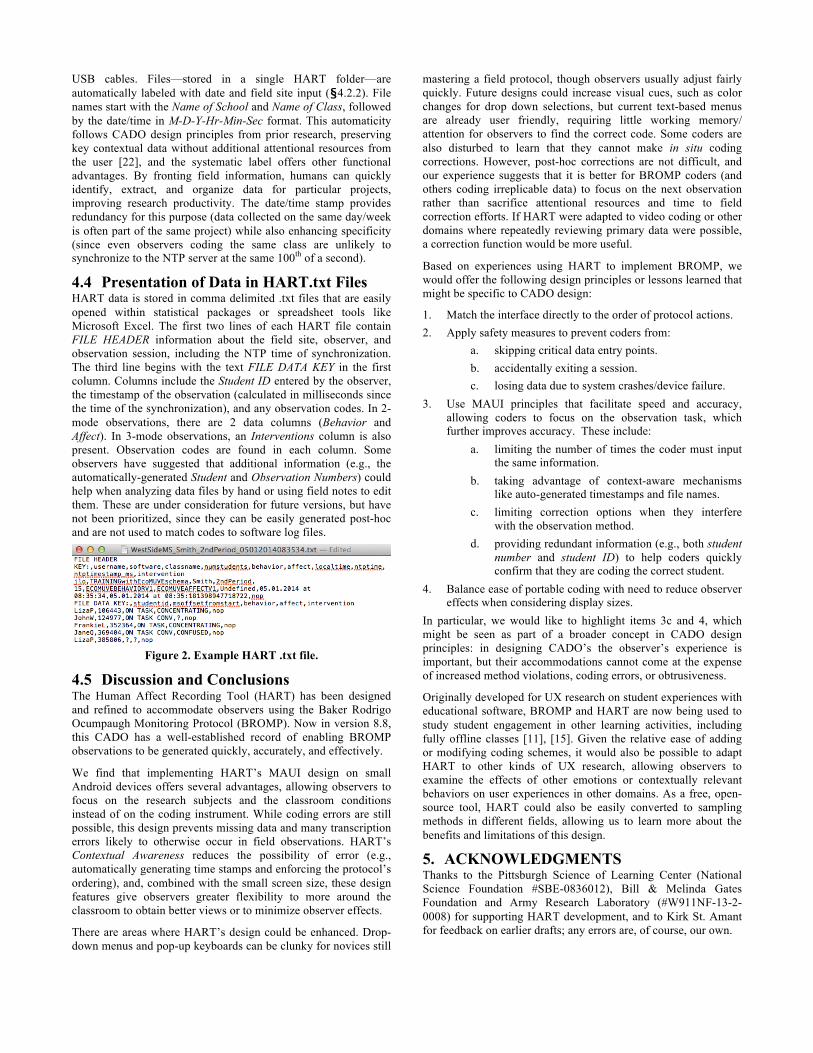
4.4 Presentation of Data in HART.txt Files HART data is stored in comma delimited .txt files that are easily opened within statistical packages or spreadsheet tools like Microsoft Excel. The first two lines of each HART file contain FILE HEADER information about the field site, observer, and observation session, including the NTP time of synchronization. The third line begins with the text FILE DATA KEY in the first column. Columns include the Student ID entered by the observer, the timestamp of the observation (calculated in milliseconds since the time of the synchronization), and any observation codes. In 2-mode observations, there are 2 data columns (Behavior and Affect). In 3-mode observations, an Interventions column is also present. Observation codes are found in each column. Some observers have suggested that additional information (e.g., the automatically-generated Student and Observation Numbers) could help when analyzing data files by hand or using field notes to edit them. These are under consideration for future versions, but have not been prioritized, since they can be easily generated post-hoc and are not used to match codes to software log files.
Figure 2. Example HART .txt file.
4.5 Discussion and Conclusions The Human Affect Recording Tool (HART) has been designed and refined to accommodate observers using the Baker Rodrigo Ocumpaugh Monitoring Protocol (BROMP). Now in version 8.8, this CADO has a well-established record of enabling BROMP observations to be generated quickly, accurately, and effectively.
We find that implementing HART’s MAUI design on small Android devices offers several advantages, allowing observers to focus on the research subjects and the classroom conditions instead of on the coding instrument. While coding errors are still possible, this design prevents missing data and many transcription errors likely to otherwise occur in field observations. HART’s Contextual Awareness reduces the possibility of error (e.g., automatically generating time stamps and enforcing the protocol’s ordering), and, combined with the small screen size, these design features give observers greater flexibility to more around the classroom to obtain better views or to minimize observer effects.
There are areas where HART’s design could be enhanced. Drop-down menus and pop-up keyboards can be clunky for novices still
mastering a field protocol, though observers usually adjust fairly quickly. Future designs could increase visual cues, such as color changes for drop down selections, but current text-based menus are already user friendly, requiring little working memory/ attention for observers to find the correct code. Some coders are also disturbed to learn that they cannot make in situ coding corrections. However, post-hoc corrections are not difficult, and our experience suggests that it is better for BROMP coders (and others coding irreplicable data) to focus on the next observation rather than sacrifice attentional resources and time to field correction efforts. If HART were adapted to video coding or other domains where repeatedly reviewing primary data were possible, a correction function would be more useful.
Based on experiences using HART to implement BROMP, we would offer the following design principles or lessons learned that might be specific to CADO design:
1. Match the interface directly to the order of protocol actions. 2. Apply safety measures to prevent coders from:
a. skipping critical data entry points. b. accidentally exiting a session. c. losing data due to system crashes/device failure.
3. Use MAUI principles that facilitate speed and accuracy, allowing coders to focus on the observation task, which further improves accuracy. These include:
a. limiting the number of times the coder must input the same information.
b. taking advantage of context-aware mechanisms like auto-generated timestamps and file names.
c. limiting correction options when they interfere with the observation method.
d. providing redundant information (e.g., both student number and student ID) to help coders quickly confirm that they are coding the correct student.
4. Balance ease of portable coding with need to reduce observer effects when considering display sizes.
In particular, we would like to highlight items 3c and 4, which might be seen as part of a broader concept in CADO design principles: in designing CADO’s the observer’s experience is important, but their accommodations cannot come at the expense of increased method violations, coding errors, or obtrusiveness.
Originally developed for UX research on student experiences with educational software, BROMP and HART are now being used to study student engagement in other learning activities, including fully offline classes [11], [15]. Given the relative ease of adding or modifying coding schemes, it would also be possible to adapt HART to other kinds of UX research, allowing observers to examine the effects of other emotions or contextually relevant behaviors on user experiences in other domains. As a free, open-source tool, HART could also be easily converted to sampling methods in different fields, allowing us to learn more about the benefits and limitations of this design.
5. ACKNOWLEDGMENTS Thanks to the Pittsburgh Science of Learning Center (National Science Foundation #SBE-0836012), Bill & Melinda Gates Foundation and Army Research Laboratory (#W911NF-13-2-0008) for supporting HART development, and to Kirk St. Amant for feedback on earlier drafts; any errors are, of course, our own.
6. REFERENCES [1] Adiguzel, T., Vannest, K., & Zellner, R. (2009) The use and
efficacy of handheld computers for school-based data collec-tion: a lit. review. Computers in the Schools, 26(3), 187-206.
[2] Baker, R.S., Corbett, A., Koedinger, K., Wagner, A. (2004) Off-Task Behavior in the Cognitive Tutor Classroom: When Students "Game The System." Proc. ACM CHI, 383-390.
[3] Baker, R.S., DeFalco, J., Ocumpaugh, J., Paquette, L. (2014) Towards Detection of Engagement & Affect in a Simulation-based Combat Medic Training Environment. GIFTSym2.
[4] Baker, R.S.J.d., D'Mello, S., Rodrigo, M.M.T., Graesser, A. (2010) Better to Be Frustrated than Bored: The Incidence, Persistence, & Impact of Learners' Cognitive-Affective States during Interactions with 3 Different Computer-Based Learning Environments. Int J HumComp Stud, 68(4), 223-41.
[5] Baker, R.S., Ocumpaugh, J. (2015) Interaction-Based Affect Detection in Educational Software. Calvo, D'Mello, Gratch, Kappas, Handbook of Affective Computing. Oxford U.P.
[6] Baker, R.S., Ocumpaugh, J., Gowda, S.M., Kamarainen, A., Metcalf, S. (2014) Extending Log-Based Affect Detection to a Multi-User Virtual Environment for Science. Proc. 22nd User Modeling, Adaptation, & Personalization, 290-300.
[7] Ocumpaugh, J., Baker, R., Kamarainen, A, Metcalf, S (2014) Modifying Field Observation Methods on the Fly: Meta-narrative and Disgust in an Environmental MUVE. 4th Per-sonalization Approaches in Learning Environments, 49-54.
[8] D’Mello, S., Graesser, A. & Picard, R. (2007) Toward an affect-sensitive AutoTutor. Intelligent Systems, 22(4), 53-61.
[9] Edleson, J. (1978) An inexpensive instrument for rapid re-cording of in vivo observations. J. App Behavior Analysis.
[10] Galesic, M., Tourangeau, R., Couper, M. & Conrad, F. (2008). Eye-Tracking data new insights on response order effects and other cognitive shortcuts in survey responding. Public Opinion Quarterly, 72(5), 892-913.
[11] Godwin, K., Almeda, M., Petroccia, M., Baker, R., Fisher, A. (2013) Classroom activities & off-task behavior elementary school children. Proc Cognitive Science Society, 2428-2433.
[12] Gravlee, C., Zenk, S., Woods, S., Rowe, Z. & Schulz, A. (2006) Handheld computers for systematic observation of the social & physical environment. Field Methods, 18, 382–397.
[13] Greenwood, C., Carta, J., Kamps, D., Terry, B., Delquadri, J. (1994) Dev. & validation of std classroom observation sys-tems for school practitioners: Ecobehavioral assessment sys-tems software (EBASS). Exceptional Children, 61, 197–210.
[14] Hintze, J. M., Volpe, R. J., & Shapiro, E. S. (2002) Best practices in the systematic direct observation of student behavior. Best practices in school psychology, 4, 993-1006.
[15] Hymavathy, C., Krishnamani, V., & Sumathi, C. (2014) Analyzing Learner Engagement to Enhance the Teaching-Learning Experience. 2nd IEEE Int Conf on MOOCs, Innovation, & Technology in Education.
[16] Ice, G. H. (2004) Technological advances in observational data collection: The advantages and limitations of computer-assisted data collection. Field Methods, 16, 352–375.
[17] Jæger, M., Skov, M., & Thomassen, N. (2008) You can touch, but you can't look: interacting with in-vehicle systems. SIGCHI Human Factors in Computing Systems, 1139-1148.
[18] Karlson, A., Bederson, B., & Contreras-Vidal, J. (2006) Understanding single-handed mobile device interaction. Handb Res Interface Des & Eval for Mobile Tech, 86-101.
[19] Kahng, S, Iwata, B. (1998) Computerized systems for collec-ting realtime observational data. J App Beh Anal, 31, 253–61.
[20] Lal, D., Smith, F., Davis, J, Castro, H, Smith, D, Chinkes, D, Barrow, R. (2000) Palm comp demonstrates fast & accurate burn data collection. J Burn Care & Rehab, 21, 559–561.
[21] Law, E, Roto, V, Hasenzahl, M, Vermeeren, A, Kort, J (2009) Understanding, Scoping & Defining User eXperience: A Sur-vey Approach. 27th Int Conf Hum Factors Comp Syst, 719-28.
[22] Moe, K., Dwolatzky, B., & Olst, R. (2004) Designing a usable mobile application for field data collection. 7th AFRICON Conference in Africa, 2, 1187-1192.
[23] McNely, B. (2012) Big data, situated people: humane approaches to communication design. Com Des Quart Rev, 1(1), 27-30.
[24] Ocumpaugh, J., Baker, R., Gowda, S., Heffernan, N., Heffer-nan, C. (2014) Population validity for Educational Data Mining models: A case study in affect detection. British Journal of Educational Technology, 45 (3), 487-501.
[25] Ocumpaugh, J., Baker, R.S, Rodrigo, M.M.T. (2012) Baker-Rodrigo Observation Method Protocol (BROMP) 1.0. Training Manual. NY, NY: EdLab. Manila, Philippines: Ateneo Laboratory for the Learning Sciences.
[26] Ocumpaugh, J., Baker, R.S, Rodrigo, M.M.T. (2015) Baker Rodrigo Ocumpaugh Monitoring Protocol (BROMP) 2.0 Technical & Training Manual. NY, NY: Teachers College, Columbia U. Manila, Philippines: Ateneo Laboratory for the Learning Sciences.
[27] Pascoe, J., Ryan, N., & Morse, D. (2000) Using while mov-ing: HCI issues in fieldwork environments. Transactions on Computer-Human Interaction, 7(3), 417-437.
[28] Reynierse, J. Toevs, J. (1973) An ideal signal generator for time-sampling observation procedures. Behavior Research Methods, 5(1), 57-58.
[29] Roberts, W. (2012) Programs for the Collection and Analysis of Observational Data Manual for Version 2.75.5.
[30] Sarkar, A., Dutta, A., Dhingra, U., Dhingra, P., Verma, P., Juyal, R., & Sazawal, S. (2006) Development and use of behavior and social interaction software installed on Palm handheld for observation of a child’s social interactions with environment. Behavior Research Methods, 38(3), 407-415.
[31] Stern, M., Dillman, D., & Smyth, J. (2007) Visual design, or-der effects, & respondent characteristics in self-administered survey. Survey Research Methods 1(3), 121-138.
[32] Tapp, J. (2008) INTMAN: Interval Manager [Handheld computer app]. Nashville, TN: Vanderbilt Kennedy Center.
[33] Wessel, D. (2015) The Potential of Computer-Assisted Dir-ect Observation Apps. Int J Interact Mobile Tech, 9(1), 31.
[34] Wolach, A. H., Roccaforte, P., & Brhuning, S. E. (1975) Converting an electronic calculator into a counter. Behavior Research Methods & Instrumentation, 7(4), 365-367.
[35] Wright, P. (1974) The harassed decision maker: Time pressures, distractions, & the use of evidence. Journal of Applied Psychology 59(5), 555.