Harnessing the Digital Lens to Measure and Manage...
16
Electronic copy available at: http://ssrn.com/abstract=1709943 Harnessing the Digital Lens to Measure and Manage Information Work Sinan Aral NYU Stern School of Business & MIT, 44 West 4 th Street Room: 8-81, New York, NY 10012 [email protected] Erik Brynjolfsson MIT Sloan School of Management, Room: E53-313, 50 Memorial Drive, Cambridge, MA 02142 [email protected] Marshall Van Alstyne Boston University & MIT, 595 Commonwealth Avenue, Boston, MA 02215 [email protected] Revolutions in measurement inevitably revolutionize science and practice. Over 300 years ago, Anton van Leeuwenhoek developed a better microscope to verify thread counts on imported carpets. Using this new tool, he discovered microorganisms he called “animalcules” in drops of water and individual blood corpuscles in drops of blood. Biology and medicine have never been the same. Just as the microscope gave rise to the germ theory of disease and the remarkable advances that followed, our new-found ability to observe fine-grained information flows in electronic data portends a revolution in our understanding of information work. Managers who harness this new Digital Lens will uncover a wealth of insights into performance improvement for individuals, teams and organizations - insights that will ultimately affect the economy as a whole. In this article, we draw on our own research, and that of others, to describe tools and techniques for tracking information work in unprecedented detail. The result is a step change in our ability to manage information work and information workers. During the course of our research, we used these tools to uncover lessons for individuals on information novelty, workload and transformation, as well as for organizations on automation, decentralization, and incentives. Perhaps more importantly, this fine-grained view of work provides a toolkit for deriving new lessons, many of which will vary from company to company, but each of which will be grounded in detailed, actionable data. What analyzing information flows reveals about information work Social interactions have always been a part of business, but today our web of connections embodied in email, geo-positioning, Internet access and instant messaging leaves microscopic traces. Previously invisible activity has become visible as Digital Lenses reveal our patterns of information flow (Lazer et al 2009, Aral et al 2009). While the visibility of these connections has garnered much press attention at social networking sites like Facebook, a far greater impact on the economy will materialize when unseen correlations with performance come into focus. Like doctors improving diagnoses, real change will occur when organizations understand and act on the communication flows that constitute their lifeblood, right down to the content of individual messages.
-
Upload
vuongquynh -
Category
Documents
-
view
217 -
download
2
Transcript of Harnessing the Digital Lens to Measure and Manage...

Electronic copy available at: http://ssrn.com/abstract=1709943
Harnessing the Digital Lens to Measure and Manage Information Work
Sinan Aral
NYU Stern School of Business & MIT, 44 West 4th Street Room: 8-81, New York, NY 10012 [email protected]
Erik Brynjolfsson
MIT Sloan School of Management, Room: E53-313, 50 Memorial Drive, Cambridge, MA 02142 [email protected]
Marshall Van Alstyne
Boston University & MIT, 595 Commonwealth Avenue, Boston, MA 02215 [email protected]
Revolutions in measurement inevitably revolutionize science and practice. Over 300 years ago, Anton van Leeuwenhoek developed a better microscope to verify thread counts on imported carpets. Using this new tool, he discovered microorganisms he called “animalcules” in drops of water and individual blood corpuscles in drops of blood. Biology and medicine have never been the same. Just as the microscope gave rise to the germ theory of disease and the remarkable advances that followed, our new-found ability to observe fine-grained information flows in electronic data portends a revolution in our understanding of information work. Managers who harness this new Digital Lens will uncover a wealth of insights into performance improvement for individuals, teams and organizations - insights that will ultimately affect the economy as a whole. In this article, we draw on our own research, and that of others, to describe tools and techniques for tracking information work in unprecedented detail. The result is a step change in our ability to manage information work and information workers. During the course of our research, we used these tools to uncover lessons for individuals on information novelty, workload and transformation, as well as for organizations on automation, decentralization, and incentives. Perhaps more importantly, this fine-grained view of work provides a toolkit for deriving new lessons, many of which will vary from company to company, but each of which will be grounded in detailed, actionable data. What analyzing information flows reveals about information work Social interactions have always been a part of business, but today our web of connections embodied in email, geo-positioning, Internet access and instant messaging leaves microscopic traces. Previously invisible activity has become visible as Digital Lenses reveal our patterns of information flow (Lazer et al 2009, Aral et al 2009). While the visibility of these connections has garnered much press attention at social networking sites like Facebook, a far greater impact on the economy will materialize when unseen correlations with performance come into focus. Like doctors improving diagnoses, real change will occur when organizations understand and act on the communication flows that constitute their lifeblood, right down to the content of individual messages.

Electronic copy available at: http://ssrn.com/abstract=1709943
Harnessing the Digital Lens Page 2
For the past decade, our research has measured and analyzed information flows at various firms (see sidebar for details). Fine-grained measurement of information flows and their relationship with productivity and compensation challenged basic assumptions while generating insights into what good management means in information rich environments. Enterprise information is a means not an end. Faster, better and cheaper information processing only has value to an organization if it increases performance. Are managers who processed more information more productive? Do they generate more revenue for their firms, close more contracts, or earn higher compensation? Our data affirmed that more was not necessarily better. Raw quantities of information flows did not correlate well with higher productivity. What’s more, different circumstances demanded different tactics.
Figure 1 – These plots show hourly email patterns averaged over six weeks for four people. Behaviors vary widely and communications volume alone was not the best predictor of productivity.
But when we matched data on information flows to data on performance, recurring patterns emerged. The correlations we found can be organized into eight basic lessons for managing information work: four for individual information workers and four more for the organization as a whole. Transforming Work: Lessons for Information Workers 1. Be a broker of information

Harnessing the Digital Lens Page 3
Analysis of email traffic provides a window into information workers' professional social networks. These contact networks predict performance better than older metrics like experience and education, providing quantitative evidence that "social capital" is an integral part of "human capital." We found that sending or receiving lots of information was not, by itself, the best predictor of performance. One's role as an information hub in the network of connections however was much more important. Information workers benefited from actively brokering information. Workers who were more central to the information flows - as measured by their frequency of being on the shortest path connecting others - were more productive. Further, each additional contact that a worker had was correlated with over $1000 of additional revenue generated.
Figure 2 – The email network of some of the workers we studied reveals their information flows. The worker labeled “w14,” scored high on the betweenness centrality metric, making him an “information hub” in this firm. He was also among the best performers.
Why did being well-connected predict higher performance? Our data enabled us to examine not only the set of connections, but also the nature of the information flowing through those connections. We found that more diverse social contacts led people to receive more novel information. In turn, more novel information predicted significant productivity gains. By applying a set of algorithms to analyze email content, we determined characteristics of information flows that contribute to better decisions, faster work, and higher productivity (Aral, Brynjolfsson & Van Alstyne 2007; Aral & Van Alstyne 2009). Novel information was by far the best predictor of performance and network diversity predicted access to novelty. By reaching into diverse information pools in different parts of the network, information brokers maintained awareness of opportunities and complementary expertise not necessarily visible to others around them. Information sharing is a function of social distance. Contacts two hops away in the social network can volunteer information at less than half the rate, so more direct access to different pools of information keeps workers better informed. In our study, the diffusion of news dropped by 27%

Harnessing the Digital Lens Page 4
for every step in the social network, while more complex discussion dropped by 97% for every step (Aral, Brynjolfsson & Van Alstyne 2007).
Figure 3 – This illustrates message level clustering of an email inbox, which allowed us to create vector models of novelty based on information dispersion.
However, there is a tradeoff between network diversity and relationship bandwidth: Socially distant contacts tend to provide more novel information, but interaction frequency tends to be low. In contrast, close contacts might have more redundant information but interaction frequency is high, and they are more willing to share. So, if you need valuable information that is time sensitive, you are more likely to get it sooner from close contacts (Aral & Van Alstyne 2009). To reinterpret the classic example of how "weak ties" help in finding jobs (Granovetter 1973), suppose that highly desirable job openings fill quickly but that undesirable jobs remain open longer. Then checking a weak tie (infrequently) for news of currently open jobs can sample disproportionately from undesirable openings. By the time a weak tie delivers information about a desirable job, information about that job is already well known to competitors. If information about jobs changes often or obsolesces quickly, frequent communication is essential to getting news in a timely manner. Frequent contact with strong ties is thus more likely to deliver valuable, novel information in turbulent information environments where information obsolesces quickly. We econometrically translated these correlates into measurable results. Each increase in the amount of non-redundant information flowing to individuals was associated with more revenue generated, more projects completed, and shorter average project duration per person per month. (Aral, Brynjolfsson & Van Alstyne 2006, 2007; Aral & Van Alstyne 2009). But, we also found diminishing returns to novel information (Aral & Van Alstyne 2009). As the total amount of novel information flowing into recruiters’ inboxes went up, their productivity first improved dramatically, then leveled off and declined. These observations align with the economic theory of information, which predicts diminishing marginal returns to more information due to decision irrelevance (Marschak & Radner 1972), bounded rationality (Simon 1991) and cognitive overload (Van Alstyne & Brynjolfsson 2005). 2. Send short messages to increase information metabolism In the digital economy, speed isn’t everything, but it doesn’t hurt. In particular, we found that quick responses to queries correlate with higher productivity. When executives respond quickly,

Harnessing the Digital Lens Page 5
so do their contacts. They not only make decisions sooner, they have fewer overlapping decisions to make. Why? As cycle time shrinks, fewer intervening tasks have a chance to pile up. Faster response times not only improved business performance significantly, but they also reduced perceptions of information overload. Time delays, rather than mail volume, are the most revealing indicator of managers self-reported levels of information overload. Managers who waited for responses to large numbers of open queries were the most likely to feel overwhelmed. Colleagues who quickly received responses had no such perception - even if their total information flow rate was higher. Computer scientists recognize this as a classic “stack overflow” condition. Information processors, whether human or machine, can only keep a finite number of items active at any one time. Ironically, information overload was not due to too much total information flow, but rather perceived delays in getting necessary information promptly. Analysis also revealed that a simple tactic can dramatically speed up work and increase performance. Email users who send short focused messages receive demonstrably faster responses than users who send long rambling messages. When we first presented these results to an executive audience we showed two actual emails – one focused and one rambling – then asked “what would you do if you received the rambling message?” You might expect executives to say “I'll get back to it when I have time” but more than one executive shouted “I’d delete it!” Reciprocity is another cultural, organizational and economic factor. People develop norms about how much delay is acceptable. An information worker’s responsiveness measurably influences peer, counterpart and subordinate responsiveness. However, responsiveness comes at a cost. Information workers who primarily respond to others’ requests will likely fail at their own work. Problem solving requires focused attention. A separate study (Wainright 2005) found that failure to manage interruptions – answering email when it arrives, taking every phone call, allowing always-on instant messaging – reduced problem solving ability by the equivalent of one night’s loss of sleep. One trick for addressing this conflict is batching. Some of the most effective information workers in our study set aside dedicated times for responding to queries. This increased their relative responsiveness while preserving their time for concentrated thinking. 3. Don’t simply speed up work. Transform it. One widely held notion is that IT accelerates productivity in the same way that automation speeds up assembly lines. There is some truth to this idea. Email moves faster than paper mail, and respondents typically process digital communication more quickly. However, in our study of executive recruiters, we found that IT did not merely speed up existing work. To our surprise, on average, the executives who used IT extensively actually took slightly longer to complete each project. Yet they somehow managed to complete more projects. How do we resolve this seeming paradox? The biggest performance benefits came from an expanded ability to multitask (Aral, Brynjolfsson & Van Alstyne 2006). That is, allowing more people to manage multiple projects more easily and effectively. We found information workers who use IT more also multitask more. This allows them to complete more projects and generate more revenue per unit time. For example, executive recruiters who multitask one more project generate $30,000 more revenue over the course of a year even though existing projects might take slightly longer to complete.

Harnessing the Digital Lens Page 6
Figure 4 - Serial work (A) takes less time per task but parallel work (B) completes more tasks over a given time interval. Multitasking increases productivity when completion rate rises relatively more than task duration.
The effect was most striking when looking at different modes of communication. Email was correlated with an increase in multitasking, while face-to-face meetings and phone calls were not. Email was effective because it coordinates work more easily without requiring people to synchronize schedules. Face-to-face meetings and telephone calls require two or more parties to participate at exactly the same time. Synchronicity imposes coordination costs that asynchronicity does not. Data in our study show coordination costs decreased effective information processing capacity. We thus found significantly greater multitasking, and overall performance, among workers who used more asynchronous communication. There are limits to multitasking however. We found that too much multitasking eventually leads to diminishing returns and reduced output creating and inverted “U” shaped relationship between multitasking and productivity. Since work is bursty and because lessons learned from one project can be applied to other projects, multitasking increases output, to a point. As maximum capacity is approached, however, each new project displaces other projects and increases coordination costs and confusion. Fortunately, in our sample, only a minority of consultants worked on more than the optimal number of 6 projects per person. Like cars on an overcrowded highway, it appears throughput for those juggling 7 or 8 projects would have increased had they taken on fewer projects. While the precise optimum will differ for different jobs, the basic point remains. 4. Use IT to swap low value for high value information processing In August of 2010, Google CEO Eric Schmidt claimed that "there were 5 exabytes of information created between the dawn of civilization through 2003 but that much information is now created every 2 days, and the pace is increasing." (Tynan, 2010) This data deluge affects everyone but surprisingly managers who reported the greatest levels of information overload in our research were not the ones managing the greatest amount of information. Indeed, executives who were comfortable with information technology and effective at delegating routine tasks to assistants

Harnessing the Digital Lens Page 7
and subordinates were handling significantly greater information flows without experiencing overload.1 Acting on distinctions between high-value and low-value work was a common strategy among the high performers. Our study of one executive recruiting firm revealed that the most productive workers were more likely to off-load portions of their information processing work to their support staff or IT-based systems. For instance people who knew how to use the executive support system (ESS) - how to access and modify key records – not only generated more revenue, but also performed better on other metrics. A one standard deviation increase in comfort using the ESS was associated with 12% faster project completion and 3% more multitasking. Rising productivity is both a function of gaining access to information asynchronously and also having the skill to get it when you need it. The top performers did not rely on just one tool. They generally knew of specialized resources – databases or people – that added more value than sources used by others. Novices, in contrast, tended to go straight to the web, a relatively undifferentiated information resource available to anyone including potential competitors. We found that similar strategies are important at other organizations. The workman’s compensation division at one major insurance company we studied introduced a new document capture and storage system (Bhansali & Brynjolfsson 2007). When they converted reams of physical paper to digital documents they saw two kinds of benefit. The first and most visible benefit was a savings in time and money: data entry time fell by almost two hours per day per worker, costs of third party document sorters and paper warehousing disappeared entirely. The ability to move documents faster between claims adjusting, legal, and nursing also increased, saving additional time. The second and greater benefit, however, was to shift employees from data entry to value adding analysis. With more free time, employees could estimate more accurately and pay claims faster reducing the size and number of cash payments. Quicker payments reduced incidental "add-ons" while increasing customer satisfaction. Nurses gained time to compare records across entire patient histories. In a few months, one nurse found a patient claiming total disability, worth several hundred thousand dollars, whose chiropractic details included treatment for elk hunting in the Rocky Mountains. Another found a patient double billing expensive pain medication, which allowed her to sell the duplicate prescription on the black market. This nurse’s digital analysis not only reduced fraud, it also took prescription drugs off the street. Transforming the Organization: Lessons for Management Top management can do a great deal to improve information worker productivity. Since the information management habits of individual workers affect their performance, it makes sense for management to identify, document and share best practices. However, successful managers also need to change their management styles if they want to get the most from the Digital Lens. 1. Decentralize information and decision-making 1 The consultants (executive recruiters) we studied relied heavily on email for their work. Our average participant processed over 1300 messages over the course of observation while typically juggling 6.5 projects at any given time.

Harnessing the Digital Lens Page 8
As the amount of digital data continues to grow exponentially, executives should avoid overloading themselves with information and becoming bottlenecks. One important strategy is to distribute information processing. Decentralizing decision rights, flattening organizations, and empowering employees have become increasingly popular principles with good reason. The information-processing bottleneck is narrowest at the tops of firms. In the 20th century, when information was scarce and expensive, it often made sense to centralize decision-making where enough data could be assembled. Today, that same strategy is increasingly dysfunctional. When decision-making is distributed, incentives must change to assure that local decisions reflect the organization’s goals. Culture must thus change as well. Given the growing importance of lateral communication, the improved ability to track information flows couldn’t come at a better time. 2. Use incentives, culture and IT as complements If you just build it, they won’t come. When the Lotus Notes groupware product was introduced into a large services organization without complementary incentives and culture to promote group work, it was either abandoned, or worse, used to promote individual agendas (Orlikowski 1992). In a study of 189 firms over 11 years, we found similar evidence that incentives and organizational practices complement a data driven approach to identifying and rewarding those who excel (Aral et al 2010). When incentives are combined with technologies to record digital traces and policies to analyze them, it creates a “system of three-way complements” that generates measurable productivity premiums - premiums that are unattainable by implementing any one or two of the three practices in isolation. Unlike individual habits, cultural change requires top management support. When management combines incentives with policies to promote information sharing and technologies that enable them, they see results. We found that some organizations were simply much better at sharing relevant information. In turn, the propensity to share useful information was strongly correlated with output. Part of the solution is to choose incentives that promote collaboration versus those that promote competition. For instance, firms that emphasized group incentives relatively more than individual incentives witnessed far more sharing (Van Alstyne 2005). Their information workers were colleagues, not competitors. In contrast, when managers evaluated staff strictly on individual performance, knowledge sharing was implicitly discouraged. Sharing know-how hurts one's relative performance ratings and creates dysfunctional incentives to hoard information. When managers evaluate staff based on team performance, workers share information more generously. Information sharing among the different executive recruiting firms we studied followed this pattern precisely. The firm with the narrowest and most individual incentives shared the least as shown in Figure 5. The firm with the broadest incentives – those where consultants received bonuses when the whole company did well – shared the most.
Harnessing the Digital Lens Page 9
Figure 5 - Incentive theory works. Broader incentives, where consultants' bonuses depended on whole company performance, correlated with broader information sharing.
The effect was so strong that when the middling firm above, Firm Z, split in two as part of a leveraged buyout, two distinct incentive cultures were revealed. One division – with group–oriented rewards, shared more than the groups in Firm Y. The other division – which rewarded individual performance – shared less than the groups in Firm X. This culture clash, which was evident in the information traces that documented sharing, foreshadowed the firm's break-up. You can see this effect in the communications of that same firm in Figure 2. Offices in the left half of Figure 2 used broad incentives and shared more information, while offices in right half used narrow incentives and shared less. The real tradeoff is a choice between absolute versus relative rewards. Sales teams, for example, are often rewarded using relative rewards. If one person wins then another person loses so individuals keep their best ideas to themselves. Instead, managers can encourage information sharing by using absolute rewards. For example, anyone who passes the $1,000,000 mark gets a prize. Sharing the rewards also helps. We recently suggested a shared reward to Google's Personnel Innovation Lab (PiLab) which thinks about innovative human resource management practices. We recommended creating an individual reward, which required the recipient to distribute 20% or more of the bonus to those that helped her succeed. Such group rewards go further, putting the distribution of incentives in the hands of workers rather than managers. When colleagues can give you rewards for helping them succeed, everyone has incentives to collaborate. Each incentive has a conflicting advantage. Absolute incentives encourage sharing but employees can coast on others' work. Relative incentives discourage sharing but employees work hard individually. The trick is to use relative rewards when problems require greater speed, diversity of approach, and solutions are independent substitutes; and to use absolute rewards when problems require complex coordination and solutions are interdependent complements. 3. From Digital Lens to Digital Mirror: Provide constructive, non-invasive feedback Ultimately, successful strategies for information rich environments can’t only be top down. The ability to measure performance and information flows in a fine-grained way provides powerful new opportunities for command and control management. It is tempting to shift in this direction.
Harnessing the Digital Lens Page 10
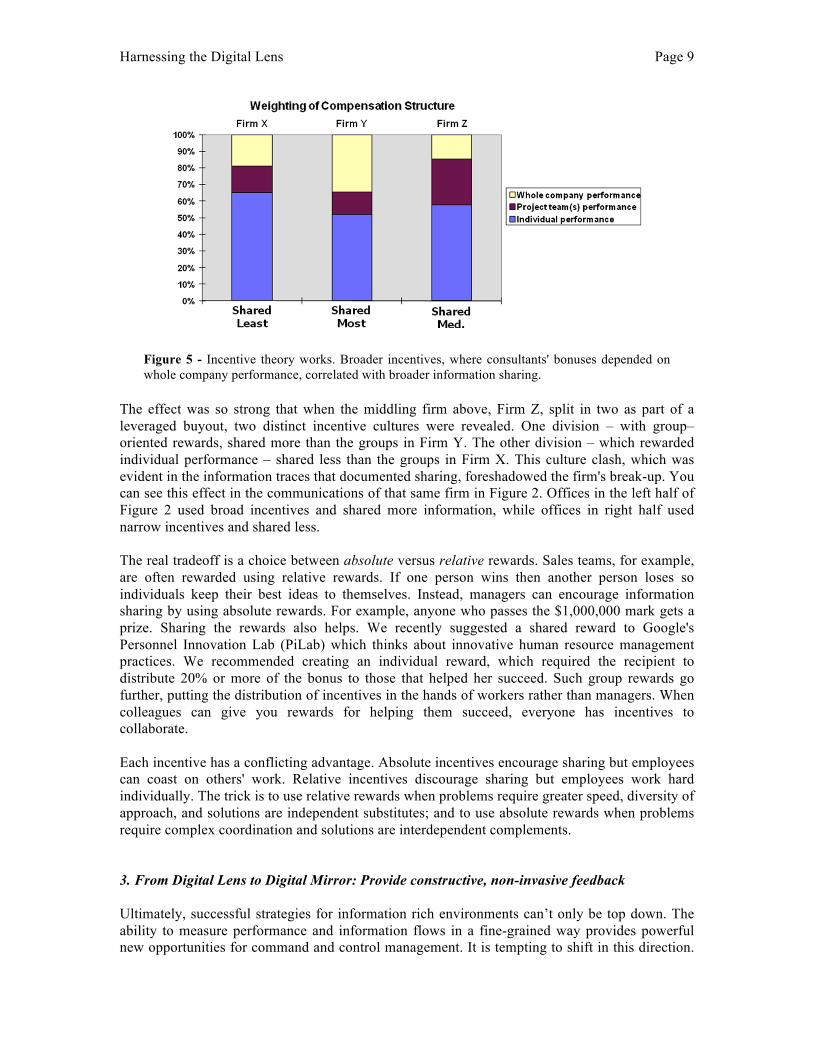
However, in volatile, information rich environments, the more robust strategy is to decentralize the data flow to inform local decisions. Internal organization of company data should learn from the successes of Web 2.0 communities which provide information globally to solve problems locally. The Digital Lens makes it possible for every company to conduct similar analyses of their internal information work and to provide continuous feedback to information workers themselves. For example, consider the “email fingerprints” generated from data at one firm we studied. Different consultants had strikingly different patterns of email use, both in terms of messages sent and received, and in terms of content. These patterns were correlated with different levels of productivity. The consultant labeled C23 (2nd from the left in the top chart) was a “rainmaker” in the firm, generating a disproportionate share of new business by communicating externally more than internally. In contrast, C71 (4th from the right) was an "old timer" who was unaware of the advantages of using newer technologies. Rather than simply using performance data to reward successful workers, sharing the patterns with everyone can help them learn from each other.
Figure 6 – Rainmakers (C23) and non-adopters (C71) have very different patterns of email activity. Sharing information about the patterns of more successful workers can help everyone learn techniques that may improve their performance.

Harnessing the Digital Lens Page 11
Figure 7 – Incoming word level diversity for five people shows very different patterns. Recruiter 2 receives more news of Topic A while Recruiter 3 receives more news of Topic H. Few people receive much news of Topic F.
Thus, firms can use the new fine-grained data to offer “digital mirrors” to employees to show each of them how their benchmarks compare with those of co-workers. This harnesses internal motivations to perform better without top down intervention. The obvious response of workers who discover they’re in the bottom performance quartile is to learn and adopt more effective practices. The data can also show what those practices are. When the lower quartile improves, the average improves, putting constructive pressure on those at the top to keep innovating. However, fine-grained data gathering that reaches down to the word level raises privacy concerns. Managers can address this by giving information first to the people who provide it. Make individuals themselves, not their bosses, the principal beneficiaries of their own data, benchmarked anonymously against peers. The distinction is not to dictatorially impose rigid work rules – white collar workers often resist monitoring. Instead, help employees by giving them the tools and information they need to figure things out for themselves. In our study, to respect privacy, participants voluntarily opted in and we developed new technology to statistically analyze worker behavior at the word level while preventing message reconstruction at the semantic level.2 Technology can be used to create checks and balances. The right controls and feedback helped us secure voluntary participation rates in excess of 85% despite the fact that we monitored communications content to the individual word. 4. Create a platform for continuous learning and experimentation The flood of detailed information is changing the way companies think about decision-making. When information is scarce, just finding a statistically significant relationship between an activity and an outcome was important. However, with millions or in some cases billions of data points, statistically significant correlations are ubiquitous. But, just because A is highly correlated with
2 See US Patent 7503070 and Reynolds, Van Alstyne & Aral (2009).

Harnessing the Digital Lens Page 12
B, does not mean that A causes B, or even that B causes A. Thus the new analytical challenge is establishing causality (e.g. Aral 2010). As scientists have long known, the gold standard for this is the use of randomized controlled trials, or experiments. The experimental method is making it possible for companies to switch from a reliance on HiPPOs (the Highest Paid Person’s Opinion), to a reliance on hard data, typically from carefully designed A-B tests. For example, our randomized trial of Viral Product Design strategies found that firms could increase the viral diffusion of a product by up to 400% by enabling several simple viral features (Aral & Walker 2010). By randomly enabling and disabling different viral features, we were able to measure which ones were the most effective and under what circumstances. These platforms for experimentation are increasingly common among online companies like Amazon and Google, each of which conducts hundreds of experiments on any given day (Brynjolfsson and Schrage, 2009). It is particularly easy to conduct experiments on the Internet, where different versions of a website or algorithm can be created and tested on thousands of visitors within a few hours. But offline companies like Harrah’s and Capital One have also had great success with this approach. As firms increasingly rely on a digital infrastructure of bits, rather than physical assets made of atoms, for their core business processes, it becomes easier to make and replicate modifications (Brynjolfsson and McAfee, 2008). This opens the door to using the digital infrastructure as a platform for continuous learning, experimentation and improvement. The biggest barrier to this approach is no longer technological, but organizational and cultural. Organizations succeed with experimentation when they replace lengthy analyses and meetings, with a bias toward generating hypotheses and rapidly testing them experimentally. The focus is less on having the “right” answer at the outset, and more on asking the right questions. In fact, at leading firms, up to 90% of experiments fail to identify a significant performance improvement. But this is by design: the platform makes it so cheap to test new ideas that even those with only a 10% chance of succeeding are worth trying. Ultimately, the pace of learning accelerates as the rate of experimentation rises. In turn, firms accelerate experimentation by combining 1) a digital platform that lowers the cost of experimentations with 2) a culture that doesn’t punish failed hypotheses, but rather embraces creativity. Conclusion: Putting the Digital Lens to Work We are living and working in the most information-rich environment in history. We will face an even larger information deluge in the coming decade. What hasn’t changed is the capacity of the human mind to make sense of all this information. Our organizations, processes and business culture evolved in a world where information was scarce by comparison. As a result, the reigning management techniques, based on long-standing traditions, assumptions and heuristics, grow increasingly ineffective and even dysfunctional. Intuitions founded in information poor environments are outmoded in information rich environments. One reason traditional intuitions yield inadequate performance is that when you can’t measure individual detail, you manage based on population averages. But, with more precise knowledge, you can tailor your tactics and strategies to groups of size one. This works because you don’t abandon general theory; instead you learn when there are exceptions to general theory and re-target more effective practices at zero marginal cost.

Harnessing the Digital Lens Page 13
In marketing, for example, sellers have used fine-grained UPC scanner and click stream data to understand individual consumer behavior. This revolutionized consumer targeting. Mass markets gave way to customization, and customization in turn gave way to individual interaction. Our research measuring information flows revealed eight general insights on how to improve the productivity of information work. However, the bigger lesson we take from this research is the power of better measurement to generate such insights in virtually any setting where information work is facilitated by technology. A century ago, Frederick Taylor, and Frank and Lillien Gilbreth, transformed industrial age factories using time and motion studies. Today, the measurement revolution made by possible the Digital Lens has opened the door to a similar yet more human and more social transformation of information work. Since the primary job of over 70% of today’s work force is managing information (Apte & Nath 2007), the direct measurement of these information flows presages a dramatic improvement in management of two of the most important assets in modern firms: the network of connections among people and the knowledge that flows through that network. As more information workers and managers put the Digital Lens to work, we can expect concomitant improvements in their performance and the performance of their organizations. What’s more, improvements in information worker productivity can also increase the rate of innovation in the economy as a whole, which leads to not only higher levels of productivity but more importantly, faster increases in the growth rate of productivity, and thus, our overall living standards. Sinan Aral is an Assistant Professor at the Stern School of New York University. Erik Brynjolfsson is the Schussel Professor at the MIT Sloan School. Marshall Van Alstyne is an Associate Professor at the Boston University School of Management. This research was generously funded by the MIT Center for Digital Business, Intel Corporation, Cisco Systems Inc., IBM, Microsoft Corporation, France Telecom, British Telecom, Yahoo Inc., Hewlett Packard., and by NSF Career Award 9876233 to Professor Van Alstyne and NSF Career Award 0953832 to Professor Aral. We think Michael Schrage for valuable comments and suggestions.

Harnessing the Digital Lens Page 14
References: Apte, U.M. and Nath, H.K. 2007. "Size, structure and growth of the US information economy",
Chapter 1 in Managing in the Information Economy, New York: NY; Springer pp 1-28. Aral, S. 2010. “Identifying Social Influence: A Comment on Opinion Leadership and Social
Contagion in New Product Diffusion.” Marketing Science. Forthcoming. Aral, S., Brynjolfsson, E. & Van Alstyne, M. 2006. “Information, Technology, and Information
Worker Productivity: Task Level Evidence” Proceedings of the 27th Annual International Conference on Information Systems, Milwaukee, WI.
Aral, S., Brynjolfsson, E. & Van Alstyne, M. 2007. "Productivity Effects of Information Diffusion in Networks" Proceedings of the 28th Annual International Conference on Information Systems, Montreal, CA.
Aral, S., Brynjolfsson, E., Wu, L. 2009. “Testing Three-Way Complementarities: Incentives, Monitoring and Information Technology” Proceedings of the 30th Annual International Conference on Information Systems, Phoenix, AZ.
Aral, S., Muchnik, L., & Sundararajan, A. 2009. “Distinguishing Influence Based Contagion from Homophily Driven Diffusion in Dynamic Networks,” Proceedings of the National Academy of Sciences, Dec. 22, vol. 106, no.51.
Aral, S. and Van Alstyne, M. W. 2009. “Networks, Information & Brokerage: The Diversity-Bandwidth Tradeoff.” Available at SSRN: http://ssrn.com/abstract=958158
Aral, S., & Walker, D. 2010. “Creating Social Contagion through Viral Product Design: A Randomized Trial of Peer Influence in Networks” Proceedings of the 31th Annual International Conference on Information Systems, St. Louis, MO.
Bhansali, S. and Brynjolfsson, E. 2007. “Digitizing Work: Measuring Changes In Information Worker Time Use and Performance With a Quasi-Experiment” Working Paper, MIT Center for Digital Business.
Brynjolfsson, E. and Schrage, M. 2009. "The New, Faster Face of Innovation: Thanks to Technology, Change Has Never Been So Easy-or So Cheap" Wall Street Journal and Sloan Management Review; August.
Bulkley, N. & Van Alstyne, M. (2004) “Why Information Influence Should Productivity” The Network Society: A Global Perspective; Manuel Castells (ed.). Edward Elgar Publishers. pp: 145-173.
Granovetter, M. 1973. “The strength of weak ties.” American Journal of Sociology (78):1360-80. Lazer, D., Pentland, A., Adamic, L., Aral, S., Barabasi, A.L., Brewer, D., Christakis, N.,
Contractor, N., Fowler, J., Gutmann, M., Jebara, A., King, G., Macy, M., Roy, D., Van Alstyne, M. 2009. "Computational Social Science," Science, February 6: 721-722.
Marschak, J., and R. Radner. 1972. Economic Theory of Teams. Yale University Press, New Haven, CT.
McAfee, A. and Brynjolfsson, E. 2008. "Investing in the IT That Makes a Competitive Difference" Harvard Business Review, July-August.
Orlikowski, W. 1992 "Learning from notes: organizational issues in groupware implementation." Proc. of the ACM Conference on Computer Supported Cooperative Work; pp 362-369.
Reynolds, M., Van Alstyne, M. Aral, S. 2009. “Privacy Preservation of Measurement Functions on Hashed Text” Annual Security Conference. Dhillon, G. “Discourses in Security Assurance & Privacy," Las Vegas, NV. April 15-16, 2009: Information Institute Publishing. p 41-45
Simon, H. 1991. “Bounded Rationality and Organizational Learning.” Organization Science. (2:1): 125-134.
Tynan, D. "Prepare for the Data Tsunami" PC World; August 6, 2010

Harnessing the Digital Lens Page 15
Van Alstyne, M. and Brynjolfsson, E “Global Village or CyberBalkans? Measuring and Modeling the Integration of Electronic Communities.” Management Science; 51 (6) (June 2005): pp. 851-868.
Van Alstyne, M. 2005. “Create Colleagues Not Competitors.” Harvard Business Review September, pp 24-28.
Wainright, Martin 2005. “Emails pose threat to IQ” The Guardian, April 22. Wu, L., Waber, B., Aral, S., Brynjolfsson, E., & Pentland, S. 2008. "Mining Face to Face
Interaction Networks Using Sociometric Badges: Evidence Predicting Productivity in IT Configuration" Proceedings of the 29th Annual International Conference on Information Systems, Paris, France.

Harnessing the Digital Lens Page 16
SIDEBAR: How We Conducted this Research
Results reported here span a decade of study across multiple organizations and types of projects. These can broadly be summarized into four separate lines of inquiry. 1) Our first project spans five years of research on consultants in executive placement. We gathered data on more than 1300 projects, 10 months of email data including word level content, perceptions of information sharing and sources of value, and numerous quality controls. We not only kept identities of participants anonymous, we also encrypted the contents of their messages to preserve their privacy using new techniques we developed. We then built econometric models of project flows, task load, individual and team level characteristics, and output. 2) We used ‘sociometric badges’ to track detailed data on face-to-face interactions, proximity, vocal tonality, and the back-and-forth of conversation (who speaks more often, who interrupts whom) to understand how face-to-face social networks affect performance. We collected data on face-to-face interactions among a group of workers building IT systems to corporate specifications and simultaneously recorded their productivity in terms of speed to project completion and error rates. Productive face-to-face networks can exhibit different structural properties than those shown to be effective in email networks (Wu et al 2008). 3) We tracked the introduction of new document and project management technology at a major insurance corporation. New technology and work practices were rollout out at eight regional offices on a staggered schedule. This quasi-experiment allowed us to observe changes in information work before and after the changes. We found large shifts from routine work, like data entry, to more analytical work, like developing case management strategy. 4) We built a platform for randomized experimentation in online social networks and used it to run randomized trials of peer-to-peer social influence in new product diffusion. We tested Viral Product Design strategies by enabling and disabling different viral features of new products and randomized passive broadcast messages to robustly identify 'influential' members of the network.