Harnessing FDI for Economic Growth - RUG
51
Harnessing FDI for Economic Growth Beata Javorcik University of Oxford
Transcript of Harnessing FDI for Economic Growth - RUG

Harnessing FDI for Economic Growth
Beata JavorcikUniversity of Oxford

Is FDI special and thus worthy of a preferential treatment?
“One dollar of FDI is worth no more (and no less) than a dollar of any kind of investment” (D. Rodrik 2003)
Yet, 59 out of 108 countries surveyed in the World Bank’s census of investment promotion agencies offered FDI incentives in 2004

Multinational corporations (MNCs) are creators of knowledge

MNCs are responsible for most of the world’s R&D
700 MNCs accounted for 46% of the world’s total R&D expenditure and 69% of the world’s business R&D in 2002 (UNCTAD 2005)
R&D budgets of large MNCs may exceed R&D spending of some countries
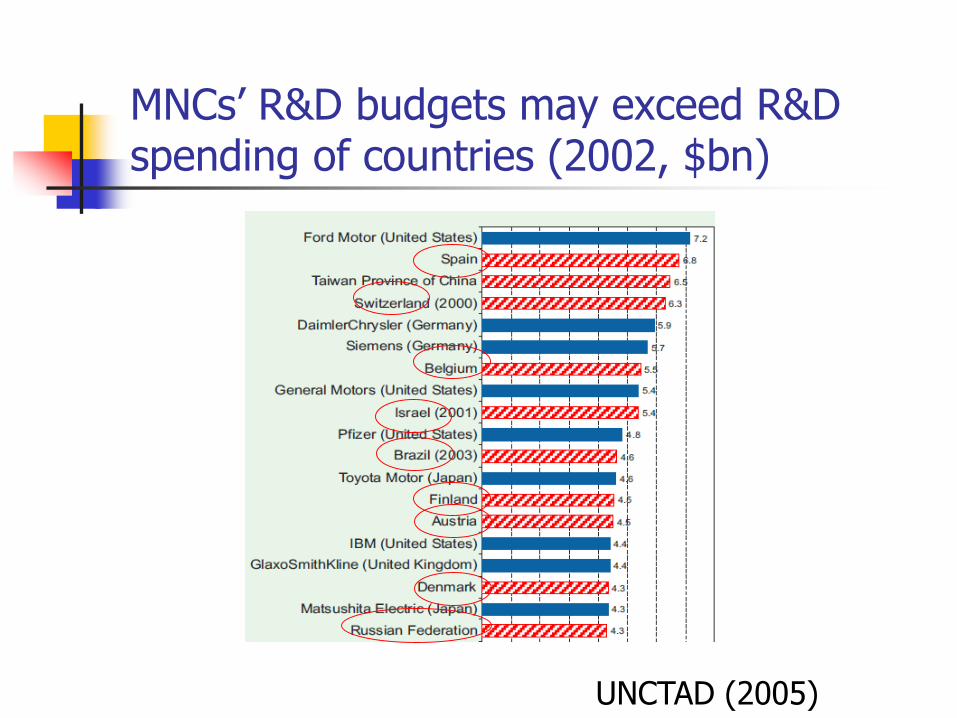
MNCs’ R&D budgets may exceed R&D spending of countries (2002, $bn)
UNCTAD (2005)

MNCs are a driver of innovation in host countries
UNCTAD (2005)

3.58
3.25
3.13Domestic
Non-US multinational subsidiary
US multinational subsidiary
Average management score by firm type in the UK, France and Germany
MNCs are better managed(Bloom and Van Reenen QJE 2007)

MNCs transfer knowledge to host countries

Evidence from Indonesia(Arnold and Javorcik JIE 2009)
Plant-level information on 400 new FDI recipients (1983-2001)
Combine propensity score matching with a difference-in-differences approach
Control group: plants with similar observable characteristics before a foreign acquisition, operating in the same industry/year
1/n 1 to n[(ProductivityFDI recipient, post-FDI - ProductivityFDI recipient, pre-FDI)
- (Productivitycontrol, post-FDI - Productivitycontrol, pre-FDI)]

Foreign acquisitions boost productivity
Total factor productivity (in logs)
Pre-acquisition
Year
Acquisition
year
One year
later
Two years
later
FDI recipients 0.864 1.079 1.142 1.215
Control group 0.867 0.976 1.022 1.083
Difference 0.106*** 0.122*** 0.135***
(0.034) (0.045) (0.051)

Foreign acquisitions induce rapid changes
(d) Employment
5.40
5.60
5.80
6.00
t-1 t0 t+1 t+2
(e) Average wage
7.60
7.80
8.00
8.20
8.40
8.60
8.80
9.00
t-1 t0 t+1 t+2
(c) Output
10.00
10.20
10.40
10.60
10.80
11.00
11.20
11.40
t-1 t0 t+1 t+2

Foreign acquisitions lead to higher investment
(f) Investment
2.00
2.50
3.00
3.50
4.00
4.50
5.00
t-1 t0 t+1 t+2
(g) Investment in machinery
2.00
2.50
3.00
3.50
4.00
4.50
t-1 t0 t+1 t+2

Foreign acquisitions facilitate integration into global markets
(h) Export share
15
20
25
30
35
t-1 t0 t+1 t+2
(i) Import input share
15
20
25
30
35
40
45
t-1 t0 t+1 t+2

Is it a one-time or a continuous knowledge transfer?

Divestment => Lower productivity(Javorcik & Poelhekke JEEA 2017)
Divestment year One year later Two years later
ln(TFP)
Divestment -0.038*** -0.043*** -0.038***
(0.007) (0.007) (0.008)
Observations 314 314 314
R-squared 0.090 0.095 0.065

Divestment => Lower output(Javorcik & Poelhekke JEEA 2017)s
Divestment year One year later Two years later
ln(Output)
Divestment -0.345*** -0.421*** -0.537***
(0.101) (0.126) (0.131)
Observations 328 328 328
R-squared 0.033 0.032 0.047

Divestment => Loss of export markets(Javorcik & Poelhekke JEEA 2017)
Divestment year One year later Two years later
Δ Share of output exported
ATT -0.055 -0.119*** -0.121**
(0.040) (0.046) (0.049)
Observations 344 344 344
R-squared 0.005 0.019 0.018
Δ log(Domestic sales +1)
ATT -0.304 0.416 0.749
(0.714) (0.772) (0.856)
Observations 344 344 344
R-squared 0.001 0.001 0.002
Δ Share of imported inputs
ATT -0.068** -0.061* -0.069**
(0.029) (0.033) (0.034)
Observations 338 338 338
R-squared 0.017 0.010 0.013

It is not just about export markets
Non-exporters at t-1 Exporters at t-1
t t+1 t+2 t t+1 t+2
∆slog(TFP) -0.034*** -0.050*** -0.040*** -0.044*** -0.040*** -0.031***
∆slog(Output)
-0.342** -0.333 -0.596*** -0.393*** -0.392** -0.333*

Entry of MNCs can change the
industry landscape

FDI affects domestic firms through multiple channels (Czech Rep.)
0
10
20
30
40
50
60
Incre
ased
com
petition
Loss o
f m
ark
et
share
Loss o
f
em
plo
yees
Wors
ened
access to c
redit
Info
rmation
about new
technolo
gie
s
Info
rmation
about m
ark
eting
techniq
ues
Hired form
er
MN
C e
mplo
yees
% o
f re
sp
on
den
ts

Relative magnitudes of the effects differ by country
29
24
15
0
10
20
30
40
50
60
Incre
ased
com
petit
ion
Loss o
f m
ark
et
share
Loss o
f
em
plo
yees
Wors
ened a
ccess
to c
redit
Info
rmatio
n a
bout
new
technolo
gie
s
Info
rmatio
n a
bout
mark
etin
g
techniq
ues
Hired form
er
MN
C
em
plo
yees
% o
f re
sp
on
de
nts
Czech Rep.
Latvia
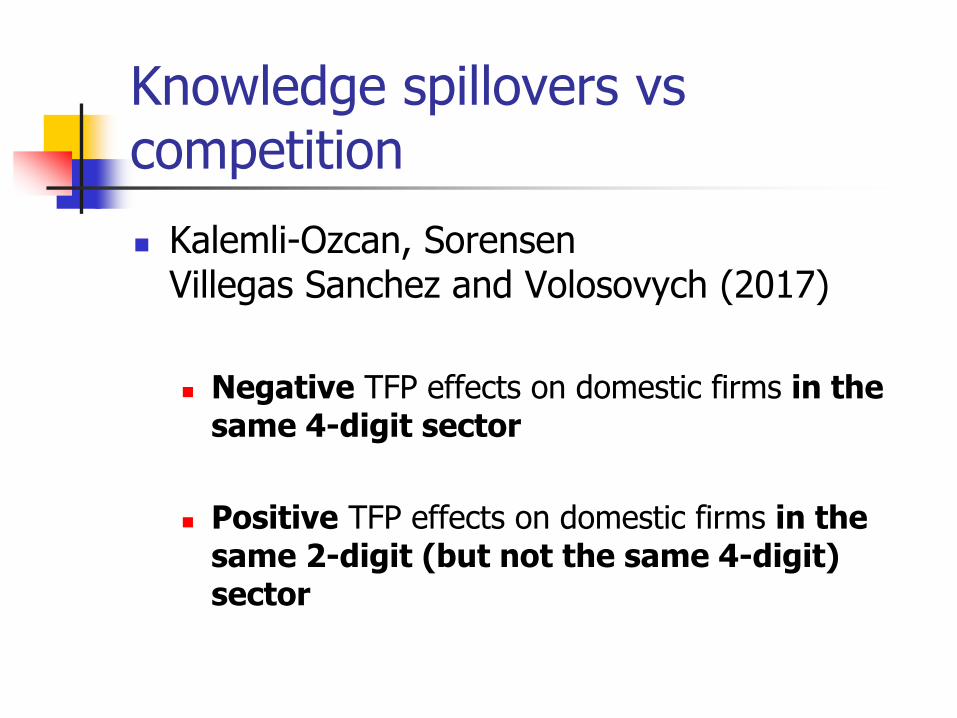
Knowledge spillovers vs competition
Kalemli-Ozcan, SorensenVillegas Sanchez and Volosovych (2017)
Negative TFP effects on domestic firms in the same 4-digit sector
Positive TFP effects on domestic firms in the same 2-digit (but not the same 4-digit) sector

Supplying industries can benefit from entry of MNCs
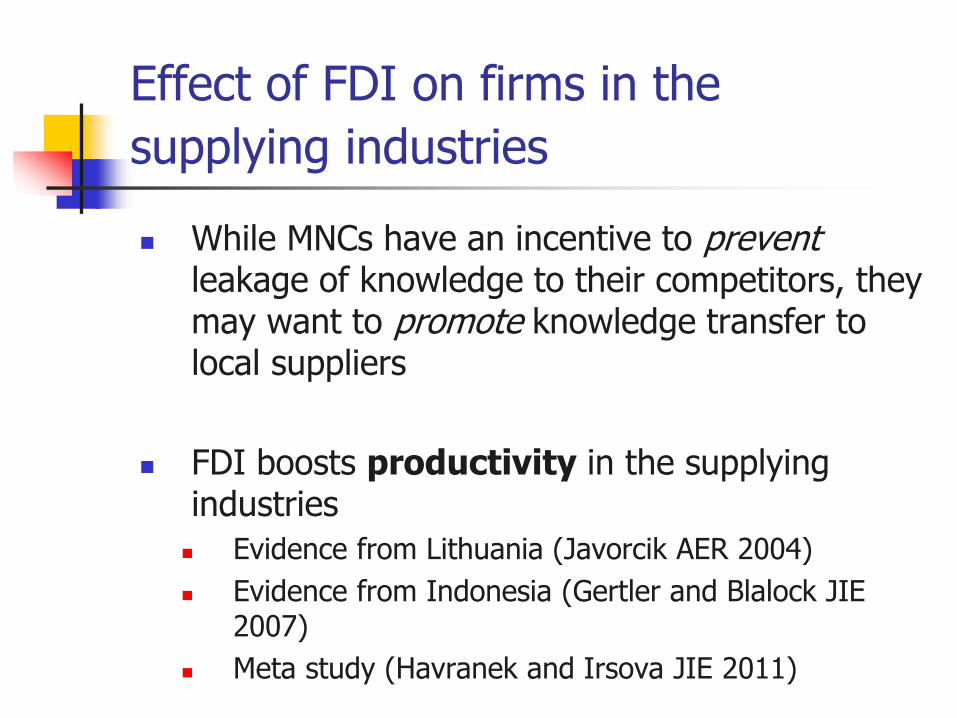
Effect of FDI on firms in the
supplying industries
While MNCs have an incentive to prevent leakage of knowledge to their competitors, they may want to promote knowledge transfer to local suppliers
FDI boosts productivity in the supplying industries
Evidence from Lithuania (Javorcik AER 2004)
Evidence from Indonesia (Gertler and Blalock JIE 2007)
Meta study (Havranek and Irsova JIE 2011)

FDI boost product complexity in the supplying industries(Javorcik, Lo Turco and Maggioni EJ 2017)
Complexity is captured using a measure developed by Hausmann and Hidalgo (PNAS 2009)
Turkish firms in sectors and regions more likely to supply foreign affiliates are also more likely to introduce more complex products

What about global retail chains? (Javorcik and Li JIE 2013)

1
Distribution of Foreign Retail Chains in Romania, 1997

Distribution of Foreign Retail Chains in Romania, 2005

Data source: A World Bank Enterprise Survey in Romania (2008), and authors’ calculation
What were the effects of the entry of foreign retail chains on the market in your city?

Magnitude of the effects
On average, food suppliers’ productivity increases by 3.8-4.7 percent after foreign chains enter a region
On average, food suppliers’ productivity increases by 3.3-3.7 percent as the number of foreign chain outlets doubles in a region

Manufacturing firms can benefit from FDI inflows into services

Perceived effects of opening Telecommunications sector to FDI
Prices Quality
Range of
Services
offered
Availability

Perceived effects of privatization and foreign entry into Banking
Prices Quality
Range of
Services
offered
Availability

Arnold, Javorcik & Matoo (2011)
Baseline specification, Firm fixed effects, OLS TFP
Dependent Variable: ln(TFP) I II III IV V
Services input EBRD 1.158***
linkages (0.397)
FDI 6.220*** 5.661**
(1.934) (2.316)
Concentration -0.342 2.919
(2.822) (2.732)
Privatization 10.087** 5.398
(4.856) (5.819)
. . . . . . . . . . . . . . .
No. of obs. 7155 7155 7155 7155 7155
R2 0.095 0.095 0.093 0.094 0.095

Magnitude of the effect
A one-standard-deviation increase in FDI in services => a 5.9% increase in the average productivity of Czech firms in downstream sectors
Services liberalizing from the level of Romania to the level of the Czech Republic => a 4.8% increase in the average productivity of Czech firms relying on services inputs

FDI facilitates upgrading of the export structure

Channels through which FDI may affect export quality
Intensive margin: exporting larger quantities of high quality products than domestic firms
Extensive margin:
producing higher quality versions of already exported products
introducing new, higher value, products
Knowledge spillovers: inducing local producers (in the same sector or the supplying sectors) to upgrade the quality of exports

Cross-country evidence (Harding and Javorcik REStat 2012)
Trade data
4-digit SITC level
1984-2000
Number of products in sample: 726
82 developing and 23 high income countries
Unit values=Export value/Quantity of exports
Strategy
Use information on sectors targeted by national investment
promotion agencies collected in a World Bank survey
Data on sectors each country targeted and when the policy was in place
Sector targeting is considered best practice in investment promotion

Findings
FDI inflows into developing countries increase unit values of exports by 11%
The effect stronger for final goods than for intermediates
Less robust results for high income countries

Supported by micro-level evidence(Bajgar and Javorcik 2017)
MNC presence
higher unit values and quality of goods exported by Romanian firms in the upstream and downstream industries
quality measured as in Khandelwal, Schott and Wei (AER 2013)

Using Investment Promotion to maximize the benefits of FDI

What is investment promotion?
Image building
Investment generation
Investor servicing
Policy advocacy
Incentives

It takes more than a sound investment climate to attract FDI
“Any country that believes it is not in competition with other countries for footloose global capital will find itself left behind.” (Jeffrey D. Sachs)
0
20
40
60
80
100
120
1980 1982 1984 1986 1988 1990 1992 1994 1996 1998 2000 2002 2004
no
. o
f IP
As
IPAs in developing countries
IPAs in developed countries

Data on investment promotion
2005 Census of Investment Promotion Agencies (IPAs)
110 respondents from all over the world, including 81 from developing countries
Additional 31 countries without IPA
Low income,
21%
Low er middle
income, 31%Upper middle
income, 20%
High income,
27%
EAP, 11%
ECA, 18%
LAC, 16%MENA, 8%
Developed,
27%
S.Asia, 3%
SSA, 16%

Harding and Javorcik (EJ 2011)
Sector_targetedcit = 1 if country c targets sector i at time t, 0 otherwise
Country-sector fixed effects ci
Country-year fixed effects ct
Sector-year fixed effects it
Data: US FDI, 1990-2004, 132 countries, 15 sectors
Note: there is no evidence of successful sectors being chosen for targeting
cititctcicitcit getedSector_tarFDIflow ln

Targeted sectors get more FDI
All All All All Developing Developing Developing Developing
Sector targeting 0.308 0.935***
[0.341] [0.330]
L. Sector targeting 0.770** 1.159***
[0.362] [0.346]
L2. Sector targeting 1.033** 1.377***
[0.406] [0.387]
L3. Sector targeting 0.968** 1.360***
[0.457] [0.430]
Observations 17196 17193 16610 16009 13012 13012 12522 12017
Number of country-sector
groups 1570 1570 1570 1568 1203 1203 1203 1201
R-squared (within) 0.17 0.18 0.18 0.18 0.19 0.19 0.19 0.19

Removing cases where targeting was determined by previous success or failure in attracting FDI to the sector
All All All All Developing Developing Developing Developing
Sector targeting 0.866* 1.511***
[0.488] [0.472]
L. Sector targeting 1.373*** 1.821***
[0.514] [0.489]
L2. Sector targeting 1.166** 1.654***
[0.564] [0.534]
L3. Sector targeting 0.839 0.824
[0.640] [0.595]
Observations 15285 15282 14750 14204 11699 11699 11246 10782
Number of group(code sectid) 1389 1389 1389 1387 1075 1075 1075 1073
Within R-squared 0.19 0.20 0.20 0.20 0.21 0.21 0.21 0.21

Magnitude of the effect
In developing countries, targeting increases FDI inflows by 155%
Is it a lot? in the sample of developing countries that received US FDI,
the median sector-level inflow was $11mn 155% increase => additional $17 mn dollars of FDI
This is not a large amount if we consider that Over the years 1999-2001, the government of Indonesia
approved $26.2 billion in new foreign investment General Electric: initial five-year investment of $50 million to
open a GE Technology and Learning Center in Qatar Boeing invested $55 million in the Czech Republic in 1998

Incentives do not seem to work
Post targeting 0.868* 0.975** 0.954** 0.933** 1.163**
[0.445] [0.419] [0.383] [0.383] [0.564]
Post targeting*Special incentives 0.336
[0.753]
Post targeting*Special incentives*General
incentives -0.042
[0.782]
Post targeting*Special incentives at time t 0.215
[0.888]
Post targeting*Special incentives at time
t*General incentives 0.251
[0.887]
Post targeting*General incentives -0.302
[0.641]
Observations 8623 8545 8623 8545 12559
No. of country-sector groups 792 786 792 786 1167
Within R-squared 0.20 0.20 0.20 0.20 0.19
Post targeting is equal to one if industry i was targeted by country c at time t, and zero otherwise.
Special incentives is a dummy taking on the value of 1 if the agency indicated that the investors
in targeted sectors had been eligible for more incentives than those entering non-targeted sectors,
and zero otherwise. In columns (3) and (4) we take into account the timing of special incentives.
General incentives is a dummy taking on the value of 1 if the host country was offering financial
incentives, fiscal incentives or subsidized infrastructure to foreign investors in general, and zero
otherwise. All models include country-year, sector-year and country-sector fixed effects.

Conclusions
MNCs are creators of knowledge
FDI is a channel of knowledge transfer to host countries
There is evidence of knowledge spillovers, particularly to the supplying sectors
Investment promotion can be used to maximize the benefits of FDI

Thank you