
Harmful algae and their potential impacts on ... -...
183
Alma Mater Studiorum – Università di Bologna Facoltà di Scienze Matematiche, Fisiche e Naturali DOTTORATO DI RICERCA IN Scienze Ambientali XXIII Ciclo Botanica Generale BIO/01 H H a a r r m m f f u u l l a a l l g g a a e e a a n n d d t t h h e e i i r r p p o o t t e e n n t t i i a a l l i i m m p p a a c c t t s s o o n n t t h h e e c c o o a a s s t t a a l l e e c c o o s s y y s s t t e e m m : : g g r r o o w w t t h h a a n n d d t t o o x x i i n n p p r r o o d d u u c c t t i i o o n n d d y y n n a a m m i i c c s s Presentata da: Laura Pezzolesi Coordinatore Dottorato Relatore Prof. Enrico Dinelli Prof. Rossella Pistocchi Correlatori Prof. Emilio Tagliavini Dr. Frances Van Dolah Esame finale anno 2011
Transcript of Harmful algae and their potential impacts on ... -...

AAllmmaa MMaatteerr SSttuuddiioorruumm –– UUnniivveerrssii ttàà ddii BBoollooggnnaa FFaaccooll ttàà ddii SScciieennzzee MMaatteemmaattiicchhee,, FFiissiicchhee ee NNaattuurraall ii
DDOOTTTTOORRAATTOO DDII RRIICCEERRCCAA IINN
SScciieennzzee AAmmbbiieennttaall ii XXXXIIII II CCiicclloo
BBoottaanniiccaa GGeenneerraallee BBIIOO//0011
HHaarrmmffuull aallggaaee aanndd tthheeii rr ppootteennttiiaall iimmppaaccttss oonn tthhee ccooaassttaall eeccoossyysstteemm:: ggrroowwtthh aanndd ttooxxiinn
pprroodduuccttiioonn ddyynnaammiiccss
Presentata da:
Laura Pezzolesi Coordinatore Dottorato Relatore Prof. Enrico Dinelli Prof. Rossella Pistocchi Correlatori Prof. Emilio Tagliavini Dr. Frances Van Dolah
Esame finale anno 2011

2

3
Table of contents
1. Introduction…….……………………………………………………………..5
1.1. Harmful Algal Blooms……………………………………..………….5
1.2. The diversity of negative effects……………………………………….7
1.3. Bloom dynamics………………………………………………….…..11
1.4. HABs and eutrophication………………………………………….....17
1.5. Growth dynamics……………………………………………………..22
1.6. Affinity coefficient Ks and nutrient acquisition………………………22
1.7. Phycotoxin biosynthesis………………………………………….…..24
1.8. HABs and climatic fluctuations………………………………………25
1.9. Coastal waters for aquaculture………………………………………..26
1.10. Algal cysts in ballast water………………………………………….27
1.11. Management perspectives………………………………………...…27
1.12. Mediterranean HABs…………………………………………….….29
2. Aim of the thesis……………………………………………………………..31
3. The Raphidophyte Fibrocapsa japonica…………………………………….33
3.1. Resting cysts………………………………………………………….34
3.2. Experimental section………………………………………………....36
3.3. Toxicity evaluation of Fibrocapsa japonica from the Northern Adriatic
Sea…………………………………………………………………………45
3.4. Chemical characterization…………………………………………….54

4
3.5. Development of LC-MS methods for Brevetoxins (BTXs)………….57
3.6. Conclusion – F. japonica…………………………………..………....75
4. The dinoflagellate Ostreopsis cf. ovata……………………………………...81
4.1. Toxin production during growth………………………………..…….83
4.2. Effect of environmental parameters…………………………………..85
4.3. Toxin characterization of Italian O. cf. ovata strains…………….....125
5. Polyketide synthase (PKS) enzymes…………………………………….....129
5.1. Experimental section………………………………………………..133
5.2. Results……………………………………………………………….137
5.3. Conclusion – PKS…………………………………………………...142
6. General conclusions………………………………………………………...147
References…………………………………………………………………….149
Abbreviation…………………………………………………………………..179
Acknowledgements…………………………………………………………...183

5
1. Introduction
1.1. Harmful Algal Blooms
Coastal systems around the world have suffered a variety of environmental problems,
including loss of seagrass habitats, coral reef degradation or destruction, loss of quality of
coastal waters for recreational use, deaths of marine mammals, red tides, fish kills, and
outbreaks of shellfish poisonings. Some of the problems cited above can be attributable to
what is called harmful algae blooms (HABs).
The term ‘Harmful Algal Blooms’ (HABs) covers a heterogeneous set of events that share
two characteristics: they are caused by microalgae and they have a negative impact on human
activities. Despite these common features, HABs are very diverse in terms of causative
organisms, dynamics of blooms and type of impact.
A phytoplankton bloom, also known as a ‘red tide’ due to the water discoloration, is a sudden
increase in the population of a microalgae that has encountered suitable conditions for growth,
and that, together with their adaptive strategies (i.e. migration, active swimming) and the
appropriate physical conditions, can reach concentrations of 104–105 cell L-1 during certain
period of time (commonly 1–3 weeks). A proliferation like this can be characterised by the
occasional dominance of a particular species (monospecific bloom) or group of species.
Harmful species belong to six algal groups (diatoms, dinoflagellates, haptophytes,
raphidophytes, cyanophytes, and pelagophytes, Fig. 1.1) and these differ greatly in terms of
morphological, physiological and ecological characteristics (Zingone and Enevoldsen, 2000;
Garcés et al., 2002).
The list of microalgal species that are potentially involved in HABs comprises about 80 toxic
species and about 200 noxious species out of an approximate total of 4000 marine planktonic
microalgae described thus far (Sournia, 1995). Of these, only around 80 (mainly
dinoflagellates) have the potential to produce toxins (Zingone and Enevoldsen, 2000; Smayda
and Reynolds, 2003). This list has increased remarkably in recent years because of new cases
of harmful events, the development of scientific research in the field, and enhanced human
interactions with the coastal zone; however, several thousand phytoplankton species are still
undescribed (Andersen, 1992).
Flagellate species account for 90% and, among flagellates, dinoflagellates stand out as a
particularly noxious group. They represent the 75% (45-60 taxa) of all harmful algal bloom
(HAB) species.

6
Harmful algal taxa may be nonmotile or motile; pica-, nano-, or larger sized;
photoautotrophic, mixotrophic, or obligate heterotrophs; siliceous or nonsiliceous species,
etc., and have diverse modes of inimical action.
Fig. 1.1- Some species of microalgae that form red tide or toxic outbreaks (from Fukuyo).
Toxicity and other negative effects caused by harmful algae are therefore not limited to a
single algal class or to a few genera, but are distributed among several taxonomic groups.
Similarly, the high taxonomical diversity of harmful algae results in a variety of toxins and
relative mechanisms of action at different levels of the trophic chain. As shown in Fig. 1.2,
they have some of the most complex structures known in nature, ranging from low to high
molecular masses and from very polar to highly lipophilic; they possess multi-functional
characters and high degrees of chirality, and cause many different types of toxic effects.
Ecological requirements and bloom dynamics also vary considerably from one species to
another; moreover the taxonomic diversity of HAB species complicates monitoring
operations, which require a high degree of specialized expertise. Another implication of the
taxonomic diversity of HAB species is that the production of toxic substances or other

7
offensive or disturbing features has been selected as an advantageous character more than
once in the evolution of these microorganisms.
1.2. The diversity of negative effects
Five major human toxic syndromes caused mainly by the consumption of bivalve molluscs
contaminated by algal toxins are reported:
1. Paralytic shellfish poisoning (PSP): PSP toxins are collectively called saxitoxins
(STXs) and at least 21 analogues of these cyclic guanidines are known in shellfish, with
saxitoxin (Fig. 1.2a) being the most common toxin. STXs exert their effect by a direct
binding on the voltage-dependent sodium channel blocking the influx of sodium and the
generation of action potentials in nerve and muscle cells, leading to paralysis
(Narahashi, 1988). Dinoflagellates that produce STXs belong to three genera
(Alexandrium, Gymnodinium and Pyrodinium).
2. Diarrhoetic shellfish poisoning (DSP): DSP toxins were originally divided into three
different structural classes: (a) okadaic acid (OA) (Fig. 1.2b) and its analogues,
dinophysistoxins (DTXs), (b) pectenotoxins (PTXs) and (c) yessotoxins
(YTXs)(Yasumoto et al., 1985). However, YTXs have now been excluded from the DSP
classification because they are not orally toxic and do not induce diarrhoea (Ogino et al.,
1997; Aune et al., 2002). The mechanism of action of the OA group toxins is via
inhibition of serine-threonine protein phosphatise 2A (PP2A) (Bialojan and Takai,
1988), which plays important roles in many regulatory processes in cells. OA probably
causes diarrhoea by stimulating phosphorylation of proteins that control sodium
secretion in intestinal cells (Cohen et al., 1990). DSP toxins are produced by the
dinoflagellates Dinophysis spp. and Prorocentrum spp. and their toxin profiles can vary
within a single species (Murakami et al., 1982; Yasumoto et al., 1980; Fernández Puente
et al., 2004).
3. Neurotoxic shellfish poisoning (NSP): NSP is a illness caused by the consumption of
bivalve molluscs contaminated with neurotoxins that are produced by the marine
dinoflagellate Karenia brevis (formerly known as Gymnodinium breve and Ptychodiscus
brevis) (Baden, 1983; Steidingen and Baden, 1984). Brevetoxin (Fig. 1.2c) and its
analogues can also affect finfish, aquatic mammals and birds and this topic has been
recently reviewed (Furey et al., 2007; Watkins et al., 2008). The symptoms of NSP
include gastroenteritis and neurological problems (Baden, 1983). The mode of action of
brevetoxins is by receptor binding to the sodium channels which control the generation

8
of action potentials in nerve, muscle and cardiac tissue, enhancing sodium entry into the
cell. This leads to the incessant activation of the cell which causes paralysis and fatigue
of these excitatory cells (Dechraoui et al., 1999).
4. Amnesic shellfish poisoning (ASP): Domoic acid (DA) was identified as the causative
toxin (Fig. 1.2d) (Wright et al., 1989) and marine diatoms of the Pseudonitzschia spp.
were identified as the source of this toxin (Bates et al., 1989). In addition to
gastrointestinal disturbance, unusual neurological symptoms, especially memory
impairment, were observed.
5. Azaspiracid shellfish poisoning (AZP): AZP is the most recently discovered toxic
syndrome from shellfish consumption and several analogues belonging to this new class
of toxins were identified in contaminated mussels (Satake et al., 1998; Ofuji et al., 1999,
2001). More than 20 analogues of azaspiracid AZA1 (Fig. 1.2e) have been identified in
shellfish (Ofuji et al., 1999, 2001; James et al., 2003; Rehmann et al., 2008), which
complicates the regulatory control of these toxins as most have not yet been
toxicologically evaluated. Cytotoxicity studies using neuroblastoma cells showed that
AZA1 disrupts cytoskeletal structure, inducing a time- and dose-dependent decrease in
F-actin pools. A link between F-actin changes and diarrhoeic activity has been suggested
and this may explain the severe gastrointestinal disturbance in AZP outbreaks.
Azaspiracids have been identified in two dinoflagellates, Protoperidinium crassipes
(James et al., 2003) and a new species, Azadinium spinosum (Tillmann et al., 2009).
Fig. 1.2 - Structures of the most abundant toxin responsible for each of the five shellfish toxic
syndromes; (a) saxitoxin (PSP), (b) okadaic acid (DSP), (c) brevetoxin (NSP), (d) domoic acid (ASP),
(e) azaspiracid (AZP) (from James et al., 2010).

9
In terms of harmful effects, we can consider two types of causative organism: the toxin
producers and the high-biomass producers. Some HAB species are related to both
characteristics.
High biomass blooms may cause significant ecological problems and harmful effects in the
biota of the region (anoxia, community and food-web changes) as well as great economic
problems connected to the deterioration of the coastal recreational waters (e.g. discoloration,
odour). In some cases, the algal bloom is beneficial for aquaculture and wild fisheries
operations; however, algal blooms can have a negative effect, causing severe economic losses
to aquaculture, fisheries and tourism operations and having major environmental and human
health impacts.
Toxin events can result from very low concentrations of the causative organism. Moreover, in
the case of toxic events co-occurring with high-biomass, levels of toxicity which are
considered dangerous have often risen before the bloom is conspicuous due to discoloration or
cell counts.
Both high biomass and toxic events can also be associated with the mortality of fish, and
different causes are associated with these mortalities (low oxygen levels, direct toxicity,
haemolysis, and mechanical damages). In many cases, fish mortality events are related to the
fact that fish cannot escape from the cages.
Four categories of deleterious effects related to marine microalgae have been identified:
1. Risks for human health: some algal toxins, different in structure and toxicity (Fig. 1.2),
reach humans through specific vector organisms that accumulate these noxious
substances in their gastrointestinal tract or body tissues (Fig. 1.3). The most toxic algal
species are recorded among dinoflagellates, but a number of diatoms and cyanobacteria
also produce neurotoxic substances that can endanger human health. Four main harmful
effects on humans are associated with the toxic producers: (i) consumption of toxic
shellfish that have accumulated phytoplankton toxins filtered from the water, (ii)
consumption of tropical fish that accumulated phytoplankton toxins (ciguatera), (iii)
respiratory problems due to inhalation of aerosols from sea water that contains toxic
species, and (iv) skin irritations due to allergy-like reactions. Toxins can accumulate in
many species of bivalve molluscs as well as in some gastropods, crabs and fish; the
characteristics of toxification and de-toxification vary remarkably from one vector to
another (Shumway et al., 1995). Currently, approximately 2000 cases of intoxication
(with a 15% mortality rate) in humans due to consumption of toxic shellfish or fish are

10
registered annually (Hallegraeff et al., 1995, 2003). However, this is probably an
underestimation because many cases, particularly those involving gastrointestinal
symptoms, are incorrectly diagnosed. Although many affected areas are nowadays well
controlled thanks to monitoring, the occurrence of toxic events in new areas and the lack
of control in others pose a serious risk to human health and life.
Fig. 1.3 - The toxin cycle: diagram illustrating the interrelationships between harmful algae and
shellfish, finfish, birds and mammals (from James et al., 2010).
Toxic phytoplankton & bacteria Finfish
Marine mammals
Bivalves
Human
Crustaceans
Toxic phytoplankton & bacteria Finfish
Marine mammals
Bivalves
Human
Crustaceans
2. Impact on living marine resources: besides the cases cited above, in which harmful
algae may indirectly impinge upon the exploitation of marine resources, several kinds of
harmful algae may directly affect wild and cultivated fish or marine invertebrates that
are valuable seafood. Most mass mortalities of cultivated fish around the world are
generally caused by such ichthyotoxic species as the raphidophytes Heterosigma
akashiwo and Chattonella marina, a number of dinoflagellates and some
prymnesiophytes. Harmful algae usually affect fish and other invertebrates by producing
toxins, but mucilage-producing or spine-bearing algae may cause mechanical clogging
or lesions of the gills. A reduction in oxygen and hydrogen sulphide production can also
cause mass mortalities of huge proportions of commercially valuable species. Oxygen
depletion can be due to high respiration by algae (at night or in low light during the day)
but more often is caused by bacterial respiration during decay of the bloom. Essentially
non-toxic bloom formers can sometimes evoke major ecosystem impacts, and unsightly
dead fish, slime and foam deter tourism and recreational activities. Whales and
porpoises can also become victims when they receive toxins through the food chain via

11
contaminated zooplankton or fish (Geraci et al., 1989). Poisoning of manatees by
dinoflagellate brevetoxins contained in salps attached to seagrass and of pelicans and
sealions by diatom domoic acid contained in anchovies has also been reported. Some
algal species can seriously damage fish gills, either mechanically or through production
of haemolytic substances, whereas other kill fish algae through the production of
extracellular neurotoxins. Whereas wild fish stocks have the freedom to swim away
from problem areas, caged fish appear to be extremely vulnerable to such noxious algal
blooms.
3. Impact on tourism and on the recreational use of coastal areas: a requisite for the
exploitation of tourism and of the recreational resources in coastal areas is a high quality
of the environment, i.e. unaltered seawater colour, transparency, smell. Algal blooms
may cause intense discolorations of seawater from golden brown to emerald green, from
reddish to whitish, which earned them the name of ‘red tides’.
4. Damage to the marine ecosystem: a number of HABs affect organisms that may have
no commercial value but nonetheless are functional components of the marine
ecosystem. The co-occurrence of several conditions is required to generate these
situations, i.e. non-limiting light and nutrient supplies and local physiographic and
oceanographic conditions that entrap the bloom, thereby amplifying the effects of
biomass degradation. Anoxia is not the only mechanism whereby HABs exert a
deleterious effect on different components of the coastal ecosystem. They also reduced
grazing by microzooplankton and decimated eelgrass beds through severe light
attenuation (Cosper et al., 1989). In other cases, specific toxins seem to affect a single
population of marine mammals, fish, birds, or other organisms.
1.3. Bloom dynamics
The dynamics of harmful algal blooms cannot be elucidated by research on one or a few
organisms; it is in fact difficult to define one kind of coastal area which is more prone to
HABs, even when a single species is considered. Indeed, HABs may occur in a variety of
areas and hydrographic conditions, including upwelling regions, pristine coastal waters with
moderate nutrient levels, and coastal areas affected by shelf-scale circulation.
The concept of high abundance is implicit in the term ‘bloom’ defined also as a ‘significant
population increase’ (Smayda, 1997), which leads to a peak. The magnitude of this peak is

12
specific for each species and may vary considerably in space and time, being dependent on
environmental conditions. In this sense, a bloom does not imply a high biomass.
Because of the difficulty in detecting low concentrations of planktonic algae, it is not always
possible to pre-alert to the harmful events, especially in the case of these extremely noxious
species.
On the diametrically opposed end of a scale of danger are species that are noxious only when
they reach very high concentrations.
The diversity of bloom dynamics is another aspect to be taken into account. Different
interacting physical, chemical and biological factors can trigger a bloom of a species but in
different habitats (Zingone and Enevoldsen, 2000). Each species has different adaptive
strategies and responds in different ways to the variability of the environment and its changes
(Fig. 1.4). It could be argued that any phytoplankton species can exert a negative impact when
it persistently dominates phytoplankton populations. Moreover, the expansion of the
geographical distribution of a species could be due to an anthropogenic introduction, a natural
phenomenon (i.e. currents), or it could be that the species was already in the area but at
undetectable concentrations (the case of the NSP producer Karenia brevis in New Zealand
waters (Hallegraeff et al., 1995)) or
present in the distant pass (Dale et al.,
1993). Genetic analysis is therefore
essential to confirm the invasion of alien
microalgae in different coastal areas
affected by ballast water or the transfer
of shellfish stocks, i.e. Alexandrium
species expansion in Tasmanian Waters
(Scholin, 1996).
Fig. 1.4 – Factors affecting harmful algae gains and losses. On the upper half the gains include their
intrinsic ability to utilize inorganic and organic compounds (mixotrophy), nutrients from
anthropogenic origin, and under adverse conditions release allelochemical compounds that kill other
algae (allelopathy) or their grazers. On the lower half the losses the harmful algae might suffer: in this
case no blooms will be formed or damage to the environment will occur (from Granéli and Turner,
2006).

13
1.3.1. Human impact
There are still doubts on the extent to which human impact may contribute to HABs;
however, factors related to human activities (Fig. 1.5) can be summarised:
(i) the increase in geographical ranges of harmful species distribution due to human
induced transport of resting cysts results from movement of shellfish stocks or
ballast waters and floating plastic;
(ii) stimulation due to the over-enrichment of coastal waters (eutrophication);
(iii) human-induced climatic change has also been noted;
(iv) the increase of confined bodies water in coastal areas due to the exploitation of the
coastline (coastal development) has been suggested in the Mediterranean Sea
(Garcés et al., 2002; Vila et al., 2001);
(v) the decreasing biomass of filter feeding organisms, due to overfishing, or changing
environmental conditions.
Fig. 1.5 - Scheme of anthropogenic factors related with recreational activities promoting HAB
increase (from Action plans and measures for an integrated control of Mediterranean recreational
waters in relationship with harmful algae blooms. http://www.icm.csic.es/bio/projects/wscalvia).
Anthropogenic changes in the ratio of nutrient availability could be one of the key factors in
some areas. Coastal zones around the world are in fact subjected to increasingly nutrient

14
inputs as related to human activities including direct discharges and via rivers, ground water
and atmospheric deposition. Anthropogenic sources of nutrients include fertilisers,
combustion of fossil fuels, discharge of human waste, and the consequences of animal
production and contribute to non-point sources of nutrient loading (Nixon, 1995; National
Research Council, 2000). There are well-established positive relationships among nutrient
loads in marine systems, and phytoplankton primary production, and fisheries yield (Rabalais
and Nixon, 2002). This over-enrichment leads to diverse impacts including increase turbidity
with a subsequent loss of submerged aquatic vegetation, oxygen deficiency, disruption of
ecosystem functioning, loss of habitat, loss of biodiversity, shifts in food webs, and loss of
harvestable fisheries and HABs (National Research Council, 2000; Rabalais and Nixon,
2002).
It is considered in a global context that point sources such as urban waste water and industrial
discharges are less important nutrient contributors than non point-sources, which are very
difficult to evaluate.
1.3.2. Environmental factors
The taxonomic diversity of HAB species suggests that each species is adapted to some set of
preferred environmental conditions or, in ecological terms, to a defined niche.
Conceivably, once the ecological requirements for each species are known, it would be easy
to predict its occurrence (Richardson, 1997).
As a result, the capability of a species to cope with
environmental conditions apparently not matching its
optimal ranges is notably expanded and its occurrence is
more difficult to predict (Fig. 1.6). Bloom dynamics are
controlled internally through behavioural adaptation.
Adaptive strategies such as mobility behaviour (phototaxis,
vertical migration, swimming patterns, and aggregation)
and life cycle strategies (which include temporary phases
and resting cysts) interact with the surrounding
environment in development and maintenance of blooms.
Fig. 1.6 – Generic vertical profiles of irradiance, nutrients concentration, temperature and chlorophyll
through the water column.

15
Vertical migration is a mechanism to seek nutrients, but is also a determining factor in the
spatial distribution of the population (Prego, 1992; Liu et al., 2002) as well as an adaptation to
minimize population loss.
A large part of HABs species research has been dedicated to toxin production and factors that
control it. The issue gets more complicated since environmental conditions (light,
temperature, salinity and nutrients) can increase or diminish the capability of some species to
produce toxins (Cembella, 1998). It has also been said that the same species can be toxic in
one area causing very harmful effects, not toxic in other areas, or lose their capability of
producing toxins in culture. This statement must be treated with caution; in fact, it may be due
to confusion in the identification of the species.
Links between HABs and nutrient loading are complex and imply an understanding of the
physiological requirements and the mechanisms of nutrient acquisition by each species.
Nutrient assimilation depends on a variety of factors such as the nutritional preferences,
uptake capabilities or nutritional status.
Flagellates, including dinoflagellates, have considerable nutritional strategies such as: (i) low
nutrient affinity (Smayda, 1997), (ii) preference for reduced N forms (i.e. ammonium and
urea) (DeYoe and Suttle, 1994), and (iii) mixotrophy (the ability to acquire N and C via
particle ingestion or by the uptake of dissolved organic compounds) (Carlsson et al., 1998;
Lomas and Glibert, 1999a,b; Berg et al., 2002, 2003).
Diatoms have an advantage, with respect to flagellates, at low nutrient conditions. A key
element in the context of HABs is silica (Smayda, 1997), an element required by diatoms in
their walls, as their growth ceases when Si becomes depleted. The ratios N:Si and P:Si have
increased substantially in coastal areas affected by human stresses (Justic et al., 1995; Olivos,
2000) and this would favour non-diatom species including several harmful/toxic species
(Smayda, 1989).
All these cases indicate that complex mechanisms regulate the interactions among different
components of the trophic web and that a lowering in diversity of algal population in time and
space may pose a serious risk to coastal ecosystems.
1.3.3. Life cicles
Numerous phytoplankton species have complex life cycles, i.e. alternation of stages that differ
in terms of physiology, motility, resistance to adverse conditions and life styles. Non motile,
benthic resting stages are widely distributed among HAB dinoflagellates and raphidophytes,
16
and may play a significant role in bloom initiation by inoculating seed populations when
conditions are favourable (Fig. 1.7).
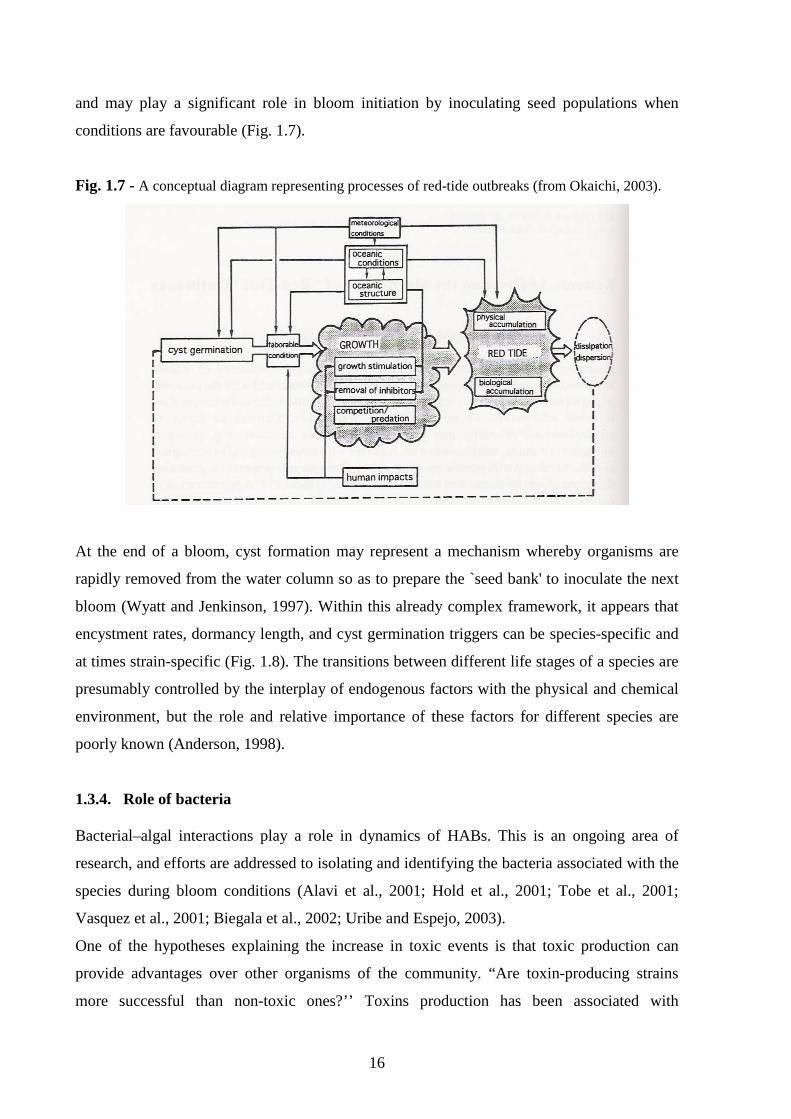
Fig. 1.7 - A conceptual diagram representing processes of red-tide outbreaks (from Okaichi, 2003).
At the end of a bloom, cyst formation may represent a mechanism whereby organisms are
rapidly removed from the water column so as to prepare the `seed bank' to inoculate the next
bloom (Wyatt and Jenkinson, 1997). Within this already complex framework, it appears that
encystment rates, dormancy length, and cyst germination triggers can be species-specific and
at times strain-specific (Fig. 1.8). The transitions between different life stages of a species are
presumably controlled by the interplay of endogenous factors with the physical and chemical
environment, but the role and relative importance of these factors for different species are
poorly known (Anderson, 1998).
1.3.4. Role of bacteria
Bacterial–algal interactions play a role in dynamics of HABs. This is an ongoing area of
research, and efforts are addressed to isolating and identifying the bacteria associated with the
species during bloom conditions (Alavi et al., 2001; Hold et al., 2001; Tobe et al., 2001;
Vasquez et al., 2001; Biegala et al., 2002; Uribe and Espejo, 2003).
One of the hypotheses explaining the increase in toxic events is that toxic production can
provide advantages over other organisms of the community. “Are toxin-producing strains
more successful than non-toxic ones?’’ Toxins production has been associated with

17
allelochemical and allelopathic activities, which inhibit the growth of co-occurring
phytoplankton species (Arzul et al., 1999), and act as a deterrent to grazers (Turner and
Tester, 1997). Toxin production could thus be a developed adaptation to offset the negative
effects of interspecific competition in nutrient limitation conditions, by increasing grazing
pressure on non-toxic competitors (Guisande et al., 2002).
Fig. 1.8 - Life cycle of a harmful algae, e.g. Alexandrium sp. (Illustration by Don Anderson, Woods
Hole Oceanographic Institution).
1.4. HABs and eutrophication
The increase of HAB records in coastal waters around the world has often been associated
with nutrients derived from anthropogenic activities (Hallegraeff, 1993; Smayda, 1989).
Eutrophication is one of several mechanisms by which harmful algae appear to be increasing
in extent and duration in many locations. Although important, it is not the only explanation
for blooms or toxic outbreaks. Nutrient enrichment has been strongly linked to stimulation of
some harmful species, but for others it has not been an apparent contributing factor.
The term ‘eutrophication’ was formerly used mostly in reference to the natural aging of lakes
wherein a large, deep, nutrient-poor lake eventually becomes more nutrient-rich, more

18
productive with plant and animal life, and slowly fills in to become a pond, then a marsh
(Wetzel, 1983). More recently, the term has been used to refer to cultural or accelerated
eutrophication of lakes, rivers, estuaries, and marine waters, wherein the natural
eutrophication process is advanced by hundreds or thousands of years by human activities that
add nutrients (Burkholder, 2000). Nixon (1995) defined eutrophication as ‘the process of
increased organic enrichment of an ecosystem, generally through increased nutrient inputs’.
Two nutrients in human-derived sources, phosphorus (P) and nitrogen (N), are of most
concern in eutrophication. In freshwaters, P is the least abundant among the nutrients needed
in large quantity (macronutrients) by photosynthetic organisms, so it is the primary nutrient
that limits their growth (Schindler, 1977). P can also limit or co-limit algal growth in
estuarine and marine environments that are sustaining high N inputs (Rudek et al., 1991;
Fisher et al., 1992). In many temperate and polar coastal marine waters, N is the most
important nutrient that limits primary production of photosynthetic organisms (Dugdale and
Goering, 1967; Glibert, 1988). N is often the nutrient that first limits primary production at
the estuarine interface between marine and freshwater habitats. In lower estuaries both N and
P can colimit phytoplankton production (Rudek et al., 1991; Fisher et al., 1992). Other
nutrients such as silicon (Si) and iron (Fe) also can significantly influence the outcome of
species dominance and the structure and abundance of phytoplankton communities under
cultural eutrophication (Heckey and Kilham, 1988; Wilhelm, 1995).
In the laboratory it is easy to demonstrate that algal growth increases with increasing nutrient
availability; however, there is scarce evidence for a direct relationship between the spread of
harmful events and eutrophication in the sea. High biomass blooms obviously require high
nutrient levels, but a high nutrient supply may not necessarily favour harmful species. Also,
specialized behaviours, like facultative or obligate mixotrophy (Stoecker, 1999; Granéli and
Carlsson, 1998) or the capability of vertically migrating to nutrient-replete water column
layers (Hasle, 1950; Villarino et al., 1995), represent very successful adaptations to cope with
the vertical segregation of light and nutrients in stratified waters. Moreover, at the ecosystem
level, complex trophic relationships, including microbial interactions and excretion from
grazers, may enhance nutrient availability and growth rates under apparently oligotrophic
conditions (Goldman et al., 1979). Linkages between HABs and eutrophication have been
noted within the past two decades (e.g., Officer and Ryther, 1980; Lam and Ho, 1989;
Smayda, 1989, 1990; Riegman, 1995; Richardson and Jorgensen, 1996; Richardson, 1997).
Coastal waters are receiving massive and increasing quantities of industrial, agricultural, and
sewage effluents through a variety of pathways (Vitousek et al., 1997). In many urbanized

19
coastal regions, these anthropogenic inputs have altered the size and composition of the
nutrient pool which may, in turn, create a more favourable nutrient environment for certain
HAB species.
The impact of high nutrient supplies and of massive inputs of inorganic and organic
compounds in coastal systems undoubtedly merits detailed investigation. In fact, besides the
cases of high biomass blooms leading to hypoxic or anoxic events, other negative effects of
eutrophication might be worth assessing, e.g. the loss of phytoplankton diversity and shifts in
the specific composition of microalgal communities. These changes could influence the fate
of primary production and modify the shape of the trophic web in coastal areas, with grave
consequences for fisheries and for the exploitation of natural resources.
Despite our increased understanding of the pathways by which nutrients are delivered to
ecosystems and the pathways by which they are assimilated differentially by different groups
of species, the relationships between nutrient delivery and the development of blooms and
their potential toxicity or harmfulness remain poorly understood. Many factors such as algal
species presence/abundance, degree of flushing or water exchange, weather conditions, and
presence and abundance of grazers contribute to the success of a given species at a given
point in time. Similar nutrient loads do not have the same impact in different environments or
in the same environment at different points in time.
Many sources of nutrients can stimulate harmful algal blooms, including sewage and animal
wastes, atmospheric deposition, and groundwater inflow, as well as agricultural and other
fertilizer runoff; yet another source is the growing aquaculture industry in many coastal areas.
Nonpoint sources of nutrients (from agricultural activities, fossil-fuel combustion, and animal
feeding operations) are often of greater concern than point sources because they are larger and
more difficult to control basis (National Research Council, 2000).
HAB species, like all plant-like organisms require certain major and minor nutrients for their
nutrition, and these can be supplied either naturally from freshwater and marine
biogeochemical processes or through human activities such as pollution. These nutrient
sources include dissolved inorganic and organic compounds of various types, as well as
particulate nutrients in the form of other organisms or detritus. Nutrients can stimulate or
enhance the impact of toxic or harmful species in several ways. At the simplest level, harmful
phytoplankton may increase in abundance due to nutrient enrichment, but remain in the same
relative fraction of the total phytoplankton biomass. Even though non-HAB species are
stimulated proportionately, a modest increase in the abundance of a HAB species can cause it
to become noticeable because of its toxic or harmful effects. Specific algal species or species
20
groups have numerous physiological adaptations that permit them to exploit nutrients
differentially (Smayda, 1990, 1997; Anderson et al., 2002; Smayda and Reynolds, 2003). A
more frequent response to nutrient enrichment occurs when a species or group of species
begins to dominate under the altered nutrient regime.
Some generalities are beginning to emerge with respect to the preference of many bloom-
forming species for specific forms of nutrients, as well as the tendency for some blooms to
occur when the ratios of nutrient availability or supply are altered. The concept is based
largely on the nutrient ratio hypothesis (Tilman, 1977; Smayda, 1990, 1997) which argues
that environmental selection of phytoplankton species is associated with the relative
availability of specific nutrients in coastal waters, and that human activities have altered these
nutrient supply ratios in ways that change the natural phytoplankton community composition
and possibly favour harmful or potentially toxic forms. Perhaps the clearest demonstration of
the effect of altered nutrient supply ratios involves the stimulation of non-diatom species
following changes in the availability of N or P relative to silicate. Diatoms, the vast majority
of which are harmless, require silica in their cell walls, whereas most other phytoplankton do
not. Since silica is not abundant in sewage effluent but N and P are, the N:Si or P:Si ratios in
some lakes, rivers, estuaries, and coastal waters have increased over the last several decades
(Schelske et al., 1986; Smayda, 1989, 1990; Rabalais et al., 1996). In theory, diatom growth
will cease when silica supplies are depleted, but other phytoplankton classes can continue to
proliferate using the excess N and P.
An understanding of physiological responses is further complicated by the fact that the rate of
nutrient supply will not necessarily correlate with the rate of nutrient assimilation by the
algae, as the latter is controlled by nutritional preferences, uptake capabilities, and
physiological or nutritional status. The response by either the total phytoplankton community
or individual species within the community also depends on many factors, including
interactions with grazers and physical forcing such as turbulence. Grazers may inhibit the
development of phytoplankton biomass through their feeding, while at the same time, enhance
the regeneration of nutrients through their release and excretion. This in turn will alter the
balance of reduced versus oxidized forms of N (Glibert, 1998).
In addition, the assimilation of nutrients by phytoplankton depends on environmental factors
such as light, temperature, and water column stability with different environmental effects
having differential impacts on different nutrient substrates. The uptake of ammonium and urea
are usually thought to be less light dependent than the uptake of nitrate (MacIsaac and
Dugdale, 1972; Fisher et al., 1982), and the temperature dependence of ammonium uptake

21
may also differ from that of nitrate (Lomas and Glibert, 1999a). In recent years, the
physiological strategies by which different groups of species acquire their nutrients have
become better understood. Rapidly growing marine diatoms have been highly correlated with
large and/or frequent additions of nitrate, in part because they have physiological adaptations
which allow them to exploit nitrate-rich conditions (Takahashi et al., 1982; Goldman, 1993;
Lomas and Glibert, 1999a, b, 2000). Microflagellates, including dinoflagellates, are most
frequently associated with low nitrate concentrations, higher ammonium, urea, or dissolved
organic nitrogen (DON) supply, and consistent physiological preference for reduced N forms
(e.g. Berg et al., 1997; Carlsson et al., 1998; Lomas and Glibert, 1999b). Harmful estuarine
dinoflagellates tend to occur in waters that have seasonally high phosphate and nitrate, as well
as high DOC and other organic nutrient forms (Burkholder and Glasgow, 1997; Burkholder et
al., 1997, 2001a,b; Magnien et al., 2000; Glasgow et al., 2001; Glibert et al., 2001).
Moreover, there is evidence that nutrients can play a major role in the regulation of toxicity in
some HAB species, and this can have significant implications to toxin monitoring programs
and public health decisions. In some cases, toxicity can increase or decrease dramatically
depending on the limiting nutrient. Saxitoxin production by Alexandrium tamarense can be 5-
10-fold higher in P-limited versus N-limited cells (Boyer et al., 1987; Anderson et al., 1990).
Likewise, domoic acid production by Pseudo-nitzschia multiseries is inversely correlated with
the ambient Si concentration in batch culture (Pan et al., 1996a). In that study, cells began
accumulating this toxin only when the division rate declined as a result of partial or total
depletion of silica; when cultures were N-limited no toxin was produced, and toxin production
was greatly enhanced under P-deficient conditions in continuous cultures (Pan et al., 1996b).
For other HAB species a similar picture emerges: toxin production varies significantly with
different degrees and types of nutrient limitation.
It is important to recognize that the impacts of nutrient loading depend on many factors, from
the species composition and nutritional state of the organisms at the time of the loading, to the
physical features of the environment at that point in time, as well as the existence of grazers.
Similar nutrient loads will not necessarily have the same effect on a different environment, or
on the same environment at a different point in time. Although there have been many
successes in relating nutrient quantity and composition to outbreaks of HABs, in general the
relationships between nutrient delivery and the development of blooms of many HAB species,
and between nutrient enrichment and the potential toxicity of blooms or outbreaks of those
species, remain poorly understood.

22
1.5. Growth dynamics
Phytoplankton growth is classically measured as a whole community response, with
chlorophyll used as an index of abundance against which rate processes are normalized.
In reality, community growth is only one of three different, concurrent growth modes which
characterize phytoplankton population dynamics: cellular growth, population growth, and
community growth.
Cellular growth is the active, basic growth unit. It is the outcome of coupled physiological
processes under genetic and multifactorial control, particularly irradiance and nutrient levels.
Population growth is the environmentally modified outcome of cellular growth, the
recruitment term; it is also the bloom unit. Population growth is dependent upon the cellular
growth rates, but the factors regulating cellular and population growth rates are not identical.
Grazing and advection, for example, influence population growth rate, but are irrelevant to
cellular growth rates. Population growth rates of a given taxon are always lower than its
cellular growth rates. Population expansions, in fact, result from divisions of individual, free-
living cells. Red tide species are commonly assumed to be relatively slow growing, with
blooms resulting from low grazing pressure and (or) physical accumulation. The early
experimental literature generally suggests that daily growth rates of dinoflagellates are k = 0.3
day-1, or a generation time of 3 days. Reviews of some of the phytoplankton growth literature
(Banse, 1982; Furnas, 1990; Tang, 1995) confirm that diatom growth rates are generally much
higher than those obtained for dinoflagellates based on equivalent body mass.
Community dynamics are a consequence of cellular and population growth, not the
determinant of the latter. The community is an assemblage of multiple, concurrent species’
blooms equal to the total number of taxa present, each in different bloom cycle stages, and
each regulated by different combinations of growth factors.
1.6. Affinity coefficient K s and nutrient acquisition
Red tide blooms occur at both extremes of the nutrient gradient: in oligotrophic and nutrient-
enhanced habitats.
Nutrient availability influences nutrient uptake rates, and sets the biomass carrying capacity
and, therefore, cellular, population, and community growth rates. Growth-strategy species
presumably have elevated maximal uptake rates (Vmax), an adaptation to ensure high velocity
uptake of ambient nutrients and pulsed accretions from grazer excretions, transient physical
advections, or other opportunistic encounters. Storage-strategy species build up intracellular

23
storage pools for future growth. In growth-strategy species, such a capability would be
advantageous in nutrient-depleted habitats.
Of the three strategies, affinity adaptation has received the most attention. Since affinity-
adapted species have low Ks constants, their selection is hypothesized to be favoured in
seasons and regions of chronically low nutrient supply rates, where they are expected to
outcompete higher Ks species.
Margalef (1978) concluded that diatoms collectively have high Ks coefficients and
dinoflagellates lower ones. He reasoned that turbulence, elevated nutrients, and high Ks
species should co-occur, because turbulence augments nutrient levels leading to prominent
spring and upwelling blooms of diatoms.
The Ks data and their phylogenetic patterns suggest a paradox: collectively, HAB species lack
the expected high affinity for nutrient uptake thought to be essential for their frequent bloom
occurrences in nutrient-depleted waters.
Flagellates generally have evolved four major adaptations to offset the ecological
disadvantages of a high Ks:
1. Nutrient-retrieval migrations
Eppley and Harrison (1975) sketched the basic mechanism of a vertical nutrient-
retrieval strategy: diel migration of nutrient-depleted dinoflagellates into NO3-rich
subsurface layers would access nutrients needed to outcompete diatoms and favour red
tide blooms. Nutrient-retrieval migrations into cooler, deeper layers would both increase
affinity, i.e. lower Ks and increase Vmax:Ks (magnitude depends on the degree of
vertical thermal change), and facilitate uptake by the cells now exposed to elevated NO3
concentrations.
2. Mixotrophic nutrition
Utilization of dissolved organic and particulate nutrients would help offset the
ecological disadvantages of a high Ks in an oligotrophic niche. About half of all
dinoflagellate taxa are obligate heterotrophs; some have evolved elaborate
phagotrophic-feeding mechanisms activated by chemodetection of prey. Almost all
HAB taxa are obligate phototrophs; however, their use of supplemental nutritional
modes is thus of great interest. Phototrophic flagellates collectively exhibit two primary
nutrient supplement strategies: uptake of dissolved organic substances (= osmotrophy)
and ingestion of particulate matter (= mixo-phagotrophy).

24
3. Allelochemically enhanced interspecific competition
Allelochemical will refer to chemically regulated interspecific competition, and
allelopathic to antipredation regulation. Phycotoxins (i.e. saxitoxin, brevetoxin, domoic
acid, okadaic acid) are distinguished from allelopathic and allelochemical secondary
metabolites because of probable differences in their biosynthesis, chemical nature, and
specific effects. Phycotoxins and secondary metabolites produced by the same species of
certain dinoflagellates and raphidophytes have similar antimicrobial activity (e.g. Nagai
et al., 1990). A major difference between phycotoxins and allelo-metabolites is that
phycotoxins can be vectored through the food web, accompanied by broad-based
trophodynamic effects, whereas allelochemicals are usually directly targeted (Smayda,
1992).
4. Allelopathic antipredation defence mechanisms
Blooms of Chattonella antiqua, C. marina, C. subsalsa, and H. akashiwo have
chronically devastated fish farms in the Seto Inland Sea (Okaichi, 1989). Allelopathic
induction of fish avoidance responses is also known. There is considerable evidence,
therefore, that HAB flagellates have a diverse allelopathy against a broad spectrum of
microbial, zooplanktonic, nektonic, and benthic taxa and of potential significance in
natural population dynamics. Poulet et al. (1994) have generalized from experimental
evidence that diatoms have evolved an allelopathic, antipredation strategy to reduce
copepod population levels by inhibiting their reproductive success.
1.7. Phycotoxin biosynthesis
From a molecular physiological and chemical ecological perspective, toxin classification
based upon structural homology presumably reflects shared elements of biosynthetic
pathways (Wright and Cembella, 1998). Most if not all polyether phycotoxins are produced
via polyketide pathways (Shimizu, 1996), in which acetate units are added sequentially from
acetyl-CoA within a pathway regulated by polyketide synthases (PKS). The classical
approach is to provide an isotopic enrichment of low-molecular-weight putative precursors
(e.g. 13C-acetate) and then follow the incorporation pattern into the target phycotoxin by
Nuclear Magnetic Resonance (NMR) spectroscopy. This approach has provide structural
elucidation and plausible biosynthetic schemes for key phycotoxins, including saxitoxin and
analogues from Alexandrium tamarense (Shimizu, 2000), brevetoxins from Karenia brevis
(Shimizu, 1996), sulphated dinophysistoxins from Prorocentrum maculosum (Macpherson et
al., 2003) and domoic acid from Pseudo-nitzschia pungens. Since many phycotoxins are

25
derived via polyketide metabolism regulated by PKS, this enzyme complex merits particular
attention in gene expression studies. Putative PKS genes have been reported from the
diniflagellates Gymnodinium catenatum, Amphidinium operculum, Prorocentrum lima,
Karenia brevis (Snyder et al., 2005) and Alexandrium ostenfeldii (Cembella et al., 2004).
However, no definitive attribution can be made regarding their role in biosynthesis of
polyketide toxins.
1.8. HABs and climatic fluctuations
It is not possible to demonstrate a worldwide increase in HABs because we are unable to
detect long-term trends of algal blooms due to the lack of time series at the correct scale
(Wyatt, 1995). However, at a local scale there are numerous examples of HABs in areas
where they were previously unknown. It is not clear as to how much of the increase reflects
heightened scientific awareness and scrutiny of coastal waters and seafood quality versus an
actual increase in the number, severity, or frequency of outbreaks (Anderson, 1989). Many
new bloom species are believed to reflect the discovery of hidden flora populations (Smayda,
1989) which had existed in those waters for many years, but which had not been detected or
recognized as harmful until the advent of more sensitive toxin detection methods or an
increase in the number and training of observers (e.g., Anderson et al., 1994).
The passive introduction of species from other sites by means of natural (currents, storms) or
man-mediated events (e.g. ballast waters, keels, mussel strains transport) has been implicated
in variations in the geographic range of a species, which has also been supported by the
absence of cyst records prior to certain dates (McMinn et al., 1997). Sediment investigations
on resting cysts provide further information on planktonic organisms with benthic stages, and
may lead to the detection of rare species that eluded planktonic sampling (Montresor et al.,
1998). Similar investigations on fossilized resting cysts provide data on the distribution of a
species over a wider time scale, which covers different hydrographic situations alternating
over the geological periods in given areas.
Climatic variations can also affect the spatial distribution of a species. Temperature variations
not only directly affect the geographic range and the magnitude of certain blooms, but can
also induce changes in circulation patterns, prolong stratification periods and cause variations
in the physical structure of the water column that can favour particular species, including
dinoflagellates and their potentially harmful representatives (Yin et al., 1999; Fraga and
Sanchez, 1985; Tester et al., 1993).

26
The issue of a global increase in harmful algal blooms has been a recurrent topic in recent
years. Four explanations for this apparent increase in algal blooms have been proposed:
(i) increased scientific awareness of toxic species;
(ii) increased utilization of coastal waters for aquaculture;
(iii) stimulation of plankton blooms by cultural euthrophication and/or unusual
climatological conditions;
(iv) transportation of dinoflagellate resting cysts either in ships’ ballast water or associated
with translocation of shellfish stocks from one area to another.
1.9. Coastal waters for aquaculture
As a consequence of the increased overfishing problems in coastal waters, more and more
countries are looking towards aquaculture as an alternative. Aquaculture operations act as
sensitive ‘bioassay systems’ for harmful algal species and can bring to light the presence in
water bodies of organisms not previously know to exist there. There is no doubt that the
growing interest in utilizing coastal waters for aquaculture is leading to greater awareness of
toxic algal species.
A more widespread problem for fish farmers is the production by various algal groups of fatty
acids or galactolipids which damage the epithelial tissues of the gills. Fish death may be
caused by capillary haemorrhage, dysfunction of gas exchange at the gills, suffocation from
an overproduction of mucus, or even from secondary infection of the damaged tissue (Yang
and Albright, 1992).
In experimental assay systems these substances destroy red blood cells and therefore have
been provisionally termed ‘haemolysins’ (Yasumoto et al., 1990). Algal species as diverse as
the raphidophytes Heterosigma akashiwo, Chattonella antique and C. marina, the
prymesiophytes Chrysochromulina polylepis and Prymnesium parvum, and the dinoflagellate
Karenia mikimotoi have been implicated.
In countries that pride themselves on their disease- and pollution-free status for aquaculture,
every effort should be made to quarantine sensitive aquaculture areas against the unintentional
introduction of non-indigenous harmful algal species. Furthermore, no aquaculture industry
can avoid having to monitor for an increasing number of harmful algal species in the water
column and for an increasing number of algal toxins in seafood products.

27
1.10. Algal cysts in ballast water
The geographic range of microalgal species can expand depending on natural factors (climate
change, catastrophic storm events, ocean currents, transport of spores via wind or bird feet) or
human-mediated vectors. Cargo-vessel ballast water was first suggested as a vector in the
dispersal of non-indigenous marine plankton some ninety year ago. However, in the 1980s the
problem of ballast-water transport of plankton species gained considerable interest when
evidence was brought forward that non-indigenous toxic dinoflagellate species had been
introduced into sensitive aquaculture areas of Australian waters, with disastrous consequences
for commercial shellfish farm operations (Hallegraeff and Bolch, 1992). One single ballast
tank was thus estimated to contain more than 300 million toxic dinoflagellate cysts which
could be germinated into confirmed toxic cultures. Impacts on shellfish and finfish
aquaculture operations may result in cases of toxin-producing microalgae.
Another vector for the dispersal of algae (especially their resting cysts) is with the
translocation of shellfish stocks from one area to another. Viable transport of dinoflagellate
cells and cysts of Pfiesteria piscicida, P. shumwaye, Karenia brevis, K. mikimotoi,
Alexandrium monilatum, A. tamarense and Prorocentrum minimum, after passage through the
digestive tract of shellfish, have also been demonstrated (Scarratt et al., 1993).
The most effective measure to prevent the spreading of dinoflagellate cysts via ship’s ballast
water would be to avoid ballasting during toxic dinoflagellate blooms in ports. Other options
using heat, electrical shock or chemical treatment (chlorine, hydrogen peroxide) of ballast
water, either in hold or in onshore facilities, have also been explored. Minimizing the risk of
ballast water introductions by microalgae and their cysts represents a very significant
scientific and technological challenge, which cannot yet be adequately achieved with best
currently available technologies and will be high on the research and development in the
future.
1.11. Management perspectives
Harmful algal blooms are apparently an antithesis to the concept of ‘health of the ocean’.
However, we have argued that in most cases HABs do not damage marine ecosystems, nor
impair their sustained biological functioning. Though extremely dangerous for human health
and deleterious for the commercial exploitation of coastal areas, these blooms are natural
phenomena with barely evident negative effects on coastal oceans. On the other hand, the
health of the oceans and the sustainable development of coastal marine ecosystems can be

28
endangered by human activities that reduce habitat and species diversity. Correct management
is required to mitigate the threat posed by HABs to the economic development of coastal
areas and to human health, and ad hoc procedures designed to prevent harmful events or to
accelerate their termination are the ultimate goal for HAB management.
Harbours may have low flushing rates and are also situated in populated areas, which, in
general, mean high nutrient contents. They are also subjected to a high traffic of commercial
vessels that are known to be important vectors in the translocation of resting cyst of harmful
phytoplanktonic species, and thus act as reservoirs for resting cysts (Garcés et al., 2004).
Since the monitoring of toxin producing species has mainly been associated with shellfish
farming, and moreover, the risk of toxin contamination could become even greater in areas
not subject to legislation of local/regional aquaculture activities, to reduce impacts in human
health and economic activities, the following elements should be taken into consideration:
(i) reliable monitoring networks and databases that allow for the analyses of the
expansion of these organisms,
(ii) established channels of exchange of information among scientific and
environmental managers,
(iii) outreach and education programs and easy access for users to monitoring networks
results (e.g. Institution’s WEB sites),
(iv) implication of the medical sector (the consequences in public health are
underestimated, necessity of epidemiological studies).
At present, capillary monitoring seems to be the only tool we have to protect ourselves and
food resources of marine origin from the deleterious effect of HABs. The key to predict HAB
phenomena is to identify and quantify adaptations of HAB species that lead to their selection,
in particular hydrodynamic and ecological conditions. Thus, the central research problem and
a challenge for biological oceanographers is to understand the critical features and
mechanisms underlying the population dynamics of HAB species.
Another gap in our knowledge of phytoplankton, including potentially harmful species, are
the long-term trends of occurrence and abundance of these organisms, which are related with
climatic factors and with their influence on coastal hydrography.
This would provide the data needed to detect trends and patterns of occurrence and
distinguish the effects of natural variability from those of anthropogenic modifications of the
environment.

29
Finally, newly discovered toxins should be characterised, and detection and analytical
methods devised in order to clarify the different types of toxins.
1.12. Mediterranean HABs
Dense blooms of phytoplankton are a widespread phenomenon of the global coastal ocean.
In contrast to large-scale blooms that are dominated by mesoscale circulation, Mediterranean
HABs are a more localized phenomenon commonly related to areas of constrained dynamism,
such as bays, lagoons, ports, beaches and estuaries (Garcés et al., 1998, Vila et al., 2001,
Lopez-Flores et al., 2006). In these areas, enhanced growth of phytoplankton not only leads to
a perceivable water discoloration along the shoreline but also to a deterioration in water
quality. Other unprecedented ecological effects in the Mediterranean, such as fish kills
(Garcés et al., 2006) and risks to human health (Penna et al., 2006), have been attributed to
toxic algal proliferations in recent years.
Despite the fact that in some cases the proliferation of algae may have a natural origin, it is
considered that coastal blooms are an emerging problem that could be related to nutrient
enrichment of coastal waters (Duarte et al., 2000). Intensive urbanization and recreational use
of coastal watersheds has resulted in a remarkable increase in sources of nutrients along the
Mediterranean coasts. This cultural eutrophication generates a contrast between coastal waters
and the open ocean where, owing to summer stratification and nutrient depletion, oligotrophic
conditions prevail in the upper layer. Nutrient-rich coastal environments of the Mediterranean
Sea and, in particular, semi-enclosed areas with low turbulence levels constitute a new and
unique environment for which several phytoplankton species with harmful effects may
become dominant.
Even though most of the factors involved in the Mediterranean nearshore algal outbreaks are
known, the mechanisms that underpin their occurrence are not yet well established. Terrestrial
nutrient loads, toxin production, species diversity, grazing pressure, life cycles and strategies,
physical transport, mixing and other factors have all been used to explain the onset and
evolution of phytoplankton blooms. It is therefore challenging to understand how all of these
different factors combine to stimulate and govern outbreaks.
Various external and/or internal factors have been proposed in attempts to explain changes in
growth rates of phytoplankton populations:
1. Intraspecific genetic variability changes over time within the same population are
possible (Orsini et al., 2002). This suggests that only a fraction of the resident

30
population is responsible for the bloom; furthermore, differences among growth rates of
the different strains are possible.
2. Excretion of chemical signals produced by the organisms could be responsible for the
different physiology.
3. More attention has been devoted to the effect of environmental factors (such as
irradiance, nutrients, turbulence, vitamins and, particularly, temperature) on growth
(Guillard, 1973 and references therein). Temperature is known to alter the
enzymatically regulated processes of most organisms, and hence should not be
disregarded as a triggering factor of the previously mentioned mechanisms. Indeed,
seasonal temperature variations are known to play a major role in the regulation of
growth rates of coastal communities in the Mediterranean Sea.
It is generally recognized that there have been more coastal algal blooms, often of greater
geographic extent and/or longer duration, with more toxic species observed, more fisheries
affected, and higher associated costs from HABs in the past decade than in previous decades
(Anderson, 1989; Smayda, 1990; Hallegraeff, 1993; Glibert et al., 2001; Anderson et al.,
2002).
However, results from laboratory studies are not sufficient to predict the succession of
phytoplankton species and blooms of specific harmful organisms in the sea. Indeed, the net
growth performance of a species is affected by complex interactions with other organisms,
which are scarcely reproducible in laboratory experiments. These include negative
interactions, such as grazing, competition, and viral infections, and a positive feedback from
predator's excretion, bacterial nutrient regeneration and viral lysis.

31
2. Aim of the thesis The main objective of the present thesis was the study of some harmful algae species which
are present in Italian waters and cause blooms, leading to consequences for human health,
coastal ecosystem, fishery and tourism. In particular, the attention was put on a raphidophyte
(Fibrocapsa japonica) and a benthic dinoflagellate (Ostreopsis cf. ovata), which was studied
in laboratory surveys using batch cultures.
The first part of this thesis (chapter 3) was focused on the Adriatic F. japonica, through the
evaluation of its toxicity for different organisms, from bacteria to crustaceans and fish, as its
toxic effects for animals, including species important for fishery, and humans were still
unknown. The aim was also to understand the toxic mechanism, basing on the different
hypothesis postulated in previous works and performed with strains from different regions
worldwide.
Moreover, a chemical characterization and quantification of the fatty acids content, involved
in the toxic mechanism of this species, was performed. Finally, as brevetoxins were
considered as one of the main factors responsible for the toxicity of the raphidophytes,
sensitive liquid chromatography-mass spectrometry (LC-MS) methods for the analysis of
brevetoxins in algal extracts were developed and used to investigate the brevetoxins
production in some Adriatic raphidophytes, including F. japonica.
A second part of this thesis (chapter 4) regarded the dinoflagellate O. cf. ovata, with the aim
to evaluate its growth and toxicity variations in response to environmental variables. In
particular, several strains isolated in recent years in Italian coastal areas were grown at
different environmental conditions to investigate the optimal growth and to understand how
the growth parameters could affect the presence, proliferation and toxicity of O. cf. ovata in
these areas. This species, in fact, showed a relevant variability in the proliferation along the
Mediaterranean coasts, reporting different environmental parameters and toxic effects during
its blooms. Effect of growth temperature were evaluated using different isolates, namely a
Tyrrhenian (from Latina) and two Adriatic (from Ancona and Bari) strains; while a detailed
study on the effects of salinity and nutrients concentration was performed using the Adriatic
strain. Toxicity was investigated either through bioassays, such as Artemia sp., sea bass
ichtyotoxicity and haemolysis assay, and through LC-MS analysis to quantify the toxin
content.
Both the toxins produced by O. cf. ovata and brevetoxins, which are supposed to be produced
by F. japonica, are polyketides. Little is known about the toxin biosynthetic pathways in the

32
dinoflagellates; however, recent data from the dinoflagellate Karenia brevis indicated
polyketide synthases (PKSs) as enzymes probably involved in the brevetoxin biosynthesis.
These enzymes are multi-domain complexes that structurally and functionally resemble the
fatty acid synthases (FASs). To date, approximately 25 species of dinoflagellates have been
found to produce polyketides, but no information exists on PKS proteins of other toxic
dinoflagellates. Thus, the third part of this thesis (chapter 5) was focused on the study of the
expression and localization of PKSs in F. japonica and O. cf. ovata, using antibodies
developed against K. brevis PKS proteins with the aim to understand the involvement of PKS
proteins in the toxin production.

33
3. The Raphidophyte Fibrocapsa japonica The Raphidophyceae Fibrocapsa japonica Toriumi and Takano is one of the most recurrent
harmful algal bloom (HAB) species along the coast of the Adriatic Sea. F. japonica blooms
have been related to massive fish mortality in the Seto Inland Sea (Japan) (Iwasaki, 1971;
Okaichi, 1972, 1989; Toriumi and Takano, 1973); since 1990 this microalga has frequently
been observed also in European coastal waters (Vrieling et al., 1995) where its involvement in
toxic events has been sometime reported (European Commission, 2003), although without the
support of direct evidence. A number of laboratory studies were thus made to evaluate
possible toxic effects of European strains. At first, Khan et al. (1996) analyzed the toxin
composition of a F. japonica strain isolated from the Dutch part of the North Sea in 1993 and
five neurotoxic components, corresponding to brevetoxins, were identified. Other studies
conducted on a German strain reported toxic effects on Artemia salina nauplii, inhibition of V.
fischeri bioluminescence and haemolysis of human red blood cells; the presence of
brevetoxins was excluded while the three haemolytic compounds in the methanol extract were
identified as polyunsaturated fatty acids (PUFAs) (Fu, 2003; Fu et al., 2004a). Another
toxicological study on F. japonica found that a German strain produced one or more bioactive
compounds, having a light-dependent inhibitory effect on Vibrio fischeri’s luminescence (van
Rijssel et al., 2008). These authors supposed that haemolytic compounds and PUFAs, which
are also excreted into the medium, or their combination, could inhibit bioluminescence.
Studies on toxicity where performed also on strains from different geographical areas,
sometimes with high variability (Guidi-Rontani et al., 2010). Although in Japan this species is
regarded as toxic, in the near Korea, in New Zealand and in the North Sea no F. japonica
blooms have been associated with fish mortality (Cho et al., 1999a,b), an aspect that contrasts
with the results of experimental studies performed on isolates from New Zealand, South
Carolina and Germany, which evidenced mortality effects on fish (Khan et al., 1996; Bridgers
et al., 2004). Different effects of the New Zealand and Japanese isolates on Artemia salina
were described by Rhodes et al. (1993), the first being non-toxic and the second one causing
acute distress to Artemia. Cho et al. (1999b) tested the same F. japonica strains for
neurotoxicity, by mouse bioassay and neuroblastoma assay and both were non-toxic to mice.
A recent comparative study on the haemolytic activity of cell extracts of USA, Japan,
Australia, New Zealand, the Netherlands and Germany strains was conducted by de Boer et
al. (2009). They found that between 7% and 89% of the haemolytic activity was attributed to

34
the PUFAs and that other light-dependent haemolytic compounds were mainly involved in the
activity of those strains with the highest haemolysis values.
Despite the attention to their toxicity, the toxic mechanism of the raphidophytes is still
unclear. PUFAs were mostly claimed as the cause of haemolytic effects and fish mortality
together with reactive oxygen species (ROS) production (Mostaert et al., 1998; Marshall et
al., 2002; Fu et al., 2004a,b). Marshall et al. (2003) investigated the ichthyotoxicity of
Chattonella marina and postulated that free fatty acids in combination with high levels of
ROS damaged gill membranes, resulting in fish mortality. Fish exposed to Chattonella sp.
reported a decrease in oxygen partial pressure of arterial blood, as earliest physiological
disturbance, while ROS produced by this flagellate may induce excessive secretion of mucus
on gill surface; thus the toxic effect of Chattonella sp. on fish may be due to a decrease of O2
transfer, resulting in asphyxia (Oda et al., 1997). In addition, the lipooxygenase-promoted
oxidative cleavage of PUFAs can generate highly reactive aldehydes. One of these secondary
oxidation products is malondialdehyde (MDA), which has been inferred to have mutagenic
and cytotoxic effects. Therefore, MDA is considered a good tracer of the involvement of free
radical damage in pathologies associated with oxidative stress (Seljeskos et al., 2006).
Since the toxicity of F. japonica is still under debate and its effects highly dependent on the
strains, the aim of this study was 1) to define the potential toxicity of Adriatic strains which
were never investigated before and 2) to understand the involvement of fatty acid and ROS in
toxicity. The first purpose was achieved by analyzing the presence of toxic compounds
previously found in different strains (brevetoxins, PUFAs, ROS); the second one by
performing toxicological assays with various F. japonica cellular, subcellular and
extracellular fractions and through fish assays and subsequent water and fish gill analyses.
3.1. Resting cysts
The production of resting cysts has been particularly studied for dinoflagellates under many
aspects, such as encystment (Anderson, 1980; Blanco, 1995; Kremp and Heiskanen, 1999;
Garcés et al., 2004), dormancy (Anderson and Keafer, 1987; Montresor and Marino, 1996;
Figueroa et al., 2008) and germination (Binder and Anderson, 1987; Figueroa et al., 2006;
Blanco et al., 2009), which have already been clarified. Cyst strategy allows the survival of
species through adverse conditions and it contributes to increase their spatial distribution
(Anderson and Wall, 1978; Steidinger and Haddad, 1981; Hallegraeff, 1993), as they can
reside in the sediment for a long time and germinate when the environmental conditions
become favourable. Consequently, resting cysts play an important role in the life cycle of

35
many microalgae. The capability of producing resting cysts is also known for several
Raphidophyceae, such as Chattonella spp., Heterosigma akashiwo, F. japonica and
Gonyostomum semen. In Chattonella, it is known that encystment may be affected by
different factors, such as nutrient depletion, adherence to solid surfaces and low light
irradiance (Imai, 1989, 1990; Nakamura and Umemori, 1991; Edvardsen and Imai, 2006). In
Chattonella antiqua and C. marina small pre-encystment cells are produced after meiosis in
nutrient-depleted conditions, and then they can change into resting cysts under low light
conditions (Imai et al., 1998). Smayda (1998) described two distinct benthic overwintering
stages in H. akashiwo: non-motile vegetative cells encapsulated by mucilage and smaller
resting cysts. In the freshwater species G. semen, Figueroa and Rengefors (2006) recently
described the entire life cycle, which includes the formation of both asexual and sexual cyst
stages. On the contrary, knowledge of the life cycle of F. japonica is limited. The first report
about F. japonica cysts is relative to sediments collected in the Inland Sea of Japan
(Yoshimatsu, 1987). The cysts of F. japonica were described as spherical, 15-20 mm
diameter, brown coloured, smooth and without any particular paratabulation or
ornamentation, and lacking a red pigmented body and black spots; these cysts were frequently
observed adhering to diatom frustules (Yoshimatsu, 1987). Subsequently Matsuoka and
Fukuyo (2003) confirmed this description, reporting a similarity with cysts of Chattonella
spp. In experimental conditions, cysts of F. japonica were observed only once by de Boer et
al. (2004), who reported that they were embedded in a brown biofilm; each cyst seemed to
have a membrane-like surface over a smooth scale-like inner layer. Moreover, empty cysts
resembled the statospores of chrysophyte microalgae. These are the only existing descriptions
of F. japonica cysts and there are only a few published images to support studies on their
identification. In addition, while it is well-known that the cysts of F. japonica have dormancy
periods of 2–3 months in sediments, their role in bloom dynamics is unclear, because of the
scarcity of eco-physiological studies on this species (Edvardsen and Imai, 2006).
Cucchiari et al. (2010) reported for the first time F. japonica cysts abundances in natural
sediments in the Mediterranean Sea. PCR-based assay confirmed the presence of F. japonica
cysts in the sediment samples which were analyzed under the microscope and helped in the
species-specific identification. The study demonstrated the presence of these cysts in several
stations of the Marche region, both in areas where blooms occurred and where vegetative cells
were never observed in the water column. Different morphotypes (Fig. 3.1) were observed for
F. japonica cysts: a first morphotype was characterized by a rounded shape, brown-black
colour and was covered by a brown biofilm; while the second was from spherical to slightly
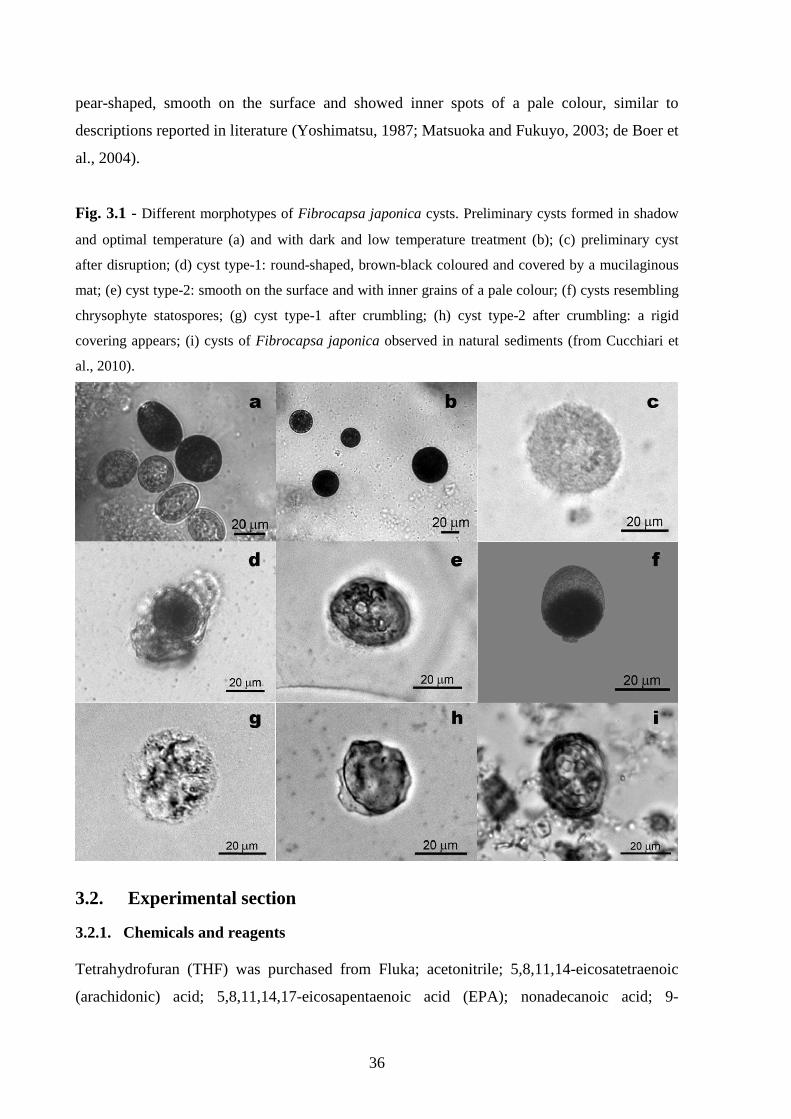
36
pear-shaped, smooth on the surface and showed inner spots of a pale colour, similar to
descriptions reported in literature (Yoshimatsu, 1987; Matsuoka and Fukuyo, 2003; de Boer et
al., 2004).
Fig. 3.1 - Different morphotypes of Fibrocapsa japonica cysts. Preliminary cysts formed in shadow
and optimal temperature (a) and with dark and low temperature treatment (b); (c) preliminary cyst
after disruption; (d) cyst type-1: round-shaped, brown-black coloured and covered by a mucilaginous
mat; (e) cyst type-2: smooth on the surface and with inner grains of a pale colour; (f) cysts resembling
chrysophyte statospores; (g) cyst type-1 after crumbling; (h) cyst type-2 after crumbling: a rigid
covering appears; (i) cysts of Fibrocapsa japonica observed in natural sediments (from Cucchiari et
al., 2010).
3.2. Experimental section
3.2.1. Chemicals and reagents
Tetrahydrofuran (THF) was purchased from Fluka; acetonitrile; 5,8,11,14-eicosatetraenoic
(arachidonic) acid; 5,8,11,14,17-eicosapentaenoic acid (EPA); nonadecanoic acid; 9-

37
hexadecenoic (palmitoleic) acid; 9,12-octadecadienoic (linoleic) acid; 9,12,15-
octadecatrienoic (linolenic) acid; brevetoxin 2, ammonium iron (II) sulphate hexahydrate;
2,6-Di-tert-butyl-4-methylphenol; N,O-Bis(trimethylsilyl)trifluoroacetamide with
trimethylchlorosilane (BSTFA-TMCS 99:1); chloroform; CDCl3; Na2EDTA; pyridine; D-
sorbitol; 1,1,3,3-tetraethoxypropane 97%; 2-thiobarbituric acid (TBA) and xylenol orange
were purchased from Sigma-Aldrich; Na2HPO4.2H2O; ethanol 99.8%; methanol 99.9%;
sulphuric acid 96% and trichloroacetic acid (TCA) were purchased from Carlo Erba. All
chemicals were used without further purification.
3.2.2. Algal cultures
Fibrocapsa japonica cells were isolated by the capillary pipette method (Hoshaw and
Rosowski, 1973) from blooms which occurred in 2004 and 2006 in Emilia-Romagna and
Marche region (Italy) having cell concentrations in the order of 107. After initial growth in
microPlates, cells were kept in sterile Erlenmeyer flasks sealed with cotton at 20°C, during a
16:8 h light–dark period at about 100-110 µmol photons m-2 s-1 from cool white lamps
(McLachlan, 1973).
F. japonica strains were cultured in f/2-Si medium (Guillard, 1975) made with natural
seawater, adjusted at a salinity of 35 through the addition of distilled water, and kept under
the temperature and the light conditions described above. Several of the reported analyses and
assays were conducted using different Adriatic strains isolated in 2004 and 2006 near
Riccione (Emilia Romagna, Italy) and in Palombina (Marche, Italy) and since no significant
differences were evidenced, the results reported in this paper refer to the strain FJAP0603
isolated in 2006 from Palombina. The growth of this strain had been previously characterized
(Cucchiari et al., 2008); the cultures used in the present work showed a slightly lower growth
rate of 0.68 and mean cell biovolumes of 3470 ± 1200 µm3 measured in the stationary phase.
Few experiments were conducted with cell in the exponential phase but most cultures were
collected during the stationary growth phase (day 12-18); differences in cell numbers used for
the different tests are due to the fact that cultures were sometimes concentrated in order to
reach higher cell amounts. Cell counts were made in settling chambers following Utermohl’s
method (Hasle, 1978).
A number of different microalgae were used in the different experiments for comparisons or
as controls. These were: Alexandrium lusitanicum E. Balech, Gonyaulax fragilis (Schütt)
Kofoid, Karenia brevis (C.C. Davis) G. Hansen & Ø. Moestrup, Phaeodactylum tricornutum

38
Bohlin, Protoceratium reticulatum (Claparède & Lachmann) Butschli, Scrippsiella sp.,
Skeletonema marinoi Sarno & Zingone; their origin, strain number and culture conditions are
reported in Table 3.1.
Table 3.1 - Species, strains, isolation details and culture conditions of microalgal species used for the
experiments.
Species Strain Isolation details Temperature
(°C)
Salinity
(psu) medium
Fibrocapsa
japonica FJAP0603
Palombina (AN),
Italy 20 35 f/2-Si
Alexandrium
lusitanicum ALA9501 Trieste, Italy 20 25 f/2-Si
Gonyaulax fragilis GFA0201 Cesenatico (FC),
Italy 20 30 GP
Karenia brevis CCMP2281 Gulf of Mexico,
Florida, USA 20 35 f/2-Si
Phaeodactylum
tricornutum PTN0301
North Sea,
Holland 20 35 f/2
Protoceratium
reticulatum PRA0414
Cesenatico (FC),
Italy 20 35 f/2-Si
Scrippsiella sp. SCA9701 Lido di Dante
(RA), Italy 20 30 f/2-Si
Skeletonema
marinoi CCMP2497
North Adriatic
Sea, Italy 20 35 f/2
3.2.3. Sample extraction and fractionation
Stationary phase F. japonica and K. brevis cultures (1.5-5 mL) were filtered under vacuum
using two different overlapping filters (GF/C Whatman, 1.2 µm and Millipore, 0.45 µm), that
were extracted in a Soxhlet apparatus with methanol-chloroform (50:50). The solution was
concentrated to dryness in a rotavapor at 40°C. The extract was left to cool at room
temperature and weighed, then it was dissolved in methanol (5 mL) and stored at -20°C. An
aliquot of F. japonica extract (3 mL) was dried, resuspended in 50% methanol and passed
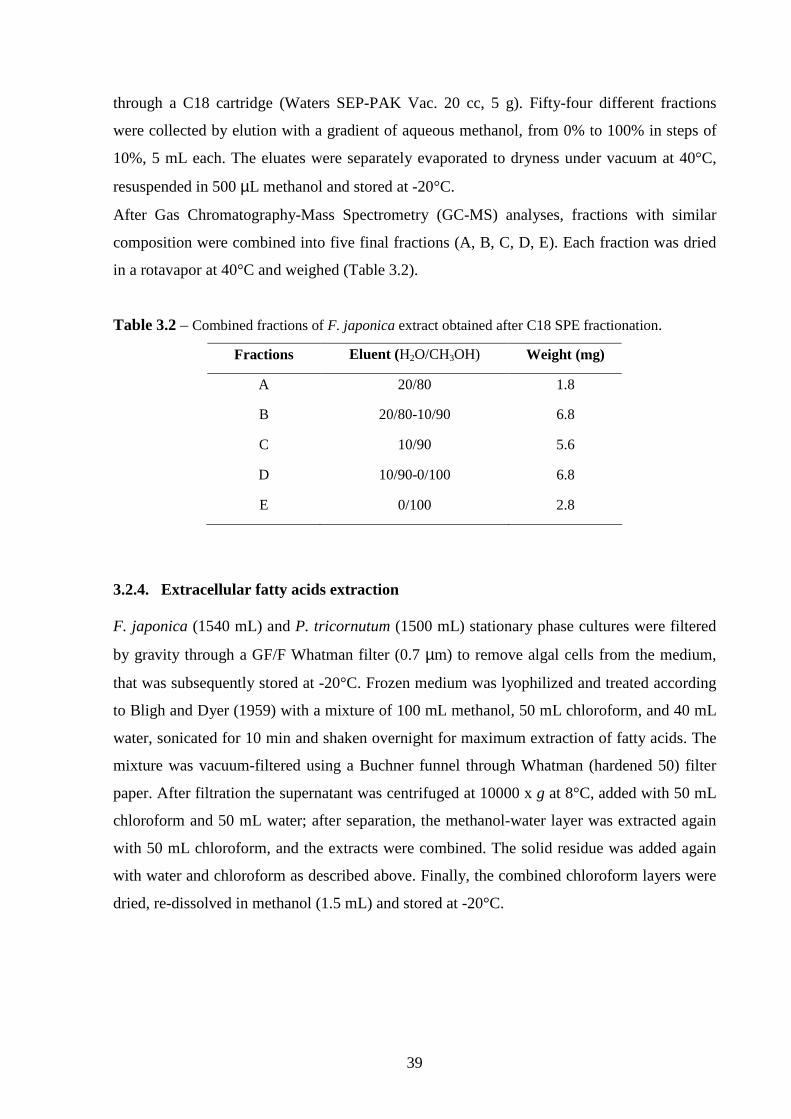
39
through a C18 cartridge (Waters SEP-PAK Vac. 20 cc, 5 g). Fifty-four different fractions
were collected by elution with a gradient of aqueous methanol, from 0% to 100% in steps of
10%, 5 mL each. The eluates were separately evaporated to dryness under vacuum at 40°C,
resuspended in 500 µL methanol and stored at -20°C.
After Gas Chromatography-Mass Spectrometry (GC-MS) analyses, fractions with similar
composition were combined into five final fractions (A, B, C, D, E). Each fraction was dried
in a rotavapor at 40°C and weighed (Table 3.2).
Table 3.2 – Combined fractions of F. japonica extract obtained after C18 SPE fractionation.
Fractions Eluent (H2O/CH3OH) Weight (mg)
A 20/80 1.8
B 20/80-10/90 6.8
C 10/90 5.6
D 10/90-0/100 6.8
E 0/100 2.8
3.2.4. Extracellular fatty acids extraction
F. japonica (1540 mL) and P. tricornutum (1500 mL) stationary phase cultures were filtered
by gravity through a GF/F Whatman filter (0.7 µm) to remove algal cells from the medium,
that was subsequently stored at -20°C. Frozen medium was lyophilized and treated according
to Bligh and Dyer (1959) with a mixture of 100 mL methanol, 50 mL chloroform, and 40 mL
water, sonicated for 10 min and shaken overnight for maximum extraction of fatty acids. The
mixture was vacuum-filtered using a Buchner funnel through Whatman (hardened 50) filter
paper. After filtration the supernatant was centrifuged at 10000 x g at 8°C, added with 50 mL
chloroform and 50 mL water; after separation, the methanol-water layer was extracted again
with 50 mL chloroform, and the extracts were combined. The solid residue was added again
with water and chloroform as described above. Finally, the combined chloroform layers were
dried, re-dissolved in methanol (1.5 mL) and stored at -20°C.

40
3.2.5. Gas Chromatography-Mass Spectrometry (GC-MS) analysis
One or two hundred microlitres of each F. japonica fraction, of algal extract and of the
extracted medium were dried in a rotavapor at 40°C and then added with 100-150 µL Tri-Sil
reagent (BSTFA-TMCS 99:1) at 70°C for 30 min to convert alcohols and carboxylic acids
into the corresponding trimethylsilyl (TMS)-ethers and esters, respectively.
GC-MS analysis was performed on a GC Agilent Technologies 6850 Network GC System
equipped with a capillary column SUPELCO SPB-5 (poly[5%diphenyl/5%dimethyl]siloxane)
(30 m × 0.25 mm × 0.25 µm film thickness), coupled to an Agilent Technologies 5975 inert
Mass Selective Detector operating in electron impact ionization (70 eV).
The oven temperature program was: 50°C for 5 min, heating to 310°C at a rate of 10°C min−1,
and hold at 310°C for 15 min; injector temperature was 250°C and the transfer line 280°C.
High purity helium was used as a carrier gas at a flow rate of 1 mL min−1. A split 1:10
injection mode was applied. Identification of compounds was done by comparison of their
retention times and of mass spectra with authentic standards (Sigma-Aldrich) when possible,
or by comparison of their mass spectra with Nist libraries.
Calibration curves were produced from standard solutions (four different concentrations from
7 to 26 µg L−1) for the following acids: palmitoleic acid (R2 = 0.9768), linoleic acid (R2 =
0.9907), linolenic acid (R2 = 0.9955) and eicosapentaenoic acid (R2 = 0.9946). Nonadecanoic
acid was used as the internal standard. Response factors (RF) obtained from the calibration
curves were used for the quantification of fatty acids in the algal extracts and extracellular
media: for 16:1n-7, 16:1 isomer and 16:2 was used the RF of palmitoleic acid (16:1n-7); for
18:1n-9, 18:1n-7 and 18:2n-6 the RF of linoleic acid (18:2n-6); for 18:3n-6, 18:3n-3 and
18:4n-3 the RF of α-linolenic acid (18:3n-3); for 20:4n-6 and 20:5n-3 the RF of
eicosapentaenoic acid (20:5n-3). RF of 1 was applied for saturated fatty acids.
3.2.6. Liquid Chromatography-Mass Spectroscopy (LC-MS) analysis
LC-MS analyses of algal extracts and of F. japonica fractions were performed by using an
Agilent Technologies HP1100 coupled to an Agilent Technologies MSD1100 single-
quadrupole mass spectrometer equipped with an API-ES chamber. LC separations were
performed on a ZORBAX-Eclipse XDB-C8 Agilent Technologies column with column
temperature of 40°C. The mobile phase consisted of water (A) and acetonitrile (B) in binary
system, with 0.1% acetic acid as an additive. The column gradient was 35% B for 2 min, a
linear gradient to 80% B at 30 min, 95% B at 35 min, hold at 95% for 15 min, return gradient

41
to 35% B at 60 min, and hold for 10 min before the next injection. Sample injection volume
was 5 µL.
The mass spectrometer with an API-ES interface was operated in positive or negative mode.
Tune settings were: drying gas temperature 350°C; drying gas flow 11.5 mL min-1; capillary
voltage 4500V in positive mode and 3500V in negative mode. Mass spectra of the analytes
were acquired in full scan mode in the range m/z 50-2600.
For brevetoxin analyses F. japonica extracts were compared with those of K. brevis, a species
known to produce brevetoxins. The extracts were prepared either as described above or
according to the method described by Abraham et al. (2006).
3.2.7. NMR spectroscopy analysis
One or two hundred microlitres of F. japonica extract or fraction were dried in a rotavapor at
40°C, dissolved in CDCl3 (0.7 mL) and transferred into an NMR tube. 1H NMR spectra were
recorded at 600 MHz with a Varian INOVA 600 spectrometer and compared with a PbTx-2
standard.
3.2.8. Artemia sp. assay
The Artemia sp. assay was performed using the IRSA-CNR (2003) procedure consisting in
both a short- and a long-term test.
Short-term test. It was performed by incubating 10 nauplii in 1 mL sample (put into 24-wells
plate) for 24 h and applied to five different kinds of samples: (I) “live cells”, (II) “lysed cells”,
(III) “extracellular medium” all tested at several concentrations in triplicate, (IV) “combined
algal fractions (A-E)” and (V) “fatty acid standards (18:3n-3, 20:4n-6, 20:5n-3)”. For “live
cells” samples, culture aliquots of F. japonica and of different microalgae (A. lusitanicum, P.
reticulatum, G. fragilis,) used for comparisons, were added to the wells before nauplii
addition. P. tricornutum was used as control. Some assays were conducted with concentrated
cultures obtained by filtering 1.5 L of F. japonica stationary phase culture by gravity through
a GF/C Whatman filter (1.2 µm), in order to reach a high cell density. “Lysed cell” samples
were obtained by sonicating the algal cultures for 3 min and “extracellular medium” samples
by filtering culture aliquots by gravity through a GF/F Whatman filter (0.7 µm) to remove
algal cells. “Algal fraction” samples were obtained by dissolving each dried sample (0.4-1.6
mg) in 2 mL (for duplicate) of seawater at salinity 35 and by sonicating for 3 min. Seawater or
f/2 medium at the same salinity were used as controls.

42
Long-term test. It was performed with three different kinds of samples: “live cells” consisted
of F. japonica culture, “lysed cells” and “extracellular medium” from F. japonica and P.
tricornutum cultures were obtained as already described for the short-term test. The assay was
carried out inside beakers by incubating 10 nauplii in 35 mL of each sample added with 5 mL
P. tricornutum culture to feed the nauplii. Five different concentrations, obtained through
dilution with seawater, and a blank (seawater) were used in triplicate in each experiment.
Effects on the organisms were checked every 24 h up to 96 h.
3.2.9. Vibrio fischeri bioassay
Toxicity to the marine bacterium Vibrio fischeri was measured as inhibition of
bioluminescence using Microtox® equipment and consumables, in accordance with the 90%
basic test for pure compounds protocol (Azur Environmental, 1998). The different algal
cultures (1.5-3 L) were collected in the stationary phase and filtered under vacuum using two
different overlapping filters (GF/C Whatman, 1.2 µm and Millipore, 0.45 µm), that were
extracted in a Soxhlet apparatus with Methanol-Chloroform (50:50). The solution was
concentrated to dryness in a rotavapor system at 40°C. The extract was left to cool at room
temperature and weighed. F. japonica extracts were obtained from 3 L cultures collected at
cell concentration of about 50 x 103 cell mL-1. Each sample for the bioassay was prepared
adding 5 ml of diluent solution (to perform 5 trials of 1 ml each) to a fraction of 5.8-7 mg of
dried algal extract or by adding 3 mL of diluent solution (for 2-3 trials) to an aliquot (0.5-3.2
mg) of the dried algal fraction, obtained as explained above, and sonicating for 20 min. The
endpoint used to establish the concentration-response relationship was the bioluminescence of
the bacteria, measured at each concentration as the ratio between the light emission after 15
min of exposure and the emission at time 0, expressed as a percentage of the same ratio in the
control:
cc II
II
015
015100
where: I0: light emission at time 0; I15: emission after 15 min, Ic: emission of the control
treatment.
3.2.10. Erythrocyte lysis assay (ELA)
ELA was carried out in conformity with Eschbach et al. (2001). Aliquots from stationary
phase cultures of P. tricornutum (5 mL) and F. japonica (15 mL) were centrifuged at 3000 x g

43
for 15 min at 4°C so that growth medium was discarded; algal pellets were resuspended in
ELA buffer (5 mL), obtained according to the method, and sonicated for 1 min on ice. Blood
samples were obtained from adult carps (Cyprinus carpio) kept at the Faculty of Veterinary;
the fish were previously anesthetized with Fenox ethanol (0.02%) then 1 mL blood was drawn
from the caudal fin, added with 1 drop eparin and kept refrigerated. To obtain the erythrocytes
it was centrifuged at 2000 x g for 15 min at 4°C; the pellet was washed twice with ELA buffer
and resuspended in the same to a final concentration of 107 cells mL-1. The absorption of ELA
buffer (blank), of the algal extracts (background value) and of the completely lysed
erythrocytes (maximum absorbance value) was measured at 540 nm. The test was conducted
by incubating 1 mL of erythrocytes with 1 mL of algal extract at 15°C for 20 hours, in the
dark. After incubation, samples were centrifuged at 2000 x g for 5 min, to pellet the intact
erythrocytes, and their absorbance measured at 540 nm. Two replicates of 6 different sample
concentrations (dilutions 1:2), were used in each experiment. Several experiments were
conducted and reported similar results. A solution of saponin standard (2 mg mL-1 in assay
ELA buffer) was used as reference compound, in a concentration series of 1-20 µg mL-1.
3.2.11. Fish bioassay
Sea basses (Dicentrarchus labrax) and sea breams (Sparus aurata) used for the assays were
obtained from the hatchery at Valle Ca’ Zuliani (Pila di Porto Tolle, Rovigo, Italy). Sea
breams were used only in preliminary experiments lasting 7 days to confirm the low toxicity
of F. japonica in at least two different species. After the transfer, the juvenile fish (1.0 ± 0.2
g) were kept in a 60-70 L aquarium, aerated by a small dispenser (Hailea) and acclimated at
room temperature and salinity 35 for two-three weeks. For the experiments, smaller aerated
tanks filled with 1.5 L solution were used and kept at 20°C, in a chamber with a 16:8 h light–
dark period. Duplicate tanks contained the same volumes (1.5 L) of either seawater, f/2
medium or algal cultures (in addition to F. japonica, P. tricornutum and S. marinoi were used
as controls, and the toxic K. brevis for comparison). H2O2 was added in seawater at two final
concentrations (44 and 88 µM) which were daily monitored and adjusted when necessary.
Four juvenile fish were put into each tank and observed for up to 16 days; starting at day 5
they were fed on fish fodder once a day. Fish were considered dead when gill opercular
movements ceased. The assays were repeated three times.

44
3.2.12. H2O2 analysis
Hydrogen peroxide produced by F. japonica cells in culture and during the fish assay was
measured by the method described by Bellincampi et al. (2000). H2O2 concentration in the
filtered culture medium was measured by the FOX1 method, based on the peroxide-mediated
oxidation of Fe2+, followed by the reaction of Fe3+ with xylenol orange. This method is
extremely sensitive and used to measure low levels of water-soluble hydroperoxide present in
the aqueous phase. To determine the H2O2 concentration, 500 µL of the incubation medium
were added to 500 µL of assay reagent. Absorbance of the Fe3+-xylenol orange complex was
detected after 45 min at 560 nm. Standard curves of H2O2 were obtained for each independent
experiment by adding variable amounts of H2O2 to 500 µL of basal medium mixed to 500 µL
of assay reagent. Data were normalized and expressed as fmol H2O2 per cell.
3.2.13. HPLC determination of malondialdehyde (MDA)
Solutions: 500 mg L−1 2,6-Di-tert-butyl-4-methylphenol (BHT) in methanol; 20 mM
tetraethoxypropane (TTEP) in ethanol; 28 mM 2-thiobarbituric acid (TBA), in distilled water;
6% TCA solution with 1.34 mM EDTA, in distilled water; Na2HPO4 buffer, 5 mM with 0.7%
THF, pH 7.0 in distilled water.
Free MDA reacts with TBA to form the pink condensation product MDA-TBA that can be
measured spectrophotometrically (λmax = 532 nm). The analysis was adapted for HPLC to
separate MDA from TBA byproducts (Draper et al., 1993; Espinosa-Mansilla et al., 1993) as
described by Rijstenbil and Gerringa (2002), so that chromatograms show a single well
defined peak of the MDA-TBA adduct, with no interference. A calibration curve was made
with TTEP diluted in TCA solution, at concentrations of 0, 2.5, 5, 10, 15 µM; MDA-TBA is
stoichiometrically formed from TTEP in an acidic environment. The standard curve generated
with TTEP standard from 0 to 15 µM resulted linear, with a correlation coefficient R2 =
0.9755.
Sea bass gills were extracted from the frozen fish, which had been immediately weighed and
put at -80°C after death. Fish gills used as controls were obtained from live fish, which had
been exposed to P. tricornutum or seawater, sacrificed for the experiment and kept at -80°C
until analysis. Gill homogenates were prepared by mixing 100-350 mg of fish gills with 1 mL
cold TCA solution and 40 µL BHT solution to prevent autoxidation and sonicating on ice for
3 min. After sonication the homogenate was kept in a heating cabinet at 100°C for 30 min and
then centrifuged at 14000 x g in a refrigerated centrifuge for 20 min at 4°C. Sample

45
supernatant (~0.9 mL), a volume of standard, or pure TCA solution (blank) was transferred in
a 2-mL Eppendorf with a small hole in the lid, and a same volume of 28 mM TBA solution
was added; the mixture was vigorously agitated on a vortex, and placed at 100°C for 30 min.
After cooling, samples were immediately used for analysis.
HPLC analysis was performed using an HPLC system (Perkin Elmer) consisting of a 250
binary LC pump equipped with a C18-column (Luna, 5 µm, 250 x 4,6 mm) and series 200
Diode Array Detector; 20 µl of each blank, standard or sample were injected. The MDA–TBA
complex was eluted with an isocratic mixture of 85% 5 mM sodium phosphate buffer (pH 7)
containing 0.7% THF, and 15% acetonitrile at a flow rate of 1 mL min-1. MDA concentrations
are expressed in µmol MDA kg-1.
3.2.14. Data analysis
The 50% effect concentration (EC50) of each sample for the V. fischeri assay was estimated by
fitting the experimental concentration-response curves to a logistic model:
b
EC
x
ay
+=
501
where: y = endpoint value; x = substance concentration; a = expected endpoint value in
absence of toxic effect; b = slope parameter. The parameters of the equation, including the
EC50, were estimated using the non-linear regression procedures implemented in Statistica
(Statsoft, Tulsa, OK, USA). An independent estimate of EC50 was obtained for each of the
experiments.
Values for H2O2 and MDA levels were compared using an ANOVA. The assumption of
homogeneity of variances was tested by Cochran’s C test. When required, data were
transformed to attain homogeneity of variances. Whenever a significant difference for the
main effect was observed (P<0.05), a Newman-Keuls test was also performed.
3.3. Toxicity evaluation of Fibrocapsa japonica from the Northern
Adriatic Sea
3.3.1. Artemia sp. assay
Short-term test. Since in preliminary tests with live cells no toxic effects were recorded at any
F. japonica concentration reached in culture, either in the exponential or in the stationary

46
phase, cultures were successively concentrated in order to reach a higher cell number (max
concentration: 321.71 x 10³ cells mL-1). After 24 h in F. japonica concentrated culture the
nauplii appeared inactive but still alive, while those incubated with P. tricornutum displayed a
normal motility. The Artemia sp. assay is generally based on the evaluation of a mortality
effect on nauplii; however in our tests the organisms rather than dying showed abnormal
movements, including swimming slowly, rotating fast around one fixed point or
immobilization (organisms still alive but unable to swim). The inactivation percentage was
directly related to the algal cell density. The EC50 value obtained considering the
immobilization percentage was 241.91 ± 49.21 x 10³ cells mL-1. The inactivation effect
produced by F. japonica was compared with the effect exerted by different microalgae; thus,
the harmful species A. lusitanicum (max concentration: 32.92 x 10³ cells mL-1), P. reticulatum
(max concentration: 11.61 x 10³ cells mL-1) which produce saxitoxins and yessotoxins,
respectively, and G. fragilis (max concentration: 5.36 x 10³ cells mL-1), which releases large
amounts of polysaccharides, were used for comparison. Contrarily to F. japonica all these
species caused nauplii mortality after 24 h. The EC50 values obtained were 15.10 ± 8.81, 5.93
± 0.97, and 0.81 ± 0.28 x 10³ cells mL-1, respectively.
The Artemia sp. assay was also performed with: F. japonica lysed cells, extracellular medium,
the five combined fractions (A-E) from the extract fractionation and three fatty acid standards
at different concentrations. The first two kinds of samples did not affect nauplii viability,
while the mortality results obtained with the latter two are shown in Table 3.4. As reported,
the fractions B and C were the most toxic; both these fractions contained PUFAs and, in
particular, fraction C presented high levels of 20:5n-3 (EPA), 20:4n-6 (AA), 18:4n-3 (OTA),
and 18:3n-3 (Table 3.3). When three of these PUFAs were tested separately as purified
standards, the relationship between mortality effect and concentration was different for the
various compounds; in particular, EPA (20:5n-3) appeared as the most toxic, causing 80%
nauplii mortality at 50 µg mL-1.
Long-term test. Contrarily to what observed in the short-term test, a lethal effect of F.
japonica live cells on Artemia sp. was observed in the long-term assay, even after 24 h
exposition. In this assay, the same number of Artemia nauplii were incubated in a high
volume (35 mL) of culture (max concentration: 80 x 103 cells mL-1) thus being exposed to a
lower cell concentration per mL but to a higher total cell number than in the short-term assay.
The EC50 values (Fig. 3.2A) showed an increase in mortality with time, reaching a value of
26.42 ± 1.24 x 10³ cells mL-1 after 96 h, when no survivors were present in the two highest
concentrations tested (Fig. 3.2B).

47
Table 3.3 - Composition (%) of F. japonica fractions obtained after C18 SPE fractionation.
% Composition of F. japonica fraction
A B C D E
12:0 1.7 0.2
14:0 2.3 33.3 DNQ DNQ
16:0 DNQ 0.6 75.9 DNQ
16:1 2.7
16:2 0.5
18:0 2.3 0.5 2.9 DNQ
18:1 21.2
18:2n-6 2.4
18:3n-6 (γ) 2.6
18:3n-3 (α) 5.0
18:4n-3 7.9 8.5
20:4n-6 6.4
20:5n-3 36.8
β sitosterol 99.9
arabinofuranose 99.9 18.7
D-ribofuranose DNQ 2.4
D-eritrotetra furanose 55.4
D-fructose 3.9
inositol 5.4 0.2
glicerol 0.4
DNQ = Detected Not Quantified
The diatom P. tricornutum, used in the assay as a control, did not show toxic effects on
Artemia sp. even at a high cell density (3.92 x 10⁶ cells mL-1) and the same result was reported
when testing the filtered algal media of the two microalgae used or the f/2 medium alone.
Sonicated P. tricornutum and F. japonica cultures were also tested in order to evaluate the
effects of dead and lysed cells. On testing 35 mL of lysed F. japonica cells at the same
maximum concentration used before, nauplii mortality occurred more quickly than with live
cells, while P. tricornutum did not exert any lethal effect (data not shown). A summary of the
results obtained in the various toxicological assays is reported in Table 3.5.

48
Table 3.4 - The effect on Artemia nauplii of the different algal fractions and fatty acid standards after
24 h (short-term test).
conc (µg/mL) % mortality
A 300 35
B 800 100
C 500 100
D 400 0
F. japonica fractions
E 400 0
control seawater - 0
18:3n-3 100 10
18:3n-3 500 90
20:4n-6 10 10
20:4n-6 143 50
20:5n-3 50 80
PUFAs
20:5n-3 500 90
Fig. 3.2 – A) The 50% effect on Artemia nauplii (EC50) due to Fibrocapsa japonica live cells during
a long-term test (24-96 h). Each value is expressed as mean ± SE. EC50 values considered mortality
effects on organisms. B) Relationship between the concentration of F. japonica and the effect on
Artemia nauplii, after a 96 h exposure (long-term test).
0 20000 40000 60000 80000
0
2
4
6
8
10
24 48 72 960
20000400006000080000
100000120000140000160000
(A)
EC
50 (c
ell m
L-1 )
Time (h)
(B)
Concentration (cell mL-1)
n° s
urvi
vors

49
Table 3.5 – Summary of the toxicological assays with F. japonica performed in this study, reporting
sample characteristics, the effect obtained and relative EC50 values. Y or N: presence or absence of a
toxic effect.
EC50 (cell mL-1) Test Sample Growth phase Toxic effect
FJAP0603
medium exponential / stationary N
live cells exponential N
live cells stationary (concentrated) Y 241 910
Artemia sp.
(short-term)
lysed cells exponential / stationary N
medium stationary N
live cells stationary Y 26 420 Artemia sp.
(long-term) lysed cells stationary Y nd
Vibrio
fischeri extract stationary Y 1 030
ELA lysed cells stationary Y 5 190
Sea bass live cells stationary Y nd
nd = not determined
3.3.2. Bacteria bioluminescence
The marine bacterium V. fischeri exposed to F. japonica extract (max concentration: 1.04 mg
mL-1) showed inhibition of the natural luminescence (Fig. 3.3), which is indicative of an
impaired metabolism. Extracts of different algae (max concentrations: Scrippsiella sp. 1.26
mg mL-1, P. tricornutum 1.26 mg mL-1, P. reticulatum 1.04 mg mL-1) were tested in order to
have a quantitative measurement of the effects exerted on bacteria by various microalgal
extracts (Fig. 3.3). EC50 values obtained showed a strong bioluminescence inhibition testing
F. japonica extract, while the other microalgae decreased bacteria metabolic activity only at
higher extract concentrations. These results are reported in Table 3.6, where the EC50 values
are expressed either as µg extract or as corresponding cell concentration. The result didn’t

50
change even considering the great difference in cell sizes and calculating the EC50 on a
biovolume basis (data not shown).
Fig. 3.3 - Relationship between the concentration of different algal extracts and the bioluminescence
of Vibrio fischeri, after a 15 min exposure.
0 200 400 600 800 1000 12000
20
40
60
80
100
120
0 200 400 600 800 1000 12000
20
40
60
80
100
120
0 200 400 600 800 1000 12000
20
40
60
80
100
120
0 200 400 600 800 1000 1200
0
20
40
60
80
100
120
P. tricornutum
F. japonica
Bio
lum
ines
cenc
e (%
)
Scrippsiella sp.
Concentration (mg L-1)
P. reticulatum
4 th trial
5 th trial
3 rd trial
1 st trial
2 nd trial

51
Table 3.6 - The 50% effect concentrations (EC50) of different algal samples expressed either as
extract or cell concentrations for Vibrio fischeri in a 15 min inhibition of bioluminescence test. The
reported values are means ± SE of two to five independent trials. Values refer to mL extract.
EC50
extract (µµµµg mL-1) concentration (103 cell mL-1)
F. japonica 9.5 ± 6.2 1.03 ± 0.67
Scrippsiella sp. 164.0 ± 52.9 42.88 ± 13.83
P. tricornutum 264.1 ± 43.9 1520.87 ± 228.63
P. reticulatum 293.4 ± 44.1 51.20 ± 8.51
Fig. 3.4 - The 50% effect concentrations (EC50) of different algal fractions for Vibrio fischeri in a 15
min inhibition of bioluminescence test. The reported values are means ± SE of two trials.
A B C D E0
20406080
100120140160180200
EC
50 ( µµ µµ
g m
L-1)
F. japonica fractions
3.3.3. Haemolysis of Cyprinus carpio erythrocytes
The ruptured cell suspension of F. japonica (max concentration: 75 x 103 cells mL-1 ELA
buffer) produced haemolytic activity for C. carpio erythrocytes. The percentage of haemolysis
increased with cell density (Fig. 3.5), giving an EC50 value of 5.19 ± 0.59 x 10³ cells mL-1. P.
tricornutum cells showed no haemolytic activity even at a high cell density (max
concentration: 2.50 x 10⁵ cells mL-1 ELA buffer), reaching a maximum haemolysis percentage
of 13.5%. Results were not different even considering the biovolumes of the two microalgae.
Saponin standard was used to conduct the assay with a chemically defined haemolytic agent
and the obtained EC50 value was 1.42 ± 0.03 µg mL-1.

52
Fig. 3.5 - Haemolytic activity of the ruptured cell suspensions of Fibrocapsa japonica and
Phaeodactylum tricornutum.
0 40000 80000 120000 200000 250000
0
20
40
60
80
100
120 F. japonica P. tricornutum
Hae
mol
ysis
(%)
Concentration (cell mL -1)
3.3.4. Effect of Dicentrarchus labrax exposition to Fibrocapsa japonica
Fish mortality
In the first week of exposure, no sea bass or sea bream mortalities occurred in the tanks where
fish were exposed to F. japonica culture. In successive experiments sea bass was exposed to
about 50 x 103 cells mL-1 for a longer period during which algal cell number did not change,
as evidenced through daily counting (data not shown). After 8-9 days fish started to show
abnormal behaviour and inability to maintain a correct position in the water column, then at
day 10 began to die, and by the 11th day all the sea basses were dead. Dead fish were
immediately put at -80°C. In the tanks with control algae (max concentrations: P. tricornutum
3.51 x 10⁶ cells mL-1, S. marinoi 1.70 x 10⁶ cells mL-1) and in those with 44 and 88 µM H2O2
they were all alive and maintained a normal behaviour till the end of the experiment (Fig.
3.6). An observation made under the light microscope of the gills of fish exposed to F.
japonica culture revealed that gill tissue was damaged and covered with mucus substances,
which might had interfered with O2 transfer (Fig. 3.7). Fish were also exposed to K. brevis
(max concentration: 1.17 x 10³ cells mL-1), in order to evaluate the sea bass resistance to a
microalga which produces brevetoxins. After 5 h from the beginning of the exposure, fish in
the tanks with K. brevis culture began to die and 21 h later they were all dead.

53
Fig. 3.6 - Toxicity of different microalgae and H2O2 for the fish (Dicentrarchus labrax). Results refer
to a single experiment and the cell concentrations used are indicated. Time is expressed as hours (h)
and days (d).
Fig. 3.7 – Gills of the controls (A) and of fish exposed to F. japonica culture (B) observed under the
light microscope. Fish tested with the Raphidophyceae revealed that gill tissue was damaged and
covered with mucus substances.
ROS analysis
ROS analysis revealed an increase in H2O2 produced by F. japonica in the tanks where the
fish assays were conducted, while no effects were observed in tanks containing P. tricornutum
(Fig. 3.8). The initial H2O2 concentration measured in F. japonica medium was 1.15 µM,
which corresponded to 22.60 fmol cell-1 (day 1) and reached a value of 18.39 µM,
corresponding to 361.75 fmol cell-1, at day 9 (data not shown), when the maximum H2O2
concentration was measured (Fig. 3.8). Nine days represented the period after which the fish
began to die and, on this day, values measured in the tanks were about 16-fold and 1.4-fold
A B

54
higher than on day 1 in the tanks with F. japonica and P. tricornutum, respectively. ANOVA
analysis showed that the differences observed for the two microalgae were significant
(P<0.001). The H2O2 concentration in P. tricornutum medium was rather constant during the
assays, with values of 5.64-7.93 µM at day 1 and 9, respectively, which corresponded to 4.27
and 6.01 fmol cell-1.
Fig. 3.8 - Concentration of H2O2 during the sea bass test in the tanks where fish were exposed to
Fibrocapsa japonica (Fj) and in the control tank with Phaeodactylum tricornutum (Pt). Each value is
expressed as log10 of the concentration detected.
1 3 5 7 91
10
100
1000 Pt Fj
H2O
2 (fm
ol c
ell-1
)
day
Fish gills analysis
Quantification of MDA, which is a marker for oxidative damage, was performed in the fish
gills. The MDA values ranged from 55.97 to 82.43 µmol MDA kg-1, while in the controls the
mean value reported was 5.10 µmol MDA kg-1. Results of statistical analysis indicated that
the MDA content in the gills of the exposed fish was significantly different (ANOVA,
P<0.05) from that of the controls.
3.4. Chemical characterization
3.4.1. Brevetoxin analyses
The search for brevetoxins was carried out by both NMR and LC-MS analyses. 1H-NMR (600
MHz, CDCl3) spectrum of the PbTx-2 standard showed some characteristic peaks, in
particular δ 9.52 (s, 1 H, CHO), 5.78-5.75 (m, 2 H, CH=CH), 5.73 (s, 1 H, =CH), 4.26 (d, 1
H, OCHC=), 2.66 (bs, 1 H, OH). These peaks were not evidenced in any of the spectra
realized with F. japonica extracts and fractions.

55
Table 3.7 – Fatty acid composition (expressed per cell) by GC-MS analysis of F. japonica and P.
tricornutum extract and extracellular medium.
Cellular fatty acids Extracellular fatty acids
Fatty acid F. japonica P. tricornutum F. japonica P. tricornutum
(pg/cell) (fg/cell)
12:0 nd nd 3.70 0.04
14:0 22.50 0.090 7.70 0.09
16:0 16.64 0.118 35.55 0.36
16:1n-7 1.00 0.252 nd nd
16:1isomer 1.35 0.019 nd nd
16:2 nd 0.046 nd nd
18:0 0.93 0.005 13.57 0.15
18:1n-9 2.98 0.005 1.66 0.05
18:1n-7 3.36 nd nd nd
18:2n-6 1.10 0.005 nd nd
18:3n-6 (γ) 0.89 nd nd nd
18:3n-3 (α) 1.80 nd nd nd
18:4n-3 7.94 nd nd nd
20:4n-6 2.51 nd nd nd
20:5n-3 13.33 0.259 nd nd
22:6n-3 nd nd nd nd
Tot PUFAs 27.57 0.309 nd nd
Tot 76.34 0.799 62.19 0.68
Chemical names and notations: dodecanoic acid (12:0, lauric acid); tetradecanoic acid (14:0,
myristic acid); hexadecanoic acid (16:0, palmitic acid); 9-hexadecenoic acid (16:1n-7,
palmitoleic acid); hexadecenoic acid (16:1); 9,12-hexadecadienoic acid (16:2n-4);
octadecanoic acid (18:0, stearic acid); 9-octadecenoic acid (18:1n-9, oleic acid); 11-
octadecenoic acid (18:1n-7, vaccenic acid); 9,12-octadecadienoic acid (18:2n-6, linoleic acid,
LA); 6,9,12-octadecatrienoic acid (18:3n-6, γ-linolenic acid, GLA); 9,12,15-octadecatrienoic
acid (18:3n-3, α-linolenic acid, ALA); 6,9,12,15-octadecatetraenoic acid (18:4n-3, stearidonic
acid, OTA); 5,8,11,14-eicosatetraenoic acid (20:4n-6, arachidonic acid, AA); 5,8,11,14,17-
eicosapentaenoic acid (20:5n-3, EPA); 4,7,10,13,16,19-docosahexaenoic acid (22:6n-3,
DHA).
nd = not detected

56
The LC-MS ion chromatogram of K. brevis extracts revealed the presence of a peak (RT
24.029) with a product ion spectrum of m/z 895.8 (MH+) corresponding to PbTx-2, that is the
most widespread algal brevetoxin. At the same retention time no peak was found in the ion
chromatogram of F. japonica extracts and fractions. In any case, no peak characterized by the
presence of ion m/z 895.8 could be detected.
3.4.2. Analysis of fatty acid composition of Fibrocapsa japonica and Phaeodactylum
tricornutum cell extract and extracellular culture medium
The cellular fatty acid profile of both F. japonica and P. tricornutum, determined by GC-MS
analysis, is presented in Table 3.7. In F. japonica, four major components were found, the
level of each being 10.40–29.48% of the total fatty acids. These four components were the
saturated fatty acids 14:0, 16:0 and the polyunsaturated acids 18:4n-3 and 20:5n-3. The minor
components represented 1.16–4.40% of the total fatty acids and consisted mainly in
unsaturated fatty acids.
P. tricornutum is a diatom known for its high content in PUFAs, in particular 20:5n-3; it was
never found to affect other organisms and is widely used as food in aquaculture. Therefore, in
this study it was used as control, and analyzed to compare its fatty acid profile with that of F.
japonica. The fatty acid profile of P. tricornutum revealed the expected high amount of
20:5n-3 (32.41%), while the presence of PUFAs with 18 carbon atoms was low or below the
detection limit. Data are expressed as pg/cell thus emphasizing the largely different fatty acid
content of the two algae; by taking into account the 50-fold smaller biovolume of P.
tricornutum, the 20:5n-3 content per biovolume unit of the two algae is quite similar while the
total PUFAs amount is two-fold higher in F. japonica.
The two species were compared also in their extracellular fatty acid profile which is presented
in Table 3.7. Only five fatty acids were found in the medium of F. japonica; they were the
saturated acids 12:0, 14:0, 16:0, 18:0, and the mono-unsaturated 18:1n-9, the latter
representing 2.67% of the total fatty acids. Almost the same profile was obtained for the P.
tricornutum extracellular medium. None of the PUFAs detected within the cells was found in
either of the extracellular media.
3.4.3. Analysis of Fibrocapsa japonica fractions
The fifty-four TMS-fractions obtained by chromatographic separation of the algal extract
were combined, as described in the experimental section, in five final fractions (A-E) which
57
were used for subsequent toxicity assays. The composition of each fraction is reported in
Table 3.3. Two samples contained mostly PUFAs, in particular, fraction B had about 8% of
18:4n-3, while fraction C contained 18.5% of PUFAs with 18 carbon atoms, 6.4% of 20:4n-6
(AA) and a high amount (36.8%) of 20:5n-3 (EPA). In the other fractions (A, D, E) sugars,
saturated fatty acids or β-sitosterol were present.
3.5. Development of LC-MS methods for Brevetoxins (BTXs)
Microalgae belonging to the Raphidophyceae, Fibrocapsa japonica, Heterosigma akashiwo
and Chattonella spp., have been documented as ichthyotoxic and causing massive fish
mortality events mostly in the Seto Inland Sea of Japan (Iwasaki, 1971; Okaichi, 1972; 1989;
Toriumi and Takano, 1973). Since the production of brevetoxins is one of the major factors
which had been proposed for the ichthyotoxicity of these raphidophytes (Khan et al., 1996),
together with reactive oxygen species (ROS) (Oda et al., 1997, Marshall et al., 2003),
haemolytic compounds such as PUFAs (Fu et al., 2004a), and mucocyst ejection (de Boer et
al., 2004), in this thesis the presence in algal extracts of these raphidophytes of some of the
known brevetoxins was investigated. To achive this aim, rapid and sensitive methods to
analyze brevetoxins in algal extracts were developed. This work was performed in the
laboratory of the Dr. Michael Quilliam at the National Research Council, Institute for Marine
Biosciences (NRC-CNRC), in Halifax (Canada).
3.5.1. Bioassay and chemical analytical methods for the toxin determination
Methods for the determination of toxins may be divided into assay and chemical analytical
methods. In assay methods, the measured signal is either a specific response to a single toxin
structure or an integration of responses to several structures in a group. In order to use the
assay result for evaluating seafood safety, it is most useful if the response correlates with
overall toxicity. On the other hand, in a chemical analytical method, signals corresponding to
individual toxin structures are measured. Most analytical methods are based on
chromatography which allows the separation and detection of several toxins in one analysis.
Calculation of individual toxin concentrations requires accurate standards to calibrate the
responses, and evaluation of seafood safety further requires specific toxicity data.
The most common assay to check for the presence of toxins is the mouse bioassay (MBA).
For over 50 years, this assay has been used successfully in inspection programs to monitor for
PSP toxins, which are easily extracted into an acidic aqueous solution suitable for direct

58
injection (Stephenson et al., 1955; AOAC International, 2000). One of the problems with the
method is that the inherent variability can exceed ±20%, compared to most chemical
techniques that have uncertainties less than 10%. Major disadvantages of using the MBA for
the detection of toxins are the lack of specificity (no differentiation between the various
components of a group), subjectivity of death time and maintenance of laboratory animals.
Additionally, the MBA is time consuming, does not provide appropriate detection limits for
some toxins (e.g., yessotoxins, okadaic acid and DTX esters, azaspiracids) and may give
‘false positive’ results because of interferences by other compounds (Combes, 2003).
Notably, hydrophilic toxins belonging to the amnesic and paralytic shellfish poisoning
groups, free fatty acids (Lawrence et al., 1994) and bioactive spiroimines (e.g., spirolides and
gymnodimines; Gill et al., 2003) have been shown to be toxic to mice. Within the EU, it is a
requirement to take all steps to refine, reduce and replace (3R’s), the use of animals used in
bioassays and scientific experiments under Directive 86/609/EEC. To this aim, the European
Centre for the Validation of Alternative Methods (ECVAM) met to consider the 3R’s
approach to shellfish toxin testing. The results of the deliberations of the working group are
available (Hess et al., 2006); it was suggested that immediate possibilities for implementation
of the 3R’s include the use of liquid chromatography–mass spectrometry (LC–MS) methods
for the detection of toxins.
Finally, since several countries have banned animal bioassays due to protests by animal rights
groups, there is considerable pressure to develop alternative methods.
A number of alternative assay methods have been developed (Van Dolah et al., 2001). These
include in vitro cell toxicity assays, receptor protein assays, and immunological assays.
Despite their potential for speed, high sensitivity and low cost, there are some limitations
associated with such methods. Since receptor assays are usually based on radioactive tracers,
they are restricted to specially equipped laboratories. Immunoassays generally cannot be used
for the precise quantitative analysis of samples containing families of toxins that have variable
levels of individual toxin. Antibodies for such assays are initially developed for single toxins
but can have varying degrees of cross-reactivity towards toxins of similar structure. Although
assays are excellent for screening out negative samples, it is generally recognised that positive
results should still be confirmed by chemical methods.
Chemical methods of analysis have the potential for sensitive, precise and fully automated
quantization of known toxins, as well as confirmation of identity. Methods based on
chromatographic and spectroscopic techniques are particularly well suited for the
identification of new toxins. It should be noted that there are many challenges to overcome

59
before it is possible to fully implement any chemical method into comprehensive monitoring
programs and research studies.
All members of a toxin class must be well characterised in terms of structure, and although
considerable information on the structures of toxins that can contaminate shellfish has been
accumulated, the situation becomes more complicated with the frequent discovery of new
toxin analogues and even new toxin classes. In addition, toxins produced by a particular
microalgal species may be transformed in shellfish to metabolites, some toxic and others non-
toxic. This is certainly a complicating factor in the development of methods and indicates a
need to continue research on the identification of new toxins. Accurate and readily available
calibration standards are required for each of the various toxins. This has always been a major
stumbling block in shellfish toxin research and monitoring, and much more effort has to be
put into the development of reference materials and standards. The specific toxicity of
individual toxins must be determined to allow calculations of overall toxic potential of
samples. Risk assessment studies also need to be conducted to establish allowable levels of
toxins in seafood. Finally, robust methods must be developed and validated for various
shellfish tissues. They must provide adequate detection limits (µg kg-1 levels) and accurate
quantitation of all individual toxin analogues within a toxin class.
Many specific analytical methods have already been developed for individual toxins or toxin
groups. Although there are some difficulties with the technique (i.e. most of the toxins do not
possess a chromophore for sensitive UV absorbance or fluorescence detection) liquid
chromatography has proven to be the most valuable instrumental analytical tool for toxins
because it is well suited to the analysis of polar, non-volatile compounds. It provides excellent
quantitative precision and is easily automated.
3.5.2. Liquid chromatography–mass spectrometry
Since the 1970s the mass spectrometer not only provided molecular mass and structural
information, but could also act as a very sensitive and selective detector for quantitative
analysis of complex mixtures. Through the 1980s, many efforts were made to achieve the
same success obtained with the combination of gas chromatography and mass spectrometry
(GC–MS) also with the combination of LC and MS. Early LC–MS interfaces such as
thermospray ionisation and continuous-flow fast atom bombardment were only partially
successful. The former was only applicable to thermally stable molecules with medium
polarity, while the latter was very difficult to implement on a routine basis.

60
In 1984, a breakthrough came with the development of electrospray ionisation (ESI)
(Yamashita and Fenn, 1984), which is well suited to compounds of widely ranging polarities
and is easily implemented. Immediate success was achieved with the application of LC–ESI-
MS to marine toxins using the first commercial mass spectrometer from SCIEX in 1989
(Quilliam et al., 1989). Due to its high sensitivity, specificity and selectivity, LC–MS quickly
became the preferred method for the confirmatory analysis of all known toxins (Quilliam,
1998; Quilliam et al., 2001). Recently, effort has been directed towards finding mobile phases
and columns that would be suitable for the simultaneous separation and detection of a wide
range of toxins, in both plankton and shellfish samples (Quilliam et al., 2001). One of the
most important factors for achieving success in electrospray LC–MS is the choice of mobile
phase. Parameters that affect sensitivity include pH, ionic strength, type of buffer, and
percentage of the organic solvent. A volatile buffer with a low ionic strength (ideally <10
mM) is desirable to prevent a build-up of salts on the sampling orifice of the MS. In addition,
a higher percentage of organic solvent tends to give higher sensitivity with most compounds.
Suitable mobile phases include aqueous methanol or acetonitrile doped with formic acid,
acetic acid, trifluoroacetic acid (TFA), the ammonium salts of these acids, or ammonium
hydroxide. TFA has been very popular because it is easy to use and produces a low pH that
facilitates protonation of most toxins. The latter can be important for the chromatography of
acidic and basic toxins on silica-based supports, as interactions with free silanol sites are
minimized. However, it has been observed that TFA forms strong ion pairs with amines and
this leads to suppression of ionization and reduced sensitivity. Also, TFA cannot be used if
negative ion work is planned on the same day, as it gives a very strong signal due to the
CF3COO- anion which persists in the source for a long time.
3.5.3. Brevetoxins
Brevetoxins (BTXs) are cyclic trans-fused polyether toxins produced by the red tide
dinoflagellate Karenia brevis (Van Dolah, 2000; Pierce et al., 2005). These toxins are broadly
defined as belonging to a lipid soluble group of cyclic polyether compounds with a molecular
weight around 900 amu (Fig. 3.9). Many analogs of brevetoxin have been identified in
cultures of K. brevis, seawater blooms as well as metabolites in shellfish and other marine life
(e.g. Abraham et al., 2006). Most of these analogs were reputed to be biosynthetic products of
either BTX1 or BTX2 as precursors (Baden et al., 2005). Typically in marine waters the
dominant brevetoxin is BTX2 with lesser amounts of BTX1 and BTX3, whereas in marine

61
aerosols BTX3 dominates (Pierce et al., 2005). Recent work by Tester et al. (2008) has shown
though as a K. brevis bloom ages there is a relative increase in the BTX3 compared to the
BTX2 homologues.
These compounds are responsible for massive fish kills, shellfish contamination (NSP), and
respiratory, eye and skin irritations in humans and mammals exposed to contaminated
seawater and aerosols in Florida and the Gulf of Mexico. Available methods for their
detection include bioassays, immunoassays, thin layer chromatography and LC. Since
brevetoxins have weak chromophores, LC with UV detection (at 215 nm) provides low
sensitivity and poor selectivity.
Hua et al. (1996) reported that electrospray LC-MS is a suitable technique for analysis of
these toxins. Under the conditions used (aqueous methanol mobile phase), the positive ion
spectra were dominated by sodiated molecules ([M+Na]+), as well as dimers ([2M+Na]+) and
trimers ([3M+2Na]2+), which is a reflection of the ionophoric nature of these molecules.
Quilliam et al. (unpublished) have investigated the ion spray LC-MS of the brevetoxins, using
an acidified (0.1% TFA) aqueous methanol mobile phase to promote protonation.
It has been already established on-line liquid chromatography (LC)/electrospray ionization
(ESI)-mass spectrometry as a powerful analytical tool to provide relatively rapid quantitative
and structural information concerning brevetoxins, with high sensitivity and low sample
quantity requirements. The strength of the polyether backbone, however, has two major
implications for ESI-MS/MS analyses. First, the polyether structure has a very high affinity
for sodium cations that result in the initial generation of abundant (M+Na)+ ions; second,
when attempting to produce collision-induced dissociations, at least two bonds of the
polycyclic backbone must be broken in order to obtain backbone fragmentations. Thus, it is
difficult to obtain useful product ions in detectable abundances from brevetoxin (M+Na)+
precursor ions during tandem mass spectrometry experiments.
The work presented in this thesis was focused on the development of rapid LC-MS/MS
methods to analyse brevetoxins in algal extracts. In particular, the different aims were: I) to
develop a rapid isocratic method to analysed BTX1, BTX2, and BTX3 in algal samples (e.i
Karenia brevis extracts); II) to develop a gradient method to quantify BTX1, BTX2, BTX3,
BTX-B2, deoxyBTX-B2, and BTX-B5, which was then apply to algal samples obtained from
cultures of Karenia brevis and raphidiphytes (Fibrocapsa japonica, Chattonella subsalsa and
Heterosigma akashiwo) from the Adriatic Sea; III) to develop a method to analyse hand-
picked K. brevis cells by micro-column liquid chromatography-tandem mass spectrometry.

62
3.5.4. Experimental section
Chemicals
Analytical grade acetonitrile (ACN), methanol (MeOH), and formic acid (FA) were purchased
from Caledon (Georgetown, Canada). The brevetoxins (BTXs) certified reference material,
such as CSRM-BTX1 (3.0 µg mL−1), CSRM-BTX2 (6.6 µg mL−1), CSRM-BTX3 (3.6 µg
mL−1), CSRM-BTX-B2 (5. µg mL−1), CSRM-S-deoxyBTX-B2 (5.0 µg mL−1), CSRM-BTX-
B5 (4.3 µg mL−1), was provided by the National Research Council, Institute for Marine
Biosciences (NRC-CNRC, Halifax, Canada). Water was distilled and further purified using a
Milli-Q purification system (Millipore, Billerica, MA, USA) and seawater at salinity 35 was
filtered using 0.22 µm cartridge filters (Harmsco, North Palm Beach, FL, USA).
Fig. 3.9 – Structures of the brevetoxins used for this study
Brevetoxin-2 (BTX2, PbTx2)
Brevetoxin-3 (BTX3, PbTx3)
Brevetoxin BTX-B2
Brevetoxin S-deoxy-BTX-B2
Brevetoxin BTX-B5
Brevetoxin-1 (BTX1, PbTx1)
Algal cultures
A strain of Karenia brevis (CCMP2281) from the Gulf of Mexico (USA) isolated in 1999 was
used in this study. For the experiment, 1000 mL Erlenmeyer flasks containing 550 mL of
sterilized f/2-Si medium (Guillard, 1975) at salinity of 35, were prepared in duplicate.

63
The culture flasks were illuminated at 105-110 µmol photons m-2 s-1 from daylight type cool
white lamps (16:8 h light-dark period), with temperature controlled at 20°C. Every 2-3 days
10 mL culture were collected from each flask, centrifuged at 4000 x g for 5 min and the algal
pellet so obtained was kept at -80°C. Cell counts were made in settling chambers following
Utermohl’s method (Hasle, 1978).
Raphidophyceae Fibrocapsa japonica, Chattonella subsalsa and Heterosigma akashiwo cells
were isolated by the capillary pipette method (Hoshaw and Rosowski, 1973) from blooms
which occurred in 2006 in the Adriatic Sea (Marche, Italy). After initial growth in
microplates, cells were kept in sterile Erlenmeyer flasks sealed with cotton at 20°C, during a
16:8 h light–dark period at about 100–110 µmol photons m-2 s-1 from cool white lamps
(McLachlan, 1973).
These strains were cultured in f/2-Si medium (Guillard, 1975) made with natural seawater,
adjusted to a salinity of 35 through the addition of distilled water, and kept under the
temperature and the light conditions described above.
For the experiment, 4 Erlenmeyer flasks containing 1500 mL culture were used for each
species and collected at the end of the stationary phase (total volume: 6000 mL for each
species) centrifuging at 5000 x g for 10 min. Algal pellets were kept at -80°C.
BTXs extraction
Algal pellets of K. brevis, F. japonica, C. subsalsa and H. akashiwo were extracted using a
methanol solution. Algal pellets were added to 1 mL (for K. brevis) or 2 mL (for
Raphidophyceae) 100% MeOH and sonicated for 2 min in pulse mode, while cooling in an ice
bath. Then the mixture was added to a same volume (1 or 2 mL) 60% MeOH, centrifuged at
5000 x g for 15 min, and the supernatant was decanted. The extract was adjusted to a final
volume of 1.5 or 3 mL for K. brevis or the Raphidophyceae, respectively.
LC–MS analysis
The LC–MS analysis was carried out using an Agilent 1100 series LC system coupled to an
API-4000 triple quadrupole (Applied Biosystems, Foster City, CA, USA) mass spectrometer,
equipped with a Turbo V electrospray ion source (MDS Analytical Technologies, Concord,
Canada). Nitrogen nebulizer gas was set at 50 (GS1, GS2) and heated at 275 °C. A higher
temperature can give somewhat increased sensitivity, but was not used to avoid magnification
of matrix effects (unpublished data). BTXs were detected using selected reaction monitoring
(SRM) with the ion source in positive mode.

64
BTXs quantitation and limit of detection (LOD) measurements were achieved with BTXs
calibration solutions (10-2500 ng mL−1) prepared in 80% MeOH. LOD was measured
statistically by the formula: LOD= [(3 SD)/b]; where “SD” is the standard deviation of
repeated runs of the minimum measurable BTX concentration in a standard solution (n = 5)
and “b” is the slope of the calibration curve. The best transition (bold, in Table 1) was used
for LOD determination.
3.5.5. Optimization of instrumental parameters
In preliminary experiments, instrumental parameters and chromatographic conditions were
optimized. These parameters included source temperature (60-550°C), declustering potential
(DP = 20-90 V), collision energy (CE = 15-60 eV), mobile phase composition (acidic and
neutral), flow rate, and column temperature. Different columns (50 mm X 2 mm i.d.) were
used in the development of the LC-MS methods for BTXs:
− Synergi Fusion RP, 2 µm;
− Thermo Hypersil-BDS-C8, 3 µm;
− Phenomenex LUNA-C18, 3 µm.
In preliminary experiments the mass spectrometer with ESI interface was operated either in
positive and negative mode and reported as best transitions those shown in Table 3.8 for each
compound. ESI+ was subsequently selected as it resulted the best mode to analyze all the
BTXs. The monitored selected reaction monitoring (SRM) transitions as well as the
optimazed declustering potential (DP) and collision energy (CE) are reported in Table 1: m/z
884.6→221.1, m/z 884.6→403.4 and m/z 884.6→850.5 for BTX1; m/z 912.6→877.5, m/z
912.6→473.6 and m/z 912.6→319.3 for BTX2; m/z 897.6→725.5, m/z 897.6→303.4 and m/z
897.6→249.3 for BTX3; m/z 1034.7→929.6, m/z 1034.7→403.4 and m/z 1034.7→249.3 for
BTX-B2; m/z 1018.7→929.7, m/z 1018.7→473.5 and m/z 1018.7→403.4 for deoxyBTX-B2;
and m/z 928.6→299.1, m/z 928.6→473.5 and m/z 928.6→403.4 for BTX-B5.
An abundant [M+NH4]+ ion dominated the spectrum of BTX1 and BTX2, while [M+H] +
resulted the predominant ion in the spectra of all the other BTXs. Fragment ions were
characteristic of these compounds and in accordance with the fragmentation reported for these
reference standards.
The retention that compounds experience on reversed phase HPLC columns is governed by
their lipophilic properties and by the presence of polar or ionic groups, which can interact
with the stationary phase. Moreover, the pH of the mobile phase is an important parameter

65
which can significantly influence the amount of interaction between the toxins and the
stationary phase.
Table 3.8 – MS/MS conditions used for the multiple reaction monitoring (MRM) acquisition to
detect brevetoxins (BTXs). Bold refer to the best transition, which was used for LOD determination.
Analyte ESI mode Transition CE (eV) DP (V)
[M+NH4]+ BTX1 ESI+ 884.6 884.6/221.1 35 60
884.6/403.7 35 60 884.6/850.5 30 60 [M+NH4]+
BTX2 ESI+ 912.7 912.6/877.5 35 50 912.6/473.6 45 50 912.6/319.3 45 50 [M+H]+
BTX3 ESI+ 897.6 897.6/725.5 40 90 897.6/303.4 35 90 897.6/249.3 40 90 [M+H]+
BTX-B2 ESI+ 1034.7 1034.7/929.6 55 90 1034.7/403.4 55 90 1034.7/249.3 70 90 [M-H]- ESI- 1032.7 1032.7/897.5 65 90 1032.7/721.5 70 80 1032.7/525.4 70 90 [M+H]+
deoxyBTX-B2 ESI+ 1018.7 1018.7/929.7 50 90 1018.7/473.5 60 90 1018.7/403.4 60 90
[M-H]- ESI- 1016.7 1016.7/929.4 60 70 1016.7/739.5 65 80 1032.7/525.4 75 90
[M+H]+ BTX-B5 ESI+ 911.7 928.6/299.1 50 40
928.6/473.5 50 40 928.6/403.4 50 40 [M-H]- ESI- 910.6 910.5/739.5* 60 90
910.6/461.4 70 70 910.5/525.4 65 90

66
Therefore, in initial experiments, the three columns were compared using all the six reference
BTX standards (BTX1, BTX2, BTX3, BTX-B2, deoxyBTX-B2, and BTX-B5) under acidic
and neutral mobile phase conditions, in particular these were:
− Acetonitrile (ACN) with 2 mM ammonium formate (HCOONH4) and 50 mM formic acid
(HCOOH);
− Methanol (MeOH) with 5 mM ammonium formate (HCOONH4) and 2.5% isopropanol
(IPA);
− Acetonitrile (ACN) with 5 mM ammonium formate (HCOONH4).
Fig. 3.10 – Separation of brevetoxins (BTXs) standards using the Synergi Fusion RP, the Hypersil C8
and the Luna C18 columns under acidic LC conditions; and the Luna C18 column under neutral
conditions.
Luna C18 - ACN/H+
Synergi Fusion RP - ACN/H+
Hypersil C8 - ACN/H+
Luna C18 - MeOH neutral
Time (min)0 2 4 6 8 10 12 14 16 18 20
F
CBA
C
C
C
B
B
B
E
D
F
A: BTX-B2B: deoxyBTX-B2C: BTX-B5D: BTX3E: BTX2F: BTX1
D
F
F
E
E
E
D
D
A
A
A
As for the mobile phase, ACN/H+ resulted in a better separation of the different brevetoxins
(Fig. 3.10), which eluted already in the first part of the chromatogram. Under acidic
conditions a slightly improved peak shape was obtained for all the BTXs, especially with the
LUNA-C18 as column, and this is in accordance with the methods described far often for the

67
separation of BTXs (Roth et al., 2007; Twiner et al., 2007), where a mobile phase containing
acetic acid is used.
The survey of different stationary phase columns (50 mm X 2 mm i.d.) revealed that those
packed with 3 µm Hypersil-BDS-C8 and LUNA-C18 are capable of a better resolution in
term of separation and peak shape. Although a better sensitivity was obtained with the
Hypersil-BDS-C8 column, LUNA-C18 was selected due to the best peak shape, in particular
peaks appeared narrower and more symmetric.
Using Sinergi Fusion RP column, overlapping of toxins occurred. For all the tested toxins the
peak width was better on the LUNA-C18 column with the acidic mobile phase; thus, it can be
concluded that both this column and the acidic mobile phase contributed to a better peak
shape.
LC-ESI-MS-MS analyses conditions applied in the development of the different LC-MS
methods for BTXs were therefore based on the results of these preliminary experiments.
3.5.6. Isocratic rapid method for BTX1, BTX2, BTX3
LC-MS conditions: BTXs were separated by an Agilent 1100 LC series using the 3 µm
Phenomenex LUNA-C18 column (50 X 2 mm i.d.). The mobile phase was based on aqueous
acetonitrile (ACN) with 2 mM ammonium formate and 50 mM formic acid (acidic mobile
phase). Additionally, the column was tested for a neutral mobile phase system which
consisted in 5 mM ammonium formate. After preliminary experiments in which different
percentage of ACN were used, the selected method resulted in a 75:25 acetonitrile:water
mobile phase for 4 min. Source and column temperatures were 350 and 25°C, respectively.
The flow rate was set at 0.3 mL min-1, and 3 µl of sample were injected. BTXs were detected
using an API-4000 triple quadrupole (Applied Biosystems, Foster City, CA, USA) mass
spectrometer equipped with a Turbo V electrospray ion source (MDS Analytical
Technologies, Concord, Canada) in selected reaction monitoring (SRM), with the ion source
in positive mode. Structural identification, detection and quantification were carried using the
SRM transitions and conditions previously described (Table 3.8). An external calibration
curve was obtained using 6 concentrations (10-2500 ng mL−1) of the BTXs standard solution
(BTX1, BTX2 and BTX3). Each sample was analyzed in triplicate and the concentrations
were reported as mean values.

68
Results: The isocratic method resulted a rapid and sensitive method to detect and quantify
BTX1, BTX2, BTX3 in algal extracts. Since these brevetoxins in the preliminary experiments
reported good peak shape and separation using either the neutral and acidic mobile phases, the
two different conditions were compared, using the LUNA-C18 as column (Fig. 3.11).
ACN/H+ resulted in a better sensitivity for all the different brevetoxins, which reported higher
peak intensities and better linearity in the calibration curves. Using the acidic mobile phase R2
were in fact 1, 0.9941 and 0.9998 for BTX1, BTX2 and BTX3, respectively; while values in
the range 0.9834-0.9917 were found with the neutral mobile phase. The LOD of BTXs with
the acidic method was 15, 43 and 27 pg on-column for BTX1, BTX2 and BTX3, respectively.
Fig. 3.11 – Separation of brevetoxins (BTX1, BTX2 and BTX3) standards using the Luna C18
column under acidic and neutral LC conditions.
BTX1RT 2.58
BTX2RT 2.13
BTX3RT 1.34
BTX1RT 2.90
BTX2RT 2.35
BTX3RT 1.44
ACN/H+
ACN neutral
Time (min)0 1 2 3 4
This method was subsequently applied to analyze algal extracts of K. brevis (Fig. 3.12). The
experiment was performed growing two different cultures for 14 days; every 2-3 days pellet
were collected and extracted and BTX1, BTX2, BTX3 produced during the growth were
analyzed. It has to be noted that the high toxin concentration per cell at the beginning of the
experiment is probably due to the fact that for the inoculum a culture with cells in the
stationary phase was used, therefore cellular toxin content was high. The BTXs pattern was
similar for the two replicates, being the BTX2 the major toxin, followed by BTX1, as
previously reported for K. brevis (Pierce et al., 2005). However, as K. brevis culture aged
there was a relative increase in the BTX3 compared to the BTX2, probably due to degradation
of BTX2, which formed BTX3. This last finding had been already observed during K. brevis
blooms (Tester et al., 2008).

69
Fig. 3.12 – Brevetoxins concentration (pg cell-1) in Karenia brevis cultures during the growth. Two
different replicate cultures were used for the experiment.
K. brevis culture
0
2
4
6
8
10
12
14
16
18
20
day 0 day 2 day 4 day 7 day 9 day 11 day 14
pg/c
ell BTX1
BTX2
BTX3
3.5.7. Gradient method for BTX1, BTX2, BTX3, BTX-B2, deoxyBTX-B2 and BTX-B5
LC-MS conditions: BTXs were separated by an Agilent 1100 LC series using the 3 µm
Phenomenex LUNA-C18 column (50 X 2 mm i.d.). The mobile phase was based on aqueous
acetonitrile (ACN) with 2 mM ammonium formate and 50 mM formic acid. A gradient
elution was used: 35-100% ACN over 10 min, and hold for 2 min. Source and column
temperatures were 275 and 40°C, respectively. The flow rate was set at 0.3 mL min-1, and 3 µl
of sample were injected. BTXs were detected using an API-4000 triple quadrupole (Applied
Biosystems, Foster City, CA, USA) mass spectrometer equipped with a Turbo V electrospray
ion source (MDS Analytical Technologies, Concord, Canada) in selected reaction monitoring
(SRM) with the ion source in positive mode. Structural identification, detection and
quantification were carried using the SRM transitions and conditions previously described
(Table 3.8). An external calibration curve was obtained using 6 concentrations (10-2500 ng
mL−1) of the BTXs standard solution (BTX1, BTX2, BTX3, BTX-B2, deoxyBTX-B2 and
BTX-B5). Each sample was analyzed in triplicate and the concentrations were reported as
mean values.
Results: The gradient method developed using an acidic mobile phase and LUNA-C18
column provided a good baseline separation of the six brevetoxins (Fig. 3.13). It resulted
sensitive and in a good linearity of all the BTXs standards, with R2 values 0.9940-0.9996.

70
LOD of BTX1, BTX3 and BTX-B2 was in the range 31-44 pg on-column; it slightly
increased for BTX2 (67 pg on-column) and reached a maximum value of 115 and 126 pg on-
column for BTX-B5 and deoxyBTX-B2, respectively.
Algal extracts of the Raphydophyceae F. japonica, H. akashivo and C. subsalsa were
analyzed using this method, to check for the presence of some of the most common
brevetoxins found in algal samples and their metabolites. None of these toxins was found in
the analyzed algal extracts, leading to the conclusion that these species don’t produce any of
these known brevetoxins, especially in considered that the method resulted sensitive and that
the algal extracts had been obtained from large cultures (6000 mL).
Fig. 3.13 - Separation of brevetoxins (BTXs) standards using the Luna C18 column under acidic LC
conditions.
3.5.8. Analysis of hand-picked K. brevis cells by micro-column liquid chromatography-
tandem mass spectrometry
The method involves micro-pipette sampling of cells, transfer to the cup of a micro filter,
removal of seawater, extraction of cells with methanol, and direct LC-MS/MS analysis. A
column switching system is used that allows a large volume injection and cleanup. Toxins are

71
trapped on an LUNA-C18 cartridge and are then back-flushed onto a microbore LC column
coupled with the MS (Fig. 3.14).
Sample Extraction: Millex-GV4 filters (0.22 µm) (Millipore) were soaked in methanol
(MeOH) overnight, followed by a final flush with 500 µL MeOH and then air drying. Before
use, each filter was filled with 100 µL MeOH for 5 min, followed by centrifugation at 2000 x
g for 5 min, and then a rinse with 50 µL of filtered (0.22 µm) seawater, followed by
centrifugation at 2000 x g for 5 min, was performed.
As shown in Fig. 3.14A, cells were selected and pooled by micropipette isolation and
transferred to the cleaned Millex-GV4 filters. Excess seawater from the cell(s) was removed
by centrifuging for 2 min at 2000 x g; the filtrate was then discarded.
To each filter 50 µL of 100% MeOH were added; after standing for 5 min, filters were
centrifuged at 4000 x g for 5 min to collect the extracts in a 300 µL micro-insert for LC
autosampler vials. Then, 25 µL of 40% MeOH were added to each filter; after standing for 5
min, centrifugation at 4000 x g for 5 min was performed and the total extract was collected in
the 300 µL micro-insert. The used filters were discarded and the inserts containing the
extracts were transferred to LC vials, tightly capped, and stored at -20°C until LC-MS
analysis.
LC-MS conditions: BTXs were separated by an Agilent 1100 binary LC, using a LUNA-C18
cartridge (20 x 2 mm i.d.) and a Hypersil-BDS-C8 column (150 x 1 mm i.d.) connected to a
switching valve as shown in Fig. 3.14B. Mobile phases consisted in water (A) and 95%
acetonitrile (B), both with 50mM formic acid and 2mM ammonium formate. Equilibration
was obtained using a 75 µl/min flow for 15 min at 10% B in position 2. 50 µL of each sample
were injected and the flow continued at 10% B in position 1 (flow through LUNA-C18
cartridge only) for 2 min at 0.2 mL/min. A gradient elution was used: the valve was switched
to position 2 (both columns, back-flushing from the LUNA-C18 cartridge onto the Hypersil
column) at 75 µl/min, then the gradient increased from 10 to 30% B over 0.5 min and then
from 30% B to 100% B over 10 min, hold at 100% for 18 min. BTXs were detected using an
API-4000 triple quadrupole (Applied Biosystems, Foster City, CA, USA) mass spectrometer
equipped with a Turbo V electrospray ion source (MDS Analytical Technologies, Concord,
Canada) in selected reaction monitoring (SRM) with the ion source in positive mode.
Structural identification, detection and quantification were carried using the SRM transitions
and conditions previously described (Table 3.8).

72
BTXs quantitation and LOD measurements were achieved with BTXs calibration solutions
(10-2500 ng mL−1) prepared in 80% MeOH. Each sample was analyzed in triplicate and the
concentrations were reported as mean values.
Fig. 3.14 – A) Micro-filtration system used to extract picked cell samples, and B) Column switching
system used for analysis.
A) MicroA) Micro--filtration systemfiltration system
Millex-GV4 Filter (0.22 µm)
300 µL glass insert for LC autosampler vial
1 mL plastic centrifuge tube
B) Column switching systemB) Column switching system
A B
MS MS
LC LC
Position 1
A B
Position 2
A B
MS MS
LC LC
Position 1
A B
Position 2
Column A: LUNA C18, 20x2 mm i.d.Column B: HyperSil-BDS-C8 150x1 mm i.d.
A) MicroA) Micro--filtration systemfiltration system
Millex-GV4 Filter (0.22 µm)
300 µL glass insert for LC autosampler vial
1 mL plastic centrifuge tube
A) MicroA) Micro--filtration systemfiltration system
Millex-GV4 Filter (0.22 µm)
300 µL glass insert for LC autosampler vial
1 mL plastic centrifuge tube
B) Column switching systemB) Column switching system
A B
MS MS
LC LC
Position 1
A B
Position 2
A B
MS MS
LC LC
Position 1
A B
Position 2
Column A: LUNA C18, 20x2 mm i.d.Column B: HyperSil-BDS-C8 150x1 mm i.d.
B) Column switching systemB) Column switching system
A B
MS MS
LC LC
Position 1
A B
Position 2
A B
MS MS
LC LC
Position 1
A B
Position 2
Column A: LUNA C18, 20x2 mm i.d.Column B: HyperSil-BDS-C8 150x1 mm i.d.
Results: The method proposed is based upon a micro sampling and extraction procedure
coupled with micro-column liquid chromatography-tandem mass spectrometry and
demonstrated the analysis of single or multiple hand-picked plankton cells. In fact, the toxin
concentration and profile present in plankton can vary considerably between different
geographical areas and even within one region and between seasons due to the presence of

73
different species and strains; moreover, variations in toxin concentration could also be due to
differences in the cell biovolume or within a population toxin content variability.
Fig. 3.15 - Analysis of 1, 5, 10, 25 and 50 individually picked cells of Karenia brevis sampled from a
culture. In each case, only 2/3 of the extract was injected (50 µL from 75 µL). It is interesting to note
that the BTX1 and BTX2 concentration increased proportionally from 1 cell to 50 cells samples.
Time (min)17 18 19 20
1 cell
5 cells
BTX1884.6>221.1
BTX2912.6>877.5
10 cells
25 cells
50 cells
Traditional methods of analysis require substantial sample sizes (e.g., millions of cells),
making it difficult to attribute the presence of toxins or variations in toxin profiles to
individual species.
This method resulted in a good linearity of the BTX1, BTX2 and BTX3 standard solutions,
which reported R2 in the range 0.9950-0.9977 and LOD values of 15, 45 and 25 pg on-
column, respectively.
It was subsequently used to analyzed the brevetoxin content in K. brevis samples obtained
hand-picking 1 to 50 cells. As shown in Fig. 3.15, this system was able to detect BTXs in
extracts obtained from 1-5 cells of K. brevis and resulted in a good correlation of the toxin
content with the number of extracted cells (Fig. 3.16). Although toxin content variability was
quite high for single cell samples, probably due also to the natural variability of the cells in
the toxin production, it decreased considerably already for 5 cells samples.

74
Fig. 3.16 – Analysis of a series of extracts prepared from cells hand-picked from a Karenia brevis
culture (CCMP2281). In each case, only 2/3 of the extract was injected (50 µL from 75 µL).
0
5
10
15
20
25
0 5 10 15 20 25 30 35 40 45 50 55
cell number
conc
(pg/
cell)
BTX1
BTX2
3.5.9. Conclusion – LC-MS methods for BTXs
Development in the use of LC-MS has progressed rapidly, since it has been considered a good
alternative to the MBA, offering greater selectivity, sensitivity, reliability and rapidity (Hess
et al., 2003; Ciminiello et al., 2002). In recent years much effort has been put in the
development of LC-MS/MS methods that are dedicated to either detect the specific classes of
marine lipophilic toxins or detect as much as possible different marine lipophilic toxins in a
multi-toxin method. In the literature, several methods for the separation of okadaic acid, its
derivatives dinophysistoxins, yessotoxins, domoic acid, spirolides, pectenotoxins and
azaspiracids have been described (Quilliam, 2003). BTXs are lipophilic toxins produced by
the dinoflagellate K. brevis and are rapidly metabolized to cysteine conjugates when
accumulated in shellfish (Roth et al., 2007). Due to the presence of the ionic amino acid
group, brevetoxins elute in the same region of the chromatogram as okadaic acid and
yessotoxins and are best analyzed in ESI+; therefore, it is not possible to analyze them
simultaneously with the other marine lipophilic toxins without polarity switching (Gerssen et
al., 2009).
The LC-MS methods for BTXs described here allows the determination of brevetoxins in
algal extracts or hand-picked plankton cells from cultures or from the field. The use of an
acidic mobile phase and LUNA-C18 column substantially improved the separation of these
compounds and gave good linearity of the standard solutions and good LOD values. These
75
LC-MS/MS methods resulted rapid, specific and sensitive, being able to separate and detect
the major BTXs and metabolites found in environmental samples. An accurate determination
of the toxin profile and individual toxin concentrations within a single cell was also possible,
and result in a good correlation between the number of extracted cells and BTXs total content.
3.6. Conclusion – F. japonica
The appearance of F. japonica in north European waters during the 1990s caused concern
because of the reported ichthyotoxicity of various species belonging to the Raphidophyceae
class (Iwasaki, 1971; Okaichi, 1972; 1989; Toriumi and Takano, 1973). In this thesis the
toxicity of Adriatic strains was evaluated by considering all the compounds previously
postulated as involved in the toxic mechanism, such as brevetoxins, fatty acids and ROS to
understand their role in toxicity. Several hypotheses have in fact been proposed for the toxic
mechanism of the raphidophytes, especially for the species Chattonella antiqua and
Chattonella marina, which have been studied more extensively. Recently a number of studies
were also performed on F. japonica strains from the USA, Japan, Australia, New Zealand, the
Netherlands, Germany, and France in order to characterize their growth and toxicity features
(Khan et al., 1996; Fu et al., 2003; de Boer et al., 2004; van Rijssel et al., 2008; Guidi-Rontani
et al., 2010); nevertheless the toxic mechanism of this raphidophyte is still unclear.
The chemical analyses of cultured Adriatic strains excluded the presence of known
brevetoxins, in accordance with the results obtained in the ichthyotoxic assays with D. labrax,
which highlighted the difference between the delayed effects of F. japonica and the rapid
ichthyotoxic effects of K. brevis, a brevetoxin-producing microalga.
The cellular fatty acid profile evidenced a high amount of PUFAs, including the three
haemolytic ones 18:4n-3 (OTA), 20:4n-6 (AA), and 20:5n-3 (EPA), found in a German strain
and called fibrocapsins Fj1, Fj2, and Fj3 (Fu et al., 2004a). These compounds were confirmed
to be haemolytic (de Boer et al., 2009) and to be toxic for crustaceans and bacteria (Fu et al.,
2003; Jüttner, 2001).
Fatty acid composition and quantification of our strain showed values in accordance with
those reported for Japanese and New Zealand strains (Marshall et al., 2002; Mostaert et al.,
1998; Cho et al., 1999b), except for a lower amount of arachidonic acid (20:4n-6). So far, all
the results obtained in several strains reveal a high variability in the composition of F.
japonica depending on the isolate (summarized in Table 3.9). In fact, the total amount of
PUFAs has been reported in one case to vary between 14 and 49 pg cell-1 (Marshall et al.,

76
2002), in another between 150 and 350 pg cell-1, and reaching the highest value of 450 pg cell-
1 in a German strain (de Boer et al., 2009).
Table 3.9 - Summary of the fatty acid composition (%) of several F. japonica isolates.
% of total fatty acids
present
study Marshall et al. 2002 Cho et al. 1999 Mostaert et al., 1998
Fatty acid FJAP0603 FJJp FJNZ NZFj JFj N136 N560
12:0
14:0 29.48 18.5 20.1 27.1 24.9
16:0 21.79 7.6 10.7 30.4 30.7 11.0 10.5
16:1n-7 1.31 2.6 1.7 4.7 5.8 2.4 4.9
16:1isomer (n-13) 1.77 1.2 1.0 1.8 2.1
16:1isomer 0.9 0.8
16:2
16:4n-3 0.4 0.1
18:0 1.22 1.6 0.7 4.3 6.1
18:1n-9 3.91 7.4 6.3 16.3 24.0 5.9 6.9
18:1n-7 4.40 0.5 5.7
18:2n-6 1.44 2.9 3.1 1.3 1.7 4.6 5.9
18:3n-6 (γ) 1.16 1.3 0.8 3.2 2.5
18:3n-3 (α) 2.36 1.6 1.5 3.3 5.9
18:4n-3 10.40 26.6 12.0 7.7 6.5 15.2 12.4
18:5n-3 0.0 0.0 0.5 0.2
20:2n-6 0.2 0.2
20:4n-6 3.29 4.4 7.2 6.9 6.8
20:4n-3 0.7 1.1 7.4 5.4
20:5n-3 17.47 17.4 24.5 20.9 12.3 16.5 15.0
22:4n-6 0.3 1.7
22:5n-6 0.6 0.1
22:5n-3 0.0 0.0
22:6n-3 0.4 0.2 1.4 1.9 1.0 1.0
Tot PUFAs 36.12 54.5 50.7
Tot PUFAs (pg/cell) 27.57
Tot (pg/cell) 76.34 25 97

77
The fatty acids quantification through GC-MS analysis led us to calculate the PUFA
concentrations in live F. japonica cells to which Artemia nauplii were exposed during the
reported toxicological assays and to establish that they rarely reached toxic levels. The
maximum F. japonica cell densities tested during the short-term assays contained a PUFA
amount of 8.8 µg mL-1, a level proved to be non-toxic by present tests with various fatty acid
standards (Table 3.4). Regarding the diatom P. tricornutum, which was never reported as
toxic, even at a cell concentration of 106 cells mL-1, none of the cell densities tested with
Artemia nauplii resulted in an amount of PUFAs sufficient to cause mortality, as the highest
cellular concentration used in the experiments corresponded to 1.2 µg mL-1. Death occurred
only when Artemia were exposed to high F. japonica cell concentrations (long-term assay),
probably because the nauplii could accumulate fatty acids, thus becoming lethal when a high
amount of cells per single organism was tested. Nevertheless, Cho et al. (1999b) reported the
absence of a correlation between the amount of PUFAs and the mortality of Artemia.
The solid phase extraction (SPE) of the Adriatic F. japonica extract resulted in a high
concentration of PUFAs in two main fractions, B and C, which caused 100% mortality of
Artemia nauplii. These fractions had PUFA amounts of about 63 µg mL-1 (B) and 311 µg
mL-1 (C), levels comparable with those of the fatty acid standards which were used for the
Artemia test, and which were also found to cause nauplii mortality. The toxicity of these
fractions was also confirmed by the inhibition of V. fischeri bioluminescence. None of the
PUFAs was instead detected in F. japonica extracellular medium, thus justifying the lack of
effects for Artemia (Table 3.5).
The various toxicological assays showed rather different results according to the organism
complexity. The effect of cell extracts on V. fischeri bioluminescence was high compared
with that exerted by other microalgae. These included a strain of P. reticulatum which
produces yessotoxins (YTX), compounds which evidently do not interfere with the
bioluminescence emission of V. fischeri. An effect of F. japonica on V. fischeri
bioluminescence was also found in a German strain (van Rijssel et al., 2008), even if less
strong than that observed in this study. In that case, the effect was caused by live cells at
concentrations far lower than those present in our extracts and it was thought to be caused by
substances which were extracellularly released.
The assay with C. carpio erythrocytes showed that F. japonica had haemolytic effects, as
increasing cell concentrations caused the lysis of up to 100% erythrocytes. The reported EC50

78
values were in accordance with the range found by de Boer et al. (2009) and were relatively
low. This result could be indicative of a marked ichthyotoxic potency, an aspect not supported
by the fish assays which evidenced a rather delayed effect of the Adriatic F. japonica with
mortality occurring only after 9-10 days of exposure.
The significant increase of H2O2 obtained in the tanks where sea basses were exposed to F.
japonica was also relevant. This indicates that the presence of fish stimulates H2O2 production
by algal cells and supports the hypothesis of H2O2 involvement in F. japonica toxicity. Kim et
al. (1999) reported lipid peroxidation of gill tissue in Cochlodinium polykrikoides-exposed
flatfish and suggested that ROS were one of the factors inducing fish mortality, through
reduction of the capability for oxygen transfer in gills. They proposed that when C.
polykrikoides passed through the fish gill lamella, gill cells were attacked by the ROS
generated by algal cells, resulting in an oxidative damage. In the present work, the
concentration of H2O2 measured in the F. japonica tanks were not considerably higher than in
those with the non-toxic diatom P. tricornutum and since the compound alone was not toxic
for the fish, even when added at high concentrations, this result confirms that other factors are
likely to be involved in the toxic mechanism, as already suggested for Chattonella marina
(Marshall et al., 2003; Woo et al., 2006).
The presence of cellular PUFAs in high amounts could substantiate the hypothesis of a
combined effect of these compounds and ROS. Thus, to evaluate the possible involvement of
oxidative stress in mortality of sea basses, MDA levels on the gills of the exposed fish were
determined. MDA is the major aldehyde formed upon breakdown of lipid hydroperoxides and
is still the most commonly applied assay for oxidative stress (Seljeskos et al., 2006); in fact,
ROS can react with the double bonds of PUFAs to yield lipid hydroperoxides and one of the
major secondary oxidation products is MDA. The average MDA concentrations measured in
the gills of fish exposed to F. japonica were 13-14-fold higher than those of the controls, in
contrast to the results obtained by Woo et al. (2006) in goldlined seabream exposed to
Chattonella marina for a period up to 6 h. We had also observed that fish exposed to F.
japonica for 5 days without reporting mortality, then being kept in seawater for 2-4 weeks and
exposed for the second time to F. japonica, died within a shorter time period (6-8 days) (data
not shown). This fact leads us to postulate the involvement in fish mortality of a permanent
and accumulating damage, such as the one caused by organ impairment, but to exclude an
acute effect such as the one resulting, for example, from red blood haemolysis.
In conclusion, F. japonica contains a high amount of PUFAs per single cell; it was already
known that these cells produce ROS, and this study confirms that the presence of predators

79
stimulates H2O2 production. As we have shown that PUFAs are not released into the
extracellular medium by live cells, we can assume that F. japonica cells, which easily cling to
fish gills due to their high polysaccharide production, can release in loco both ROS and, as a
result of the easy cell breakage, PUFAs. Then they could react in the gills by producing lipid
hydroperoxides as testified by the MDA increase; the resulting oxidative damage, possibly
associated with haemolytic effects, increases with the number of cells that passes through the
gills and accumulates with time, eventually causing fish death.
Although the exact molecular sequence of events leading to crustacean and fish death is not
definitively proved, this study on F. japonica shows that the Adriatic strains can be harmful to
crustaceans as well as to higher level organisms. It was also ascertained that a high cell
density and a long exposition time are necessary to cause severe damage on the fish gills or
death for crustaceans, thus justifying the absence of fish kill events during the frequent and
dense bloom episodes along the Italian coasts.

80

81
4. The dinoflagellate Ostreopsis cf. ovata Since the end of the1990s massive blooms of Ostreopsis cf. ovata (Fukuyo, 1981) have been
reported in a number of coastal areas of temperate regions with increasing frequency,
intensity and distribution. The occurrence of benthic biocenosis suffering and occasional
human distress have been described since the earliest bloom events (Bianco et al., 2007;
Simoni et al., 2004). Mortality of benthic organisms and human health problems broke out in
summer 2005 with an extensive phenomenon along the Ligurian coast, where hundreds of
people exposed to marine aerosol during recreational activities required medical cares due to
symptoms which mainly affected the respiratory apparatus. This event occurred concurrently
to a massive O. cf. ovata bloom (Mangialajo et al., 2008) and the symptoms in humans
disappeared when the bloom intensity decreased (Durando et al., 2007). Ostreopsis species
were found to produce palytoxin-like compounds, particularly O. siamensis and O.
mascarenensis reported the ostreocin-D (Usami et al., 1995; Ukena et al., 2001) and
mascarenotoxins (Lenoir et al., 2004), respectively.
The toxins produced by O. cf. ovata have been initially identified as a putative palytoxin
(pPLTX) in small amount and ovatoxin-a (OVTX-a) as the major toxin (Ciminiello et al.,
2008; Guerrini et al., 2010); recently the presence of putative PLTX and OVTX-a was
confirmed and the occurrence in the algal extract of four new palytoxin-like compounds,
OVTX-b, -c, -d, and -e, was highlighted (Ciminiello et al., 2010). After the 2005 event,
studies on Ostreopsis spp. have greatly increased and a more careful monitoring of benthic
biocenosis have been conducted, evidencing widespread Ostreopsis spp. proliferations in the
Mediterranean areas, including several Italian regions (Mangialajo et al., 2008; Monti et al.,
2007; Totti et al., 2010). It is difficult to establish if O. cf. ovata is really a species of recent
introduction in the Mediterranean area; however, the massive cell proliferations represent a
new phenomenon since the brownish mucilaginous film covering all benthic substrates and
the associated presence of high cell numbers in the overlying water column, both typical of O.
cf. ovata blooms (Aligizaki and Nikolaidis, 2006), have been reported to occur only recently
in Mediterranean basin.
Table 4.1 - Summary of data on the presence of Ostreopsis species from several tropical and
temperate areas and the concurrently measured environmental conditions. Data not clearly mentioned
in the text, when possible, have been extrapolated from tables or figures, and refer to temperature and
salinity values of Ostreopsis spp. proliferation and to the nutrients range measured in the studied sites.

82
Alg
al s
peci
esO
rigin
Tem
pera
ture
(°C
)S
alin
ity (
psu)
Ref
eren
ce
N (
µ µµµM)
P (
µ µµµM)
Si (
µ µµµM)
Ost
reop
sis
ovat
aM
edi
terr
ane
an
, T
yrrh
en
ian
Se
a
28-2
9T
ogn
etto
et a
l., 1
995
Ost
reop
sis
sp.
Me
dite
rra
nea
n,
Tyr
rhe
nia
n S
ea
2
4B
ian
co e
t al.,
200
6
Ost
reop
sis
ovat
aM
edi
terr
ane
an
, T
yrrh
en
ian
Se
a
> 2
2S
imon
i et a
l., 2
003
Ost
reop
sis
ovat
aM
edi
terr
ane
an
, Li
guria
n S
ea
25
Cim
inie
llo e
t al.,
20
06
Ost
reop
sis
ovat
aM
edi
terr
ane
an
, Li
guria
n S
ea
> 2
638
.0-3
8.2
Ma
ngia
lajo
et a
l., 2
008
Ost
reop
sis
ovat
aM
edi
terr
ane
an
, Li
guria
n S
ea
G
ran
éli
et a
l., 2
008
Ost
reop
sis
cfr.
ova
taM
edi
terr
ane
an
, w
est
ern
Ad
riatic
Se
a
27-2
935
.8-3
6.3
Inga
rao
et a
l., 2
009
Ost
reop
sis
ovat
aM
edi
terr
ane
an
, no
rth
ern
Adr
iatic
Se
a
16.8
-21
.8T
otti
et a
l., 2
010
Ost
reop
sis
cfr.
ova
taM
edi
terr
ane
an
, no
rth
ern
Adr
iatic
Se
a20
.6 (
Cro
atia
) 2
2.4
(Ita
ly)
37.8
(Ita
ly)
38.
6 (
Cro
at
ia)
Mon
ti e
t al.,
20
07
Ost
reop
sis
ovat
aM
edi
terr
ane
an
, so
uth
ern
Ad
riatic
Se
a
36.
75-3
8.4
4U
nga
ro e
t al.,
200
5
Ost
reop
sis
sp
. (=
siam
ensi
s )M
edi
terr
ane
an
, S
tra
it of
Me
ssin
a
< 2
5G
ang
em
i et a
l., 2
006
Ost
reop
sis
sp. (
= si
amen
sis )
NW
Me
dite
rra
ne
an,
Ca
tala
n S
ea
2
4-2
6 (1
997
), 1
8-2
0 (
199
8)
37.2
-38
.10
.76-
7.7
4 (
DIN
)0
.11
-0.8
6 (
PO 43
- )0.
17
-4.5
1 (
silic
ate
)V
ila e
t al.,
200
1
Ost
reop
sis
ovat
aM
edi
terr
ane
an
, A
ege
an
Se
a1
80
-85
(D
IN)
0.5
-6.5
(D
IP)
Spa
tha
ris e
t al.,
20
09
O. h
epta
gona
an
d O
. sia
men
sis
Kn
igh
t Ke
y (F
lorid
a)
25
33
Mor
ton
et a
l., 1
992
Ost
reop
sis
lent
icul
aris
nor
the
rnw
est
ern
Cu
ba
0.2
-12
.5 (
NO 3
- )
0.8
-39
.9 (
NH 4
+)
1.4-
52.
84
(T
IN)
0.0
05-
4.2
8 (
PO 43-
)
0
.003
-7.7
8 (
TP
)D
elg
ad
o e
t al.,
200
6
Ost
reop
sis
hept
agon
aG
ulf
of M
exi
co29
.53
11
-1.5
(D
IN)*
0.5
-2.2
(P
O 43
- )*O
kolo
dkov
et a
l., 2
00
7
Ost
reop
sis
sp. 1
Isla
nds
of H
aw
aii
27.6
30.8
0.2
-2.5
(N
O 3- +
NO
2- )
0-0
.9 (
NH 4
+)
0-0
.2 (
PO 4
3-)
0.7
-40
.9 (
silic
ate
)P
ars
on a
nd
Pre
skit,
200
7
Ost
reop
sis
ovat
aIs
land
s of
Ha
wa
ii 25
.426
.70.
2-2
.5 (
NO 3
- + N
O2- )
0-0
.9 (
NH 4
+)
0-0
.2 (
PO 4
3-)
0.7
-40
.9 (
silic
ate
)P
ars
on a
nd
Pre
skit,
200
7
Ost
reop
sis
lent
icul
aris
Ca
ribb
ea
n S
ea
, P
ue
rto
Ric
o >
28
Ba
llant
ine
et a
l., 1
988
Ost
reop
sis
siam
ensi
s N
ew
Ze
ala
nd
20
1.6
-3.8
(T
N)
0.3
3-1
.10
(P
O 43- )
She
ars
and
Ros
s, 2
009
Ost
reop
sis
siam
ensi
s E
ast
coa
st T
asm
an
ia
> 2
0>
30
Pe
arc
e e
t al.,
200
1
* ex
pres
sed
in m
g/L
as r
epor
ted
in th
e pa
per
Nut
rient
s

83
Cells are in fact easily resuspended in the water column, causing a decrease of their
abundances in the benthic environment (Totti et al., 2010; Vila et al., 2001), and the important
role of hydrodynamism in the bloom development and decline has been hence highlighted
(Aligizaki and Nikolaidis, 2006; Mangialajo et al., 2008). Moreover, higher concentrations of
Ostreopsis spp. are usually recorded during warmer periods, characterized by high
temperature and salinity and low hydrodinamism; therefore the environmental conditions
appear to be one of the main determining factors in the proliferation of these species. Table
4.1 summarizes the environmental parameters (e.g. temperature, salinity and nutrients)
recorded in situ during Ostreopsis spp. field studies.
Blooms of toxic dinoflagellates usually occur with a seasonal trend; the cell toxin content,
consisting in a balance between synthesis and excretion, can be highly influenced by variables
such as population growth phase, environment physical and chemical parameters, interaction
with bacteria and mechanical stress. Until now a few studies have been performed on the
effects of environmental conditions on the growth and toxin production of O. cf. ovata as well
as of other epiphytic dinoflagellates including the genera Gambierdiscus, Prorocentrum,
Coolia, and Amphidinium (Chinain et al., 2010; Morton et al., 1992; Vanucci et al., 2010),
which usually constitute an assemblage with Ostreopsis spp.
4.1. Toxin production during growth
The evaluation of O. cf. ovata growth profile was conducted using cultures of two Italian
isolates collected along Adriatic and Tyrrhenian coasts of Italy (Guerrini et al., 2010, Fig.
4.1). The two strains reported similar growth patterns, in fact both cultures stayed in the
exponential phase for about 10 days and then entered the stationary phase, which lasted up to
28-30 days. Growth rates were initially measured as 0.37 and 0.32 day-1 for the Adriatic and
the Tyrrhenian strain, respectively (Guerrini et al., 2010); however, subsequent measurements
made at different conditions reported higher values up to 0.49 day-1 for the Adriatic strain
(section 4.2 this thesis). Cell numbers of cultures grown at the optimum conditions could
reach values around 13,000-16,000 cells per ml in the stationary phase. Similarly, growth
rates of O. heptagona and O. siamensis from tropical areas were in the range of 0.25-0.50 div
day-1 (Morton et al., 1992), corresponding to 0.17-0.35 day-1 and being therefore slightly
lower than those obtained for O. cf. ovata. The measured growth rates for Ostreopsis spp.
were thus higher than those reported for cultured Prorocentrum lima, which were around 0.22
day-1 (Vanucci et al., 2010 and references therein), although cell yields for this species were
higher, up to 33,000 per ml.
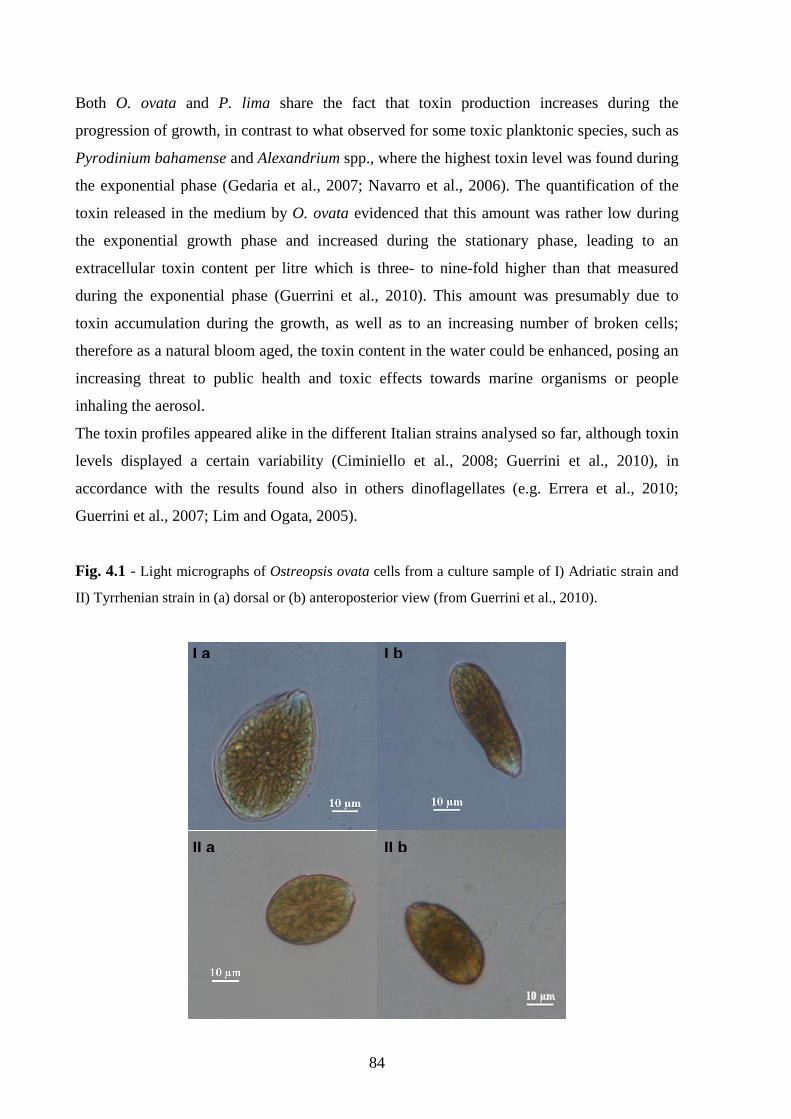
84
Both O. ovata and P. lima share the fact that toxin production increases during the
progression of growth, in contrast to what observed for some toxic planktonic species, such as
Pyrodinium bahamense and Alexandrium spp., where the highest toxin level was found during
the exponential phase (Gedaria et al., 2007; Navarro et al., 2006). The quantification of the
toxin released in the medium by O. ovata evidenced that this amount was rather low during
the exponential growth phase and increased during the stationary phase, leading to an
extracellular toxin content per litre which is three- to nine-fold higher than that measured
during the exponential phase (Guerrini et al., 2010). This amount was presumably due to
toxin accumulation during the growth, as well as to an increasing number of broken cells;
therefore as a natural bloom aged, the toxin content in the water could be enhanced, posing an
increasing threat to public health and toxic effects towards marine organisms or people
inhaling the aerosol.
The toxin profiles appeared alike in the different Italian strains analysed so far, although toxin
levels displayed a certain variability (Ciminiello et al., 2008; Guerrini et al., 2010), in
accordance with the results found also in others dinoflagellates (e.g. Errera et al., 2010;
Guerrini et al., 2007; Lim and Ogata, 2005).
Fig. 4.1 - Light micrographs of Ostreopsis ovata cells from a culture sample of I) Adriatic strain and
II) Tyrrhenian strain in (a) dorsal or (b) anteroposterior view (from Guerrini et al., 2010).
II a II b
I a I b

85
4.2. Effect of environmental parameters
4.2.1. Influence of temperature and salinity on the Adriatic Ostreopsis cf. ovata growth
and evaluation of toxin content through HR LC-MS and biological assays
Massive blooms of the benthic dinoflagellates Ostreopsis spp. are reported worldwide in
many tropical and temperate regions (Faust et al., 1996; Vila et al., 2001; Aligizaki and
Nikolaidis, 2006; Chang et al., 2000; Rhodes et al., 2000; Ciminiello et al., 2008). In the
Mediterranean Sea, blooms of O. cf. ovata and O. siamensis have been reported since the late
‘70s (Taylor, 1979; Abboud-Abi Saab, 1989) but, in the last decade, they have become
increasingly frequent and resulted in relevant benthic biocenosis sufferings and human health
problems.
Ostreopsis species, typically, proliferate in shallow and sheltered waters, with low
hydrodynamism; they form a rusty-brown coloured mucilaginous film, which covers reefs,
rocks (Bottalico et al., 2002), and soft sediments (Vila et al., 2001) as well as seaweeds (Vila
et al., 2001; Bottalico et al., 2002; Aligizaki and Nikolaidis, 2006; Totti et al., 2010), marine
angiosperms, and invertebrates (Bianco et al., 2007; Totti et al., 2007). The whole of the
above evidence suggests that the presence of Ostreopsis spp. in coastal waters may pose a real
threat to coastal food web and fishery (Aligizaki et al., 2008). However, the effects on marine
organisms and ecosystem dynamics remain still unknown, although mortality of several
marine organisms, in particular sea urchins, which lost their spines during blooms of O. cf.
ovata or O. siamensis, was reported (Granéli et al., 2008; Sansoni et al., 2003; Shears and
Ross, 2009).
Ostreopsis species were supposed to produce palytoxin (or its analogues) (Fig. 4.2)
(Taniyama et al., 2003), one of the most potent marine toxin so far known, which acts on the
Na+/K+ pump converting it into an ionic channel and causing the subsequent depletion of the
K+ ions (Habermann, 1989). This hypothesis was later supported by identification of putative
palytoxin as the causative toxin of human poisonings occurred during O. siamensis blooms
(Onuma et al., 1999) and, most importantly, by identification of some palytoxin-like
compounds from various Ostreopsis spp. Particularly, ostreocin-D was isolated from O.
siamensis and structurally elucidated by NMR (Usami et al., 1995; Ukena et al., 2001) while
mascarenotoxins were identified, basing only on MS evidence, as palytoxin-like compounds
from O. mascarenensis (Lenoir et al., 2004). Putative palytoxin and ovatoxin-a were detected
in field and cultured samples of O. cf. ovata, collected along the Ligurian coasts (Italy)
(Ciminiello et al., 2006, 2008) as well as in O. cf. ovata cultures from the Adriatic and

86
Tyrrhenian Sea (Guerrini et al., 2010) by liquid chromatography-mass spectrometry (LC-MS).
Recently, several new ovatoxins, namely ovatoxin-b, -c, -d, and -e, were also detected in an
Adriatic O. cf. ovata culture through an in-depth high resolution (HR) LC-MS investigation
(Ciminiello et al., 2010).
Fig. 4.2 - Structure of palytoxin. Molecular formulae (M) of ovatoxins, elemental composition of
their relevant A and B moieties and most abundant peaks of [M+2H-H2O]2+ and [M+2H+K]3+ ion
clusters for each compound.
O
OH
O
O
OH
O
OH
HO
OH
OHMe
O
HO
O
HOMe
O
OH
OO
OHHO
O
O
HN
O
NH
H2N
OH
HO
OH
OH
OH
OH
OH
OH
OH
OH
OHOHOH
HO
OH
OH
Me
Me OH
OHHO
OHOH
OH Me OH
OH
OH
OH
Me
Me
OH
HO
OH
OH
OH8
9
A moiety
B moiety
Toxin Rt (min) M A moiety B moiety [M+2H-
H2O]2+ [M+2H+K] 3+
Palytoxin 10.78 C129H223N3O54 C16H28N2O6 C113H195NO48 1331.7436 906.8167
Ovatoxin-a 11.45 C129H223N3O52 C16H28N2O6 C113H195NO46 1315.7498 896.1572
Ovatoxin-b 11.28 C131H227N3O53 C18H32N2O7 C113H195NO46 1337.7623 910.8318
Ovatoxin-c 10.90 C131H227N3O54 C18H32N2O7 C113H195NO47 1345.7584 916.1628
Ovatoxin-d 11.07 C129H223N3O53 C16H28N2O6 C113H195NO47 1323.7456 901.4884
Ovatoxin-e 11.07 C129H223N3O53 C16H28N2O7 C113H195NO46 1323.7456 901.4884
Currently, O. cf. ovata blooms occur each year from June to late October at several sites of
the Italian coastlines, characterized by different environmental conditions, such as seawater
temperature in the range 18-30°C and salinity in the range 30-39 (Pistocchi et al., 2011).

87
However, O. cf. ovata has never been detected in the Northwestern Adriatic sea, at sites
located close to the Po river delta, where peculiar salinity conditions occur, thus suggesting
that some environmental conditions play a key role in influencing O. cf. ovata growth and/or
its geographical dispersal.
Several authors indicated seawater temperature as an important factor affecting cell
proliferation (Tognetto et al., 1995; Sansoni et al., 2003; Simoni et al., 2004; Aligizaki and
Nikolaidis, 2006; Mangialajo et al., 2008). In most studies (as reviewed by Pistocchi et al.,
2011), high temperature values (24-29°C) were associated with the increase of Ostreopsis cell
number in seawater; however, in Adriatic (Totti et al., 2010) and Catalan Seas (Vila et al.,
2001) such positive correlation was not observed. Recently, the influence of temperature on
O. cf. ovata growth and toxicity has been also reported by Granéli et al. (2011) using a
Tyrrhenian isolate from the Ligurian coast: the highest toxicity was found in cultures grown at
20°C, whereas the highest algal biomass was recorded at 30°C.
In the present study, we report on in-depth investigation of the effect of some environmental
parameters on the growth and toxicity of O. cf. ovata. An Adriatic O. cf. ovata isolate, whose
growth and toxin profile had been previously characterized at 20°C and salinity 36 during the
exponential and stationary phases (Guerrini et al., 2010), was employed. Cultures were grown
at different temperature (20, 25 and 30°C) and salinity values (26, 32, 36 and 40); HR LC-MS
analyses were carried out to determine their toxin profile, including the recently found
ovatoxins (Ciminiello et al., 2010), and to evaluate the total toxin amount released in the
extra-cellular medium during the stationary growth phase.
A further object of the present study was to compare the total toxin content of algal extracts
measured by HR LC-MS with the results obtained through the haemolysis assay (Riobó et al.,
2008), with the aim of gaining information on the accuracy of the haemolytic test, a rapid and
very sensitive biological assay widely employed for palytoxins detection (Riobó et al., 2011).
Finally, the toxicity of O. cf. ovata cultures on crustaceans and fish was also investigated
using Artemia sp. assay and the ichthyotoxicity test with juvenile sea basses (Dicentrarchus
labrax) (IRSA-CNR, 2003) to evaluate the potential O. cf. ovata impact on the ecosystem.
Experimental section
Cultures of Ostreopsis cf. ovata
O. cf. ovata was isolated by the capillary pipette method (Hoshaw and Rosowski, 1973) from
water samples collected along the Adriatic coasts of Italy (Marche region, Numana sampling
site, strain OOAN0601) in October 2006, in proximity of the seaweeds Cystoseira sp. and

88
Alcidium corallinum. After an initial growth in microplates, cells were cultured at 20°C under
a 16:8 h L:D cycle from cool white lamp in natural seawater, at salinity 36, adding
macronutrients at a five-fold diluted f/2 concentration (Guillard, 1975) and selenium. In order
to evaluate the effect of environmental parameters on growth and toxicity of O. cf. ovata,
temperature and salinity experiments were carried out. In the salinity experiment, cultures (at
20°C) were established at salinity 26, 32, 36 and 40 in a thermostatic room, maintaining light
irradiance at 100-110 µmol m−2 s−1. Salinity levels 26, 32 and 36 were obtained by diluting
seawater (salinity 38) with deionized water, while salinity 40 was obtained by evaporation of
the seawater. In the temperature experiment, cultures (salinity 36) were established at 20, 25
and 30°C in water baths kept in the same thermostatic room, thus light irradiance slightly
decreased to 90 µmol m−2 s−1. Phaeodactylum tricornutum (strain PTN0301 from the North
Sea, Holland) was cultured using f/2 medium under the same conditions and used in the
experiments either for comparisons or control.
Both temperature and salinity experiments were carried out by using, for each condition, 2
series of batch cultures that were used for evaluation one of growth profile and the other of
toxin content.
Fig. 4.3 – Ostreopsis cf. ovata cultures. In focus are shown cells aggregates which characterize the
growth of this species.

89
Evaluation of growth profile
Since evaluation of growth profile of O. cf. ovata in batch cultures was complicated by the
presence of mucous aggregates (Fig. 4.3), the sampling method developed by Guerrini et al.
(2010) was used for counting. For each temperature/salinity level, 15 Erlenmeyer flasks
containing 200 ml of culture were grown in parallel (Fig. 4.3); every other day, two out of the
initial flasks were treated with HCl to a final concentration of 4 mM. Acid addition dissolved
mucous aggregates and homogenous sampling could be performed. After counting, the two
acidified flasks were discarded.
Cell counts were made following Utermöhl method (Hasle, 1978) and specific growth rate (µ,
day-1) was calculated using the following equation:
01
01
tt
lnNlnN
−−=µ
where N0 and N1 are cell density values at time t0 and t1.
Calculation of cell volume was made with the assumption of ellipsoid shape using the
following equation (Sun and Liu, 2003):
V = (π/6)*a*b*c
where a = dorsoventral diameter (length), b = width, c = mean anteriorposterior diameter
(height).
Evaluation of toxin content
For each temperature and salinity level, a set of four culturing flasks was set up. Due to the
available equipment, salinity experiment was carried out in a thermostatic room by using
1,500 mL flasks, while temperature experiment was carried out by locating 800 mL flasks in
water baths. Cell counting was carried out on one out of the four flasks as described above.
Five replicate countings were performed in one of the four flasks of each treatment and used
to determine the cell density and to express toxin content on a per cell basis. Culture
collection was carried out during the late stationary growth phase by gravity filtration through
GF/F Whatman (0.7 µm) filters at day 21st and 25th for the salinity and temperature
experiment, respectively. Cell pellets and growth media for each temperature/salinity level
were provided for chemical analysis.

90
Chemical analysis
Chemicals
All organic solvents were of distilled-in-glass grade (Carlo Erba, Milan, Italy). Water was
distilled and passed through a MilliQ water purification system (Millipore Ltd., Bedford, MA,
USA). Acetic acid (Laboratory grade) was purchased from Carlo Erba. Analytical standard of
palytoxin was purchased from Wako Chemicals GmbH (Neuss, Germany).
Extraction
Cell pellets and growth media for each temperature/salinity level were separately extracted.
Each pellet sample was added of 9 mL of a methanol/water (1:1, v/v) solution and sonicated
for 30 min in pulse mode, while cooling in ice bath. The mixture was centrifuged at 3000 x g
for 30 min, the supernatant was decanted and the pellet was washed twice with 9 mL of
methanol/water (1:1, v/v). The extracts were combined and the volume was adjusted to 30 mL
with extracting solvent. The obtained mixture was analyzed directly by HR LC-MS (5µl
injected). Each growth medium was extracted five times with an equal volume of butanol.
The butanol layer was evaporated to dryness, dissolved in 5 mL of methanol/water (1:1, v/v)
and analyzed directly by HR LC-MS (5 µl injected). Recovery percentage of the above
extraction procedures were estimated to be 98% and 75% for the pellet and growth medium
extracts, respectively (Ciminiello et al., 2006).
High Resolution liquid chromatography-mass spectrometry (HR LC-MS)
High resolution (HR) LC-MS experiments were carried out on an Agilent 1100 LC binary
system (Palo Alto, CA, USA) coupled to a hybrid linear ion trap LTQ Orbitrap XLTM Fourier
Transform MS (FTMS) equipped with an ESI ION MAXTM source (Thermo-Fisher, San Josè,
CA, USA). Chromatographic separation was accomplished by using a 3 µm gemini C18 (150
× 2.00 mm) column (Phenomenex, Torrance, CA, USA) maintained at room temperature and
eluted at 0.2 mL min-1 with water (eluent A) and 95% acetonitrile/water (eluent B), both
containing 30 mM acetic acid. A slow gradient elution was used: 20-50% B over 20 min, 50-
80% B over 10 min, 80-100% B in 1 min, and hold 5 min. This gradient system allowed a
sufficient chromatographic separation of most palytoxin-like compounds (Fig. 4.2).
HR full MS experiments (positive ions) were acquired in the range m/z 800-1400 at a
resolving power of 15,000. The following source settings were used in all HR LC-MS
experiments: a spray voltage of 4 kV, a capillary temperature of 290°C, a capillary voltage of
91
22 V, a sheath gas and an auxiliary gas flow of 35 and 1 (arbitrary units). The tube lens
voltage was set at 110 V.
Due to commercial availability of the only palytoxin standard, quantitative determination of
putative palytoxin, ovatoxin-a,-b,-c,-d, and -e in the extracts was carried out by using a
calibration curve (triplicate injection) of palytoxin standards at four levels of concentration
(25, 12.5, 6.25, and 3.13 ng mL-1) and assuming that their molar responses were similar to
that of palytoxin. Extracted ion chromatograms (XIC) for palytoxin and each ovatoxins were
obtained by selecting the most abundant ion peaks of both [M+2H-H2O]2+ and [M+2H+K]3+
ion clusters (Fig. 4.2). A mass tolerance of 5 ppm was used.
Toxicity assays
Artemia sp. assay
The assay was carried out according to the short-term test of the IRSA-CNR (2003) method,
consisting in a 24 h exposure of Artemia sp. to the potentially toxic sample. 10 nauplii were
incubated in 1 mL of sample in a glass tube for 24 h. Initially, aliquots of a culture grown at
20°C and salinity 36, containing five increasing concentrations of live cells, lysed cells, algal
extracts and growth media, were tested in triplicate. Live cell aliquots were sampled during
the stationary phase of the culture. Lysed cell aliquots were obtained by sonicating 10 mL of
the culture for 3 min. Algal extracts were obtained as reported above and diluted (1:100 to
1:10,000) with seawater. A palytoxin stock solution (12.5 µg mL-1) in methanol/water (1:1,
v/v) was diluted with seawater and tested in the concentration range 500-10,000 pg mL-1.
Growth medium aliquots were obtained by filtering 50 mL of the culture through GF/F
Whatman (0.7 µm) filters.
Toxicity of O. cf. ovata cultures grown at different temperature/salinity conditions was
evaluated by Artemia sp assay, using only live cells. Five different concentration levels of
each sample, obtained through dilution with seawater, were tested in triplicate. Toxic effects
on Artemia sp. of sample exposure were evaluated after 24 h and dead organisms were
counted. Seawater samples, methanol/water (1:1, v/v) solution (diluted 1:100, v/v with sea-
water) and f/2 medium at the investigated salinity levels (diluted 1:5 with seawater) were used
as control. EC50 values were calculated as reported below
Haemolytic assay
Haemolytic assay was carried out following the procedure proposed by Bignami (1993) and
modified by Riobó et al. (2008). The test is based on photometrical determination of

92
haemoglobin released from sheep erythrocytes following exposure to haemolytic compounds.
Sheep blood was kindly provided by the Department of Veterinary Public Health and Animal
Pathology (University of Bologna). Erythrocytes were separated from plasma by
centrifugation (400 x g at 10°C for 10 minutes) and washed twice with a solution containing
phosphate buffered saline (PBS) 0.01 M, pH 7.4, bovine serum albumin (BSA), calcium
chloride (CaCl2 2H2O) 1 mM and boric acid (H3BO3) 1 mM. Finally, the erythrocytes solution
was diluted with PBS at a final concentration of 1.7 x 10⁸ red cells mL-1.
According to the reported method (Riobó et al., 2008), two blood solutions, one added of
ouabain (2.5 µM) and one ouabain-free, were prepared to a final concentration of 1.7 x 10⁷
erythrocytes. 1 mL of each blood solution was mixed with 1 mL of the sample diluted in PBS
(either pellet extract or palytoxin standard previously dissolved in methanol/water (1:1, v/v))
and incubated at 25°C for 20 h. After the incubation, samples were centrifuged at 400 x g for
10 min and the supernatant absorptions were measured at 405 nm. Two replicates of algal
extract at different concentration levels, control solutions for blanks (PBS buffer and
methanol/water (1:1, v/v) in PBS) and total haemolysis sample were prepared in each
experiment. Palytoxin standard at seven concentration levels (4-196 pg mL-1) was used for
generating calibration curve. The haemolytic effects of the algal extracts were expressed
either on cell basis (cell mL-1) and on toxin content basis (pg mL-1). EC50 values obtained
testing the palytoxin standard and the algal extracts were calculated as reported below. Stock
solutions of the algal extracts and palytoxin standard used in the haemolytic assay were
quantified by HR LC-MS.
Fish bioassay
Sea bass (Dicentrarchus labrax) employed in the assay were collected from the hatchery
Valle Ca’ Zuliani (Pila di Porto Tolle, Rovigo, Italy). After the transfer, they were kept in a
60-70 L aquarium, aerated by a small dispenser (Hailea) and kept at room temperature and
salinity 36 for one month. For the experiments, 2 L aerated tanks containing algal culture
were used. Three juveniles (5.0 ± 1.0 g) were put into each tank, kept at 20 °C, during a 16:8
h light–dark period and observed for 4 days. Two replicates of O. cf. ovata culture grown for
4-6 days at 20°C and salinity 36 were tested at three concentration levels. An equal volume of
Phaeodactylum tricornutum culture was used as control. Fish were considered dead when gill
opercular movements ceased.

93
Data analysis
The 50% effect concentration (EC50) of each sample for the Artemia sp. and haemolytic
assays was estimated by fitting the experimental concentration-response curves to a logistic
model:
b
EC
x
ay
+=
501
where: y = endpoint value; x = substance concentration; a = expected endpoint value in
absence of toxic effect; b = slope parameter. The parameters of the equation, including the
EC50, were estimated using the non-linear regression procedures implemented in Statistica
(Statsoft, Tulsa, OK, USA). An independent estimate of EC50 was obtained for each of the
experiments.
Differences in cell biovolume, EC50 value, and toxins concentration among the samples were
tested by using the multivariate analysis-of-variance (ANOVA) test, using Statistica (StatSoft,
Tulsa, OK, USA) software. Whenever a significant difference for the main effect was
observed (P<0.05), a Newman-Keuls test was also performed.
Results
Batch cultures of an Adriatic strain of O. cf. ovata, collected along the Marche coasts of Italy
(Numana sampling site) in October 2006, were established in order to evaluate the effect of
salinity and temperature on algal growth and toxin profile. Particularly, in the temperature
experiment, cultures were set at 20, 25 and 30°C by maintaining salinity at 36 and light
irradiance at 90 µmol m−2 s−1, while in the salinity experiment cultures were established at
salinity 26, 32, 36 and 40, by maintaining temperature at 20°C and light irradiance at 100-
110 µmol m−2 s−1.
Growth pattern and cell volume
The growth profile of O. cf. ovata cultures exposed to different salinity and temperature
values was analyzed by measuring the cell density every 2-3 days from the beginning of the
exponential phase to the end of the stationary phase (Fig. 4.4A and 4.4B). Under the different
growth conditions, O. cf. ovata growth rates in the range 0.34-0.49 day-1 were observed.
As for the temperature experiment, despite during the first 5 days cells grew better at 25°C, at
the end of the exponential phase the maximum growth rate of 0.49 day-1 was recorded at
20°C, followed by 0.43 and 0.34 day-1 at 25 and 30°C, respectively. As for the salinity

94
experiment (carried out at 20°C) growth rate was not significantly affected by the salt
concentration (0.43-0.47 day-1) (ANOVA, P>0.05).
Fig. 4.4 - Growth pattern of O. cf. ovata cultures exposed to different salinity (A) and temperature
(B) conditions.
0 2 4 6 8 10 12 14 16 18 20 22 24 26100
1000
10000
100000
0 2 4 6 8 10 12 14 16 18 20 22 24 26 28 30100
1000
10000
100000
salinity 26 salinity 32 salinity 36 salinity 40
(A)
cell
mL-1
Time (day) 20°C 25°C 30°C
(B)
Time (day)
cell
mL-1
In the stationary phase, the maximum density was 13,000-16,000 cell mL-1 at 20°C and
intermediate salinities (32 and 36), while the cell yield dropped to 7,500 cell mL-1 both at
salinity 26 (temperature 20°C; Fig. 4.4A) and temperature 30°C (salinity 36; Fig. 4.4B).
In the course of the experiments, we noticed that the culture volume played a key role on the
final cell yield: decreasing cell densities were obtained as culture volumes increased from 200
mL to 800 mL up to 1500 mL.
Another aspect we considered in the salinity and temperature experiments was the cell
biometric measurement. It is to be noted that O. cf. ovata cells appeared highly different both
in size and in shape, within each cell culture; therefore, a statistically significant cell number
(n ≥ 50) was used for estimating the mean biovolumes which are reported in Fig. 4.5. In both

95
salinity and temperature experiments, a significant difference was observed between cell
volumes measured in the exponential and stationary phases (ANOVA, P<0.001).
Fig. 4.5 - Cell volumes of O. cf. ovata cells exposed to different salinity (A) and temperature (B)
conditions.
(A)
05000
10000150002000025000300003500040000
26 32 36 40
Salinity
µm3
exponential phase
stationary phase
(B)
0
5000
10000
15000
20000
25000
30000
35000
20 °C 25 °C 30 °C
Temperature
µm3
In the salinity experiment, the highest difference among biovolumes was observed in the
exponential phase where a mean value of 22,000 µm3 was reached at the lowest salinity (26)
and resulted significantly higher (Post-hoc SNK test, P<0.001) than those observed at 36 and
40 (14,000 and 13,000 µm3, respectively). An intermediate biovolume mean value was
observed at salinity 32 (17,000 µm3). In the stationary phase, cells were more homogenous in
96
size, with cell volumes in the range 28,000-30,000 µm3; however, the value reported at
salinity 32 (22,400 µm3) resulted significantly lower than those observed at the other salinity
levels (Post-hoc SNK test, P<0.001).
In the temperature experiment, in both growth phases cell volumes decreased as temperature
increased, with a maximum biovolume of 22,000 µm3 being reached at 20°C (stationary
phase), which was significantly higher than biovolumes measured at 25 and 30°C (Post-hoc
SNK test, P<0.001).
Determination of toxin content by HR LC-MS
Cell pellets and growth media of O. cf. ovata cultures grown at the different temperature and
salinity values were collected during the late stationary growth phase. Samples were
separately extracted as reported in the experimental and the crude extracts were used to
evaluate the toxin profile. HR LC-MS experiments were acquired in full MS mode by using
an LC method which allowed chromatographic separation of the major components of the
toxin profile. The spectra were acquired in the mass range m/z 800-1400 where each
palytoxin-like compound (Fig. 4.2) produces bi-charged ions due to [M+H+K]2+,
[M+H+Na]2+, and [M+2H]2+, tri-charged ions due to [M+2H+K]3+ and [M+2H+Na]3+, and a
number of ions due to multiple water losses from the [M+2H]2+ and [M+3H]3+ ions.
The presence of putative palytoxin and of all the ovatoxins (ovatoxin-a, -b, -c, -d, and -e)
recently identified in O. cf. ovata (Ciminiello et al., 2008, 2010) was highlighted in all the
analyzed samples. With the purpose of gaining information on the relative abundance of
individual compounds, extracted ion chromatograms (XIC) were obtained by summing the
most abundant peaks of both [M+2H-H2O]2+ and [M+2H+K]3+ ion clusters for each
compound (Fig. 4.2). Due to lack of standards for ovatoxins, quantitative analyses were
carried out basing on the tentative assumption that they present the same molar response as
palytoxin. These appeared reasonable since ovatoxins present elemental formulae similar to
that of palytoxin.
Concentrations of putative palytoxin and ovatoxins in all the analyzed extracts were
extrapolated from a calibration curve of palytoxin standard injected under the same conditions
and the obtained results were corrected basing on recovery percentages of the extraction
procedures, namely 98% and 75% (Ciminiello et al., 2006) for pellet and growth medium
extracts, respectively.

97
Significant differences were observed in the total toxin content of different algal extracts
(ANOVA, P<0.001), whereas relative abundance of individual toxins were quite similar:
ovatoxin-a was by far the major component of the toxin profile (47-56% of the total toxin
content; Post-hoc SNK test, P<0.001), followed by ovatoxin-b (24-27%), ovatoxin-d and -e
(15-18%), ovatoxin-c (4-8%) and putative palytoxin (0.5-3%) on the basis of their decreasing
relative abundance.
Total toxin content of pellet and medium extracts expressed as µg L-1 culture in both salinity
and temperature experiments are reported in Table 4.2. Toxin contents were significantly
higher in the cell pellet then in the corresponding culture medium (Post-hoc SNK test,
P<0.001), resulting in relatively low release percentages (13-16%) in most of the growth
conditions applied; however, the release increased up to 23 and 27% under the most
unfavourable growth conditions, namely salinity 26 (temperature 20°C) and temperature 30°C
(salinity 36), respectively.
Table 4.2 – Total toxin content (putative palytoxin, ovatoxin-a, -b, -c, -d, and -e) of O. cf. ovata
culture pellet and medium extracts, measured by HR LC-MS in both salinity and temperature
experiment. Data are expressed as µg per Liter of culture (µg L-1). Cell density (cell L-1) and
extracellular release(%) are also reported.
Total toxin content (ug L -1)
cell L -1 pellet medium total extracellular release (%)
Salinity 26 3,450,333 57 17 74 23 32 4,646,333 95 14 109 13 36 4,281,333 76 12 88 14 40 5,619,000 68 11 80 14
Temperature 20°C 9,869,587 155 25 180 14 25°C 5,581,677 129 25 154 16 30°C 4,493,377 81 30 111 27
Total and individual toxin contents on a per cell basis (pg cell-1), are reported in Fig. 4.6A and
4.6B for salinity and temperature experiments, respectively. Small differences in total toxin
content were observed between the experiments, that should have provided similar results,
namely the cultures grown at temperature 20°C and salinity 36. Such differences could be
likely due to the slightly different growth conditions, among which the difference in light
intensity and in culture volume could have played a major role.

98
Fig. 4.6 – Total and individual toxin contents of putative palytoxin, ovatoxin-a, -b, -c, -d, and -e of O.
cf. ovata cultures grown under different salinity (A) and temperature (B) conditions. HR LC-MS
measurements (pg cell-1) were carried out for both pellet and medium extracts at the end of stationary
growth phase.
0
5
10
15
20
25
palytoxin ovatoxin-a ovatoxin-b ovatoxin-c ovatoxin-d,-e tot
palytoxin ovatoxin-a ovatoxin-b ovatoxin-c ovatoxin-d,-e tot
26 32 36 40 26 32 36 40 pellet medium Salinity
20 25 30 20 25 30 pellet medium Temperature (°C)
pg c
ell-1
0
5
10
15
20
25
(B)
(A)
pg
cell
-1
In the salinity experiment, total toxin content reached the highest value in the culture grown at
32 (20 pg cell-1) and the lowest at 40 (12 pg cell-1).
As for the temperature experiment, O. cf. ovata grown at 25°C was found to have a total toxin
content of 23 pg cell-1, while cultures grown at 20 and 30°C produced 16 and 18 pg cell-1,

99
respectively. This last finding apparently is not in agreement with the maximum concentration
(µg L-1) observed at 20°C (salinity 36), which was indeed affected by the high cell yield of
the culture (Table 4.2). Particularly, culture grown at 20°C showed a cell density almost two-
fold higher than the others.
Haemolytic assay
Palytoxin converts Na+/K+ pump into a non-selective cation channel, causing cell lysis;
ouabain and other cardiac glycosides are used as indicators for the site of action since these
compounds are specific ligands for the Na+/K+-ATPase.
Fig. 4.7 - Haemolytic activity of O. cf. ovata extracts grown at different salinity (A) and temperature
(B) conditions on sheep erythrocytes in absence (solid lines) and in presence (dashed lines) of ouabain
(OUA). Data are expressed as haemolysis percentage (%) versus cell number mL-1 assay (cell mL-1).
0 1 2 3 4 5 6 7 8 9 100
102030405060708090
100
1 2 3 4 5 6 7 80
102030405060708090
100
cell mL -1
salinity 26 salinity 26+OUA salinity 32 salinity 32+OUA salinity 36 salinity 36+OUA salinity 40 salinity 40+OUA
Hae
mol
ysis
(%)
(B)
(A)
20°C 20°C+OUA 25°C 25°C+OUA 30°C 30°C+OUA
cell mL -1
Hae
mol
ysis
(%)
The haemolytic assay proposed by Riobó et al. (2008) is a rapid and sensitive method to
determine palytoxin content and it was applied to culture extracts of O. cf. ovata grown under
different salinity and temperature conditions.
All the O. cf. ovata culture extracts investigated in the present study were tested by
haemolytic assay and the results, expressed as haemolysis percentage versus cell number

100
present in 1 mL of assay solution (cell mL-1), are reported in Fig. 4.7. All showed a strong
delayed haemolysis of sheep erythrocytes, which was specifically inhibited by ouabain, even
at concentrations corresponding to very low cell densities; however, a percentage of not-
specific haemolysis was left over even in the presence of ouabain as shown in Fig. 4.7 (dotted
lines).
The haemolytic activity of cultures grown at different salinity levels (Fig. 4.7A) followed a
pattern similar to that measured by HR LC-MS; particularly the highest haemolysis (83%)
was observed for the culture grown at salinity 32 (total toxin content = 20 pg cell-1) followed
by cultures grown at salinity 26 (haemolysis 79%, total toxin content = 16 pg cell-1), 36
(haemolysis 76%, total toxin content = 18 pg cell-1), and 40 (haemolysis 74%, total toxin
content = 12 pg cell-1).
In the temperature experiment (Fig. 4.7B) cells grown at 20°C reported the lowest haemolytic
activity (haemolysis 76%, total toxin content = 16 pg cell-1) in agreement with HR LC-MS
results, while an 82% haemolytic effect was observed for both cultures grown at 25 and 30°C,
despite the slightly different toxin content of 23 and 18 pg cell-1, respectively. All the above
data were consistent with HR LC-MS results expressed as pg cell-1.
A comparison of the results of the haemolytic assay with the quantitative results achieved by
HR LC-MS could provide useful information about the haemolytic activity of ovatoxins in
comparison with that of palytoxin. To this aim, the haemolytic activity of the algal extracts
from salinity and temperature experiments was also expressed as haemolysis percentage
versus concentration of pg total toxin contained in 1 mL assay solution (pg mL-1) as measured
by HR LC-MS. These data are compared in Fig. 4.8 with those obtained for the haemolytic
activity of palytoxin standard tested at seven different concentrations. This clearly suggests
that the haemolytic activity of the overall ovatoxins is quite similar to that of palytoxin
standard.
Values obtained for the palytoxin standard were interpolated using a non-linear estimation
curve, described by the reported equation (f1, Fig. 4.8). The resulting EC50 values for
palytoxin standard and algal extracts were not significantly different (ANOVA, P>0.05),
being 22 ± 2 and 25 ± 8 pg mL-1, respectively.

101
Fig. 4.8 - Haemolytic activity of O. cf. ovata extracts and palytoxin standard on sheep erythrocytes in
absence and in presence of ouabain (OUA). Data are expressed as haemolysis percentage (%) versus
concentration of palytoxin equivalent per mL of assay (pg mL-1). Equation f1: non-linear estimation
curve obtained for the palytoxin standard.
0 25 50 75 100 125 150 175 2000
10
20
30
40
50
60
70
80
90
100
palytoxin standard algal extracts palytoxin standard+OUA algal extracts+OUA
f1
Hae
mol
ysis
(%)
Concentration (pg mL -1)
Function (f1)
PLTX standard y = (85.5819)-(85.5819)/(1+(x/(21.473))^(log(9)/(log((254.169)/(21.473)))))
Artemia sp. assay
Artemia sp. assays were carried out using both live and lysed cells of O. cf. ovata cultures as
well as the algal extract and the growth medium of a culture grown at 20°C and salinity 36.
O. cf. ovata live cells induced rapid and high mortality of Artemia sp. nauplii, even at low cell
concentrations. From the EC50 values of all the samples calculated at 24 h (Table 4.3), cell
toxicity appeared relevant and significantly different (ANOVA, P<0.001): the growth medium
resulted significantly less toxic than the live cells (Post-hoc SNK test, P<0.001), with an EC50
value of 720 cell mL-1 versus 8 cell mL-1, respectively. This result confirmed the presence of
small amounts of toxins released in the growth medium. The lysed cells induced a similar
mortality as the algal extract, as evidenced by the comparable EC50 values (Post-hoc SNK
test, P>0.05).
EC50 values of all the tested O. cf. ovata samples were expressed also as pg of toxins per mL
assay (pg mL-1) (Table 4.3), basing on the total toxin contents measured by HR LC-MS. A
palytoxin standard at five levels of concentrations (500-10,000 pg mL-1) was also tested; it

102
presented an EC50 value of 4606 pg mL-1, which was significantly higher (Post-hoc SNK test,
P<0.001) than that of the algal extract (1146 pg mL-1).
Table 4.3 – The 50% mortality on Artemia nauplii (EC50) is expressed both as cells of O. cf. ovata
per mL (cell mL-1) and total toxin content per mL (pg mL-1) and it is reported for O. cf. ovata live and
lysed cells, extract, and growth medium. EC50 measured for palytoxin standard is reported as pg mL-1.
Each value is the mean of three replicates ± standard error.
EC50 (cell mL -1) EC50 (pg mL -1) O. cf. ovata live cells 8 ± 5 115 ± 72 O. cf. ovata lysed cells 96 ± 6 1376 ± 86 O. cf. ovata extract 80 ± 7 1146 ± 272 O. cf. ovata medium 720 ± 54 1822 ± 137 palytoxin standard 4606 ± 781
Administration of O. cf. ovata live cells, grown at different salinity and temperature
conditions, to Artemia sp. resulted in no significant differences among the measured EC50
values (ANOVA, P>0.05) (Table 4.4); however, the lowest EC50 values were measured for
live cells grown at 25°C (EC50 = 6 cell mL-1), and for those grown at salinity 32 (EC50 = 9 cell
mL-1) in the temperature and salinity experiment, respectively. This appears in good
agreement with total toxin contents (pg cell-1) measured by HR LC-MS (Fig. 4.8).
Table 4.4 - The 50% mortality on Artemia nauplii (EC50) of O. cf. ovata live cells grown at different
salinity and temperature conditions, expressed as cell mL-1. Each value is the mean of three replicates
± standard error.
EC50 (cell mL -1) Salinity
26 17 ± 3 32 9 ± 2 36 24 ± 8 40 17 ± 4
Temperature 20°C 11 ± 3 25°C 6 ± 2 30°C 14 ± 1

103
Fish bioassay
Fig. 4.9 shows the results of the ichthyotoxic assay performed with different concentrations of
O. cf. ovata live cells. Sea bass mortality occurred after 1 day of exposure, only at the highest
O. cf. ovata cell density (2367 cells mL-1). After 45 h from the beginning of the assay, even
fish exposed to lower algal concentrations (1138 and 425 cells mL-1) began to die and they
were all dead after 72 h. Fish exposed to the diatom Phaeodactylum tricornutum (789,100
cells mL-1) used as control survived and behaved normally till the end of the experiment (96
h).
Fig. 4.9 - Toxicity of different concentrations of O. cf. ovata cells on fish (Dicentrarchus labrax).
Phaeodactylum tricornutum was used as control and was tested at the reported cell density. Time is
expressed as hours (h).
Concentration(cell mL -1)
1 0/32 0/31 1/3 2/3 3/32 1/3 2/3 3/31 3/32 1/3 3/31 2/3 3/32 1/3 3/3
0 28 29 30 31 45 51 52 72 96
O. cf. ovata
P. tricornutum
2 367
1 138
tank (2 L)
789 100
n° dead fish / n° tested fish
time (h)
425
Discussion
Several field surveys indicated that environmental conditions play a major role in determining
Ostreopsis species proliferation (Pistocchi et al., 2011). Since very few laboratory studies on
the effects of environmental parameters on growth and toxicity of Ostreopsis isolates were
reported (Granéli et al., 2011; Ashton et al., 2003; Morton et al., 1992), a detailed study was
carried out on an Adriatic strain of O. cf. ovata grown at different temperature and salinity
conditions.
Growth and cell size pattern
The Adriatic O. cf. ovata strain showed to be tolerant to salinity variation in the range 26-40.
Very similar growth rates and yields were observed within the tested salinity range, with the
lowest growth yield being recorded at salinity 26. This is in good agreement with field
measurements performed during Mediterranean O. cf. ovata blooms (Totti et al., 2010; Monti
et al., 2007) as well as with results of a survey of epiphytic dinoflagellates along the Hawaiian

104
coast, (Parsons and Preskitt, 2007) in which O. cf. ovata was the only dinoflagellate to be
negatively correlated with salinity.
In the temperature experiment, the analyzed Adriatic O. cf. ovata strain reached the highest
growth yield at 20°C, whereas the lowest yield was recorded at 30°C. Our results are in good
agreement with field surveys in the Adriatic Sea, where O. cf. ovata proliferation occurs from
the end of August to October, when water temperature is about 20-22°C (Totti et al., 2010;
Monti et al., 2007). On the contrary, Granéli et al. (2011) indicated, for a Tyrrhenian O. cf.
ovata strain, that high water temperatures (26-30°C) increased both growth rate and yield; this
is consistent with the field surveys reporting O. cf. ovata blooms in the Tyrrhenian Sea in the
middle of the summer. Our results and those observed by Granéli et al. (2010) agree in
highlighting that Adriatic and Tyrrhenian strains are differently affected by environmental
temperature.
As for the morphometric characters, in both salinity and temperature experiments, a certain
cell size variability was observed; however, the cell volumes reported under the different
growth conditions didn’t show a specific pattern, particularly in the stationary growth phase.
A marked variability in the biovolumes of O. cf. ovata cells from the same culture had been
already observed (Guerrini et al., 2010), and it is in agreement with field observations
(Aligizaki and Nikolaidis, 2006; Bianco et al., 2007).
Toxin profile
Putative palytoxin and all the ovatoxins so far known (Ciminiello et al., 2010) were detected
in O. cf. ovata extracts. In the cultures grown under different conditions relative abundance of
individual toxins was similar, with ovatoxin-a and putative palytoxin being the major and the
minor component of the toxin profile, respectively.
The highest total toxin content on a per cell basis (pg cell-1) was recorded in cultures grown at
25°C, while the highest total toxin concentration on a per liter basis was recorded at 20°C,
namely under conditions that induced the highest growth yield. A reverse correlation between
growth and toxin production has been reported also by Granéli et al. (2011), as found also for
other dinoflagellates (Etheridge and Roesler, 2005; Errera et al., 2010). As for the salinity
experiment the highest total toxin content (pg cell-1) was measured at salinity 32, while it
decreased at lower and higher salinity values, as previously observed for the dinoflagellate
Protoceratium reticulatum (Guerrini et al., 2007). However, no clear correlation between
growth and toxin content was observed in the salinity experiment.

105
The extracellular release increased as the temperature increased, with the maximum 27%
value being observed at 30°C, the most unfavourable growth condition in the temperature
experiment. This suggests that high temperatures favour cell lysis, leading to toxins being
released in the growth medium. Similarly, in the salinity experiment, the highest release was
also measured at the most unfavourable growth condition (26); comparable results were
obtained for P. reticulatum (Guerrini et al., 2007) and this could represent a response of the
cells to the osmotic stress.
Haemolysis results in comparison with HR LC-MS data
The haemolytic assay was reported as a rapid, easy and sensitive method to determine
palytoxin by Riobó et al. (2008). In our study, it was successfully applied to the analyses of
O. cf. ovata extracts in order to gain information about the haemolytic activity of ovatoxins.
The haemolytic assay resulted highly reproducible even among separate set of experiments
and using different blood samples.
The haemolytic activity was tested by using O. cf. ovata extracts obtained from cultures set up
at different growth conditions. The obtained data showed a good correlation between
haemolysis percentage and the total toxin content measured through HR LC-MS. This is the
first time that a cross check between biological assay and chemical analysis was applied to
palytoxin-like compounds. Useful information was obtained from haemolytic tests after
pretreatment with ouabain. They showed that ovatoxins behave similarly to palytoxin,
suggesting a common mechanism of action, which involves a binding to the Na+/ K+ pump.
The haemolytic activity of all the O. cf. ovata extracts was found to be very similar to that of
palytoxin, as confirmed also by the similar EC50 values. These data suggested that ovatoxins,
which represent the major components of the O. cf. ovata extracts (99.5-97%), have a similar
haemolytic effect as palytoxin standard. It has to be noted that, in our analyses, the total
activity of ovatoxins was measured and it has still to be ascertained whether individual
components of the ovatoxin profile present different haemolytic activity. This will be possible
when each ovatoxin will be isolated as a pure compound and used to evaluate its haemolytic
activity.
In conclusion, the haemolytic assay appears a good method for preliminary quantification of
the whole of palytoxin-like compounds in algal extracts: equation (f1, Fig. 4.8) obtained from
the haemolysis curve, indicating the total haemolysis, can be a powerful tool to evaluate total
toxin concentration of algal extracts, especially in laboratories where LC-MS is not available.

106
However, some drawbacks of this assay are represented by the interference of other possibly
co-occurring haemolytic compounds and its inability to define toxin profile.
Toxicity for crustacean and fish
The toxicological assays revealed a marked toxicity of compounds produced by O. cf. ovata
on Artemia nauplii and juvenile sea basses.
In the Artemia sp. assay performed with O. cf. ovata live cells the death of nauplii was
observed even at very low cell densities and the relevant EC50 value was significantly lower
than those obtained for O. cf. ovata lysed cells, algal extract, and growth medium (Table 4.3).
The difference in EC50 values of O. cf. ovata live cells versus both O. cf. ovata lysed cells and
algal extract can be related to a different toxin uptake by the Artemia sp. nauplii: live cells
were actually ingested by nauplii whereas either lysed cells or algal extract were assumed
through filtration. Thus, this latter mechanism of toxin uptake seems to be less powerful than
ingestion. This suggests that herbivorous fish, that feeds on seaweeds where the benthic
dinoflagellates proliferates, is the most exposed to O. cf. ovata toxicity.
The high EC50 value of the O. cf. ovata growth medium also deserves consideration. It can be
related to the low toxin extracellular release emerging by HR LC-MS data (Table 4.2).
Despite apparently low toxicity of O. cf. ovata growth medium on Artemia nauplii, a long
lasting bloom could be anyway hazardous to marine crustaceans, particularly considering that
cell lyses and toxin extracellular release increase at the end of the stationary phase reached at
the end of the bloom.
Unlike the haemolytic assay, the Artemia sp. assay was not able to detect the different toxin
contents of O. cf. ovata cultures grown at different salinity and temperature conditions. This
could be due to the extreme sensitivity of Artemia sp. nauplii to O. cf. ovata live cells (EC50
values ranging from 6 to 24 cell mL-1), which has not been observed for any other harmful
algae so far (Pezzolesi et al., 2010). Thus, Artemia sp. assay is not able to catch relatively
small differences among different samples and, therefore, it cannot be used for quantitative
purposes.
In the ichthyotoxic assay, sea basses exposed to O. cf. ovata live cells died within a few days
despite they are known not to feed on microalgal cells. This mortality could be attributed to an
haemolytic effect of palytoxin-like compounds on the gills, where Na+/K+ ATPase activity is
high in the juvenile stage of sea basses (Varsamos et al., 2004). However, we cannot exclude
an effect due to accidental ingestion of algal cells, which were contained in the surrounding
water at high density.

107
4.2.2. Effect of temperature on the toxicity and growth of different O. cf. ovata strains
Experimental section
Cultures of Ostreopsis cf. ovata
O. cf. ovata cells were isolated by the capillary pipette method (Hoshaw and Rosowski, 1973)
from water samples collected along the Adriatic (Bari, Puglia; strain OOAB0801) and
Tyrrhenian (Latina, Lazio; strain OOTL0707) coasts of Italy in 2008 and 2007, respectively.
Cultures were established at salinity 36 adding macronutrients at a five-fold diluted f/2
(Guillard, 1975) concentrations. In order to evaluate the effect of temperature on growth and
toxicity of diffferent O. cf. ovata strains, cultures were prepared at 20, 25 and 30°C in water
baths, under a 16:8 h L:D cycle from cool white lamp, maintaining light irradiance at
90 µmol m−2 s−1(see section 4.2.1).
As previoulsy described (section 4.2.1), to evaluate the growth profile, 15 Erlenmeyer flasks
containing 200 ml of culture were grown in parallel for each condition; every other day, two
out of the initial flasks were treated with HCl to a final concentration of 4 mM and discarded
after the counting. Cell counts were made following Utermöhl method (Hasle, 1978), while
calculation of cell volume was made with the assumption of ellipsoid shape using the
following equation (Sun and Liu, 2003).
For each temperature condition, a set of four 800 mL culturing flasks was set up for the
evaluation of toxin content. Cell counting was carried out on one out of the four flasks as
described above. Culture collections were carried out during either the exponential and
stationary growth phases by gravity filtration through GF/F Whatman (0.7 µm) filters at day
9th and 22th, respectively. Cell pellets for each condition were provided for chemical analysis.
Chemical analysis
HR LC-MS analyses of palytoxin-like compunds were performed as reported in section 4.2.1.
Results
Batch cultures of an Adriatic and Tyrrhenian strain of O. cf. ovata were established in order to
evaluate the effect of temperature on algal growth and toxin profile. Particularly, cultures
were set at 20, 25 and 30°C by maintaining salinity at 36 and light irradiance at
90 µmol m−2 s−1, as previously performed using another Adriatic strain from Ancona. This
study allows to compare the effect of temperature on different O. cf. ovata strains to evaluate
how this environmental parameter affects the cell proliferation in these areas.

108
Growth pattern
The growth profile of O. cf. ovata cultures exposed to different temperature values was
analyzed by measuring the cell density every 2-3 days from the beginning of the exponential
phase to the end of the stationary phase (Fig. 4.10A and 4.10B). Under the different growth
conditions, O. cf. ovata growth rates in the range 0.30-0.45 day-1 were observed.
Fig. 4.10 - Growth pattern of O. cf. ovata cultures exposed to different growth temperatures. (A)
Adriatic strain (OOAB0801) and (B) Tyrrhenian strain (OOTL0707).
0 2 4 6 8 10 12 14 16 18 20 22 24100
1000
10000
0 2 4 6 8 10 12 14 16 18 20 22 24100
1000
10000
Bari 20°C Bari 25°C Bari 30°C
(A)
cell
m L
-1
Time (day) Latina 20°C Latina 25°C Latina 30°C(B)
Time (day)
cell
m L
-1
Temperature affected cell growth of both strains; however differences between the two
isolates were obsereved. Final cell yield of the Adriatic strain was only slightly affected by
the various temperature, and reached values of about 4000-5000 cell mL-1; while relevant
differences were reported for the Tyrrhenian strain. In fact, a maximum cell density of about
4500 cell mL-1 was reported at 20°C, whereas lower values were reached at the highest
temperatures (2600 and 3200 cell mL-1 at 25 and 30°C, respectively).
Both strains reported a better growth rate at 25°C (ANOVA, P<0.05), being 0.41 and 0.45
day-1 for the Adriatic and Tyrrhenian strain, respectively; while the lowest growth rates were
observed at the highest tested temperature (30°C), namely 0.30 and 0.32 day-1, respectively.

109
Temperature of 20°C showed intermediate growth rates for both isolates, resulting in 0.32 and
0.39 day-1 for the Adriatic and Tyrrhenian strain, respectively.
Determination of toxin content by HR LC-MS
Cell pellets of O. cf. ovata cultures grown at the different temperature values were collected
during the exponential and stationary growth phases. HR LC-MS experiments were acquired
in full MS mode by using an LC method which allowed chromatographic separation of the
major components of the toxin profile (Fig. 4.11). The spectra were acquired in the mass
range m/z 800-1400 where each palytoxin-like compound produces bi-charged ions due to
[M+H+K] 2+, [M+H+Na]2+, and [M+2H]2+, tri-charged ions due to [M+2H+K]3+ and
[M+2H+Na]3+, and a number of ions due to multiple water losses from the [M+2H]2+ and
[M+3H]3+ ions, as reported in the experimental.
The presence of putative palytoxin and of all the ovatoxins (ovatoxin-a, -b, -c, -d, and -e)
recently identified in O. cf. ovata (Ciminiello et al., 2008, 2010) and found in the Adriatic
strain from Ancona (section 4.2.1) was highlighted in all the analyzed samples (Fig. 4.12 and
4.13).
Fig. 4.11 - Total ion chromatogram (TIC) of the O. ovata culture extract containing putative PLTX,
OVTX-a, -b, -c, -d, and-e. LC-MS analysis was carried out in full MS positive ion mode in the mass
range 800-1400 amu, by using the chromatographic conditions reported in the experimental (from
Ciminiello et al., 2010).

110
Significant differences were observed in the total toxin content of different algal extracts
(ANOVA, P<0.001), whereas relative abundance of individual toxins were quite similar:
ovatoxin-a was by far the major component of the toxin profile (55-57% of the total toxin
content; Post-hoc SNK test, P<0.001), followed by ovatoxin-b (25-28%), ovatoxin-d and -e
(11-13%), ovatoxin-c (4-6%) and putative palytoxin (0.5-0.7%) on the basis of their
decreasing relative abundance.
Fig. 4.12 - Total and individual toxin contents of putative palytoxin, ovatoxin-a, -b, -c, -d, and -e of
the Adriatric O. cf. ovata strain grown under different temperatures, in the exponential (A) and
stationary (B) phase. HR LC-MS measurements (pg cell-1) were carried out for cell pellet extracts.
20°C 25°C 30°C 05
101520253035404550556065
B
A
pPLTX OVTX-a OVTX-b OVTX-c OVTX-d,e TOT
pPLTX OVTX-a OVTX-b OVTX-c OVTX-d,e TOT
stationary phase
exponential phase
conc
(pg
cell
-1)
20°C 25°C 30°C 0
10
20
30
40
50
60
70
80
90
100
110
Adriatic strain (Bari)
con
c (p
g ce
ll-1)
Total toxin content of pellet extracts expressed as µg L-1 culture in both strains are reported in
Table 4.5. Toxin contents were significantly different in the stationary than in the
corresponding exponential phase (Post-hoc SNK test, P<0.001), being about 2 to 4-fold
higher at the end of the growth. Total content expressed as µg L-1 culture was higher in the

111
Adriatic strain than in the Tyrrhenian one and the highest value was detected at 20°C either
for both isolates and growth phases (270 and 242 µg L-1 culture for the Adriatic and
Tyrrhenian strain, respectively). At the other two temperatures (25 and 30°C) not significant
differences were reported in the expoenetial phases, whereas values significantly changed in
the stationary phase (ANOVA, P<0.05): 25 and 30°C resulted in a higher toxin content for the
Adriatic (251 µg L-1 culture) and Tyrrhenian (156 µg L-1 culture) strain, respectively.
Fig. 4.13 - Total and individual toxin contents of putative palytoxin, ovatoxin-a, -b, -c, -d, and -e of
the Tyrrhehnian O. cf. ovata strain grown under different temperatures, in the exponential (A) and
stationary (B) phase. HR LC-MS measurements (pg cell-1) were carried out for cell pellet extracts.
20°C 25°C 30°C 05
101520253035404550556065 A
pPLTX OVTX-a OVTX-b OVTX-c OVTX-d,e TOT
pPLTX OVTX-a OVTX-b OVTX-c OVTX-d,e TOT
stationary phase
exponential phase
conc
(pg
cell
-1)
20°C 25°C 30°C 0
102030405060708090
100110120130140150 B
Tyrrhenian strain (Latina)
con
c (p
g ce
ll-1)
Total and individual toxin contents on a per cell basis (pg cell-1), are reported in Fig. 4.12 and
4.13 for the Adriatic and Tyrrhenian strain, respectively. Differences in total toxin content
were observed between the strains: the strain from Bari was more toxic at all the different
growth temperatures besides at 20°C in the stationary phase, where a maximum value of 130

112
pg cell-1 was reported for the strain from Latina (Fig. 4.13). Toxin expressed on a cell basis
resulted in a different toxicity pattern, in fact in the Adriatic strain the highest toxin content
was observed at 25°C in the stationary phase (99 pg cell-1), followed by 20°C (91 pg cell-1)
and 30°C (63 pg cell-1), while in the Tyrrhenian strain the maximum toxin amount found at
20°C (130 pg cell-1) was followed by 25°C (79 pg cell-1) and 30°C (74 pg cell-1).
Table 4.5 – Total toxin content (pPLTX and OVTX-a,b,c,d,e) in the cell pellets of the two Ostreopsis
cf. ovata strains (OOAB0801 and OOTL0707) grown at the different temperatures, measured in both
exponential and stationary phases. Data are expressed as µg L-1 culture.
Adriatic strain (Bari)
conc (µ (µ (µ (µg/L) Tyrrhenian strain (Latina)
conc (µ (µ (µ (µg/L)
exp. phase stat. phase exp. phase stat. phase 20°C 97.4 270.3 63.0 242.2 25°C 68.0 250.7 58.9 131.8 30°C 71.9 214.3 59.9 155.9
Conclusion
Ostreopsis cf. ovata proliferation in the Italian coasts is characterized by differences in the
environmental paraters, especially in temperature values (Pistocchi et al., 2011). To evaluate
the effect of temperature on the growth and toxicity of this dinoflagellate, various strains
isolated in recent years in the Italian costal waters, have been cultured and compared.
Growth pattern
Temperature resulted to affect O. cf. ovata growth, as the analyzed Adriatic and Tyrrhenian
strains reported the highest growth rates at 25°C, whereas the lowest rates was recorded at
30°C. These results differed slighltly from those obtained using another Adriatic isolate from
Ancona (see section 4.2.1), which showed a better growth rate at 20°C. However, our results
are in good agreement with field surveys in the Adriatic and Tyrrhenian Seas, where O. cf.
ovata proliferation occurs in different period of the year: in July and August blooms are
present in the Tyrrenian Sea (Tognetto et al., 1995; Simoni et al., 2004) and southern Adriatic
Sea (Ungaro et al. 2005), when water temperature is around 24-28°C; while blooms are
usually detected in the northern Adriatic Sea near Ancona from the end of August to October,
with water temperature about 20-22°C (Totti et al., 2010; Monti et al., 2007). Despite Granéli
et al. (2011) indicated, for a Tyrrhenian O. cf. ovata strain, that high water temperatures (26-

113
30°C) increased both growth rate and yield, our survey showed that the growth yield of a
different Tyrrhenian strain (from Latina) was higher at 20°C.
However, these results agree in highlighting one more time that Adriatic and Tyrrhenian
strains are differently affected by environmental temperature.
Toxin profile
Putative palytoxin and all the ovatoxins so far known (Ciminiello et al., 2010) were detected
in all O. cf. ovata extracts. In the cultures grown under different conditions relative abundance
of individual toxins was similar, with ovatoxin-a and putative palytoxin being the major and
the minor component of the toxin profile, respectively.
The total toxin content of the strains from Bari and Latina on a per cell basis (pg cell-1) was
significantly higher (ANOVA, P<0.01) than that detected for the Adriatic strain from Ancona,
which reported values in the range 12-23 pg cell-1. These strains have a toxin content about 5
to 6-fold higher and even when toxin were expressed on a culture volume basis toxicity
resulted significantly higher (ANOVA, P<0.01). A reverse correlation between growth and
toxin production, as reported also by Granéli et al. (2011), was found also for these strains:
the highest total toxin content (µg L-1) was measured at temperature 20°C in both strains,
while growth rates were higher at 25°C. However, the correlation between growth and toxin
content is still not clear, depsite it had been already reported for other dinoflagellates
(Etheridge and Roesler, 2005; Errera et al., 2010; Guerrini et al., 2007).
These highlighted differences in the toxin production may have important implication in O.
cf. ovata proliferation, as blooms in these coastal areas (southern Adriatic and Tyrrhenian
Sea) may cause more relevant toxic effects on the ecosystem and human health problems.
4.2.3. Changes of O. cf. ovata palytoxin-like compounds under N- and P- limitation
It is well recognized that environmental factors such as temperature, salinity, light, and
nutrient unbalanced conditions affect both growth and toxicity of many planktonic toxic
dinoflagellates (Morton et al., 1992; Granéli and Flynn, 2006); while the role of the different
environmental conditions favouring the onset of benthic harmful dinoflagellates has been less
investigated (Morton et al., 1992; Van Dolah, 2000; Chateau-Degat et al., 2005; Yasumoto et
al., 1977).
Up to now, worldwide surveys including Mediterranean area, suggest that temperature,
hydrodynamism, wave action, and substrate typology display major roles for Ostreopsis spp.
growth (Totti et al., 2010; Pistocchi et al., 2011) as for other epibenthic dinoflagellates typical

114
of ciguatera areas (Morton et al., 1992; Van Dolah, 2000; Chateau-Degat et al., 2005;
Yasumoto et al., 1977), while links with salinity and nutrient availability are less clear.
N:P supply is a topic of particular concern for the development of nuisance algal blooms with
or without enhancement through eutrophication (Flynn, 2002). In field situations, changes in
the nutrient N:P supply ratio are to be expected both for cells exposed to tidal or river flows
(Flynn, 2002). Indeed changes in nutritional status due to eutrophication of the coastal waters
(Nixon, 1995), together with increasing surface water temperature and water column stability,
favour the occurrence and proliferation of a selected group of phytoplankton (Balode et al.
1998; Anderson et al., 2002; Parsons et al., 2007; Hallegraeff, 1993; Heisler et., 2008; Collos
et al., 2004). Decreases in N/P ratios due to phosphorus loading have been related to harmful
algal bloom events (Hodgkiss and Ho, 1997), including many planktonic toxic dinoflagellates
of the genus Alexandrium (Bechemin et al., 1999).
Most studies agree that nitrogen or phosphorus limitation reduces growth of toxic
dinoflagellates (Gallardo Rodríguez et al., 2007; Shi et al., 2005; Siu et al., 1997; Wang and
Hsieh, 2002). Nevertheless, changes of the nutrient pool affect not only the growth of the
organisms but also their biochemical composition. In laboratory controlled setting, cellular
toxin of some paralytic shellfish toxins (PSTs) producing species are induced under P-limited
or high N/P ratio conditions (Boyer et al., 1987; Anderson et al., 1990; Bechemin et al.,
1999), while other studies showed that an increase of cellular toxin is due to simultaneous N
and P limitations (Flynn et al., 1994; John and Flynn, 2000). The difference might be due to
ecotypic variation in ecophysiological adaptation in the environment from where they
originated. Anyhow, P-stress has been often associated with the development of major
toxicity in flagellates (Granéli et al., 1998; John and Flynn, 2000) planktonic dinoflagellate
(Frangopulos et al., 2004; Guerrini et al., 2007), but also in benthic dinoflagellates such as
Prorocentrum lima. For some harmful species like P. lima (Tomas and Baden, 1993),
Prymnesium parvum (Johansson and Granéli, 1999) and Chrysochromulina polylepis (Dahl et
al., 2005; Johansson and Granéli, 1999) phosphorus limitation increases toxicity through
stimulation of toxin production.
With regard to Ostreopsis cf. ovata and more generally to Ostreopsidaceae the role of
nutrients and/or nutrient unbalanced conditions on Ostreopsis spp. growth and toxicity is
almost unknown. Very limited information on relationships between field nutrient
concentrations and Ostreopsis abundances deal with some environmental surveys carried out
for assessing and monitoring the presence and abundance of the epibenthic dinoflagellates
which typically co-occur in ciguatera endemic regions. In some of these studies, although

115
some evidence appears on the linkage between nutrient concentrations and benthic
dinoflagellates abundances, the results based on correlation analyses are controversial (Vila et
al., 2001; Delgado et al., 2006; Parsons and Preskitt, 2007; Okolodkov et al., 2007; Shears
and Ross 2009; Armi et al., 2010).
So far, information on laboratory experiments assessing effects of nutrient unbalanced
conditions on O. cf. ovata growth and toxin production are almost lacking (Granéli et al.,
2008).
The aim of this work was to investigate how nutrient limited conditions affect O. cf. ovata
cell growth and toxin content. To do this, a O. cf. ovata strain isolated from the Adriatic Sea
(OOAN0601) was grown under 1/50-nitrogen limited and 1/50-phosphorus limited conditions
with respect to control nutrient conditions (five-fold diluted f/2 medium plus selenium; N/P
ratio: 16).
Experimental section
Cultures of Ostreopsis cf. ovata
O. cf. ovata was isolated by the capillary pipette method (Hoshaw and Rosowski, 1973) from
water samples collected along the Adriatic coasts of Italy (Marche region, Numana sampling
site, strain OOAN0601) in October 2006 (see section 4.2.1). Cultures were established at
salinity 36 and 20°C, in a thermostatic room under a 16:8 h L:D cycle from cool white lamp,
maintaining light irradiance at 100-110 µmol m−2 s−1. In order to evaluate the effect of
nutrient concentrations on growth and toxicity of O. cf. ovata, cultures were prepared adding
macronutrients at a five-fold diluted (for control), and twenty five-fold diluted f/2 (Guillard,
1975) concentrations for N- and P- depletion conditions.
As previoulsy descrive (section 4.2.1), to evaluate the growth profile, 15 Erlenmeyer flasks
containing 200 ml of culture were grown in parallel for each condition; every other day, two
out of the initial flasks were treated with HCl to a final concentration of 4 mM and discarded
after the counting. Cell counts were made following Utermöhl method (Hasle, 1978), while
calculation of cell volume was made with the assumption of ellipsoid shape using the
following equation (Sun and Liu, 2003).
For each nutrient condition, a set of four 800 mL culturing flasks was set up for the evaluation
of toxin content. Cell counting was carried out on one out of the four flasks as described
above. Culture collections were carried out during either the exponential and stationary
growth phases by gravity filtration through GF/F Whatman (0.7 µm) filters at day 9th and 22th,

116
respectively. Cell pellets and growth media for each condition were provided for chemical
analysis.
Chemical analysis
HR LC-MS analyses of palytoxin-like compunds were performed as reported in section 4.2.1.
Nutrient analysis
Nitrate and phosphate analyses were performed on filtered culture medium aliquots (Millipore
cellulose filters, pore size 0.45 mm) and analysed spectrophotometrically according to
Strickland and Parsons (1972).
Results
Nutrient concentrations
Figures 4.14 shows nutrient concentration changes during O. cf. ovata cell growth under
control, N-nitrogen and P-phosphorous limited conditions (N:P ratio: 17, 5, 105,
respectively). Under control conditions (actual initial concentrations: N = 108 and P = 6.35
µM, respectively; N:P ratio = 17), both N-nitrogen and P-phosphorous were rapidly taken up
leading to a N:P ratio of about 30 from day 6 to day 9, when N and P concentrations (20.18
and 0.65 µM, respectively) were about 5-fold and 10-fold lower than initial concentrations.
During stationary phase nutrient concentrations decreased further (i.e. N = 2.14 and P = 0.48
µM, respectively, 13th day), especially N concentration, and the N:P ratio dropped to values
<5. Finally, in late stationary phase (i.e. 22nd day) N:P ratio was <2 (N = 0.73 and P = 0.40
µM).
Under N-limited conditions (initial concentrations: N = 29.29, P = 5.29 µM, respectively;
N:P ratio= 5.54) N concentration decreased rapidly within the first 6 days (N = 2.68 µM; 10-
fold lower than N initial concentration) and by the end of the exponential phase (6-9th day) N
and P concentrations were <1 and >4.5 µM, respectively with a N:P ratio <1 (N:P ratio =
0.17); thus, most of the phosphate was available in late stationary phase (22nd day), whereas N
was mostly depleted (0.2 and 3.7 µM, for N and P, respectively).
Under P-limited conditions (initial concentrations: N = 120 and P = 1.14 µM; N:P ratio =
105), from late exponential phase to late stationary phase (i.e. from 9th from 22nd day) both N
and P concentrations changed slightly (N = 20, P = 0.69 µM at 9th day, and N = 14, P = 0.45
µM at 22nd day) resulting in a almost constant N:P ratio of about 30 (29 and 32, 9th and 22nd
day, respectively).

117
Fig. 4.14 - Nitrogen (NO3-) and phosphorus (PO4
3-) concentrations measured in O. cf. ovata cultures
grown under different nutrient conditions. Bars indicate standard deviations.
0 2 4 6 8 10 12 14 16 18 20 22 240
1
2
3
4
5
6
7
8A)
P-P
O4 (
µmol
L-1)
Days
Control N-Deficiency P-Deficiency
0 2 4 6 8 10 12 14 16 18 20 22 240
20
40
60
80
100
120
140
160
B)
N-N
O3 (
µmol
L-1)
Days
Control N-Deficiency P-Deficiency
Cell growth and cell size
Growth curves of Ostreopsis cf. ovata under control N- and P-limited conditions are shown in
Figure 4.15. Initial cell densities were on average, 300-330 cells mL-1 and the exponential
growth phase lasted till 6-9th day.
Fig. 4.15 - Growth pattern of O. cf. ovata cultures exposed to different nutrient concentrations.
0 2 4 6 8 10 12 14 16 18 20 22 24100
1000
10000
n ce
ll m
l-1
Days
Control P - Deficiency N - Deficiency
During the early exponential phase (i.e. from 1st to 6th day) the mean growth rate (µ) was
significantly lower under nutrient limited conditions comparing to control (µ= 0.40 ± 0.013,
0.29 ± 0.034, and 0.24 ± 0.055, day-1, for control, N- and P-treatment, respectively; ANOVA,

118
both P<0.001), whereas, no significant difference was found between N- and P-limited
treatments (P>0.05).
Fig. 4.16 - Cell volumes of O. cf. ovata cells exposed to different nutrient conditions.
Control N- Deficiency P- Deficiency0
5000
10000
15000
20000
25000
Bio
volu
me
(µm
3 )
Exponential Phase Stationary Phase
As a result, by the end of the exponential phase (6-9th day) under both nutrient limited
conditions cell densities were significantly lower than in the control conditions (1.9- and 1.5-
fold lower for N- and P-treatments, respectively; ANOVA, both P≤0.05). Finally, in the
stationary phase (22nd), cell yields under N-limited and P-limited treatments attained to a 2.2-
fold and 1.8-fold lower values with respect to control yield (mean cell yield: 4.57 x 10³, 2.31
x 103, and 2.95 x 10³ cells mL-1, for control, N-, and P- limited conditions, respectively;
ANOVA, P<0.001). N-limited cell yield was also significantly lower than P-limited yield
(ANOVA, P<0.01).
Under all tested conditions and over the growth cycle O. cf. ovata cell cultures were
composed by two cell size classes, a small one (i.e. class 1; cell volume range: 5728-10,008
µm3, control in the exponential phase and P-limited treatment in the stationary phase,
respectively) and a large one (i.e. class 2; cell volume range: 20,280-30,232 µm3, N-limited
treatment in the exponential phase and P-limited treatment in the stationary phase,
respectively). As a general trend, under all conditions, both cell size classes showed an
increasing volume from exponential to stationary phase (Fig. 4.16) which was significant
under N-limited treatment for both classes, and under control conditions for class 1 (ANOVA,
all P<0.01) but not for P-limited treatment. The highest cell volumes were found under P-
limited conditions over the growth cycle with significant higher values for class 1 when
compared to control (ANOVA, P<0.01 and P<0.05, exponential and stationary phase,
119
respectively), and for both classes when compared to N-limited conditions (ANOVA, P<0.05,
class 1 in both phases; ANOVA, P<0.01, class 2 in the exponential phase).
The relative contribution of the two size classes to the total cell abundance and cell volume
showed different temporal trend under the different nutrient conditions (data not shown).
More in deep, under control conditions cells were mostly of class 2 and their relative
contribution to the total cell abundance increased slightly and not significantly from the
exponential to the stationary phase (67 and 70%, respectively). A similar high contribution of
class 2 cells to cell abundance was found under P-limited condition, although this contribution
decreased slightly from the exponential to the stationary phase (73 and 66% of total cells, in
exponential and stationary phase, respectively). Differently, under N-limited conditions class
2 cells represented 52 and 54% of the total cell numbers in the exponential and in the
stationary phase, respectively. So that, the recorded changes in cell size composition and cell
class volume returned into: 1) a significant lower mean cell volume under N-limitation over
the growth cycle when compared to both control (29 and 18% lower in the exponential and
stationary phase, respectively) and P-limited conditions (40 and 20% lower in the exponential
and stationary phase, respectively; ANOVA, all P<0.001); 2) a significant higher cell volume
under P-limitation in the exponential phase when compared to control conditions (19%;
ANOVA, P<0.001) (2% in stationary phase); 3) a significant increase of the mean cell volume
from exponential to stationary phase under control and N-limited conditions (ANOVA,
P<0.001), but not under P-limitation (ANOVA, P>0.05).
Toxin concentrations
As general, under all tested conditions (either control, N- or P- deficiency) O. cf. ovata
showed the same qualitative toxin profile producing putative palytoxin (pPLTX), ovatoxin-a
(OVTX-a), and the recently identified palytoxin-like compounds OVTX-b, OVTX-c, OVTX-
d, and OVTX-e (Fig. 4.17). The relative contribution of each toxin to the total toxin content
varied slightly throughout the experiments with OVTX-a and OVTX-b as major contributors
(accounting for 52-53% and 23-26%, respectively), followed by OVTX-d plus OVTX-e (13-
15%), and OVTX-c (6.6-7.4%); whereas pPLTX contribution was less than 2%. Moreover,
under all tested conditions, toxin concentrations (either expressed on per cell or on cell
volume basis) showed an increasing trend from the exponential to the stationary growth
phase. Nevertheless, toxins content of cells grown at different nutrient conditions changed
differently over cell growth cycle.
120
Fig. 4.17 – Total and individual toxin contents of putative palytoxin, ovatoxin-a, -b, -c, -d, and -e of
the Adriatric O. cf. ovata strain grown under different nutrient conditions, in the exponential (1) and
stationary (2) phase. HR LC-MS measurements were carried out for cell pellet extracts and espressed
as content per cell (pg cell-1) (A), per biovolume, (fg µm3) (B) and per culture volume (µg L-1) (C).
Control N Deficiency P Deficiency0
5
10
15
20
25
30A1 Exponential phase
pg c
ell-1
pPLTX OVTX-a OVTX-b OVTX-c OVTX-d,e Total
Control N Deficiency P Deficiency0
5
10
15
20
25
30A2
Stationary phase
pg c
ell-1
pPLTX OVTX-a OVTX-b OVTX-c OVTX-d,e Total
Control N Deficiency P Deficiency0.0
0.2
0.4
0.6
0.8
1.0
1.2
1.4
B1Exponential phase
fg µ
m3
pPLTX OVTX-a OVTX-b OVTX-c OVTX-d,e Total
Control N Deficiency P Deficiency0.0
0.2
0.4
0.6
0.8
1.0
1.2
1.4
B2 Stationary phase
fg µ
m3
pPLTX OVTX-a OVTX-b OVTX-c OVTX-d,e Total
Control N Deficiency P Deficiency0
25
50
75
100
125
150C1
Exponential phase
µµ µµ g
L-1
pPLTX OVTX-a OVTX-b OVTX-c OVTX-d,e Total
Control N Deficiency P Deficiency0
25
50
75
100
125
150
C2Stationary phase
µµ µµ g
L-1
pPLTX OVTX-a OVTX-b OVTX-c OVTX-d,e Total

121
More in details, under control conditions, all toxins on a cell basis, showed significantly
higher concentrations (close to 2-fold) in the stationary growth phase compared to the
exponential phase (ANOVA, all P<0.01; Fig. 4.17A).
Control toxin concentrations expressed on cell volume basis ranged from 0.012 to 0.564 fg
µm-3 (pPLTX in the exponential and OVTX-a in the stationary phase, respectively; Fig.
4.17B), showing the same significant increasing trend (up to 1.6-fold).
N-limited condition: comparison between growth phases. Under N-limited condition,
concentration of all toxins on a cell basis also increased (about 1.35-fold for all toxins except
for pPLTX with a 2.1-fold) over the growth cycle (Fig. 4.17A); however, it resulted not
significantly (ANOVA, all P>0.05). The relative increase of each toxin concentration was
reduced when expressed on cell volume basis (from 0.97-fold to 1.13, OVTX-d plus OVTX-e
and pPLTX, respectively; ANOVA, all P>0.05, Fig. 4.17B) due to significant higher cell
volume in the stationary phase with respect to the exponential phase.
N-limited condition: comparison between control and N-treatment. Under N-limitation all
toxins showed lower concentrations (on a cell basis) with respect to control conditions over
the growth cycle (Fig. 4.17A). Nevertheless, in the exponential phase, toxin concentrations
were significantly lower only for pPLTX and OVTX-c compared to control (ANOVA,
P<0.05, and P<0.01, respectively). These significant differences still persist when values were
referred to cell volume (ANOVA, P<0.01 for both pPLTX and OVTX-c) regardless the
significant smaller cell volume found under N-limitation than in control conditions all over
the growth cycle (29% and 18% smaller than control, exponential and stationary phase,
respectively). Whereas, over stationary phase, all toxins concentration on cell basis, were
significantly lower with respect to control conditions (ANOVA, P<0.01 for OVTX-a,
OVTX-b, and total toxins; and P<0.001 for pPLTX, OVTX-c, and OVTX-d plus OVTX-e)
with a decrease exceeding 50% for all toxins (range: 51-57% lower than control, OVTX-a
and OVTX-c, respectively). In details, the highest reduction was observed for OVTX-c
concentration (57% lower than control conditions) followed by pPLTX (55%), whereas
OVTX-a, OVTX-b showed almost the same decrease with respect to control (i.e. 51 and
53%, respectively). When comparison was performed on cell volume basis all toxin
concentrations showed similar pattern and were still significant lower than under control
conditions (ANOVA, all P<0.01), although the relative decrease was reduced (range: 40 to
47% lower than control, OVTX-b and OVTX-c, respectively).

122
P-limited condition: comparison between growth phases. Under P-limitation all toxin
concentrations on a cell basis (Fig. 4.17A) increased over the growth cycle, with significant
higher values in the stationary phase for pPLTX, OVTX-a, OVTX-b, and OVTX-c, compared
to exponential phase (ANOVA, P<0.05). Toxin concentration on a cell volume basis (Fig.
4.17B) showed the same results and statistical pattern (exponential phase range: 0.007–0.234
fg µm-3, pPLTX and OVTX-a, respectively; stationary phase range: 0.010–0.330 fg µm-3,
pPLTX and OVTX-a, respectively; ANOVA, P<0.01 for pPLTX and OVTX-c; P<0.05 for
OVTX-b), however accompanied with a reduced increasing range (i.e. from 1.25-fold to 1.53-
fold, for OVTX-d plus OVTX-e and OVTX-b, respectively).
P-limited condition: comparison between control and P-treatment. Under P-limitation, in the
exponential phase, all toxins showed lower concentrations than those found under control
conditions, nevertheless differences were not significant (ANOVA, P>0.05). When data were
expressed on cell volume basis (Fig. 4.17B), pPLTX, OVTX-c, OVTX-d plus OVTX-e
showed significant lower values than in the control (ANOVA, P<0.05), very likely due to a
significant higher cell volume (20% higher). In the stationary phase, toxin values on cell basis
were significant lower when compared to control conditions; the highest decrease was
observed for pPLTX (49% lower than control; ANOVA, P<0.001) followed by OVTX-d plus
OVTX-e, (46 % lower than control; ANOVA, P<0.01), OVTX-c (44% lower than control,
ANOVA, P<0.001), OVTX-a (39%, ANOVA, P>0.05) OVTX-b (36%, ANOVA, P<0.05),
total toxin (P<0.05). When toxin concentrations were expressed on a cell volume basis, all
toxins presented the same significant decreasing trend found (range: 38-49%, OVTX and
pPLTX, respectively) with respect to control (ANOVA, all P<0.01).
Comparison between N-limited and P-limited conditions. When comparing toxin
concentrations (on per cell basis) in both exponential and stationary growth phases (Fig.
4.17A), N- and P-deficient conditions no significant differences were found for all toxins,
except for OVTX-c at stationary phase (ANOVA, P<0.001); in fact OVTX-c concentrations
showed significant lower values (22% less) under N-treatment when compared with P-
treatment (0.76 and 0.98 pg cell-1, respectively). In the exponential phase when comparing
toxin concentration expressed on a cell volume basis (Fig. 4.17B), pPLTX, OVTX-c, OVTX-
d plus OVTX-e were significant lower under P-limitation than under N-limitation (ANOVA,
P<0.05 and P<0.01 for pPLTX, OVTXd,e, and OVTX-c, respectively). By contrast, in the

123
stationary phase toxin concentration did not show any difference between N- and P-treatment
(ANOVA, all P>0.05).
Conclusion
The results reported in this study show that nutrient unbalanced conditions affects O. cf. ovata
cell growth rate, biovolume, yield, and toxin amounts. While a cell growth limitation was
expected, a toxin content decrease was more surprisingly.
Cell growth and nutrients
Results reported in this study show that both N- and P- applied limited conditions affected O.
ovata cell growth already in the early exponential phase due to a significant reduction of the
mean growth rate (mean value 0.26 day-1) compared to that one found under balanced nutrient
conditions (0.40 day-1) that was within the range of values reported for Mediterranean O. cf.
ovata strains (section 4.2.1 this thesis; Guerrini et al., 2010; Granéli et al., 2010) and other
worldwide distributed O. spp. strains (Pearce et al., 2001).
Therefore, both nutrient limited conditions caused significant lower final cell yields with
respect to control conditions with more severe effects under N-limitation.
O. cf. ovata growth pattern was clearly dependent on nutrient dynamics; under control
conditions (N:P ratio = 16) phosphorous uptake rates (data not shown) were high during the
exponential phase while nitrogen maintained relative high uptake rates also during the early
stationary phase. Accordingly, under N-limitation (N:P = 5), nitrogen was exhausted by the
end of the exponential phase reaching a N:P ratio <1. On the other hand, under P-limitation
(N:P = 100) most phosphorous was uptake during the first few days of growth (day 2),
reporting in the exponential phase (day 6) a N:P ratio of about 400; thereafter, phosphorous
concentration slightly changed, leading to a nearly steady N:P ratio of about 30.
Interestingly, O. cf. ovata growth was affected more severely by nitrogen than phosphorous
limitation and this in accordance with recent results reported by Vidyarathna and Granéli
(2010). Whereas, this result may be apparently in contrast with findings for some toxic
planktonic dinoflagellates including diarrheic shellfish poisoning (DSP) species (e.g.
Protoceratium reticulatum; Guerrini et al., 2007; Gallardo Rodríguez et al., 2009), and
paralytic shellfish poisoning (PSP) (e.g. Alexandrium minutum, Lim et al., 2005) (Granéli and
Flynn, 2006 and references therein), but also for some benthic dinoflagellates such as P. lima
(Varkitzi et al., 2010; Vanucci et al., 2010), as P was found to affect mainly their growth.
It has to be noted that N and P concentrations per se are also important factors to be
considered when dealing with the effect of nutrient on dinoflagellate cell growth. Indeed, the

124
initial nutrient amounts interfere with the dynamics of nutrient cell uptake, storing and
nutrient intracellular ratio, and ultimately on timing of nutrient limitation status. For instance,
the complex mechanisms underlying P uptake, its transport and assimilation interactions
within the cell depend on species cell eco-physiology and on internal nutrient ratio which is
the effective ratio (Flynn, 2002). As such, John and Flynn (2000) showed that in the absence
of phosphate, growth and carbon fixation of Alexandrium species continue for several
generations, and phosphate may only be limited under N:P ratios which are significantly
higher than Redfield ratio.
In our P-limited conditions, at the end of the exponential phase, residual P concentrations
were still available (about 0.4 µM) accompanied by appreciable N concentrations;
nevertheless, as mentioned above, cells experienced strong P-limitation during early
exponential phase preventing cell algal division.
Nutrient limited conditions also affected O. cf. ovata cell size; particularly, P stress resulted in
an increase of cell biovolume. The percentage of large cells recorded at the stationary phase
under P-depleted condition was similar to that one found under control condition at the end of
the exponential phase when cell experienced a similar N/P ratio (31). This behaviour was also
observed in other species of both planktonic (e.g. Latasa and Berdalet 1994; John and Flynn
2000; Lim et al. 2005) and benthic dinoflagellates (Vanucci et al., 2010; Varkitzi et al.,
2010). John and Flynn (2000) suggesting that the increase in cell biovolume is due to the
arrest of cells in the G1 phase (Vaulot et al. 1996) without undergoing cell division, while
other non-P compounds continued to be synthesized.
Toxins
Under all tested conditions O. cf. ovata Adriatic strain showed the same qualitative toxin
profile producing pPLTX, OVTX-a, OVTX-b, OVTX-c, OVTX-d, and OVTX-e, with
OVTX-a being the major contributor to the total toxin content (>50%). Moreover, under all
tested conditions, toxin concentrations increased from exponential to stationary growth phase;
however, this increase was significantly reduced under both N- and P-nutrient limited
conditions. The major effect was found under nitrogen limitation with a decrease of final total
toxin content of 51% and 39.6% for N-and P-limitation, respectively, when compared to
control conditions. Increasing toxin production during the growth was consistent with
previous results on different O. cf. ovata strains (Guerrini et al., 2010) and other toxic benthic
dinoflagellates such as P. lima (Vanucci et al., 2010; Varkitzi et al., 2010; McLachlan et al.,

125
1994; Sohet et al., 1995). Whereas, the decreasing toxin trend induced by unbalance nutrients
appears quite different from the results found for P. lima and many other toxic dinoflagellates.
In this study, N-deficiency affected toxin production with major effects under stationary
growth phase, although pPLTX and OVTX-c amounts were significantly affected also during
exponential phase. Moreover, comparison with control conditions also indicates that under N-
limitation the lower toxin amounts is due to a factual decrease in toxin production as under N-
limitation cell volume was significantly smaller than under control conditions all over the
growth cycle.
Conversely to the observations under N-limitation, P-limited conditions did not affect cell
toxin production during the exponential phase at the end of which N:P ratio was about 30.
The lower toxic concentrations found for some toxins when expressed on cell volume basis
are very likely ascribable to the significant higher cell volume found under P-limitation when
compared to control (20% higher than control) due to inhibition of cell division. This
indicates that during exponential phase P-limitation affects cell yield whereas cell
biochemical pathways involved in qualitative and quantitative production of toxin did not
appear to be significantly affected.
As O. cf. ovata toxins are N containing compounds, our results agree with the results reported
for species producing N-rich toxins; in fact N-rich PSP-toxins are synthesized during N-
upshock and P-stress (which gives relatively high N-status) and not during N-downshock
(Flynn et al., 1994; Granéli et al., 1998; Granéli and Flynn 2006 and references therein). In
the tentative to minimize batch experimental artefacts as possible. N and P concentrations
reported during Ostreopsis spp. surveys worldwide may be taken into consideration and
reported a high N-limitation (nitrate range: 0.2–12.5 µM; phosphate range: 0.005–4.28 µM;
Pistocchi et al., 2011). In this study we used low concentrations for both nutrients and a
Redfield ratio for control. In our conditions, neither N-upshock and P-stress which gives
relatively high N-status were experienced by O. cf. ovata.
4.3. Toxin characterization of Italian O. cf. ovata strains
Since O. cf. ovata cells present different growth and toxicity characteristics in the different
coastal areas, several strains isolated from field water samples collected along the Italian
coasts in recent years were analyzed for their toxin content and their toxin production was
compared.

126
An important issue in the ovatoxins field is represented by lacking of certified reference
standards of palytoxin and its analogues; they are difficult to be obtained in acceptable
amounts until a large scale culturing of Ostreopsis spp. as well as efficient isolation
procedures of the produced toxins will be developed. Currently, quantitation is carried out
basing on the tentative assumption that palytoxin-like compounds show the same molar
response as palytoxin itself, but even limited structural features in large molecules as
palytoxins could significantly impact their ionization efficiency (Ciminiello et al., 2011).
Therefore, this work was also done with the aim to select one strain, with the highest toxin
production efficency, to be used for large scale culturing in order to isolate ovatoxins and
characterize their structures.
Experimental section
Cultures of Ostreopsis cf. ovata
O. cf. ovata strains isolated by the capillary pipette method (Hoshaw and Rosowski, 1973)
from water samples collected along the Adriatic and Tyrrhenian coasts of Italy in 2006, 2007
and 2008 were cultured. Adriatic strains were: OOAN0601 (from Numana, Marche region,
isolated in 2006); OOAN0709 (from Numana, Marche region, isolated in 2007); OOAN0816
(from Numana, Marche region, isolated in 2008); and OOAB0801 (from Bari, Puglia region,
isolated in 2008); the Tyrrenian strain was OOTL0707 (from Latina, Lazio region, isolated in
2007). Cultures were established at salinity of 36 and temperature of 20°C, in a thermostatic
room under a 16:8 h L:D cycle from cool white lamp, maintaining light irradiance at 100-
110 µmol m−2 s−1. In order to evaluate the toxin content of O. cf. ovata strains, cultures were
prepared adding macronutrients at a five-fold diluted f/2 (Guillard, 1975) concentrations with
selenium.
For each isolate, two 400 mL culturing flasks were set up for the evaluation of toxin content,
and culture collections were carried out during the late stationary growth phases (day 25) by
gravity filtration through GF/F Whatman (0.7 µm) filters. Cell pellets for each condition were
provided for chemical analysis.
Chemical analysis
HR LC-MS analyses of palytoxin-like compunds were performed as reported in section 4.2.1.

127
Results and discussion
Cell pellets of several O. cf. ovata cutures grown at the same conditions (temperature 20°C
and salinity 36) were collected during the late stationary growth phase. Samples were
separately extracted as reported in the experimental and the crude extracts were used to
evaluate the toxin profile. HR LC-MS experiments were acquired in full MS mode by using
an LC method which allowed chromatographic separation of the major components of the
toxin profile (see sections 4.2, this thesis). Due to lack of standards for ovatoxins, quantitative
analyses were carried out basing on the tentative assumption that they present the same molar
response as palytoxin.
The presence of putative palytoxin and of all the ovatoxins (ovatoxin-a, -b, -c, -d, and -e)
recently identified in O. cf. ovata (Ciminiello et al., 2008, 2010) was highlighted in four of
the five analyzed samples. The absence of ovatoxin-b and -c in one (OOAN0816) of the O. cf.
ovata strains was remarked for the first time and was confirmed also by subsequently analyses
of algal extracts of the same strain grown at different conditions (data not shown).
Fig. 4.18 – Individual toxin contents of putative palytoxin, ovatoxin-a, -b, -c, -d, and -e of several
Adriatic and Tyrrhenian O. cf. ovata strains in the exponential stationary phase. HR LC-MS
measurements were carried out for cell pellet extracts and espressed as toxin content per colture
volume (µg L-1).
OOTL0707 OOAN0709 OOAN0816 OOAN0601 OOAB08010
25
50
75
100
125
150
175
200
225
250
toxi
ns c
onc
(µµ µµg
/L)
pPLTX OVTX-a OVTX-b OVTX-c OVTX-d,e
Significant differences were observed in the total toxin content of the different algal extracts
(ANOVA, P<0.001), whereas relative abundance of individual toxins were quite similar in all
the strains besides the Adriatic O. cf. ovata starin isolated in 2008 (OOAB0816), which

128
reported the anomaly in the toxin profile: ovatoxin-a was by far the major component of the
toxin profile (52-54% of the total toxin content; Post-hoc SNK test, P<0.001), followed by
ovatoxin-b (25-26%), ovatoxin-d and -e (13-15%), ovatoxin-c (5-6%) and putative palytoxin
(1-2%) on the basis of their decreasing relative abundance. These amounts were in accordance
with previous data, as reported in section 4.2. The strain OOAN0816 resulted in a higher
amount of ovatoxin-a (about 76%) than the others strains, and the other detected toxins were
ovatoxin-d and -e (22%), and putative palytoxin (2%).
Total toxin content expressed as µg L-1 culture are reported in Fig. 4.18. The highest toxin
content was reported in the cell pellet of the Tyrrhenian strain OOTL0707 (314 µg L-1),
followed by the Adriatic OOAN0816 (307 µg L-1) and OOAB0801 (273 µg L-1); while
significantly (Post-hoc SNK test, P<0.001) lower amount were found in the two Adriatic
strains OOAN0709 and OOAN0601, being 201 and 129 µg L-1, respectively.
These results confirmed once again the existing differences among O. cf. ovata strains, in
term of toxin production (Guerrini et al., 2010; section 4.2.2) and reported for the first time
the absence in the toxin profile of two out of the six known palytoxin-like compounds in one
strain of this dinoflagellate.

129
5. Polyketide synthase (PKS) enzymes The majority of dinoflagellate toxins that adversely affect human health are polyether
compounds (Fig. 5.1), synthesized by complex enzymes known as polyketide synthase (PKS)
enzymes. Polyketides are often highly oxygenated compounds and include macrolides,
polyethers, polyols and aromatics. The construction of dinoflagellate polyketides, is achieved
by the polyketide pathway and probably involves a polyketide synthase (PKS) with some
additional functional segments (Shimizu, 2003).
Similar to many other dinoflagellates, O. cf. ovata is a prolific producer of secondary
metabolites; in particular, Ostreopsis spp. were proposed to be the biogenetic origin of
palytoxin (Taniyama et al., 2003). Palytoxin is a large, very complex molecule with a long
polyhydroxylated and partially unsaturated aliphatic backbone, containing 64 chiral centers
(Kan et al., 2001). Palytoxin has both lipophilic and hydrophilic regions and is referred to as a
super-carbon-chain compound, since it has the longest chain of continuous carbon atoms in
any known natural product (Wang, 2008). Besides putative palytoxin, new compounds,
namely ovatoxins, have been recently isolated from different clones of O. cf. ovata organism
through an in-depth high resolution (HR) Liquid Cromatography-Mass Spectrometry (LC-
MS) investigation (Ciminiello et al., 2010). Their structures are still unknown however, they
present elemental formulae similar to that of palytoxin.
Along the Mediterranean coasts, Ostreopsis spp. are generally present in association with
other dinoflagellate species, namely Coolia monotis and Prorocentrum spp. C. monotis is
quite common in temperate and tropical waters (Steideinger and Tangen, 1997) where it has
been frequently detected at low concentrations during warmer periods. C. monotis has been
reported to produce a toxin, named cooliatoxin, that is believed to be structurally related to
yessotoxin based upon the molecular weight, which corresponds to a monosulfated
yessotoxin, and the sympoms induced in mice however, its structure is still uncharacterized
(Holmes et al., 1995).
Polyketides are synthesized through the sequential addition of carbon building blocks
mediated by a set of coordinated catalytic sites that make up polyketide synthase enzymes
(PKSs) (Staunton et al., 2001).
Polyketide biosynthesis is analogous to fatty acid biosynthesis and involves similar catalytic
sites; the condensation reaction between carboxylic acid building blocks is performed by a •-
ketoacyl synthase (KS), and the •-keto group may be reduced by successive ketoreduction by

130
a ketoreductase (KR), dehydration by a dehydratase (DH), and enoyl reduction by an enoyl
reductase (ER) following each chain elongation step.
Fig. 5.1 - Chemical structure for some dinoflagellate toxins: (a) yessotoxin (related to Coolia monotis
toxin), (b) brevetoxin (produced by Karenia brevis), (c) palytoxin (produced by Ostreopsis spp.)
The growing carbon chain resides on a phosphopantetheine “arm” on the acyl carrier protein
(ACP) that “swings” the growing chain in proximity to catalytic sites, while the acyl
transferase (AT) brings additional “extender” units to be added to the growing chain.
Polyketides are released from the PKS complex by a thioesterase (TE), and post-PKS
modifications create the final polyketide structure.
PKS enzymes have classically been categorized as type I-III. Type I PKSs are large
multifunctional proteins with multiple active sites on a single polypepetide. Iterative Type I
PKSs are found in fungi and are analogous to vertebrate fatty acid synthase (FAS). These
complexes are multidomain proteins used repeatedly for each chain elongation. Modular, or
processive, Type I PKSs are also multifunctional proteins, but each protein has multiple
active site domains organized into modules. Each module catalyzes one chain extension
reaction and programmed reduction based on which active site domains are present in the
module. Type II PKSs build aromatic polyketides found in bacteria, and unlike Type I PKSs,
type II PKSs are organized as complexes of smaller mono-functional proteins where each
catalytic domain is located on a separate peptide, a structure similar to bacterial FAS. Also
unique to the type II PKSs is the CLF (chain length factor) domain, or KS•, that is part of the
minimal PKS required for type II polyketide biosynthesis (Rawlings, 1997). Type III PKS are
typically associated with chalcone synthases (CHS) and the stilbene synthases (STS) found
exclusively in higher plants, but Type III PKS has also recently been identified in several
bacteria (Gross et al., 2006). Type III PKSs are smaller PKSs (40-47kD) and are involved in
flavonoid biosynthesis in plants and melanin in bacteria (Funa et al., 1999; Gross et al., 2006;
Hopwood, 1997; Khosla et al., 1999).
a) b c)

131
Fig. 5.2 - A) Type I PKS: a large multifunctional enzyme with several functional or “module”
domains within a single protein. B) PKS transcript structure in K. brevis with a single domain on a
trans-spliced, polyadenylated message (modified from Monroe and Van Dolah, 2008).
Little information exists regarding protist PKSs, especially in dinoflagellates. The first protist
PKS gene was identified in the apicomplexan Cryptosporidium parvum, which is the closest
relative of dinoflagellates to have a fully sequenced genome (Zhu et al., 2000, 2002). The C.
parvum PKS gene is an intronless 40 kb open reading frame that encodes for a single 13,000
amino acid polypeptide. The polypeptide contains 29 domains including an N-terminal
loading unit, 7 modules for chain extension and modifications, and a terminator unit (Zhu et
al., 2002). Protist PKS have also been recently identified in the genomes of three
chlorophytes, Ostreococcus taurii, O. lucimarinus, and Chlamydomonas reinhardtii, and the
haptophyte, Emiliania huxleyi (John et al., 2007). Within the compact genome of two
Ostreococcus sp., three large PKS genes were identified that comprise 1.5% of the total
genome. One long open reading frame with type I PKS domains is present in the E. huxleyi
genome (John et al., 2007).
The previous identification of protist PKS relied on full genome sequencing, but due to the
large genomes of dinoflagellates (e.g. 1x10¹¹ bp in K. brevis, Van Dolah et al., 2007), the
production of genome sequences is currently intractable. Despite these impediments, a PKS
gene has been identified in Amphidinium, a dinoflagellate that produces the polyketide
amphidinolide (Kubota et al., 2006). Within the 36,000 base pair clone, six open reading
frames were identified that had sequence similarity to several PKS domains (KS, AT, DH,
KR, ACP, and TE) spanning 5625 base pairs. As for K. brevis PKSs, degenerate PCR primers
have been used to identify type I PKS KS domains in 7 dinoflagellate species, including 2
encoded by K. brevis (Snyder et al., 2003, 2005). More recently, transcripts with sequence
similarity to type I PKS were identified in K. brevis through screening of cDNA libraries to K.
brevis (Monroe and Van Dolah, 2008). Although the full-length PKS transcripts are
phylogenetically most similar to type I PKSs from other protists, bacteria, and fungi, they
KS AT DH ER KR ACP KS AT ER KR AC
1st Module 2nd Module
KS SL KR SL
A)
B)

132
contain only single catalytic domains, a structure more similar to type II PKSs. Thus, K.
brevis appears to possess type I PKSs that are unique from other known PKSs. In silico
translation of K. brevis PKS full-length transcripts previously described predicts PKS proteins
to be between 50 and 100kDa. Monroe et al. (2010) developed peptide polyclonal antibodies
from in silico translated KS and KR transcripts to confirm their predicted protein sizes, study
their expression, and determine their cellular localization. Several putative PKS genes
encoding ketosynthase (KS), ketoreductase (KR), and both acyl carrier protein (ACP) and KS
domains were identified from K. brevis (Monroe and Van Dolah, 2008), with domains
residing on separate polypeptides, more similar to Type II PKS (Fig. 5.2B) while sequence
similarity was closest to type I (Fig. 5.2A). Their altered expression in a non-toxic isolate of
K. brevis suggested their involvement in brevetoxin biosynthesis (Monroe et al., 2010);
however, evidence for their function in toxin biosynthesis was limited to correlation. Since
PKS and FAS share a long evolutionary history, it can be difficult to distinguish between
PKSs and FASs solely on sequence information. The only evidence to suggest these PKSs are
involved in brevetoxin biosynthesis was their presence in K. brevis and their absence from
dinoflagellate species that do not produce brevetoxins, as determined by gene specific PCR.
Four PKS transcripts were determined to be K. brevis-specific, KB1008, KB2006, KB5299,
and KB5361, while the remaining four transcripts were identified in other dinoflagellate
species. From this data it was hypothesized that the four PKSs found in other dinoflagellates
might be involved in processes conserved among dinoflagellate species, like fatty acid
synthesis, while the four K. brevis-specific sequences could be involved in brevetoxin
biosynthesis.
Since no information exists on PKS proteins of other toxic dinoflagellates, in the current work
antibodies developed against K. brevis PKS proteins were used to probe for the expression
and intracellular localization of PKS domains in the two PKS producing dinoflagellates
(Ostreopsis ovata, Coolia monotis), and a raphidophyte (Fibrocapsa japonica) which causes
blooms in the Adriatic Sea and is known to produce high concentrations of free fatty acids
(FFA) (Pezzolesi et al., 2010). For the PKS localization within the cells, chloroplasts were
isolated from the algal cells, based on the results previously ottained in K. brevis. This work
was completed at NOAA (Charleston, SC, USA) in the laboratory of the Dr. Frances Van
Dolah, with the aim to investigate the role of the identified PKSs in toxin biosynthesis.

133
5.1. Experimental section
5.1.1. Algal cultures
O. cf. ovata (strains OOAB0801 and OOTL0707) were isolated by the capillary pipette
method (Hoshaw and Rosowski, 1973) from water samples collected along Adriatic (Bari,
Puglia) and Tyrrhenian (Latina, Lazio) coasts of Italy in 2008 and 2007, respectively. C.
monotis (strain CMAB0801) was isolated along the Adriatic (Bari, Puglia) in 2008, while F.
japonica (strain FJAP0603) was isolated in 2006 in Adriatic Sea near Palombina (Marche,
Italy). After an initial growth in microplates, cells were cultured at 20°C under a 16:8 h L:D
cycle from cool white lamp in natural seawater at salinity 36, adding macronutrients at a five-
fold diluted f/2-Si for O. cf. ovata and C. monotis and at a f/2-Si medium (Guillard, 1975) for
F. japonica. Cultures were made with natural seawater, adjusted to a salinity of 36 through
the addition of distilled water, and kept under the temperature and the light conditions
described above.
The experiment was carried out by growing 9000 mL of culture for each strain, from which
triplicate 2000 mL aliquots were used for ‘chloroplast’ isolation and triplicate 1000 mL
aliquots were used for ‘whole cell’ extracts. Cultures were established at salinity of 36 and
temperature of 25°C in a thermostatic room, maintaining light irradiance at 100-
110 µmol m−2 s−1. At the end of the exponential phase (day 8) cultures were centrifuged at
2400 x g (3600 rpm) for 20 min and supernatant was discarded. Whole cell samples were put
at -80°C, while chloroplast samples were used immediately for the subcellular fractionation.
5.1.2. Subcellular fractionation
Chloroplasts were isolated by a modification of the method of Laatsch et al (2004). O. cf.
ovata, C. monotis and F. japonica cells were harvested by centrifugation at 2400 x g (3600
rpm) for 20 min. Cell pellets were resuspended in chloroplast isolation buffer (CIB)
consisting of 50 mM Tris, pH 7.5, 1 mM MgCl2, 10 mM EDTA, 0.25% PVP, and 0.4 M
mannitol and homogenized in a Dounce homogenizer on ice until chloroplasts free of nuclei
(Fig. 5.3) were apparent by epifluorescent microscopic inspection of a Dapi stained sample.
The homogenate was then layered onto a gradient of 4 mL 2.2 M sucrose and 12 mL 1.6 M
sucrose, then centrifuged at 14,000 x g (28,000 rpm) for 30 min at 4°C in an ultracentrifuge
equipped with a swinging bucket rotor. The plastid band was removed, washed with 24 mL
isolation buffer, and then harvested by centrifugation at 12,000 x g for 10 min at 4°C. The
chloroplast pellet was then stored at -80°C until use.

134
Fig. 5.3 – Red fluorescence of chloroplasts in Fibrocapsa japonica (A), Ostreopsis ovata (B), and
Coolia monotis (C) cells.
5.1.3. Antibody Development
Custom peptide polyclonal antibodies were made against in silico translation of K. brevis KS
domain (KB2006; GenBank Accession No. EF410007), ACP/KS domain (KB1008; GenBank
Accession No. EF410006) and KR domain (KB5299; Genbank Accession No. EF410009) full
length transcripts by ProSci Incorporated (Poway, CA), as described in Monroe and Van
Dolah (2008).
5.1.4. Protein isolation and western blotting
Total protein was isolated from O. cf. ovata, C. monotis and F. jpaonica cultures using
TriReagent (Molecular Research Center, Cincinnati, PH) according to manufacturer's
instructions with some modifications. In brief, whole cell or chloroplast pellets were
resuspended in 1mL or 0.5 mL of TriReagent, respectively, and sonicated on ice with short
pulses of 15-20 sec for a total of 2 min. Phases were separated using 0.2 mL (or 0.1 mL)
chloroform. RNA was removed from the aqueous phase and precipitated with isopropanol for
further purification. DNA was precipitated from the organic phase using 0.3 mL (or 0.15 mL)
ethanol and then proteins were precipitated from the supernatant using 3 mL (or 1.5 mL)
isopropanol, washed in 95% ethanol, and the protein pellets resuspended in protein sample
buffer containing 30 mM Tris, 2 M thiourea, 7 M urea, and 4% (w/v) CHAPS.
Protein concentration was determined using a BioRad (Hercules, CA) Bradford protein assay,
and 10 µg of protein were run on a NuPAGE Novex 4-12% Bis-Tris gel from Invitrogen.
Proteins were transferred to polyvinyl difluoride (PVDF) membranes (0.45 µm), and blots
were stained with Ponceau stain (Sigma, St. Louis, MO) to examine total protein transferred
to the blot. Membranes were blocked with 5% nonfat milk in Tris-buffered Saline (TBS) for 1
B C A

135
hour, and blots were then incubated with appropriate primary antibody dilutions (KB2006:
1:5000, KB5299: 1:500, KB1008: 1:1000) in 5% nonfat milk in TBS overnight at 4°C.
Antibody specificity was determined by incubating the antibody with 100-fold excess (by
weight) of the peptide used to generate the antibody for 1 hr prior to membrane
immunoblotting at the same dilutions indicated above. After 3 washes for 10 min each were
done in TBS with 0.1% Tween 20 (TBST), membranes were incubated with an ECL HRP-
linked anti-rabbit (1:2000) (GE Healthcare, Buckinghamshire, UK), washed twice with TBST
(10 min each) and once with TBS (5 min) and finally developed using Pierce West Pico
chemiluminescent substrate (Rockford, IL). Images were taken using a SynGene G:box
imaging system and SynGene GeneSnap software, and densitometry was calculated using the
SynGene GeneTools software (Frederick, MD).
5.1.5. Evaluation of toxin and chlorophyll content
For toxin and chlorophyll-a quantification in O. cf. ovata ‘whole cell’ and ‘chloroplast’
samples, 6000 mL culture was grown. At the end of the exponential phase, 500 mL and 50
mL of culture, each in duplicate, were centrifuged at 4000 rpm for 15 min to use for ‘whole
cell’ toxin and chlorophyll extraction, respectively. Algal pellets were stored at -80°C until
use. ‘Chloroplast’ samples were obtained by centrifuging 2450 mL culture in duplicate at
4000 rpm for 15 min, and algal pellet obtained were used for the subcellular fractionation, as
described above (see section 5.1.2).
Cell counts were made following Utermöhl method (Hasle, 1978).
Chemicals
All organic solvents were of distilled-in-glass grade (Carlo Erba, Milan, Italy). Water was
distilled and passed through a MilliQ water purification system (Millipore Ltd., Bedford, MA,
USA). Acetic acid (Laboratory grade) was purchased from Carlo Erba. Analytical standard of
palytoxin was purchased from Wako Chemicals GmbH (Neuss, Germany).
Extraction
Whole cell and chloroplast pellets were separately extracted, adding 9 or 1 mL of a
methanol/water (1:1, v/v) solution, respectively, and sonicating for 30 min in pulse mode,
while cooling in an ice bath. The mixture was centrifuged at 3000 x g for 30 min, the
supernatant was decanted and the pellet was washed twice with 9 or 1 mL of methanol/water

136
(1:1, v/v). The extracts were combined and the volume was adjusted to 30 or 3 mL with the
methanol/water (1:1, v/v) solution for whole cell and chloroplast samples, respectively. The
obtained mixture was analyzed directly by HR LC-MS (5 µL injected). Recovery percentage
of the above extraction procedures was estimated to be 98% (Ciminiello et al., 2006).
High Resolution Liquid chromatography-mass spectrometry (HR LC-MS)
High resolution (HR)LC-MS experiments were carried out on an Agilent 1100 LC binary
system (Palo Alto, CA, USA) coupled to a hybrid linear ion trap LTQ Orbitrap XLTM Fourier
Transform MS (FTMS) equipped with an ESI ION MAXTM source (Thermo-Fisher, San Josè,
CA, USA). Chromatographic separation was accomplished by using a 3 µm gemini C18 (150
× 2.00 mm) column (Phenomenex, Torrance, CA, USA) maintained at room temperature and
eluted at 0.2 mL/min with water (eluent A) and 95% acetonitrile/water (eluent B), both
containing 30 mM acetic acid. A slow gradient elution was used: 20-50% B over 20 min, 50-
80% B over 10 min, 80-100% B in 1 min, and hold 5 min. This gradient system allowed a
sufficient chromatographic separation of most palytoxin-like compounds.
HR full MS experiments (positive ions) were acquired in the range m/z 800-1400 at a
resolving power of 15,000. The following source settings were used in all HR LC-MS
experiments: a spray voltage of 4 kV, a capillary temperature of 290°C, a capillary voltage of
22 V, a sheath gas and an auxiliary gas flow of 35 and 1 (arbitrary units). The tube lens
voltage was set at 110 V.
Due to commercial availability of the only palytoxin standard, quantitative determination of
putative palytoxin, ovatoxin-a,-b,-c,-d, and -e in the extracts was carried out by using a
calibration curve (triplicate injection) of palytoxin standards at four levels of concentration
(25, 12.5, 6.25, and 3.13 ng mL-1) and assuming that their molar responses were similar to
that of palytoxin. Extracted ion chromatograms (XIC) for palytoxin and each ovatoxins were
obtained by selecting the most abundant ion peaks of both [M+2H-H2O]2+ and [M+2H+K]3+
ion clusters. A mass tolerance of 5 ppm was used.
5.1.6. Chlorophyll analysis
Chlorophyll a measurements have historically provided a useful estimate of algal biomass.
Chlorophyll analyses were performed by collecting cells (50 mL of algal culture and 1/10 of
chloroplast sample obtained from the subcellular fractionation) with centrifugation.
Supernatant was removed and pellets put at -80°C. For the extraction, 90% acetone was used

137
and samples were analyzed spectrophotometrically according to Strickland and Parsons
(1972).
5.2. Results
5.2.1. PKS espression in whole cell and chloroplast samples
Fig. 5.4 - Western blot analysis of Ketosynthase domain (KS) KB2006 expression in whole cell (WC)
and chloroplast (CHLP). Ten micrograms of protein from whole cells and isolated chloroplasts in
triplicates were separated on a 4%–12% gel (A). Average densitive values are shown (B). Results refer
to the strain OOAB0801 of O. cf. ovata.
A)
B)
0
50
100
150
200
250
300
O. cf. ovataKB2006 (KS)
p = 0.939 Whole Cell Chloroplast
Ave
rage
den
sitiv
e va
lue
0
50
100
150
200
250
300
C. monotisKB2006 (KS)
p = 0.077 Whole Cell Chloroplast
Ave
rage
den
sitiv
e va
lue
Western blot analysis with anti-KB2006 (KS) identified a band at about 100 kDa in both
strains of the dinoflagellates O. cf. ovata and in C. monotis, in accordance with the band
found in K. brevis and in good agreement with the predicted 101 kDa in silico translation data
C. monotis
WC
C. monotis
CHLP
O. cf. ovata
WC
1 2 3 1 2 3 1 2 3 1 2 3
62
98
O. cf. ovata
CHLP

138
(Fig. 5.4A). No bands were identified in F. japonica samples. KS protein was expressed
equivalently in whole cell and chloroplast extracts in the two benthic dinoflagellates (Fig.
5.4B) as confirmed by the densitometry.
Fig. 5.5 - Western blot analysis of Ketoreductase domain (KR) KB5299 expression in whole cell
(WC) and chloroplast (CHLP). Ten micrograms of protein from whole cells and isolated chloroplasts
in triplicates were separated on a 4%–12% gel (A). Average densitive values are shown (B). Results
refer to the strain OOAB0801 of O. cf. ovata.
A)
B)
0
50
100
150
200
250
300
350
400
450
F. japonicaKB5299 (KR)
p = 0.338 Whole Cell Chloroplast
Ave
rage
den
sitiv
e va
lue
C. monotis
WC
1 2 3
C. monotis
CHLP
1 2 3
O. cf. ovata
WC
1 2 3 1 2 3
62
98
O. cf. ovata
CHLP
80
100
120
F. japonica
WC
1 2 3
F. japonica
CHLP
1 2 3

139
The second antibody anti-KB5299 (KR) identified a protein about 90 kDa, larger than the
predicted 56 kDa and even different from the about 40 kDa protein found in K. brevis.
Proteins cross-reactive with the anti-KR antibody, but larger than in K. brevis, were expressed
in whole cell but not in the chloroplast extracts in the dinoflagellates.
Fig. 5.6 - Western blot analysis of acyl carrier protein (ACP)/KS domain protein KB1008 expression
in whole cell (WC) and chloroplast (CHLP). Ten micrograms of protein from whole cells and isolated
chloroplasts in triplicates were separated on a 4%–12% gel.
A)
B)
0
50
100
150
200
250
F. japonicaKB1008 (ACP/KS)
p = 0.232 Whole Cell Chloroplast
Ave
rage
den
sitiv
e va
lue
However, a band of approximately 75 kDa was present in chloroplast of C. monotis. It has to
be noted that no bands were found in the strain OOTL0707 of O. cf. ovata, resulting in a
difference between the expression of PKS proteins in the two isolates of this dinoflagellate,
which were used in the study. A protein of similar size was expressed equivalently in whole
cell and chloroplast extracts in the raphidophyte (Fig. 5.5A), reporting strong bands.
80
100
F. japonica
WC
1 2 3
F. japonica
CHLP
1 2 3

140
Densitometry showed no significant difference between these bands (Fig. 5.5B).
The third antibody anti-KB1008 (ACP/KS) identified a protein about 95 kDa, which was
expressed equivalently in whole cell and chloroplast extracts in the raphidophyte (Fig. 5.6),
but not in the other two dinoflagellates.
Fig. 5.7 – Polyketide synthase (PKS) proteins in the dinoflagellates O. cf. ovata, strain OOAB0801
(1) and C. monotis (2) and in the Raphidophyte F. japonica (3). Western blot analysis of PKS proteins
using peptide polyclonal anti-KS against K. brevis KS domain protein KB2006 (A) and peptide-
blocked anti-KS demonstrating specificity for the 100 kDa band (B); anti-KR against K. brevis KR
domain protein KB2599 (A) and peptide-blocked anti-KR demonstrating specificity for the about 90
kDa band (B); and anti–ACP/KS against K. brevis ACP/KS domain protein KB1008 (A) and peptide-
blocked anti-ACP/KS demonstrating specificity for the about 95 kDa band (B).
1 2 3 1 2 3
A B
KB2006
62
98
B A
80 100
1 2 3 1 2 3 KB1008
80 100
1 2 3 1 2 3
A B
KB5299
To summarize, the expression of the PKS proteins was compared in protein extracts from the
isolated chloroplasts and whole cells by Western blotting with the KS domain (KB2006), KR
domain (KB5299), and ACP/KS PKS antibodies. PKS showed prominent bands in the
chloroplast (Fig. 5.4, 5.5, 5.6) almost in all cases, besides for the KR5299 which was absent
in the chloroplast of the dinoflagellates.

141
In fact, negative controls with peptide-blocked antibodies demonstrate the specificity of the
bands, as reported in Fig. 5.7 for the three PKS proteins in all the algal species. The 75 kDa
bands found in C. monotis chloroplasts resulted no specific.
5.2.2. Determination of toxin content and localization by HR LC-MS
Culture and chloroplast pellets of O. cf. ovata were collected during the late exponential
growth phase. Samples were separately extracted as reported in the experimental and the
crude extracts were used to evaluate the toxin profile. HR LC-MS experiments were acquired
in full MS mode by using an LC method which allowed chromatographic separation of the
major components of the toxin profile. The presence of putative palytoxin and of all the
ovatoxins (ovatoxin-a, -b, -c, -d, and -e) recently identified in O. cf. ovata (Ciminiello et al.,
2008, 2010) was highlighted in all the analyzed samples.
With the purpose of gaining information on the toxin localization in the cells, total toxin
content was expressed on the basis on the chlorophyll a concentration. Spectrometric
determination of chlorophyll-a content is in fact a method for the algal biomass evaluation,
therefore after evaluation of pg cl-a cell-1 in the culture utilized for chloroplast isolation, it
provides an estimation of the number of cells corresponding to the chloroplast sample. Due to
lack of standards for ovatoxins, quantitative analyses were carried out basing on the tentative
assumption that they present the same molar response as palytoxin. Concentrations of putative
palytoxin and ovatoxins were extrapolated from a calibration curve of palytoxin standard
injected under the same conditions and the obtained results were corrected basing on recovery
percentages of the extraction procedures, namely 98% (Ciminiello et al., 2006) for pellet
extracts.
Total toxin content expressed as ng per chlorophyll a (ng cl-a-1, Fig. 5.8) reported no
significant differences between the culture and CHLP extracts (ANOVA, P>0.05) of
OOAB0801 O. cf. ovata, whereas it resulted significantly different (ANOVA, P<0.001) in the
OOTL0707 O. cf. ovata strain. The toxin content in the CHLP of the Tyrrhenian strain
resulted about 25% of the total content in the cell, thus suggesting a partial localization of the
palytoxin-like compounds in this plastid.

142
Fig. 5.8 – Total toxin content (pPLTX and OVTX-a,b,c,d,e) in the two O. cf. ovata strains, expressed
on the basis of chlorophyll a concentration. Samples are algal (WC) and chloroplast (CHLP) pellets,
obtained as reported in the experimental (n=3).
WC CHLP WC CHLP0
200
400
600
800
1000
1200
*
OOTL0707OOAB0801
ng to
xins
/cl-a
* significantly different (ANOVA, P<0.001)
5.3. Conclusion - PKS
This study identifies PKS proteins in the benthic dinoflagellate O. cf. ovata and C. monotis
and in the raphidophyte F. japonica for the first time. Genes with sequence similarity
to Type I PKS have previously been identified in K. brevis (Snyder et al., 2003, 2005; Monroe
and Van Dolah, 2008; Monroe et al., 2010), where full-length PKS transcripts predicted
proteins smaller than typical Type I PKSs that encode only single catalytic domains (Monroe
and Van Dolah, 2008).
The current study confirms the presence of PKS proteins predicted by the in silico translation
of the transcripts found in K. brevis also in other species. Western blotting identified a 100
kDa band cross-reactive to a peptide antibody to the KS domain (KB2006), in close
agreement to the result obtained in K. brevis. A protein band detected by the antibody specific
to the KR domain (KB5299) is larger (about 95 kDa) than predicted by in silico translation
(56 kDa) and K. brevis protein (about 40 kDa). By comparison with the K. brevis proteins,
Type I PKS proteins typically encode polypeptides containing multiple catalytic domains and,
in the case of modular PKSs, multiple modules. It appears that even the PKS proteins found in
these species are more similar in size to Type II PKSs, as previously found for K. brevis
(Monroe et al., 2010) where PKS are multi-protein complexes made up of monofunctional
proteins each containing a single catalytic domain.
Although all species, including the raphidophyte expressed proteins cross-reactive with one or
more K. brevis antibodies, different protein sizes were reported likely due to differences in

143
species. C. monotis and F. japonica from the Adriatic Sea have never reported the production
of toxins; however, the raphidophyte is known to produce high concentrations of free fatty
acids (FFA). Thus, these results lead hypothesize that either (1) these proteins are FAS or (2)
single PKS units could be cobbled together to form complexes that synthesize different
polyketide compounds and/or fatty acids in different species (Sieber et al., 2002).
Immunolocalization studies and subcellular fractionation of chloroplasts suggested
chloroplast localization of both KS and KR proteins in K. brevis (Monroe et al., 2010). KR
appeared to be chloroplast specific since the density of the Western blotting bands was similar
to that of whole-cell protein lysates whereas, the KS domain protein appears to occur in other
compartment(s) more prominently than the chloroplast, based on the relative intensity of the
chloroplast band and that in the whole cell. The chloroplast localization of K. brevis PKSs
was consistent with the localization of another dinoflagellate polyketide toxin, okadaic acid
(OA), in Prorocentrum lima (Zhou and Fritz, 1994; Barbier et al., 1999). Cyanobacterial
toxins microcystin and nodularin are similarly strongly associated with the photosynthetic
apparatus, with 70% of labeled microcystin observed in the thylakoid, especially the outer
portion of the thylakoid (Shi et al., 1995; Young et al., 2005).
The identification of O. cf. ovata PKSs and the localization of the palytoxin-like compounds
produced by this dinoflagellate in a similar location (chloroplast) as that observed for other
dinoflagellate and cyanobacterial toxins provides some indication that these proteins may be
involved in polyketide biosynthesis. However, their potential function as fatty acid synthases
cannot be ruled out, as plant fatty acid biosynthesis also occurs within chloroplasts, albeit in
the stroma. This last hypothesis is also supported by the fact that even in the other two
species, and in particular in F. japonica, PKS proteins were present. PKSs are structurally and
functionally similar to FASs and likely originated when an early ancestor of extant
prokaryotes and eukaryotes evolved a simple condensing enzyme to make other cellular
functions more efficient (Hopwood, 1997). From this primitive enzyme, a PKS is thought to
have evolved through the addition of an ACP and AT, and further additions of a reductive
cycle converted the primitive PKS to an FAS. PKSs subsequently evolved distinct and diverse
pathways through mutations, recombinations, and gene duplications, while the simple FAS
were retained because fatty acids had become essential components of the cell.
It is important to point out that the real biological origin of palytoxin-like compounds remains
controversial. Palytoxin content in Palythoa spp. in fact significantly varies among species,
population of the same species and even seasonally (Moore et al., 1982) and, besides algae,
sporadic occurrence of palytoxins had been detected also in crabs (Yasumoto et al., 1986),

144
and fish (Fukui et al., 1987). Therefore, many have defended the assumption that this class of
toxins are indeed produced by microorganisms. The occurrence of palytoxins in such a large
number of even biogenetically distant marine organisms could reasonably imply a symbiotic
relationship of the above organisms with bacteria (Katikou, 2008). This is also consistent with
experimental observation that showed haemolytic activity of some Pseudomonas (Carballeira
et al., 1998), Brevibacterium, Acinetobacter and Bacillus cereus extracts and others proving
that Vibrio spp. and Aeromonas spp. were producers of molecules antigenically related to
palytoxin (Frolova et al., 2000a,b). The co-isolation of symbiontic bacteria in the chloroplast
samples can not be excluded, because the small size of the chloroplasts in C. monotis and O.
cf. ovata (about 1-3 µm) could potentially allow for comigration of larger bacteria to a similar
density in the sucrose gradient. Therefore even the origin of the palytoxin-like compounds
detected in these extracts remains uncertain.
Monroe et al. (2010) compared PKS transcript expression and protein abundance in the ‘‘non-
toxic’’ strain and its parental, toxic K. brevis (Wilson) isolate. By both microarray and qPCR
analysis, PKS transcript levels were not significantly different in the ‘‘nontoxic’’ cultures
compared to toxin-producing cultures. This was not surprising since many other functions in
K. brevis are known to be regulated post-transcriptionally (Van Dolah, 2009; Brunelle et al.,
in prep.). Therefore, more insight might be provided by assessing their expression at the
protein level. In fact, the KS domain was expressed at lower levels in the non-toxic isolate,
suggesting it may be involved in brevetoxin biosynthesis. However, KB5299 (the KR
domain) was more abundant in ‘‘non-toxic’’ cultures.
An interesting finding from the current study is that KR domain was present only in one of
the two O. cf. ovata strains used, confirming the previous results found in K. brevis which
indicated as KR protein may be not involved in the same cellular process as the KS proteins
recognized by the antibodies used in this study (Monroe et al., 2010). Additionally, since this
strain (OOTL0707) is the one which showed only about 25% of the toxins being localized in
the chloroplast it could be interesting to investigate more deeply the role of KR protein in
polyketide biosynthesis.
The previous studies on K. brevis suggested the roles for polyketides in photosynthetic
processes in algae (Monroe et al., 2008; 2010), as reported also for okadaic acid (OA) (Zhou
and Fritz, 1994). Moreover, both the association of microcystins with the thylakoid and the
increase in microcystin transcripts in response to light (Kaebernick et al., 2000) led to the
hypothesis that microcystins may also have a functional role in photosynthesis and other
light-related processes. The localization of PKSs and O. cf. ovata toxins in the chloroplast

145
may also suggest a functional role of palytoxin-like compounds in chloroplast processes or
suggest that these toxins may be confined in these plastids to avoid damages to the
cytoskeleton.
This study provides evidence of the presence of PKS proteins in other dinoflagellates and a
raphidophyte, and their localization in the chloroplast. Further studies are needed to clarify the
role that these enzymes may have in the toxin biosythesis.

146

147
6. General conclusions The main goal of the present thesis was to study some harmful algal species which cause
blooms in Italian coastal waters, leading to consequences for human health, coastal
ecosystem, fishery and tourism.
In particular, in the first part of this thesis the toxicity of Adriatic strains of the raphidophyte
Fibrocapsa japonica was investigated. Despite several hypotheses have been proposed for the
toxic mechanism of the raphidophytes, especially for the species Chattonella antiqua and C.
marina, which have been studied more extensively, just a few studies on the toxic effects of
these species for different organisms were reported. Moreover, a careful reading of the
literature evidenced as any ichthyotoxic events reported worldwide can be linked to F.
japonica blooms. Although recently several studies were performed on F. japonica strains
from the USA, Japan, Australia, New Zealand, the Netherlands, Germany, and France in order
to characterize their growth and toxicity features, the work reported in this thesis results one
of the first investigation on the toxic effects of F. japonica for different organisms, such as
bacteria, crustaceans and fish. Mortality effects, together with haemolysis of fish erythrocytes,
probably due to the relatively high amount of PUFAs produced by this species, were
observed. Mortality for fish, however, was reported only at a high cell density and after a long
exposition period (9-10 days); moreover a significant increase of H2O2 obtained in the tanks
where sea basses were exposed to F. japonica was also relevant. This result may justify the
absence of ichthyotoxic events in the Italian coasts, despite F. japonica blooms detected in
these areas were characterized by high cell densities. This work reports also a first complete
characterization of the fatty acids produced and extracellularly released by the Adriatic F.
japonica, and results were also compared with the fatty acid profile of other strains. The
absence of known brevetoxins in F. japonica algal extracts was also highlighted, leading to
the hypothesis that the toxicity of F. japonica may be due to a synergic effect of PUFAs and
ROS.
Another microalgae that was studied in this thesis is the benthic dinoflagellate Ostreopsis cf.
ovata. This species was investigated with the aim to investigate the effect of environmental
parameters on its growth and toxicity. O. cf. ovata, in fact, shows different blooming periods
along the Italian coasts and even the reported toxic effects are variable. The results of this
work confirmed the high variability in the growth dynamic and toxin content of several Italian
strains which were isolated in recent years along the Adriatic and Tyrrhenian Seas. Moreover,

148
the effects of temperature and salinity on the behaviour of the different isolates are in good
agreement with the results obtained from field surveys, which evidence as the environmental
parameters are important factors modulating O. cf. ovata proliferation. Another relevant result
that was highlighted is the anomaly in the production of palytoxin-like compounds reported
by one of the studied isolate, in particular the one isolated in 2008 in Ancona (Adriatic Sea).
Only this strain reported the absence of two (ovatoxin-b and –c) of the five ovatoxins so far
known in the toxin profile and a different relative abundance of the other toxins.
The last aspect that was studied in this thesis regards the toxin biosythesis. In fact, toxins
produced (palytoxin-like compounds) or supposed to be produced (brevetoxin-like
compounds) by O. cf. ovata and F. japonica, respectively, are polyketides, which are highly
oxygenated compounds synthesized by complex enzymes known as polyketide synthase
(PKS) enzymes. These enzymes are multi-domain complexes that structurally and
functionally resemble the fatty acid synthases (FASs). This work reports the first study of
PKS proteins in the dinoflagellates O. cf. ovata, C. monotis and in the raphidophyte F.
japonica. For the first time some PKSs were identified in these species, confirming the
presence of PKS proteins predicted by the in silico translation of the transcripts found in K.
brevis also in other species. The identification of O. cf. ovata PKSs and the localization of the
palytoxin-like compounds produced by this dinoflagellate in a similar location (chloroplast)
as that observed for other dinoflagellate and cyanobacterial toxins provides some indication
that these proteins may be involved in polyketide biosynthesis. However, their potential
function as fatty acid synthases cannot be ruled out, as plant fatty acid synthesis also occurs
within chloroplasts. This last hypothesis is also supported by the fact that in all the
investigated species, and in particular in F. japonica, PKS proteins were present. Therefore,
these results provide an important contribution to the study of the polyketides and of the
involvement of PKS proteins in the toxin biosynthesis.

149
References
Abboud-Abi Saab, M., 1989. Les dinoflagellés des eaux côtières libanaises-espèces rares ou
nouvelles du phytoplancton marin. Leb. Sci. Bull. 5, 5–16.
Abraham, A., Plakas, S.M., Wang, Z., Jester, E.L.E., El Said, K.R., Granade, H.R., Henry,
M.S., Blum, P.C., Pierce, R.H., Dickey, R.W., 2006. Characterization of polar brevetoxin
derivatives isolated from Karenia brevis cultures and natural blooms. Toxicon 48, 104-
115.
Alavi, M., Miller, T., Erlandson, K., Schneider, R., Belas, R., 2001. Bacterial community
associated with Pfiesteria-like dinoflagellate cultures. Environmental Microbiology 3,
380–396.
Aligizaki, K., & Nikolaidis, G., 2006. The presence of the potentially toxic genera Ostreopsis
and Coolia (Dinophyceae) in the North Aegean Sea, Greece. Harmful Algae 5, 717-730.
Aligizaki, K., Katikou, P., Nikolaidisa, G., Panoub A., 2008. First episode of shellfish
contamination by palytoxin-like compounds from Ostreopsis species (Aegean Sea,
Greece). Toxicon 51, 418–427.
Andersen, R.A., 1992. Diversity of eukaryotic algae. Biodiversity and Conservation 1, 267-
292.
Anderson, D.M., & Wall, D., 1978. The potential importance of benthic cysts of Gonyaulax
tamarensis and Gonyaulax excavata in initiating toxic dinoflagellate blooms. J. Phycol.
14, 224–234.
Anderson, D.M., 1980. Effects of temperature conditioning on development and germination
of Gonyaulax tamarensis (Dinophyceae) hypnozygotes. J. Phycol. 16, 166–172.
Anderson, D.M., & Keafer, B.A., 1987. An endongenous annual clock in the toxic marine
dinoflagellate Gonyaulax tamarensis. Nature 325, 616–617.
Anderson, D. M., 1989. Toxic algal blooms and red tides: A global perspective, pp. 11-16. In:
T. Okaichi, D. M. Anderson, T. Nemoto (eds.), Red Tides: Biology, Environmental
Science and Toxicology. Elsevier, New York.
Anderson, D.M., Kulis, D.M., Sullivan, J.J., Hall, S., Lee, C., 1990. Dynamics and physiology
of saxitoxin production by the dinoflagellates Alexandrium spp. Mar. Biol. 104, 511–524.
Anderson, D. M., Kulis, D. M., Doucette, G.J., Gallagher, J.C., Balech, E., 1994.
Biogeography of toxic dinoflagellates in the genus Alexandrium from the northeastern
United States and Canada. Marine Biology 120, 467-478.

150
Anderson, D.M., 1998. Physiology and bloom dynamics of toxic Alexandrium species, with
emphasis on life cycle transitions. In: D.M. Anderson, A.D. Cembella, G.M. Hallegraeff,
(eds), Physiological ecology of harmful algal blooms, vol. G41. Berlin: Springer, pp. 29-
48.
Anderson, D.M., Glibert, P.M., Burkholder, J.M., 2002. Harmful algal blooms and
eutrophication: Nutrient sources, composition, and consequences. Estuaries 25, 704–726.
AOAC International. In W. Horwitz (ed.), Official Methods of Analysis of AOAC
International, AOAC International, Gaithersburg, MD, 17th ed., 2000.
Armi, Z., Turki, S., Trabelsi, E., Maiz, N.B., 2010. First recorded proliferation of Coolia
monotis (Meunier, 1919) in the North Lake of Tunis (Tunisia) correlation with
environmental factors. Environ. Monit. Assess. 164, 423–433.
Arzul, G., Seguel, M., Guzman, L., ErardLeDenn, E., 1999. Comparison of allelopathic
properties in three toxic Alexandrium species. J. Exp. Mar. Biol. 232, 285–295.
Ashton, M., Tosteson, T., Tosteson, C., 2003. The effect of elevated temperature on the
toxicity of the laboratory cultured dinoflagellate Ostreopsis lenticularis (Dinophyceae).
Rev. Biol. Trop. 51, 1–6.
Aune, T., Sørby, R., Yasumoto, T., Ramstad, H., Landsverk, T., 2002. Comparison of oral
and intraperitoneal toxicity of yessotoxin towards mice. Toxicon 40, 77–82.
Azur Environmental 1998, Microtox® User’s Manual: 90% Basic Test for Pure Compounds.
Baden, D.G., 1983. Marine food-borne dinoflagellate toxins. International Review of
Cytology 82, 99–150.
Baden, D.G., Bourdelais, A.J., Jacocks, H., Michelliza, S., Naar, J., 2005. Natural and
derivative brevetoxins: historical background, multiplicity, and effects. Environ. Health
Perspect. 113, 621–625.
Ballantine, D.L., Tosteson, T.R., Bardales A.T., 1988. Population dynamics and toxicity of
natural population of benthic dinoflagellates in southwestern Puerto Rico. J. Exp. Mar.
Biol. Ecol. 119, 201-212.
Balode, M., Purina, I., Béchemin, C., Maestrini S.Y., 1998. Effects of nutrient enrichment on
the growth rates and community structure of summer phytoplankton from the Gulf of
Riga, Baltic Sea. Journal of Plankton Research 20, 2251-2272.
Banse, K., 1982. Cell volumes, maximal growth rates of unicellular algae and ciliates, and the
role of ciliates in the marine pelagial. Limnol. Oceanogr. 27, 1059-1071.
151
Barbier, M., Amzil, Z., Mondeguer, F., Bhaud, Y., Soyer-Gobillard, M.O., Lassus, P., 1999.
Okadaic acid and PP2A cellular immunolocalization in Prorocentrum lima
(Dinophyceae). Phycologia 38, 41–46.
Bates, S.S., Bird, C.J., de Freitas, A.S.W., Foxall, R., Gilgan, M., Hanic, L.A., Johnson, G.R.,
McCulloch, A.W., Odense, P., Pocklington, R., Quilliam, M.A., Sim, P.G., Smith, J.C.,
Subba Rao, D.V., Todd, E.C.D., Walter, J.A., Wright, J.L.C., 1989. Pennate diatom
Nitzschia pungens as the primary source of domoic acid, a toxin in shellfish from Prince
Edward Island, Canada. Can. J. Fish. Aq. Sci. 46, 1203–1215.
Bechemin, C., Grzebyk, D., Hachame, F., Hummert, C., Maestrini, S.Y., 1999. Effect of
different nitrogen/phosphorus nutrient ratios on the toxin content in Alexandrium
minutum (AM89BM). Aquat. Microb. Ecol. 20, 157–165.
Bellincampi, D., Dipierro, N., Salvi, G., Cervone, F., De Lorenzo, G., 2000. Extracellular
H2O2 induced by oligogalacturonides is not involved in the inhibition of the auxin-
regulated rolB gene expression in tobacco leaf explants. Plant Physiol. 122, 1379-1385.
Berg, G. M., Glibert, R.M., Lomas, M.W., Burford, M.A., 1997. Organic nitrogen uptake and
growth by the chrysophyte Aureococcus anophagefferens during a brown tide event.
Marine Biology 129, 377-887.
Berg, G.M., Repeta, D.J., Laroche, J., 2002. Dissolved organic nitrogen hydrolysis rates in
axenic cultures of Aureococcus anophagefferens (Pelagophyceae): comparison with
heterotrophic bacteria. Appl. Environ. Microbiol. 68, 401–404.
Berg, G.M., Balode, M., Purina, I., Bekere, S., Béchemin, C., Maestrini, S.Y., 2003. Plankton
community composition in relation to availability and uptake of oxidized and reduced
nitrogen. Aqua. Microb. Ecol. 30, 263–274.
Bialojan, C, & Takai, A., 1988. Inhibitory effect of a marinesponge toxin, okadaic acid, on
protein phosphatases. Specificity and kinetics. J. Biochem. 256, 283–290.
Bianco, I., Sangiorgi, V., Penna, A., Guerrini, F., Pistocchi, R., Zaottini, E., Congestri, R.,
2007. Ostreopsis ovata in benthic aggregates along the Latium Coast (middle Tyrrhenian
Sea). International Symposium on algal toxins, SITOX, p. 29.
Biegala, I.C., Kennaway, G., Alverca, E., Lennon, J.F., Vaulot, D., Simon, N., 2002.
Identification of bacteria associated with dinoflagellates (Dinophyceae) Alexandrium spp.
using tyramide signal amplification-fluorescent in situ hybridization and confocal
microscopy. J. Phycol. 38, 404–411.
Bignami, G.S., 1993. A rapid and sensitive hemolysis neutralization assay for palytoxin.
Toxicon 31, 817-820.

152
Binder, B.J., & Anderson, D.M., 1987. Physiological and environmental control of
germination in Scrippsiella trochoidea (Dinophyceae) resting cysts. J. Phycol. 23, 99–
107.
Blanco, J., 1995. Cyst production in four species of neritic dinoflagellates. J. Plankton Res.
17, 165–182.
Blanco, E.P., Lewis, J., Aldridge, J., 2009. The germination characteristics of Alexandrium
minutum (Dinophyceae), a toxic dinoflagellate from the Fal estuary (UK). Harmful Algae
8, 518–522.
Bligh, E.G., & Dyer, W.J., 1959. A rapid method for total lipid extraction and purification.
Can. J. Biochem. Physiol. 37, 911-917.
Bottalico, A., Micella, P., Feliciti, G.P., 2002. Fioritura di Ostreopsis sp. (Dinophyta) nel
porto di Otranto. In: Gruppo di Lavoro per l’Algologia – Società Botanica Italiana,
Chioggia, 8–9 Novembre 2002.
Boyer, G.L., Sullivan, J.J., Andersen, R.J., Harrison, P.J., Taylor, F.J.R., 1987. Effects of
nutrient limitation on toxin production and composition in the marine dinoflagellate
Protogonyaulax tamarensis. Mar. Biol. 96, 123–128.
Bridgers, A., McConnel, E., Naar, J., Weidner, A., Tomas, L., Tomas, C.R., 2004.
Comparison of regional clones of the genus Chattonella and Fibrocapsa for growth
characteristics and potential toxin production. In: K.A. Steidinger, J.H. Landsberg, C.R.
Tomas, G.A. Vargo (eds.), Harmful Algae 2002. Florida Fish and Wildlife Conservation
Commission, Florida Institute of Oceanography, and Intergovernmental Oceanographic
Commission of UNESCO, St Petersburg, pp. 405–407.
Burkholder, J.M., & Glasgow, H.B., 1997. The ichthyotoxic dinoflagellate Pfiesteria
piscicida: Behavior, impacts and environmental controls. Limn. Ocean. 42, 1052-1075.
Burkholder, J.M., Mallin, M.A., Glasgow, H.B., Larsen, L.M., McIver, M.R., Shank, G.C.,
Deamer-Melia, N.J., Briley, D.S., Springer, J., Touchette, B.W., Hannon, E.K., 1997.
Impacts to a coastal river and estuary from rupture of a large swine waste holding lagoon.
J. Environ. Qual. 26, 1451-1466.
Burkholder, J.M., 2000. Eutrophication and oligotrophication, pp. 649-670. In: S. Levin (ed.),
Encyclopedia of Biodiversity, Volume 2. Academic Press, New York.
Burkholder, J.M., Glasgow, H.B., Deamer-Melia, N.J., 2001a. Overview and present status of
the toxic Pfiesteria complex. Phycologia 40, 186-214.

153
Burkholder, J. M., Glasgow, H.B., Deamer-Melia, N.J., Springer, J., Parrow, M.W., Zheng,
C., Cancellieri, P., 2001b. Species of the toxic Pfiesteria complex, and the importance of
functional type in data interpretations. Environmental Health Perspectives 109, 667-679.
Carballeira, N.M., Emiliano, A., Sostre, A., Restituyo, J.A., González, I.M., Colón, G.M.,
Tosteson, C.G., Tosteson, T.R., 1998. Fatty acid composition of bacteria associated with
the toxic dinoflagellate Ostreopsis lenticularis and with Caribbean Palythoa species.
Lipids 33, 627-632.
Carlsson, P., Edling, H., Bechemin, C., 1998. Interactions between a marine dinoflagellate
(Alexandrium catenella) and a bacterial community utilizing riverine humic substances.
Aq. Microb. Ecol. 16, 65–80.
Cembella, A.D., 1998. Ecophysiology and metabolism of paralytic shellfish toxins in marine
microalgae. In: D.M. Anderson, A.D. Cembella, G.M. Hallegraeff (eds.), Physiological
Ecology of Harmful Algal Blooms, vol. NATO ASI Series; vol. G 41: Ecol. Sciences.
Springer-Verlag, Berlin, pp. 381–403.
Cembella, A.D., John, U., Singh, R., Walter, J., MacKinnon, S., 2004. Molecular genetic
analysis of spirolide biosynthesis in the toxigenic dinoflagellate Alexandrium ostenfeldii.
XI Inter. Conf. on Harmful Algal Blooms, Cape Town, South Africa (Abstract), p.82.
Chang, F.H., Shimizu, Y., Hay, B., Stewart, R., Mackay, G., Tasker, R., 2000. Three recently
recorded Ostreopsis spp. (Dinophyceae) in New Zealand: temporal and regional
distribution in the upper North Island from 1995 to 1997. NZ J. Mar. Freshwat. Res. 34,
29–39.
Chateau-Degat, M.L., Chinain, M., Cerf, N., Gingras, S., Hubert, B., Dewailly, E., 2005.
Seawater temperature, Gambierdiscus spp. variability and incidence of ciguatera
poisoning in French Polynesia. Harmful Algae 4, 1053-1062.
Chinain, M., Darius, H., Ung, A., Cruchet, P., Wang, Z., Ponton, D., Laurent, D., Pauillac, S.,
2010. Growth and toxin production in the ciguatera-causing dinoflagellate Gambierdiscus
polynesiensis (Dinophyceae) in culture. Toxicon 56, 739-750.
Cho, E.S., Rhodes, L.L., Kim, H.G., 1999a. The morphological and growth characteristics of
two strains of Fibrocapsa japonica isolated from New Zealand and Japan. J. Fish. Sci.
Tech. 2, 17–24.
Cho, E.S., Rhodes, L.L., Kim, H.G., 1999b. The comparison of two strains of Fibrocapsa
japonica (Raphidophyceae) in New Zealand and Japan. J. Fish. Sci. Tech. 2, 58–65.

154
Ciminiello, P., Dell’Aversano, C., Fattorusso, E., Forino, M., Magno, S., Poletti, R., 2002.
Direct detection of yessotoxin and its analogues by liquid chromatography coupled with
electrospray ion trap mass spectrometry. J. Chromatogr. A 968, 61-69.
Ciminiello, P., Dell’Aversano, C., Fattorusso, E., Forino, M., Magno, G.S., Tartaglione, L.,
Grillo, C., Melchiorre, N., 2006. The Genoa 2005 outbreak. Determination of putative
palytoxin in Mediterranean Ostreopsis ovata by a new liquid chromatography tandem
mass spectrometry method. Anal. Chem. 78, 6153–6159.
Ciminiello, P., Dell’Aversano, C., Fattorusso, E., Forino, M., Tartaglione, L.,Grillo, C.,
Melchiorre, N., 2008. Putative palytoxin and its new analogue, ovatoxin-a, in Ostreopsis
ovata collected along the Ligurian coasts during the 2006 toxic outbreak. J. Am. Soc.
Mass Spectrom. 19, 111-120.
Ciminiello, P., Dell’Aversano, C., Dello Iacovo, E., Fattorusso, E., Forino, M., Grauso, L.,
Tartaglione, L., Guerrini, F., Pistocchi, R., 2010. Complex palytoxin-like profile of
Ostreopsis ovata. Identification of four new ovatoxins by high-resolution liquid
chromatography/mass spectrometry. Rapid Commun. Mass Spectrom. 24, 2735–2744.
Cohen, P., Holmes, C.F.B., Tsukitani, Y., 1990. Okadaic acid – a new probe for the study of
cellular-regulation. Trends in Biochemical Sciences 15, 98–102.
Collos, Y., Gagne, C., Laabir, M. et al., 2004. Nitrogeneous nutrition of Alexandrium
catenella (dinophyceae) in cultures in Thau Lagoon, Southern France. J. Phycol. 40, 96–
103.
Combes, R.D., 2003. The mouse bioassay for diarrhetic shellfish poisoning: a gross misuse of
laboratory animals and of scientific methodology. Atla-Alter. Lab. Anim. 31, 595–610.
Cosper, E.M., Bricelj, V.M., Carpenter, E.J. (eds.), 1989. Novel phytoplankton blooms. In:
Coastal and estuarine studies, vol. 35. Berlin: Springer, p. 799.
Cucchiari, E., Guerrini, F., Penna, A., Totti, C., Pistocchi, R., 2008. Effect of salinity,
temperature, organic and inorganic nutrients on growth of cultured Fibrocapsa japonica
(Raphidophyceae) from the northern Adriatic Sea. Harmful Algae 7, 405-414.
Cucchiari, E., Pistocchi, R., Pezzolesi, L., Penna, A., Battocchi, C., Cerino, F., Totti, C., 2010.
Resting cysts of Fibrocapsa japonica (Raphidophyceae) from coastal sediments of the
northern Adriatic Sea (Mediterranean Sea). Harmful Algae 10, 81-87.
Dahl, E., Bagoien, E., Edvardsen, B., Stenseth, N.C., 2005. The dynamics of
Chrysochromulina species in the Skagerrak in relation to environmental conditions. J. Sea
Res. 54, 15–24.

155
Dale, B., Madsen, A., Nordberg, K., Thorsen, T.A., 1993. Evidence for prehistoric and
historic ‘blooms’ of the toxic dinoflagellate Gymnodinium catenatum in the Kattegat-
Skagerrak region of Scandinavia. In: T.J Smayda, Y. Shimizu (eds.), Toxic
Phytoplankton Blooms in the Sea. Elsevier, Amsterdam, pp. 47–52.
de Boer, M.K., Tyl, M.R., Vrieling, E.G., van Rijssel, M., 2004. Effects of salinity and
nutrients on growth and haemolytic activity of Fibrocapsa japonica (Raphidophyceae).
Aquat. Microb. Ecol. 37, 171–181.
de Boer, M.K., Van Rijssel, M., Vrieling, E.G., 2004. Morphology of Fibrocapsa japonica
cysts formed under laboratory conditions. In: K.A. Steidinger, J.H. Landsberg, C.R.
Tomas, G.A. Vargo (eds.), Harmful Algae 2002. Florida Fish and Wildlife Conservation
Commission and Intergovernmental Oceanographic Commission of UNESCO, pp. 455–
457.
de Boer, M.K., Tyl, M.R., Fu, M., Kulk, G., Liebezeit, G., Tomas, C.R., Lenzi, A., Naar, J.,
Vrieling, E.G., van Rijssel, M., 2009. Haemolytic activity within the species Fibrocapsa
japonica (Raphidophyceae). Harmful Algae 8, 699-705.
Dechraoui, M.Y., Naar, J., Pauillac, S., Legrand, A.M., 1999. Ciguatoxins and brevetoxins,
neurotoxic polyether compounds active on sodium channels. Toxicon 37, 125–143.
Delgado, G., Lechuga-Devéze, C.H., Popowski, G., Troccoli, L., Salinas, C.A., 2006.
Epiphytic dinoflagellates associated with ciguatera in the northwestern coast of Cuba.
Rev. Biol. Trop. 54, 299-310.
DeYoe, H.R., & Suttle, C.A., 1994. The inability of the Texas ‘‘brown tide’’ alga to use
nitrate and the role of nitrogen in the initiation of a persistent bloom of this organism. J.
Phycol. 30, 800–806.
Draper, H.H., Squires, E.J., Mahmoodi, H., Wu, J., Agarwal, S., Hadley, M., 1993. A
comparative evaluation of thiobarbituric acid methods for the determination of
malondialdehyde in biological materials. Free Radic. Biol. Med. 15, 353–363.
Duarte, C.M., Agustí, S., Agawin, N.S.R., 2000. Response of a Mediterranean phytoplankton
community to increased nutrient inputs: a mesocosm experiment. Mar. Ecol. Prog. Ser.
195, 61–70.
Dugdale, R.C., & Goering, J.J., 1967. Uptake of new and regenerated forms of nitrogen in
primary productivity. Limn. Ocean. 12, 196-206.
Durando, P., Ansaldi, F., Oreste, P., Moscatelli, P., Gasparini, L.M., Icardi, G., 2007.
Ostreopsis ovata and human health: epidemiological and clinical features of respiratory
syndrome outbreaks from a two-year syndromic surveillance, 2005-06, in north-west

156
Italy. Euro Surveill. 12 (23): pii=3212. Available online:
http://www.eurosurveillance.org/ViewArticle.aspx?PublicationType=W&Volume=12&Is
sue=23&OrderNumber=1.
Edvardsen, B., & Imai, I., 2006. The ecology of harmful flagellates within Prymnesiophyceae
and Raphidophyceae. In: E. Granéli, J.T. Turner (eds.), Ecology of Harmful Algae.
Ecological Studies, vol. 189. Springer-Verlag, Berlin/Heidelberg, pp. 67–79.
Eppley, R.W., & Harrison, W.G., 1975. Physiological ecology of Gonyaulax polyedra, a red
water dinoflagellate of southern California. In: Proc. 1st Int. Conf. on Toxic
Phytoplankton Blooms. Mass. Sci. Technol. Found, pp. 194-205.
Errera, R.M., Bourdelais, A., Drennan, M.A., Dodd, E.B., Henrichs, D.W., Campbell, L.,
2010. Variation in brevetoxin and brevenal content among clonal cultures of Karenia
brevis may influence bloom toxicity. Toxicon 55, 195-203.
Eschbach, E., Scharsack, J.P., John, U., Medlin, L., 2001. Improved erythrocyte lysis assay in
microtitre plates for sensitive detection and efficient measurement of haemolytic
compounds from ichthyotoxic algae. J. Appl. Toxicol. 21, 513-519.
Espinosa-Mansilla, A., Salinas, F., Rubio Leal, A., 1993. Determination of malondialdehyde
in human plasma: elimination of spectral interferences in the 2-thiobarbituric acid
reaction. Analyst 118, 89–95.
Etheridge, S.M., & Roesler, C.S., 2005. Effects of temperature, irradiance, and salinity on
photosynthesis, growth rates, total toxicity, and toxin composition for Alexandrium
fundyense isolates from the Gulf of Maine and Bay of Fundy. Deep-Sea Research II 52,
2491-2500.
European Commission, 2003. The EU-US scientific initiative on harmful algal blooms.
European Commission report EUR 20578, European Commission, Trieste.
Faust, M.A., Morton, S.L., Quod, J.P., 1996. Further SEM study of the marine dinoflagellates:
the genus Ostreopsis (Dinophyceae). J. Phycol. 32, 1053–1065.
Fernández Puente, P., Fidalgo Sáez, M.J., Hamilton, B., Furey, A., James, K.J., 2004. Studies
of polyether toxins in the marine phytoplankton, Dinophysis acuta, in Ireland using
multiple tandem mass spectrometry. Toxicon 44, 919–926.
Figueroa, R.I., Bravo, I., Garcés, E., 2006. Multiple routes of sexuality in Alexandrium taylori
(Dinophyceae) in culture. J. Phycol. 42, 1028–1039.
Figueroa, R.I., & Rengefors, K., 2006. Life cycle and sexuality of the freshwater raphidophyte
Gonyostomum semen (Raphidophyceae). J. Phycol. 42, 859–871.

157
Figueroa, R.I., Bravo, I., Garcés, E., 2008. The significance of sexual versus asexual cyst
formation in the life cycle of the noxious dinoflagellate Alexandrium peruvianum.
Harmful Algae 7, 653–663.
Fisher, T.R., Carlson, P.R., Barber, R.T., 1982. Carbon and nitrogen primary productivity in
three North Carolina estuaries. Estuarine, Coastal, and Shelf Science 15, 621-644.
Fisher, T.R., Peele, E.R., Ammerman, J.W., Harding, L.W., 1992. Nutrient limitation of
phytoplankton in Chesapeake Bay. Mar. Ecol. Prog. Ser. 82, 51-63.
Flynn, K., Franco, J.M., Fernandez, P., Reguera, B., Zapata, M., Wood, G., Flynn, K.J., 1994.
Changes in toxin content, biomass and pigments of the dinoflagellate Alexandrium
minutum during nitrogen refeeding and growth into nitrogen or phosphorus stress. Mar.
Ecol. Prog. Ser. 111, 99–109.
Flynn, K.J., Clark, D.R., Owens, N.J.P., 2002. Modelling suggests that optimization of dark
nitrogen-assimilation need not be a critical selective feature in phytoplankton. New
Phytol. 155, 109–119.
Fraga, S., & Sanchez, F.J., 1985. Toxic and potentially toxic dinoflagellates found in the
Galician Rias (NW Spain). In: D.M. Anderson, A.W. White, D.G. Baden (eds.), Toxic
dinoflagellates. Amsterdam: Elsevier, pp. 51-54.
Frangópulos, M., Guisande, C., DeBlas, E., Maneiro, I., 2004. Toxin production and
competitive abilities under phosphorus limitation of Alexandrium species. Harmful Algae
3, 131–139.
Frolova, G.M., Kuznetsova, T.A., Mikhailov, V.V., Elyakov, G.B., 2000a. Immunoenzyme
method fro detecting microbial producers of palytoxin. Bioorganicheskaia Khimiia 26,
315-320.
Frolova, G.M., Kuznetsova, T.A., Mikhailov, V.V., Elyakov, G.B., 2000b. An enzyme linked
immunosorbent assay for detecting palytoxin-producing bacteria. Russian Journal of
Bioorganic Chemistry 26, 285-289.
Fu, M., 2003. Isolation and characterisation of toxins from Fibrocapsa japonica
(Raphidophyceae). PhD Thesis, University Oldenburg, Germany.
Fu, M., Koulman, A., van Rijssel, M., Lützen, A., de Boer, M.K., Tyl, M.R., Liebezeit, G.,
2004a. Chemical characterization of three haemolytic compounds from the microalgal
species Fibrocapsa japonica (Raphidophyceae). Toxicon 43, 355–363.
Fu, M., van Rijssel, M., Liebezeit, G., 2004b. Hemolytic compounds from Fibrocapsa
japonica (Raphidophyceae). In: K.A. Steidinger, J.H. Landsberg, C.R. Tomas, G.A.
Vargo (eds.), Harmful Algae 2002. Florida Fish and Wildlife Conservation Commission,

158
Florida Institute of Oceanography, and Intergovernmental Oceanographic Commission of
UNESCO, St. Petersburg, pp. 207–209.
Fukui, M., Murata, M., Inoue, A., Gawel, M., Yasumoto, T., 1987. Occurence of palytoxin in
the trigger fish Melichtys vidua. Toxicon 25, 1121-1124.
Fukuyo, Y., 1981. Taxonomical study on benthic dinoflagellates collected in coral reefs. Bull.
Jpn. Soc. Sci. Fish. 47, 967–978.
Fukuyo, Y., Sako, Y., Matsuoka, K., Imai, I., Takahashi, M., Watanabe, M., 2003. Biological
character of red-tide organisms. In: T. Okaichi (ed.), Red Tides. Terra Scientific
Publishing Company, Tokyo, pp. 61–153.
Funa, N., Ohnishi, Y., Fujii, I., Shibuya, M., Ebizuka, Y., Horinouchi, S., 1999. A new
pathway for polyketide synthesis in microorganisms. Nature 400, 897–899.
Furey, A., Garcia, J., O'Callaghan, K.O., Lehane, M., Fernandez Amandi, M., James, K.,
2007. Brevetoxins: Structure, Toxicology and Origin. In: L. Botana, Y.H. Hui (eds.),
Phycotoxins: Chemistry and Biochemistry. Ames: Blackwell Publishing, pp. 19–46.
Furnas, M., 1990. In situ growth rates of marine phytoplankton: Approaches to measurement,
community and species growth rates. J. Plankton Res. 12, 1117-1151.
Gallardo Rodríguez, J.J., Cerón García, M.C., García Camacho, F., Sánchez Mirón, A.,
Belarbi, E.H., Molina Grima, E., 2007. New culture approaches for yessotoxin production
from the dinoflagellate Protoceratium reticulatum. Biotechnol. Progr. 23, 339–350.
Gallardo Rodríguez, J.J., Sánchez Mirón, A., Cerón García, M.C., Belarbi, E.H., García
Camacho, F., Chisti, Y., Molina Grima, E., 2009. Macronutrients requirements of the
dinoflagellate Protoceratium reticulatum. Harmful Algae 8, 239-246.
Gangemi, E., Giacobbe, M.G., Fraga, S., 2006. The ciguateric species complex in the Capo
Peloro lagoons (Messina, Sicily). Biol. Mar. Medit. 13, 979-983.
Garcés, E., Delgado, M., Masó, M., Camp, J., 1998. Life history and in situ growth rates of
Alexandrium taylori (Dinophyceae, Pyrrophyta). J. Phycol. 34, 880–887.
Garcés, E., Zingone, A., Montresor, M., Reguera, B., Dale, B. (eds.), 2002. LIFEHAB: life
histories of microalgal species causing harmful blooms. Office for the Official
Publications of the European Communities, Luxembourg.
Garcés, E., Bravo, I., Vila, M., Figueroa, R.I., Masó , M., Sampedro, N., 2004. Relationship
between vegetative cells and cyst production during Alexandrium minutum bloom in
Arenys de Mar harbour (NW Mediterranean). J. Plankton Res. 26, 637–645.
Garcés, E., Fernández, M., Penna, A., Lenning, K.V., Gutierrez, A., Camp, J., Zapata, M.,
2006. Characterization of NV Mediterranean Karlodinium spp. (Dinophyceae) strains

159
using morphological, molecular, chemical and physiological methodologies. J. Phycol.
42, 1096–1112.
Gedaria, A.I., Luckas, B., Reinhardt, K., Azanza, R.V., 2007. Growth response and toxin
concentration of cultured Pyrodinium bahamense var. compressum to varying salinity and
temperature conditions. Toxicon 50, 518-529.
Geraci, J.R., Anderson, D.M., Timperi, R.J., St. Aubin, D.J., Early, G.A., Prescott, J.H.,
Mayo, C.A., 1989. Humpback whales (Megaptera novaeangliae) fatally poisoned by
dinoflagellate toxin. Can. J. Fish. Aq. Sc. 46, 1895-1898.
Gerssen, A., Mulder, P.P.J., McElhinney, M.A., de Boer, J., 2009. Liquid chromatography-
tandem mass spectrometry method for the detection of marine lipophilic toxins under
alkaline conditions. J. Chromatogr. A 1216, 1421-1430.
Gill, S., Murphy, M., Clausen, J., Richard, D., Quilliam, M., MacKinnon, S., LeBlanc, P.,
Mueller, R., Pulido, O., 2003. Neural injury biomarkers of novel shellfish toxins,
spirolides: a pilot study using immunochemical and transcriptional analysis.
Neurotoxicology 24, 593–604.
Glasgow, H.B., Burkholder, J.M., Mallin, M.A., Deamer-Melia, N.J., Reed, R.E., 2001. Field
ecology of toxic Pfiesteria complex species, and a conservative analysis of their role in
estuarine fish kills. Environmental Health Perspectives 109, 715-730.
Glibert, P.M., 1988. Primary productivity and pelagic nitrogen cycling, pp. 3-31. In: T.H.
Blackburn, & J. Sorensen (eds.), Nitrogen Cycling in Coastal Marine Environments. John
Wiley and Sons, Inc. Chichester, U.K.
Glibert, P.M., 1998. Interactions of top-down and bottom-up control in planktonic nitrogen
cycling. Hydrobiologia 363, 1-12.
Glibert, P.M., Magnien, R., Lomas, M.W., Alexander, J., Fan, C.K., Haramoto, E., Trice, M.,
Kana, T.M., 2001. Harmful algal blooms in the Chesapeake and coastal bays of
Maryland, USA: comparison of 1997, 1998, and 1999 events. Estuaries 24, 875–883.
Goldman, J.C., McCarthy, J.J., Peavey, D.G., 1979. Growth rate influence on the chemical
composition of phytoplankton in oceanic waters. Nature 279, 210-215.
Goldman, J.C., 1993. Potential role of large oceanic diatoms in new primary production.
Deep-Sea Research 40, 159-168.
Granéli, E., & Carlsson, P., 1998. The ecological significance of phagotrophy in
photosynthetic flagellates. In: D.M. Anderson, A.D. Cembella, G.M. Hallegraeff (eds.),
Physiological ecology of harmful algal blooms, vol. 41. Berlin: Springer, pp. 539-557.

160
Granéli, E., & Flynn, K., 2006. Chemical and physical factors influencing toxin content. In:
E. Granéli, J.T. Turner (eds.), Ecological Studies, Vol. 189. Ecology of Harmful Algae.
Springer-Verlag, Berlin Heidelberg, pp. 229–241.
Granéli, E., & Turner, J.T., (eds). Ecology of harmful algae. Springer, Heidelberg, 2006,
Series: Ecological Studies, Vol. 189, 413 p.
Granéli, E., Vidyarathna,N.K., Funari, E., Cumaranatunga, R., 2008. Climate change and
benthic dinoflagellates - the Ostreopsis ovata case. In: Proceedings of the 13th
International Conference on Harmful Algae, Hong Kong, 3–7 November, 2008, p.42.
Granéli, E., Vidyarathna,N.K., Funari, E., Cumaranatunga, P.R.T., Scenati, R., 2011. Can
increases in temperature stimulate blooms of the toxic benthic dinoflagellate Ostreopsis
ovata? Harmful Algae 10, 165-172.
Gross, F., Luniak, N., Perlova, O., Gaitatzis, N., Jenke-Kodama, H., Gerth, K., Gottschalk, D.,
Dittmann, E., Muller, R., 2006. Bacterial type III polyketide synthases: phylogenetic
analysis and potential for the production of novel secondary metabolites by heterologous
expression in pseudomonads. Arch. Microbiol. 185, 28–38.
Guerrini, F., Ciminiello, P., Dell’Aversano, C., Tartaglione, L., Fattorusso, E., Boni, L.,
Pistocchi, R., 2007. Influence of temperature, salinity and nutrient limitation on
yessotoxin production and release by the dinoflagellate Protocetatium reticulatum in
batch-cultures. Harmful Algae 6, 707–717.
Guerrini, F., Pezzolesi, L., Feller, A., Riccardi, M., Ciminiello, P., Dell’Aversano, C.,
Tartaglione, L., Dello Iacovo, E., Fattorusso, E., Forino, M., Pistocchi, R., 2010.
Comparative growth and toxin profile of cultured Ostreopsis ovata from the Tyrrhenian
and Adriatic Seas. Toxicon 55, 211-220.
Guidi-Rontani, C., Maheswari, U., Jabbari, K., Bowler, C., 2010. Comparative ecophysiology
and genomics of the toxic unicellular alga Fibrocapsa japonica. New Phytol. 185, 446-
458.
Guillard, R.R.L., 1973. Division rates. In: J.R. Stein (ed.), Handbook of phycological
methods: culture methods and growth measurements. Vol 1, Cambridge University Press,
New York, pp. 289–312.
Guillard, R.R.L., 1975. Culture of phytoplankton for feeding marine invertebrates. In: W.L.
Smith, M.H. Chanley (eds.), Culture of Marine Invertebrates Animals. Plenum Press,
New York, pp. 26-60.

161
Guisande, C., Frangopulos, M., Maneiro, I., Vergara, A.R., Riveiro, I., 2002. Ecological
advantages of toxin production by the dinoflagellate Alexandrium minutum under
phosphorus limitation. Mar. Ecol. Prog. Ser. 225, 169–176.
Habermann, E., 1989. Palytoxin acts through Na+, K+-ATPase. Toxicon 27, 1171–1187.
Hallegraeff, G.M., & Bolch, C.J., 1992. Transport of diatom and dinoflagellate resting spores
via ship’s ballast water: Implications for plankton biogeography and aquaculture. J.
Plankton Res. 14, 1067-1084.
Hallegraeff, G.M., 1993. A review of harmful algal blooms and their apparent global increase.
Phycologia 32, 79–99.
Hallegraeff, G.M., Anderson, D.M., Cembella, A.D. (eds.), 1995. Manual on Harmful Marine
Microalgae, vol. 33. UNESCO.
Hallegraeff, G.M., Anderson, D.M., Cembella, A.D. (eds.), 2003. Manual on Harmful Marine
Microalgae, vol. 33. UNESCO.
Hasle, G.R., 1950. Phototactic vertical migration in marine dinoflagellates. Oikos 2, 162-175.
Hasle, G.R., 1978. The inverted microscope method. In: A. Sournia (ed.), Phytoplankton
Manual. Monographs on Oceanographic Methodology, vol. 6. UNESCO, Paris, pp. 88–
96.
Hecky, P.E., & Kilham, P., 1988. Nutrient limitation of phytoplankton in freshwater and
marine environments: A review of recent evidence on the effects of enrichment. Limn.
Ocean. 33, 796-822.
Heisler, J., Glibert, P.M., Burkholder, J.M., Anderson, D.M., Cochlan, W., Dennison, W.C.,
Dortch, Q., Gobler, C.J., Heil, C.A., Humphries, E., and others. 2008. Eutrophication and
harmful algal blooms: A scientific consensus. Harmful Algae 8, 3–13.
Hess, P., McMahon, T., Slattery, D., Swords, D., Dowling, G., McCarron, M., Clarke, D.,
Gibbons, W., Silke, J., O’Cinneide, M., 2003. Use of LC–MS testing to identify lipophilic
toxins, to establish local trends and interspecies differences and to test the comparability
of LC–MS testing with the mouse bioassay: an example from the Irish Biotoxin
Monitoring Programme 2001. In: A. Villalba, B. Reguera, J.L. Romalde, R. Beiras (eds.),
Molluscan Shellfish Safety. Xunta de Galicia and UNESCO, Spain, pp. 57–66.
Hess, P., Grune, B., Anderson, D.B., Aune, T., Botana, L.M., Caricato, P., van Egmond, H.P.,
Halder, M., Hall, S., Lawrence, J.F., Moffat, C., Poletti, R., Richmond, J., Rossini, G.P.,
Seamer, C., Vilageliu, J.S., 2006. Three Rs approaches in marine biotoxin testing - the
report and recommendations of a joint ECVAM/DG SANCO workshop (ECVAM
workshop 55). Atla-Alter. Lab Anim. 34, 193–224.

162
Hodgkiss, I.J., & Ho, K.C., 1997. Are changes in N:P ratios in coastal waters the key to
increased red tide blooms? Hydrobiologia 352, 141–147.
Hold, G.L., Smith, E.A., Rappe, M.S., Maas, E.W., Moore, E.R.B., Stroempl, C., Stephen,
J.R., Prosser, J.I., Birkbeck, T.H., Gallacher, S., 2001. Characterisation of bacterial
communities associated with toxic and non-toxic dinoflagellates: Alexandrium spp. and
Scrippsiella trochoidea. FEMS Microbiol. Ecol. 37, 161–173.
Holmes, M.J., Lewis, J.L., Jones, A., Wong Hoy, A.W., 1995. Cooliatoxin, the first toxin
from Coolia monotis (Dinophyceae). Natural Toxins 3, 355-362.
Hopwood, D.A., 1997. Genetic contributions to understanding polyketide synthases. Chem.
Rev. 97, 2465–2498.
Hoshaw, R.W., & Rosowski, J.R., 1973. Methods for microscopic algae. In: J.R. Stein (ed.),
Handbook of Phycological Methods. Cambridge University Press, New York, pp. 53–67.
Hua, Y., Lu, W., Henry, M.S., Pierce, R.H., Cole, R.B., 1996. On-line liquid
chromatography–electrospray ionization mass spectrometry for determination of
brevetoxin profile in natural ‘‘red tide” algae blooms. J. Chromatogr. 750, 115–125.
Imai, I., 1989. Cyst formation of the noxious red tide flagellate Chattonella marina
(Raphidophyceae) in culture. Mar. Biol. 103, 235–239.
Imai, I., 1990. Physiology, morphology, and ecology of cysts of Chattonella
(Raphidophyceae), causative flagellates of noxious red tides in the Inland Sea of Japan.
Nansei Bull. Nat. Fish. Res. Inst. Japan 23, 63–166.
Imai, I., Yamaguchi, M., Watanabe, M., 1998. Ecophysiology, life cycle, and bloom
dynamics of Chattonella in Seto Island Sea, Japan. In: D.M. Anderson, A.D. Cembella,
G.M. Hallegraeff (eds.), Physiological Ecology of Harmful Algal Blooms. Springer-
Verlach, Berlin/Heidelberg, pp. 95–112.
Ingarao, C., Lanciani, G., Teodori, A., Pagliani, T., 2009. First presence of Ostreopsis cfr.
Ovata (Dinophyceae) along Abruzzo coasts (W Adriatic Sea). Biol. Mar. Mediterr. 16,
172-173.
IRSA-CNR., 2003. Metodi analitici per le acque, APAT Manuali e Linee Guida 29/2003. Vol.
3, 8060 - Metodo di valutazione della tossicità acuta con Artemia sp., pp.1043-1050.
Iwasaki, H., 1971. Studies on the red tide flagellates. VI On Eutreptiella sp. and Exuviaella
sp. appeared in Bingo-Nada, the Seto Inland Sea, in 1970. J. of the Oceanogr. Soc. of
Japan 27, 152–157.

163
James, K.J., Sierra, M.D., Lehane, M., Magdalena, A.B., Furey, A., 2003. Detection of five
new hydroxyl analogues of azaspiracids in shellfish using multiple tandem mass
spectrometry. Toxicon 41, 277–283.
James, K.J., Carey, B., O’Halloran, J., van Pelt, F.N.M., Skrabáková, Z., 2010. Shellfish
toxicity: human health implications of marine algal toxins. Epidemiol. Infect. 138, 927-
940.
Johansson, N., Granéli, E., Yasumoto, T., Carlsson, P., Legrand, C., 1996. Toxin production
by Dinophysis acuminata and D. acuta cells grown under nutrient sufficient and deficient
conditions. In: Yasumoto, T., Oshima, Y., Fukuyo, Y. (eds.), Harmful and Toxic Algal
Blooms. Intergovernmental Oceanographic Commission of UNESCO, Paris, pp. 277–
279.
John, E.H., Flynn, K.J., 2000. Growth dynamics and toxicity of Alexandrium fundyense
(Dinophyceae): the effect of changing N: P supply ratios on internal toxin and nutrient
levels. European J. Phycol. 35, 11–23.
John, U., Beszteri, B., Derelle, E., Van de Peer, Y., Read, B., Moreau, H., Cembella, A.D.,
2007. Novel insights into evolution of protistan polyketide synthases through
phylogenomic analysis. Protist 159, 21–30.
Justic, D., Rabalais, N.N., Turner, R.E., Dortch, Q., 1995. Changes in nutrient structure of
river-dominated coastal waters: stoichiometric nutrient balance and its consequences.
Estuarine, Coastal and Shelf Science 40, 339–356.
Jüttner, F., 2001. Liberation of 5,8,11,14,17-eicosapentaenoic acid and other polyunsaturated
fatty acids from lipids as a grazer defense reaction in epilithic diatom biofilms. J. Phycol.
37, 744-755.
Kaebernick, M., Neilan, B. A., Borner, T., Dittmann, E., 2000. Light and the transcriptional
response of the microcystin biosynthesis gene cluster. Appl. Environ. Microbiol. 66,
3387–92.
Kan, Y., Uemura, D., Hirata, Y., Ishiguro, M., Iwashita, T., 2001. Complete NMR signal
assignment of palytoxin and N-acetylpalytoxin. Tetrahedron Lett. 42, 3197-3202.
Katikou, P., 2008. Palytoxin and analogues: ecobiology and origin, chemistry, metabolism
and chemical analysis. In: L.M. Botana (ed.), Seafood and Freshwater Toxins, second ed.
CRC Press Taylor & Francis Group, Boca Raton FL, pp. 631–664.
Khan, S., Arakawa, O., Onoue, Y., 1996. Neurotoxin production by a chloromonad
Fibrocapsa japonica (Raphidophyceae). J. World Aquat. Soc. 27, 254–263.

164
Khosla, C., Gokhale, R.S., Jacobsen, J.R., Cane, D.E., 1999. Tolerance and specificity of
polyketide synthases. Annu. Rev. Biochem. 68, 219–253.
Kim, C.S., Lee, S.G., Lee, C.K., Kim, H.G., Jung, J., 1999. Reactive oxygen species as
causative agents in the ichthyotoxicity of the red tide dinoflagellate Cochlodinium
polykrikoides. J. Plankton Res. 21, 2105-2115.
Kremp, A., & Heiskanen, A.S., 1999. Sexuality and cyst formation of the spring-bloom
dinoflagellate Scrippsiella hangoei in the coastal northern Baltic Sea. Mar. Biol. 143,
771–777.
Kubota, T., Iinuma, Y., Kobayashi, J., 2006. Cloning of polyketide synthase genes from
amphidinolide-producing dinoflagellate Amphidinium sp. Biol. Pharm. Bull. 29, 1314–
1318.
Laatsch, T., Zauner, S., Stoebe-Maier, B., Kowallik, K.V., Maier, U.G., 2004. Plastid-derived
single gene minicircles of the dinoflagellate Ceratium horridum are localized in the
nucleus. Mol. Biol. Evol. 21, 1318–1322.
Lam, C.W.Y., & Ho, K.C., 1989. Red tides in Tolo Harbour, Hong Kong, pp. 49-52. In: T.
Okaichi, D.M., Anderson, T. Nemoto (eds.), Red Tides: Biology, Environmental Science
and Toxicology. Elsevier, New York.
Latasa, M., & Berdalet, E., 1994. Effect of nitrogen and phosphorus starvation on pigment
composition of cultured marine dinoflagellate Heterocapsa sp. J. Plankton Res. 16, 83-94.
Lawrence, J.F., Chadha, R.K., Ratnayake, W.M.N., Truelove, J.F., 1994. An incident of
elevated levels of unsaturated free fatty acids in mussels from Nova Scotia and their toxic
effect in mice after intraperitoneal injection. Nat. Toxins 2, 318–321.
Lenoir, S., Ten-Hage, L., Turquet, J., Quod, J. P., Bernard, C., Hennion, M. C., 2004. First
evidence of palytoxin analogues from an Ostreopsis mascarenensis (Dinophyceae)
benthic bloom in Southwestern Indian Ocean. J. Phycol. 40, 1042–1051.
Lim, P.T., & Ogata, T., 2005. Salinity effect on growth and toxin production of four tropical
Alexandrium species (Dinophyceae). Toxicon 45, 699–710.
Liu, G., Janowitz, G.S., Kamykowski, D., 2002. Influence of current shear on Gymnodinium
breve (Dinophyceae) population dynamics: a numerical study. Mar. Ecol. Prog. Ser. 231,
47–66.
Lomas, M.W., & Glibert, P.M., 1999a. Temperature regulation of NO3 uptake: A novel
hypothesis about NO3 uptake and cool-water diatoms. Limn. Ocean. 44, 556-572.

165
Lomas, M.W., & Glibert, P.M., 1999b. Interaction between NH4+ and NO3
- uptake and
assimilation: Comparisons of diatoms and dinoflagellates at several growth temperatures.
Marine Biology 133, 541-551.
Lomas, M.W., & Glibert, P.M., 2000. Comparisons of nitrate uptake, storage, and reduction
in marine diatoms and flagellates. J. Phycol. 36, 903-913.
Lopez-Flores, R., Garcés, E., Boix, D., Badosa, A., Brucet, S., Masó, M., Quintana, X.D.,
2006. Comparative composition and dynamics of harmful dinoflagellates in
Mediterranean salt marshes and nearby external marine waters. Harmful Algae 5, 637–
648.
MacIsaac, J.J., & Dugdale, R.C., 1972. Interactions of light and inorganic nitrogen in
controlling nitrogen uptake in the sea. Deep-Sea Research 19, 209-232.
Macpherson, G.R., Burton, I.W., LeBlanc, P., Walter, J.A., Wright, J.L.C., 2003. Studies of
the biosynthesis of DTX-5a and DTX-5b by the dinoflagellate Prorocentrum maculosum:
regiospecificity of the putative Baeyer-Villigerase and insertion of a single amino acid in
a polyketide chain. J. Org. Chem. 68, 1659-1664.
Magnien, R., Goshorn, D., Michael, B., Tango, P., Karrh, R., 2000. Associations between
Pfiesteria, fish health and environmental conditions in Maryland. Tidewater Ecosystem
Assessment, Maryland Department of Natural Resources, Annapolis, Maryland.
Mangialajo, L., Bertolotto, R., Cattaneo-Vietti, R., Chiantore, M., Grillo, C., Lemee, R.,
Melchiorre, N., Moretto, P., Povero, P., Ruggirei, N., 2008. The toxic benthic
dinoflagellate Ostreopsis ovata: quantification of proliferation along the coastline of
Genoa, Italy. Mar. Poll. Bull. 56, 1209-1214.
Marshall, J.A., Nichols, P.D., Hallegraeff, G.M., 2002. Chemotaxonomic survey of sterols
and fatty acids in six marine raphidophyte algae. J. Appl. Phycol. 14, 255-265.
Marshall, J.A., Nichols, P.D., Hamilton, B., Lewis, R.J., Hallegraeff, G.M., 2003.
Ichthyotoxicity of Chattonella marina (Raphidophyceae) to damselfish (Acanthochromis
polycanthus): the synergistic role of reactive oxygen species and free fatty acids. Harmful
Algae 2, 273–281.
Margalef, R., 1978. Life-forms of phytoplankton as survival alternatives in an unstable
environment. Oceanol. Acta 1, 493-509.
Matsuoka, K., & Fukuyo, Y., 2003. Taxonomy of cysts. In: G.M. Hallegraeff, D.M.
Anderson, A.D. Cembella (eds.), Manual on Harmful Marine Microalgae. Manual and
Guides IOC. UNESCO, pp. 563–592.

166
McLachlan, J., 1973. Growth media-marine. In: J.R. Stein (ed.), Handbook of Phycological
Methods. Culture Methods and Growth Measurements. Cambridge University Press, New
York, pp. 25–51.
McLachlan, J.L., Marr, J.C., Conlon-Kelly, A., Adamson, A., 1994. Effects of nitrogen
concentration and cold temperature on DSP-toxin concentration in the dinoflagellate
Prorocentrum lima (Prorocentrales. Dinophycae). Nat. Toxins 2, 263–270.
McMinn, A., Hallegraeff, G.H., Thomson, P., Jenkinson, A.V., Heijnis. H., 1997. Cyst and
radionuclide evidence for the recent introduction of the toxic dinoflagellate Gymnodinium
catenatum into Tasmanian waters. Mar. Ecol. Prog. Ser. 161, 165-172.
Monroe, E. & Van Dolah, F. 2008. The toxic dinoflagellate Karenia brevis encodes novel
type I-like polyketide synthases containing discrete catalytic domains. Protist 159, 471–
482.
Monroe, E.A., Johnson, J.G., Wang, Z., Pierce, R.K., Van Dolah, F.M., 2010.
Characterization and expression of nuclear-encoded polyketide synthases in the
brevetoxin-producing dinoflagellate Karenia brevis. J. Phycol. 46, 541-552.
Monti, M., Minocci, M., Beran, A., Ivesa, L., 2007. First record of Ostreopsis cfr. ovata on
macroalgae in the Northern Adriatic Sea. Mar. Poll. Bull. 54, 598–601.
Montresor, M., & Marino, D., 1996. Modulating effect of cold-dark storage on excystment in
Alexandrium pseudogonyaulax (Dinophyceae). Mar. Biol. 127, 36–60.
Montresor, M., Zingone, A., Sarno, D., 1998. Dinoflagellate cyst production at a coastal
Mediterranean site. J. Plankton Res. 20, 2291-2312.
Moore, R.E., Helfrich, P., Patterson, G.M.L., 1982. The deadly seaweed of Hana. Oceanus 25,
54-63.
Morton, S.L., Norris, D.R., Bomber, J.W., 1992. Effect of temperature, salinity and light-
intensity on the growth and seasonality of toxic dinoflagellates associated with ciguatera.
J. Exp. Mar. Biol. Ecol. 157, 79–90.
Mostaert, A.S., Karsten, U., Hara, Y., Watanabe, M.M., 1998. Pigments and fatty acids of
marine raphidophytes: a chemotaxonomic re-evaluation. Phycol. Res. 46, 213-220.
Murakami, Y, Oshima, Y, Yasumoto, T., 1982. Identification of okadaic acid as a toxic
component of a marine dinoflagellate, Prorocentrum lima. Bulletin of the Japanese
Society of Fisheries Science 48, 69–72.
Nagai, H., Satake, M., Murata, M., Yasumoto, T., 1990. Screening of marine phytoplankton
for antifungal activity, pp. 385-390. In: Toxic marine phytoplankton: Proc. 4th Int. Conf.
Elsevier.

167
Nakamura, A., & Umemori, T., 1991. Encystment of the red tide flagellate Chattonella
antiqua (Raphidophyceae): cyst yield in batch cultures and cyst flux in the field. Mar.
Ecol. Progr. Ser. 78, 273–284.
Narahashi, T., 1988. Mechanism of tetrodotoxin and saxitoxin action. In: A.T. Tu (ed.),
Marine Toxins and Venoms, vol. 3. New York: Marcel Dekker Inc., pp. 185–210.
National Research Council, 2000. Clean Coastal Waters – Understanding and reducing the
effects of nutrient pollution. National Academy Press, Washington, D.C.
Navarro, J.M., Muñoz, M.G., Contreras, A.M., 2006. Temperature as a factor regulating
growth and toxin content in the dinoflagellate Alexandrium catenella. Harmful Algae 5,
762-769.
Nixon, S.W., 1995. Coastal marine eutrophication: A definition, social causes, and future
concerns. Ophelia 41, 199–219.
Oda, T., Nakamura, A., Shikayama, M., Kawano, I., Ishimatsu, A., Muramatsu, T., 1997.
Generation of reactive oxygen species by raphidophycean phytoplankton. Biosci.
Biotechnol. Biochem. 61, 1658–1662.
Officer, C.B., & Ryther, J.H., 1980. The possible importance of silicon in marine
eutrophication. Mar. Ecol. Prog. Ser. 3, 83-91.
Ofuji, K., Satake, M., McMahon, T., Silke, J., James, K.J., Naoki, H., Yasumoto, T., 1999.
Two analogs of azaspiracid isolated from mussels, Mytilus edulis, involved in human
intoxications in Ireland. Natural Toxins 7, 99–102.
Ofuji, K., Satake, M., McMahon, T., James, K.J., Naoki, H., Oshima, Y., Yasumoto, T., 2001.
Structures of azaspiracid analogs, azaspiracid-4 and azaspiracid-5, causative toxins of
azaspiracid poisoning in Europe. Bioscience Biotechnology Biochemistry 65, 740–742.
Ogino, H., Kugami, M., Yasumoto, T., 1997. Toxicologic evaluation of yessotoxin. Natural
Toxins 5, 255–259.
Okaichi, T., 1972. Occurrence of red-tides related to neritic water pollution. In: The Cause of
Red-tide in Neritic Waters, Japanese Association for the Protection of Fisheries
Resources, Tokyo, pp. 58–76.
Okaichi, T., 1989. Red tide problems in the Seto Inland Sea, Japan. In: T. Okaichi, D.M.
Anderson, T. Nemoto (eds.), Red tides, Biology, Environmental Science and Toxicology.
Elsevier, New York, pp. 137–142.
Okaichi, T. (ed.), 2003. Red Tides. Terra Scientific Publishing Company, Tokyo.
Okolodkov, Y., Campos-Bautista, G., Gárate-Lizárraga, I., González-González, J.A.G.,
Hoppenrath, M., Arenas, V., 2007. Seasonal changes of benthic and epiphytic

168
dinoflagellates in the Veracruz reef zone, Gulf of Mexico. Aquat. Microb. Ecol. 47, 223-
237.
Olivos, A., 2000. Nutrientes inorgánicos disueltos en aguas litorales próximas del Mar
Catalán. PhD Marine Biology Department. Barcelona, Universitat de Barcelona, 195.
Onuma, Y., Satake, M., Ukena, T., Roux, J., Chanteau, S., Rasolofonirina, N., Ratsimaloto,
M., Naoki, H., Yasumoto, T., 1999. Identification of putative palytoxin as the cause of
clupeotoxism. Toxicon 37, 55–65.
Orsini, L., Sarno, D., Procaccini, G., Poletti, R., Dahlmann, J., Montresor, M., 2002. Toxic
Pseudo-nitzschia multistriata (Bacillariophyceae) from the Gulf of Naples: morphology,
toxin analysis and phylogenetic relationships with other Pseudonitzschia species. Eur. J.
Phycol. 37, 247–257.
Pan, Y., Subba Rao, D.V., Mann, K.H., Brown, R.G., Pocklington, R., 1996a. Effects of
silicate limitation on production of domoic acid, a neurotoxin, by the diatom Pseudo-
nitschia multiseries. I. Batch culture studies. Mar. Ecol. Prog. Ser. 131, 225-233.
Pan, Y., Subba Rao, D.V., Mann, K.H., Brown, R.G., Pocklington, R., 1996b. Effects of
silicate limitation on production of domoic acid, a neurotoxin, by the diatom Pseudo-
nitschia multiseries. II. Continuous culture studies. Mar. Ecol. Prog. Ser. 131, 235-243.
Parsons, M.L., & Preskitt, L.B., 2007. A survey of epiphytic dinoflagellates from the coastal
waters of the island of Hawai’i. Harmful Algae 6, 658–669.
Pearce, I., Marshall, J.M., Hallegraeff, G.M., 2001. Toxic epiphytic dinoflagellates from east
coast Tasmania. In: G.M. Hallegraeff, S.I. Blackburn, C.J. Bolch, R.J. Lewis (eds.),
Proceedings of the Ninth International Conference on Harmful Algal Blooms,
Intergovernmental Oceanographic Commission of UNESCO, Hobart, Tasmania, pp. 54–
57.
Penna, A., Ingarao, C., Ercolessi, M., Rocchi, M., Penna, N., 2006. Potentially harmful
microalgal distribution in an area of the NW Adriatic coastline: sampling procedure and
correlations with environmental factors. Estuar. Coast. Shelf. Sci. 70, 307–316.
Pezzolesi, L., Cucchiari, E., Guerrini, F., Pasteris, A., Totti, C., Pistocchi, R., 2010. Toxicity
evaluation of Fibrocapsa japonica from the Northern Adriatic Sea through a chemical
and toxicological approach. Harmful Algae 8, 504-514.
Pierce, R.H., Henry, M.S., Blum, P.C., Hamel, S.L., Kirkpatrick, G.J., Cheng, Y.S., Zhou, Y.,
Irvin, C.M., Naar, J., Weidner, A., Fleming, L.E., Backer, L.C., Baden, D.G., 2005.
Brevetoxin composition in water and marine aerosol along a Florida beach: assessing
potential human exposure to marine biotoxins. Harmful Algae 4, 965–972.

169
Pistocchi, R., Pezzolesi, L., Guerrini, F., Vanucci, S., Dell’Aversano, C., Fattorusso E., 2011.
A review on the effects of environmental conditions on growth and toxin production of
Ostreopsis ovata. Toxicon 57, 421-428.
Poulet, S.A., Ianora, A., Miralto, A., Meijer, L., 1994. Do diatoms arrest embryonic
development in copepods? Mar. Ecol. Prog. Ser. 111, 79-86.
Prego, R., 1992. Flows and budgets of nutrient salts and organic carbon in relation to a red
tide in the Ria of Vigo (NW Spain). Mar. Ecol. Prog. Ser. 79, 289–302.
Quilliam, M.A., Thomson, B.A., Scott, G.J., Siu, K.W.M., 1989. Ion-spray mass spectrometry
of marine neurotoxins. Rapid Commun. Mass Spectrom. 3, 145-150.
Quilliam, M.A., 1998. In: B. Reguera, J. Blanco, M.L. Fernandez, T. Wyatt (eds.), Harmful
Algae, Xunta de Galicia and IOC/ UNESCO, Vigo, p. 509.
Quilliam, M.A., Hess, P., Dell’Aversano, C., 2001. In: W.J. deKoe, R.A. Samson, H.P. van
Egmond, J. Gilbert, M. Sabino (eds.), Mycotoxins and Phycotoxins in Perspective at the
Turn of the Century, W.J. deKoe, Wageningen, The Netherlands, p. 383.
Quilliam, M.A., 2003. The role of chromatography in the hunt for red tide toxins. J.
Chromatogr. A 1000, 527-548.
Rabalais, N.N., Wiseman jr., W.J., Turner, R.E., Justic, D., Sen Gupta, B.K., Dortch, Q.,
1996. Nutrient changes in the Mississippi River and system responses on the adjacent
continental shelf. Estuaries 19, 386-407.
Rabalais, N.N., & Nixon, S.W., 2002. Preface: nutrient over-enrichment of the coastal zone.
Estuaries 25, 639.
Rawlings, B.J., 1997. Biosynthesis of polyketides. Nat. Prod. Rep. 14, 523–56.
Rehmann, N., Hess, P., Quilliam, M.A., 2008. Discovery of new analogs of the marine
biotoxin azaspiracid in blue mussels (Mytilus edulis) by ultra-performance liquid
chromatography/tandem mass spectrometry. Rap. Commun. Mass Spectrom. 22, 549–
558.
Rhodes, L.L., Haywood, A.J., Ballantine, W.J., MacKenzie, A.L., 1993. Algal blooms and
climate anomalies in north-east New Zealand, August–December 1992. N.Z. J. Mar.
Freshw. Res. 27, 419–430.
Rhodes, L., Adamson, J., Suzuki, T., Briggs, L., Garthwaite, I., 2000. Toxic marine epiphytic
dinoflagellates, Ostreopsis siamensis and Coolia monotis (Dinophyceae), in New
Zealand. NZ J. Mar. Freshwat. Res. 34, 371–383.
Richardson, K., & Jorgensen, B.B., 1996. Eutrophication: Definition, history and effects, pp.
1-19. In: B.B. Jorgensen, & K. Richardson (eds.), Eutrophication in Coastal Marine

170
Ecosystem. Coastal and Estuarine Studies, volume 52. American Geophysical Union,
Washington, D.C.
Richardson, K., 1997. Harmful or exceptional phytoplankton blooms in the marine ecosystem,
pp. 302-386. In: J.H.S. Blaxter, & A.J. Southworth (eds.), Advances in Marine Biology,
volume 31. Academic Press, San Diego, California, pp. 301-385.
Riegman, R., 1995. Nutrient-related selection mechanisms in marine phytoplankton
communities and the impact of eutrophication on the planktonic food web. Water Science
and Technology 32, 63-75.
Rijstenbil, J.W., & Gerringa, L.J.A., 2002. Interactions of algal ligands, metal complexation
and availability, and cell responses of the diatom Ditylum brightwellii with a gradual
increase in copper. Aq. Toxicol. 56, 115-131.
Riobó, P., Paz, B., Franco, J.M., Vázquez, J.A., Murado, M.A., 2008. Proposal for a simple
and sensitive haemolytic assay for palytoxin toxicological dynamics, kinetics, ouabain
inhibition and thermal stability. Harmful Algae 7, 415-429.
Riobó, P., Franco, J.M., 2011. Palytoxins: Biological and chemical determination. Toxicon
57, 368-375.
Roth, P.B., Twiner, M.J., Wang, Z., Dechraoui, M.Y.B., Doucette, G.J., 2007. Fate and
distribution of brevetoxin (PbTx) following lysis of Karenia brevis by algicidal bacteria,
including analysis of open A-ring derivatives. Toxicon 50, 1175–1191.
Rudek, J., Paerl, H.W., Mallin, M.A., Bates, P.W., 1991. Seasonal and hydrological control of
phytoplankton nutrient limitation in the lower Neuse River estuary, North Carolina. Mar.
Ecol. Prog. Ser. 75, 133-142.
Sansoni, G., Borghini, B., Camici, G., Casotti, M., Righini, P., Fustighi, C., 2003. Fioriture
algali di Ostreopsis ovata (Gonyaulacales: Dinophyceae): un problema emergente. Biol.
Amb. 17, 17-23.
Satake, M., Ofuji, K., Naoki, H., James, K.J., Furey, A., McMahon, T., Silke, J., Yasumoto,
T., 1998. Azaspiracid, a new marine toxin having unique spiro ring assemblies, isolated
from Irish mussels, Mytilus edulis. J. Am. Chem. Soc. 120, 9967–9968.
Scarratt, A.M., Scarratt, D.J., Scarratt, M.G., 1993. Survival of live Alexandrium tamarense
cells in mussel and scallop spat under simulated transfer conditions. J. Shellfish Res. 12,
383-388.
Schelske, C.L., Stoermer, E.F., Fahnenstiel, G.L., Haibach, M., 1986. Phosphorus enrichment,
silica utilization, and biogeochemical silica depletion in the Great Lakes. Can. J. Fish.
Aquat. Sci. 43, 407-415.

171
Schindler, D.W., 1977. Evolution of phosphorus limitation in lakes. Science 196, 260-262.
Scholin, C.A., 1996. Morphological, genetic and biogeographic relationships of toxic
dinoflagellates Alexandrium tamarense, A. catenella and A. fundyense. In: D.A.
Anderson, A.D. Cembella, G.M. Hallegraeff (eds.), The Physiological Ecology of
Harmful Algal Blooms. Springer, Bermuda Biological Station, pp. 13–28.
Seljeskos, E., Hervig, T., Mansoor, M.A., 2006. A novel HPLC method for the measurement
of thiobarbituric acid reactive substances (TBARS). A comparison with a commercially
available kit. Clin. Biochem. 39, 947–54.
Shears, N.T., & Ross, P.M., 2009. Blooms of benthic dinoflagellates of the genus Ostreopsis;
an increasing and ecologically important phenomenon on temperate reefs in New Zealand
and worldwide. Harmful Algae 8, 916–925.
Shi, L., Carmichael, W.W., Miller, I., 1995. Immuno-gold localization of hepatotoxins in
cyanobacterial cells. Arch. Microbiol. 163, 7–15.
Shi, Y., Hu, H., Cong, W., 2005. Positive effects of continuous low nitrate levels on growth
and photosynthesis of Alexandrium tamarense (Gonyaulacales, Dinophyceae). Phycol.
Res. 53, 43–48.
Shimizu, Y., 1996. Microalgal metabolites: a new perspective. Annu. Rev. Microbiol. 50,
431-465.
Shimizu, Y., 2000. Microalgae as a drug source. In Drugs from the Sea. Edited by Fusetani
N., Basel: Karger; pp. 30-45.
Shimizu, Y., 2003. Microalgal metabolites. Curr. Opin. Microbiol. 6, 236–243.
Shumway, S.E., Egmond, H.Pv., Hurst, J.W., Bean, L.L., 1995. Management of shellfish
resources. In: G.M. Hallegraeff, D.M. Anderson, A.D. Cembella (eds.), Manual on
harmful marine microalgae, vol. 33. Paris: UNESCO, pp. 433-474.
Sieber, S.A., Linne, U., Hillson, N.J., Roche, E., Walsh, C.T., Marahiel, M.A., 2002.
Evodnece for a monomeric structure of nonribosomal peptide synthetases. Chem. Biol. 9,
997-1008.
Simoni, F., Gori, L., Di Paolo, C., Lepri, L., Mancino, A., 2004. Fioriture d’Ostreopsis ovata,
Coolia monotis, Prorocentrum lima nelle macroalghe del mar Tirreno settentrionale,
Mediterraneo (seconda fase di studio). Biol. Ital. 10, 68-73.
Siu, G.K.Y., Young, M.L.C., Chan, D.K.O., 1997. Environmental and nutritional factors
which regulate population dynamics and toxin production in the dinoflagellate
Alexandrium catenella. Hydrobiologia 352, 117–140.

172
Smayda, T.J., 1989. Primary production and the global epidemic of phytoplankton blooms in
the sea: a linkage? In: E.M. Cosper, V.M. Bricelj, E.J. Carpenter (eds.), Novel
phytoplankton blooms, vol. 35. Berlin: Springer, pp. 449-483.
Smayda, T.J., 1990. Novel and nuisance phytoplankton blooms in the sea: evidence for a
global epidemic. In: E. Granéli, B. Sundström, L. Edler, D.M. Anderson (eds.), Toxic
Marine Phytoplankton. New York, Elsevier Science Inc., pp. 29-40.
Smayda, T.J., 1992. Global epidemic of noxious phytoplankton blooms and food chain
consequences in large ecosystems, pp. 275-307. In: K. Sherman et al. (eds.), Food chains,
yields, models and management of large marine ecosystems. Westview.
Smayda, T.J., 1997. What is a bloom? A commentary. Limn. Ocean. 42, 1132-1136.
Smayda, T.J., 1998. Ecophysiology and bloom dynamics of Heterosigma akashiwo
(Raphidophyceae). In: G.M. Hallegraeff, D.M. Anderson, A.D. Cembella (eds.),
Physiological Ecology of Harmful Algal Blooms. Springer-Verlag, Berlin/Heidelberg, pp.
113–131.
Smayda, T.J., & Reynolds, C.S., 2003. Strategies of marine dinoflagellate survival and some
rules of assembly. J. Sea Res. 49, 95–106.
Snyder, R.V., Gibbs, P.D.L., Palacios, A., Abiy, L., Dickey, R., Lopez, J.V., Rein, K.S., 2003.
Polyketide synthase genes from marine dinoflagellates. Mar. Biotechnol. 5, 1–12.
Snyder, V.R., Guerrero, M.A., Sinigalliano, C.D., Winshell, J., Perez, R., Lopez, J.V., Rein,
K.S., 2005. Localization of polyketide synthase encoding genes to the toxic dinoflagellate
Karenia brevis. Phytochemistry 66, 1767-1780.
Sohet, K., Pereira, A., Braeckman, J.C., Houvenaghel, G., 1995. Growth and toxicity of
Prorocentrum lima (Ehrenberg) dodge in different culturemedia: effects of humic acids
and organic phosphorus. In: P. Lassus, G. Arzul, E. Erard-le Denn, P. Gentien, C.
Marcaiillou-Le Baut (eds.), Harmful Marine Algal Blooms. Lavoisier Intercept, New
York, pp. 669–674.
Sournia, A., 1995. Red tide and toxic marine phytoplankton of the world ocean: an inquiry
into biodiversity. In: P. Lassus, G. Arzul, E. Erard, P. Gentien, C. Marcaillou (eds.),
Harmful marine algal blooms. Paris: Lavoisier, Intercept Ltd, pp. 103-112.
Spatharis, S., Dolapsakis, N.P., Economou-Amilli, A., Tsirtsis, G., Danielidis, D.B., 2009.
Dynamics of potentially harmful microalgae in a confined Mediterranean Gulf-Assessing
the risk of bloom formation. Harmful Algae 8, 736–743.
Staunton, J.. & Weissman, K.J., 2001. Polyketide biosynthesis: a millennium review. Nat.
Prod. Rep. 18, 380–416.

173
Steidinger, K.A., & Haddad, K., 1981. Biologic and hydrographic aspects of red tides.
BioScience 31, 814–819.
Steidinger, K.A., & Baden, D.G., 1984. Toxic marine dinoflagellates. In: D.L. Spector (ed.),
Dinoflagellates. New York: Academic Press, pp. 201–299.
Steidinger, K.A., & Tangen, K., 1997. Dinoflagellates. In: C.R. Tomas (ed.), Identifying
marine phytoplankton. St. Petersburg, FL, USA: Academic, pp.387-584.
Stephenson, N.R., Edwards, H.I., MacDonald, B.F., Pugsley, L.I., 1955. Biological assay of
the toxin from shellfish. Can. J. Biochem. Pharmacol. 33, 849-857.
Stoecker, D.K., 1999. Mixotrophy among dinoflagellates. J. Eukaryot. Microbiol. 46, 397-
401.
Strickland, J.D.H., & Parsons, T.R., 1972. A practical handbook of seawater analysis. Bull.
Fish. Res. Board Can. 167, 311 pp.
Sun, J., & Liu, D., 2003. Geometric models for calculating cell biovolume and surface area
for phytoplankton. J. Plankton Res. 25, 1331-1346.
Takahashi, M., Koike, I., Iseki, K., Bienfang, P.K., Hattori, A., 1982. Phytoplankton species
responses to nutrient changes in experimental enclosures and coastal waters, pp. 333-340.
In: G.D. Grice, & M.R. Reeve (eds.), Marine Mesocosms: Biological and Chemical
Research in Experimental Ecosystems. Springer-Verlag, New York.
Tang, Y., 1995. The allometry of algal growth rates. J. Plankton Res. 17, 1325-1335.
Taniyama, S., Osamu, A., Masamitsu, T., Sachio, N., Tomohiro, T., Yahia, M., Tamao, N.,
2003. Ostreopsis sp., a possible origin of palytoxin (PLTX) in parrotfish Scarus ovifrons.
Toxicon 42, 29–33.
Taylor, F.J.R., 1979. A description of the benthic dinoflagellate associated with maitotoxin
and ciguatoxin, including observations on Hawaiian material. In: D.L. Taylor, H.H.
Seliger (eds.), Toxic Dinoflagellate Blooms. Elsevier/North-Holland, New York, pp. 71–
76.
Tester, P.A., Geesey, M.E., Vukovich, F.M., 1993. Gymnodinium breve and global warming:
what are the possibilities? In: T.J. Smayda, Y. Shimizu (eds.), Phytoplankton blooms in
the sea. Amsterdam: Elsevier, pp. 67-72.
Tester, P.A., Shea, D., Kibler, S.R., Varnam, S.M., Black, M.D., Litaker, R.W., 2008.
Relationships among water column toxins, cell abundance and chlorophyll concentrations
during Karenia brevis blooms. Cont. Shelf Res. 28, 59–72.
Tilman, D., 1977. Resource competition between planktonic algae: An experimental and
theoretical approach. Ecology 58, 338-348.

174
Tillmann, U., Elbrächter, M., Krock, B., John, U., Cembella, A., 2009. Azadinium spinosum
gen. et sp. nov. (Dinophyceae) identified as a primary producer of azaspiracid toxins. Eur.
J. Phycol. 44, 63–79.
Tobe, K., Ferguson, C., Kelly, M., Gallacher, S., Medlin, L.K., 2001. Seasonal occurrence at
a Scottish PSP monitoring site of purportedly toxic bacteria originally isolated from the
toxic dinoflagellate genus Alexandrium. Eur. J. Phycol. 36, 243–256.
Tognetto, L., Bellato, S., Moro, I, Andreoli, C., 1995. Occurrence of Ostreopsis ovata
(Dinophyceae) in the Tyrrhenian Sea during summer 1994. Bot. Mar. 38, 291-295.
Tomas, C.R., & Baden, D.G., 1993. The influence of phosphorus source on the growth and
cellular toxin content of the benthic dinoflagellate Prorocentrum lima. In: T.J. Smayda,
Y. Shimizu (eds.), Toxic Phytoplankton Blooms in the Sea. Elsevier, Amsterdam, pp.
565–570.
Toriumi, S., & Takano, H., 1973. Fibrocapsa, a new genus in Chloromonadophyceae from
Atsumi Bay, Japan. Bull. Tokai Reg. Fish. Res. Lab. 76, 25–35.
Totti, C., Cucchiari, E., Romagnoli, T., Penna, A., 2007. Bloom of Ostreopsis ovata on the
Conero riviera (NW Adriatic Sea). Harmful Algae News 33, 12–13.
Totti, C., Accoroni, S., Cerino, F., Cucchiari, E., Romagnoli, T., 2010. Ostreopsis ovata
bloom along the Conero Riviera (northern Adriatic Sea): Relationships with
environmental conditions and substrata. Harmful Algae 9, 233–239.
Twiner, M.J., Dechraoui, M.Y.B., Wang, Z., Mikulski, C.M., Henry, M.S., Pierce, R.H.,
Doucette, G.J., 2007. Extraction and analysis of lipophilic brevetoxins from the red tide
dinoflagellate Karenia brevis. Anal. Biochem. 369, 128-135.
Turner, J.T., & Tester, P.A., 1997. Toxic marine phytoplankton, zooplankton grazers, and
pelagic food webs. Limn. Ocean. 42, 1203–1214.
Ukena, T., Satake, M., Usami, M., Oshima, Y., Naoki, H., Fujita, T., Kan, Y., Yasumoto, T.,
2001. Structure elucidation of ostreocin D, a palytoxin analog isolated from the
dinoflagellate Ostreopsis siamensis. Biosci. Biotechnol. Biochem. 65, 2585–2588.
Ungaro, N., Marano, G., Pastorelli, A.M., Marzano, M.C., Pompei, M. 2005. Presenza di
Ostreopsidiaceae nel basso Adriatico. In: D. Mattei, S. Melchiorre, V. Messineo, M.
Bruno (eds.), Rapporti ISTISAN 05/29. Istituto Superiore di Sanità, Roma, pp. 112-115.
Uribe, P., & Espejo, R.T., 2003. Effect of associated bacteria on the growth and toxicity of
Alexandrium catenella. Appl. Environ. Microbiol. 69, 659–662.
Usami, M., Satake, M., Ishida, S., Inoue, A., Kan, Y., Yasumoto, T., 1995. Palytoxin analogs
from the dinoflagellate Ostreopsis siamensis. J. Am. Chem. Soc. 117, 5389–5390.

175
Van Dolah, F.M., 2000. Marine algal toxins: origins, health effects and their increased
occurrence. Env. Health Persp. 1081, 133–141.
Van Dolah, F.M., Ramsdell, J.S., 2001. Review and assessment of in vitro detection methods
for algal toxins. J. AOAC Int. 84, 1617-1625.
Van Dolah, F. M., Lidie, K., Morey, J., Brunelle, S., Ryan, J., Monroe, E. & Haynes, B. 2007.
Microarray analysis of diurnal and circadian regulated genes in the Florida red tide
dinoflagellate, Karenia brevis. J. Phycol. 43:741–52.
Van Dolah, F.M., Lidie, K.B., Monroe, E.A., Bhattacharya, D., Campbell, L., Doucette, G.J.,
Kamykowski, D., 2009. The Florida red tide dinoflagellate Karenia brevis: new insights
into cellular and molecular processes underlying bloom dynamics. Harmful Algae 8, 562–
572.
van Rijssel, M., de Boer, M.K., Tyl, M.R., Gieskes W.W.C., 2008. Evidence for inhibition of
bacterial luminescence by allelochemicals from Fibrocapsa japonica (Raphidophyceae),
and the role of light and microalgal growth rate. Hydrobiologia 596, 289–299.
Vanucci, S., Guerrini, F., Milandri, A., Pistocchi, R., 2010. Effects of different levels of N-
and P- deficiency on cell yield, okadaic acid, DTX-1, protein and carbohydrate dynamics
in the benthic dinoflagellate Prorocentrum lima. Harmful Algae 9, 590-599.
Varkitzi, I., Pagou, K., Grane´ li, E., Hatzianestis, I., Pyrgaki, C., Pavlidou, A., Montesanto,
B., Economou-Amilli, A., 2010. Unbalanced N:P ratios and nutrient stress controlling
growth and toxin production of the harmful dinoflagellate Prorocentrum lima. Harmful
Algae 9, 304–311.
Varsamos, S., Wendelaar Bonga, S.E., Charmantier, G., Flik, G., 2004. Drinking and Na+/K+
ATPase activity during early development of European sea bass, Dicentrarchus labrax:
Ontogeny and short-term regulation following acute salinity changes. J. Exp. Mar. Biol.
Ecol. 311, 189–200.
Vaulot, D., LeBot, N., Marie, D., Fukai, E., 1996. Effect of phosphorus on the Synechococcus
cell cycle in surface Mediterranean waters during summer. Appl. Environ. Microbiol. 62,
2527-2533.
Vasquez, M., Gruttner, C., Gallacher, S., Moore, E.R.B., 2001. Detection and characterization
of toxigenic bacteria associated with Alexandrium catenella and Aulacomya after
contaminated with PSP. J. Shellfish Res. 20, 1245–1249.
Vila, M., Garcés, E., Masò, M., 2001. Potentially toxic epiphytic dinoflagellate assemblages
on macroalgae in the NW Mediterranean. Aquat. Microb. Ecol. 26, 51-60.

176
Villarino, M.L., Figueiras, F.G., Jones, K.J., Alvarez-Salgado, X.A., Richard, J., Edwards, A.,
1995. Evidence of in situ diel vertical migration of a red-tide microplankton species in
Ria de Vigo (NW Spain). Marine Biology 123, 607-617.
Vitousek, P.M., Aber, J., Howarth, R.W., Likens, G.E., Matson, P.A., Schindler, D.W.,
Schlesinger, W.H., Tilman, G.D., 1997. Human alteration of the global nitrogen cycle:
Causes and consequences. Ecological Applications 7, 737-750.
Vrieling, E.G., Koeman, R.P.T., Nagasaki, K., Ishida, Y., Peperzak, L., Gieskes, W.W.C.,
Veenhuis, M., 1995. Chattonella and Fibrocapsa (Raphidophyceae): first observation of,
potentially harmful, red tide organisms in Dutch coastal waters. Neth. J. Sea Res. 33,
183–191.
Wang, D.Z., 2008. Neurotoxins from marine dinoflagellates: a brief review. Mar. Drugs 6,
349-371.
Wang, D.Z., & Hsieh, D.P.H., 2002. Effects of nitrate and phosphate on growth and C2 toxin
productivity of Alexandrium tamarense CI01 in culture. Mar. Pollut. Bull. 45, 286–289.
Watkins, S.M., Reich, A., Fleming, L.E., Hammond, R., 2008. Neurotoxic shellfish
poisoning. Marine Drugs 6, 431–455.
Wetzel, R.G., 1983. Limnology. Saunders College Publishing, Philadelphia, Pennsylvania.
Wilhelm, S.W., 1995. Ecology of iron-limited cyanobacteria: A review of physiological
responses and implications for aquatic systems. Aquatic Microbial Ecology 9, 295-303.
Woo, S.P.S., Liu, W., Au, D.W.T., Anderson, D.M., Wu, R.S.S., 2006. Antioxidant responses
and lipid peroxidation in gills and erythrocytes of fish (Rhabdosarga sarba) upon
exposure to Chattonella marina and hydrogen peroxide: Implication on the cause of fish
kills. J. Exp. Mar. Biol. and Ecol. 336, 230-241.
Wright, J.L.C., Boyd, R.K., de Freitas, A.S.W., Falk, M., Foxall, R.A., Jamieson, W.D.,
Laycock, M.V., McCulloch, A.W., McInnes, A.G., Odense, P., Pathak, V., Quilliam,
M.A., Ragan, M.A., Sim, P.G., Thibault, P., Walter, J.A., Gilgan, M., Richard, D.J.A.,
Dewar, D., 1989. Identification of domoic acid, a neuroexcitory amino acid, in toxic
mussels from eastern PEI, Canada. Can. J. Chem. 67, 481–490.
Wright, J.L.C., & Cembella, A.D., 1998. Ecophysiology and biosynthesis of polyether marine
biotoxins. In: D.M. Anderson, A.D. Cembella, G.M. Hallegraeff (eds.), Physiological
ecology of harmful algal blooms. NATO ASI Series 41. Springer, Berlin Heidelberg New
York, pp. 427-451.

177
Wyatt, T., 1995. Global spreading, time series, models and monitoring. In: P. Lassus, G.
Arzul, E. Erard, P. Gentien, C. Marcaillou (eds.), Harmful marine algal blooms, vol. 19.
Paris: Lavoisier, Intercept Ltd, pp. 755-764.
Wyatt, T., & Jenkinson, I.R., 1997. Notes on Alexandrium population dynamics. J. Plankton
Res. 19, 551-575.
Yamashita, M., & Fenn, J.B., 1984. Electrospray ion source. Another variation on the free-jet
theme. J. Phys. Chem. 88, 4451-4459.
Yang, C.Z., & Albright, L.J., 1992. Effects of the harmful diatom Chaetoceros concavicornis
on respiration of rainbow trout. Diseases Aquatic Organisms 14, 105-114.
Yasumoto, T., Nakajima, I., Bagnis, R., Adachi, R., 1977. Finding a dinoflagellate as a likely
culprit of ciguatera. Bull. Jap. Soc. Sci. Fish. 43, 1021-1026.
Yasumoto T, Oshima, Y., Sugawara, W., Fukuyo, Y., Oguri, H., Igarashi, T., Fujita, N., 1980.
Identification of Dinophysis fortii as the causative organism of diarrhetic shellfish
poisoning. Bull. Japan. Soc. Sci. Fish 46, 1405-1411.
Yasumoto, T., Murata, M., Oshima, Y., Sano, M., 1985. Diarrhetic shellfish toxins.
Tetrahedron 41, 1019–1025.
Yasumoto, T., Yasumura, D., Ohizumi, Y., Takahashi, M., Alcala, A.C., Alcala, L.C., 1986.
Palytoxin in two species of xanthid crab from the Philippines. Agric. Biol. Chem. 50,
163-167.
Yasumoto, T., Underdahl, B., Aune, T., Hormazabal, V., Skulberg, O.M., Oshima, Y., 1990.
Screening for haemolytic and ichthyotoxic components of Chrysochromulina polylepis
and Gyrodinium aureolum from Norwegian coastal waters. In: E. Granéli, B. Sundström,
L. Edler, D.M. Anderson (eds), Toxic Marine Phytoplankton. New York, Elsevier
Science Inc., pp. 436-440.
Yin, K., Harrison, P.J., Chen, J., Huang, W., Qian, P.Y., 1999. Red tides during spring 1998
in Hong Kong: is El Niño responsible? Mar. Ecol. Prog. Ser. 187, 289-294.
Yoshimatsu, S., 1987. The cysts of Fibrocapsa japonica (Raphidophyceae) found in bottom
sediment in Harima-Nada, Eastern Inland Sea of Japan. Bull. Plankton Soc. Jpn. 34, 25–
31.
Young, F.M., Thomson, C., Metcalf, J.S., Lucocq, J.M., Codd, G.A., 2005. Immunogold
localisation of microcystins in cryosectioned cells of Microcystis. J. Struct. Biol. 151,
208–214.

178
Zhou, J., & Fritz, L., 1994. Okadaic acid antibody localizes to chloroplasts in the DSP-toxin-
producing dinoflagellates Prorocentrum lima and Prorocentrum maculosum. Phycologia
33, 455–61.
Zhu, G., Marchewka, M.J., Woods, K.M., Upton, S.J., Keithly, J.S., 2000. Molecular analysis
of a type I fatty acid synthase in Cryptosporidium parvum. Mol. Biochem. Parasitol. 105,
253–260.
Zhu, G., LaGier, M.J., Stejskal, F., Millership, J.J., Cai, X., Keithly, J.S., 2002.
Cryptosporidium parvum: the first protist known to encode a putative polyketide
synthase. Gene 298, 79–89.
Zingone, A., & Enevoldsen, H.O., 2000. The diversity of harmful algal blooms: a challenge
for science and management. Ocean and Coastal Management 43, 725–748.

179
Abbreviations
AA 5,8,11,14-eicosatetraenoic acid
ACN Acetonitrile
ACP Acyl carrier protein
ASP Amnesic shellfish poisoning
AT Acyl transferase
AZP Azaspiracid shellfish poisoning
BHT 2,6-Di-tert-butyl-4-methylphenol
BSA Bovine serum albumin
BSTFA-TMCS N,O-Bis(trimethylsilyl)trifluoroacetamide with trimethylchlorosilane
BTXs Brevetoxins
CE Collision energy
CHLP Chloroplast
CIB Chloroplast isolation buffer
DA Domoic acid
DH Dehydratase
DON Dissolved organic nitrogen
DP Declustering potential
DSP Diarrhoetic shellfish poisoning
DTXs Dinophysistoxins
EC50 50% effect concentration
ELA Erythrocyte lysis assay
EPA 5,8,11,14,17-eicosapentaenoic acid
ER Enoyl reductase
ESI Electrospray ionisation
FA Formic acid
FASs Fatty acid synthases
FFA Free fatty acids
GC-MS Gas chromatography-mass spectrometry
HABs Harmful algal blooms
HR High resolution
KR Ketoreductase
KS Ketoacyl synthase

180
LC-MS Liquid chromatography-mass spectrometry
LOD Limit of detection
MBA Mouse bioassay
MDA Malondialdehyde
MeOH Methanol
MRM Multiple reaction monitoring
NMR Nuclear magnetic resonance
NSP Neurotoxic shellfish poisoning
OA Okadaic acid
OTA 6,9,12,15-octadecatetraenoic acid
OUA Ouabain
OVTX Ovatoxin
PBS Phosphate buffered saline
PKSs Polyketide synthases
PP2A Protein phosphatise 2A
pPLTX Putative palytoxin
PSP Paralytic shellfish poisoning
PTXs Pectenotoxins
PUFAs Polyunsaturated fatty acids
PVDF Polyvinyl difluoride
RF Response factors
ROS Reactive oxygen species
SNK Student-Newman-Keuls test
SPE Solid phase extraction
SRM Selected reaction monitoring
STXs Saxitoxins
TBA 2-thiobarbituric acid
TBS Tris-buffered saline
TCA Trichloroacetic acid
TE Thioesterase
TFA Trifluoroacetic acid
THF Tetrahydrofuran
TTEP Tetraethoxypropane
WC Whole cell

181
XIC Extracted ion chromatograms
YTXs Yessotoxins

182

183
Acknowledgements
First, I would like to thank Prof. Rossella Pistocchi and Dr. Franca Guerrini, for their
support and guidance, for scientific discussions and general help. They always supported me
during my PhD and gave me the opportunity to live great experiences for my scientific and
personal life.
I would like to thank Dr. Frances Van Dolah for the opportunity to study at the National
Oceanic and Atmospheric Administration (NOAA) in Charleston (SC, USA) and Dr.
Mackenzie Zippay for the scientific help and her support. Special thanks also go to the Van
Dolah’s research group, in particular to Jill and Steph for the nice talks and laughs in the lab
and their scientific contributions. A special thanks to Guillaume, who help me a lot during my
experience in Charleston: he was a guidance and a special friend.
I would also like to thank Dr. Michael Quilliam and all of the National Research
Council, Institute for Marine Biosciences (NRC-CNRC) in Halifax (Canada), in particular Dr.
Pearce McCarron who helped me learning the LC-MS techniques.
Special thanks also go to Dr. Chiara Samorì, Giulia Samorì, Emanuela Fiori and
Manuela Riccardi. Dr. Silvana Vanucci is acknowledged for the helpful discussions and nice
talks about science and life. I would like to thank the researchers and the groups of CIRSA
(Interdepartmental Research Centre for the Environmental Science, University of Bologna),
who gave me precious scientific advices and guidance throughout this thesis, specifically
Prof. Elena Fabbri, Dr. Andrea Pasteris, Prof. Emilio Tagliavini and Dr. Paola Galletti.
To all my girlfriends, thank you for your understanding and encouragement in many
moments: your friendship lights my heart.
Finally, I would like to acknowledge my parents, who have always taken care of me,
supported my decisions and who have been patient with me. This PhD thesis is dedicated to
them.


