Harishchandra Singh - hbni.ac.in
212
Structural and Spectroscopic studies of transition metal based Multiferroics and Oxides By Harishchandra Singh Enrolment Number: PHYS03201004011 Raja Ramanna Centre for Advanced Technology Indore-452013, India A thesis submitted to the Board of Studies in Physical Sciences In partial fulfillment of requirements for the Degree of DOCTOR OF PHILOSOPHY of HOMI BHABHA NATIONAL INSTITUTE October 2015
Transcript of Harishchandra Singh - hbni.ac.in

Structural and Spectroscopic studies of transition metal
based Multiferroics and Oxides
By
Harishchandra Singh
Enrolment Number: PHYS03201004011
Raja Ramanna Centre for Advanced Technology
Indore-452013, India
A thesis submitted to the
Board of Studies in Physical Sciences
In partial fulfillment of requirements for the Degree of
DOCTOR OF PHILOSOPHY
of
HOMI BHABHA NATIONAL INSTITUTE
October 2015


STATEMENT BY AUTHOR
This dissertation has been submitted in partial fulfillment of requirements for an advanced
degree at Homi Bhabha National Institute (HBNI) and is deposited in the Library to be made
available to borrowers under rules of the HBNI.
Brief quotations from this dissertation are allowable without special permission, provided that
accurate acknowledgement of source is made. Requests for permission for extended quotation
from or reproduction of this manuscript in whole or in part may be granted by the Competent
Authority of HBNI when in his or her judgment the proposed use of the material is in the
interests of scholarship. In all other instances, however, permission must be obtained from the
author.
Harishchandra Singh


DECLARATION
I, hereby declare that the investigation presented in the thesis has been carried out by me. The
work is original and has not been submitted earlier as a whole or in part for a degree/diploma at
this or any other Institution/University.
Harishchandra Singh


DEDICATIONS
I dedicate this thesis to…
My Mother


Abstract
The thesis reports investigation of structural and spectroscopic properties of transition metal
based magneto-electric multiferroic systems and their correlation with the magnetic as well as
ferroelectric properties. Low structural symmetry systems Co3TeO6 (CTO) and Mn doped CTO
(CMTO) have been synthesised using an optimized solid state reaction route and their growth
mechanism has been studied. Further, Cobalt is found to exist in mixed oxidation states of +2
and +3, which gives rise to the possibilities of both ferromagnetic (FM) and antiferromagnetic
(AFM) interactions, in CTO. With the help of low magnetic field magnetization, it is established
that CTO show short range FM interactions in addition to reported AFM interactions, the so
called Griffiths Phase (GP). We have observed five AFM transitions, which are understood to be
due to four Co-O-Co networks corresponding to five crystallographically in-equivalent lattice
sites of Co. Experimental observations of spontaneous polarization as well as spontaneous
magnetization and magneto-dielectric coupling (representing spin lattice coupling in this system)
have been reported in CTO, for the first time.
Further, Mn doping in CTO increases the critical temperature (below which the samples attain
AFM interactions) substantially. In this work, the reason for the increase in AFM transition
temperature is attributed to decreased TM-O bond lengths as well as maximum average TM
charge states for a specific concentration of Mn. The observance of robust FM interactions
(below 185 K) in CMTO systems shows supersession on increasing the magnetic fields. The FM
transitions are limited to short range length scales and are embedded in long range AFM matrix
(GP similar to the case of CTO). GP is found to be much more robust (compared to CTO), in the
sense that it shows up to much higher magnetic fields and higher temperatures. The thesis is
organized in five chapters. The Introduction chapter describes the importance and status (before
this thesis) of the present work. In chapter 2, synthesis method and characterization techniques
have been described. An important contribution of this chapter is establishment of X-ray
absorption near edge structure (XANES) spectroscopy technique for study of phase
concentration of Co3O4 and CoO in a mixed phase samples. Chapter 3 and 4 covers the main
results of the thesis along with discussion on results. In the final chapter, conclusion of this work
and scope for future work has been listed.


Publications:
(i) In refereed journal :
1. Observation of high spin mixed oxidation state of cobalt in ceramic Co3TeO6;
Harishchandra Singh, H. Ghosh, T.V. Chandrasekhar Rao, A. K. Sinha, P. Rajput
Journal of Applied Physics (2014) 116, 214106 (1-7).
2. Structural investigations on Co3-xMnxTeO6 ; (0 < x < 2); High temperature ferromagnetism
and enhanced low temperature anti-ferromagnetism;
Harishchandra Singh, A. K. Sinha, H. Ghosh, M. N. Singh, Parasmani Rajput, C. L.
Prajapat, M. R. Singh, G. Ravikumar
Journal of Applied Physics (2014) 116, 074904 (1-9).
3. Spectroscopic and structural studies of isochronally annealed cobalt oxide nanoparticles;
Harishchandra Singh, A .K. Sinha, M.N. Singh, P. Tiwari, D.M. Phase, S. K. Deb
Journal of Physics and Chemistry of Solids (2014) 75, 397-402.
4. Short range ferromagnetic, magnetoelectric and magneto-dielectric effect in ceramic
multiferroic Co3TeO6;
Harishchandra Singh, H. Ghosh, T. V. Chandrasekhar Rao, G. Sharma, J. Saha, and S.
Patnaik
Journal of Applied Physics (2016) 119, 044104.
5. Griffith like robust ferromagnetism in Co3-xMnxTeO6; (x = 0.5, 1 and 2);
Harishchandra Singh, H. Ghosh, C. L. Prajapat, G. Ravikumar;
Material Research Bulletin, (2016) 80, 273.
6. Insight into the growth reaction mechanism of ceramic Co3TeO6: Synchrotron structural
and thermal analysis;
Harishchandra Singh, A. K. Sinha, S. M. Gupta, M. N. Singh, H. Ghosh;
Journal of the American Ceramic Society: in press
ii) Conferences :
1. Synthesis and structural characterization of Co3-xMnxTeO6; (0.3 ≤ x ≤2) solid solutions using
Synchrotron Source;

Harishchandra Singh, A. K. Sinha, Haranath Ghosh, M. N. Singh, A. Upadhyay
International Conference on Advanced Functional Materials (ICAFM), 19th
- 21th
Feb,
(2014). Thiruvananthapuram, Kerala, India.
2. Investigation of Co-Co networks in ceramic multiferroic Co3TeO6 from structural study;
Harishchandra Singh, A. K. Sinha, Haranath Ghosh, M. N. Singh, A. Upadhyay
AIP Conf. Proc. (2015) 1665, 060021-22.
3. Negative magneto-dielectric coupling in ceramic multiferroic Co3TeO6;
Harishchandra Singh, G. Sharma, Haranath Ghosh, S. Patnaik, A. K. Sinha
International European Meeting on Ferroelectricity-EMF 2015, 28th
June - 3rd
July (2015).
University of Porto, Portugal.
iii) Publications (not included in the thesis):
1. Origin of giant dielectric constant and magnetodielectric study in Ba(Fe 0.5Nb0.5)O3 nano-
ceramics;
P. K. Patel, K. L. Yadav, Harishchandra Singh, and A. K. Yadav
Journal of Alloys and Compounds (2014) 591, 224-229.
2. Effect of Zn doping on the magneto-caloric effect and critical constants of Mott insulator
MnV2O4;
P. Shahi, Harishchandra Singh, A. Kumar, K. K. Shukla, A. K. Ghosh, A. K. Yadav, A. K.
Nigam, and Sandip Chatterjee
AIP Advances 4, (2014) 097137 (1-10).
3. Air annealing effects on lattice structure, charge state distribution, and room temperature
ferrimagnetism in Co2.25 Fe 0.75 O4;
M. R. Panda, R. N. Bhowmik, Harishchandra Singh, M. N. Singh, and A. K. Sinha
Mat. Res. Exp. (2015) 2, 036101 (1-11).

ACKNOWLEDGEMENTS
This thesis work is the part of research that has been done since I came to RRCAT.
When I look back, I realize that I have worked with a great number of people whose
contribution in assorted ways to the research and the making of the thesis deserved special
mention. It is a pleasure to convey my gratitude to all of them.
It is a great honor and privilege to express my deep sense of gratitude to my Ph.D.
guide Dr. Anil K. Sinha, at the successful completion of my thesis work. He infused
enthusiasm at every step of research work. He has a cool temperament that certainly benefits
a person working with him. I feel invigorated at every moment on recalling the words of
inspirations received from him. Discussion with him was always very fruitful. He taught me
to think at basic level for every problem. I thank him for his expertise shown in guiding my
work and the willingness to share his knowledge and experience. His profound practical skills,
immense knowledge and critical but valuable remarks led me to do a good research. I especially
thank him for his prompt reading and careful critique of my thesis.
I sincerely give special gratitude to Dr. Haranath Ghosh for fruitful discussions and
suggestions time to time. He has infused many ideas that helped me a lot in growing up in the
field of science. I am greatly indebted to him for his support, trust, guidance and
encouragement throughout these years. He has greatest professional influence on my
development as a researcher. He pushed me to develop my weaknesses and exploit my
strengths. His courage to tackle new and difficult problems is admirable. Thanks are also due
to Dr. Haranath Ghosh for performing the first principles total energy calculations on one of
the studies samples.

I sincerely thank Dr. S. M. Gupta for his continuous discussion during the thesis
work. I grew up in the field of growth taking help from his ideas. He owns a great quality to
sort out the experimental difficulties with many exciting ideas that eventually helped me in
reaching the targets while this thesis works. He has a great ability to keep the person
motivated. He is keen for a chat about interesting things in physics and is always very
encouraging. He has always helped me as a friend and scientist as well.
I am very grateful to Dr. P. D. Gupta, Director RRCAT for his continual help during
my stay at RRCAT for PhD training. I am extremely thankful to Dr. P. A. Naik, Head ISUD
for his constant encouragement. I also thank him for his full support at every step of my Ph.D
training. I am grateful to Dr. S. M. Oak and Dr. P. A. Naik (Chairman-C3), Dr. N. P. Lalla
(External member), UGC DAE CSR Indore and all members of C3-Doctoral Committee for
their constructive motivation and guidance.
I am thankful to Dr. P. S. Anil Kumar, IISc Bangaluru, India and Dr. Y. Singh, IISER
Mohali for reviewing this thesis work.
I sincerely thank our HBNI Ph.D. coordination committee members specially Dr. G.
S. Lodha, Dr. S. B. Roy, Dr. Arup Banerjee and Dr. S. K. Deb for their continuous care and
help during the Ph. D. course. I also thank our HBNI cell at RRCAT to provide all the
necessary support especially during my Ph. D. course work. I thank HBNI committee for
providing us various sports faculties at guest house. I also thank HBNI committee members,
RRCAT for urging us to celebrating Ph.D. day.
I thank BL-12 group members specially Mr. M. N. Singh for the help in learning the
operation of angle dispersive X-ray diffraction (ADXRD) beamline, at every step. He is very
supportive. I used to call him at both the day and night for the help required during the

measurements. He never said no to me. I have also shared my happiness and sorrow with
him. I also thank Mr. Ashok Kumar for his continuous support since I joined Ph.D. program
in HBNI, RRCAT. I thank Dr. Archna Sagdeo for her useful guidance as a senior group
member and for providing lab source XRD set-up. I also thank Dr. Pooja Gupta and Mr. Anuj
Upadhyay for their constant help during the course.
I am very thankful to Dr. S. N. Jha for providing support during PhD work and
allowing me to use EXAFS beam-line as well as other facilities. I am extremely thankful to
Dr. Tapas Ganguly, Dr. Sanjay Rai for their various help and suggestions during the course
of my Ph.D. training. I thank Dr. Aparna Chakrabarti for inviting us for dinner on several
occasions at her home along with the help that she has provided. I also thank Dr. C. Kamal. I
had fruitful discussion over various topics with him. I cherish my interactions and
discussions with him. Thanks are also due to all members of ISUD.
I thank Dr. Kevin Jorissen (University of Washington) for providing JFEFF software
and fruitful discussion on the XANES analysis using JFEFF.
I thank Dr. T. V. Chandrasekhar Rao for providing magnetic property measurements
data and discussions during the work. I also thank C.L. Prajapat and Dr. G. Ravikumar for
the magnetic measurements. Thanks are due to Mr. Ashok Kumar Yadav, for his help in
EXAFS measurements at Scanning EXAFS beamline. I thank Dr. A. Sundaresan and B.
Rajeswaran for initial magnetic measurements. I am also thankful to Dr. C. Mukherjee for
performing the gold coating on Cobalt oxide nanoparticles samples for SEM measurements. I
thank Mrs. Pragya Tiwari for performing SEM measurements. I would like to thank Dr. S.
Patnaik, JNU New Delhi for help in Dielectric and Polarization measurements. I would also
like to thank RRCAT Glass Blowing Section’s members for their continuous help during my

Ph.D. work. Thanks are due to Dr. D. M. Phase and Mr. A. D. Wadikar, UGC DAE CSR
Indore for help in XPS measurements. I am indebted to members of Indus operation crew
without whom it would have not been possible to do the experiments on Indus-2. I am also
grateful to all the professors/associate professors who have taught us during 1st year course
work.
Above all, it would have not been possible for me to achieve this milestone in my
research career without encouragement and support from my all family members who have
dreamed and prayed for my all around success.
It would be grateful for me to thank my M.Sc. batch mats: Ashok, Samar,
Gyaneshwar, Piyush, Rajiv, Vikas and childhood friends: Anand, Divakar.
My time at RRCAT was made enjoyable in large part due to my PhD friends, MTech
students who have become a part of my life. We had valuable research discussions. We together
had enjoyed small trips and parties. Playing volleyball with them was quite refreshing after
spending whole day in the lab.
I sincerely thank all the persons who have helped and supported me directly or
indirectly in the course of this research work.

i
Contents
Contents ...................................................................................................................................... i
Synopsis .................................................................................................................................... iii
List of Figures ........................................................................................................................... xi
List of Tables .......................................................................................................................... xix
Chapter 1: Introduction 1.1. Multiferroics 5
1.2. Combining magnetism and ferroelectricity 6
1.2.1. Type I Multiferroics 7
1.2.2. Type II (Magnetic) Multiferroics 9
1.3. Applications and recent trends in Multiferroics 12
1.4. Issues and Motivation of the present work 14
1.5. Organization of the Thesis 16
Chapter 2: Experimental Details 2.1. Introduction 17
2.2. Synthesis 17
2.2.1. Solid State Reaction Route 17
2.2.2. Wet Chemical Route 19
2.3. Thermal Analysis 20
2.4. An overview of Indus-2 and the Beamline used for the present work 20
2.5. X-Ray Diffraction 22
2.6. X-Ray Absorption Near Edge Structure Spectroscopy 29
2.7. X-ray Photoelectron Spectroscopy 34
2.8. Scanning Electron Microscopy 36
2.9. Dielectric Constant and pyroelectric current (Polarization) Measurements 37
2.10. Magnetization Measurements 39
2.11. Demonstration of structural and spectroscopic techniques to study oxides 41
2.11.1. X-ray Absorption Near Edge Structure Spectroscopy analysis 42
2.11.2. X-ray Photoelectron Spectroscopy analysis 47
2.11.3. Synchrotron X-ray diffraction analysis 50
Chapter 3: Cobalt Tellurate (Co3TeO6; CTO) 3.1. Two step solid state synthesis of CTO 58
3.1.1. Introduction 58
3.1.2. Results and Discussion 59
3.1.2.1. Growth and its structural correlation 59
3.1.2.2. X-ray Photoelectron spectroscopic analysis 71
3.1.3. Conclusions 73
3.2. Observation of high-spin mixed oxidation state of cobalt in CTO 75
3.2.1. Introduction 75
3.2.2. Results and Discussion 78
3.2.2.1. X-ray Absorption Near Edge Structure Spectroscopy 78
3.2.2.2. High field DC Magnetization study 83
3.2.2.3. First principles study 86
3.2.2.4. In the search for the origin of Co3+
89

ii
3.2.3. Conclusions 91
3.3. Magneto-electric and Magneto-dielectric properties of CTO 93
3.3.1. Introduction 93
3.3.2. Results and Discussion 94
3.3.2.1. Low field DC Magnetization Study 94
3.3.2.2. Structural investigation for the insight into the magnetism 96
3.3.2.3. Bifurcation between FC and ZFC magnetization curves 100
3.3.2.4. Investigation of Magneto-Electric and Magneto-Dielectric effect 105
3.3.3. Conclusions 110
Chapter 4: Mn doped Co3TeO6 4.1. Structural and Spectroscopic Characterizations on Co3-xMnxTeO6 115
4.1.1. Introduction 115
4.1.2. Results and Discussion 116
4.1.2.1. Synchrotron X-ray diffraction study 116
4.1.2.2. X-ray Absorption Near Edge Structure study 126
4.1.4. Conclusions 130
4.2. Magnetic Properties of Co3-xMnxTeO6; (x = 0.5, 1 & 2) 132
4.2.1. Introduction 132
4.2.2. Results and Discussion 133
4.2.2.1. Magnetic behavior of Co3-xMnxTeO6 (x = 0.5, 1 and 2) 133
4.2.2.2. Structural insight for the observed magnetic behavior 141
4.2.3. Conclusions 144
Chapter 5: Conclusions and Future work 147
References 153

iii
SYNOPSIS
Structural and spectroscopic studies play vital role in transition metals (TMs) based Multiferroics
(MFs) and Oxides. This is because TM and their complexes (TM surrounded by oxygen) exhibit
variety of structures and properties due to the unique nature of outer shell d-electrons of TM.
These (partially filled 3d1 to 3d
9 orbitals of first row TM atoms) electrons not only influence
structural and spectroscopic (electronic) properties, but also the magnetic properties of TM based
compounds. Key features behind the variations in the aforementioned properties of TM based
compounds are the crystal field splitting (Δcf: of the degenerate 3d orbitals) and coulomb
correlation (U: between two electrons in the same orbital). In addition to these, charge state of
the TM and type of interactions between the TM ions also lead to variation in the properties.
Electrons in transition metal oxides (TMOs) manifest themselves in many different ways leading
to interactions among charge, spin, lattice and orbital degrees of freedom. One of the current
interesting implications of such interactions among these degrees of freedom is magneto-electric
(ME) MFs,1 which exhibits two fundamental ferroic (magnetic and ferroelectric (FE)) orders
coupled in the same phase. ME-MF materials show enormous applicability in spintronics, next
generation low power- non-volatile memory storage devices and in solar cells etc.2-5
Stabilization
of ferroelectricity and magnetism in a single phase material is quite difficult due to the demand
of two mutually exclusive requirements. Magnetic ordering requires localization of electrons in
partially filled d shells and is usually seen in TM showing metallic behavior. Conversely,
electrical polarization requires a structural distortion of the lattice, which occurs from empty d
shells, and thus FE materials tend to be insulators. This is not the only constraint; the
simultaneous occurrence of both the orders is also prohibited from symmetry considerations. The
electrical polarization needs the lack of inversion centre, whereas, the magnetic order requires

iv
lack of time reversal. Although, the coexistence of ferroelectricity with magnetism was initially
considered to be one of the rarest of rare phenomena, the evolution of strongly cross-coupled
response in various materials with spontaneous polarization and magnetization has changed the
existing scenario drastically. The path that MF community adopts is to induce ferroelectricity in
a compound, either by breaking the inversion symmetry (BIS) or by using some other
mechanisms.1
Depending on the mechanism, responsible for the origin of ferroelectricity, MF
materials can be classified into two types, type I (proper) and type II (improper). In type I MFs,
ferroelectricity and magnetism have separate mechanisms and the coupling strength between the
two is weak, although the individual strengths are significant. On the other hand, in type II MFs,
both the magnetic and ferroelectric orders have a common mechanism i.e. one can induce the
other. Such materials exhibit intrinsic magnetic structures, which are responsible for BIS and
hence for electrical polarization. Due to the large coupling between the electric and magnetic
orders, these materials are extremely important from technological point of view. In order to
utilize ME-MF materials with full potential, there remain a number of issues, which need to be
addressed. Besides, understanding the mechanism of coupling of these ferroic orders, enhancing
the coupling strength, designing and finding new MFs are some of the frontline research
activities.
In the quest of finding new and better performing materials, Cobalt Tellurate (Co3TeO6;
CTO) has been found to have favourable characteristics.6 CTO (belonging to A3TeO6 family; A
= Mn, Ni, Cu, Co) shows very interesting structural as well as low temperature magnetic
properties.6-11
Single crystal CTO crystallizes in monoclinic (C2/c) crystal symmetry. The
interest in CTO is due to its low temperature type II MF properties. In addition, the monoclinic
crystal structure with multiple magnetic transitions at low temperatures makes CTO very
v
interesting. Origin and understanding of each transition have its own challenge due to the
complex crystal as well as magnetic structure of CTO.6-11
There exists substantial amount of
work on CTO, however, there are some issues, which are still under debate. Issues discussed
below form the basis for the work, presented in this thesis.
Single phase synthesis and understanding its zero magnetic field behaviour remains a
challenging issue in ceramic as well as single crystal CTO.12-13
In addition, there are no reports
showing all the five (~ 34 K, 26 K, 21 K, 17.4 / 18 K and 16 K) magnetic transitions in one
ceramic or single crystal CTO sample. Different groups have reported mainly two transitions
(TN1 ~ 26 K and TN2 ~ 18 K) along with few other transitions noted above.6-10
This may be
attributed to the difference in the method of sample preparation adopted by different groups.
Further, no report discusses growth mechanism of CTO, in details. We provide, for the first time,
a two step solid state reaction growth mechanism for the preparation of ceramic CTO, which
shows all the five transitions, in a single phased material.
As per earlier reports on single crystal / ceramic CTO, only Co2+
ions occupy five
different crystallographic positions as tetra, square-pyramidal and three inequivalent octahedral
sites.11
Further, very large variations are observed in Co-O bond distances. It has been reported
that largest bond distance is almost double to that of the smallest one. In this scenario,
observance of only Co2+
ions in these varying coordinations is difficult to appreciate. One
possibility to arrange such a polyhedral mixing with a range of bond lengths can be through
mixed valence ions. However, to the best of our knowledge, there is no report on the presence of
Co3+
in (either single crystal or ceramic) CTO. In our work, we have used Synchrotron X-ray
Diffraction (SXRD), X-ray Absorption Near Edge Spectroscopy (XANES) and high field DC
vi
magnetization in corroboration with first principle calculations to show the presence of high spin
mixed oxidation state of Co in ceramic CTO, for the first time.
In literature, there have been theoretical predictions14
about the spontaneous weak
magnetization as well as the spontaneous polarization. The experimental proof for the weak
magnetization has been put forward with domain structure observed in Second Harmonic
Generation measurements.14
The experimental observation of the spontaneous zero field
polarization remains yet to be confirmed. We measure temperature and magnetic field dependent
magnetization, dielectric constant and polarization to show the possibility of the spontaneous
polarization and magnetization below 18 K in ceramic CTO. Measurements show the above two
effects in our sample (at zero magnetic field). Temperature dependent DC magnetization reveals
complicated magnetic structures and signature of all the magnetic phases observed earlier in
neutron diffraction studies are retained in present ceramic CTO.
Wang et al.,9 have observed four magnetic transitions and ascribed two of them to two
magnetic networks Co1-Co4 and Co2-Co3-Co5 using neutron diffraction studies. To explain all
the magnetic transitions, there might be a possibility of other magnetic networks, which the
authors have not mentioned. We have analyzed the room temperature SXRD data using Rietveld
refinement and VESTA (a 3D visualization software) for our ceramic as well as reported data of
single crystal CTO. It is important to note that we have observed two additional structural
networks Co1-Co5 and Co2-Co3-Co4, which we attribute to the observed magnetic transitions.
Through this, we propose four structural networks, which may be related to the observed
multiple magnetic transitions.
Furthermore, to enhance the coupling strength and the transition temperature (at which
the MF transitions take place) in CTO, researchers have tried doping Co site with several

vii
transition metals such as Cd, Fe and Mn etc. Out of these, only Mn doped CTO (CMTO) results
in the enhancement of transition temperature, below which MF properties are observed. On the
other hand, other dopants lead to lower transition temperatures. As mentioned earlier, CTO is a
low symmetry (C2/c) type II multiferroic at low temperatures, which shows complex magnetic
structure with a sequence of antiferromagnetic (AFM) transitions. Mn3TeO6 (MTO), on the other
hand, crystallizes in higher symmetry (R ) and is a type I multiferroic. Surprisingly, MTO also
shows similar AFM transition temperatures, as is observed in the case of CTO. MTO and CTO
show main AFM transitions at around 23 K and 26 K, respectively. In contrast, Mn doping in
CTO enhances the AFM transition temperature to ~ 40 K; even when the AFM transition
temperatures of the end members are much lower.15-16
Not only the reason behind the
enhancement in the transition temperature is not discussed in literature, but also no evidence of
FM interaction has been reported. To address these issues, we have carried out room temperature
SXRD and Mn as well as Co K- edge XANES studies on Mn doped CTO samples. These results
have been used to explain magnetic properties of the samples.
Thesis Outline
This thesis comprises of five chapters and contents of each chapter are discussed briefly in the
following:
1. Introduction
This chapter describes fundamentals of MF, their importance and proposed application in various
fields. From application point of view, merits / demerits of type I and type II MFs are discussed.
Current status of knowledge and issues pertaining to CTO and Mn doped CTO are pointed out.
2. Experimental techniques
This chapter describes the details of characterization techniques used in the present thesis.

viii
Experimental aspects of X-ray diffraction and X-ray absorption measurements and their data
interpretation procedures are elaborated. Details of diffraction and absorption beamlines used in
this work have been given. In addition, X-ray photoelectron spectroscopy (XPS) and XANES
spectroscopy have been discussed in detail. Other experimental techniques used for magnetic,
dielectric and polarization measurements have also been described, in brief. Further, utilization
of structural and spectroscopic tools to study oxides is described, wherein XANES, XPS and
SXRD measurements have been carried out on Cobalt oxide nanoparticles to determine the phase
composition.
3. Cobalt Tellurate (Co3TeO6: CTO)
This chapter is divided into three sections. Section 3.1 describes a two steps solid state reaction
route for the synthesis of monophasic CTO. Thermo-gravimetric data along with SXRD
measurements have been used to optimize synthesis parameters like concentration of reactants,
single/double step calcination times and temperatures to get single phase CTO. Co and Te core
level XPS spectra on the single phasic CTO indicate possible mixed oxidation states of Co (i.e.
Co2+
and Co3+
) and +6 oxidation state of Te, respectively. Section 3.2, therefore, is focused on
the determination of charge and spin states of Co in CTO. We find coexistence of high spin Co3+
and Co2+
in ceramic CTO. These conclusions are established using XANES, high field DC
magnetization and first principle calculations. Relative concentrations of Co3+
and Co2+
in CTO
have been estimated by Co K edge XANES measurements using interpolation of absorption edge
energies of CoO, CoF3 and Co metal foil standards, whereas the spin state of these ions have
been obtained by the analysis of pre-edge part of XANES spectrum. First principle calculations
also show the most favourable total energy for the above mentioned configuration of Co ions in
CTO. Observed magnetic moment could be explained using high spin states of Co3+
and Co2+
.
ix
Section 3.3 presents the observation of magneto-electric and magneto-dielectric couplings in
ceramic CTO using temperature and magnetic field dependent DC magnetization, dielectric,
pyroelectric and polarization measurements. Observation of all the five magnetic transitions and
their possible correlations with room temperature structural analysis are discussed. Observance
of short range ferromagnetic interactions has been attributed to Co3+
-O- Co2+
networks. Further,
following various reports,17-19
we present several interesting observations from magnetic field
dependent dielectric constant data such as spontaneous polarization, presence of ferromagnetic
correlation below TN2, possible spin-phonon coupling and magneto-dielectric effect in this
system for the first time. These observations also lead to believe that CTO contains weak
ferromagnetic nano regions embedded in AFM matrix, the so called Griffiths phase. Finally,
combined dielectric and pyroelectric current (polarization) measurements are utilized to
comment on the spontaneous symmetry breaking even in the absence of magnetic field.
4. Mn doped Co3TeO6 (CMTO)
This chapter is divided into two sections. Preparation, structural as well as spectroscopic
characterizations of Co3-xMnxTeO6; (0 < x ≤ 2) solid solutions have been discussed in Section 4.1.
Phase diagram obtained from the two phase Rietveld refinement of SXRD data indicate mixed
symmetries i.e. monoclinic (C2/c) and rhombohedral (R ) for x < 0.5, and only R symmetry for
x ≥ 0.5. Further, it shows increase in lattice parameters as well as average transition metal -
oxygen (Co/Mn-O) bond lengths for x ≥ 0.5, attaining a minimum value at x = 0.5. Co and Mn
K-edge XANES spectra reveal that both Co and Mn are in mixed oxidation states of +2 and +3.
Relative ratios of Co3+
/Co2+
and Mn3+
/Mn2+
(obtained from XANES data) decrease with
increasing x (for x ≥ 0.5) with a maximum value at x = 0.5. These structural and spectroscopic
evidences have been used to propose possible interpretation of observed as well as reported

x
magnetic behaviour of CMTO. Section 4.2 not only supports the above interpretation but also
presents CMTO as the potential magnetic materials having very high temperature ferromagnetic
correlations, low temperature enhanced AFM interactions and their coexistence. This is
demonstrated through detailed magnetization studies.
5. Summary and Future Scope
In this chapter, summary and major conclusions of the thesis are described. We show that the
existence of Co3+
and Co2+
in ceramic CTO does not diminish multiferroic properties observed
earlier in single crystal, but actually enhances some of the observables like ME-MF behaviour,
magneto-dielectric effect and Griffiths phase. Mn Doped CTO results in near room temperature
short-range robust ferromagnetic as well as long range low temperature enhanced
antiferromagnetic correlations. Issues which could not be attempted or concluded are described,
in brief. Possible ways to resolve these issues have also been discussed, as future work.
References:
1H. Schmid, Ferroelectrics 162, 317 (1994); D. Khomskii, Physics 2, 20 (2009).
2R. Nechache, et al., Nature Photonics 9, 61 (2015).
3W. Wang, J. Zhao, W. Wang et al., Phys. Rev. Letts. 110, 237601 (2013).
4I. N. Apostolova, A. T. Apostolov, et al., J. Appl. Phys. 113, 203904 (2013).
5W. Kleemann, Physics 2, 105 (2009); J. F. Scott, NPG Asia Materials 5, e72 (2013).
6M. Hudl, R. Mathieu, S. A. Ivanov, M. Weil, et al., Phys. Rev. B 84, 180404(R) (2011).
7W. H. Li, C. W. Wang, D. Hsu, C. H. Lee et al., Phys. Rev. B 85, 094431(2012).
8S. A. Ivanov, R. Tellgren, C. Ritter, et al., Mater. Res. Bull. 47, 63 (2012).
9C. W. Wang, C. H. Lee, C. Y. Li, et al., Phys. Rev. B 88, 184427 (2013).
10J. L. Her, C. C. Chou, Y. H. Matsuda, et al., Phys. Rev. B 84, 235123 (2011).
11R. Becker, M .Johnsson, H. Berger, Acta Crystallogr. C 62, i67 (2006).
12N. V. Golubko, V. Yu.Proidakova, et al., Bull. Russ. Acad. Sci.: Phys. 74, 724 (2010).
13J. Sikac and L. Jensqvsky, Collection Czechoslov. Chern .Comrnun. 45, 2489 (1980).
14P. Toledano, V. Carolus, M. Hudl, et al., Phys. Rev. B 85, 214439 (2012).
15R. Mathieu, S. A. Ivanov, P. Nordblad and M. Weil, Eur. Phys. J. B 86, 361 (2013).
16S. A. Ivanov, R. Mathieu, P. Nordblad, et al., Mater. Res. Bull. 50, 42 (2014).
17G. Lawes, T. Kimura, C.M. Varma, et al., Progress in Solid State Chemistry 37, 40 (2009).
18A. K. Singh, D. Jain, V. Ganesan, A. K. Nigam, S. Patnaik, Europhysics Lett. 86, 57001 (2009).
19Q. Zhang, K. Singh, F. Guillou, C. Simon, Y. Breard, et al., Phys. Rev. B 85, 054405 (2012).

xi
List of Figures:
Chapter 1
Fig. 1.1. Pictorial illustration of TM’s d level splitting in (a) octahedral and b) tetrahedral
crystal fields. Representation of corresponding coordination geometries is also shown.
Crystal field stabilization energy (CSFE), for both the cases, where n (t2g) and n (eg) – are
the number of electrons occupying the respective energy levels, is mentioned.
Fig. 1.2. Distortion from the regular octahedra (b) due to strong electric field of
octahedral anions generally changes its structure via higher symmetry to lower symmetry
through elongation in any of the three crystallographic directions. Representative
elongations along z direction (a) and y directions (c) have been shown. Crystal field
parameters would be different for each case, where ΔD and ΔR for distorted and regular
octahedra, respectively.
Fig. 1.3. Interaction among three degrees of freedom of an electron in a lattice i.e. charge,
spin and orbital, results in ME MF that combines properties of ferroelectrics (due to
charge) and magnets (due to spin). Hysteresis along with switching behaviour, displayed
by ferromagnets and ferroelectrics mutually control magnetic response with an electric
field and modification of polarization by magnetic field leading to the basis for making 4-
state logic devices.
Fig. 1.4. Modulated spin structures, (a) sinusoidal, where magnitude of the magnetic
moment changes along the propagation axis (arrow). (b), (c) The same remains constant
in helicoidal and cycloidal spin configuration cases, only rotation axis changes. In (b), the
rotation axis coincides with the propagation axis, while they are perpendicular in (c). In
(d) and (e), which are longitudinal and transverse conical spin spirals, the spins rotate on a
cone (not in a plane but), leading to a macroscopic magnetization.
Fig. 1.5. The Dzyaloshinskii-Moriya (DM) interaction’s mechanism (a) Dependence of
superexchange interaction between neighboring spins on their bond angle and hence on
the displacement x of oxygen ions, which results in the minimization of DM interaction
energy for fixed bond angles adjusted by oxygen displacement. (b) In zig-zag chains,
vector Dij = x × rij alternates in sign leading to a homogeneous shift of the negative ions
with respect to the positive ions, which results in macroscopic polarization. (c) Collinear
2
3
5
9
11

xii
spin structure with ↑ – ↑ – ↓ – ↓ spin configuration breaks inversion symmetry and hence
induces the electrical polarization.
Chapter 2
Fig. 2.1. Schematic to understand XRD mechanism through Bragg reflection by lattice
planes of a crystalline sample. For XRD pattern, path difference between reflected rays by
adjacent lattice planes must be integral multiple of wavelength.
Fig. 2.2. Optical layout of BL-12.
Fig. 2.3. Photograph of 1st experimental station consisting of several components.
Fig. 2.4. Photograph of the 2nd
experimental station with its various components.
Fig. 2.5. (a) Shows 2D intensity data as found at Image Plate for LaB6 NIST standard, (b)
shows Rietveld refinement of the same LaB6 1D pattern and (c) shows a typical view of
the refined structure form Rietveld refinement.
Fig. 2.6. Schematic illustration of X-ray absorption spectrum.
Fig. 2.7. Various modes of XANES measurements depending on the sample’s conditions
and requirements. I and IC in different subscript represent photon beam intensity and
ionization chambers, respectively.
Fig. 2.8. (a) Instrumental setup of X-ray photoelectron spectroscopy (XPS) and (b) A
typical XPS spectrum: survey scan of Co3O4 nanoparticles. Inset shows enlarge part of the
same.
Fig. 2.9. Schematic layout of pyroelectric current measurements setup. Switches labeling
represent electrical connection to be made for measurements. Switch 1 for poling process,
2 for electrical shortening and switch 3 for final step of measurements.
Fig. 2.10. Schematic of vibrating sample magnetometer (VSM). The detection coil
assembly is wound in a second-order gradiometer configuration with oppositely wound
detection coils.
Fig. 2.11. Schematic of typical SQUID magnetometer used for magnetization
measurements. Detection coils, SQUID-input coils and the connecting wires are the parts
of a closed superconducting loop acting as a flux transformer, where the detection coils
are connected to the SQUID-input coil, which is inductively coupled to the SQUID
sensor.
Fig. 2.12. SEM images of three samples, (a) H1, (b) H2 and (c) H4.
23
24
25
25
26
29
32
34
38
39
40
41

xiii
Fig. 2.13. Normalized Co K-edge XANES spectra for all the samples H1 to H4, along
with CoO (H0) and Co3O4 (H5) standards. Vertical shifting has been done for the sake of
clarity. Features in the XANES spectra are marked with P (Pre-edge), A (Main edge), W
(White line) and B. Energy calibration has been done using Co metal foil XANES spectra.
Fig. 2.14. Demonstration that the identification of features in XANES spectra does not
alter the conclusion of the analysis, wherein variations of transition energies as a function
of cobalt oxides NP samples have been shown. Numbers in the X axis represent H0 to H5.
Fig. 2.15. Linear Combination Fitting (LCF) for all the samples H1 to H4 using cobalt K-
edge XANES spectra. Raw data points are shown by black (+) and solid lines (red) denote
LCF fit to the data. Fractions of standards CoO (shown by blue dash dot) and Co3O4
(shown by magenta dash) are used for LCF.
Fig. 2.16. Normalized core level XPS spectra of Co 2p and O 1s (right inset) for all the
samples (H1 to H4).
Fig. 2.17. Oxygen 1s XPS spectra of cobalt oxide nanoparticle samples H1 to H4 fitted
with Shirley background and two Lorentzian-Gaussian peaks (I, II).
Fig. 2.18. Synchrotron X-Ray diffraction patterns recorded at room temperature from
cobalt oxide nanoparticle samples (H1 to H4).
Fig. 2.19. Reitveld refined Synchrotron X-Ray diffraction patterns for all the samples.
Red dots represent the raw data, and solid black lines are the fit obtained by the Rietveld
refinement. The blue and magenta line beneath the pattern records the Bragg positions
and difference between the observed and calculated patterns, respectively.
Chapter 3
Fig. 3.1. SXRD patterns of TeO2, Co3O4 and their mixture at room temperature.
Fig. 3.2. DTA/TGA curves for Co3O4 + TeO2 mixture. Thermal analysis indicates four
step reaction assigned as I, II, III and IV. Inset shows 1st derivative of TGA curve
showing anomaly at ~500 oC (region I).
Fig. 3.3. The stoichiometric ground mixture at 500 oC indicates initialization of a new
phase (CoTeO4) along with unreacted initial reactants. Calcination at 600 oC, on the other
hand, corresponds to CoTeO4 as major phase.
Fig. 3.4. Stabilization of CoTeO4 along with various other phases, as we increase the
calcinations temperature from 600 oC to 800
oC, all these phases are get converted to the
42
44
45
47
49
50
51
59
60
61
62

xiv
final compound Co3TeO6.
Fig. 3.5. No change in TeO2 phase at 700 oC for 2 hrs calcinations, which excludes the
possibilities of TeO3, Te2O5 or Te4O9 leading to the stability against it’s oxidation or
reduction.
Fig. 3.6. SXRD data showing no change in Co3O4 phase at 700 oC for 2 hrs calcinations.
This excludes the possibilities of their oxidizing agents like CoO and Co2O3 during
calcinations process.
Fig. 3.7. Shows comparisons of single step and double step calcinations (see text for
details).
Fig. 3.8. (a) A high resolution Synchrotron X-ray Diffraction measurement is used to
probe monophasic CTO, (b) shows the corresponding impurity, which is Co3O4, (c)
Rietveld refinement is used to estimate concentration of impure Co3O4 phase.
Fig. 3.9. Simulated and observed Synchrotron X-Ray Diffraction patterns recorded at
room temperature (λ = 0.9480 Ǻ) for ceramic CTO sample.
Fig. 3.10. Polyhedral view (a-b plane) of the ceramic CTO clearly signifies the
octahedral, pentahedral and tetrahedral sites of Co, and octahedral sites of Te.
Fig. 3.11. (a) Normalized core level XPS spectra of Co 2p, satellite (ss) peaks nearby
main peaks confirms the mixed oxidation state of Co in CTO, (b) normalized core level
XPS spectra of Te 3d, binding energy 587.3 eV and 576.8 eV positions of the main peaks
confirm the +6 oxidation state of Te and (c) Oxygen 1s XPS spectra CTO sample fitted
with Shirley background and two Lorentzian- Gaussian peaks acquired with Al Kα
source.
Fig. 3.12. Polyhedra of our ceramic CTO as compared to single crystal CTO show
marginal distortion in the corresponding CoO6/CoO5/CoO4 and TeO6 polyhedra leading to
shorter typical bond distances of Co/Te-O.
Fig. 3.13. Edge step normalized Co K-edge XANES spectra of CTO, Cobalt oxide
standards (CoO and CoF3) and Co metal foil. Co foil is used for photon energy
calibration.
Fig. 3.14. LCF fit of ceramic CTO using CoO and CoF3 standard samples (main panel)
and inset shows linear dependence of oxidation states as a function of energy obtained
from derived formula.
63
63
65
67
68
68
71
77
78
80

xv
Fig. 3.15. Te L3 edge XANES spectra of CTO along with Te standards.
Fig. 3.16. Edge step normalized Co-K edge XANES spectra of ceramic CTO sample
showing pre edge structure at around 7709 eV (main panel). CoF3 and CoO are used as
the source for high spin Co3+
and Co2+
, respectively (left inset). Various pre edge features
namely A1, A2 and A3 has been shown for the sake of clarify (left inset). Gaussian peak
fitting has been used to analyze the crystal field splitting between the eg and t2g states of
Co cations after careful background subtraction (see right inset).
Fig. 3.17. High field DC magnetization under ZFC/FC protocol indicates
antiferromagnetic behavior akin to that of single crystal CTO. Curie-Weiss fit to FC data
is shown in right inset. Left inset shows the corresponding Neel temperatures (TN1 and
TN2) through the second derivative of MFC. Effective magnetic moment (μeff) has been
calculated through the relation: μeff = √(8C) μB per.
Fig. 3.18. (A) Graphical representation of Co3TeO6 crystal structure where only Co - O
bonding is shown (red solid ball is the oxygen) and (B) Representative angles (in degree)
between Co-O-Co are shown, which can modify the nature of super-exchange interaction
(e. g., < Co – O – Co ≥ 120o AFM type and weak FM type otherwise). These are
employed in first principles calculations. Various orientations are used for clear visual
presentation.
Fig. 3.19. SXRD patterns of CTO synthesized in air, argon and vacuum atmosphere,
indicating the only novel route for CTO synthesis. Dash represents multiphase CTO for
vacuum ad argon case.
Fig. 3.20. Co K edge XANES spectra of CTO synthesized in air, argon and vacuum
atmosphere, indicates same Co valency.
Fig. 3.21. ZFC and FC Magnetization vs temperature curves taken under 100 Oe. Inset
shows the 1st derivative of FC curve.
Fig. 3.22. 1st derivative of DC magnetization data at 5 Oe (shown in the inset), which
shows clear signature of all magnetic transitions, especially at 16 K.
Fig. 3.23. Schematic drawing of the proposed Co-Co spins arrangements, for our ceramic
CTO, through layer A, B, C and D, respectively. These layers are Co2-Co3-Co5 (a), Co1-
Co4 (b), Co2-Co3-Co4 (c) and Co1-Co5 (d), respectively. The Co ions lie in the ac plane,
as in the earlier case of Wang et al.,.
80
81
83
87
90
91
95
95
98

xvi
Fig. 3.24. Similar schematic drawing of the proposed Co-Co spins arrangements, for
single crystal CTO through layer A, B, C and D, respectively. These layers are Co2-Co3-
Co5 (a), Co1-Co4 (b), Co2-Co3-Co4 (c) and Co1-Co5 (d), respectively.
Fig. 3.25. It shows the magnetization difference of the corresponding FC and ZFC mode.
Fig. 3.26. Thermal dependence of inverse susceptibility (H/M) data of ceramic CTO
taken at magnetic field of 100 Oe.
Fig. 3.27. Magnetic hysteresis loop measurement at 5 K and 300 K.
Fig. 3.28. This shows power law behavior of inverse susceptibility (H/M) data.
Fig. 3.29. Low field Magnetization data, both in ZFC and FC mode, taken subsequently at
100 Oe, 500 Oe and 1000 Oe. It clearly shows the suppression of deviation, as indicated
by vertical arrows and insets.
Fig. 3.30. Dielectric constant vs temperature profile at different magnetic fields. Inset
shows the error bar of one of the representative dielectric data taken at 5 T.
Fig. 3.31. Dielectric constant showing change in peak position towards lower temperature
with the increase in magnetic field.
Fig. 3.32. Measured pyroelectric current as a function of temperature in the presence of 0,
3 and 5 T external field (poling field = 6.6 kV/cm).
Fig. 3.33. Electrical polarization derived from pyroelectric current is plotted as a function
of temperature in the presence of 0, 3 and 5 T external field.
Chapter 4
Fig. 4.1. Synchrotron X-ray diffraction patterns of x = 0.0, 0.1, 0.2, 0.3, 0.5, 1 and 2
compositions possessed either mixed (C2/c and R ) symmetry (0.1, 0.2, 0.3) or pure R
symmetry (0.5, 1.0, 2.0). Here x = 0 corresponds to pure CTO (C2/c) phase.
Fig. 4.2. Synchrotron XRD patterns of Co3-xMnxTeO6 with only x = 0.0, 0.05, 0.25 and
0.5. Inset shows SXRD patterns for x = 0.3, 0.4 and 0.5 for q around ~ 4.8, indicating mix
phase behavior below 0.5.
Fig. 4.3. (a) CTO, (b) MTO crystal structures with C2/c and R symmetries, respectively.
Red smaller circles represent oxygen atoms, blue and magenta circles represent Co and
Mn atoms, respectively, while the large dark yellow circles show Te atomic positions (a,
b, c axes are as indicated) . Arrow in (b) shows a particular transition metal in oxygen
environment.
99
101
102
103
103
104
105
107
108
108
116
117
118

xvii
Fig. 4.4. Two phase Rietveld refinement for the composition x = (a) 0.1, (b) 0.2, (c) 0.25
and (d) 0.3, wherein C2/c and R with their corresponding structural parameters have
been taken as inputs. Red circle represent raw data, black solid line the Rietveld fit, blue
vertical bar the Bragg reflections and zigzag magenta line the difference between
observed and calculated intensities.
Fig. 4.5. Phase diagram obtained from Rietveld Refinement on the SXRD data as a
function of Mn concentration indicates mixed phases of C2/c and R for x < 0.5, while
pure R phase for x ≥ 0.5. Enlarge data shows the representative error bar.
Fig. 4.6. (a) Variations of lattice parameters through volume per formula unit of C2/c
phase and (b) R phase as a function of Mn concentrations for x < 0.5, error bars are
within the symbols. Connecting solid lines are shown just to guide the eye.
Fig. 4.7. Rietveld refinement of SXRD patterns for x = 0.5, 1 and 2 indicates the pure R
phase.
Fig. 4.8. (a) Variations of R phase lattice parameters and (b) average transition metal-
oxygen bond distances as a function of Mn concentration for x ≥ 0.5 along with x = 0.3
within the error bars.
Fig. 4.9. Octahedral distortions for x = 0.5, 1.0 and 2.0, obtained from Rietveld refined
structure, clearly showing bond length (in Å) variations. Distortions in the bond distances
can also be seen in the bond angles (O-TM-O) which vary from 75.8 to 73.4o in upper
part and from 108.2 to 106.6o in the lower part as we go from x = 0.5 to x =2.0. This
particular TM has been shown by arrow in Fig. 4.3 (b).
Fig. 4.10. Edge step normalized XANES spectra at Co K edge, which show gradual shift
of main edge energy indicating increase of Co2+
concentration (right inset) with increase
in Mn concentration using maxima in the first derivative of normalized absorption and the
corresponding charge proportion (left inset).
Fig. 4.11. Edge step normalized XANES spectra at Mn K edge for x = 0.1 and the
corresponding LCF fit (right inset) along with gradual shift of main edge (raising edge)
energy, via maxima in the first derivative, which indicates increase of Mn2+
concentration
with increase in Mn concentration (left inset).
Fig. 4.12. Te L3 edge XANES spectra of x = 0.5 sample (main panel), showing +6
oxidation state of Te in the corresponding solid solution. Here we have used two
119
120
120
121
123
124
126
128
129
xviii
standards reference samples, TeO2 for Te4+
state and Te(OH)6 for Te6+
oxidation states,
respectively. Inset show 1st derivative for x = 0.5, 1.0 and 2.0 as a function of energy,
indicating the same +6 oxidation state of Te in all the samples.
Fig. 4.13. (a), (b), (c) Low magnetic field DC magnetization in ZFC/FC protocol for x =
0.5, 1.0 and 2.0 indicates enhanced AFM transition (45 K, 40 K and 30 K) followed by
induced ferromagnetic ordering at around 185 K. Insets show the dm/dT to assign exact
Curie temperature.
Fig. 4.14. (a), (b), (c): Corresponding magnetic hysteresis (M/H) measurements at 300 K
and 25 K for all samples signify the paramagnetic behavior at room temperature and FM
like at low temperature.
Fig. 4.15. FM correlations is manifested through the CW fit of the inverse magnetic
susceptibility (H/M) data for CMTO (x = 0.5, 1 and 2) solid solutions, inset enlarge the
linear part. Data has been offset along Y-axis for clarity.
Fig. 4.16. Magnetization difference curves as a function of temperature for CMTO (x =
0.5, 1 and 2) show additional transitions at 118 K, 112 K and 83 K, respectively.
Fig. 4.17. Representative hysteresis loop for CMTO; x = 0.5 at 180 K, 150 K and 100 K.
Fig. 4.18. Deviation of H/ M curve from the CW law, the upper inset shows the enlarge
data for x = 2. Main panel data is shifted in Y axis for clarity, corresponding values are
not shown.
Fig. 4.19. Very high magnetic field χ (H/M) and χ-1
curves for CMTO, which signifies
another characteristic of GP. The CW fit indicates absence of GP at 50 kOe.
Fig. 4.20. Unaltered values of TN at various magnetic fields for CMTO (x = 0.5, 1 and 2).
Fig. 4.21. (a) Polyhedral view along (010), (b) layered structure (side view from b-axis)
of Mn/Co ions, (c) equilateral triangular arrangements (top view along b axis) of Mn/Co
ions located at different layers, and (d) network type of structure through oxygen along c-
axis (a-b plane).
134
135
137
137
138
139
140
140
142

xix
List of Tables:
Table 2.1. Major Parameters of Indus-2.
Table 2.2. Beam Parameters at BL-12.
Table 2.3. Features of the Huber-5020 diffractometer.
Table 2.4. Details of the Image plate setup.
Table 2.5. Phase compositions obtained from Rietveld refinement on SXRD data and
LCF on XANES data of cobalt oxide nanoparticles samples H1 to H4 are tabulated,
along with refined cell parameters.
Table 3.1. Rietveld refined lattice parameters and atomic positions of Co3TeO6 at
room temperature.
Table 3.2. Comparison of lattice parameters of present ceramic CTO with the earlier
reports.
Table 3.3. Most relevant interatomic distances (Å) in our ceramic CTO in comparison
to the single crystal CTO.
Table 3.4. Binding energies (in eV) for Co 2p (2p1/2 and 2p3/2) and Te 3d reported in
literature along with our results. O/T denotes the octahedral and tetrahedral
coordination, respectively.
Table 3.5. Total energies of all possible antiferromagnetic and ferromagnetic spin
configurations for the coexistence of Co2+
and Co3+
in Co3TeO6. The energies have
been tabulated with respect to the energy of Co2+
-O-Co2+
antiferromagnetic spin
arrangement (Co2+
as 100%) as reference. The lowest-energy spin arrangement is
given by Co2+
-O-Co2+
. AFM+GKA as shown in the table for the respective
concentration of Co3+
.
Table 4.1. Results of the Rietveld refinement of the crystal structure of the Mn doped
CTO samples (here x = 0.5, 1.0 and 2.0 only) at room temperature using Synchrotron
X-ray powder diffraction data using R space group.
Table 4.2. Effective Bohr magneton (μeff) and λ values for both GP and PM phase
obtained from fitted parameters (observed through CW fit) and modified CW law for
CMTO. Maximum errors in μeff and λ are 0.06 and 0.005, respectively.
21
24
25
25
52
69
69
70
72
80
122
137

xx

Chapter 1
Introduction


1
Materials with new functionalities and improved performances are key drivers of innovation.
Current examples of such materials are transition metal (TM) based Oxides1 and Multiferroics
(MFs).2-3
These materials show potential applications in many fields like medical,4-6
spintronics,7-9
memory storage devices,10-14
solar cells15-16
etc.17-19
and thus are fundamentally
important20-22
. Oxide complexes of TMs (TM surrounded by oxygen) exhibit variety of
structures and properties due to unique nature of their outer shell d-electrons.23
TMs are elements
with partially filled d (3d1 to 3d
9) orbitals and exhibit relatively narrow d bands. Some
implications, of having such features in TMs, are as follow. Overlap of substantially higher level
broader band (e.g. 4s band of Vanadium (V)) with the entire d band results in an occupied (4s)
band giving rise to metallic conductivity of (V) TMs.24-25
In TMOs (e.g. Vanadium oxide), on
the other hand, completely filled 2p orbitals of oxygen anions form the valence band and
partially filled 3d orbitals form the conduction band. Because of the bonding/anti-bonding
splitting between the 2p and 4s bands, the cationic 4s band is several eVs above the 3d band (and
completely empty at zero temperature) leading to insulating / semiconducting behaviour.24-25
The
TM’s 3d band is therefore responsible for all the electronic and magnetic properties in TM based
compounds.1-3,20-23
Due to the pivotal role of 3d orbitals, we briefly describe the underlying
fundamentals of TMOs in the following:
In TMOs, electrons manifest themselves in many different ways as they interact strongly not
only with each other but also experience the crystal field potentials of the surrounding.23,24
Fig.
1.1 describes crystal field splitting (Δ) of 3d orbital under tetrahedral and octahedral crystal field
potentials of anions environment around TM. These are the common types of polyhedral
coordinations, where Δ is generally larger in the octahedral case (see Fig. 1.1). Under such
potential, the electron in 3d orbitals of the TM prompts splitting of degenerate 3d orbitals into
∆t = 4/9 ∆O

2
two sub-orbitals, i) triply degenerate t2g (dxy, dyz, and dxz with spatial distributions along xy, yz,
and xz) and ii) doubly-degenerate eg (dx2
−y2 and dz
2 orbitals with spatial distribution along the
coordinate axes). A comparison of the energy scales corresponding to Δ and coulomb interaction
(U, also known as Hubbard repulsive energy) play major role in deciding a range of properties in
TMOs, e.g. the spin states (low, intermediate or high) of the TM ions.
23 For instance,
in the case
of Fe3+
(3d5) in oxygen octahedra, wherein larger Δ compared to U results in filling of lower
orbital (t2g) followed by eg orbital and hence giving only one unpaired spin, indicating its low
spin state.23
Whereas, larger Δ in case of Co2+
(3d7) in octahedral configuration results in its high
spin state.23
These two cases result in different magnetic moments and hence different magnetic
properties in the corresponding compounds.
Lifting of the degeneracy of d orbitals not only gives information on the variation in the
magnetic properties but also may explain structural (phase transition) and spectroscopic
(electronic) properties. In the presence of strong crystal field of octahedral/tetrahedral anions, the
Fig. 1.1. Pictorial illustration of TM’s d level splitting in (a) octahedral and b) tetrahedral crystal fields.
Representation of corresponding coordination geometries is also shown. Crystal field stabilization energy
(CFSE), for both the cases, where n (t2g) and n (eg) – are the number of electrons occupying the respective
energy levels, is mentioned.
CFSEtet = 0.4 x n(t2g) - 0.6 x n(eg) ∆t
CFSEoct = - 0.4 x n(t2g) + 0.6 x n(eg) ∆o

3
regular polyhedra of cations either changes its structure from higher symmetry (cubic) to lower
symmetry (tetragonal/orthorhombic) or distort through John Teller (JT) distortion (to be
discussed in the next paragraph).23,24,26-27
Fig. 1.2 describes the distortion of regular polyhedra
through elongation in any of the three crystallographic directions. This effect may lead to
ferroelectric behaviour at the cost of the breaking of inversion symmetry (BIS). 23,24,26-27
Furthermore, t2g to eg transition ranging between 1.8 eV to 3.1 eV (i.e. in the visible region) may
explain electronic (the color) property.28
Crystal field also provides significant splitting effects in
square-pyramidal and trigonal-prismatic crystal symmetries.23-24
In the following, we discuss the interplay of lattice and electron energies towards the magnetic
interaction, which is also another implication of crystal field potential. This interaction is due to
the combined effect of competition among crystal field, Hund’s coupling and Pauli’s exclusion
principle. This interaction results in other interesting concepts such as JT distortion, super-
exchange and double exchange mechanisms.23,26-27
JT distortion is a structural distortion due to
the interaction between lattice and orbital energy. It is un-even occupation of electrons in a
Fig. 1.2. Distortion from the regular octahedra (b) due to strong electric field of octahedral
anions generally changes its structure from higher symmetry to lower symmetry through
elongation in any of the three crystallographic directions. Representative elongations along z
direction (a) and y directions (c) have been shown. Crystal field parameters would be different
for each case, where ΔD and ΔR for distorted and regular octahedra, respectively.
ΔD ≠ ΔR
ΔD ≠ ΔR

4
degenerate set of orbitals, which creates un-even forces to distort the structure, thereby lowering
both the symmetry and the energy of the system. For example, in TMOs, when two apical O
atoms in an octahedron move toward the central atom, the dz2
orbital shifts to higher energies as
compared to dx2
−y2 orbital, thus lifting the degeneracy of these orbitals. Out of the three known
modes of octahedral distortion (breathing, basal plane and stretching modes), typical JT like
distortion along z and y axes are shown in Fig. 1.2. Moreover, apart from the direct exchange
between TM ions, two indirect exchange interactions through intervening oxygen namely the
super-exchange and the double exchange have also been proposed to explain observed magnetic
behaviour in a number of TMOs.27
Double exchange prefers ferromagnetic (FM) interaction,
while super-exchange may result in FM or antiferromagnetic (AFM) interaction, which depends
on the electron configuration of the magnetic ions, the angle of interaction and the type of TM-
O-TM bonding.29-30
The outcome of magnetic interactions in most of the TMOs can often be
predicted from Goodenough-Kanamori-Anderson (GKA) rules.29-30
The phenomena discussed above are the result of coupling among charge, spin, lattice and orbital
degrees of freedom.1,23
One of the most interesting examples in this category is the coupling
between (ferro) electric and magnetic orders2-3
in insulating TMOs. This is also the main subject
of this thesis. Structural and spectroscopic techniques have been used to understand the
interaction and coupling between these two (electric and magnetic) orders. Attention has also
been drawn for the correlation among structural, spectroscopic and MF (magnetic, dielectric and
electronic) properties in TM based MFs. Usually, electricity and magnetism are coupled through
Faraday’s and Ampere’s laws,30-31
however, this coupling in insulators (where no electric current
flows) is non-trivial.3,33
This coupling was observed for the first time in Cr2O3, due to the broken
inversion and the time reversal symmetries.34-35
The large electrical polarization in BiFeO3 and

5
Fig. 1.3. Interaction among three degrees of freedom (charge, spin and orbital)
of an electron in a lattice, results in ME MF that combines properties of
ferroelectrics (due to charge) and magnets (due to spin). Hysteresis along with
switching behaviour, displayed by ferromagnets and ferroelectrics mutually
control magnetic response with an electric field and modification of polarization
by magnetic field leading to the basis for making 4-state logic devices.
the magnetic control on electrical polarization in TbMnO3 have triggered intense research in the
field of MFs.36-37
An additional outcome of this coupling (between electric and magnetic orders)
is the magneto-dielectric effect,38-39
wherein dielectric constant gets modified by magnetic field /
magnetic ordering, indicating spin-phonon coupling. Although, such electric and magnetic orders
are mutually exclusive in a single phase material, recent observations on various materials
establish magneto-electric (ME) MFs as the future material.1,40
Remaining part of this chapter
describes two types of ME couplings followed by proposed mechanisms explaining these
couplings. The purpose and the motivation of this thesis are mentioned at the end of this chapter
(section 1.4).
1.1. Multiferroics
Single phase compounds and multiphase composites, which possesses simultaneously two or
more primary ferroic orders viz. ferroelectric, ferromagnetic, ferroelastic and ferrotoroidic, are

6
called MFs.2-3
ME MF materials contains only two fundamental ferroic (magnetic and
ferroelectric) orders in the same phase (Fig. 1.3). From application point of view, the coupling
between these two ferroic orders is more important. For example, possibility of controlling
magnetization by applying electric field or controlling polarization by applying magnetic field, in
a single phase materials, is of great technological importance.41-45
Magnetism and ferroelectricity
(FE), as independent phenomena, are rather well studied in condensed matter physics. The
stabilization of FE and magnetism in a single phase is quite difficult due to demand of two
mutually exclusive requirements.3,33
The magnetic ordering requires localization of electrons into
partially filled d shells and is usually seen in TMs leading to the metallic behavior. Conversely,
FE (and hence electrical polarization) requires structural distortion of the lattice occurring
usually from empty d shells, and ferroelectric materials tend to be insulators.3,41
This is not the
only constraint, as simultaneous occurrence of magnetic and electric orders is also prohibited
from symmetry considerations. Electrical polarization needs the lack of the inversion center
whereas, magnetic order requires lack of time reversal.33,41
Although, the coexistence of FE with
magnetism was initially considered as one of the rarest of rare phenomena, the evolution of
strongly cross-coupled response of various materials with the spontaneous polarization and the
spontaneous magnetization in the absence of external field has changed the existing scenario
drastically.2-3,34-40
1.2. Combining magnetism and ferroelectricity
A compound having transition metal provides magnetic ordering. But inducing FE in the same
phase is not trivial.3,33,41
The path that MF community adopts is to induce ferroelectricity in a
compound (consisting of magnetic elements), either by BIS or by using some other

7
mechanism.3,41
On the basis of microscopic mechanism for the origin of FE, the MF materials
can be classified into two types, the type I (proper) and type II (improper) MFs.
1.2.1. Type I Multiferroics
In type I MF, appearance of FE and magnetism have separate mechanisms and thus the coupling
strength between the two is weak, although the individual strengths can be quite significant.40
These materials usually exhibit large polarization, and the ferroelectric transition is usually
observed at higher temperature than that of the magnetic transition.40
Depending on mechanisms,
common examples of single phase type I MF materials are BiFeO3,34,60
Fe3O446-48
and YMnO349-
50, which exhibit lone pair, charge order and geometrical frustration mechanisms, respectively.
In BiFeO3, FE occurs due to lone pair electron (Bi’s). These electrons (also called the dangling
bonds because they are always unsatisfied in chemical reactions) are highly polarizable and
therefore lead to favorable condition for FE. Similar mechanism is observed for BiMnO3 and
PbVO3, where Bi3+
and Pb2+
, respectively play major role in the origin of the electrical
polarization.40
The co-valency of Bi/Pb-O bonds create electric dipoles (with certain admixture
of oxygen p orbitals) along the corresponding bonds. On the other hand, magnetism in these
compounds originates from the B site (Fe, Mn, V) consisting of unfilled 3d orbitals with
uncompensated spins. In these cases, the magnetic and ferroelectric properties are decoupled and
corresponding transition temperatures are far apart from each other.40
It is also important to note
that FE observed in these compounds is different from those of the conventional perovskite
ferroelectric, which is of displacive nature.51
Charge order (CO),46
often observed in transition metal compounds, occurs when the valence of
TM is not distributed equally on a particular crystal site. The average valence of that particular
site, in most cases, has non integral value. Consequently, below the temperature at which charge

8
ordering occurs: i) charges start to localize on the particular sites at the cost of other sites, which
were previously equivalent and ii) the appearance of super-lattice due to symmetry lowering.46
One of the famous examples, where a charge order has been reported, is magnetite Fe3O4
(AB2O4). Below the Verwey-transition (TV = 120K), Fe ions at the B site start to arrange into
Fe2+
and Fe3+
and lead to FE ordering.47-48
However, this does not necessarily mean that mixed
valence configuration will always lead to spatial inversion symmetry breaking.47-48
It may
happen that the mixed valency of TM leads to the weakening and strengthening of alternate TM-
O bonds resulting in net dipole moment and hence the polaristion.47-48
Similar to the earlier case,
magnetism originates from the presence of localized spins of electrons (partially filled d shells)
of TM ions.
Lastly, we consider the case of geometrically frustrated type I ME MF, as observed in YMnO3.49-
50 FE in YMnO3 has nothing to do with magnetic Mn
3+ ions or its JT nature. It occurs by an
accidental by-product (frustration of MnO5 polyhedra and distortion in Y-O bonds) due to the
tendency of close packing. Close packing in normal ABO3 (where A ions are in 6-fold and B
ions are in 12-fold coordination) perovskite occurs through tilting and rotation of BO6 octahedra.
This may also lead to structural transition like cubic to orthorhombic. However, in YMnO3
(where Mn ions exist in 5-fold and Y ions are in 7-fold coordinations), tilting of MnO5 block
with Mn at the center, provide two down Y-O bonds and one up Y-O bond, resulting in net
dipole moment.50
This leads to loss of inversion symmetry and thus results in FE, wherein dipole
moments are formed by Y-O pairs. The remaining requirement of ME MF i.e. magnetism in the
same phase originates from the presence of localized electrons of d shells of Mn, as in earlier two
cases.

9
1.2.2. Type-II (Magnetic) Multiferroics
In type II MFs, FE and magnetism are dependent phenomena i.e. one can induce the other.35
Such materials exhibit intrinsic certain magnetic structures, which are responsible for BIS and
hence for the electrical polarization.35
Due to large coupling, these materials are extremely
important from technological point of view.35
In the following, we discuss various mechanisms
for the development of ferroelectric order (as a result of BIS) on magnetic transitions, in some
details.
There are certain modulated magnetic orders different from well known FM and AFM orders,
which play important role in strong ME coupling.41,52
These spin structures are sinusoidal,
helical, cycloidal, conical etc. All these may be grouped under spin spirals and are shown in Fig.
1.4. The spin-spiral structures result from magnetic frustration,41
a situation in which no spin
arrangement exists that simultaneously fulfils all exchange paths. As a result, a compromise spin
structure is obtained, which only partially fulfils these paths. Spin-spiral structures are formed
Fig. 1.4. Modulated spin structures, (a) sinusoidal, where magnitude of the magnetic
moment changes along the propagation axis (arrow). (b), (c) The same remains constant in
helicoidal and cycloidal spin configuration cases, only rotation axis changes. In (b), the
rotation axis coincides with the propagation axis, while they are perpendicular in (c). In
(d) and (e), which are longitudinal and transverse conical spin spirals, the spins rotate on a
cone (not in a plane), leading to a macroscopic magnetization.

10
for certain geometric arrangements of spins and relative strengths of the exchange paths.
Different spiral arrangements are possible (Fig. 1.4), out of these only few can induce FE.41
The best known mechanism for the generation of a ferroelectric polarization is through a spin
spiral structure based on the Dzyaloshinskii-Moriya (DM) interaction.41,53
The antisymmetric D-
M interaction is the relativistic correction to the usual superexchange interaction and its strength
is proportional to the spin-orbit coupling. This interaction favors non-collinear spin ordering, viz.
spiral spin ordering. Once it produces the spiral state the lattice reacts (relaxes) to it by the
magnetoelastic effect or exchange striction (minimizes energy) and that causes the atomic shifts
or ferroelectric polarization. This is an antisymmetric contribution to the Hamiltonian due to
spin-orbit coupling,
where, Si and Sj are neighboring spins and D is the Moriya vector. The vector D can be expressed
as Dij = x×rij. Here, rij is the vector connecting spins Si and Sj and x is the displacement of an
intermediate oxygen ion from the connection line, which mediates the super-exchange between
spins (Fig. 1.5 (a)). Magnetically induced FE in spin spirals works exactly the other way round.
It is therefore also called the inverse DM interaction.41,53
The inverse effect is nothing but the
efforts of the lattice degrees of freedom to repair the damage done by the D-M interaction. If a
spin spiral is present and the oxygen atoms are not fixed, the displacement x can be changed to
minimize the DM energy term (Fig. 1.5 (b)).
An alternative explanation for the magnetic structure induced polarization is through spin current
model54
(i.e. Pij ∝ γ × eij × (Si × Sj)), for a pair of neighboring spins Si, Sj with the unit vector eij
connecting them. Here, γ is a constant, which depends on the spin-orbit coupling and super-

11
exchange interactions. These types of spin spiral structures have been proposed for rare earth
manganites (e.g. TbMnO3).35
The paraelectric phase, in these cases, is characterized by
sinusoidal spins network (Si × Sj = 0), whereas, ME phase is explained through spin current
model having finite values of polarization with spin spiral (Si × Sj ≠ 0) network. According to
Katsura et al.,54
the spin current induced between non-collinearly coupled spins displaces the
oxygen atom, sandwiched between the two moments (TMs), through electron lattice interaction.
This causes BIS leading to the ferroelectric nature.
In contrast to the spin spiral magnetic structure, collinear magnets consist of spins arranged in
Ising chain (↑– ↑– ↓– ↓), which is shown in Fig. 1.5 (c), BIS occurs through the Heisenberg-like
symmetric exchange term.41
This specific type of spin arrangement is adopted by the
stabilization of FM interaction between nearest neighbour and strengthening of AFM interaction
over next nearest neighbours. These arrangements of spins (i.e. ↑–↑ and ↓–↓) can lead to in-
(c)
Fig. 1.5. The Dzyaloshinskii-Moriya (DM) interaction’s mechanism, (a) Dependance of
superexchange interaction between neighboring spins on their bond angle and hence on the
displacement x of oxygen ions, which results in the minimization of DM interaction energy for
fixed bond angles adjusted by oxygen displacement. (b) In zig-zag chains, vector Dij = x × rij
alternates in sign leading to a homogeneous shift of the negative ions with respect to the positive
ions which results in macroscopic polarization. (c) Collinear spin structure with ↑ – ↑ – ↓ – ↓
spin configuration breaks inversion symmetry and hence induces the electrical polarization.
12
equivalent interatomic forces that result in magneto-striction based FE.41
Due to an exchange-
striction,41
the distortion of ferro and antiferro bonds (↑– ↑ and ↑– ↓) is different and thus the
material (whether one have dissimilar or identical magnetic ion) becomes ferroelectric, as also
predicted by theoretical calculations.55
One more mechanism of ferroelectricity in a collinear
magnet is the “electronic” ferroelectricity, which has been seen in frustrated magnets.56
1.3. Applications and recent trends in Multiferroics
ME MFs have attracted great attention due to their promising potential applications.4-20,34-45
FM
materials have been widely used in the field of data storage because of their property of
switchable spontaneous magnetization by an external magnetic field.57
Similar property of FE is
applied in ferroelectric random access memory (FeRAM) for computers and radio frequency
identification (RFID).8 In ME MF, four degrees of ferroic order work simultaneously that
enables the possibility of four stage logic realization in a single phase device.58-63
Current field of data storage devices consist of two types of non-volatiles memories, FeRAM and
magneto resistive random access memory (MRAM).14,64
MRAM has the advantage of very large
density of memory elements along with a handicap in high writing energy. It has similar access
time and endurance compared to FeRAM. In order to combine the respective advantages of
FeRAM and MRAM, the second character i.e. magnetism of ME MF needs to be coupled.
Through this, one can switch P by H or M by E using the concept of ME effect. Development of
ME random access memory (MERAM), which is one of the potential applications of ME MF,
saves the writing energy by using low write voltages and also keeps the advantage of
MRAM.14,64
Some of proposed applications of ME MF materials are magnetic sensors,
microwave devices, transformers and gyrators.65-68

13
Another impressive application of ME MF is in the field of Spintronics.7-9,40,69
In conventional
electronics, information is encoded by the electron charge. In spintronics, the electron spin is
used as an additional degree of freedom to perform logic operations and store information etc.
Spintronics exploit the spin-dependent electronic properties of magnetic materials and
semiconductors.40
In spintronics, magnetism is used to control an electric current. Due to the
large power consumption and heating in conventional electronics, spintronics have triggered
significant interest in MFs for their potential to reduce the energy consumption while also adding
functionality to the device.
Further, very recently, ME MF materials, in thin film form, have been found to be promising
materials in solar cells.15,70
The key features of the same are their efficient ferroelectric
polarization driven carrier separation and above-bandgap generated photo-voltage. Nechache et
al.15
developed a multilayer structures of Bi2FeCrO6 with a graded bandgap, for the first time,
which provides non-negligible photocurrent (20 mA cm-2
) and power conversion efficiency
(PCE) of 8.1%.15
The two combined breakthroughs i.e. efficient carrier separation and above
bandgap voltage, are a result of long range ordering of the cations Fe and Cr. This leads to the
reduction of the absorption edge (optical band gap) from approximately 2.5 eV (of the parent
compositions with Fe or Cr) to an impressive 1.5 eV (where maximum PCE is expected),
through the charge transfer mechanism between Fe and Cr. Actually, in Bi2FeCrO6, the
ferroelectricity (and hence polarization) is driven mostly by Bi3+
results in the internal electric
field, which control the charge transfer between Fe and Cr via O, leading to the tuning of the
bandgap by controlling the cationic ordering of Fe and Cr.
It is clear from the above discussion that ME MF materials have been proposed to be of
importance in various applications. The issues with further applications of ME MF materials are

14
the lack of strong ME effect and their functioning at / near room temperature. Recently Vaz et
al.,71
suggest a way for solving these issues using MF composites (out of scope for this work).
1.4. Issues and Motivation of the present work
The subject matter of this thesis work, as mentioned above, is studies on structural and
spectroscopic properties of TM based MFs and Oxides, owing to their frontier research
activities72-73
. We have chosen Cobalt oxide, Cobalt tellurate (Co3TeO6: CTO) and Mn doped
Co3TeO6 (CMTO). The interest in CTO74-86
is due to its low temperature type II MF properties
and monoclinic crystal structure with multiple magnetic transitions. One of the structural issues
with CTO is variety of polyhedral configurations of divalent Co ions (Co2+
), which is usually not
feasible.87-89
Further, in order to enhance the coupling strength and the magnetic transition
temperature, in CTO, we have studied Mn doped CTO (Co3-xMnxTeO6: CMTO). Here, both the
end members (Co3TeO6 and Mn3TeO6: MTO) belong to the A3TeO6 family; (A = Mn, Ni, Cu,
Co),76
and are improper and proper MFs, respectively. Although, substantial amount of work
have been reported on CTO74-86
and CMTO90-94
, there are several issues, still under debate.
1) Single phase synthesis83-86
and reported large variations in its intrinsic low magnetic field
magnetic behaviour77-82
remain a challenging issue in ceramic as well as single crystal CTO. In
addition, to the best of our knowledge, none of the reports discuss growth mechanism of ceramic
CTO.
2) There is no experimental report which shows all the five magnetic transitions ~ 34 K, 26
K, 21 K, 17.4 K and 16 K in a particular ceramic or single crystal CTO.77-80
Origin and the
understanding of each magnetic transition is also an important issue.
3) Literature suggests only Co2+
ions in CTO, which occupies five different crystallographic
positions as tetra, square-pyramidal and three octahedral sites.74-80
Such variety of polyhedral
15
configurations with divalent (Co2+
) ions are usually not feasible.87-89
One possible way to arrange
such polyhedral mixing is through mixed valence ions. However, there are no reports about the
presence of additional valency like Co3+
in (either single crystal or ceramic) CTO and thus needs
to be explored.
4) Theoretical work predicts spontaneous weak magnetization as well as spontaneous
polarization.82
The former one is consistent with domain structure observed in the Second
Harmonic Generation measurements.82
The experimental observation of the spontaneous zero
field polarization remains a subject of debate.
5) Moreover, magneto-dielectric,38-39
an important observation in the field of type II MFs,
which deals generally with the response of dielectric constant under magnetic field, and hence
spin phonon coupling has not been observed in any of the earlier reports.
6) In order to enhance the coupling strength and temperatures in CTO, researchers have
tried doping Co site with several transition metals such as Cd, Fe and Mn etc.90-94
Out of these,
only Mn doped CTO results in the enhancement of transition temperature.91-92
Mn doping in
CTO enhances the AFM transition temperature to ~ 40 K, which is 26 K for CTO and 23 K for
MTO.91-92
Not only the structural origin of this enhancement is missing, but also no evidence of
FM interaction is observed.
We have made an attempt to understand the growth mechanism of CTO (synthesized through a
novel two step solid state reaction route).95
In order to address above mentioned issues
(numbered as 2-5), extensive structural as well as spectroscopic studies with their probable
correlation with magnetic and dielectric properties of CTO have been carried out.95-99
Temperature and magnetic field dependent magnetic, dielectric and polarization measurements
are performed and analyzed to address above mentioned issues in CTO. Furthermore, to address

16
the issues in Mn doped CTO samples (described in paragraph numbered 6, above ), we have
carried out room temperature Synchrotron X-ray Diffraction (SXRD) and TM K- edge X-ray
Absorption Near Edge Structure (XANES) studies, described in chapter 4. Detailed structural as
well as spectroscopic studies have been used to establish a correlation between these
information and the observed as well as reported enhancement in the AFM transition temperature
and the high temperature robust ferromagnetism (not reported so far), in CMTO.100-102
1.5. Organization of the Thesis
Work of this thesis is organized as follows: Details of the instruments and experimental set-up
used for various characterizations of samples; along with synthesis procedures are discussed in
chapter 2. Utilization of XANES measurements for the study of phase concentration of a
multiphase sample is established for cobalt oxide nanoparticles103-105
. Chapter 3 is divided into
three sections. In these sections, we have discussed the growth mechanism of CTO (Section 3.1),
charge and spin states of Cobalt in CTO (Section 3.2) and their probable correlation to magneto-
electric and magneto-dielectric properties (Section 3.3). Chapter 4 is divided into two sections.
Preparations and characterizations of CMTO are discussed in the first section. The second
section provides structural explanation to the observed magnetic behaviour of CMTO.
Conclusions and proposed future work are discussed in chapter 5.

Chapter 2
Experimental
techniques

17
2.1. Introduction
In this chapter, synthesis procedure and characterization techniques have been described. Since,
the optimization of synthesis of samples are interrelated to the characterization steps, hence
details of synthesis process are discussed in results and discussion section (chapter 3 for CTO
and chapter 4 for CMTO). We only briefly mention about the synthesis procedure in this chapter.
Structural details in relation with growth of these materials have been covered into the results
and discussion part of chapters 3 and 4. For structural and spectroscopic characterizations (and
their correlation with magnetic, dielectric and electronic properties), which are the main subject
work of this thesis, Angle Dispersive X-ray Diffraction (ADXRD) beamline (BL-12)106
has been
used extensively along with scanning EXAFS beamline (BL-09)107
at Indus synchrotron
source108-109
. X-ray diffraction and X-ray absorption techniques along with some details of
Indus-2 synchrotron source are discussed followed by brief discussion on the dielectric and the
magnetic measurement set-ups.
2.2. Synthesis
For the preparation of bulk ceramic CTO and CMTO, the solid-state reaction (SSR) route has
been utilized. Cobalt oxide nanoparticles (NPs) have been prepared by the wet chemical route103
.
2.2.1. Solid State Reaction Route
The SSR (also called solid state diffusion, i.e. the movement and transport of atoms in solid
phases) is the simplest and most widely used method for the preparation of polycrystalline
samples. Four steps namely, i) Weighing and mixing, ii) Calcination, iii) Shaping or Pelletization
and iv) Sintering, are used in the SSR route. Solids (powder form) do not react at room
temperature over normal time scales and is necessary to heat them at much higher temperatures
(often > 1000 °C) in order for the reaction to occur at an appreciable rate. In the SSR technique,

18
chemical reactants are taken in required stoichiometric or (sometimes) off- stoichiometric ratio
and mixed thoroughly. After mixing, solid mixtures are heat treated at higher temperature (called
calcination) for several hours with intermediate grindings. As a main element of a SSR route, a
resistively heated quartz tube furnace system has been utilized for the present work. Shaping or
pelletization of samples is preferred since it increases the area of contact between the grains.
Finally, sintering has been done to increase the density. The factors on which the feasibility and
rate of a SSR resides are reaction conditions, structural properties of the reactants, surface area of
the solids, their reactivity and the thermodynamic free energy change associated with the
reaction. The synthesis procedure for CTO and CMTO is given in the forthcoming paragraphs.
CTO is synthesized using conventional SSR route. The reactants used are of analytical grade i.e.
Co3O4 (Alpha Aesar 99.7 %) and TeO2 (Alpha Aesar 99.99 %). The mentioned reactants are
taken in stoichiometric as well as off- stoichiometric ratios and mixed thoroughly using Shaker
mixture (TURBULA @- T 2 F) for 6 hrs. Obtained mixtures have been calcined at different
temperatures and for different time in order to get single phasic CTO in an optimized condition.
In the process of CTO preparation, stoichiometric as well as off- stoichiometric ratios of Co3O4
and TeO2 has been considered for optimizing the growth. Optimization parameters include
calcination time, calcination temperature, single step and double step calcination process etc.
Optimized parameters suggest non-stochiometric reactants (with 5% excess of TeO2) and a two
step calcinations procedure are essential for synthesis of single phase CTO sample. Firstly, the
ground (non-stochiometric) oxide mixture is heated at 700 oC for 10 hrs and then re-calcined at
800 oC for ~ 25 hrs, as a second step. For each step of calcination and sintering (~ 850
oC for
2hrs), the pellets are made by applying 2 tons of hydrostatic force.

19
Co3-xMnxTeO6; (x = 0.0, 0.05, 0.1, 0.2, 0.25, 0.3, 0.4, 0.5, 1, and 2) are also synthesized via
conventional SSR route. The reactants used are of analytical grade Co3O4 (Alpha Aesar 99.7 %),
Mn3O4 (obtained from high purity MnO2: Alpha Aesar 99.999%) and TeO2 (Alpha Aesar 99.99
%). We have used the same synthesis route, as in the case of CTO, which involves non-
stochiometric reactants (5% excess TeO2) and a two step calcinations procedure. Firstly, the
ground oxide mixture is heated at 700 oC for 10 hrs and then re-calcined at 800
oC for ~ 25 hrs as
a second step. Different calcination times for different Mn concentrations are required for single
phase synthesis. Calcination time of ~ 25 to 30 hrs for x < 1 and 48 hrs for x ≥ 1 are used. For
each step of calcination and sintering (~ 850oC for 2hrs), the pellets are made by applying 2 tons
of force. Volume compression in all the pellets for x < 0.2 and no volume change for x > 0.5 has
been observed, on calcination. In the composition range 0.2 ≤ x ≤ 0.5, volume expansion like
behavior has been observed. Anomalous changes in volume of pellets after calcination might be
due to large variation in the densities of CTO (~ 1400 gm/cm3) and MTO (720 gm/cm
3).
2.2.2. Wet Chemical Route
Cobalt oxide NPs are synthesized using wet chemical route.103-104
The reactants used are cobalt
nitrate Co(NO3)2.6H2O as a precursor, 2-Pyrrolidone as solvent, oleic acid and trioctylphosphine
oxide (TOPO) as surfactants. The purpose of TOPO and oleic acid is to control of size and shape
of the NPs. The chemicals used are of analytical grade and are procured from Sigma Aldrich. 0.5
g (1.72 mM) Co(No3)2·6H2O is dissolved in 25 mL (0.33 M) 2-pyrrolidone. 2 mL (6.2 mM) oleic
acid and 2.4 g (6.2 mM) trioctylphosphine oxide are mixed with the above solution at 50°C and
stirred for 30 minutes. The reaction takes place in two steps. After heating at 50 °C and stirring
the mixture for ~ 30 minutes, the solution has changed to pink color. This indicates the
completion of the first phase. The solution is heated in air at 200 °C for 1 hour and a black
20
solution is observed. The solution is then cooled to the room temperature and is diluted with
methanol. Black powder is separated from the solution using centrifuge. The powder is dried at
65 °C for about 10 hours in the oven. The base sample (as grown) is further annealed at various
temperatures from 300 C to 800
C for ~ 2 hrs in air. For the proposed work, we have chosen
four samples 1) H1: as grown, 2) H2: annealed at 300 oC for 2 hours, 3) H3: annealed at 500
oC
for 2 hours, and 4) H4: annealed at 800 oC for 2 hours.
2.3. Thermal Analysis
In order to understand the underlying growth reaction mechanism of CTO during SSR synthesis,
thermal analysis of the mixed starting (Co3O4+TeO2) powder is carried out. Thermal analyses,
such as differential thermal analysis (DTA) and thermo-gravimetric analysis (TGA) of the oven-
dried powder are carried out in a thermal analyzer (Perkin Elmer, Pyris Diamond) at a heating
rate of 10 oC / min. DTA measures the temperature difference and shows a peak to the
endothermic or exothermic direction depending on the type of reaction e.g. DTA takes upturn
peak during oxidation i.e. exothermic reaction. TGA measures changes in mass of the sample
with change in temperature e.g. change in mass during oxidation.
2.4. An overview of Indus-2 and the Beamline used for the present work
Laboratory X-ray source, where X-rays are produced through high energy beam of electrons
falling on high Z materials, has immense importance. However, its low flux as well as spectral
brightness or brilliance (flux per unit area of the radiation source per unit solid angle of the
radiation cone per unit spectral bandwidth) remain experimental/technological limitation. This
limitation is overcome by the synchrotron storage ring, wherein, electron or positron bunches
continuously circulate at a fixed energy for periods up to many hours and results in synchrotron
radiation (SR) emission. Material characterizations using X-rays have been greatly benefited by

21
the advent of SR sources. SR has several properties, which makes it more advantageous over
laboratory X-rays. SR gives about 4 orders of magnitude higher photon flux, higher brilliance
and most importantly, tunability in the X-ray region. Due to higher photon flux, one can afford to
lose intensity in order to monochromatize X-rays with narrower energy spread (leading to higher
energy resolution in structural and spectroscopic analysis). Also because of higher brilliance, the
experiments are performed faster and with improved signal to noise ratio. In addition, tunability
of the SR enables not only spectroscopic (response of a system as a function of energy) analysis
but also multi-wavelength anomalous dispersion analysis quickly and conveniently.
Indus-2, the only Indian third generation SR source, is a 2.5 GeV and 200 mA current SR source
having critical wavelength of 1.98 Å (for the radiation from bending magnets).108-109
Electrons
are injected into a booster cum storage ring (circumference ~ 172.47 m) at 550 MeV and
accelerated to 2.5 GeV, where the beam is kept stored for several hours. A set of 4 RF cavities
with an operating frequency of 505.812 MHz provides the required energy for beam acceleration
from 550 MeV to 2.5 GeV. Major parameters of Indus-2 source are summarized in Table 2.1.
Table.2.1. Major Parameters of Indus-2.
Circumference 172.47 m
Injection Energy 550 MeV
Final Energy 2.5 GeV
Beam current 200 mA
Critical wavelength 1.98 Ǻ (Bending Magnet)
Emittance 58 nmrad
Brightness 1.0210
14 (photons s
–1 mr
–2
mm–2
bandwidth–1
)
Lifetime 18 hrs (at 100 mA current)

22
Depending on diverse purpose and requirements such as fundamental, medical and industrial,
several beamlines (BLs) have been commissioned.108-109
These BLs are designed to operate
either in hard X-rays (~5 - 25 keV) or soft X-rays (~100 eV to ~1500 eV) regions. Important
components in a typical BL are slits, pre mirror, monochromator (crystal or grating), post mirror
and the experimental station. The hard X-ray BLs are designed with double crystal
monochromators (DCM), while the soft X-rays with grating monochromators.108-109
In addition,
pre and post-mirror facilitate collimation or focusing of the X-ray beam, required for the
operation of BL in high resolution or high flux modes, respectively. To avoid contamination of
the reflecting surfaces of the optical elements and also to minimize scattering of photons by air,
the BL has to be operated in high vacuum conditions with pressures of the order of 10-8
mbar, for
hard X-ray BL. For soft X-ray BL, ultra high vacuum (UHV) of 10-9
mbar is required to facilitate
windowless operation of the beamlines. In the following, we discuss the experimental techniques
used in the present thesis, in some details.
2.5. X-Ray Diffraction
X-ray Diffraction (XRD)110-111
has been a well-established technique in the field of structural
investigation. Electrons in a crystal (a regular array of atoms) scatter X-rays. Since, the atoms are
arranged in regular pattern, the scattered waves from the atoms exhibit definite phase
relationship and interfere, giving rise to constructive and destructive interference.
In order to understand the underlying mechanism, Bragg has derived XRD equation (2.1) using
Fig. 2.1, which is known as Bragg’s law.
2 dhkl = n λ, n = 1, 2, 3... (2.1)
Bragg has considered consecutive parallel planes with the lattice spacing d, which is irradiated
by incident radiation at incident angle . The path difference for rays reflected from adjacent

23
planes is 2d . These rays interfere constructively when the path difference is an integral
multiple of wavelength λ. Bragg law, given by equation 2.1 gives only the space group
information. Information about the basis/positions and types of atom at the lattice points is
obtained by relative intensities of Bragg peaks. The intensity of a Bragg peak with miller indices
(hkl) is given by
Ihkl ; (2.2)
is the structure factor, which is defined as:
= (2.3)
where, fi is the atomic form factor of the ith
atom in the unit cell. ui, vi, wi are the atomic
(fractional) positions of the ith
atom in the unit cell. Summation is performed over the entire
atoms in the unit cell. The proportionality includes the multiplicity for that family of reflections
and other correction factors like absorption, geometrical factors, temperature dependence and
polarization factors etc. As the temperature increases, peak intensity (or Bragg peaks) will
decrease since spacing of the planes will not be correctly defined.
Fig. 2.1. Schematic to understand XRD mechanism through
Bragg reflection by lattice planes of a crystalline sample. For
XRD pattern, path difference between reflected rays by
adjacent lattice planes must be integral multiple of wavelength.
dhk
l

24
In this work, we have carried out synchrotron X-ray diffraction measurements using ADXRD
beamline (BL-12)106
at Indus-2 SR source108-109
. BL-12 consists of pre and post mirrors and Si
(111) based double crystal monochromator (DCM). The first optical element is a platinum
coated Si pre-mirror which is plane and bendable in the form of a cylinder. This mirror is used
for vertical focusing/collimation of the X-ray beam. DCM is the second optical element of the
beamline and is used for monochromatization of photon beam. A pair of crystals is used in
DCM for dual purpose of fixed exit of the beam, when energy is changed and also for
suppression of higher order harmonics. The second crystal of the DCM, in the present optical
design, is also used for the sagittal focusing of the beam. For high energy resolution, Si (311)
crystal pair is also available which require approximately 3 days for being replaced and aligned.
The third optical element is a platinum coated bendable post mirror used for vertical focusing of
the beam. Optical layout and major parameters of ADXRD beamline are given in Fig. 2.2 and
Table 2.2, respectively.
BL-12 consists of two experimental stations in tandem. The adoptive optics allows us to focus
the beam at one or the other experimental station. The first experimental station is a six circle
diffractometer (Huber 5020) with scintillation point detector (Radicon). A photograph along
with major specifications of the set-up is shown in Fig. 2.3 and Table 2.3, respectively.
Table 2.2. Beam Parameters at BL-12.
Spectral Range: 5-22 keV
Energy Resolution: 7000 (E/ΔE) at
Cu K-edge
Flux: 1010
photons/sec at 10keV
Beam Size: 0.7mm (H) x 0.5mm (V)
Angular Resolution ~ 0.018o /0.025
o
Fig. 2.2. Optical layout of BL-12.

25
The second experimental station is Image plate area detector (Mar 345 Dtb). It consists of a pair
of movable cross slits and two ionization chambers, for the alignment of the incident beam on
the axis of the area detector. A photograph along with its main features is shown in Fig. 2.4 and
Table 2.4, respectively. It may be mentioned that most of the Synchrotron XRD measurements
included in this thesis have been carried out using the Image plate area detector.
Table 2.4. Detail features of the Image plate setup.
Diameter 345mm
Sample environment
1. Air
2. High pressure (Diamond anvil
cell based)
3. Low Temperature (3K – 450K).
Higher order
suppression
Possible with detuning of the second
crystal
Sample mounting
Powder sample in a capillary with
provision for sample rotation -
Powder sample sandwiched between
kapton sheets
q Range up to 14.74 Å-1
Angular Resolution 0.025 degree (2σ in 2θ)
Fig. 2.4. Photograph of the 2
nd experimental
station with its various components.
Experimental station II: Image plate area
detector
Table 2.3. Features of the Huber-5020 diffractometer.
Angular range 0 – 100°
Sample environment
1. Air, Powder sample with
provision for sample rotation
2. High temperature ( up to 800K)
Higher order
suppression
Possible with detuning of the second
crystal
Various scan modes
1. θ-2θ scan
2. detector scan
3. rocking curve scan
4. φ and χ scans
Incident flux
monitoring
On line measurement using Ionization
Chamber
q Range 4.66 Å-1
- 14.74 Å-1
Angular Resolution
15 arc sec (single crystal in rocking
curve) (and 0.018 degree for powder
LaB6 (NIST))
Fig. 2.3. Photograph of 1st experimental
station consisting of several components.
Experimental station I: Huber-5020
diffractometer

26
Fig. 2.5. (a) Shows 2D intensity data as found at Image Plate for LaB6 NIST standard, (b)
shows Rietveld refinement of the same LaB6 1D pattern and (c) shows a typical view of the
refined structure form Rietveld refinement.
b
c
a

27
The XRD pattern obtained on the Image Plate is in the form of circular rings (2D pattern). These
rings are converted into conventional intensity versus 2θ [I (2θ) -1D] pattern using Fit2D
software112
. A NIST standard (LaB6) is used to get accurate values of (i) incident X – ray
wavelength and (ii) D (distance between the sample and the detector). This value of wavelength
was used for refinement of sample’s XRD patterns using Rietveld method.113
Apart from the
powder samples on Image Plate, we have also performed High resolution SXRD measurements
on diffractometer to resolve multiphase issue in CTO (to be discussed in Chapter 3). More
details on each components of BL-12 can be found elsewhere.103,106,107-109
Fig. 2.5 (a) shows 2D
intensity data as found in Image Plate for LaB6 NIST standard. The data is reduced to I (2θ)
form, as shown by Fig. 2.5 b, using Fit2D software discussed above. This 1D intensity data
along with its corresponding structure’s information has been used as input for Rietveld
refinement. Fig. 2.5 (b) also shows theoretically obtained data points (circles) using FullProf113
.
In Fig. 2.5 (c), refined structure from Rietveld refinement is shown to find its atomic positions
(Wyckoff), bonding, angle, polyhedral rotation or tilting etc. Synchrotron XRD provides the
structural information like crystal symmetry, space group, lattice parameters, Wyckoff site
distribution etc. Response of these parameters in extreme condition like temperature, pressure
provide the understanding of mechanism for their variations in various properties such as
structural, magnetic, electronic and dielectric. Below we discuss Rietveld refinement in brief.
Rietveld method is a powerful tool for refining crystal-structure using X-ray and neutron powder
diffraction data.113-116
Present work emphasizes Rietveld refinement on X-ray diffraction data. It
calculates the intensity [ (structure factor)2] for each plane, based on the parameters given and
fit this data to the observed data using least square fitting. The refinement program also allows

28
the user to change some of the parameters suitable for better agreement between experimental
and calculated values.
For satisfactory fit between observed and calculated patterns, the following agreement factors are
optimized, 1). RF - structure factor, 2). Rp - profile, 3) Rwp - weighted profile, 4) Rexp - expected
weighted profile and 5). RB - Bragg factor. The goodness of fit (χ2) of the pattern fitting is
defined as:
where, N and P are the number of profile points and refined parameters, respectively. Rwp is the
main factor, which determines the convergence of refinement and Rexp is used to check the fit
data quality. For obtaining the accurate structural parameters, Rwp and Rexp should be as low as
possible. Backgrounds, in all the refinement, are modeled either by a suitable polynomial or by
interpolation of user defined data points. Among the various peak shape functions, the pseudo-
Voigt is most widely used. Since the Rietveld analysis is essentially a refinement process, the
parameters which are refined in the Rietveld method include structural parameters (positional
coordinates, unit cell parameters and thermal parameters), sample parameters (strains, domain
size, preferred orientation etc.), instrumental parameters (FWHM of the peaks due to diffraction
geometry, shift of origin, background etc.) and the scale factor. One has to consider occupancy
parameter, scale factor, zero correction, half-width parameters and isotropic thermal parameters
during refinement.
Synthesized (CTO, CMTO and cobalt oxide NPs) samples are characterized by SXRD
measurements at BL-12. SXRD measurements have been performed in Debye-Scherrer
geometry for all the samples. In order to compare SXRD patterns of various samples (see section
(2.4)

29
3.1 of chapter 3 and section 4.1 of chapter 4), we have used I vs q (= 4 sin /) plots instead of
I vs 2 plot (in order to make the SXRD pattern wavelength () independent), because the
measurements have been done at different wavelengths.
2.6. X-Ray Absorption Near Edge Structure Spectroscopy
X-ray absorption spectroscopy (XAS) of a material is characterized by sharp increases in
absorption at definite X-ray photon energies.117
These definite photon energies are characteristic
of the absorbing element and it’s neighborhood. A typical XAS spectrum is divided into two
regions with respect to edge energy (E0), as shown in Fig. 2.6. The structures in the vicinity of
the edge up to around 50 eV from the edge are referred as X-ray Absorption Near Edge Structure
(XANES). The region of the spectrum from about 50 eV to 1000 eV is called Extended X-ray
Absorption Fine Structure (EXAFS).
In this work, XANES technique has been used extensively for the determination of charge states
and spin states of elements (Co, Mn and Te) present in the studied (CTO, CMTO, cobalt oxide
nanoparticles) samples. We have also proposed a method for estimating phase composition of
Pre edge
E0
Main edge
White
line
Fig 2.6. Schematic illustration of X-ray absorption spectrum.

30
multiphase (cobalt oxide nanoparticles) materials using XANES. In the following, we discuss
XANES technique and its measurement modes, in details.
K edge XANES spectrum is characterized by various features such as the main edge, the pre-
edge, the white line as well as the near edge provide detailed information on the oxidation state,
the coordination environment and the unoccupied DOS of the probed atom, respectively.
However, the information on the coordination environment is an average of various possible
coordinations. In XANES, we actually measure the probability that a deep-core electron will be
promoted to an unoccupied bound or continuum state by the absorption of an incident X-ray
photon. The absorption function measured by a core level absorption experiment is related to the
transition rate of the photoelectron from some initial deep core state, , to a final state above
the Fermi energy, . This transition rate is determined within the one electron and dipole
approximations by Fermi's Golden Rule,
(2.5)
In this equation, .r is the dipole operator for the incident electromagnetic wave on the system of
atoms and electrons. First term in equation 2.5 is a dipole matrix element of the initial core state
and the final state restricted to those final states, which are accessible by an incident photon of
frequency ω. XANES spectra can be divided into two main regions: the pre-edge and the main
edge.
Pre-edge region appears just below the main edge region and is caused by electronic transitions
to empty bound states (see Fig. 2.6). Transition probability in this region is controlled by dipolar
selection rules. For TM with partially empty d-orbitals, these features are visible owing to 1s→
3d (Δ L=2) transitions. The pre-edge features are relatively weak in intensity due to dipole-
forbidden nature of these transitions. But the probability of their occurrence is nonzero (in the
31
case of TM oxide), because partially filled d-orbitals can hybridize with oxygen / anions p-
orbitals. As a result, the intensity of these pre-edge features is weaker in comparison to
absorption edge and enhances as the ligand environment is perturbed strongly, improving
hybridization. In this way, pre-edge feature provides information of local geometry around the
absorber (such as number of neighbors and ligand geometry).119-121
In addition, one can probe the
spin state of that particular absorber on the basis of crystal field splitting (Δ), as discussed earlier
in chapter 1. This feature reflects in the pre edge spectra as a result in the lifting of d orbitals
degeneracy into eg and t2g orbitals due to crystal field of oxygen cage on TM. Several reports also
suggest the determination of charge states using the pre-edge feature,119-123
but mostly by main
edge as discussed below.
When the incident photon energy is just sufficient to cause excitation of a core electron of the
absorbing atom to empty states in continuum, there is a sharp increase in the absorption
coefficient in the edge region (see Fig. 2.6). This transition is identified as 1s-4p (in the case of
TM). However, it is still in debate about the accurate identification of this feature.124-128
Some of
the authors have proposed this transition as 1s→4s, while others as 1s→4p transition.124-128
It
may be mentioned here that, this identification does not change the interpretation of XANES
spectra. The position of the absorption edge is closely related to the charge (oxidation) state on
the absorbing metal ion. Higher the oxidation state of a metal, more is the positive charge (of the
nucleus) experienced by the electron and thus more energy is required to excite an electron from
an orbital. Hence, the position of the main edge blue shifts with increase in charge states. By
measuring the edge position one can extract the information about the average valence state of
the absorbing atom. The absorption edge is identified as the first inflection (maxima in first
derivative) point or middle of the edge jump.

32
The XAS data can be collected in several modes: Transmission, Fluorescence and Total Electron
yield (TEY), as shown in Fig. 2.7. The simplest and most popular mode is the transmission mode
(Fig. 2.7: A), wherein the sample is placed between two identical ionization chambers (IC1 and
IC2) to measure incident (I0) and transmitted (I) intensities (X-ray flux), and absorption
coefficient is obtained by the relation:
I / I0 = exp {−μ (E) × x} (2.6)
where, x is the sample thickness and E = hν. Normalized μ (hν) vs hν is called XAS spectrum. To
get the correct XAS spectrum, the edge jump in the spectrum is critical, which makes this mode
more applicable only for samples with critical thickness or absorption. However, this mode
cannot be used for samples, which are either too absorbing or too small in concentration. In such
cases, in the former case the transmitted signal is too small, whereas, in the later case the edge
jump is too weak, and cannot be relied upon.
For these samples, mainly two alternate modes, i) fluorescence and ii) total electron yield, are
used. In fluorescence mode (Fig. 2.7: B), one measures the incident flux and the fluorescence
X-ray’s intensity, , and absorption coefficient is obtained by the relation:
(2.7)
Fig. 2.7. Various modes of XANES measurements depending on the sample’s conditions and requirements. I
and IC in different subscript represent photon beam intensity and ionization chambers, respectively.
Tunable
monochromatic
SR X-ray
IC1 IC2

33
To measure the fluorescence, Vortex silicon drift detector (SDD) is used. Like other solid state
X-ray detectors, SDDs measure the energy of an incoming photon by the amount of ionization it
produces in the detector material. The major distinguishing feature of an SDD is the transversal
field generated by a series of ring electrodes that causes charge carriers to 'drift' (concept allows
significantly higher count rates) to a small collection electrode. Fluorescence mode is suitable for
highly absorbing samples. However, this mode cannot be used with low Z materials, because the
emitted photons lie in soft X-ray / VUV region, which gets absorb in air. To overcome this
problem, TEY detection mode (Fig. 2.7: C) is used. In TEY mode, we collect all the produced
electrons and measure the drain current from the sample. It is not suitable for the highly
insulating materials. Since probing depth of photoelectron is few nm, so experiments performed
in the TEY mode are surface sensitive. Much larger escape lengths of photons in fluorescence
mode, makes it more bulk sensitive as compared to TEY.
In this work, XANES measurements have been carried out at BL-12, both in transmission as well
fluorescence modes. Two ionization chambers (one for measuring incident flux and the second
for measuring transmitted flux) have been used for data collection in transmission mode. We
have also carried out some XANES measurements at Energy-Scanning EXAFS beamline (BL-
09), in order to probe Te- L edge and K edges. BL-09 uses three ionization chambers, one for
measuring incident flux, second for measuring transmitted flux and the third one for measuring
XAS spectrum of a reference metal foil for energy calibration, for data collection in transmission
mode. Rest of the experimental arrangement is the same as that of BL-12.
XANES measurements on the present (CTO, CMTO and cobalt oxide NPs) samples are carried
out in transmission mode (for Co K-edge) and fluorescence mode (for Mn K–edge) at room
temperature. The photon energy is calibrated by Co/Mn K-edge XANES spectra of standard

34
Co/Mn metal foils at 7709 / 6539 eV. Te L3-edge XANES spectra has been recorded in
transmission mode. In literature, average charge state of an ion has been obtained using XANES
by linear extrapolation of edge energies of standards with known charge states in a sample.
However, there is uncertainty in the slope of linear plot, in different reports. To stablish the
technique for the determination of charge state, we have taken a mixture of CoO and Co3O4
nanoparticles. The concentrations of the two phases were determined using XANES and also
using XRD. A close match between the concentrations obtained by the two techniques, gives us
confidence in average charge state obtained by XANES technique. The details of the proposed
method are given in section 2.11 of this chapter.
2.7. X-ray Photoelectron Spectroscopy
X-ray Photo-electron spectroscopy (XPS) is one of the most important methods to study the
electronic structure of molecules, solids and surfaces.129
In XPS, the kinetic energy distribution
of the emitted photoelectrons from surface (escape depth ~ 5 – 10 nm) is analyzed to study
electron binding energy (BE) and occupied electronic density of states of samples. The technique
is based on the photoelectric effect. When the sample is irradiated with mono-energetic photon
Fig. 2.8. (a) Instrumental setup of X-ray photoelectron spectroscopy (XPS) and (b) A typical XPS spectrum:
survey scan of Co3O4 nanoparticles. Inset shows enlarge part of the same.

35
of energy hν, it emits electrons from the sample surface. The kinetic energy of the emitted
electron is given by
K.E. = hν - B.E. - (2.8)
where, hν is the energy of the incident photon, B.E. is the binding energy of the emitted electron
and is the work function of the spectrometer.
Schematic diagram of XPS set up is shown in Fig. 2.8 (a). In the present work, Omicron XPS
system with monochromatic Al-Kα1 X-ray radiation (1486.6 eV, penetration depth ~ 1 - 10 nm)
has been used for XPS measurements.130
Survey scans are recorded over 0-1400 eV kinetic
energies and then detailed scans are measured to determine the oxidation state of the elements of
interest. In Fig. 2.8 (b), typical XPS spectrum for the cobalt oxide sample is presented in order to
understand the analysis procedure. The XPS spectra are the plot of number of emitted electrons
per energy interval versus their B.E. / kinetic energy. Since each element produces a
characteristic set of XPS peaks at characteristic binding energies, one can identify directly the
elements present on the surface of any material. These characteristic peaks of an element in the
spectra correspond to the electrons emitting from its core levels, viz., 1s, 2s, 2p, 3s, etc. In XPS,
the number of detected electrons corresponding to each characteristic peak is related to the
amount of that particular element present within the area (volume) of the sample being
irradiated. One can easily identify the chemical state of any element by knowing the exact peak
position, peak separation and other spectral features such as satellite feature etc. In this
measurement, ultra-high vacuum is required to increase the mean free path of the electrons
coming out of the sample surface and reaching the detector.
XANES and XPS are sensitive to bulk and surface of the samples, respectively. Information
obtained are also complementary in the sense that XPS gives information about occupied density

36
of states (DOS) below the Fermi level, whereas, XANES gives that for unoccupied DOS above
the Fermi level.
2.8. Scanning Electron Microscopy
Electron microscopy is a versatile characterization technique to study the morphology,
composition and texture of solid materials. Scanning electron microscopy (SEM) is used to
analyze the same in the length scale ranging from few nanometers to hundreds of microns. The
electrons are emitted from tungsten filament by thermionic emission process. Depending on the
source, two types of SEM are commonly used. We have used field effect SEM, where field
emission gun is used for emitting the electrons. The emitted electrons are accelerated by electric
field in the energy range 1 keV to 30 keV. The beam is allowed to pass through electromagnetic
lenses that focus it to form a nanometer sized electron probe. This probe scans on the specimen
for SEM characterization. As a result of beam-specimen interactions various signals are
produced. Secondary electrons are used for morphological characterization, back scattered
electrons give rise to z contrast and diffracted backscattered electrons are used to determine
crystal structures and orientations of minerals. X-rays emission spectra of constituent atoms are
used for elemental analysis-known as energy dispersive spectroscopy (EDS). The secondary
electron image is equivalent to an optical image in the reflected geometry and used extensively
for material characterization. In the present work, cobalt oxide NPs samples are characterized
using Phillips microscope (model XL30CP) to investigate the typical size of NP. For SEM
measurements, NPs are dispersed in methanol and are ultrasonicated for 15 mints. These
particles are dispersed dropwise on cleaned Si wafer. The samples are then dried under lamp
light. A 100 Å thick gold layer is deposited on the samples to nullify the charging effect while
performing SEM.

37
2.9. Dielectric Constant and pyroelectric current (Polarization)
Dielectric constant (ε) can be determined by placing the specimen between the parallel
conducting plates. When electric field is applied between the plates, the interactions are
described by the complex relative permittivity (ε*) of the material and is expressed
mathematically as:
ε* = ε′ + j ε′′ (2.9)
where: ε′ and ε′′ are dielectric constant and dielectric loss factor, respectively ( ).
ε′ = C / Co (2.10)
tan (δ) =ε′′ / ε′ (2.11)
and value of Co can be estimated by the formula.
Co =εo A / d (2.12)
Here ε0 is the permittivity of free space (8.854 × 10⁻¹²
Fm–1
) and A represents the area of the
parallel plates. The value of Co can be determined using equation 2.10. For the measurement, we
paint both surfaces of dielectric specimen with conductive silver paste and two copper wires are
connected at both surfaces of pellets to work as electrode. The two electrodes are connected to
QUADTech 1920 Precision LCR Meter via electrical connection of VTI (variable temperature
insert) of Cryogen free magnet system. We measured (only for CTO sample) dielectric constant
as a function of temperature and magnetic field. The response of dielectric constant in a magnetic
field is called magneto-dielectric (MD) and is defined through MD parameter as:
MD = {ε (T, H) – ε (T, 0)} / ε (T, 0) (2.13)
The schematic set up for pyroelectric current measurements is shown in Fig. 2.9. The electric
current is measured with sweeping temperature (called pyroelectric current) and expressed as
(2.14)
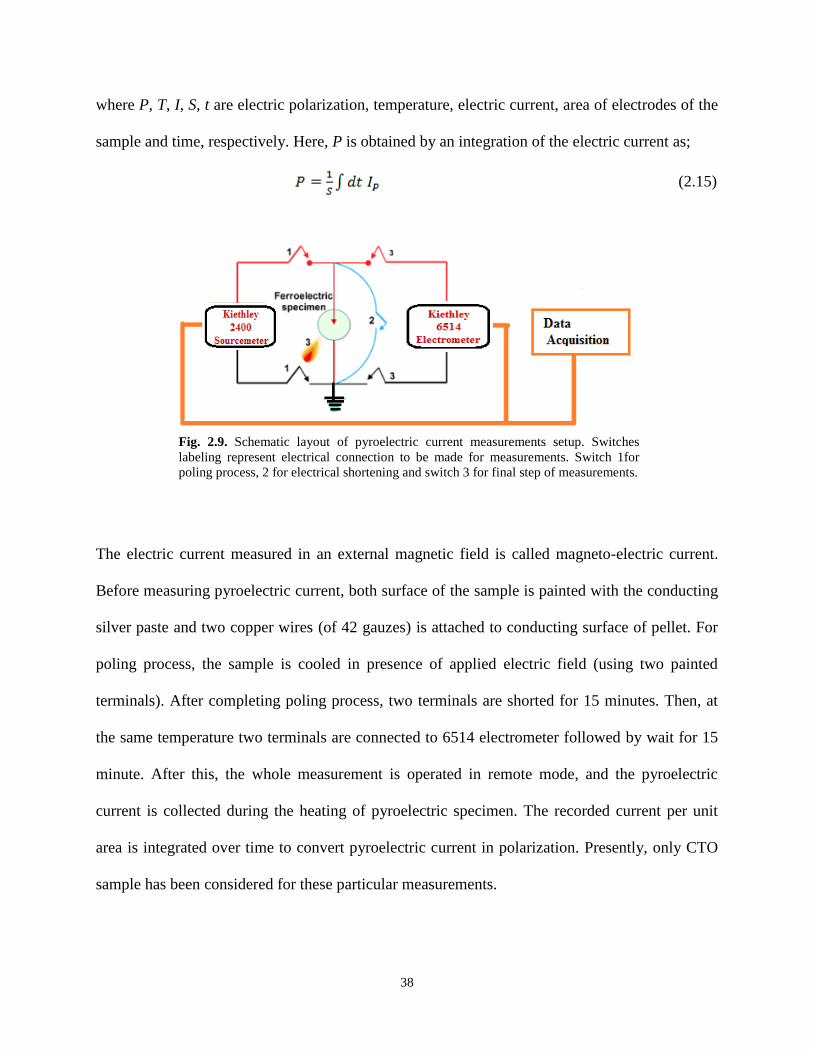
38
where P, T, I, S, t are electric polarization, temperature, electric current, area of electrodes of the
sample and time, respectively. Here, P is obtained by an integration of the electric current as;
(2.15)
The electric current measured in an external magnetic field is called magneto-electric current.
Before measuring pyroelectric current, both surface of the sample is painted with the conducting
silver paste and two copper wires (of 42 gauzes) is attached to conducting surface of pellet. For
poling process, the sample is cooled in presence of applied electric field (using two painted
terminals). After completing poling process, two terminals are shorted for 15 minutes. Then, at
the same temperature two terminals are connected to 6514 electrometer followed by wait for 15
minute. After this, the whole measurement is operated in remote mode, and the pyroelectric
current is collected during the heating of pyroelectric specimen. The recorded current per unit
area is integrated over time to convert pyroelectric current in polarization. Presently, only CTO
sample has been considered for these particular measurements.
Fig. 2.9. Schematic layout of pyroelectric current measurements setup. Switches
labeling represent electrical connection to be made for measurements. Switch 1for
poling process, 2 for electrical shortening and switch 3 for final step of measurements.

39
2.10. Magnetization Measurements
Magnetization measurements on the samples are performed using Vibrating Sample
Magnetometer (VSM) and Superconducting Quantum Interference Device (SQUID)
magnetometer (M/s. Quantum Design, model MPMS). The principle of magnetization
measurements in these systems is based on the Faraday's law of electromagnetic induction,
wherein, a voltage is induced in a conductor under a time-varying magnetic field. In VSM, on
the other hand, the sample vibrates in a homogeneous magnetic field with small fixed amplitude
and at a constant frequency (typically 20 - 40 Hz) against the stationary detection coils. This
motion of the sample induces voltage (emf) in the detection coils, magnitude (voltage signal) of
which depends on the magnetic moment of the sample, the amplitude and frequency of vibration
of the sample as well as the distance of the sample from the detection coils. Further, the use of
the lock-in technique provides accurate measurement of this voltage signal induced in the
detection coils. A schematic consisting of main components in a typical VSM is shown in Fig.
2.10.
Fig. 2.10. Schematic of vibrating sample magnetometer (VSM).
The detection coil assembly is wound in a second-order
gradiometer configuration with oppositely wound detection coils.

40
The SQUID magnetometer is used for the magnetization measurement with higher sensitivity. It
is basically a superconducting ring where two (in a dc-SQUID) Josephson junctions are inserted,
where the principle is the magnetic flux linked with it is periodic (in the units of magnetic flux
quantum, , where is the Planck's constant and is the electronic charge). For the
magnetization measurement, the sample is moved in detection / superconducting coil, which is
wound in a second-order gradiometer configuration (oppositely wound detection coils) in order
to reject the contributions other than those coming from the sample as shown in Fig. 2.11. A
superconducting magnet provides the magnetic field for the required measurements. The motion
of the sample through the detection coil assembly changes the flux linked with the same
detection coil assembly. Any change of flux linked with the detection coil assembly will result in
a persistent current to flow through the closed superconducting loop to keep the total flux
constant. The persistent current is proportional to the change in flux (linked with the detection
Fig. 2.11. Schematic of typical SQUID magnetometer used for magnetization
measurements. Detection coils, SQUID-input coils and the connecting wires are the parts
of a closed superconducting loop acting as a flux transformer, where the detection coils
are connected to the SQUID-input coil, which is inductively coupled to the SQUID sensor.

41
coil assembly) due to the motion of the sample. This persistent current produces a change in flux
(which is also linked with the SQUID sensor). In the closed superconducting loop, the voltage
signal across the SQUID sensor varies in accordance with the persistent current. One does not
measure the current but rather the voltage across the SQUID output in a SQUID magnetometer.
2.11. Demonstration of structural and spectroscopic techniques to study
oxides
Fig. 2.12. SEM images of three samples, (a) H1, (b) H2 and (c) H4.
a) as grown sample # H1
b) annealed at 300oC # H2
c) annealed at 800oC # H4
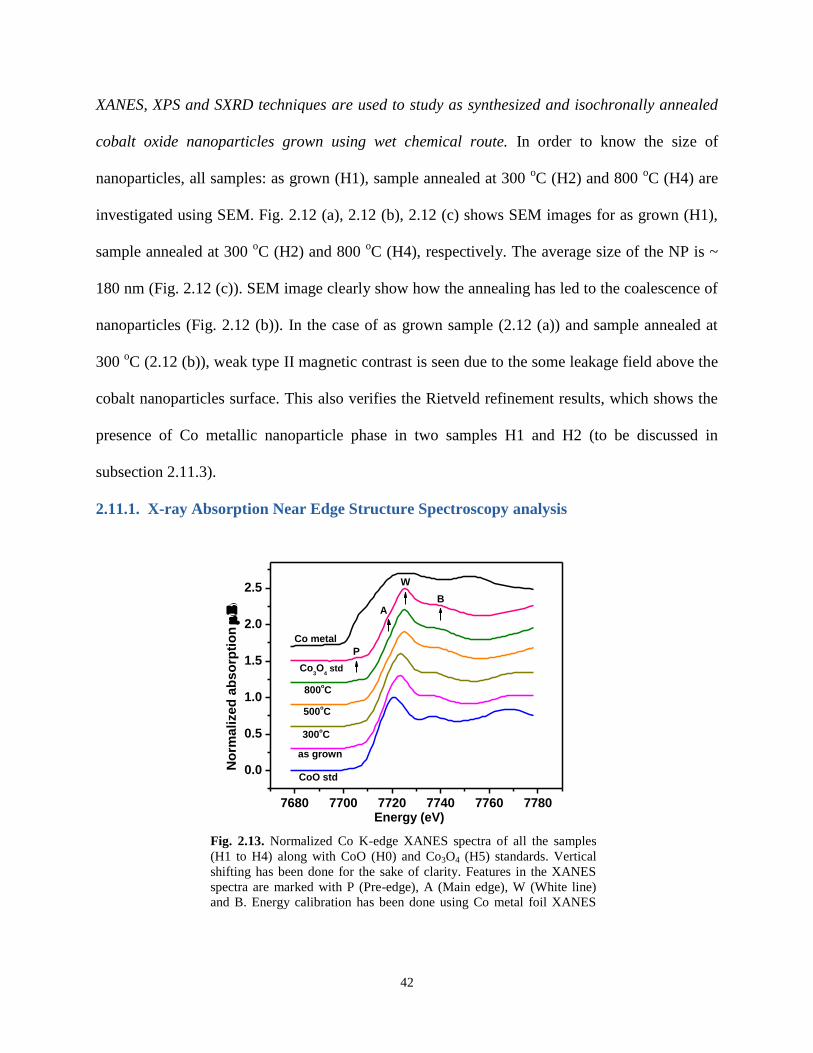
42
XANES, XPS and SXRD techniques are used to study as synthesized and isochronally annealed
cobalt oxide nanoparticles grown using wet chemical route. In order to know the size of
nanoparticles, all samples: as grown (H1), sample annealed at 300 oC (H2) and 800
oC (H4) are
investigated using SEM. Fig. 2.12 (a), 2.12 (b), 2.12 (c) shows SEM images for as grown (H1),
sample annealed at 300 oC (H2) and 800
oC (H4), respectively. The average size of the NP is ~
180 nm (Fig. 2.12 (c)). SEM image clearly show how the annealing has led to the coalescence of
nanoparticles (Fig. 2.12 (b)). In the case of as grown sample (2.12 (a)) and sample annealed at
300 oC (2.12 (b)), weak type II magnetic contrast is seen due to the some leakage field above the
cobalt nanoparticles surface. This also verifies the Rietveld refinement results, which shows the
presence of Co metallic nanoparticle phase in two samples H1 and H2 (to be discussed in
subsection 2.11.3).
2.11.1. X-ray Absorption Near Edge Structure Spectroscopy analysis
7680 7700 7720 7740 7760 7780
0.0
0.5
1.0
1.5
2.0
2.5
No
rmalized
ab
so
rpti
on
(
)
Energy (eV)
CoO std
as grown
300oC
500oC
800oC
Co3O
4 std
Co metal
P
A
W
B
Fig. 2.13. Normalized Co K-edge XANES spectra of all the samples
(H1 to H4) along with CoO (H0) and Co3O4 (H5) standards. Vertical
shifting has been done for the sake of clarity. Features in the XANES
spectra are marked with P (Pre-edge), A (Main edge), W (White line)
and B. Energy calibration has been done using Co metal foil XANES
spectra.

43
We have analyzed as grown and isochronally annealed cobalt oxide NP samples using XANES
spectroscopy. Generally, XANES115
measurements (where absorption edge is being probed) are
performed to study oxidation state, local surroundings and electronic states of specific metal site.
However, in this work, XANES measurements (at Co K edge) on all the samples have been
performed to investigate the composition of mixed phases of cobalt oxide. Fig. 2.13 shows the
normalized Co K-edge XANES spectra of samples H1 to H4 along with the two standard
samples CoO (H0) and Co3O4 (H5) with known oxidation states of Co. As shown in Fig. 2.13,
XANES spectrum may be divided into four regions, namely, the pre edge (marked ‘P’), the main
edge (marked ‘A’), white line (marked ‘W’) and the extended edge region (marked ‘B’). All
these regions correspond to different transition energies observed for that particular element in
the compound. The pre edge corresponds to 1s→3d, a dipole forbidden (quadrupole) transition,
is allowed because of favored co-ordination environment of the absorbing atom. The main edge
is attributed to 1s→4s monopole transition, whereas the white line corresponds to dipole allowed
1s→4p transition.115
As discussed in earlier chapters, the notation of the main edge feature has
some debates.124-130
Although, identification of the feature in the XANES spectra does not alter
the overall conclusion of the analysis, demonstrated further in this section.105
Main edge (rising
edge) gives information about the oxidation state of the absorbing atom in the sample. This edge
position shifts when the effective number of positive charges i.e. oxidation state changes
resulting from 1s core hole shielding effects. In a sample with mixed oxidation state, the main
edge is located in between the edge positions of the two. Using Linear Combination Fitting
(LCF), which is based on the proposed empirical linear combination formula, one can
quantitatively estimate the concentrations of the two phases in the sample.

44
For the same, a detailed qualitative as well as quantitative (using software Athena)105
XANES
analysis has been done. For the analysis, we have used XANES spectra of two standard samples
CoO and Co3O4 along with Co metal foil to calibrate the photon energy (Fig. 2.13). Quantitative
phase composition analysis has been done using LCF method. The position of main edge in
XANES spectra for all the samples has been determined by the energy corresponding to ~ 0.5
absorption in the normalized XANES spectra. From Fig. 2.13, XANES spectrum of sample H0
(CoO) shows a minor pre edge peak, which signifies octahedral configuration of O around Co in
agreement with literature. On the other hand, significant pre edge peak is observed for standard
sample H5 (Co3O4) and is attributed to tetrahedral configuration of O around Co. This makes
dipole forbidden 1s→3d (quadrupole) transition possible with the mixing of O 2p and Co 3d
orbitals. In our samples, a visible pre edge feature for sample H1 is observed (Fig. 2.13). The
intensity of the pre edge becomes more prominent with the increase in the annealing temperature
indicating larger tetrahedral component. In addition, for the samples H1 to H4, the energy
Fig. 2.14. Demonstration that the identification of features in XANES
spectra does not alter the conclusion of the analysis, wherein variations
of transition energies as a function of cobalt oxides NP samples have
been shown. Numbers in the X axis represent H0 to H5.
0 1 2 3 4 5
7705
7710
7715
7720
7725
7705
7710
7715
7720
7725
En
erg
y (
eV
)
Samples
1s-3d
1s-4s
1s-4p

45
positions of the main edge peak (marked A, Fig. 2.13) shifts towards higher energies with the
increase in the annealing temperature. Both these observations indicate increase in average
oxidation state with the increase in annealing temperature. Increase in the average oxidation state
clearly indicates the increase in Co3O4 phase.
We have summarized and plotted the energy positions of 1s→3d, 1s→4s and 1s→4p transitions
for all the samples H0 to H5 in Fig. 2.14. For the two standard oxides, the main edge transition
energy for Co3O4 is blue shifted ~ 3.7 eV as compared to CoO. The main edge energies of the NP
samples H1 to H3 are found to be intermediate between the two standard oxide samples, whereas
that of sample H4 is the same as that of Co3O4. This indicates mixed phase behavior of samples
H1 to H3. Further, white line positions for the standard samples indicate that Co3O4 peak is also
7700 7722 7744 7766 7700 7722 7744 7766
7700 7722 7744 77667700 7722 7744 7766
No
rma
lized
ab
so
rpti
on
(
)
As grown:H1
300oC:H2
500oC:H3
Energy (eV)
Energy (eV)
800oC:H4
Fig. 2.15. Linear Combination Fitting (LCF) for all the samples H1 to H4 using cobalt
K-edge XANES spectra. Raw data points are shown by black (+) and solid lines (red)
denote LCF fit to the data. Fractions of standards CoO (shown by blue dash dot) and
Co3O4 (shown by magenta dash) are used for LCF.
46
blue shifted (~ 4.9 eV) with respect to the CoO. Feature marked as B (extended edge region)
occurs due to the surrounding environment of the absorbing atom. This feature is similar for the
samples H3, H4 and H5 suggesting almost similar kind of surrounding environments for sample
H3 and H4 as compared to standard H5. Whereas, the same feature for sample H0 is quite sharp.
This indicates different kind of environment for Coin the sample H0 as compared to samples H3,
H4. This feature for samples H1 and H2 is intermediate. Based on above analysis, we find that as
grown sample together with sample annealed at 300 oC are in the mixed phases of CoO and
Co3O4. The demonstration that the identification of features in XANES spectra does not alter the
conclusion of the analysis can be seen in Fig. 2.14, wherein variations of transition (1s→3d,
1s→4s and 1s→4p) energies as a function of cobalt oxides NP samples indicate almost similar
behaviour. All these observations indicate that annealing at higher temperatures lead to the
transformation of CoO to Co3O4 phase.105
To confirm the above qualitative results, quantitative phase composition analysis using LCF
method on XANES data has been done. LCF works on least square fit algorithm and use the
XANES spectra of selected standards to determine the composition of an unknown sample. The
basic principle of this method is based on the additive nature of absorption from each chemical
state or species in the samples. LCF method fits the unknown sample as a linear combination of
standards according to their valance states. Here, the pure phase of CoO (H0) and Co3O4 (H5)
are used as standards. The normalized μ (E) data obtained for all the samples have been fitted by
the linear combination of the normalized μ (E) data of standard samples. The experimental data
and the best fit obtained are presented in Fig. 2.15. The goodness-of-fit is judged by Residual
and Chi-square value. Percentages of phases in as grown and annealed samples are obtained
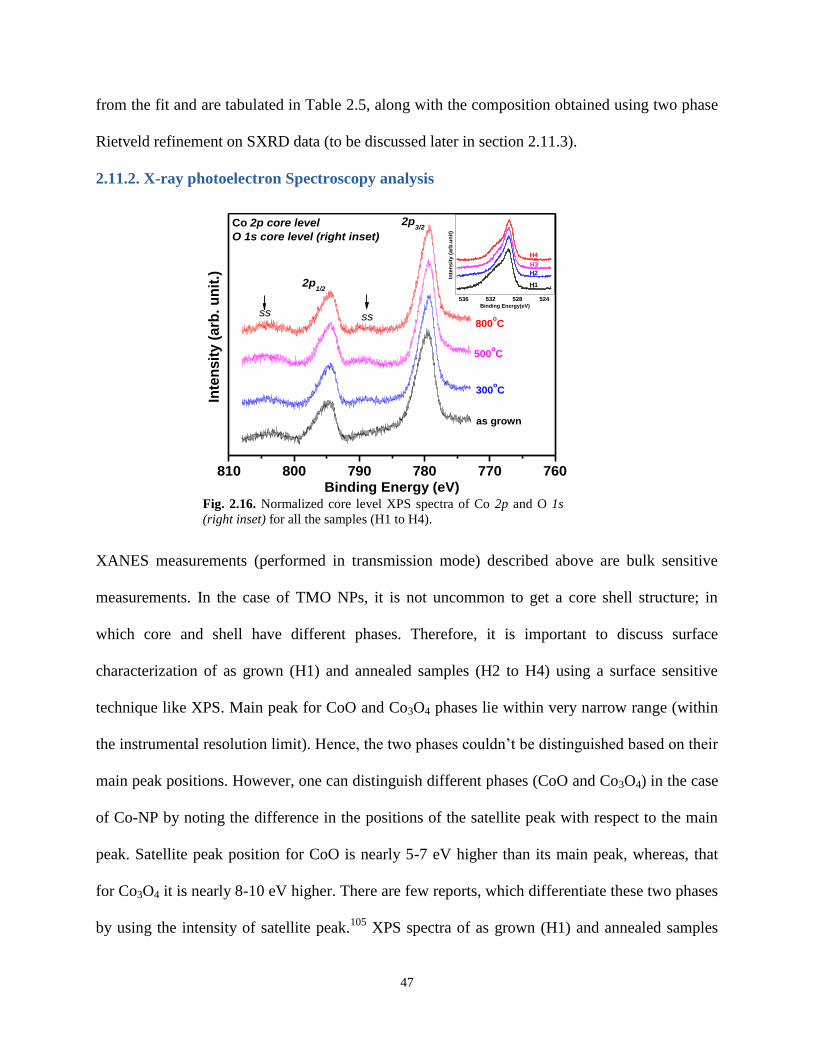
47
from the fit and are tabulated in Table 2.5, along with the composition obtained using two phase
Rietveld refinement on SXRD data (to be discussed later in section 2.11.3).
2.11.2. X-ray photoelectron Spectroscopy analysis
XANES measurements (performed in transmission mode) described above are bulk sensitive
measurements. In the case of TMO NPs, it is not uncommon to get a core shell structure; in
which core and shell have different phases. Therefore, it is important to discuss surface
characterization of as grown (H1) and annealed samples (H2 to H4) using a surface sensitive
technique like XPS. Main peak for CoO and Co3O4 phases lie within very narrow range (within
the instrumental resolution limit). Hence, the two phases couldn’t be distinguished based on their
main peak positions. However, one can distinguish different phases (CoO and Co3O4) in the case
of Co-NP by noting the difference in the positions of the satellite peak with respect to the main
peak. Satellite peak position for CoO is nearly 5-7 eV higher than its main peak, whereas, that
for Co3O4 it is nearly 8-10 eV higher. There are few reports, which differentiate these two phases
by using the intensity of satellite peak.105
XPS spectra of as grown (H1) and annealed samples
810 800 790 780 770 760
536 532 528 524
H4
H2
H3
Inte
ns
ity
(a
rb.u
nit
)
Binding Energy(eV)
H1
ss
2p3/2
300oC
500oC
800oC
Inte
ns
ity
(a
rb.
un
it.)
Binding Energy (eV)
as grown
2p1/2
ss
Co 2p core level
O 1s core level (right inset)
Fig. 2.16. Normalized core level XPS spectra of Co 2p and O 1s
(right inset) for all the samples (H1 to H4).

48
(H2 to H4) are shown for Co 2p edge (Fig. 2.16) and O 1s edge (inset in the Fig. 2.16),
respectively. Peak analyses are carried out using carbon peak at 284.6 eV as reference. Co 2p
spectra for as grown sample (H1) show Co 2p1/2
and Co 2p3/2
main peaks at 795.2 eV and 779.9
eV, respectively with broad satellite peaks. Occurrence of broad satellite peak may be because of
superposition of 2 or 3 peaks, to be discussed further. Binding energies (BE) of both the main
peaks are red shifted by ~ 0.4 eV with increase in the annealing temperatures (samples H2 to
H4). Further, separation between the satellite and the main peak positions increases with the
increase in annealing temperature. No shake-up satellite peaks (in between the two main peaks)
for as grown samples (H1) is observed indicating Co3+
in octahedral cage on the surface of NPs.
Whereas, annealed samples show clear but subdued satellite peaks. The satellite peak for Co
2p1/2
and Co 2p3/2
peaks are shifted by (9.3 ± 0.1) eV and (10.2 ± 0.1) eV, respectively from their
main peaks for sample H4. Further, the values of the peak shift increases slightly with the
increase in annealing temperature. This clearly indicates that the concentration of Co3O4 phase
increases with increase in annealing temperature. These results are in agreement with XANES
results. The separation between the main and the satellite peaks (about 10 eV) are slightly higher
than the values (8.5 eV (p1/2
) compared to 8.8 eV (p3/2
)) reported for bulk/thin film/epitaxial
Co3O4. Satellite peaks are attributed to crystal field splitting for Co2+
3d7 energy states in
tetrahedral crystal field environment. We believe that this is a significant result because it shows
larger crystal field spitting for NPs compared to that in the bulk. The separation between Co 2p1/2
and Co 2p3/2
main peaks lie within 15.3 ± 0.1 eV (not shown) for all the samples H1 to H4. This
suggests that the spin-orbit multiplet separation is not sensitive to ionic valence state of cobalt in
the cobalt oxides.

49
Oxygen (O) 1s peaks for samples H2 to H4 are almost same at 529.3 ± 0.1 eV (Fig. 2.17). Based
on O 1s binding energy, we rule out any appreciable charging effect in our data and no
manipulation in the energy axis has been done to nullify charging effect. Following the earlier
observations,129-131
the photoelectron spectral features of O1s peak at ~ 529.3 ± 0.1eV for the
sample H4, may indicates the presence of Co3O4 phase, in agreement with the XANES result.
Analyses of O 1s core level XPS peak for all samples are carried out after removing the Shirley
background using XPSPEAK 4.1. Further, minimum numbers of Gaussian-Lorentzian peaks are
used to account the XPS spectra. Oxide peak corresponds to 529.3 ± 0.1 eV position for all the
samples (H1 to H4). The second peak observed at ~ 531.6 eV is attributed to the adsorbed
hydroxyl group.129-131
This peak shifts to slightly higher value in position and lower value in
FWHM on annealing (H2 to H4). The position (FWHM) values are: 530.6 eV (2.4) for H2, 530.8
eV (2.2) for H3 and 531.1 eV (2.0) for H4 and 531.1 eV (3.1) for as grown (H1) sample. Fits for
536 534 532 530 528 526 536 534 532 530 528 526
536 534 532 530 528 526536 534 532 530 528 526
III
Inte
ns
ity
(a
rb.
un
its
)
O 1s_as grown
O 1s_300 oC
I
II
II
I
Binding Energy (eV)
O 1s_500 oC
III
Binding Energy (eV)
O 1s_800 oC
Fig. 2.17. Oxygen 1s XPS spectra of cobalt oxide nanoparticle samples H1 to
H4 fitted with Shirley background and two Lorentzian-Gaussian peaks (I, II).

50
samples H1 to H4 are shown in Fig. 2.17. The intensity ratios (area under the peak) of the peak I
and peak II are 0.81 (H1), 1.13 (H2), 1.39 (H3) and 2.65 (H4). Based on our analysis105
, we have
inferred that concentration of Co3O4 increases and adsorbed hydroxyl group decreases with the
increase in annealing temperature, in agreement with XANES result.
2.11.3. Synchrotron X-ray diffraction analysis
In subsection 2.11.1, we have applied XANES technique to estimates the phase concentration of
a mixed phase of CoO and Co3O4; for the first time. A straight forward way of estimating the
phase composition is Rietveld refinement on SXRD data. We describe the SXRD data analysis in
the following, in an attempt to estimate the phase concentration of CoO and Co3O4 phases and its
comparison with those obtained from XANES data. Fig. 2.18 shows the observed experimental
data for H1 to H4. Initially, two phase (CoO and Co3O4) Rietveld refinement for all the samples
(H1 to H4) have been done. Composition, unit cell parameters, Wyckoff positions and peak
profile parameters etc. have been used as the refinable parameters. The crystal symmetries are
10 15 20 25 30 35 40
H4
H3
H2
Inte
ns
ity
(a
rb.
un
it)
2 theta (deg)
H1
Fig. 2.18. Synchrotron X-Ray diffraction patterns recorded at room
temperature from cobalt oxide nanoparticle samples (H1 to H4).
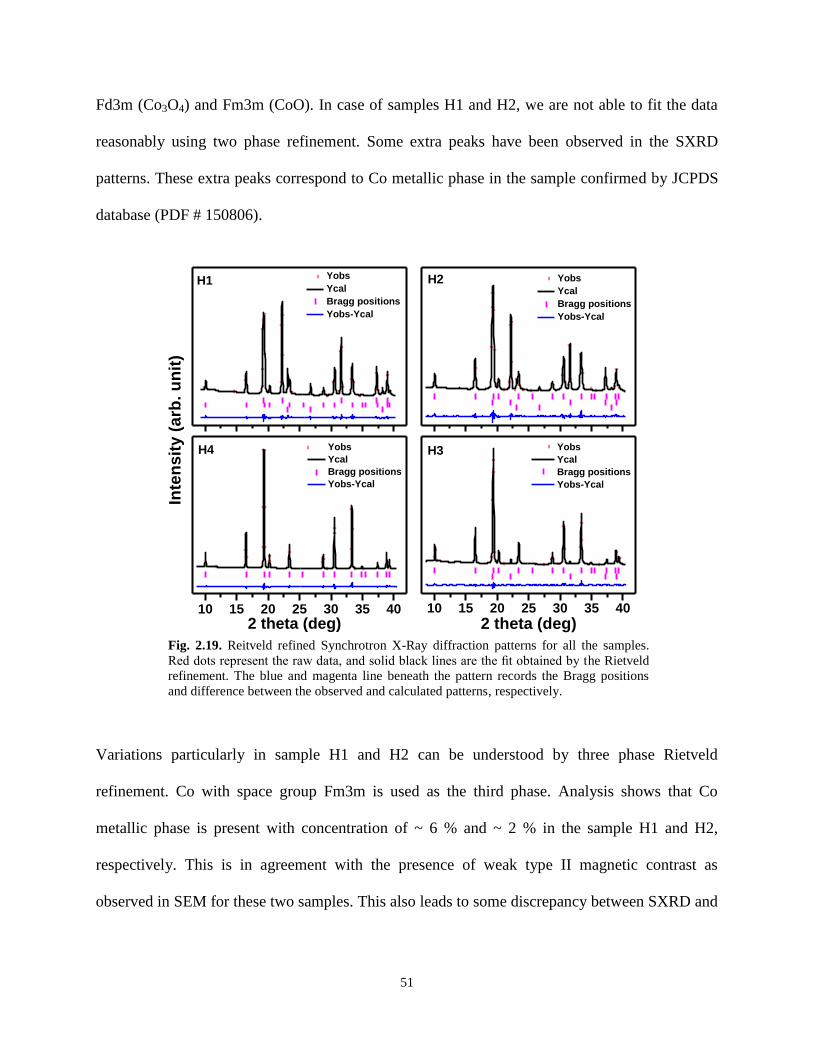
51
Fd3m (Co3O4) and Fm3m (CoO). In case of samples H1 and H2, we are not able to fit the data
reasonably using two phase refinement. Some extra peaks have been observed in the SXRD
patterns. These extra peaks correspond to Co metallic phase in the sample confirmed by JCPDS
database (PDF # 150806).
Variations particularly in sample H1 and H2 can be understood by three phase Rietveld
refinement. Co with space group Fm3m is used as the third phase. Analysis shows that Co
metallic phase is present with concentration of ~ 6 % and ~ 2 % in the sample H1 and H2,
respectively. This is in agreement with the presence of weak type II magnetic contrast as
observed in SEM for these two samples. This also leads to some discrepancy between SXRD and
Fig. 2.19. Reitveld refined Synchrotron X-Ray diffraction patterns for all the samples.
Red dots represent the raw data, and solid black lines are the fit obtained by the Rietveld
refinement. The blue and magenta line beneath the pattern records the Bragg positions
and difference between the observed and calculated patterns, respectively.
10 15 20 25 30 35 40 10 15 20 25 30 35 40
Yobs
Ycal
Bragg positions
Yobs-Ycal
H1
Yobs
Ycal
Bragg positions
Yobs-Ycal
H2
Inte
ns
ity
(a
rb.
un
it)
2 theta (deg)
Yobs
Ycal
Bragg positions
Yobs-Ycal
H4
2 theta (deg)
Yobs
Ycal
Bragg positions
Yobs-Ycal
H3

52
XANES results for these two samples. Two phase Rietveld refined data for H3 and H4 and three
phase Rietveld refined data H1 and H2 are shown in Fig. 2.19.
Phase compositions for all the samples obtained from Rietveld analysis suggest that as grown
sample (H1) and sample annealed at 300 oC (H2) are in mixed phase of Co, CoO, and Co3O4. For
samples H3 and H4, we have found that CoO phase oxidized to Co3O4 in agreement with
XANES results. Rietveld refinement results for all the samples are summarized in Table 2.5
along with the phase concentration obtained from XANES analysis. We find reasonably good
agreement (within 4 %) between the compositions obtained from SXRD and XANES analysis.
It is important to note that a sharp jump of Co3O4 concentration is observed for sample annealed
at 500 oC compared to 300
oC (Table 2.5). This may be because oxidation of Co metallic phase
to CoO or Co3O4 is a two step process. First step corresponds to transition from Co to CoO and
in the second step CoO transforms to Co3O4. Atomic structural changes and diffusion processes
during the chemical transformation of Co to CoO and then to Co3O4 has also been reported. CoO
Table 2.5. Phase compositions obtained from Rietveld refinement on SXRD data and LCF
on XANES data of cobalt oxide nanoparticles samples H1 to H4 are tabulated, along with
refined cell parameters.
Sample
No.
Annealing
Temp (oC)
Phases
present
Composition obtained Cell
parameter
(Å)
XRD XANES
H1 As grown CoO 43.59 46.3 4.2502(3)
Co3O4 49.56 53.7 8.0635(2)
H2 300 oC CoO 33.16 35.9 4.2528(1)
Co3O4 65.16 64.1 8.0686(2)
H3 500 oC CoO 3.20 3.7 4.2561(4)
Co3O4 96.80 96.3 8.0697(3)
H4 800 oC CoO 0.0 0.0 N. A.
Co3O4 100 100 8.0761(3)

53
stabilizes via O in-diffusion by an indirect exchange mechanism through interstitial O and
vacancies of certain type of Co sites from Co metallic NP phase. For Co3O4, outward diffusion of
Co is faster than the inward diffusion of O. It is also reported that even different phases of CoO
(rocksalt or wurtzite) transform to spinel phase of Co3O4 in air during the oxidation with
retention of the original crystal morphology. High temperature annealing improves the
crystalline quality of NPs due to the rearrangement of cobalt cations and oxygen anions of CoO
to the spinel Co3O4 phase. The phase compositions obtained through XANES data are compared
with those obtained from Rietveld analysis on SXRD data. These values are found to be in good
agreement.
Herein, quantitative phase compositions using Rietveld refinement (SXRD) and LCF (XANES)
have been obtained. Both the methods are based on least square fit algorithm and require prior
knowledge of the phases that exist in the sample. In the case of Rietveld refinement, one needs
complete crystallographic information i.e. Wyckoff positions (fractional coordinates) of atom in
the unit cell and unit cell parameters etc. for the corresponding phases. However, in case of LCF,
only standard XANES spectra of all the phases are required. These standard spectra are used as
combination for an unknown sample to obtain the composition depending on their chemical
state. Therefore, XANES can also be a useful technique for quantitative phase composition
analysis in the case of samples having complex structure, for which crystallographic information
are not readily available.
To summarize, we have studied cobalt oxide NPs using synchrotron source. Qualitative analysis
of XANES spectra of as grown and isochronally annealed samples of cobalt oxide NPs show that
as grown together with sample annealed at 300 oC are in mixed phase of CoO and Co3O4. The
phase concentration of Co3O4 increases with increase in annealing temperature at ambient.

54
Quantitative XANES analysis shows Co3O4 phase concentration increases from ~ 49 % in
sample H1 to 100 % for sample H4. These results have been corroborated with Rietveld analysis
on SXRD data. The composition obtained from the two methods is in reasonably good
agreement. This suggests that XANES can be effectively used to study composition of mixed
phase samples. XPS results indicate the increase in Co3O4 phase concentration on the surface, in
agreement with the phase concentration for the bulk. This analysis established our procedure for
the determination of average charge state of a sample, using XANES main edge analysis. We
have used this procedure in chapters 3 and 4 for the determination of average charge state of Co
and Mn in various samples.

Chapter 3
Cobalt Tellurate
(Co3TeO6; CTO)


55
As discussed in chapter 1 about the multiferroicity, their types and the possible mechanism for
the development of the same, in detail. Besides understanding the mechanism of coupling of
various ferroic orders and enhancing the strength of coupling among these ferroic orders,
designing and finding new MF materials are some of the main concerns of MF researchers. CTO
seems to have interesting characteristics, because of multiple magnetic transitions and type II
multiferrocity.75-82
The first Neutron diffraction study76
on CTO indicates first-order multi-k
phase transitions,82
with a sequence of three AFM phases (below 30 K) accompanied by ME
effect.76,82
The in-commensurate (IC) AFM structure emerges at TN1 = 26 K (denoted as phase I),
whereas the two commensurate AFM phases appear at 21 K (phase II) and TN2 = 17.4 K (phase
III).76,82
In literature, there is disagreement in number of magnetic transitions in CTO. For
example, Hudl et al.,77
and Her et al.,78
report two magnetic transitions (~ 18 K and 26 K) in
addition to transitions at 34 K and 16 K, which the authors have not discussed. Wang et al.,80
on
the other hand, not only report IC nature of all these magnetic transitions but also discuss a total
of four transitions at 26 K, 20 K, 18 K, and 16 K below 30 K. They also point out the probable
origin of two magnetic transitions (26 K and 18 K) by studying chains in two Co-Co networks.80
Theoretical Landau free energy analysis taking care of irreducible representations and
monoclinic magnetic group symmetry suggests a strong magneto-elastic effect.82
The evolution
of phase II from phase I take place through strong first order transition.82
This would also
suggest a possible change in interatomic spacing causing first order transition, which may in turn
influence exchange energy from phase I to phase II.82
A phenomenological explanation to the
ME behaviour of CTO is also developed by Harris et al.81
In contrast, there is a smooth second
order transition from phase II to phase III indicating no significant discontinuity in structural
parameters.76,80,82
As theoretically explained,82
monoclinic symmetry of phase III (2´) permits

56
spontaneous weak magnetization as well as spontaneous polarization, where the later is due to a
single spontaneous zero magnetic field polarization component Py.82
Although, there exist plenty
of works on CTO but there are certain issues, which are still under debate. In the following,
detailed earlier observations along with issues and attempts have been described.
To get a clue on large variations in reported multiple magnetic transitions (seen in low magnetic
fields), as discussed above, we synthesize ceramic CTO by two step calcination route (section
3.1). This also provides the explanation for the origin of its lowest symmetry structure in A3TeO6
family. We believe that synthesis process plays an important role in deciding the magnetic
behavior in CTO.. To the best of our knowledge, none of the reports discuss growth reaction
mechanism of CTO. Implication of this route of synthesis is discussed in section 3.2 and section
3.3 of this chapter.
From structural point view, synthesized single crystal CTO crystallizes in monoclinic (C2/c)
crystal symmetry, in which only Co2+
ions occupy five different crystallographic positions as
tetra, square-pyramidal and three octahedral sites.74,77-80
Co atoms possess very large variations
in the typical Co-O bond distances; the smallest bond distances are almost half of the largest one.
These informations, however, carries some basic concerns, which need to be addressed.85-87
For
example, such a variety of polyhedral configurations and large variations in Co-O bond lengths
of an ion with only 2+ valence, is difficult to comprehend. One possible way to arrange such a
polyhedral mixing with a range of bond lengths is through mixed valence ions. However, to the
best of our knowledge, no reports exist signifying the presence of Co3+
in (either single crystal or
ceramic) CTO. In section 3.2 of this chapter, we have estimated average valence state of Co
CTO, using XANES measurements. We have also commented on the spin state of Co ions in our
ceramic CTO.94

57
Further, as mentioned above: a) Understanding low magnetic field magnetic behaviour, remains
a challenging issue.77-80
To the best of our knowledge, there is no experimental report which
shows all the five magnetic transitions (~ 34 K, 26 K, 21 K, 17.4 K and 16 K) in a particular
ceramic or single crystal CTO,77-80
b) In CTO, spontaneous weak magnetization as well as
spontaneous polarization have been theoretically predicted.82
, The former (weak magnetization)
has been experimentally shown with domain structure observed in Second Harmonic Generation
measurements.82
The experimental observation of the spontaneous zero field polarization has not
been reported. 77-80,82
c) Moreover, the magneto-dielectric effect,38-39
an important observation in
the field of type II multiferroics, which deals generally with the response of dielectric constant
under magnetic field indicating possible spin-phonon coupling,99
which has not been observed in
any of the earlier reports.
Attempts to solve these issues (discussed above in a), b) and c)), have been carried out in section
3.3 of this chapter.95-96
. Our combined dielectric, pyroelectric and polarization measurements
suggest that the ground state of CTO may possess spontaneous symmetry breaking even in the
absence of magnetic field.95

58
3.1. Two step solid state synthesis of ceramic CTO
This section describes the synthesis and structural investigations of CTO in order to probe the
crystallographic aspects. A two-step solid state reaction route has been proposed to synthesize
monophasic CTO. HR-SXRD has been used to optimize the synthesis parameters and ascertain
purity in synthesized CTO. XPS study near Co K and Te L-edge show the possibility of mixed
oxidation states of Co (i.e. Co2+
and Co3+
) and +6 valence state of Te, respectively.
3.1.1. Introduction
Mainly two routes of synthesis of CTO have been reported in literature: hydrothermal and solid
state reaction.75,77-80,83-86,
Different starting reagents like CoO, Co(NO3)2.H2O, TeO2, Te(OH)6,
H2TeO4.2H2O and TeO3 have been used to synthesize CTO. Thermal decomposition of cobalt
(II) tellurate-molybdates (CoTeMoO6 and Co4TeMo3O16) and amorphous cobalt tellurate
(CoH4TeO6.Co(OH)2) around 900 K for 24 hrs in air, have also been reported for CTO
synthesis.84
Different second phases like Co5TeO8 and CoTeO3 are generally present in the
calcined powder and in ceramic, which have been related to the loss of TeO2 oxide during
calcination/sintering at high temperature.83,85
Thermographic study of the CoO-TeO2 system,
heated in air, has revealed no oxidation to tellurate, unlike that observed in NiO-TeO2 system.84
Synthesis of CTO single crystal has also been reported by Beckar et al.86
using 3:2:1 ratio of
Co3O4 : TeO2 : CoCl2 (or PtCl2) through transport reaction method.
It is known that CTO decomposes spontaneously above 1100 K to CoO and TeO2, however,
direct synthesis of the single phase CTO from CoO and TeO2 below 1100 K seems difficult83
.
Till now, no reaction mechanism has been proposed for the formation of CTO. Here we present,
synthesis of single phase CTO using two step calcination and solid state reactions between

59
Co3O4 and TeO2 in air at T < 1100 K. The sample, prepared using two step synthesis route, has
been found to show better multi-ferroic properties.86-88
3.1.2. Results and Discussion
3.1.2.1. Growth and its structural correlation
Co3TeO6 is synthesized using conventional solid state reaction route using Co3O4 and TeO2
reactants, as described briefly in chapter 2. Fig. 3.1 shows SXRD pattern of Co3O4, TeO2 and
their mixture at room temperature, in order to verify the purity of ingredients.
Fig. 3.2 shows thermos-gravimetric curves (Differential thermal analysis (DTA) and
Thermogravimetric analysis (TGA)). The thermo-gravimetric curves are divided in to four
regions marked as I, II, III and IV, as shown in Fig. 3.2. The region I, between 300 oC to 600
oC
with a maximum (in DTA) around 480 0C (broad peak), corresponds to the oxidation of Te
4+ to
Te6+
.
Co3O4 + 3 TeO2 + O2 → 3 CoTeO4 (3.1)
8 12 16 20 24 28 32
Inte
ns
ity
(a
rb.
un
its
)
2 theta (deg)
TeO2
Co3O4
Co3O
4 + TeO
2
= 0.94931 Å
Fig. 3.1. SXRD patterns of TeO2, Co3O4 and their mixture at room temperature.

60
This oxidation reaction suggests weight gain during the calcination process, because of the
incorporation of “O2” in the chemical reaction (see Eq. 3.1). This oxidation and the
corresponding weight gain depicted by broad hump in DTA and a jump in the first derivative of
TGA are shown in the main panel and the inset of Fig. 3.2, respectively. The region II around
730 oC and the region III around 800
oC are due to intermediate phase formation and its
transformation into the CTO phase, respectively. The temperature of region II also matches with
melting point of TeO2. In the last region IV above 900 oC, decomposition of the CTO phase into
CoO and TeO2 phase has been reported.83
Taking a clue from the thermal analysis of the reactants, we have chosen the temperatures for
different steps of calcination. The reactant powders (Co3O4 and TeO2) in stoichiometric amount
are mixed thoroughly using ball mill and calcined at different temperatures ranging from 500 oC
to 800 oC for a fixed time (12 hrs). Different calcined powders are labeled as CTO500, CTO600,
0 200 400 600 800 1000 1200
-150
-120
-90
-60
-30
0
30
300 400 500 600 700
1st
derivative of TGA
T (0C)
DT
A (V)
TG
A (g
)
Temperture (OC)
8.5k
9.0k
9.5k
10.0k
10.5k
11.0k
11.5k
IV
III
II
I
Fig. 3.2. DTA/TGA curves for Co3O4 + TeO2 mixture. Thermal analysis
indicates four step reaction assigned as I, II, III and IV. Inset shows 1st
derivative of TGA curve showing anomaly at ~500 oC (region I).

61
CTO650, CTO700 and CTO800. Fig. 3.3 compares SXRD patterns of the CTO500 and CTO600.
Initiation of a new phase formation (marked by “●” in Fig. 3.3) has been noticed for CTO500
sample, which becomes major phase, when the mixed powder is calcined at 600oC (CTO600).
All other extra peaks have been assigned to un-reacted starting reagents Co3O4 and TeO2.
Rietveld refinement of CTO600 powder reveals the formation of an intermediate phase
(CoTeO4), which is of monoclinic (P21/c: a~ 6.192(3) Å, b~ 4.671(3) Å, c~5.567(2) Å,
β~124.07(2)0) symmetry.
131 CoTeO4 has also been reported previously with cubic space group
[PDF#32-0318]. However, we get monoclinic CoTeO4 phase with P21/c symmetry, which is
closer to the final compound CTO (C2/c).
Along with the intermediate phase (CoTeO4), commencement of the CTO phase has also been
noticed in CTO600 sample. Concentration of the CTO phase has been found to increase with
further increase in the calcination temperatures. Fig. 3.4 compares the SXRD patterns of
Fig. 3.3. The stoichiometric ground mixture at 500 oC indicates initialization
of a new phase (CoTeO4) along with unreacted initial reactants. Calcination at
600 oC, on the other hand, corresponds to CoTeO4 as major phase.
1.2 1.6 2.0 2.4 2.8 3.2
Inte
ns
ity
(a
rb.
un
its
)
q (Å-1)
+ Co3O
4
TeO2
CoTeO4
Stoichiometric ground
CTO500 oC
CTO600 oC

62
CTO650, CTO700 and CTO800 samples. Phase analysis reveals that concentration of the CTO
phase increases along with decrease in the CoTeO4 phase with increasing calcination
temperature. No peak corresponding to the CoTeO4 phase has been noticed in CTO800 sample.
Although, few extra peaks corresponding to Co3O4 have also been found in the SXRD pattern of
CTO800 sample, which may be due to the loss of TeO2.
Based on the thermal and phase analysis, following reaction mechanism is suggested for the
synthesis of CTO using Co3O4 and TeO2 in the temperature regime 500 oC to 900
oC. We
observed that it is not a single step process and complete via an intermediate CoTeO4 phase, as
can be seen in equation 3.1. This reaction mechanism is consistent with the oxidation and the
corresponding weight gain observed in the thermal analysis plot, shown in Fig. 3.2. Here, the
reactant TeO2 and the intermediate product CoTeO4 exibit +4 and +6 oxidation statesof Te,
respectively.131
As can be seen in Fig. 3.3, the major unreacted phases i.e. Co3O4 may further
reactswith CoTeO4 to form Co3TeO6 in the followng reactions:
Fig. 3.4. Stabilization of CoTeO4 along with various other phases, as we
increase the calcinations temperature from 600 oC to 800
oC, all these
phases are get converted to the final compound Co3TeO6.
1.2 1.5 1.8 2.1 2.4 2.7
500 550 600 650 700 750 800
0
30
60
90
Temperature (0C)
Co
TeO
4
0
30
60
90C
o3T
eO
6
650
0C
700 0C
800 0C
Inte
nsit
y (
arb
. u
nit
s)
q (Å-1)
12 hrs
TeO2
+ Co3O
4
CoTeO4
+

63
3 CoTeO4 + 2 Co3O4→ 3 Co3TeO6 + O2 (3.2)
3 CoTeO4 + 3 Co3O4 + TeO2 → 4 Co3TeO6 + O2 (3.3)
2 Co3TeO6 → 6 CoO + 2 TeO2 + O2 (3.4)
Fig. 3.5. No change in TeO2 phase at 700 oC for 2 hrs calcinations,
which excludes the possibilities of TeO3, Te2O5 or Te4O9 leading to
the stability against it’s oxidation or reduction.
20 30 40 50 60 70
700 oC for 2 hrs
Inte
nsit
y (
arb
. u
nit
s)
2 theta (deg)
TeO2 - 25
oC
TeO2 - 700 oC
Fig. 3.6. SXRD data showing no change in Co3O4 phase at 700 0C for
2 hrs calcinations. This excludes the possibilities of their oxidizing
agents like CoO and Co2O3 during calcinations process.
20 30 40 50 60
(3 3
1)
(51
1)
(3 3
1)
(4 0
0)
(2 2
2)
(31
1)
(2 2
0)
Inte
ns
ity
(a
rb.
un
its
)
2 theta(deg)
Co3O
4 - 25 oC
Co3O
4 - 700
oC
700 o
C for 2 hrs
(11
1)

64
One can see from Figs. 3.3 and Fig. 3.4 that as we increase the calcination temperature from 500
0C to 800
0C, the intermediate CoTeO4 phase is transformed to the final CTO product following
equations 3.2 and 3.3. Equation 3.4 indicates decomposition of CTO above 900 0C. Inset of Fig.
3.4 shows variation of concentration of CoTeO4 and Co3TeO6 phases against the calcination
temperature.
The following equation has been used to calculate the concentrations of CoTeO4/Co3TeO6
phases.
% of CoTeO4/Co3TeO6 = I CoTeO4/Co3TeO6/(ICoTeO4 + ICo3TeO6) x 100 (3.5)
It has been reported that TeO2 oxidizes to TeO3, Te2O5 or Te4O9 around ~ 650 0C - 700
0C.
132-133
However, no such oxidation of TeO2 has been observed, when TeO2 is heated at 700 0C for 2 hrs.
Similarly, no dissociation of Co3O4 into CoO and Co2O3 has been observed when the starting
reagent Co3O4 is heated to 700 oC, as shown in Fig. 3.5 and Fig. 3.6. All these analyses are based
on the single step synthesis in which the mixed ground powder is heated directly to the designed
temperatures. Due to the large amount of unreacted Co3O4 phase in the last calcination stage (i.e.
800 oC), double step synthesis has also been attempted. We have chosen a two step process
because TeO2 is volatile (melting temperature ~ 730 0C) and hence we get unreacted Co3O4
phase along with CTO, in one step synthesis process. In two step process, mixed powder is first
heated at 700 oC for 10-12 hours and then again at 800
oC for 20-24 hrs with intermittent mixing
and grinding. We have optimized first step by taking several calcination temperatures ranging
between 600 - 700 0C, wherein we find no change in the final product. Fig. 3.7 compares SXRD
pattern of CTO synthesized using single and double step synthesis. One can clearly see that
lower concentration of Co3O4 phase is present in the double step synthesis compared to that for
the single step. To get a clue about how much Co3O4 phase is present in the two step CTO

65
synthesis, percentage of the Co3O4 phase has been calculated from the peak intensity of the most
intense peaks in SXRD patterns.
Percentage of Co3O4 phase is calculated using the equation
% of Co3O4 phase = (3.6)
where, and represent the highest peak intensities (area under the peak)
corresponding to the Co3O4 and CTO phases, respectively. The above equation reveals a
concentration of ~ 15-18 % and ~ 8-10 % Co3O4 phase for single and two step syntheses,
respectively.
It is important to note that the calcination temperature (800 oC) is in between the melting points
of TeO2 (735 oC) and Co3O4 (890
oC), and the presence of the Co3O4 is due to the TeO2 loss
during calcination. To compensate the loss of TeO2, extra amount of the TeO2 has been added in
the stoichiometric amount of Co3O4 and TeO2 powders. However, several reports have pointed
Fig. 3.7. Shows comparisons of single step and double step calcinations.
1.5 2.0 2.5 3.0 3.5
2.50 2.55 2.60 2.65
q (Å-1
)
2.196 2.205 2.214
q-1
1.344 1.372
q-1
Single step
double step
- - - - Co3O
4
(111)
(220)
Inte
ns
ity
(a
rb. u
nit
s)
q-1
(311)

66
out the ambiguity in phase concentrations (due to different atomic numbers and symmetry of
phases concern) calculated using the equation 3.7. Therefore, in order to know the accurate value
of the Co3O4 phase concentration and hence the exact additional amount of TeO2, Rietveld
refinement on SXRD data has been performed.
Fig. 3.8 (a) shows HR-SXRD patterns of the samples obtained using stoichiometric (blue colour)
and non- stoichiometric (red colour) reactant ratios. One can clearly see that more Co3O4 phase
is present in stoichiometric sample as compared to the non-stoichiometric one, as shown in Fig.
3.8 (b) (zoom part). Fig. 3.8 (c) shows two phases Rietveld refined SXRD patterns along with
experimental and difference profiles. The same quantitative phase composition analysis using
Rietveld Refinement on SXRD patterns gives ~ 4±1 % Co3O4 phase in the case of the two step
CTO synthesis. To balance this loss in TeO2, extra TeO2 has been added to complete the
reaction. Fig. 3.8 compares the SXRD patterns of CTO, synthesized using stoichiometric
(without extra TeO2) and non-stoichiometric (with extra TeO2) reactants. We find that, single
phase CTO is synthesized when ~ 5 % TeO2 extra amount has been added in the stoichiometric
amount of Co3O4 and TeO2. The mixed powder is first calcined in air at 700 oC for 10 hrs and
then again at 800 oC for 24 hrs with intermediate mixing and drying steps. The above process has
been repeated number of times to confirm the single phase CTO formation.
Detailed Rietveld analysis of the SXRD pattern reveals that monophasic CTO stabilized in
monoclinic symmetry (space group: C2/c), in agreement with reported results on single crystal as
well as powder CTO.74-80
The simulated pattern is shown in Fig. 3.9 along with observed
experimental data. The room temperature refined crystallographic parameters obtained from the
Rietveld refinement are summarized in Tables 3.1, 3.2 and 3.3. Insight into the structure of CTO
(which contains five Co, two Te and nine O) indicates that crystallographically distinct Co

67
‘
a
Fig. 3.8. (a) A high resolution Synchrotron X-ray Diffraction measurement is used to probe
monophasic CTO, (b) shows the corresponding impurity, which is Co3O4, (c) Rietveld
refinement is used to estimate concentration of impure Co3O4 phase.
Inte
nsi
ty (
arb
. u
nit
s)
2 3 4 5 6 7
CTO
differencereflections
— cal
q (Å-1
)
oooo exp
Co3O4
0.94709 Åc
1.2 1.5 1.8 2.1 2.4 2.7
(2
2 0
)
stochiometric
off-stochiometric
Co3O
4
(3 1
1)
(1 1
1)
2.14 2.16 2.18 2.20 2.22
2.55 2.58 2.61
1.32 1.35 1.38
q (Å-1)
b

68
Fig. 3.10. Polyhedral view (a-b plane) of the ceramic CTO clearly signifies the
octahedral, pentahedral and tetrahedral sites of Co, and octahedral sites of Te.
cations occupy 4e and 8f Wyckoff positions, Te 4b and 8f and all O 8f sites (Table 3.1). Both
the Te ions occupy crystallographically different octahedral sites, whereas five Co ions occupy
tetra, penta and octahedral sites as shown in Fig. 3.10.
Fig. 3.9. Simulated and observed Synchrotron X-Ray Diffraction patterns
recorded at room temperature (λ = 0.9480 Ǻ) for ceramic CTO sample.
12 16 20 24 28 32 36
Inte
ns
ity
(a
rb.
un
it)
2(deg)
Yobs
Ycal
Difference pattern
Bragg Reflections
Co3TeO6
Space group: C2/c, 0.37
Rp=3.53%, Rwp=4.31%,
Rb=7.13%

69
Table 3.1. Rietveld refined lattice parameters and atomic positions of Co3TeO6 at room temperature.
with a monoclinic symmetry of space group C2/c (Z = 12).
Co3TeO6, T = 300 K, χ2 = 0.9983; Rwp = 4.31 %; Rp = 3.53 %
a = 14.8061(5) Å, b = 8.8406(3) Å, c = 10.3455(4) Å, α = 90◦, β = 94.819(2)
◦, γ = 90
◦
Atom
Co1
Co2
Co3
Co4
Co5
Te1
Te2
O1
O2
O3
O4
O5
O6
O7
O8
O9
X
0.50000
0.86205 (54)
0.52150 (47)
0.66890 (59)
0.79836 (48)
0.00000
0.66057 (23)
0.92542 (17)
0.58297 (19)
0.60095 (14)
0.75549 (15)
0.92948 (13)
0.58142 (14)
0.91876 (17)
0.73502 (18)
0.73099 (16)
Y
-0.18278 (13)
-0.35713 (87)
-0.65706 (92)
-0.29106 (70)
-0.36092 (97)
0.50000
-0.49882 (59)
-0.37621 (27)
-0.33389 (40)
-0.63851 (38)
-0.54947 (30)
-0.52162 (42)
-0.48910 (35)
-0.70289 (28)
-0.34141 (43)
-0.63739 (38)
Z
0.25000
0.23163 (65)
0.04342 (54)
0.05467 (67)
0.57172 (67)
0.50000
0.30046 (25)
0.55492 (20)
0.20480 (24)
0.19532 (22)
0.67236 (21)
0.34490 (18)
0.43810 (18)
0.55967 (24)
0.39372 (19)
0.38105 (21)
Table. 3.2. Comparison of lattice parameters of present ceramic CTO with the earlier reports.
Sr. No. a (Å) b (Å) c(Å) β (o) Ref.
1 14.8167 8.8509 10.3631 94.90 [13]
2 14.8014 8.8379 10.3421 94.83 [15]
3 14.7526 8.8139 10.3117 94.905 [17]
4 14.8113 8.8394 10.3589 94.834 [18]
5 14.8061 8.8406 10.3455 94.819 Our results
[22,26,27]

70
Rietveld refinement and corresponding results of valence bond sum calculations have also been
done on SXRD data. The refined lattice parameters a = 14.8061(5) Å, b= 8.8406(3) Å, c=
10.3455(4) Å, β=94.819(2)ο, show marginal differences from earlier reports
74-80and are tabulated
in Table 3.2. An important difference in our study lies in the typical bond distances of Co-O and
Te-O (Table 3.3). In our samples, the Co-O bond lengths vary from 1.84 Å - 2.87 Å as compared
to 1.97 Å - 2.93 Å reported earlier.74,76
In addition, the typical bond distance of Te-O ranges
from 1.70 Å to 2.28 Å (in slightly more distorted TeO6 octahedra) as compared to that reported
earlier from 1.88Å - 1.98Å.74,76
Among others, one of the possible causes for such a significant
Table 3.3. Most relevant interatomic distances (Å) in our ceramic CTO in comparison to the single crystal
CTO.
Present CTO Becker et al.
74 Present CTO Becker et al.,
74
Co-O Co-O Co-O Co-O
Co5-O1 = 1.90824(7)
Co5-O4 = 2.09208(6)
Co5-O8 = 1.90407(6)
Co5-O8 = 2.00313(7)
1.966 (4)
1.929 (3)
1.988 (4)
1.998 (3)
Co4-O4 = 2.20532(5)
Co4-O7 = 1.85511(5)
Co4-O2 = 2.12176(6)
Co4-O9 = 2.18023(7)
Co4-O4 = 2.20532(5)
Co4-O7 = 1.85511(5)
2.131 (3)
2.282 (3)
1.982 (3)
2.389 (3)
2.065 (3)
2.030 (3)
Co3-O1 = 2.35588(6)
Co3-O3 = 1.89226(6)
Co3-O6 = 1.95899(5)
Co3-O6 = 2.14707(6)
Co3-O7 = 1.97877(5)
2.078 (3)
1.936 (3)
2.050 (3)
2.032 (4)
2.212 (3)
Co1-O1 = 2.274(8)×2
Co1-O2 = 1.9095(5)×2
Co1-O5 = 2.0614(5)×2
2.161 (3)
2.054 (3)
2.023 (3)
Co2-O3 = 2.11851(7)
Co2-O4 = 1.83667(5)
Co2-O5 = 2.07096(5)
1.963 (3)
2.008 (3)
2.023 (3)
Co2-O7 = 2.09548(7)
Co2-O8 = 2.63144(8)
Co2-O9 = 2.60085(6)
2.087 (4)
2.538 (4)
2.419 (3)
Te-O Te-O Te-O Te-O
Te1-O1=1.68841(4)×2
Te1-O5=1.85095(6)×2
Te1-O7=2.27385(6)×2
1.951 (3)
1.908 (3)
1.938 (3)
Te2-O2=2.05289(5)
Te2-O3=1.82849(5)
Te2-O4=2.05713(6)
1.927 (3)
1.910 (3)
1.969 (3)
Te2-O6=1.91313(6) 1.927 (4) Te2-O8=1.96798(5)
Te2-O9=1.77183(4)
1.933 (3)
1.925 (3)

71
difference in average bond distances (Co-O and Te-O), may be due to mixed valence of Co (to
be discussed in next sub-section of this section). Structural analysis and visualization of structure
have been done using VESTA software134
on Rietveld refined structure. In addition, we also
observe contraction of CoO6 octahedra, CoO5 pentahedra and/or CoO4 tetrahedra as compared
to the earlier reports. This might result in the shortening of the Co-O bond lengths accompanied
by the variations in Te-O bond lengths.
We have also characterized the final single phase CTO sample using XPS, in order to get clue on
average oxidation states of cations, as discussed below.
3.1.2.2. X-ray photoelectron spectroscopic analysis
In XPS129
(details are given in chapter 2), main peak positions, peak separation and positions of
other special features like shake up satellites, are used for the estimation of charge state of ions.
Fig. 3.11. (a) Normalized core level XPS spectra of Co 2p, satellite (ss) peaks nearby main peaks confirms
the mixed oxidation state of Co in CTO, (b) normalized core level XPS spectra of Te 3d, binding energy
587.3 eV and 576.8 eV positions of the main peaks confirm the +6 oxidation state of Te and (c) Oxygen 1s
XPS spectra CTO sample fitted with Shirley background and two Lorentzian-Gaussian peaks acquired with
Al Kα source.
800 795 790 785 780 775
ss
2p1/2
2p3/2
In
ten
sit
y (
arb
. u
nit
s)
Co 2p
ss4.65 eV
5.49 eV
590 585 580 575
3d3/2
Te 3d 3d5/2
534 532 530 528
II
I
O 1s
Binding Energy (eV)

72
Also, shake up satellite gives information on oxygen cage geometry around the transition metal.
Herein, we perform XPS measurements in order to check the oxidation states of Co and Te,
which may give clue on microstructural variations as higher valence cations have smaller ionic
radii. Figs. 3.11 (a), (b) and (c) show XPS spectra of prepared CTO sample for Co 2p, Te 3d and
O 1s edges.
The photoelectron spectral features of oxygen (O) 1s peak for CTO sample falls at 529.9 ± 0.1eV
(I: oxide peak and II: adsorbed hydroxyl group).103
This value is in agreement with the binding
energy given earlier,103,135-136
showing negligible charging effect in our sample. Co 2p spectrum
for CTO sample shows main Co 2p1/2
and Co 2p3/2
peaks at 780.1 eV and 795.8 eV, respectively,
with significant satellite peaks. By using only the main peak positions, one can’t probe
accurately; the exact valence state of Co in the samples.136
Satellite peak intensity along with
their binding energy positions may identify the Co valence state. Reported values of Co 2p
Sr. No.
2p3/2
Co 2p
ss
2p1/2
ss
Ref (No.)
1- Co2+
(O/T)
Co3+
(O)
780.5/780.7
779.6
786.4/789.5
---
796.3/796.0
794.5
803.0/804.5
----
[135-136]
[135-136]
2 780.05 784.70 795.80 801.29 CTO
Te 3d
3d5/2 3d3/2
1
2
3
576.8
576.6
576.87
--
--
--
587.2
587.0
587.18
--
--
--
[137]
[138]
CTO
Table 3.4. Binding energies (in eV) for Co 2p (2p1/2 and 2p3/2) and Te 3d reported in literature
along with our results. O/T denotes the octahedral and tetrahedral coordination, respectively.

73
binding energy and satellite peak positions are tabulated in Table 3.4 along with the
experimentally observed values for our sample.
The satellite peaks for Co 2p1/2
and Co 2p3/2
peaks are shifted by (4.6 ± 0.1) eV and (5.5 ± 0.1)
eV from their main peaks, respectively. Concerning the present case, only two ionic state of Co
(+2 and +3) are stable and the values of their satellite peaks are tabulated in Table 3.4. From this
table, one may see the mix valence behaviour of Co in the sample. The separation between Co
2p1/2
and Co 2 p3/2
main peaks is about 15.7 ± 0.1 eV for CTO samples, which is rather
insensitive to the valence state of Co. Therefore, spin-orbit multiplet separation cannot be used
for the identification of ionic valence state of cobalt in cobalt based compounds.124
Further, Te 3d peak position (FWHM) has been found to be at 576.8 (1.96) eV for 3d5/2
and at
587.2 (2.08) eV for 3d3/2
, with spin orbit separation of 10.2 eV. The peak separation of 10.2 eV
and no satellite peak indicate Te+6
.137-138
Table 3.4 compares peak positions of 3d peaks in CTO
sample with those for Te+6
complexes, reported in literature.. We have also compared the
binding energy position of Te+4
, which is not matching with our results indicating +6 charge state
of Te in our sample. XPS analysis so far indicates the possibility of mixed valence Co and +6
oxidation states of Te in CTO sample.
3.1.3. Conclusions
To summarize this section, ceramic Co3TeO6 is synthesized via conventional solid state reaction
route and possible reaction mechanism has been proposed. Off-stoichiometric Co3O4 and TeO2
and two step calcination in air leads to single phase CTO. CTO structure crystallizes in
monoclinic C2/c space group in agreement with earlier reports of single crystal as well as
ceramic CTO. Obtained structural parameters using Rietveld refinement shows slightly different
lattice parameters from those reported in literature. Corresponding bond valence sum

74
calculations support all the crystallographic information reported earlier for the single crystal
CTO. Noticeable differences between synthesized CTO and reported single crystal structures are
observed through the variations in the average bond distances. We find wider variations in bond
lengths of different Co and Te sites, which may be attributed to the mixed valence of Co in CTO.
The conjecture is supplemented qualitatively by XPS results. Quantitative confirmation has been
done using XANES measurements (to be discussed in section 3.2 of this chapter). Moreover,
synthesis in different (oxygen reduced) atmospheric conditions will also be discussed.

75
3.2. Observation of high-spin mixed oxidation state of cobalt in CTO
This section describes the observation of coexistence of mixed oxidation states of Co (Co3+
and
Co2+
) in our ceramic CTO. Co3+
and Co2+
ions are found to be in high spin states. XANES, high
field DC magnetization and first principles ab-initio calculations have been used to study charge
and spin states of Co in CTO. Finally, we have studied probable origin of Co3+
in CTO by
synthesizing CTO in different atmospheric conditions.
3.2.1. Introduction
In continuation of previous section, which shows the signature of Co3+
in our synthesized CTO, a
thorough study to investigate the possibility of additional charge state has been explored in this
section. XPS study on our single phasic CTO suggests that Co may be in mixed oxidation states
(Co3+
and Co2+
). However, literature suggests that only Co2+
ions occupy five different
crystallographic positions as tetra, square-pyramidal and three octahedral sites in single crystal as
well as ceramic CTO.74-80
Such polyhedral configurations with only one type of cations is
difficult to appreciate,87-89
and thus leave the possibility of mixed valence cations.87-89
An
interesting analogue is Co3O4 {i.e. (Co2+
)tet[Co23+
]octO4}, which possesses spatially
inhomogeneous magnetic moments via Co2+
in tetrahedral sites and Co3+
in octahedral sites.139
Due to the same, 3d electrons of Co ions experience different crystal fields, leading to different
electronic/spin configurations.139
The change in distribution of Co2+
/Co3+
caused by various
external sources like magnetic field, high pressure, temperature etc. have led to several other
phenomena like diffusive charge transfer and very large effective magnetic moment, which make
great interest in such systems.140-141
As CTO shows features similar to those of spinel compounds,
its low-temperature magnetic properties are likely to be very interesting, as observed in several
reports75-82
. For example, Co3+
ions in octahedral coordinations prefer low spin state (S=0),

76
whereas the same may also show high spin state in same configuration as observed in several
other cases.139,142
It may be also noted that Co3+
may exist in octahedral, tetrahedral or
pentahedral site.143-144
As the strength of Hund's coupling and the crystal-field splitting are
comparable for Co based compounds, the spin state of the cobalt ions are highly dependent on
various factors like doping concentration, crystal structure, external magnetic field etc.145
For
example, magnetic field-induced spin-state transition state in Sr1−xYxCoO3−δ and a similar
temperature induced spin state transition in La2−xSrxCoO4 are linked to low-to-intermediate spin
(IS) and low-to-high spin (HS) state transitions of Co3+
, respectively.146-147
It is therefore important to investigate the charge and spin state of Co in our ceramic CTO, not
reported so far. For this, we have performed XANES and high field DC magnetization
measurements. The magnetization measurements combined with crystal field splitting obtained
from XANES pre-edge analysis have indicated additional support for our interesting
observations of mixed valence of Co (i.e. Co2+
and Co
3+), in our ceramic CTO. To ascertain the
same, first principles simulations have also been carried out. Such observation of Co3+
oxidation
state is a first step towards the experimental verification of some of the theoretical predications.82
For example, it is well known that the Co2+
-O-Co2+
network gives rise to AFM correlations
between Co ions through super-exchange interactions.77-80
Appearance of Co3+
ions in Co2+
-O-
Co2+
network can cause (a) structural distortion, (b) local FM interaction through double-
exchange, (c) weakening of effective magnetic interaction between the Co2+
ions and (d) in-
commensurate (IC) AFM ordering.139
For instance, a possible reason for the appearance of the
IC-AFM order in Co3O4 is considered to be local structural modulations due to change in
charge/spin state of Co ions.139
This may also result in the larger effective magnetic moment as
compared to that in single crystal (with only Co2+
). Through the present study, we show that the

77
existence of Co3+
and Co2+
in ceramic CTO does not diminish multiferroic property (to be
discussed in section 3.3 of this chapter) observed earlier in single crystal, but actually enhances
some of the observables.96
Structural analysis using Rietveld refinement on SXRD data leads to significant differences in
bond distances (Co-O and Te-O) as compared to reported results on single crystal samples (Table
3.3). Herein, Co-O bond lengths vary from 1.84 (1) Å - 2.87 (1) Å as compared to 1.97 Å - 2.93
Å reported earlier.74,76,80
Also, Te-O bond lengths range from 1.70 (1) Å to 2.28 (1) Å (in slightly
more distorted TeO6 octahedra, and shown in Fig. 3.12) as compared to that reported earlier
(1.88Å - 1.98Å). 74,76,80
One of the possible causes for such a significant difference in average
bond distances (Co-O and Te-O) may be due to the presence of Co3+
.148
It may so happen that
some of the Co sites are occupied by Co3+
instead of Co2+
, which may give rise to contraction of
CoO6 octahedra, CoO5 pentahedra and/or CoO4 tetrahedra.148
This might result in the
shortening of the Co-O bond lengths accompanied by the variations in Te-O bond lengths.
Fig. 3.12. Polyhedra of our ceramic CTO as compared to single crystal CTO show
marginal distortion in the corresponding CoO6/CoO5/CoO4 and TeO6 polyhedra leading
to shorter typical bond distances of Co/Te-O.

78
Experimental evidence for the observed micro-structural variations which are possibly due to the
presence of Co3+
in addition to Co2+
in ceramic CTO, has been presented using XANES
measurements. In the following, first we discuss XANES data in details followed by discussion
on magnetization and first principles studies.
3.2.2. Results and Discussion
3.2.2.1. X-ray Absorption Near Edge Structure Spectroscopy
XANES, discussed in chapter 2, is an element specific spectroscopic tool, which provides
information on oxidation state, local coordination around the absorbing atom and electronic
structure including hybridization effect of orbitals.115,146
Fig. 3.13 shows edge step normalized
XANES spectra of Co metal foil, CTO and cobalt oxide standards (for +2 and +3 oxidation
states).
A typical TM K-edge XANES spectrum provides clue about the chemical shift and the nature of
unoccupied density of states through the main (1s-4p) and pre (1s-3d) absorption edges,
Fig. 3.13. Edge step normalized Co K-edge XANES spectra of
CTO, Cobalt oxide standards (CoO and CoF3) and Co metal foil.
Co foil is used for photon energy calibration.
7704 7712 7720 7728 7736
Co2+
No
rma
lize
d A
bs
orp
tio
n
Energy (eV)
Co metal
CoO
CoF3
CTOCo3+
Co metal
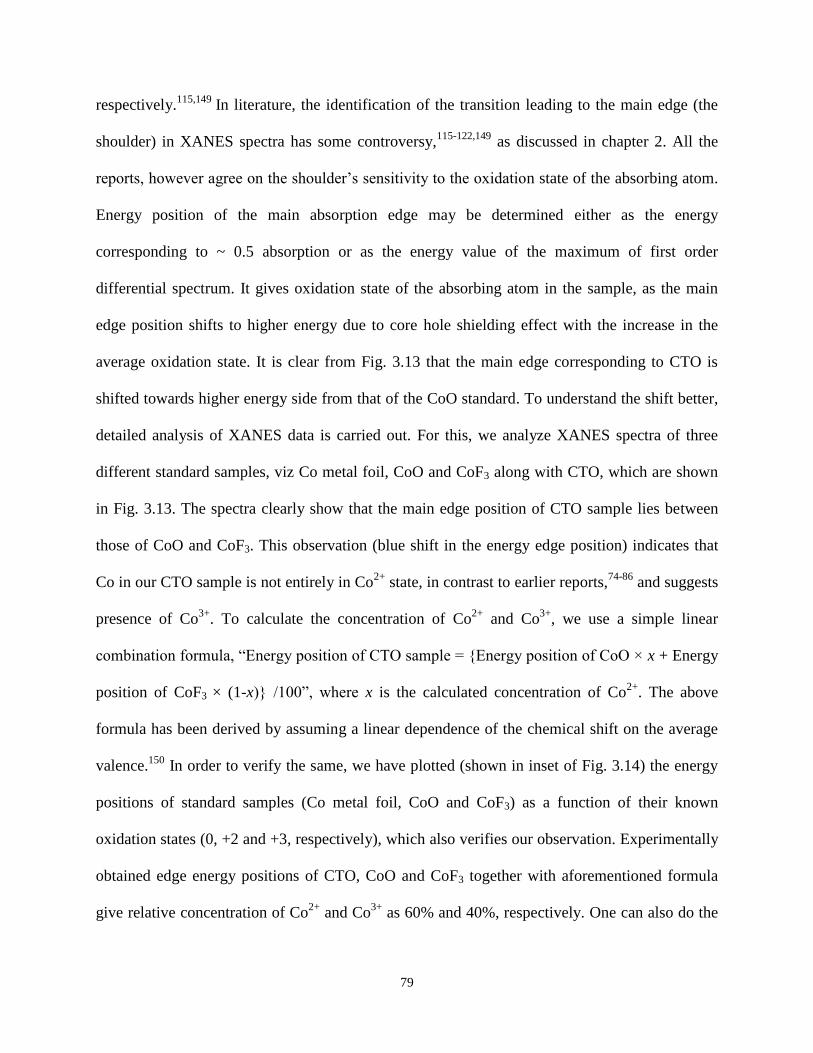
79
respectively.115,149
In literature, the identification of the transition leading to the main edge (the
shoulder) in XANES spectra has some controversy,115-122,149
as discussed in chapter 2. All the
reports, however agree on the shoulder’s sensitivity to the oxidation state of the absorbing atom.
Energy position of the main absorption edge may be determined either as the energy
corresponding to ~ 0.5 absorption or as the energy value of the maximum of first order
differential spectrum. It gives oxidation state of the absorbing atom in the sample, as the main
edge position shifts to higher energy due to core hole shielding effect with the increase in the
average oxidation state. It is clear from Fig. 3.13 that the main edge corresponding to CTO is
shifted towards higher energy side from that of the CoO standard. To understand the shift better,
detailed analysis of XANES data is carried out. For this, we analyze XANES spectra of three
different standard samples, viz Co metal foil, CoO and CoF3 along with CTO, which are shown
in Fig. 3.13. The spectra clearly show that the main edge position of CTO sample lies between
those of CoO and CoF3. This observation (blue shift in the energy edge position) indicates that
Co in our CTO sample is not entirely in Co2+
state, in contrast to earlier reports,74-86
and suggests
presence of Co3+
. To calculate the concentration of Co2+
and Co3+
, we use a simple linear
combination formula, “Energy position of CTO sample = {Energy position of CoO × x + Energy
position of CoF3 × (1-x)} /100”, where x is the calculated concentration of Co2+
. The above
formula has been derived by assuming a linear dependence of the chemical shift on the average
valence.150
In order to verify the same, we have plotted (shown in inset of Fig. 3.14) the energy
positions of standard samples (Co metal foil, CoO and CoF3) as a function of their known
oxidation states (0, +2 and +3, respectively), which also verifies our observation. Experimentally
obtained edge energy positions of CTO, CoO and CoF3 together with aforementioned formula
give relative concentration of Co2+
and Co3+
as 60% and 40%, respectively. One can also do the

80
same quantitative analysis by Linear Combination Fitting (LCF) on XANES data, using the
software Athena.151
Experimental data and the best LCF fit are presented in Fig. 3.14. LCF fit
also results Co2+
/Co3+
ratio in CTO to be ~ 60/40, in agreement with the value obtained from the
empirical formula used above.
4300 4320 4340 4360
No
rmalized
Ab
so
rpti
on
Energy (eV)
CTO
Te(+6)
Te(+4)
Fig. 3.15. Te L3 edge XANES spectra of CTO along with Te standards.
Fig. 3.14. LCF fit of ceramic CTO using CoO and CoF3 standard samples
(main panel) and inset shows linear dependence of oxidation states as a
function of energy obtained from derived formula.
7704 7712 7720 7728 7736
0.0
0.2
0.4
0.6
0.8
1.0
1.2
7710 7713 7716 7719
0.0
0.5
1.0
1.5
2.0
2.5
3.0
Av
era
ge v
ale
nc
y
Energy (eV)
Linear dependance
of Oxidation state
No
rma
lize
d A
bs
orp
tio
n
Energy (eV)
CTO:raw data
LCF fit
CoO
CoF3
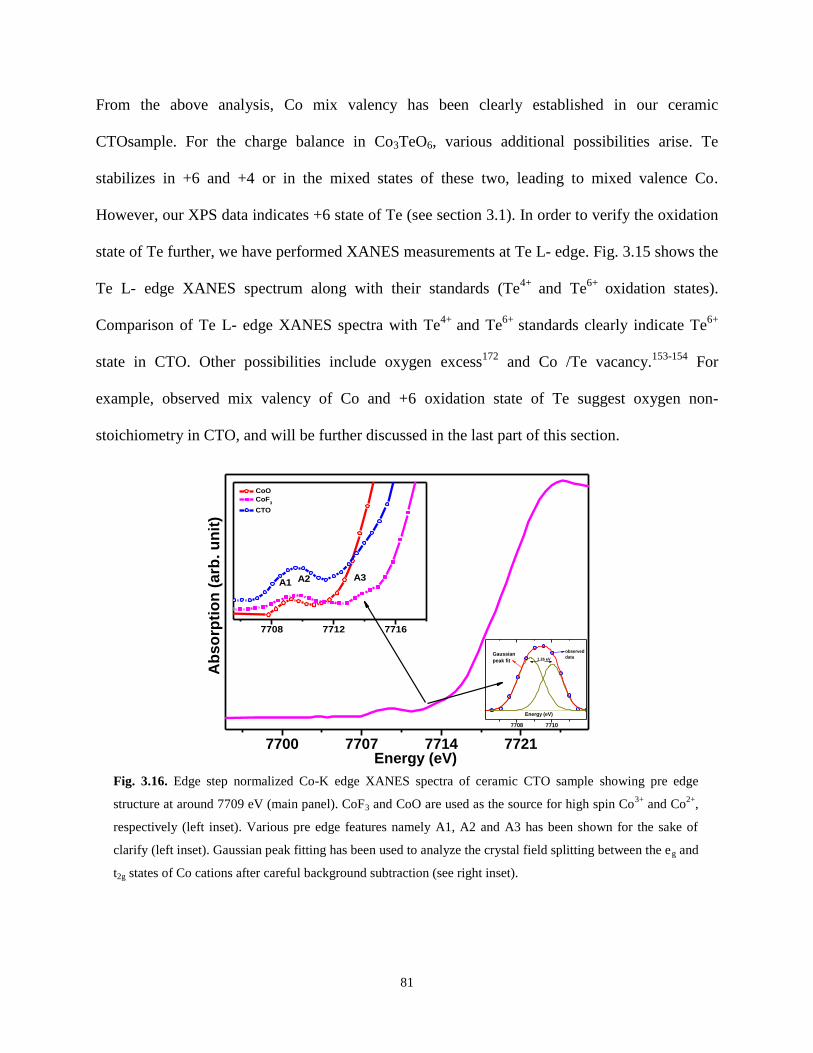
81
From the above analysis, Co mix valency has been clearly established in our ceramic
CTOsample. For the charge balance in Co3TeO6, various additional possibilities arise. Te
stabilizes in +6 and +4 or in the mixed states of these two, leading to mixed valence Co.
However, our XPS data indicates +6 state of Te (see section 3.1). In order to verify the oxidation
state of Te further, we have performed XANES measurements at Te L- edge. Fig. 3.15 shows the
Te L- edge XANES spectrum along with their standards (Te4+
and Te6+
oxidation states).
Comparison of Te L- edge XANES spectra with Te4+
and Te6+
standards clearly indicate Te6+
state in CTO. Other possibilities include oxygen excess172
and Co /Te vacancy.153-154
For
example, observed mix valency of Co and +6 oxidation state of Te suggest oxygen non-
stoichiometry in CTO, and will be further discussed in the last part of this section.
Fig. 3.16. Edge step normalized Co-K edge XANES spectra of ceramic CTO sample showing pre edge
structure at around 7709 eV (main panel). CoF3 and CoO are used as the source for high spin Co3+
and Co2+
,
respectively (left inset). Various pre edge features namely A1, A2 and A3 has been shown for the sake of
clarify (left inset). Gaussian peak fitting has been used to analyze the crystal field splitting between the eg and
t2g states of Co cations after careful background subtraction (see right inset).
7700 7707 7714 7721
7708 7710
Energy (eV)
1.26 eV
observed
dataGaussian
peak fit
7708 7712 7716
CoO
CoF3
CTO
A3A1 A2
Ab
so
rpti
on
(a
rb.
un
it)
Energy (eV)

82
In order to estimate the contribution of TM ions to the magnetic moment, we need to know the
charge state, spin state and orbital contribution of the ions. In the following, we estimate the spin
state of Co3+
using pre edge feature of XANES spectrum. In literature,75-80
it has been proposed
that Co2+
is in the high spin state. Followed by the observation of both Co2+
and Co3+
, we
speculate the possible spin state of the observed Co3+
through the pre-edge study of XANES
spectrum in our ceramic CTO. Figs. 3.16 (main panel and left inset) show the pre-edge structure
below the main absorption line at around 7718 eV. The pre edge spectrum exhibits several
features in the energy range 7708 eV to 7715 eV, denoted as A1, A2 and A3. Following earlier
reports,155-157
we ascribe A1 and A2 to the 1s - 3d transitions into t2g and eg states, respectively.
These transitions take place partly through direct quadrupolar transitions, and also a mixture of
dipolar transitions to d - p hybridized molecular orbitals of Co (3d) and O (2p). We find that the
crystal field splitting (the energy difference between the t2g and eg states) is of the order of 1.26
eV. This contradicts the possibility of low spin state of Co3+
in our sample, as in this case the
expected crystal field splitting would be around 2.3 eV.155-157
The observed splitting (~1.2 eV) in
our sample suggests high spin state of Co3+
. This splitting in the case of intermediate spin state of
Co3+
has been reported to be 2.2 eV.158
Furthermore, the splitting in the case of high spin Co2+
in
CoO is 1.14 eV.159
Therefore, the observed energy difference between A1 and A2 (shown in the
right inset of Fig. 3.16, fitted with two Gaussian peaks after careful background subtraction) may
correspond to the superposition of the high spin states of both the Co2+
and Co3+
.155-159
In
literature, mixture of high spin states of Co3+
and Co2+
has also been reported for other
compounds e.g. LaMn1-xCoxO3 (x = 0 - 1).155-158
Furthermore, at higher energies, another broad feature (A3) at around 7714 eV is observed,
which has been assigned to a ligand-to-metal charge transfer (LMCT) shake-down process.155-158

83
Shortening of bond lengths (as observed in section 3.1) in our ceramic CTO as compared to that
in single crystal may also be due to charge transfer between Co2+
and Co3+
via oxygen. Our
analysis so far assumes localized picture of t2g and eg states and hence have integral spins on
oxygen. However, recent work by Medling et al.,160
suggests that the localized picture may not
be valid due to the interaction of eg states with O-2p states. In contrast to the study of Medling et
al.,160
which concerns doping effect, our un-doped sample has intrinsic Co3+
and Co2+
occupying
octahedral, tetrahedral and square pyramidal configurations, causing variations in the Co-O bond
distances. Observation of high spin Co3+
in our ceramic CTO could affect the magnetic
properties of the sample. In the following, we discuss the DC magnetization results and their
correlation to the charge and spin states of TM ions in CTO.
3.3.2.2. High field DC Magnetization study
Fig. 3.17. High field DC magnetization under ZFC/FC protocol indicates
antiferromagnetic behavior akin to that of single crystal CTO. Curie-Weiss fit to FC
data is shown in right inset. Left inset shows the corresponding Neel temperatures
(TN1 and TN2) through the second derivative of MFC. Effective magnetic moment
(μeff) has been calculated through the relation: μeff = √(8C) μB per .
Fig. 2.9. Schematic layout of pyroelectric current measurements setup. Switches
labeling represent electrical connection to be made for measurements. Switch 1for
poling process, 2 for electrical shortening and switch 3 for final step of
measurements.
0 50 100 150 200 250 300
0.6
0.8
1.0
1.2
1.4
1.6
1.8
2.0
8 16 24 32 40
TN2
Temperature (K)
2nd derivative of MFC
TN1
0 50 100 150 200 250 300
16
24
32
40
-1=(T-)/C;
= - 68.57 K
eff = 8.56
-1
(m
ole
.Oe
/em
u)
Temperature (K)
TN2
Mag
neti
zati
on
(em
u/g
)
Temperature (K)
ZFC
FC
10 kOe
TN1

84
Fig. 3.17 shows magnetization on ceramic CTO under zero field cooled (ZFC) and field cooled
(FC) conditions. DC magnetization of CTO has been recorded as a function of temperature under
an applied constant magnetic field of 10 kOe. In FC, magnetic field is applied while cooling the
sample from room temperature to lower temperatures, whereas, in ZFC, sample is cooled to
lowest temperature in the first stage and then field is applied during the warming process. From
the first look at the data, we find that the magnetic behavior is similar to that observed in single
crystal studies, which includes two magnetic transitions at around 26 K (TN1) and 18 K (TN2) at
high magnetic fields (> 1 Tesla).78
Low field magnetization data, on the other hand, shows very
complex magnetic behaviour and will be discussed in section 3.3 of this chapter. Left inset of
Fig. 3.17 shows corresponding Neel temperatures (TN1 and TN2) from the second derivative of
MFC curve in agreement with earlier reports. Her et al.,78
mention typical tendency of these
transitions as AFM and FM like, respectively through specific heat measurements under various
magnetic fields on their single crystal CTO sample.78
It is important to note from Fig. 3.17 that the measured magnetization of our ceramic CTO
sample at 1 T is comparable to that reported in single crystal studies at 14 T 77
. This shows our
ceramic sample consists of improved magnetic properties compared to the reported magnetic
properties for single crystal samples. To investigate the effect of the observation of Co3+
on
magnetization, we analyze M vs T data in detail. The normal trend to analyses M vs T data is
through Curie-Weiss (CW) fit, which may provide the nature of existing magnetic interactions,
effective magnetic moment etc. The CW fit and the corresponding fit parameters of high
temperature part of the dc magnetization data are shown in the right inset of Fig. 3.17. Fit shows
negative value of ΘCW (CW parameter) suggesting dominance of antiferromagnetic interactions
in CTO, in agreement with earlier report.78
Further, the effective magnetic moment ( )

85
estimated from the CW parameter (obtained from CW fit) using is 8.56
μB/ . This value is larger than that observed for single crystal studies ~ 8.19 μB / (or
4.73 μB / Co2+
ion).77-80
In the present case, it is not feasible to assign per Co2+
ions,
because our XPS and XANES results indicate the presence of Co3+
. Therefore, we attribute the
enhancement in the magnetic moment to the presence of Co3+
..
To investigate the observed enhancement in , we calculate the parameter for Co3+
using
the formula: . As mentioned above, of CTO single crystal is ~ 4.73
μB / Co2+
ion (orbital plus spin contributions), which results in = (4.73)2
/ 8 =
2.8. Whereas, the experimental value of in our CTO is 9.16 (obtained through the CW
fit, see Fig. 3.17). Assuming high spin state of Co2+
, we calculate the value of
using the following formula:
In this formula, we have divided the three cobalt of Co3TeO6 in to two parts 1.8 (~ 60%) Co2+
and 1.2 (~ 40 %) Co3+
, respectively, as per the observations from LCF and XANES analyses.
After simple calculations, we get = 3.43, which corresponds to the magnetic
moment of 5.24 μB / Co3+
ion. This value of the magnetic moment is close to the magnetic
moment of Co3+
ions in the high spin state (e.g, μB / Co3+
ion,
where S and L are the spin and orbital angular momentum, respectively. Therefore, our
magnetization and XANES results indicate the presence of Co2+
and Co3+
where both the ions
favor high spin states in our CTO.
So far, we have established the coexistence of mixed valence states (Co2+
and Co3+
) of Co and
their high spin states from the analysis of SXRD, XANES and high field magnetization data.
However, some uncertainty remains in the indirect estimation of magnetic moment. Therefore, in

86
order to get a lowest energy and hence, most stable configuration, first principles calculations by
taking Co2+
and Co3+
in various spin states ( i.e. low and high for Co2+
and low, intermediate and
high for Co3+
) have been carried out to further ascertain our findings.
3.2.2.3. First principles study
The first principles ab-initio calculations are performed using the CASTEP module of Material
Studio 7.0 package161
that employs density functional theory using plane-wave pseudo-potential
method. The first principles plane wave basis set calculations are performed within the
generalized gradient approximation (GGA) using Perdew-Burke-Enzerhof (PBE) functional.162
Ultra-soft-pseudo-potentials, plane wave basis set with energy cut off of 380 eV and SCF
tolerance of 10-6
eV/atom are used. Brillouin zone is sampled in the k space within Monkhorst-
Pack scheme and grid size for SCF calculation is (2×4×2). During the first principles ab-initio
simulations, the crystallographic details like lattice parameters, Wyckoff positions, etc. obtained
from the Rietveld refined structure on room temperature SXRD data of CTO and is used as fixed
input for the calculations. Fig. 3.18 shows the crystal structure (graphical view) of CTO along
with some of Co – O – Co angles based on which GKA rule is applied. Large variations in bond
lengths and bond angles corresponding to CTO indicate various possible interactions.29-30
The
purpose of our simulations is to obtain a better understanding on the possible ground state
configurations that justify the observed XANES and magnetization data. For example, whether
the coexistence of Co2+
states with certain percentage of Co3+
(~ 40 % as emerges from XANES
studies) is energetically favorable or not.
In order to ascertain the same, we have carried out single point total energy calculations using
density functional theory (DFT) based on CASTEP code. Total energy calculations for all
possible arrangements of Co2+
and Co3+
in terms of their spin states and magnetic alignments are

87
carried out; only some typical results have been tabulated in Table 3.5. The second column of
Table 3.5 tabulates the nature of initial spin configuration between Co2+
(and/or Co3+
) ions via
oxygen. The spin arrangement between Co2+
and Co3+
is also kept in AFM configurations. For
33 % of Co3+
in intermediate spin, an initial FM spin arrangement with Co2+
(high spin) resulted
in unfavorable total energy, not included in the Table 3.5, suggesting long range FM state may
be unlikely (but short range FM may not be overruled).163
The third and fourth columns represent
the crystallographic positions (Wyckoff sites) of Co2+
and Co3+
in CTO structure and their
relative concentration, whereas the fifth and sixth columns indicate their spin states. Finally, the
single point total energy is shown in the seventh column.
Fig. 3.18. (A) Graphical representation of Co3TeO6 crystal structure where only Co - O
bonding is shown (red solid ball is the oxygen) and (B) Representative angles (in
degree) between Co-O-Co are shown, which can modify the nature of super-exchange
interaction (e. g., < Co – O – Co ≥ 120o AFM type and weak FM type otherwise).
These are employed in first principles calculations. Various orientations are used for
clear visual presentation.

88
Sr. Configurations Co2+
Co3+
Spin state Total relative
No. (%) (%) Co2+
Co3+
Energy (meV)
1. AFM
Co2+-
O-Co2+
100
(Co1,Co2,Co3, Co4, Co5)
0.0 High -- 0
2. AFM
Co-O-Co
78
(Co1,Co2,Co3,Co4)
22
(Co5)
High Intermediate -267.16
3. AFM
Co-O-Co
78
(Co1,Co2,Co3,Co4)
22
(Co5)
High Low -316.31
4. AFM
Co-O-Co
78
(Co1,Co2,Co3,Co4)
22
(Co5)
High High -305.18
5. Co-O-Co
AFM+GKA
67
(Co2,Co3Co4)
33
(Co5,Co1)
High Intermediate -381.51
6. Co-O-Co
AFM+GKA
67
(Co2,Co3Co4)
33
(Co5,Co1)
High Low -341.49
7. Co-O-Co
AFM+GKA
67
(Co2,Co3Co4)
33
(Co5,Co1)
High High -433.00
8. Co-O-Co
AFM+GKA
58
(Co1,Co4,Co)
42
(Co2,Co3)
High Intermediate -117.19
9. Co-O-Co
AFM+GKA
58
(Co1,Co4,Co5
42
(Co2,Co3)
High Low -450.32
10. Co-O-Co
AFM+GKA
58
(Co1,Co4,Co5)
42
(Co2,Co3)
High High -529.89
Table 3.5: Total energies of all possible antiferromagnetic and ferromagnetic spin configurations for the
coexistence of Co2+
and Co3+
in Co3TeO6. The energies have been tabulated with respect to the energy of
Co2+
-O-Co2+
AFM spin arrangement (Co2+
as 100%) as reference. The lowest-energy spin arrangement is
given by Co2+
-O-Co2+
: AFM+GKA as shown in the table for the respective concentration of Co3+
.

89
Based on the earlier reports74-82
on CTO, we have taken AFM arrangement between Co ions first.
One may note that the configurations in which Co2+
is in high spin state in combination with high
spin of Co3+
have favorable magnetic ground states. However, low or intermediate spin state of
Co3+
may also be a possible magnetic ground state depending upon the amount of fractional
presence of Co3+
and Co2+
. For example, for 78 % Co2+
and 22 % Co3+
, both the ground state
energies for high spin – high spin and high spin – low spin are comparable. Energy calculations
presented in Table 3.5 depend also on the fraction of Co3+
present, its neighboring spin
configurations, etc. Note that Co2+
is in high spin state and is antiferromagnetically coupled via
oxygen to another Co2+
. As per GKA rule,30
some of the arrangements are also aligned
ferromagnetically depending on the angle Co2+
–O – Co2+
(above or below 120). Therefore, the
configuration in which both Co2+
and Co3+
are in high spin states (Sr. No. 4, 7, 10) have the most
favorable total energy for the observed concentration of Co2+
and Co3+
.
So far, we have discussed the evidence of Co3+
along with Co2+
in ceramic CTO using
experimental observations and theoretical predictions. Emphasis on the search for the origin of
the same is drawn in the next clause. One can easily guess from the result of the above analysis
that possible outcome of mixed valence Co would be either anions non-stoichiometry (excess) or
cations non-stoichiometry (vacancy).152-154
3.2.2.4. In the search for the origin of Co3+
To investigate one of the possibilities, which is the most common in TM based oxides i.e. the
possibility of oxygen excess, we have synthesized CTO in oxygen reduced (e.g. argon and
vacuum) atmosphere in the optimized condition. In the argon atmosphere, tube furnace is first
evacuated to 2×10⁻³
mbar pressure and then purged with argon for three times for few minutes
each. The calcinations were carried out at constant flow of argon. For vacuum synthesis, pressed

90
pellet of ground mixture is sealed in a quartz ampoule at 7×10⁻⁶
mbar pressure and kept into the
furnace. The ampoule with pellet was calcined in two steps (700 oC and 800
oC) without
intermediate grinding, in the vacuum synthesis. Obtained samples are then characterized by
SXRD and XANES techniques.
Fig. 3.19 shows SXRD patterns for CTO samples prepared under different atmospheric (air,
argon and vacuum) conditions. SXRD patterns indicate that CTO synthesized in air results in
monophasic CTO. Rest of the CTO samples have impurities; either Co5TeO8 (JCPDS # 20-0367)
in the case of vacuum or Co2Te3O8 (JCPDS # 89-4451), in the case of argon (see Fig. 3.19).
We mention the possible reactions for the formation of impurities phases, as follow.
(2/3) Co3O4+ (3) TeO2 → Co2Te3O8 + (2/3) O2 (g) - Argon - (3.9)
(5/3) Co3O4+TeO2 → Co5TeO8 + (2/3) O2 (g) - Vacuum - (3.10)
Fig.3.19. SXRD patterns of CTO synthesized in air, argon and vacuum
atmosphere, indicating the only novel route for CTO synthesis. Dash
represents multiphase CTO for vacuum ad argon case.
1.5 2.0 2.5 3.0 3.5
+++
----
Inte
ns
ity
(a
rb.
un
its
)
q (Å-1
)
Vacuum
Argon
Air
CTO'
-
+
+ Co5TeO
8-- Vacuum
- Co2Te
3O
8-- Argon

91
The other important observation from these samples is the same average valency of Co (within
experimental error) in all the synthesized samples, as depicted by Co K edge XANES spectra
(Fig. 3.20). Fig. 3.20 shows edge step normalized XANES spectra for all the samples
synthesized under different atmospheric conditions (air, argon and vacuum). This actually
complicates the cause of Co3+
in CTO. Based on all these studies, one may conclude that single
phase of CTO forms only in air with two step calcinations. However, it is difficult to conclude
the origin of Co3+
in CTO, suggesting the possibility of cations vacancy in our samples.
3.2.3. Conclusions
To conclude this section, we have evidenced the observation of Co3+
through XANES study, as
also indicated earlier using XPS in section 3.1, of this chapter. Rietveld refinement of SXRD
data recorded on ceramic CTO shows a noticeable deviation in typical Co-O bond distances
when compared with other reports in literature, for single crystal as well as powder CTO.
Observation of shorter bond lengths in our sample further supports the presence of Co3+
valence
state. XANES spectra show coexistence of Co2+
and Co3+
with concentrations of 60 % and 40 %,
Fig. 3.20. Co K edge XANES spectra of CTO synthesized in air,
argon and vacuum atmosphere, indicates same Co valency.

92
respectively. Magnetization measurements, with major magnetic transitions at ~ 26 K and ~18 K,
show a large effective magnetic moment ~ 8.56 µB / obtained by Curie Weise fit, indicating
high spin Co3+
in agreement with XANES results. First principles based total energy calculations
using CASTEP code support the experimental observation of high spin Co3+
in ceramic CTO.
Consequences of Co3+
on the multiferroic properties of our ceramic CTO are discussed in the
next section, where we show that the existence of Co3+
ions does not diminish any of the
multiferroic properties seen earlier in powder as well as in single crystal CTO, but enhances
some of the observables.96-97

93
3.3. Magneto-electric and Magneto-dielectric properties of CTO
This section describes magneto-electric and magneto-dielectric properties of ceramic CTO.
Observation of all the magnetic transitions at low magnetic field and their possible structural
correlations are discussed. Observed short range ferromagnetic interactions have been
attributed to Co3+
-O- Co2+
network. Together with these, we present several interesting
observations from magnetic field dependent dielectric constant data such as spontaneous
electrical polarization, presence of ferromagnetic correlation below TN2, possible spin-phonon
coupling and magneto-dielectric effect in CTO. Finally, combined dielectric and pyroelectric
current (polarization) measurements are utilized to comment on the spontaneous symmetry
breaking in the absence of magnetic field.
3.3.1. Introduction
As discussed previously in the start of this chapter, single phase synthesis and the intrinsic low
magnetic field magnetic behaviour of CTO remain under debate.74-86
The concern about this
issue is due to its different magnetic behaviour at high and low magnetic fields.75-80
In section 3.2
of this chapter, we have discussed the high magnetic fields data, which shows only two AFM
transitions TN1 ~ 26 K and TN2 ~ 18 K, in agreement with various reports on CTO.77-78
Low
magnetic field data, on the other hand, shows different magnetic behaviour and thus are under
debate.76-80
For example, there is no experimental report which shows all the five magnetic
transitions (~ 34 K, 26 K, 21 K, 17.4 K and 16 K) in a particular ceramic or single crystal CTO.
Different groups have reported different sets of magnetic transitions, including TN1 and TN2.75-80
Assuming the origin of these variations in its synthesis part, we provide for the first time, the
growth reaction mechanism of ceramic CTO in an attempt to solve this issue. Through this, we
end up with monophasic and mixed valence CTO, as detailed in previous section 3.1 and 3.2.

94
Further, we have discussed the origin of low symmetry structure of CTO in A3TeO6 (A = Mn,
Ni, Cu, Co)76
family, where the other members of this family with A= Mn, Ni show
rhombohedral symmetry, while Cu3TeO6 shows cubic symmetry. Implications of such lower
symmetry structure can be seen in its low temperature complex magnetic structure. As expected,
due to high spin mixed valence state of Co in CTO, the magnetic behaviour may vary from the
sample which has single +2 valence of Co, as reported in literature. .77-80
Section 3.2 presents
some of the advantages of having mixed valence Co in ceramic CTO as compared to its single
crystal form.96
In this section, we have studied low 5 Oe – 500 Oe) and high magnetic field ( 1
kOe-50 kOe) DC magnetization data in order to investigate its zero magnetic field magnetic
behaviour along with its behavior on increasing the magnetic field.. Finally, attention has been
drawn to show magneto-electric and magneto-dielectric couplings along with several intriguing
observations in ceramic CTO. Following paragraphs describe magnetic behaviours at low
magnetic field, their probable structural correlation and the presence of short range
ferromagnetic interactions in CTO.
3.3.2. Results and Discussion
3.3.2.1. Low field DC Magnetization Study
Fig. 3.21 shows a representative low field (100 Oe) ZFC and FC magnetization curves (5 K to 80
K). No anomaly has been observed for T > 80 K, in agreement with literature. Starting from high
temperature side, one can easily see a strong bifurcation between ZFC and FC curve at ~ 60 K,
followed by various kinks below 60 K. In literature, these kinks are considered as magnetic
transitions for CTO.75-80
To have an exact value of the kink, derivative (either first order or
second order) with respect to temperature has been taken. These kinks are marked with arrows
(see Fig. 3.21). In addition to the faint anomaly at ~ 16 K, we observe four main magnetic

95
transitions at around 34 K, 26 K, 21 K and 17.4 K (as shown by second derivative, the inset of
Fig. 3.21), in agreement with single crystal studies.75-80
The bifurcation observed in ZFC and FC
will be discussed in next paragraphs. As mentioned above (about the issue of five magnetic
transitions), we show all the magnetic transitions (observed separately by various groups) in our
single phase ceramic CTO.
Fig. 3.22. 1st derivative of DC magnetization data at 5 Oe
(shown in the inset), which shows clear signature of all
magnetic transitions, especially at 16 K.
12 18 24 30 36
5
6
7
12 18 24 30 36 42 48
dm
/dT
(em
u/g
m
)
Temperature (K)
1st
derivative of m
m (
em
u/g
m1
0-
4)
Temperature (K)
M vs T curve @ 5 Oe
ZFC
Fig. 3.21. ZFC and FC Magnetization vs temperature curves
taken under 100 Oe. Inset shows the 1st derivative of FC curve.

96
As discussed earlier, we see all the five magnetic transitions in our samples, in low magnetic
field magnetization data. We show ZFC M vs T data along with the first derivative for an applied
magnetic field of 5 Oe, in the inset and the main panel of Fig. 3.22, respectively. The ZFC and
FC M vs T data along with second derivative for 100 Oe are also shown in Fig. 3.21. From Fig.
3.21, one could see a clear transition at 16 K (along with other four), which is also seen in Fig.
3.22. Through Figs. 3.21 and 3.22, we have not only validated our synthesis route for CTO
sample but also observed all the magnetic transitions reported earlier for single crystals, by
various groups. In the following, discussion on the observance of multiple magnetic transitions
in CTO has been given.
Looking the data from high temperature side, the transition at ~ 34 K, also observed by Hudl et
al. and Her et al. on their single crystal sample, is intrinsic to ceramic CTO.77-78
The remaining
successive aforementioned low temperature magnetic transitions are studied by various authors
on their single crystal as well as in powder samples using magnetic and neutron diffraction
experiments.75-80
Only Wang et al.,80
have discussed about multiple magnetic transitions
observed in CTO and ascribed its possible origin to two magnetic networks Co1-Co4 and Co2-
Co3-Co4 (detailed in next clause).80
However, our observation of two possible additional Co-Co
networks through structural analysis may provide structural origin for the additional magnetic
transitions, as discussed in below.
3.3.2.2. Structural investigation for the insight into the magnetism
In order to understand multiple magnetic transitions, observed in CTO, we have carried out
detailed structural investigations using VESTA (a 3D visualization) software134
on Rietveld
refined SXRD data. Rietveld analysis indicates that ceramic CTO adopts monoclinic crystal
structure with C2/c space group as reported earlier74-80
. A comparative table, consisting of lattice

97
parameters of CTO by various groups74-80
including our results, is presented in section 3.1. CTO
exhibits complex magnetic behaviour at very low temperatures. Based on Rietveld refinement of
neutron diffraction data, Wang et al.,80
have reported the structure of CTO along [-101] direction
by four layers A, B, C, D. Layers A and B represent Co3-Co2-Co5 (or 3-2-5) and Co1-Co4-Co4
(or 1-4-4) chains, respectively, where Co1, Co2, Co3, Co4 and Co5 represent
crystallographically distinguishable Co atoms. Layers C and D can be obtained by a translation
of A and B chain, respectively by (a/2, b/2, 0). CTO unit cell can be obtained by translation of
block or A, B, C, D layers along a-axis. Other layers (C and D) have not been mentioned further,
neither their contribution to magnetic behaviour nor their assignment.80
The authors have
proposed that layer B possessing zig-zag Co1-Co4-Co4 chains, consist of IC moments, whereas
layer A consists of simple AFM moment. Based on these results, the authors assigned IC
transition at 26 K to zig-zag chain in layer B (1-4-4) and layer A (2-3-5) to second transition at ~
18 K. However, their zero magnetic field phase diagram of CTO clearly shows four magnetic
transitions below 30 K i.e. at 26 K, 21 K, 18 K and 16 K.80
This suggests that networks
corresponding to remaining magnetic transitions need to be identified. Therefore, we have made
an attempt to identify other networks using SXRD to get insight into the origin of low
temperature multiple magnetic transitions.
Fig. 3.23 shows a cross sectional (┴r to b axis) view of CTO structure, as obtained using VESTA
tool based on Rietveld refined structure. Oxygen anions are not shown, for clarity following
Wang et al.,.80
The interconnecting medium (oxygen) ions along with Co ions based chains /
layers can be viewed easily through Fig. 3.23 and by layers A, B, C and D. The first two (A and
B) layers show the reported Co-Co networks, while the third and fourth (C and D) layers show
the additional ones. These are 2-3-5 (A), 1-4-4 (B), 2-3-4 (C) and 1-5-5 (D). As can be seen from
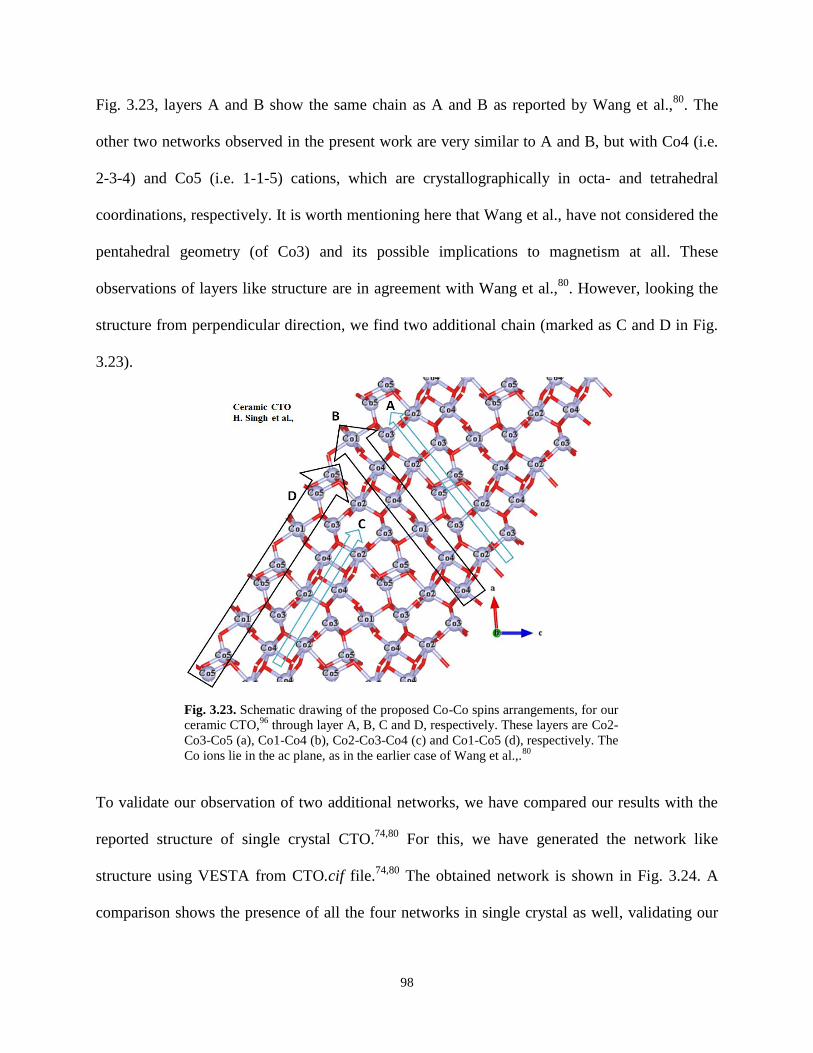
98
Fig. 3.23, layers A and B show the same chain as A and B as reported by Wang et al.,80
. The
other two networks observed in the present work are very similar to A and B, but with Co4 (i.e.
2-3-4) and Co5 (i.e. 1-1-5) cations, which are crystallographically in octa- and tetrahedral
coordinations, respectively. It is worth mentioning here that Wang et al., have not considered the
pentahedral geometry (of Co3) and its possible implications to magnetism at all. These
observations of layers like structure are in agreement with Wang et al.,80
. However, looking the
structure from perpendicular direction, we find two additional chain (marked as C and D in Fig.
3.23).
To validate our observation of two additional networks, we have compared our results with the
reported structure of single crystal CTO.74,80
For this, we have generated the network like
structure using VESTA from CTO.cif file.74,80
The obtained network is shown in Fig. 3.24. A
comparison shows the presence of all the four networks in single crystal as well, validating our
Fig. 3.23. Schematic drawing of the proposed Co-Co spins arrangements, for our
ceramic CTO,96
through layer A, B, C and D, respectively. These layers are Co2-
Co3-Co5 (a), Co1-Co4 (b), Co2-Co3-Co4 (c) and Co1-Co5 (d), respectively. The
Co ions lie in the ac plane, as in the earlier case of Wang et al.,.80

99
observation. Therefore, our detailed structural analysis provides an origin for the observed
multiple magnetic transitions in CTO at lower temperatures.
Further, in the network 1-4-4, both the Co ions are in octahedral configurations, whereas in 1-5-
5, Co5 is in tetrahedral. Similarly, 2-3-5 network consists of octa, penta, tetrahedral, whereas, 2-
3-4 network consists of octa, penta, octahedral coordination. Also, in all the networks, Co-Co
bond distances (~3 Ǻ) are much larger compared to Co-O distances (~2 Ǻ). Only Co5-Co5
(~2.75 Ǻ) or even Co3-Co4 (~2.85 Ǻ) pairs have lower bond lengths, which possibly makes
these as a source for direct exchange. Rest of the bond lengths are > 3 Ǻ, leading to a strong case
for super-exchange or double exchange through oxygen. Furthermore, we observe typical bond
angles of ~ 90o and 110
o for Co4-O-Co4 and Co5-O-Co5, respectively, whereas, 105
o to 130
o for
Co2-Co3-Co5 and 80o to 125
o for Co2-Co3-Co4 networks. Accepted values of bond angles (TM-
Fig. 3.24. Similar schematic drawing of the proposed Co-Co spins
arrangements, for single crystal CTO80
through layer A, B, C and D,
respectively. These layers are Co2-Co3-Co5 (a), Co1-Co4 (b), Co2-Co3-Co4 (c)
and Co1-Co5 (d), respectively.

100
O-TM) for AFM and FM interactions are 180 o and 90
o, respectively. The bond length must be
as small as possible.29-30
Several reports 29-30
indicate different values of bond angles, compared
to the ones mentioned above. Hence, bond lengths and angles corresponding to these networks
indicate various possible interactions, which further corroborate the observed complex magnetic
structure.
Therefore, the presence of Co in five different polyhedral geometries with such large varieties of
bond lengths and bond angles may lead to the observance of different crystal fields, which may
contribute differently to the magnetic behaviour (as discussed in Chapter 1). Hence the observed
complex magnetic ion networks may be responsible for the complex magnetic structure as well
as multiple magnetic transitions in CTO. One of the implications of such complications in the
magnetic behaviour is the observation of short range FM interactions in CTO, which is described
in forthcoming paragraphs.
3.3.2.3. Bifurcation between FC and ZFC magnetization curves
Herein, nature and cause for the bifurcation at ~ 60 K between FC and ZFC magnetization
curves (see Fig. 3.21) of ceramic CTO are discussed. We first establish FM interactions and then
its short range nature. In general, this feature (bifurcation) may arise due to several reasons164
including the opening up of hysteresis loops and a corresponding non-zero value for the
coercivity (as temperature falls).165
It may also possibly be due to the presence of FM clustering,
termed as the Griffiths like FM clusters with nano-size domains.166-171
The coexistence of
magnetic interactions of opposite nature leading to complex magnetic behaviour has been seen in
numerous magnetic systems.171-177
Griffiths phase (GP) presents the competition between the FM
and AFM interactions under random potential (due to disorder).168-170
Disorder sets in such a way
that different values of exchange coupling (J) may be assigned randomly to different sites of the

101
lattice. This causes existence of short-range ordering of FM clusters when TC < T < TGP (here, TC
represents the FM Curie temperature, whereas, TGP is the Griffiths temperature at which the FM
clusters begin to nucleate). The intermediate regime is known as GP. The Hallmark of GP is a
sharp downturn in the inverse magnetic susceptibility data.168-170
This downturn in the behaviour
of χ−1
(as a function of temperature) is an important observation that distinguishes GP from
smeared phase transition because, the later gives rise to an upward curvature in χ−1
vs T above
TC, deviating from CW law.168-170
The softening (or disappearance) of the downturn in χ−1
vs T
curve, with the increase in magnetic field is another typical signature of GP. The basic
characteristic of GP regime is that above TC there exists finite but nano size clusters with FM
correlated spins.166-170
One of the possible causes for the appearance of FM clustering in AFM
matrix is Co2+
- O - Co3+
network, which may result in FM correlations. One may attribute this
FM correlations to weak short range type as the long range FM Co2+
-O-Co3+
networks are found
less favorable from our first principles simulations leaving a possibility of local FM clustering
(see section 3.2).96,163
10 20 30 40 50 60 70
0
2
4
6
(e
mu
/g)
Temperature (K)
60 K
=FC
-ZFC
100 Oe
Fig. 3.25. It shows the magnetization difference of the
corresponding FC and ZFC mode.

102
To elaborate the evidence of short range ferromagnetic correlations, we present the
magnetization difference curve178
and the down turn in the inverse susceptibility data166-170
.
These two curves are shown in Figs. 3.25 and 3.26, respectively. Magnetic hysteresis (which
closes at higher fields ≥ 1000 Oe) at 300 K and 5 K are also plotted in Fig. 3.27. We plot the
power law behaviour of χ-1
= (T-TCR)1-β
, where we find 0 < β < 1 and TCR
(random ferromagnetic
Curie temperature) = TN, which is another characteristics of GP. The β values (see Fig. 3.28) for
paramagnetic (βPM) and GP (βGP) phases are 0.003 and 0.342, respectively. This value of βGP
correspond to FM correlations, in agreements with our earlier first principles calculations (see
section 3.2).96,163
FM interactions are also visible from the temperature-dependent difference
between FC and ZFC magnetization (MFC-MZFC) curves.178
Fig. 3.25 shows ΔM (=MFC-MZFC) vs
T curve taken at 100 Oe. The ferromagnetic characteristic transition temperature TFM may be
obtained by taking derivative of (MFC-MZFC) with respect to temperature. The difference
advantageously eliminates para- and diamagnetic contributions and indicates the presence of
0 50 100 150 200 250 300
10
20
30
40
data
CW fit
1/
Temperature (K)
Evidence of Griffiths like phase in CTO
M vs T @ 100 Oe
Deviation from C-W law
Fig. 3.26. Thermal dependence of inverse susceptibility (H/M)
data of ceramic CTO taken at magnetic field of 100 Oe.

103
hysteresis (if ΔM ≠ 0) leading to FM correlations.178
However, this FM component appears only
at very low fields and increases with decrease in magnetic fields, suggesting the presence of zero
magnetic field magnetization. To investigate the same, we have plotted field dependent inverse
susceptibility data for 100 Oe, 500 Oe and 1000 Oe in Fig. 3.29. We have re-plotted the M vs T
and χ-1
for 100 Oe data for comparison.
Fig. 3.27. Magnetic hysteresis loop measurement at 5 K
and 300 K.
-400 -200 0 200 400
-4
-2
0
2
4
-40 -20 0 20 40
300 K
H (kOe)
5 K
m (
10-3
em
u/g
m)
H (Oe)
M/H@300K
M/H@5K
Linear fit
2.00 2.05 2.10
1.05
1.12
1.19
GP
=0.342
PM
=0.003 Power law :
= (T-TCR)1-
log
10
-1
log10(T-TCR)
100 Oe
Fig. 3.28. This shows power law behavior of inverse
susceptibility (H/M) data.

104
It is clear from Fig. 3.29 that the deviation from CW behaviour, which is sufficiently strong at
low field, suppresses with the increase in magnetic field. In the case of 500 Oe and 1000 Oe, we
also plot enlarged χ-1
data to confirm suppression of the downturn. This feature has disappeared
Fig. 3.29. Low field Magnetization data, both in ZFC and FC mode, taken subsequently at 100 Oe,
500 Oe and 1000 Oe. It clearly shows the suppression of deviation, as indicated by vertical arrows
and insets.
30 60 90 120 150 180 210
0.10
0.15
0.20 ZFC
FC
em
u/g
m
Temperature (K)
1000 Oe
30 60 90 120 150 180
15
20
25
60 80 100
15
18
T (K)
Temperature (K)
No deviation
1000 Oe
30 60 90 120 150 180 210
0.008
0.012
0.016
0.020
em
u/g
m
Temperature (K)
M/T@100Oe-ZFC
M/T@100Oe-FC
30 60 90 120 150 180
14
21
28
Temperature (K)
Deviation from CW law
100 Oe
30 60 90 120 150 180 210
0.04
0.06
0.08
0.10
em
u/g
m
Temperature(K)
M/T@500Oe-ZFC
M/T@500Oe-FC
30 60 90 120 150 180
14
21
28
40 60 80
14
16
T (K)
Temperature (K)
500 Oe
Deviation from
CW law

105
at 1000 Oe data. This confirms GP.166-170
Therefore, we have evidenced ferromagnetic
correlations in CTO, which is of short range nature and Griffiths like. We now discuss the
investigation of magneto-electric and magneto-dielectric effects in CTO.
3.3.2.4. Investigation of Magneto-Electric (ME) and Magneto-Dielectric (MD) effects
To investigate ME and MD couplings in our ceramic CTO, we perform temperature and
magnetic field dependent dielectric constant and pyroelectric current (and hence polarization)
measurements. We have measured the dielectric constant, pyroelectric current and polarization in
the magnetic fields of 0, 3 and 5 T. Fig. 3.30 shows dielectric constant as a function of
temperature performed under above mentioned magnetic fields.
In the inset of Fig. 3.30, we show dielectric constant as a function of temperature ɛ (T) with error
bar. Before interpreting the data, we would like to mention few common features about dielectric
constant. One normally observes lower value of dielectric constant for ceramic samples as
compared to those for single crystals. This is because, in powder, one can measure the average
Fig. 3.30. Dielectric constant vs temperature profile at different
magnetic fields. Inset shows the error bar of one of the
representative dielectric data taken at 5 T.
8 12 16 20 24 28 323.3840
3.3848
3.3856
3.3864
3.3872
14 16 18 20
Temperature (K)
0T
3T
5T
freq = 5023 Hz
10 15 20 25 30
3.3840
3.3855
3.3870
Temperature (K)
5 T
106
dielectric constant compared to a larger value measured in a preferred direction in single crystal.
Also, as shown in Fig. 3.30, above 20 K, the dielectric constant for CTO shows a gradual
decrease on cooling, typical feature of many insulating materials.179
Below roughly 20 K, the
dielectric constant increases with further cooling. The following features have been observed
from Fig 3.30.
a) While cooling from room temperature to lower temperature, zero magnetic field
dielectric constant data show a step anomaly at 18 K. It may be mentioned that temperature of
dielectric anomaly, which may be taken as the first derivative of dielectric constant data with
temperature just below 20 K, matches well with magnetic transition (TN2 ~ 18 K) in our sample,
indicating a possible common origin for the two.
b) In literature180
, such sharp upturn in ɛ (T) has been correlated with the spontaneous
polarization; e.g. in CuO and other type II multiferroic materials.180
This leads us to infer that our
sample should show spontaneous polarization below 18 K. Recent neutron diffraction data80
also
support our interpretation of spontaneous polarization below 18 K, quoting our work 181
as an
example.
c) The dielectric constant data on the application of magnetic fields show very interesting
observations. Similar downturn is observed for ɛ (T) curves measured at 3 T and 5 T, well above
20 K, indicating no change in the dielectric constant data for T > 20 K.
d) Shift of T2 (~TN2) towards lower temperature below 20 K on the application of magnetic
fields, confirm the magneto-electric coupling in CTO (see Fig. 3.31). The observation of
lowering of T2 with raising magnetic fields is also in accordance with the theoretical prediction
by Toledano et al.,80
applicable to single crystal. This may be an additional evidence for the
correlation between T2 in ɛ (T) curve and (TN2) in M (T) curve in CTO.

107
e) Following our magnetization measurement as a function of temperature at various
magnetic fields, we show indication of Griffiths like phase, in addition to AFM majority phase
(see section 3.3.2.3). Our dielectric measurements show decrease in the AFM transition
temperature and also a decrease in magnitude of dielectric constant at high magnetic field. Both
these are indications of AFM phase182-183
.
f) Most importantly, we find dispersion in ɛ (T) curve (i.e. reduction of the overall
magnitude of dielectric constant below 18 K) as a function of applied magnetic field (see Fig.
3.31). We observe lower ɛ value for higher applied magnetic field for T < 18 K. This is an
evidence of magneto-dielectric effect in CTO; being reported for the first time for this material.
Furthermore, Figs. 3.32 and 3.33 show the thermal profile of pyroelectric current and derived
polarization under 0, 3 and 5 T magnetic fields respectively. The pyroelectric current and
corresponding polarization in the absence of magnetic field shows no observable anomaly within
the experimental resolution. It may be noted that very well studied compound CaMn7O12, in
16 17 18 19
3.3848
3.3856
3.3864
3.3872
14 16 18 20
Temperature (K)
0T
3T
5T
freq = 5023 Hz
Fig. 3.31. Dielectric constant showing change in peak
position towards lower temperature with the increase in
magnetic field.

108
single crystal form, exhibits polarization of 3000 C/m2, whereas, in ceramic form its magnitude
gets reduced by an order of magnitude to ~ 300 C/m2
.185-186
In literature, this decrease in
polarization (and hence dielectric constant) has been attributed to the ceramic nature of the
Fig. 3.32. Measured pyroelectric current as a function of
temperature in the presence of 0, 3 and 5 T external field (poling
field = 6.6 kV/cm).
10 15 20 25
0.00
0.12
0.24
0.36
I Py
ro (
pA
)
Temperature (K)
5T
3T
0T
Fig. 3.33. Electrical polarization derived from pyroelectric current
is plotted as a function of temperature in the presence of 0, 3 and
5 T external field.
10 15 20 25
0.00
0.04
0.08
P
(C
/m2)
Temperature (K)
5 T
3 T
0 T

109
sample, as mentioned earlier in this chapter. It is worth mentioning that the emergence of
pyroelectric current, polarization and sharp upturn in dielectric constant at identical temperatures
is observed where magnetization ~ 18 K also shows downturn. Therefore, observable magnitude
of ferroelectric polarization is perhaps a consequence of rearrangement of spin ordering due to
the magnetic field. The ferroelectric phase transition temperature gradually shifts towards lower
temperatures whereas the degree of polarization increases with application of magnetic field,
which signifies magnetically coupled ferroelectricity. This is also observed in the temperature
dependence of electronic specific heat (Cp) and ac magnetic susceptibility (χ´) data at various
magnetic fields by Her et al.78
on their single crystal CTO. The magnitude of pyroelectric current
and derived polarization increases monotonically with the strength of magnetic field. These
observations i.e. opposite response of dielectric constant and polarization to magnetic fields (in
our ceramic CTO) not only follow the same polarization behaviour as that of single crystal CTO
studies,77
but also show the similar trend as in the well-studied compound Ni3V2O8.184,187
This
may also suggest the possible origin for the observance of electrical polarization in CTO.
Further, our polarization measurements derived from the pyroelectric current measurements
verify the upward turn in dielectric constant around the 18 K occurs at the cost of spatial
symmetry inversion in the presence of magnetic field.
The following inferences may be drawn from the magnetic field dependent dielectric and
pyroelectric measurements. The nature of magneto-dielectric behaviour presents a generic
response of magneto-electric coupling in CTO. The systematic response of thermal profile of
dielectric constant at 0, 3 and 5 T magnetic fields suggests that the magnetic ground state alone is
sufficient to break the spatial inversion symmetry. A qualitative analysis of all the collective
experimental results suggests that the magneto-dielectric effect is originated as interdependent

110
response of magneto-electric effect. The intriguing interplay of dielectric constant and
polarization (as evidenced through magneto-dielectric and magneto-electric couplings) at
magnetic transition temperature with the application of magnetic field, is a characteristics of
type-II multiferroic. This is because in such materials, intrinsic spin ordering in inhomogeneous
non-collinear magnet provides driving force to spontaneously break spatial inversion
symmetry.21
Our combined analyses indicate magnetically broken inversion symmetry leading to
a possible spontaneous polarization. According to the prediction by Toledano et al.,80
and a
requirement of type II MF,35
spontaneous electric polarization is also accompanied by
spontaneous magnetization in the same phase III (< 20 K). Very weak hysteresis loop at 5 K i.e.
in phase III (see Fig. 3.27) confirms the presence of a weak ferromagnetism in our CTO. In the
same phase, our dielectric constant data also shows the ferromagnetic correlations below 18 K.
Our observations based on above measurements indicate that our ceramic CTO is strongly
coupled type II multiferroic material.
3.3.3. Conclusions
Temperature dependent DC magnetization measured at low and high magnetic fields reveals
complicated magnetic structures and signature of all the magnetic transitions, observed earlier in
neutron diffraction studies, are also retained in our ceramic CTO. Synchrotron XRD based
structural analysis indicates two additional possible magnetic (Co-Co) networks. At low
temperatures, weak FM interactions are developed as also evidenced through very weak
hysteresis. This behavior is because of Griffiths like ferromagnetic clusters of nano size domains.
The measured dielectric constant exhibits a steep upward turn at around 21 K and a well-defined
peaked structure at 18 K (T2). On further lowering in temperature and applying magnetic field,
T2 (H) along with overall magnitude of ɛ (T) decrease with increasing magnetic field indicating

111
several unresolved observations like FM correlations in phase III and spin-phonon coupling
leading to magneto-dielectric effect in CTO. This further supports strong coupling between
electric and magnetic orders in CTO.
To conclude this chapter, single phase ceramic Co3TeO6 (CTO) is synthesized via conventional
solid state reaction route by taking off-stoichiometric Co3O4 and TeO2 and two step calcination in
air. CTO structure crystallizes in monoclinic C2/c space group, which is understood as due to the
formation of low symmetry CoTeO4 intermediate phase. Spectroscopic characterizations using
XANES and XPS show mixed oxidation state of Co (Co2+
and Co3+
, both in high spin), which
can be due to wider variations in bond lengths and bond angles as elucidated using Rietveld
refinement on structural data. The high spin states of both Co2+
and Co3+
is further supported by
pre-edge XANES data, high field magnetization data (wherein CW fit gives higher magnetic
moment as compared to that reported for single crystal CTO) and first principles ab-initio
calculations. It has been established that possible charge imbalance due to different oxidation
states of Co-ions may be compensated by Te-cation vacancies. Further, we have observed only
two magnetic transitions (TN1 ~ 26 K and TN2 ~ 18 K) in high field magnetization data. This
observation is in disagreement with low field DC magnetization data, which shows all the five
magnetic transitions. This suggests CTO has complex magnetic structures at low magnetic field,
which may be due to the fact that CTO possesses low symmetry structure. In addition, we
observe bifurcation (~ 60 K) in the ZFC and FC magnetization curves at lower magnetic fields
(H < 500 Oe) and its disappearance under higher (≥ 1000 Oe) magnetic fields, indicating
possible zero magnetic field magnetization. Magnetic hysteresis (M vs H) data also shows very
weak hysteresis loop at very low temperatures, which has been attributed to the presence of
Griffiths like phase in CTO, suggesting short range FM nano domains in AFM matrix. Both FM

112
and AFM interactions can arise due to the mixed valence of Co leading to the network Co2+
-O-
Co3+
(normally favours FM interactions) and Co2+
-O- Co2+
or Co3+
-O- Co3+
(favours AFM
interactions). Observance of multiple magnetic transitions is understood to have origin in the
structure of CTO and is further correlated with the four structural networks observed. This is
because, various polyhedral configurations of Co ions experience different crystal fields leading
to their different electronic/spin configurations. This is in dis-agreement with the observation of
only two networks reported in literature, based on their neutron diffraction data. Temperature
and magnetic field dependent dielectric constant and polarization measurements show the
possibility of spontaneous electrical polarization in CTO. The response of dielectric constant
with magnetic field confirms the magneto-dielectric coupling. Our magnetic, polarization and
dielectric measurements show spontaneous electrical polarization as well as spontaneous
magnetization at low temperatures and hence a possible magneto-electric coupling. Also,
combined dielectric, pyroelectric and polarization measurements suggest that the ground state of
CTO may possess spontaneous symmetry breaking even in the absence of magnetic field.

Chapter 4
Mn doped Co3TeO6


113
In the last chapter, we have presented a detailed investigation on CTO, a type II MF, which
shows the ME coupling at very low temperatures. In this chapter, we attempt to enhance the
temperature, by doping CTO system with Mn. From fundamental as well as application points of
view, investigations are guided to achieve two major goals in MF materials; increasing the
coupling among various ferroic orders and enhancing the transition temperature below which the
coupling strength is significant.2-3,7-16
In addition, the understanding the mechanism of MF
coupling is also important. Doping an existing MF with a suitable dopant as well as designing
and developing new MF materials are major routes to attain the above mentioned goals.188-189
Undoubtedly, controlling the coupling of various ferroic orders and enhancing the transition
temperature to room temperature are of immense interest.190
Enhancement of these couplings at
higher temperatures may possibly be achieved by various ways like internal chemical pressure
and external perturbations etc.191-193
Most of the existing materials show aforementioned
couplings at very low temperatures.77-80,96
With an aim to developing new functionalities in Co3TeO6 (CTO), we have partially
replaced Co in CTO by two nearby transition metals: Fe and Mn. Substitution of Fe in CTO does
not result in single phase material due to unstable structure of Fe3TeO6.194-195
Our initial
synthesis (not discussed further) and structural characterization (along with literature) of Fe
doped CTO show the formation of Fe2TeO6, a magneto-electric material, which is not a
multiferroic.194-195
On the other hand, Mn doped CTO (CMTO) results in a single phase solid
solution of CTO and MTO after a particular Mn concentration.91-92,100-102
For lower Mn
concentration, two phase compound is observed.100
As discussed in the previous chapter, CTO is
low symmetry (C2/c) type II MF material, which shows complex magnetic structure with a
sequence of AFM transitions at very low temperatures.77-80,95-99
MTO, on the other hand,

114
crystallizes in higher symmetry (R ) and is a type I MF material, which exhibits AFM transition
at approximately the same temperature as that of CTO.196
MTO and CTO show AFM transitions
at around 23 K and 26 K, respectively.77-80,198
In contrast, Mn doping in CTO enhances the AFM
transition temperature to ~ 40 K (45 K in for our sample: at the same Mn concentration); even
when the AFM transition temperatures of the end members are lower.91-92,100-101
Rest of the chapter is organized in two sections. The preparation and characterization of
Co3-xMnxTeO6 (CMTO); (0 < x ≤ 2) solid solutions have been discussed in section 4.1. The
section describes structural and spectroscopic characterizations of CMTO. The results obtained
from these characterizations for CMTO samples are used to explain interesting magnetic
properties, as discussed in section 4.2.

115
4.1. Structural and Spectroscopic Characterizations on Co3-xMnxTeO6
In this section, we describe growth of Co3-xMnxTeO6; (0 < x ≤ 2) solid solutions using two step
solid state reaction route as described for CTO. Synthesized CMTO in an optimized condition
are characterized using SXRD and XANES techniques.
4.1.1. Introduction
As discussed above, present section of this chapter explores effect of Mn doping in CTO on
structural and spectroscopic properties, leading to the anomalous magnetic behaviour in CMTO.
Mn substitutions on Co sites in CTO may have several effects like (i) different ionic radii of Mn
as compared to Co can modify the effective orbital overlap between the transition metals and
thus modifying the exchange integral, (ii) probable mixing of variable oxidation states of Mn/Co
may also influence the effective magnetic moment and magnetic interactions and iii) chemical
pressure may change electronic configuration, inter-atomic distances and local environment. As
a result, changes in TM – oxygen (Co/Mn-O) bond lengths and their respective angles (TM-O-
TM) along with variable oxidation states of Co and Mn greatly influence the magnetic properties
of the compound.100
Doped materials show properties quite different from the parent compounds.
For example, interesting features like insulator-metal and FM-AFM transition are observed in the
intermediate compounds LaMn1-xCoxO3197-198
(absent in the end members). This led us to
investigate Co3-xMnxTeO6 solid solutions. Several studies on various other solid solutions have
also been reported e. g., Mn3-xCdxTeO6.199-201
However, the observance of combined
ferromagnetism at higher temperature and enhanced anti-ferromagnetism at lower temperature
has not been reported so far. The main contribution of the present work is the observance of high
temperature (185 K) FM interactions and low temperature (45 K) AFM interactions in these solid
solutions. We have also provided the explanation for the experimental observations, based on

116
structural and spectroscopic measurements. To address issues discussed above, we have carried
out room temperature SXRD and XANES studies. The detailed structural as well as
spectroscopic studies provide information to understand and explore its probable correlation with
observed as well as reported anomalous magnetic behavior of Co3-xMnxTeO6 (0 x 2) solid
solutions.
4.1.2. Results and Discussion
4.1.2.1. Synchrotron X-ray diffraction study
Polycrystalline samples of Co3-xMnxTeO6; (x = 0.0, 0.05, 0.1, 0.2, 0.25, 0.3, 0.4, 0.5, 1, and 2)
have been synthesized via conventional solid state reaction route using Co3O4, Mn3O4 and TeO2
reactants. Synthesis procedure is given in chapter 2. Fig. 4.1 shows SXRD patterns of Co3-
xMnxTeO6 for x = 0, 0.1, 0.2, 0.3, 0.5, 1.0, and 2.0 collected at room temperature. A closer look at
Fig. 4.1. Synchrotron X-ray diffraction patterns of x = 0.0, 0.1, 0.2, 0.3,
0.5, 1 and 2 compositions possessed either mixed (C2/c and R )
symmetry (0.1, 0.2, 0.3) or pure R symmetry (0.5, 1.0, 2.0). Here x = 0
corresponds to pure CTO (C2/c) phase.
3 4 5 6 7 8
x=1
x=0.5
x=0.3
x=0.2
x=0.1
x=0
Inte
ns
ity
(a
rb.
un
it)
q(Å-1
)
x=2

117
the SXRD patterns reveals that patterns of samples with composition x = 0.1, 0.2 and 0.3 have
some extra peaks as compared to those for x = 0.5, 0.8, 1.0, 2.0, 3.0. A comparison of the
diffraction patterns of present CMTO samples with reported patterns of end members CTO and
MTO; reveals that the composition with x = 0.1, 0.2 and 0.3 may be in a mixed phase of CTO
and MTO (i.e. mixed C2/c and R symmetries). In addition, the SXRD pattern of Co3-xMnxTeO6
with x = 0.05 (not shown in Fig. 4.1) shows very weak reflections of MTO (R ) phase.But the
concentration of R phase increases very rapidly with the increase in x. For example, for x =
0.25 (or even x = 0.4) R phase dominates (see Fig. 4.2). Similarly for x = 0.4, minor additional
reflections have been observed (inset of Fig. 4.2). The inset of Fig. 4.2 clearly indicate the
complete crystallographic phase transition at x = 0.5.
As mentioned earlier, ceramic CTO possesses monoclinic (space group C2/c) symmetry,
whereas, MTO exhibits rhombohedral (R ) symmetry.96,196
Visualized crystal structures of CTO
Fig. 4.2. Synchrotron XRD patterns of Co3-xMnxTeO6 with only x
= 0.0, 0.05, 0.25 and 0.5. Inset shows SXRD patterns for x = 0.3,
0.4 and 0.5 for q around ~ 4.8, indicating mix phase behavior
below 0.5.
3 4 5 6 7
4.74 4.80 4.86
q (Å-1)
x = 0.3
x = 0.4
x = 0.5
C2/c phase
x=0.5
x=0.25
x=0.05Inte
ns
ity
(a
rb.
un
it)
q (Å-1)
x=0

118
and MTO are presented in Fig. 4.3. While doping different concentrations of Mn in CTO, it has
been found that for the lower doping concentration (x < 0.5), mixed phases of CTO (C2/c) and
MTO (R ) like symmetries co-exist.
In order to obtain the phase concentrations of R and C2/c quantitatively, two phase Rietveld
refinement has been done for all the samples with x < 0.5, where C2/c and R phases with their
(CTO and MTO) corresponding structural parameters have been used as initial guess.96,196
As
discussed in chapter 2, during the structural refinement, a Pseudo- Voigt and linear interpolation
function has been used to refine the peak shape and background, respectively. The instrumental
broadening has been taken into account by refining SXRD pattern of LaB6. Further, as discussed
in chapter 3, Co in CTO occupies five different crystallographic sites; therefore Mn substitutions
at Co site may have several possibilities of occupying a crystallographic site. On the other hand,
MTO has comparatively simpler crystal structure (all Mn sites are equivalent).96,196
Two phase
Fig. 4.3. (a) CTO, (b) MTO crystal structures with C2/c and R symmetries,
respectively. Red smaller circles represent oxygen atoms, blue and magenta circles
represent Co and Mn atoms, respectively, while the large dark yellow circles show
Te atomic positions (a, b, c axes are as indicated) . Arrow in (b) shows a particular
transition metal in oxygen environment.

119
Reitveld refinement is shown for the samples with x = 0.1 (Fig. 4.4 (a)), x = 0.2 (Fig. 4.4 (b)), x =
0.25 (Fig. 4.4 (c)), and x = 0.0.3 (Fig. 4.4 (d)). Two phase Rietveld refinement analysis shows the
presence of C2/c phase with percentage around 85%, 39% and 4% for x = 0.1, 0.2 and 0.3,
respectively in the mixed phase solid solutions.
It is surprising that small (< 17%) substitution of Co by Mn at A site, leads to the transformation
of C2/c (CTO) phase to R phase. Even for smaller Mn substitutions, volume of R phase is
concentration disproportionate. Phase diagram obtained from Rietveld refinement (two phases
Fig. 4.4. Two phase Rietveld refinement for the composition x = (a) 0.1, (b) 0.2, (c) 0.25 and (d) 0.3, wherein
C2/c and R with their corresponding structural parameters have been taken as inputs. Red circle represent raw
data, black solid line the Rietveld fit, blue vertical bar the Bragg reflections and zigzag magenta line the
difference between observed and calculated intensities.
Inte
nsit
y (
arb
. u
nit
)
Yobs
Ycal
Yobs-Ycal
Reflections
x = 0.1a
RWP = 5.25
χ 2 = 1.86
Yobs
Ycal
Yobs-Ycal
x = 0.2b
RWP = 5.01
χ2 = 1.81
3 4 5 6 7 8
Inte
ns
ity
(a
rb. u
nit
)
q(Å-1)
Yobs
Ycal
Yobs-Ycal
Reflections
x = 0.25c RWP = 3.06
χ2 = 1.40
3 4 5 6 7 8
q(Å-1)
Yobs
Ycal
Yobs-Ycal
Reflections
x = 0.3d
RWP = 2.85
χ2 = 1.08

120
for x < 0.5 and single phase for x ≥ 0.5, which is discussed in the next clause, indicates doping
disproportionate concentration of R phase for x < 0.5 (Fig. 4.4). Doping disproportionate
amount of R and C2/c phase observed for x < 0.5 are due to the change in monoclinic phase to
rhombohedral phase.202
Fig. 4.5. Phase diagram obtained from Rietveld Refinement on the SXRD
data as a function of Mn concentration indicates mixed phases of C2/c and
R for x < 0.5, while pure R phase for x ≥ 0.5. Enlarge data shows the
representative error bar.
0.0 0.5 1.0 1.5 2.0
0
20
40
60
80
100
0
20
40
60
80
100
Phase diagram
R3 p
hase (
%)
C 2
/c p
hase (
%)
x: Mn concentration
Fig. 4.6. (a) Variations of lattice parameters through volume per
formula unit of C2/c phase and (b) R phase as a function of Mn
concentrations for x < 0.5, error bars are within the symbols.
Connecting solid lines are shown just to guide the eye.
1350
1352
1354
1356
1358
0.05 0.10 0.15 0.20 0.25 0.30
676
677
678
C2/c
:Vo
lum
e (Å
3) a
R3:V
olu
me (Å
3)
x: Mn concentration
b

121
Changes in the lattice parameters of both the phases with increasing Mn concentration for x < 0.5
have been estimated through the volume per formula unit (V/Z, Z is the formula unit). Volume
per formula unit of C2/c (CTO) and R (MTO) phases are shown in Fig. 4.6, for x < 0.5. Here, Z
is the ratio of number of atoms in the unit cell divided by number of atom in the chemical
formula. The Rietveld refinement on SXRD data of mix phase samples shows overall increase in
volume per formula unit (Fig. 4.6 (a) and (b)) with the increase in Mn concentration. However,
the same shows a constant value till x = 0.2, followed by sharp increase beyond x = 0.2 for R
(Fig. 4.6 (b)). In literature, various considerations have been taken into account to explain the
structural parameters variation on doping.104,203-205
One of the responsible factors can be different
ionic radii of Mn and Co,203
which may result in internal stresses,
104 defects/impurities,
204 and/or
chemical pressure effect205
. Above discussions suggest that a deeper understanding of the phase
concentration variation of the mixed phase of Co3-xMnxTeO6 (for x < 0.5) is required. Present
work emphasizes detailed studies on obtained single phase (x ≥ 0.5) samples as discussed below.
Fig. 4.7. Rietveld refinement of SXRD patterns for x = 0.5, 1 and 2
indicates the pure R phase.
3 4 5 6 7
x = 0.5
Rwp= 3.92, 2 = 0.47x = 1
Inte
nsit
y (
arb
. u
nit
)
Rwp= 3.71, 2 = 0.43
Rwp= 3.93, 2 = 1.43
x = 2
q (Å-1)
I Reflections
— difference— Simulatedooo Observed

122
Phase x = 0.5 x = 1.0 x = 2.0
a/Ǻ 8.6398(3) 8.7117(1) 8.7964(3)
c/Ǻ 10.4934(2) 10.5628(2) 10.6276(3)
Mn/Co
x/a 0.0413(1) 0.0421( 3) 0.0409(1)
y/b 0.2667(2) 0.26557( 4) 0.2655(3)
z/c 0.2101( 3) 0.21215( 3) 0.2119(2)
B/A2 0.64(4) 0.18( 3) 0.06(2)
Te1
x/a 0.0 0.0 0.0
y/b 0.0 0.0 0.0
z/c 0.5 0.5 0.5
B 0.33(2) 0.06(3) 0.03(4)
Te2
x/a 0.0 0.0 0.0
y/b 0.0 0.0 0.0
z/c 0.0 0.0 0.0
B 0.77(2) 0.03( 2) 0.12(4)
O1
x/a 0.0323(3) 0.0295(1) 0.0289(2)
y/b 0.2077( 1) 0.1971(4) 0.1999(5)
z/c 0.3983( 1) 0.40034( 2) 0.3996(2)
B 0.37(2) 0.02(3) 0.38(3)
O2
x/a 0.1883( 1) 0.1859(1) 0.1868( 4)
y/b 0.1667(2) 0.1614(1) 0.1601(1)
z/c 0.1134(1) 0.1149(3) 0.1135(3)
B 0.78(3) 0.21(2) 0.23(4)
Rp
Rwp
χ2
3.93 3.92 3.71
4.74 3.99 4.16
1.43 0.47 0.74
Table. 4.1. Results of the Rietveld refinement of the crystal structure of the Mn doped CTO samples
(here x = 0.5, 1.0 and 2.0 only) at room temperature using Synchrotron X-ray powder diffraction data
using R space group.
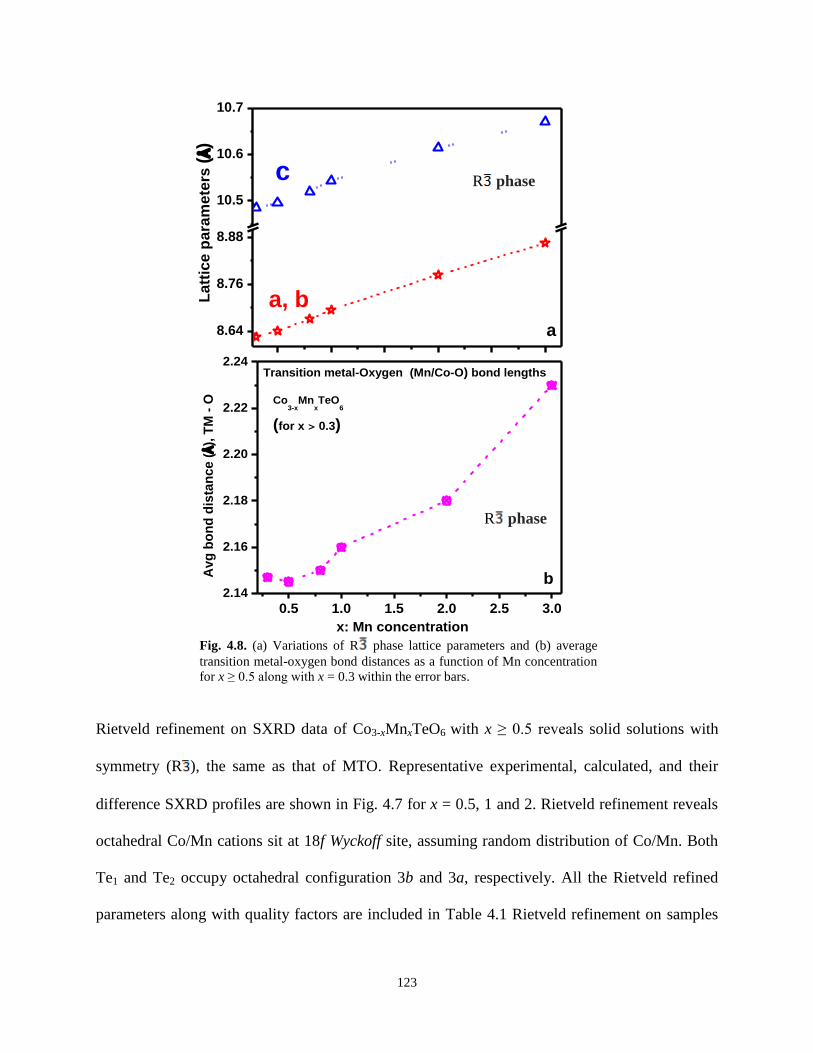
123
Rietveld refinement on SXRD data of Co3-xMnxTeO6 with x ≥ 0.5 reveals solid solutions with
symmetry (R ), the same as that of MTO. Representative experimental, calculated, and their
difference SXRD profiles are shown in Fig. 4.7 for x = 0.5, 1 and 2. Rietveld refinement reveals
octahedral Co/Mn cations sit at 18f Wyckoff site, assuming random distribution of Co/Mn. Both
Te1 and Te2 occupy octahedral configuration 3b and 3a, respectively. All the Rietveld refined
parameters along with quality factors are included in Table 4.1 Rietveld refinement on samples
8.64
8.76
8.88
10.5
10.6
10.7
a
c
La
ttic
e p
ara
me
ters
(Å)
a, b
R phase
0.5 1.0 1.5 2.0 2.5 3.0
2.14
2.16
2.18
2.20
2.22
2.24
Avg
bo
nd
dis
tan
ce (Å
), T
M -
O
x: Mn concentration
Transition metal-Oxygen (Mn/Co-O) bond lengths
Co3-x
MnxTeO
6
(for x > 0.3)
b
R phase
Fig. 4.8. (a) Variations of R phase lattice parameters and (b) average
transition metal-oxygen bond distances as a function of Mn concentration
for x ≥ 0.5 along with x = 0.3 within the error bars.

124
for x ≥ 0.5 indicate almost linear increase in lattice parameters with increasing Mn concentration;
attaining the values of MTO for x = 3 (shown in Fig. 4.8 (a)). Fig. 4.8 (b) shows variations in the
average bond length as a function of Mn concentration (x) for single phase sample. Values
corresponding to x = 3 has been incorporated from Ivanov et al., for comparisons.91-92
On Mn doping, large changes (increase) in the lattice constants (about 0.15 Ǻ) has been
observed. However, the change in lattice parameters is in agreement with those reported in
various other compounds.90-94
In most of these systems, large change in lattice parameters has
been attributed to large change in the ionic radii.,203
the apparent discrepancy, in this case, may
also be solved by invoking mixed oxidation states of Mn and Co in R phase (discussed below).
In order to investigate the effect of doping in the microstructure (bond length and bond angles) of
CMTO, polyhedral investigation with the help of VESTA software on the Reitveld refined
structure has been carried out. We plot the distorted octahedra depicting TM-O bond lengths and
TM-O-TM bond angles as a function of Mn concentrations in Fig. 4.9. We observe considerably
distorted Mn/CoO6 octahedra, which are reflected in the variation of the TM-O bond distances as
well as (O-TM-O) bond angles. On the other hand, Te-O octahedra (TeO6: not shown here) are
Fig. 4.9. Octahedral distortions for x = 0.5, 1.0 and 2.0, obtained from Rietveld refined
structure, clearly showing bond length (in Å) variations. Distortions in the bond
distances can also be seen in the bond angles (O-TM-O) which vary from 75.8 to 73.4o
in upper part and from 108.2 to 106.6o in the lower part as we go from x = 0.5 to x =2.0.
This particular TM has been shown by arrow in Fig. 4.3 (b).

125
less distorted. The TM-O bond lengths (Mn/Co-O) vary between 2.0414 (2) Å and 2.2793 (2) Å
for x = 0.5 and 2.0751 (2) Å and 2.3273 (2) Å for x = 2. Co-Mn-O bond angles vary between
75.8o and 73.4
o in upper part of the octahedra, whereas the same vary between 108.2
o and 106.6
o
in the lower part, with increasing x from 0.5 to 2.0. Mn/CoO6 octahedra seems to have been
contracted as compared to those reported one by S. A. Ivanao et al.,91
as inferred from reduced
bond lengths observed in this work.
The observation of contracted octahedra in these solid solutions, compared to those reported
earlier, may be attributed to the presence of mixed valence TM ions (to be discussed later in this
chapter). We argue that a more distorted octahedral in our samples may be because Co3+
/Mn3+
-
O bonds are smaller as compared to Co2+
/Mn2+
- O bonds.145
As the TM - TM bond lengths
(Mn/Co-Mn/Co) range from 3.2171 (2) Å to 4.4522 (3) Å, which is quite large and thus may
indicate that the exchange interaction is favored through nonmagnetic oxygen anions only.29-30
Smaller TM-O lengths increase the strength of super-exchange interaction which in turn
increases the Neel temperature (TN) (to be discussed in next section of this chapter). We observe
bond angle variation in the upper part of the octahdera (shown in Fig. 4.9), proportional to Mn
concentration, whereas, the variation in lower part is smaller. It may be mentioned that these
bond length and angles are important factors for the interpretation of magnetic interactions in
these solid solutions. The same values for x = 3.0 has been reported to be as 70.46o (upper one)
and 104.0o (lower one).
91 The other important parameters that influences the magnetic properties
are the charge states and the spin states (high spin state for Mn and low/intermediate/high spin
state for Co) of TMs. To study the average oxidation state of TMs, we have performed Mn and
Co K-edge XANES measurements along with Te L3 edge.

126
4.1.2.2. X-ray Absorption Near Edge Structure study
XANES spectra at Co and Mn K-edges of Co3-xMnxTeO6 series have been measured along with
standard references for Co [Co2+
(CoO), Co3+
(CoF3)] and Mn [Mn2+
(MnCl2), Mn2.67+
(Mn3O4)
and Mn3+
(Mn2O3)]. Edge step normalized XANES spectra for Co3-xMnxTeO6 series at Co K
edge is shown in Fig. 4.10. Co K edge XANES spectra are similar for all the studied
compositions. The spectra show a structured pre-edge region and the dominant peak called white
line peak together with main rising edge in between the two.115,146
Here, we emphasize only the
main edge of the XANES spectra, which is normally used for the estimation of average oxidation
state of the sample. More details of interpretation of XANES spectra are given earlier (chapter
2). A close inspection of Fig. 4.10 reveals that the main edge energy corresponding to Co K edge
for the solid solutions of Co3-xMnxTeO6 lie in between those of CoO and CoF3 (see main panel,
Fig. 4.10). It is also important to note that the peak positions (energy position) of 1st derivative
Fig. 4.10. Edge step normalized XANES spectra at Co K edge, which
show gradual shift of main edge energy indicating increase of Co2+
concentration (right inset) with increase in Mn concentration using
maxima in the first derivative of normalized absorption and the
corresponding charge proportion (left inset).

127
shifts towards lower energy with increasing x (right inset of Fig. 4.10), which suggests that
average oxidation state gradually decreases with increasing Mn concentration. In order to
estimate the relative concentration of Co2+
and Co3+
, we note main edge energy positions and use
a simple linear combination formula as discussed earlier (chapters 2 and 3).
Quantitative phase composition analysis by LCF method on XANES data, using Athena
software, has also been carried out.148
Quantitative analysis using LCF and linear combination
formula give the information about relative concentration of Co2+
and Co3+
in the corresponding
solid solutions. For example, above mentioned combined analysis for x = 0.2 results in 37% Co3+
and 63% Co2+
with ~ 2.37 as an average valence state. The relative concentration is shown in left
inset of Fig. 4.10. Further, with increasing x ≥ 0.5 (only single phase), the relative ratio of Co3+
/
Co2+
start decreasing from ~ 0.4 for x = 0.5 to 0.2 for x = 2.0. However, maximum charge
disproportion has been found at x = 0.5 (see left inset of Fig. 4.10). In a single phase material (x
≥ 0.5), we observe that Co3+
/ Co2+
decreases monotonically with increasing x. This is in
agreement with the average TM-O bond length data (in R phase), which is found to be
minimum at x = 0.5.
Similar to Co K-edge, edge step normalized XANES spectra for Mn K-edge (6539 eV) is shown
in Fig. 4.11 (only a few XANES spectra presented for brevity). The shift in the main edge (rising
edge) energy with doping concentration for selected samples is shown in the right inset of Fig
4.11. The left inset of Fig. 4.11 shows LCF fit for x = 0.1. It is clearly evident that the main edge
energy for all the solid solution of Co3-xMnxTeO6 are red shifted (towards Mn2+
from Mn3+
) with
increasing x (right inset of Fig 4.11). Qualitative analysis of the Mn K-edge shifts has been
performed using main edge energies of standards reference samples such as MnCl2, Mn3O4 and
Mn2O3 having formal valence states of Mn2+
, Mn2.67+
and Mn3+
, respectively. Quantitative

128
analysis for the oxidation state of Mn in Co3-xMnxTeO6 has also been performed on Mn K edge
XANES spectra, similar to Co K-edge analysis. We obtain from the combined analysis (Linear
Combination Fitting as well as linear combination formula) that the sample with x = 0.1 (left
inset of Fig. 4.11) shows approximately 70% Mn2+
and 30% Mn3+
and thus ~ 2.30 as an average
valence state of Mn. Moreover, with increase in x value, the ratio of Mn3+
/ Mn2+
decreases from
~ 0.26 for x = 0.5 to ~ 0.13 for x = 2.0 and show maximum at x ~ 0.5 in the concentration range
0.5 < x < 2.
From the analysis of Co and Mn K edge XANES spectra, it is clear that both the transition
metals are in mixed oxidation states of +2 and +3 in Co3-xMnxTeO6. This can be possible only if
at least one of the following cases occur: a) Te is in average oxidation state of lower than +6, b)
Te or TM vacancies, and c) excess interstitial oxygen. Further, in order to probe the Te oxidation
state in Co3-xMnxTeO6 solid solutions, we have carried out Te L3 edge XANES measurements.
Fig. 4.11. Edge step normalized XANES spectra at Mn K edge for x = 0.1
and the corresponding LCF fit (right inset) along with gradual shift of
main edge (raising edge) energy, via maxima in the first derivative, which
indicates increase of Mn2+
concentration with increase in Mn
concentration (left inset).

129
Here, we have considered only the compositions with x = 0.5, 1.0 and 2.0. Fig. 4.12 shows
comparison of Te L3-edge XANES spectra of Co3-xMnxTeO6 solid solution with two standard
references for Te+6
(Te(OH)6) and Te+4
(TeO2). From the main panel and inset of Fig. 4.12, we
find that Te L3-edge XANES spectra for these samples coincide with that of the standard
samples containing Te6+
state. Comparisons of these samples with two standards (Te4+
and Te6+
)
confirm the +6 oxidation state of Te in Co3-xMnxTeO6, which is consistent with other reports.206
Therefore, XANES observations on Mn, Co and Te edges indicate the presence of either excess
oxygen or cations vacancies in the Co3-xMnxTeO6 solid solutions.149-151
Mathew et al., and Ivanov et al.,91-92
have recently reported magnetic properties (magnetic
transition temperature) with change in Mn concentration in the Co3-xMnxTeO6. They have found
that these solid solutions show comparatively higher AFM transition temperature as compared to
the end members (x=0 and x=3). They were unable to correlate the structural changes with the
Fig. 4.12. Te L3 edge XANES spectra of x = 0.5 sample (main panel),
showing +6 oxidation state of Te in the corresponding solid solution. Here
we have used two standards reference samples, TeO2 for Te+4
state and
Te(OH)6 for Te+6
oxidation states, respectively. Inset show 1st derivative
for x = 0.5, 1.0 and 2.0 as a function of energy, indicating the same +6
oxidation state of Te in all the samples.
Te6+
Te4+

130
enhancement in the AFM transition temperatures. Our SXRD and XANES data, on the other
hand, indicate possible structural correlation to the magnetic transition temperatures with change
in Mn concentration. Mn doping at Co site and/or vice versa may affect the structure either
through TM ion’s size or by chemical pressure introduced into the lattice by doping. In Co3-
xMnxTeO6, these changes are reflected in the Mn/Co-O bond distance as well as in O-TM-O
bond angles (Fig. 4.9). In addition to the average TM-O bond distance, which shows a linear
increase (for x ≥ 0.5, Fig. 4.8) with increase in x, the present work reports, for the first time, that
TM ions show mix valence in Co3-xMnxTeO6. Mn/Co mixed valency observed through XANES
would induce different exchange interaction in the sense that super exchange through like spins
(TM2+/3+
-O- TM2+/3+
) and double exchange between unlike spins (TM2+/3+
-O-TM3+/2+
).207-210
Due
to completely antiferromagnetic nature of magnetic order in CTO and MTO, it is likely that the
similar magnetic order may exist in these solid solutions, as well.77,196
Though weak
ferromagnetism in single crystal (which exhibits only single magnetic Co2+
ions) as well as
ceramic CTO (which contains both Co2+
and Co3+
ions) has also been suggested using possible
spin canting and double exchange, respectively.78,97
However, in the present case enhanced
ferromagnetism may also be possible through the double exchange interaction (TM2+/3+
-O-
TM3+/2+
).207-210
4.1.3. Conclusions
In the above discussion, we have explained the structural and spectroscopic variations in CTO on
Mn doping at Co sites using SXRD and XANES measurements. Changes in average TM-O bond
lengths and average oxidation state of TM follow an interesting trend, as we increase Mn from x
= 0.5 to x = 3.0. These changes may perturb the overlap integral of the magnetic interactions and
hence the magnetic transition. Variable oxidation states of TM (both Co and Mn) may also give

131
rise to both FM and AFM magnetic transitions. In order to correlate the structural and
spectroscopic changes with the magnetic properties, we present magnetic measurements on these
solid solutions (only for x ≥ 0.5) in the next section.

132
4.2. Magnetic Properties of Co3-xMnxTeO6; (x = 0.5, 1 & 2)
In this section, we describe DC magnetization studies on Co3-xMnxTeO6 (CMTO); (x = 0.5, 1 and
2) solid solutions. We observe not only near room temperature ferromagnetic interactions but
also low temperature enhanced anti-ferromagnetic interactions for all the compositions. We
explain the observed magnetic properties using our structural and spectroscopic studies,
discussed in the previous section. Finally, we probe the insight into the complex magnetic
behavior by network like structural analysis.
4.2.1. Introduction
The coexistence of magnetic interactions of opposite nature (well accepted phenomenon in
colossal magneto-resistance) leading to complex magnetic behavior has been seen in numerous
magnetic systems like manganites, cobaltites.171,174-177
Role of Griffiths phase like
ferromagnetism in MF systems cannot be overemphasized. We show that the presence of such a
phase in MFs can add to a great advantage. Properties corresponding to type II MF materials,
which are of practical interest, are found only at very low temperatures except for a few
systems.180
Such materials with enhanced MF properties and coupling of various ‘ferro or
antiferro’ magnetic orders along with FE at room temperature are some of the current activities.
In this regard, many doped compounds become intrinsically inhomogeneous due to random
distribution of cation’s sizes, valence/spin states and strong competition between different
ordering tendencies. Compounds on doping, not only show the enhanced coupling at higher
temperature but also the coexistence of more than one magnetic interaction, e. g. AFM and
FM.197-198,100-101
As described earlier, MTO and CTO show AFM transitions (TN, the Neel temperature) at ~ 23 K
and ~26 K, respectively.77,96,196
In this section, we show that Mn doping in CTO (CMTO) not

133
only enhances the AFM transition temperature91-92,100-101
but also show very high temperature
ferromagnetism for all the aforementioned compositions.100-101
In the following, we describe the
underlying mechanism behind these phenomena in details.
4.2.2. Results and Discussion
4.2.2.1. Magnetic behavior of Co3-xMnxTeO6 (x = 0.5, 1 and 2)
Figs. 4.13 (a), (b) and (c) show temperature dependent magnetization for CMTO (x = 0.5, 1.0,
and 2.0) at 100 Oe. All these DC magnetization data have been recorded under ZFC and FC
conditions, as in the case of CTO. We have also used constant magnetic fields of 10 kOe and 50
kOe during the magnetization measurements (to be discussed later). It is interesting to note that
the observed magnetic behaviors for all the compositions are similar but much richer (more
features) than those reported earlier.91-92
Looking from room temperature side, in Figs. 4.13 (a),
(b) and (c), samples exhibit paramagnetic (PM) to FM like transition at a characteristic
temperature TC (Curie temperature) ~ 185 K, which is the same (within ± 2 K) for all the
samples. This feature in the magnetization curve is followed by the AFM transitions at TN ~ 45
K, 40 K and 30 K, for x = 0.5, 1.0, and 2.0 Mn content, respectively. However, in literature,91-92
the reported transition for these solid solutions were AFM like and at temperatures ≤ 40 K. These
values (reported earlier ~ 40 K and observed presently ~ 45 K) are much higher compared to the
Neel temperatures observed in either of the compounds CTO (26 K) or MTO (23 K).77,96,196
To the best of our knowledge, no FM correlation has been reported in CMTO compounds.91-92
We observe FM like transition at T ~ 185 K along with bifurcation in ZFC and FC curves for all
the samples (see Figs. 4.13 (a), (b) and (c)).
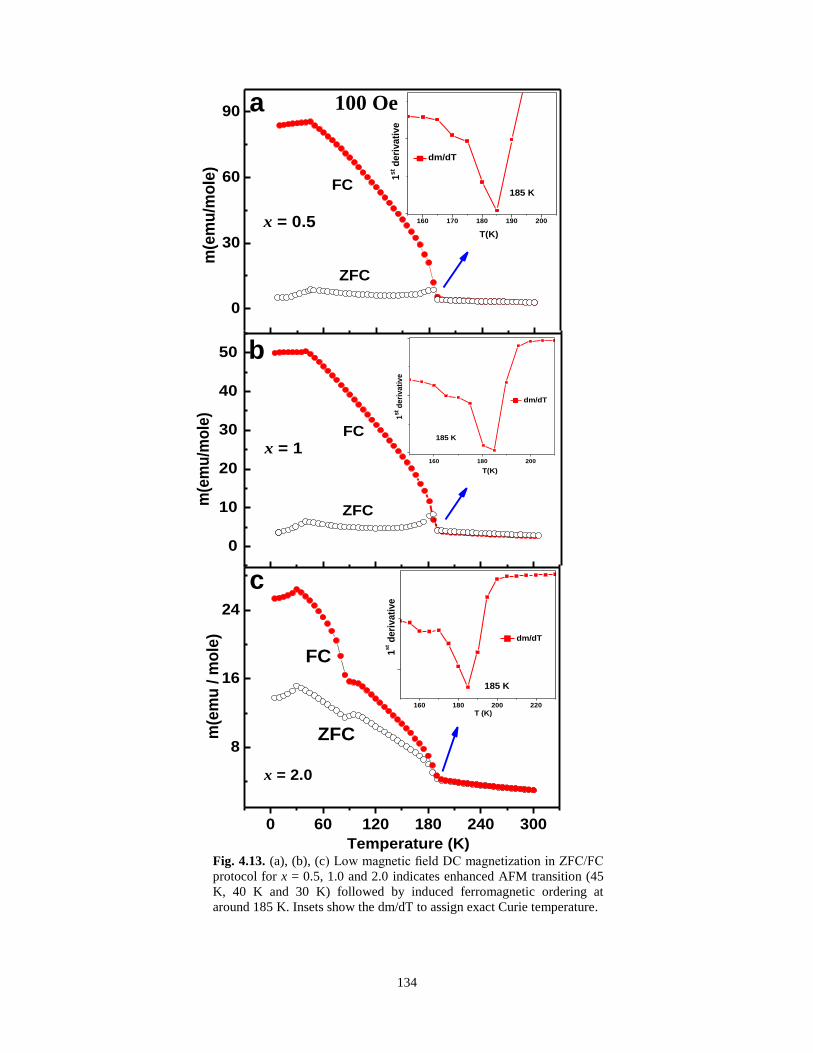
134
Fig. 4.13. (a), (b), (c) Low magnetic field DC magnetization in ZFC/FC
protocol for x = 0.5, 1.0 and 2.0 indicates enhanced AFM transition (45
K, 40 K and 30 K) followed by induced ferromagnetic ordering at
around 185 K. Insets show the dm/dT to assign exact Curie temperature.
0
30
60
90
x = 0.5
ZFC
m(e
mu
/mo
le)
FC
160 170 180 190 200
1st d
eri
vati
ve
T(K)
dm/dT
185 K
100 Oe a
0
10
20
30
40
50
FC
m(e
mu
/mo
le)
ZFC
x = 1160 180 200
1st d
eri
va
tiv
e
T(K)
dm/dT
185 K
b
0 60 120 180 240 300
8
16
24
x = 2.0
ZFC
m(e
mu
/ m
ole
)
Temperature (K)
FC
160 180 200 220
1s
t deri
vati
ve
T (K)
dm/dT
185 K
c

135
-5
0
5
a
M,
10
2
(em
u/m
ole
)
0.5 @ 25 K
0.5 @ 300K
Fig. 4.14. (a), (b), (c): Corresponding magnetic hysteresis (M/H)
measurements at 300 K and 25 K for all samples signify the paramagnetic
behavior at room temperature and FM like at low temperature.
-5
0
5
1.0 @ 25 K
1.0 @ 300K
M,
10
2
(em
u/m
ole
)
b
-9 -6 -3 0 3 6 9
-6
-3
0
3
6
M,
10
2
(em
u/m
ole
)
H (kOe)
2.0 @ 25 K
2.0 @ 300K
c

136
In literature,164-165
the bifurcation in FC–ZFC magnetization data has been attributed to the
presence of a spin-glass, cluster-glass, super-PM behaviour etc. We attribute this feature to a PM
to FM like transition. As discussed in section 3.3 of chapter 3 (for the case of CTO), the
temperature derivative dm/dT of the field-cooled magnetic data visualizes the FM transition, and
is shown in the inset of Figs. 4.13 (a), (b) and (c). The existence of FM correlations (along with
its short range nature) below TN, reported earlier for various other compounds,174,211-212
has been
understood as the presence of FM correlation inside AFM matrix. The statement made during the
analysis of magnetization data, is confirmed through the magnetic hysteresis data, as can be seen
in Figs. 4.14 (a), (b) and (c). The PM state is confirmed by the reversible linear M-H curve at
300 K, and the persistence of FM nature from 185 K down to 10 K is revealed by the M-H loop.
The loop does not show any signature of saturation up to 10 kOe, which indicates the presence of
significant AFM contribution. In addition, the magnetic hysteresis loop at 25 K signifies the
existence of ferromagnetism even below TN, suggesting the coexistence of FM and AFM phases.
The presence of FM correlations is also manifested through the CW fit of the inverse magnetic
susceptibility -1
(H/M) data (see Fig. 4.15). It can be seen that all the -1
vs T curves follow CW
law just above TGP ∼190 K (onset of downturn), with an effective magnetic moment, μeff ~ 8.97 -
9.42 μB / f. u. and a PM negative Curie temperature, ΘCW ~ 49.1 K to 68.8 K for x = 0.5 to x =
2.0, respectively. Both values (μeff and ΘCW) are significantly larger than the previous reports of
ΘCW (-ve) ranging from about 35 K to 45 K and μeff ~ 5.8 - 6.0 μB / f. u.91-92
In Table 4.2, we
tabulate all the fitted parameters observed from CW fit for all x values. As we go from x = 0.5 to
x = 2.0, ΘCW increases while TN decreases, indicating weakening of AFM interactions on Mn
doping. Interestingly, the observed larger magnetic moment, which increases with Mn
concentration, indicates FM cluster type interactions in our samples,213
as discussed further.

137
Table 4.2. Effective Bohr magneton (μeff) and λ values for both GP and PM phase obtained from fitted
parameters (observed through CW fit) and modified CW law for CMTO. Maximum errors in μeff and λ
are 0.06 and 0.005, respectively.
x = 0.5 1.0 2.0
H (Oe) 100 10000 50000 100 10000 50000 100 10000 50000
μeff (μB/f.u.) 8.97 9.14 9.25
9.03 9.22 9.33 9.42 9.67 9.83
λPM 0.002 0.003 0 0.004 0.003 0 0.003 0.004 0
λGP 0.80 0.29 - 0.76 0.244 - 0.62 0.145 -
Fig. 4.15. FM correlations is manifested through the CW fit of the
inverse magnetic susceptibility (H/M) data for CMTO (x = 0.5, 1 and
2) solid solutions, inset enlarge the linear part. Data has been offset
along Y-axis for clarity.
2.0 2.2 2.4 2.6
0.3
0.6
0.9
1.2
1.5
= 0.62
= 0.76
= 0.80
Lo
g (
H/M
)
Log (T-TR
c)
0.5
1.0
2.0
0
Log (T-TRc )
Lo
g (
H/M
)
Fig. 4.16. Magnetization difference curve as a function of temperature
for CMTO (x = 0.5, 1 and 2). This is just to show additional transitions
at 118 K, 112 K and 83 K.
0 50 100 150 200
83 K
112 K
0.5
1.0
2.0
(
FC-
ZF
C,
em
u/m
ole
)
Temperature (K)
118 K

138
Evidence of short range FM correlation is also presented through the down turn in the (log-log
plot) inverse susceptibility data (a hallmark of GP)168-170
and magnetization difference
curve,169
and are shown in Fig. 4.15 and Fig. 4.16, respectively. Fig. 4.15 represents one of the
main characteristics of GP i.e., it follows power law: χ-1
= (T-TCR)1-λ
, where 0 < λ < 1 and TCR
=
TN. The λ values for paramagnetic (λPM) and Griffiths phase (λGP) are tabulated in Table 4.2. We
find λGP increases with increasing x from 0.62 to 0.80 for the increase in x from x = 0.5 to x =
2.0. These values of λGP correspond to strong FM correlation in CMTO.166-170
One of the possible
reasons for this ferromagnetic ordering is TM2+
- O - TM3+
networks (as a result of the
replacement in TM2+
by TM3+
in TM2+
-O-TM2+
networks). This is because of coexistence of
mixed oxidation states (+2 and +3) of Co and Mn, as described in section 4.2 of this chapter, and
the fact that unlike spins favor FM interactions while like spins favor AFM interactions.207-210
Furthermore, the FM correlation is also clear from the magnetization difference (MFC-MZFC)
versus temperature plot. Fig. 4.16 shows the temperature-dependent ΔM = MFC-MZFC curves at
100 Oe. This subtraction advantageously eliminates PM and diamagnetic contributions and
Fig. 4.17. Representative hysteresis loop for CMTO; x
= 0.5 at 180 K, 150 K and 100 K.
-1.5 -1.0 -0.5 0.0 0.5 1.0 1.5
-140
-70
0
70
140
x = 0.5
m(e
mu
/mo
le)
H(kOe)
100 K
150 K
180 K
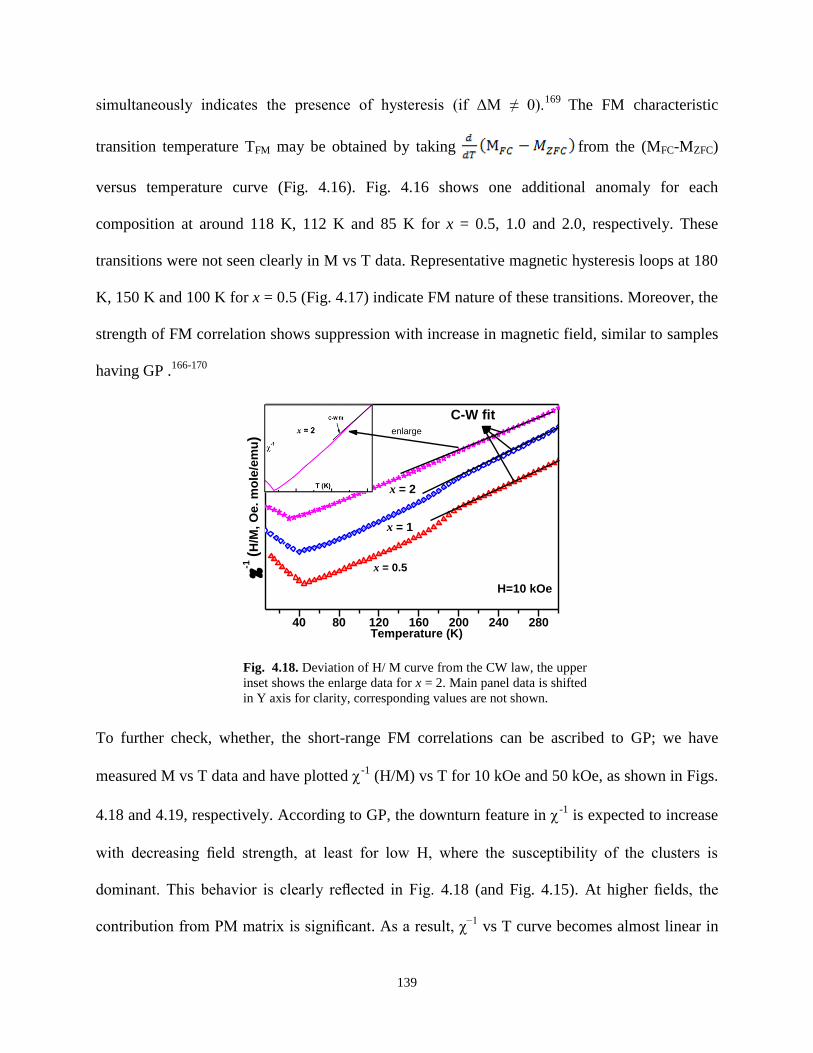
139
simultaneously indicates the presence of hysteresis (if ΔM ≠ 0).169
The FM characteristic
transition temperature TFM may be obtained by taking from the (MFC-MZFC)
versus temperature curve (Fig. 4.16). Fig. 4.16 shows one additional anomaly for each
composition at around 118 K, 112 K and 85 K for x = 0.5, 1.0 and 2.0, respectively. These
transitions were not seen clearly in M vs T data. Representative magnetic hysteresis loops at 180
K, 150 K and 100 K for x = 0.5 (Fig. 4.17) indicate FM nature of these transitions. Moreover, the
strength of FM correlation shows suppression with increase in magnetic field, similar to samples
having GP .166-170
To further check, whether, the short-range FM correlations can be ascribed to GP; we have
measured M vs T data and have plotted -1
(H/M) vs T for 10 kOe and 50 kOe, as shown in Figs.
4.18 and 4.19, respectively. According to GP, the downturn feature in -1
is expected to increase
with decreasing field strength, at least for low H, where the susceptibility of the clusters is
dominant. This behavior is clearly reflected in Fig. 4.18 (and Fig. 4.15). At higher fields, the
contribution from PM matrix is significant. As a result, χ−1
vs T curve becomes almost linear in
Fig. 4.18. Deviation of H/ M curve from the CW law, the upper
inset shows the enlarge data for x = 2. Main panel data is shifted
in Y axis for clarity, corresponding values are not shown.
40 80 120 160 200 240 280
x = 2
x = 1
-1
(H
/M,
Oe
. m
ole
/em
u)
Temperature (K)
x = 0.5
C-W fit
H=10 kOe
enlarge

140
GP region, as shown in Fig. 4.19. Similar downward turn (and the corresponding suppression) in
χ−1
(T) has also been observed in several other compounds, and is attributed to GP, owing to the
formation of nano size FM domains.168-170
Formation of nano-size Griffiths-like FM clusters has
also been demonstrated by small-angle neutron scattering in Tb5Si2Ge2.214
Often, the same is
reflected in the very large value of effective Bohr magneton, μeff and is discussed earlier in the
current section.
Fig. 4.19. Very high magnetic field χ (H/M) and χ-1
curve for
CMTO, which signifies another characteristic of GP. The CW
fit indicates absence of GP at 50 kOe.
0 80 160 240
4
6
8
10
12
Temperature (K)
mo
men
t (1
02em
u/m
ole
)
50 KOe
0.5
1
2
(
Oe
. m
ole
/em
u)
Linear fit - CW law
Fig. 4.20. Unaltered values of TN at various magnetic
fields for CMTO (x = 0.5, 1 and 2).
0 10k 20k 30k 40k 50k
30.0
39
42
45
x = 2.0
x = 1.0
TN
H (Oe)
x = 0.5

141
So far, we have illustrated the signatures of FM correlations along with its short-range nature in
CMTO (x = 0.5, 1 and 2) solid solutions using M vs T and M vs H studies. This feature has been
attributed to the FM nano phase embedded in AFM matrix, which is also called Griffiths phase.
This is quite unusual because the same was not observed in previous investigations of CMTO.91-
92 We attribute this GP like anomaly to the presence of mixed valence TM ions in our samples.
Also, as the Mn content is changed, it modifies the H/M vs T curves very significantly and
changes the value of λG (Table 4.2). The downturn feature of the H/M curve shows suppression,
whereas, there is no change in AFM transition temperatures (TN), as shown in Fig. 4.20, with the
increase in the Co/Mn ratio. Our observations also support the absence of ferromagnetism in
MTO, whereas a very weak presence of FM interactions in CTO.78,96
In the following, we study
structural data in order to understand magnetic behaviour of CMTO samples.
4.2.2.2. Structural insight for the observed magnetic behavior
We present detailed structural studies in order to find its possible correlation to magnetic
behavior presented in preceding paragraphs..92
Fig. 4.21 shows representative layer and
equilateral triangular arrangements of Mn/Co (ions structure) of studied CMTO solid solution at
room temperature for x = 0.5. Oxygen is not shown for the sake of clarity. First we show the
polyhedral view of a representative R-3 structure for x = 0.5 (Fig. 4.21 (a)). Simplified unit cell
of CMTO solid solution is displayed through Mn/Co ions in Fig. 4.21 (b). From the side view
along a- or b- axis, a layer structure is observed (Fig. 4.21 (b)), and from the top view along c
axis, an equilateral triangular arrangement of Mn/Co ions can be found (Fig. 4.21 (b)). Fig. 4.21
(c) (slightly tilted from Fig 4.21 (b)) show the equilateral triangles (length = 3.699 Å) consisting
of Mn ions. Only few triangles are shown.

142
Fig. 4.21. (a) Polyhedral view along (010), (b) layered structure (side view
from b-axis) of Mn/Co ions, (c) equilateral triangular arrangements (top view
along b axis) of Mn/Co ions located at different layers, and (d) network type of
structure through oxygen along c-axis (a-b plane).
(a)
(d)

143
These triangles belong to different layers. Furthermore, a network structure is also presented
(Fig. 4.21 (d)) perpendicular to c-direction (a-b plane). The above analysis indicates that there
are triangular cycles, which may be comprised of Mn/Co/Mn and Co/Mn/Co sites, stacked along
c axis of the unit cell, very similar to the earlier observation by Ivanov et al.,92
predicted using
neutron diffraction study. The connectivity of TM or Mn/Co cations with increasing Mn
concentration shows a deviation from the ideal triangular lattice, distortions due to which are
reflected in the displacements of TM ions from their initial sites.91-92,100,196
Further, to have an
insight we have shown triangular structure in Fig 4.21 (d), similar to the one shown in literature
based on neutron diffraction.92
It shows the possible cationic arrangements for this geometry
along c axis, which can extend throughout the lattice through periodic translation. They are
attached through O atoms which prefer to have either super exchange or double exchange
interactions. Our earlier report100
clearly elaborates the increasing nature of average bond
distances and resulting distortion in the lattice decreases the magnetic interactions in these
CMTO solid solutions.
Finally, we have discussed and demonstrated the origin of Griffiths-like anomaly in CMTO solid
solutions. In the structural section, we speculate all the possible cause related to competing FM
and AFM interactions. Comparison of the present CMTO samples with those reported by Ivanao
at. el, and Mathew et al.,91-92
reveals that because of mixed oxidation states in TM ions in our
samples, there is a possibility of double exchange between unlike spins (e. g. Co3+
- O - Co2+
,
Mn3+
- O - Mn2+
)) favoring ferromagnetic interactions. However, few reports on other
compounds contradict the conjecture that the the existence of Griffiths phase may not be because
of mixed valance.215
Also, the presence of Co3+
/Mn3+
in the triangular lattice of Mn/Co/Mn and
Co/Mn/Co, may lead to frustration and hence, spontaneously induce FM and or AFM

144
interaction, apart from major AFM interaction proposed earlier.91-92
This may cause disorder /
magnetic inhomogeneity in CMTO samples leading to GP.166-170
Moreover, JT distortion (due to
TM3+
) can also induce GP like FM.166-168
But we do not consider JT effect in the present study
because, out of the three known modes of octahedral distortions (breathing, basal plane and
stretching modes), breathing mode (which can’t be responsible for GP) is found in our CMTO
samples.100
4.2.3. Conclusions
We identify CMTO (x = 0.5, 1 and 2) solid solutions as a potential magnetic material having
high temperature FM interactions, low temperature enhanced AFM interactions. This is
demonstrated through detailed magnetization (M vs T and M vs H) studies. Inverse magnetic
susceptibility vs temperature data provide clear indication of Griffiths like FM phase extended
over large thermal region. This FM phase is robust against applied magnetic field. Both FM and
AFM phases are sensitive to the content of Co/Mn ratio. We also attempt detailed structural
studies in order to find its possible correlation to the magnetic behavior possessed by CMTO
solid solutions.
To conclude this chapter, we have synthesized polycrystalline samples of Co3-xMnxTeO6 (0 < x ≤
2) using conventional two step solid state reaction route with Co3O4, Mn3O4 and TeO2 (in off-
stoichiometric ratio). We have carried out structural and spectroscopic investigations in order to
find the structural correlation with magnetic behaviour of these solid solutions as a function of
Mn concentration using SXRD, XANES and magnetization studies. Structural studies using
Rietveld refinement reveal R structure for x ≥ 0.5, whereas mixture of C2/c and R phases for x
< 0.5. For x ≥ 0.5, increase in lattice parameters and average TM - O bond distances with
increasing Mn concentration naturally corroborate with the observed as well as reported

145
magnetic behavior of enhanced AFM transition temperatures in CMTO. Analysis of XANES
spectra at Co and Mn K-edges show mixed oxidation states of Co2+
/Co3+
and Mn2+
/Mn3+
.
Quantitative analysis of the oxidation state using Linear combination fit (LCF) indicates gradual
increase in Co2+
and Mn2+
with increase in Mn concentration. Relative ratios of Co3+
/Co2+
and
Mn3+
/Mn2+
are found to be maximum at around x ~ 0.5, where the corresponding <Co/Mn-O>
bond lengths are minimum. Approximately at the same concentration, maximum TN (~ 45 K) has
been observed and could be correlated with the observed structural and spectroscopic results,
which also show anomalous behavior in average bond lengths and charge ratio at x ~ 0.5.
Further, we identify Co3-xMnxTeO6 (x = 0.5, 1 and 2) solid solutions as an interesting magnetic
material having coexistence of high temperature ferromagnetic and enhanced low temperature
antiferromagnetic transitions, demonstrated through detailed magnetization (M vs T and M vs
H) studies. We believe such high temperature FM and low temperature enhanced AFM transition
temperatures in CMTO would attract further research with an aim to achieving room temperature
FM and low temperature AFM together with strong dielectric coupling. Our detail structural,
spectroscopic and magnetic studies indicate that CMTO could be an important material for future
technological application as well as fundamental research.

146

Chapter 5
Conclusions and
Future Work

147
In this thesis, we have carried out structural and spectroscopic studies on TM based oxides and
MFs .1-3
TM and their complexes exhibit variety of structures and properties due to the unique
nature of their outer shell d-electrons. These electrons in TMOs manifest themselves in many
different ways leading to interactions among charge, spin, lattice and orbital degrees of freedom.
These systems have also been proposed to be of great technological importance. For example
ME MFs,2-3
which offer opportunities for applications in information storage, spin electronics,
magneto-electronics and solar cells.4-17
A number of MFs possessing cationic and anionic non-
stoichiometry are also useful in many other applications such as energy conversion, oxygen
sensing, oxygen storage etc.18-20
Recently, Co3TeO6 (CTO: a type-II MF material and the only low symmetry compound in
A3TeO6 family; A= Cu, Mn, Co, Ni) has been reported to show favourable characteristic, which
exhibits very interesting structural as well as low temperature MF properties. Its monoclinic
crystal structure with multiple magnetic transitions (at very low temperatures) makes CTO very
interesting from fundamental point of view. However, due to very complex crystal as well as
magnetic structures, understanding of origin and of the magnetic transitions is still under debate.
We have performed structural and spectroscopic studies in corroboration with magnetic,
dielectric and polarization measurements in an attempt to understand underlying phenomena.
Single phasic ceramic CTO is synthesized using solid state reaction route. Rietveld refinement
analysis on high resolution Synchrotron X-ray diffraction data suggests that only off-
stoichiometric ratio of Co3O4 and TeO2 reactants and two step solid state reaction route give rise
to single phase of CTO. During synthesis, initial ingredient Co3O4 is found better than CoO in
circumventing the intermediate Co5TeO8 or CoTeO3 phases. Detailed growth reaction
mechanism suggest formation of intermediate phase (CoTeO4: monoclinic symmetry), which on

148
calcinations leads to the formation of single phase of CTO (monoclinic symmetry). This may be
due to the diffusion of unreacted high symmetry Co3O4 phase (Fd3m) into lower symmetry
CoTeO4 phase (P21/c) during the intermediate calcinations. Rietveld analysis show wider
variations in bond lengths and bond angles in our ceramic sample compared to those reported in
literature for single crystal as well as ceramic CTO, which may lead to the observance of
additional possible cation valency. Thorough structural study suggests low symmetry structure of
CTO. Implications of such lower symmetry structure (compared to other members of A3TeO6
family) are seen in its low temperature complex magnetic structure.
Spectroscopic characterizations using XANES and XPS show the mixed oxidation state (Co2+
and Co3+
) of Co in CTO. We attribute observed wider variations in bond lengths to the presence
of mixed valence Co ions. Further, the analysis of pre-edge XANES spectra shows that both
Co2+
and Co3+
are in high spin states. Curie-Weiss fit of the high field magnetization data, which
show only two magnetic transitions (TN1 ~ 26 K and TN2 ~ 18 K), give higher magnetic moment
compare to that reported for single crystal CTO. The observed value of magnetic moment
support our observation of high spin mixed oxidation state of Co. This observation is also
confirmed with first principles ab-initio calculations, which shows that the minimum energy
configuration for the system remains for high spin states of Co2+
and Co3+
. Te L3-edge XANES
and synthesis of CTO in oxygen deficient (vacuum and argon) conditions indicate that the
plausible charge imbalance due to different oxidation states of the Co-cations may be
compensated by Te-cation vacancy.
Low field magnetization data show all the five magnetic transitions (~ 34 K, 26 K, 21 K, 17.4 K
and 16 K) in CTO, which indicates its complex magnetic ground state. It is important to note
here that different groups have reported different set of magnetic transitions including two main

149
magnetic transitions (TN1 ~ 26 K and TN2 ~ 17.4 K) in CTO. This indicates that MF properties of
CTO depend on the method of synthesis and thus understanding the growth mechanism is
crucial, which may explain its complex magnetic structure. In addition, we observe bifurcation
(~ 60 K) in the zero field cooled and field cooled magnetization curves at lower magnetic fields
(H < 500 Oe) and its disappearance under higher (> 500 Oe) magnetic fields indicating the
presence of zero field magnetization in CTO. Magnetic hysteresis data also show very weak
hysteresis at very low temperatures. Analysis of the magnetic data (M vs T and M vs H) suggests
the presence of Griffiths phase in CTO, showing short range ferromagnetic nano domains in an
anti-ferromagnetic matrix. Weak ferromagnetic correlation may be explained through the mixed
valence of Co ions due to the presence of Co2+
-O-Co3+
networks (which favour ferromagnetic
interactions) along with Co2+
-O- Co2+
networks (which normally favour anti-ferromagnetic
interactions).
Origin of multiple magnetic transitions is investigated by using room temperature structural
(SXRD) data and their Rietveld refined structure of our ceramic as well as those of reported
single crystal CTO. Our analyses indicate four structural networks, which may be correlated with
aforementioned multiple magnetic transitions observed both in single crystal as well as in
ceramic CTO. This is because, various polyhedral configurations of Co ions experience different
crystal fields leading to their different electronic/spin configurations. This observation is in
agreement with the observation of only two networks proposed by Wang et al., based on their
low temperature neutron diffraction data.
Temperature and magnetic field dependent DC magnetization, dielectric constant and
polarization (measured through pyroelectric current) measurements suggest the magneto-electric
and magneto-dielectric couplings in CTO. Dielectric constant data shows a step anomaly at 18 K

150
(T2: which is also TN2 observed in the magnetization data). Furthermore, shift of 18 K towards
lower temperature and reduction of the overall magnitude of dielectric constant below 18 K on
the application of magnetic fields confirm the magneto-electric and magneto-dielectric couplings
in CTO. Together with these, the polarization measurements show the possibility of spontaneous
electrical polarization in CTO. Lowering of T2 (AFM transition temperature) on applying
magnetic field indicates strong coupling between electric and magnetic orders. In this phase (at
lower temperatures) weak magnetization is observed along with very weak hysteresis attributed
to Griffiths like ferromagnetic clusters of nano size domains. Our results further indicate that
ceramic CTO is a strongly coupled multiferroic material. These observations on our ceramic
CTO not only investigate magneto-electric multi-ferroic behaviour but also show additional
features such as magneto-dielectric and mixed valence Co (not reported so far).
Furthermore, in an effort to enhance the coupling strength and the temperature at which the
material shows MF behavior, we have prepared Co3-xMnxTeO6; (0 < x ≤ 2) solid solutions. Room
temperature structural and spectroscopic investigations on these solid solutions as a function of
Mn concentration using SXRD and XANES measurements, respectively, indicate doping
disproportionate mixing of monoclinic (C2/c) and rhombohedral (R ) structures for x < 0.5,
while only R phase for x ≥ 0.5. Relative ratios of Co3+
/Co2+
and Mn3+
/Mn2+
decrease with
increasing x (for x ≥ 0.5). Interestingly, the ratios of Co3+
/Co2+
and Mn3+
/Mn2+
are found to be
maximum at around x ~ 0.5, where the corresponding average <Co/Mn-O> bond length is
minimum. Approximately at the same concentration, maximum TN has been observed. These
evidences are used to provide interpretation of the observed enhancement in the AFM transition
to ~ 45 K for x = 0.5, whereas, the transition temperatures for the end member CTO (x = 0) and
MTO (x = 3) are ~26 K.

151
Moreover, detailed analysis of the magnetic data (M vs T and M vs H) on CMTO solid solutions
not only suggest enhancement in the AFM transition temperature to ~ 45 K but also show near
room temperature ~ 185 K short-range robust FM correlation. Griffiths-like ferromagnetism
exists over an extended temperature range (up to 185K) and is finite even for an applied
magnetic field of 1 T, indicating its robustness. This may further be attributed to the observed
anomalies in TM-O bond lengths as well as mixed charge states of TMs for Co3-xMnxTeO6.
Future work
a) Low temperature X-ray and neutron diffraction
It would be interesting to study low temperature SXRD as well as neutron diffraction and
correlate possible anomalies in lattice parameters to the magnetic transitions in CTO as well as
CMTO. These studies are expected to provide information on the nature of the magnetic
transitions. For example, whether these transitions have structural origin or not?. By using low
temperature evaluation of bond distances and other structural parameters, one may also provide a
possible probe for spin lattice coupling in CTO and CMTO. Exact identifications of these
transitions however would specially need detailed neutron diffraction measurements at low
temperature.
b) Low temperature heat capacity measurements:
One of the interesting observations from this thesis work is the difference in high and low field
magnetization data, wherein zero (low) magnetic field magnetic behaviour of CTO shows
various multiple magnetic transitions compared to the only two magnetic transitions at higher
magnetic fields. This is consistent with the magnetization data of single crystal CTO and various
other compounds, reported in literature. To the best of our knowledge, the origin of this
difference is not yet understood. Further, in order to find the origin of large variation in the

152
number of magnetic transitions observed by various groups as well as in the present study, we
have planned for detail specific heat measurements. The temperature and the magnetic field
dependence of the same measurement would also be a main goal.
c) TGA measurements under oxygen reduced condition (> 600 oC)
In this thesis, we have reported results on CTO samples synthesized in oxygen deficient
conditions to conclude that the TM charge excess cannot be explained by oxygen excess. This
conclusion is based on an indirect way. For direct measurements, we had perfomed EDS
measurements, however, it was not being conclusive. A direct measurement may be TGA/DTA
or DSC of CTO in oxygen reduced environment, may be done to estimate oxygen concentration
(>6000C). As an origin of the enhanced multiferroicity in our ceramic samples as compared to
reported single crystal, we have concluded that it may be cation vacancies which play role to the
observed mixed valency in our samples and is not because of oxygen non-stoichiometry. As a
further confirmation about the oxygen anion concentration, we have planned for performing
TGA under oxygen reduced condition (> 600 oC), as the future studies.

153
References:
1. C. N. R. Rao, A. Sundaresan and R. Saha, J. Phys. Chem. Lett. 3 (16), 2237 (2012).
2. H. Schmid, Ferroelectrics 162, 317 (1994).
3. N. A. Hill, J. Phys. Chem. B 104, 6694 (2000).
4. A. Kargol, L. Malkinski, and G. Caruntu, “Advanced Magnetic Materials” Dr. Leszek
Malkinski (Ed.), ISBN: 978-953-51-0637-1, InTech, (2012).
5. S. R. Pattan, S. B. Pawar, U. D. Gharate and S. B. Bhawar, Indian Drugs 49, 5 (2012).
6. E. Papisa, F. Rossia, M. Raspantib, I. D. Donnec, G. Colomboc, A. Milzanic, G.
Bernardiniad and R. Gornatia, Toxicol. Lett. 189, 253 (2009).
7. S. Fusil, V. Garcia, A. Barthélémy and M. Bibes, Ann. Rev. of Mat. Res. 44, 91 (2014).
8. R. Ramesh, Nature Mater. 9, 380 (2010).
9. S. A. Wolf, D. D. Awschalom, R. A. Buhrman, J. M. Daughton, S. Von Molnár, M. L.
Roukes, A. Y. Chtchelkanova and D. M. Treger, Science 294, 1488 (2001).
10. J. Mannhart and D. G. Schlom, Science 327, 1607 (2010).
11. M. Gajek, M. Bibes, S. Fusil, K. Bouzehouane, J. Fontcuberta, A. Barthélémy and A. Fert,
Nature Mater. 6, 296 (2007).
12. A. Roy, R. Gupta and A. Garg, Adv. in Cond. Matt. Phys., 2012, 926290 (2012).
13. A. P. Pyatakov and A. K. Zvezdin, Phys. Usp. 55, 557 (2012).
14. J. M. Slaughter, Annu. Rev. Mater. Res. 39, 277 (2009).
15. R. Nechache, C. Harnagea, S. Li, L. Cardenas, W. Huang, J. Chakrabartty and F. Rosei,
Nature Photonics 9, 61 (2015).
16. M. A. Jalaja and S. Dutta, Adv. Mat. Lett. 6, 7 (2015).
17. T. Choi Y. Horibe, H. T. Yi, Y. J. Choi, and S.W. Cheong, Nat. Mater. 9, 253 (2010).
18. M. Mostovoy, Nat. Mater. 9, 188 (2010).
19. J. Seidel, L. W. Martin, Q. He, Q. Zhan, Y.-H. Chu, A. Rother, M. E. Hawkridge, P.
Maksymovych, P. Yu, M. Gajek, N. Balke, S. V. Kalinin, S. Gemming, F. Wang, G.
Catalan, J. F. Scott, N. A. Spaldin, J. Orenstein and R. Ramesh, Nat. Mater. 8, 229 (2009).
20. J. Meyer, S. Hamwi, M. Kröger, T. Riedl and A. Kahn, Adv. Mater. 24, 5408 (2012).
21. N. Izyumskaya, Y. Alivov and H. Morkoç, Crit. Rev. in Sol. St. & Mat. Sci. 34, 89 (2009).

154
22. C. Yuan, H. Bin Wu, Yi Xie and X. W. D. Lou, Angew. Chem. Int. Ed. 53, 1488 (2014).
23. S. Maekawa, T. Tohyama, S. E. Barnes, S. Ishihara, W. Koshibae, and G. Khaliullin,
“Physics of Transition Metal Oxides” Springer, Berlin, (2004).
24. F. J. Morin, Bell System Tech. J. 37, 1047 (1958).
25. N. B. Aetukuri, A. X. Gray, M. Drouard, M. Cossale, L. Gao, A. H. Reid, R. Kukreja, H.
Ohldag, C. A. Jenkins, E. Arenholz, K. P. Roche, H. A. Dürr, M. G. Samant and S. S. P.
Parkin, Nature Physics 9, 661 (2013).
26. K. I. Kugel and D. I. Khomskii, Sov. Phys. Usp. 25 (4), (1982).
27. C. A. Marianetti, D. Morgan and G. Ceder, Phys. Rev. B 63, 224304 (2001).
28. D. L. Wood and J. P. Remeika, The Journal of Chemical Physics 46, 3595 (1967).
29. J. B. Goodenough, “Magnetism and Chemical Bond” Inter-science, New York, (1963).
30. W. Geertsma and D. Khomskii, Phys. Rev. B 54, 3011 (1996).
31. J. C. Maxwell, Philos. Trans. of the Royal Society of London 155, 459, (1865).
32. W. C. Röntgen, Ann. Phys. 271, 264 (1888).
33. H. Schmid, J. Phys.: Condens. Matter 20, 434201 (2008)
34. I. E. Dzyaloshinskii, Sov. Phys. JETP 10, 628 (1959).
35. D.N. Astrov, Sov. Phys. JETP 13, 729 (1961).
36. J. Wang J. B. Neaton, H. Zheng, V. Nagarajan, S. B. Ogale, B. Liu, D. Viehland, V.
Vaithyanathan, D. G. Schlom, U. V. Waghmare, at el., Science 299, 1719 (2003).
37. T. Kimura, T. Goto, K. Ishizaka, T. Arima and Y. Tokura, Nature 426, 55 (2003).
38. M. Mostovoy, Phys. Rev. Letts. 96, 067601 (2006).
39. S. Lee, M. T. F. Diaz, H. Kimura, Y. Noda, D. T. Adroja, S. Lee, J. Park, V. Kiryukhin,
S.W. Cheong, M. Mostovoy and Je Geun Park, Phys. Rev. B 88, 060103 (2013).
40. G. Catalan and J. F. Scott, Advanced Materials 21, 2463 (2009).
41. D. Khomskii, Physics 2, 20 (2009).
42. E. Giliolia and L. Ehm, IUCrJ 1, 590 (2014).
43. N. C. Wen, M. I. Bichurin, S. Dong, D. Viehland and G. Srinivasan, J Appl. Phys. 103,
031101 (2008).
44. Y. Zhang, L. Zheng, D. Chaoyong, M. Jing, L. Yuanhua and C. W. Nan, Appl. Phys. Letts.
92, 152510 (2008).

155
45. M. Hambe, A. Petraru, N. A. Pertsev, P. Munroe, V. Nagarajan and H. Kohlstedt, Adv.
Funct. Mater. 20, 2436 (2010).
46. J. van den Brink and D. I. Khomskii, J. Phys.: Condens. Matter 20, 434217 (2008).
47. Y. Miyamoto, S. Ishihara, M. Takada and N. Suzuki, Sol. St. Commun. 89, 51 (1994).
48. N. Ikeda, K. Kohn, N. Myouga, E. Takahashi, H. Kitoh and S. Takekawa, J. Phys. Soc.
Japan 69, 1526 (2000).
49. B. V. Aken, T. T. M. Palstra, A. Filippetti and N. A. Spaldin, Nature Mater. 3, 164 (2004).
50. R. Moessner and A. P. Ramirez, Phys. Today 59, 24 (2006).
51. A. R. Bishop, A. B. Holder, S. Kamba and M. Maglione, Phys. Rev. B 81, 064106 (2010).
52. C. M. Hurd, Contemporary Physics, 23, 469 (1982).
53. I. Dzyloshinskii, J. Phys. Chem. Solid 4, 241 (1958).
54. H. Katsura, N. Nagaosa and A. V. Balatsky, Phys. Rev. Lett. 95, 057205 (2005).
55. H. Wu, T. Burnus, Z. Hu, C. Martin, A. Maignan, J. C. Cezar, A. Tanaka, N. B. Brookes,
D. I. Khomskii and L. H. Tjeng, Phys. Rev. Lett. 102, 026404 (2009).
56. L. N. Bulaevskii, C. D. Batista, M. V. Mostovoy and D. I. Khomskii, Phys. Rev. B 78,
024402 (2008).
57. J. H. Park, E. Vescovo, H. J. Kim, C. Kwon, R. Ramesh and T. Venkatesan, Nature 392,
794 (1998).
58. J. F. Scott, Nature Mater. 6, 256 (2007).
59. M. Bibes and A. Barthélémy, Nature Mater. 7, 425 (2008).
60. M. Hambe, A. Petraru, N. A. Pertsev, P. Munroe, V. Nagarajan and H. Kohlstedt, Adv.
Funct. Mater. 20, 2436 (2010).
61. Garcia, V. M. Bibes, L. Bocher, S. Valencia, F. Kronast, A. Crassous, X. Moya, S. E.
Vedrenne, A. Gloter, D. Imhoff, at el., Science 327, 1106 (2010).
62. M. Gajek, M. Bibes, S. Fusil, K. Bouzehouane, J. Fontcuberta, A. Barthélémy and Albert
Fert, Nature Mater. 6, 297 (2007).
63. E. Y. Tsymbal and H. Kohlstedt, Science 313, 181 (2006).
64. J. M. Hu, Z. Li, L. Q. Chen and C. W. Nan, Nature Communications 2, 553 (2011).
65. C. W. Nan, M. I. Bichurin, S. Dong, D. Viehland and G. Srinivasan, J. Appl. Phys. 103,
031101 (2008)

156
66. Y. Zhang, L. Zheng, D. Chaoyong, M. Jing, L. Yuanhua and C. W. Nan, Appl. Phys. Letts.
92, 152510 (2008).
67. J. Gao, J. Das, Z. Xing, J. Li and D. Viehland, J. Appl. Phys. 108, 084509 (2010).
68. J. Gao, L. Shen, Y. Wang, J. Li and D. Viehland, J. Appl. Phys. 109, 074507 (2011).
69. D. D. Awschalom and M. E. Flatté, Nature Phys. 3, 153 (2007).
70. A. Bhatnagar, A. R. Chaudhuri, Y. H. Kim, D. Hesse and M. Alexe, Nat. Commun. 4,
2835 (2013).
71. C. A. F. Vaz, J. Hoffman, C. H. Ahn and R. Ramesh, Adv. Mater. 22, 2900 (2010).
72. R. D. Johnson, L. C. Chapon, D. D. Khalyavin, P. Manuel, P. G. Radaelli and C. Martin,
Phys. Rev. Lett. 108, 067201 (2012).
73. W. Wang, J. Zhao, W. Wang, Z. Gai, N. Balke, M. Chi, Ho N. Lee, W. Tian, L. Zhu, X.
Cheng, D. J. Keavney, at el., Phys. Rev. Lett. 110, 237601 (2013).
74. R. Becker, M . Johnsson and H. Berger, Acta Crystallogr. C 62, i67 (2006).
75. N. V. Golubko, V. Yu. Proidakova, G. M. Kaleva, S. A. Ivanov, A.V. Mosunov, S. Yu.
Stefanovich, N. V. Sadovskaya, E. D. Politova and P. Nordblad, Bull. Russ. Acad. Sci.:
Phys. 74, 724 (2010).
76. S. A. Ivanov, R. Tellgren, C. Ritter, P. Nordblad, R. Mathieu, G. Andre, N. V. Golubko, E.
D. Politova and M. Weil, Mater. Res. Bull. 47, 63 (2012).
77. M. Hudl, R. Mathieu, S. A. Ivanov, M. Weil, V. Carolus, T. Lottermoser, M. Fiebig, Y.
Tokunaga, Y. Taguchi, Y. Tokura and P. Nordblad, Phys. Rev. B 84, 180404(R) (2011).
78. J. L. Her, C. C. Chou, Y. H. Matsuda, K. Kindo, H. Berger, K. F. Tseng, C. W. Wang, W.
H. Li and H. D. Yang, Phys. Rev. B 84, 235123 (2011).
79. W. H. Li, C. W. Wang, D. Hsu, C. H. Lee, C. M. Wu, C. C. Chou, H. D. Yang, Y. Zhao, S.
Chang, J. W. Lynn and H. Berger, Phys. Rev. B 85, 094431 (2012).
80. C. W. Wang, C. H. Lee, C. Y. Li, C. M. Wu, W. H. Li, C. C. Chou, H. D. Yang, J. W.
Lynn, Q. Huang, A. B. Harris and H. Berger, Phys. Rev. B 88, 184427 (2013).
81. A. B. Harris, Phys. Rev. B 85, 100403 (R) (2012).
82. P. Toledano, V. Carolus, M. Hudl, T. Lottermoser, D. D. Khalyavin, S. A. Ivanov and M.
Fiebig, Phys. Rev. B 85, 214439 (2012).
83. J. Sikac and L. Jensqvsky, Collection Czechoslov. Chern. Comrnun. 45, (1980).

157
84. Y. N. Sokolov, K. K. Samplavskaya, M. K. Karapetyants, Izv. Akad. Nauk SSSR, Neorg.
Mater. 3, 560 (1977).
85. H. Kasper, Z. Anorg. Allg. Chem. 354, 78 (1967).
86. J. Sloczynski, Z . Anorg. Allg. Chem. 438, 287 (1978).
87. B. Raveau and Md. M. Seikh, “Cobalt Oxides: From Crystal Chemistry to Physics” First
Edition, Wiley VCH Verlag GmbH and Co. KGaA (2012).
88. K. Grimaud, J. May, C. E. Carlton, Y. L. Lee, M. Risch, W.T. Hong, J. Zhou and Y. S.
Horn, Nat. Commun. 4, 2439 (2013).
89. M. E. Foglio and G. E. Barberis, Brazilian Journal of Physics 36, 1A (2006).
90. S. A. Ivanov, P. Nordblad, R. Mathieu, R. Tellgren, C. Ritter, N. Golubko, E. D. Politova
and M. Weil, Mater. Res. Bull. 46, 1870 (2011).
91. R. Mathieu, S. A. Ivanov, P. Nordblad and M. Weil, Eur. Phys. J. B. 86, 361 (2013).
92. S. A. Ivanov, R. Mathieu, P. Nordblad, C. Ritter, R. Tellgren, N. Golubko, A. Mosunov, E.
D. Politova, M. Weil, Mater. Res. Bull. 50, 42 (2014).
93. S. A. Ivanov, R. Mathieu, P. Nordblad, E. Politova, R. Tellgren, C. Ritter and V.
Proidakova, J. Magn. Magn. Mater. 324, 1637 (2012).
94. R. Mathieu, S. A. Ivanov, R. Tellgren and P. Nordblad, Phys. Rev. B 83, 174420 (2011).
95. H. Singh, A. K. Sinha, S. M. Gupta, M. N. Singh, and H. Ghosh, Communicated.
96. H. Singh, H. Ghosh, T.V. Chandrasekhar Rao, A. K. Sinha and P. Rajput, J. of Appl. Phys.
116, 214106 (2014).
97. H. Singh, H. Ghosh, T. V. Chandrasekhar Rao, G. Sharma, J. Saha and S. Patnaik,
Communicated.
98. H. Singh, A. K. Sinha, H. Ghosh, M. N. Singh and A. Upadhyay, AIP Conf. Proc. 1665,
060021 (2015).
99. H. Singh, G. Sharma, Haranath Ghosh, S. Patnaik, A. K. Sinha, EMF 2015, University of
Porto, Portugal.
100. H. Singh, A. K. Sinha, H. Ghosh, M. N. Singh, P. Rajput, C. L. Prajapat, M. R. Singh and
G. Ravikumar, J. of Appl. Phys. 116, 074904 (2014).
101. Harishchandra Singh, H. Ghosh, C. L. Prajapat and M. R. Singh: Communicated.
102. H. Singh, A. K. Sinha, Haranath Ghosh, M. N. Singh and A. Upadhyay, ICAFM-2014,
Thiruvananthapuram, Kerala, India.

158
103. R. K. Gupta A. K. Sinha B. N. Raja Sekhar, A. K. Srivastava, G. Singh and S. K. Deb,
Appl. Phys. A. 103, 13 (2011).
104. A. K. Sinha, R. K. Gupta and S. K. Deb, Appl. Phys A 108, 607 (2012).
105. H. Singh, A .K. Sinha, M.N. Singh, P. Tiwari, D.M. Phase and S.K. Deb, J. of Physics and
Chemistry of Solids 75, 397 (2014).
106. A. K. Sinha, A. Sagdeo, Pooja Gupta, Anuj Upadhyay, Ashok Kumar, M.N. Singh, R.K.
Gupta, S.R. Kane, A. Verma, and S. K. Deb, J. of Phys.: Conf. Series 425, 072017 (2013).
107. S. Basu, C. Nayak, A. K. Yadav, A. Agrawal, A. K. Poswal, D. Bhattacharyya, S. N. Jha
and N. K. Sahoo, J. of Phys.: Conference Series 493, 012032 (2014).
108. S. K. Deb, Gurnam Singh, and P. D. Gupta, J. of Physics: Conf. Series 425, 072009 (2013).
109. Website: http://www.cat.gov.in/technology/accel/srul/beamlines/index.html
110. B. D. Cullity, “Elements of X-Ray Diffraction” Addison-Wesley, Reading MA (1978) p.
233-247.
111. B. E. Warren, “X-ray Diffraction” Addison-Wesley, Reading, (1969).
112. A. P. Hammersley, S. O. Svensson, and A. Thompson, Nucl. Instrum. Methods A 346, 312
(1994).
113. J. Rodriguez-Carvajal, Physica B 192, 55 (1993).
114. R. A. Young, “The Rietveld Method” Oxford: University Press. (ISBN 0 19 855577 6)
(1993).
115. J. C. Taylor, “Rietveld made easy: a practical guide to the understanding of the method and
successful phase quantifications” Canberra: Sietronics Pty Ltd. (ISBN 0 9750798 0 8)
(2001).
116. G. Bunker, “Introduction to XAFS Cambridge University Press” Cambridge, (2010).
117. F. de Groot, G. Vanko, and P. Glatzel, J. Phys. Condens. Matter 21, 104207 (2009).
118. J. P. Rueff, L. Journel, P.-E. Petit, and F. Farges, Phys. Rev. B 69, 1 (2004).
119. T. Yamamoto, X-Ray Spectrum. 37, 572 (2008).
120. D. Cabaret, Y. Joly, H. Renevier, and C. R. Natoli, J. Synchrotron Rad. 0495, 258 (1999).
121. P. K. Patel, K. L. Yadav, H. Singh, A.K. Yadav, J. Alloys & Comp. 591, 224 (2014).
122. G. Vankó, F. M. F. de Groot, S. Huotari, R. J. Cava, T. Lorenz, and M. Reuther,
arXiv:0802.2744 (2008).

159
123. M. Kusunoki, O. T. ki, T. Matsushita, H. Oyanagi, and Y. Inoue, J. Biochem. 108, 560
(1990).
124. A. J. Berry, H. S. C. O’Neill, K. D. Jayasuriya,
S. J. Campbell and G. J. Foran, American
Mineralogist. 560, 967 (2003).
125. O. Durmeyer, J. P. Kappler, E. Beaurepaire, J. M. Heintz, and M. Drillon, J. Phys.:
Condens. Matter 2, 6127 (1990).
126. G. Sankar, P.R. Sarode and C.N.R. Rao, Chemical Physics 76, 435 (1983).
127. F. Bridges, C. H. Booth. G. H. Kwei, J. J. Neumeier and G. A. Sawatzky, Phys. Rev. B 61,
R9237 (2000).
128. E. R. Aluri and A. P. Grosvenor, Phys. Chem. Chem. Phys.15, 10477 (2013).
129. C. D. Wagner, W. M. Riggs, L. E. Davis, J. F. Moulder, G. E. Muilenberg (Ed.),
“Handbook of X-ray Photoelectron spectroscopy” Perkin-Elmer, Physics Electronics
Division 6509, Flying Cloud Drive, Eden Prairie, Minnesota 553444 USA (1992).
130. A. K. Bakshi, S.N. Jha, L. Olivi, D.M. Phase, R.K. Kher and D. Bhattacharyya, Nucl.
Instrum. Methods Phys. Res. B 264, 109 (2007).
131. J. Isasi, Journal of Alloys and Compounds 322, 89 (2001).
132. X. Zhu, Z. Wang, X. Su and P. M. Vilarinhopaula, ACS Appl. Mater. Interfaces 6, 11326
(2014).
133. X. Su, A. Wu and P. Vilarinho, Scr. Mater. 67, 927 (2012).
134. K. Momma and F. Izumi, J. Appl. Crystal logr. 44, 1272 (2011).
135. C. A. F. Vaz, D. Prabhakaran, E. I. Altman and V. E. Henrich, Phys. Rev. B 80, 155457
(2009).
136. T. Mizokawa, Y. Morita, T. Sudayama, K. Takubo, I. Yamada, M. Azuma, M. Takano and
Y. Shimakawa, Phys. Rev. B 80, 125105 (2009).
137. J. F. Mouller, W. F. Stickie, P. E. Sobol, K. D. Bomben, “Handbook of X-ray
Photoelectron Spectroscopy”, Perkin-Elmer, Physics Electronics Division, Eded Prairie
1992.
138. W. E. Sartz Jr., K. J. Wynne and D. M. Hercules, Anal. Chem. 43, 1884 (1971).
139. Y. Ikedo, J. Sugiyama, H. Nozaki, H. Itahara, J. H. Brewer, E. J. Ansaldo, G. D. Morris, D.
Andreica and A. Amato, Phys. Rev. B 75, 054424 (2007).

160
140. L. G. Bai, M. Pravica, Y. S. Zhao, C. Park, Y. Meng, S. Sinogeikin and G. Shen, J. Phys.:
Condens. Matter 24, 435401 (2012).
141. P. Sahoo, H. Djieutedjeu and P. Poudeu., J. Mater. Chem. A 1, 15022 (2013).
142. J. Chen, Y. Chin, M Valldor, Z. Hu, J. Lee, S. Haw, N. Hiraoka, H. Ishii, C. Pao, K. Tsuei,
J. Lee, H. Lin, L. Jang, A. Tanaka, C. Chen and L. H. Tjeng, J. Am. Chem. Soc. 136, 1514
(2014).
143. Z. Hu, H. Wu, M. W. Haverkort, H. H. Hsieh, H. J. Lin,T. Lorenz, J. Baier, A. Reichl, I.
Bonn, C. Felser, A. Tanaka, C.T. Chen and L. H. Tjeng, Phys. Rev. Lett. 92, 20 (2004).
144. C. T. Chen, L. H. Tjeng, J. Kwo, H. L. Kao, P. Rudolf, F. Sette and R. M. Fleming, Phys.
Rev. Lett. 68, 2543 (1992).
145. K. Sano and Y. Ono, J. Phys. Soc. Jpn. 72, 1847 (2003).
146. S. Kimura, Y. Maeda, T. Kashiwagi, H. Yamaguchi, M. Hagiwara, S. Yoshida, I. Terasaki
and K. Kindo, Phys. Rev. B 78, 180403(R) (2008).
147. N. Hollmann, M. W. Haverkort, M. Benomar, M. Cwik, M. Braden and T. Lorenza, Phys.
Rev. B 83, 174435 (2011).
148. J. Park, S. Cho, J. Jeong and G. Jeong, Bull. Korean Chem. Soc. 21, 973 (2000).
149. F. de Groot, G. Vanko and P. Glatzel, J. Phys.: Condens. Matter 21, 104207 (2009).
150. M. C. Sanchez J. Garcia, J. Blasco, G. Subias and J. P. Cacho, Phys. Rev. B 65, 144409
(2002).
151. B. Ravel and M. Newville, J. Synchrotron Rad. 12, 537 (2005).
152. A. A. Taskin, A. N. Lavrov and A. Yoichi, Phys. Rev. B 71, 134414 (2005).
153. L. Malavasi, C. Ritter, M. C. Mozzati, C. Tealdi, M. S. Islam, C. B. Azzoni and G. Flor, J.
of Solid State Chemistry 178, 2042 (2005).
154. H. Eisaki, N. Kaneko, D. L. Feng, A. Damascelli, P. K. Mang, K. M. Shen, Z. X. Shen and
M. Greven, Phys. Rev. B 69, 064512 (2004).
155. M. Sikora, Cz. Kapusta, K. Knížek, Z. Jirák, C. Autret, M. Borowiec, C. J. Oates, V.
Procházka, D. Rybicki and D. Zajac, Phys. Rev. B 73, 094426 (2006).
156. G. Vankó, J. Rueff, Z. Németh and A. Shukla, Phys. Rev. B 73, 024424 (2006).
157. O. Haas, R. P. W. J. Struis and J. M. McBreen, J. Solid State Chem. 177, 1000 (2004).
158. A. Chainani, M. Mathew and D. D. Sharma, Phys. Rev. B 46, 9976 (1992).
159. H. Ikeno, T. Mizoguchi and I. Tanaka, Phys. Rev. B 83, 155107 (2011).

161
160. S. Medling, Y. Lee, H. Zheng, J. F. Mitchell, J. W. Freeland, B. N. Harmon and F. Bridges,
Phys. Rev. Lett. 109, 157204 (2012).
161. J. Clark, M. D. Segall, C. J. Pickard, P. J. Hasnip, M. J. Probert, K. Refson, and M. C.
Payne, Zeitschriftfuer Kristallographie 220, 567 (2005).
162. P. Perdew, K. Burke and M. Ernzerhof, Phys. Rev. Lett. 77, 3865 (1996).
163. Z. W. Ouyang, V. K. Pecharsky, K. A. Gschneidner, D. L. Schlagel and T. A. Lograsso,
Phy. Rev. B 74, 094404 (2006).
164. D. Kumar and A. Banerjee, J. Phys.: Condens. Matter 25, 216005 (2013).
165. D. J. Goossens, K. F. Wilson, M. James, A. J. Studer and X. L. Wang, Phys. Rev. B 69,
134411 (2004).
166. R. B. Griffiths, Phys. Rev. Lett. 23, 17 (1969).
167. A. J. Bray and M. A. Moore, J. Phys. C 15, L765 (1982); A. J. Bray, Phys. Rev. Lett. 59,
586 (1987).
168. M. B. Salamon, P. Lin and S. H. Chun, Phys. Rev. Lett. 88, 197203 (2002).
169. M. B. Salamon and S. H. Chun, Phys. Rev. B 68, 014411 (2003).
170. A. K. Pramanik and A. Banerjee, Phys. Rev. B 81, 024431 (2010).
171. W. Jiang, X. Z. Zhou, G. Williams, Y. Mukovskii and K. Glazyrin, Phys. Rev. B 76,
092404 (2007); 77, 064424 (2008).
172. K. Grimaud, J. May, C. E. Carlton, Y. L. Lee, M. Risch, W.T. Hong, J. Zhou and Y. S.
Horn, Nature Communications 4, 2439 (2013).
173. M. E. Foglio and G. E. Barberis, Brazilian Journal of Physics 36, 1A (2006).
174. D. J. Goossens, K. F. Wilson, M. James, A. J. Studer and X. L. Wang, Phys. Rev. B 69,
134411 (2004).
175. Y. Shimada, S. Miyasaka, R. Kumai and Y. Tokura, Phys. Rev. B 73, 134424 (2006).
176. A. Moreo, S. Yunoki and E. Dagotto, Science 283, 2034 (1999).
177. E. Dagotto, “Nanoscale Phase Separation and Colossal Magnetoresistance” Springer, New
York, (2002).
178. N. Theodoropoulou, A. F. Hebard, M. E. Overberg, C. R. Abernathy, S. J. Pearton, S. N.
G. Chu and R. G. Wilson, Phys. Rev. Lett. 89, 107203 (2002).
179. A. P. Ramirez, M. A. Subramanian, M. Gardel, G. Blumberg, D. Li, T. Vogt and S. M.
Shapiro, Solid State Commun. 115, 217 (2000).

162
180. T. Kimura, T. Goto, H. Shintani, T. Arima and Y. Tokura, Nature 426, 6 (2003).
181. H. Singh, H. Ghosh, T. V. C. Rao, G. Sharma, J. Saha and S. Patnaik, “Spontaneous
electric polarization and Magneto-dielectric coupling in ceramic multiferroic Co3TeO6”
arXiv:1309.6417[cond-mat.mtrl-sci] (2013).
182. G. Lawes, T. Kimura, C. M. Varma, M. A. Subramanian, N. Rogado, R. J. Cava and A. P.
Ramirez, Progress in Solid State Chemistry 37, 40 (2009).
183. A. Dixit, G. Lawes and A. B. Harris, Phys. Rev. B 82, 024430 (2010).
184. G. Lawes, A. B. Harris, T. Kimura, N. Rogado, R. J. Cava, A. Aharony, O. E.Wohlman, T.
Yildirim, M. Kenzelmann, C. Broholm and A. P. Ramirez, Phys. Rev. Lett. 95, 087205
(2005).
185. R. D. Johnson, L. C. Chapon, D. D. Khalyavin, P. Manuel, P. G. Radaelli and C. Martin,
Phys. Rev. Lett. 108, 067201 (2012).
186. J. Sannigrahi, S. Chattopadhyay, D. Dutta, S. Giri and S. Majumdar, J. Phys.: Condens.
Matter 25, 246001 (2013).
187. A. K. Singh, D. Jain, V. Ganesan, A. K. Nigam and S. Patnaik, Europhysics Letters 86,
57001 (2009).
188. I. N. Apostolova, A. T. Apostolov S. G. Bahoosh and J. M. Wesselinowa, J. Appl. Phys.
113, 203904 (2013).
189. J. F. Scott, NPG Asia Materials. 5, e72 (2013).
190. L. Wang, D. Wang, Q. Cao, Y. Zheng, H. Xuan, J. Gao and Y. Du, Sci. Rep. 2, 223 (2012).
191. N. N. Hur, S. Park, P. A. Sharma, S. Guha and S. W. Cheong, Nature 429, 392 (2004).
192. E. M. Choi, A. Kursumovic, O. J. Lee, J. E. Kleibeuker, A. Chen, W. Zhang, H. Wang, and
J. L. M. Driscoll, ACS Appl. Mater. Interfaces 6 (17), 14836 (2014).
193. J. Hellsvik, M. Balestieri, T. Usui, A. Stroppa, A. Bergman, L. Bergqvist, D. Prabhakaran,
O. Eriksson, S. Picozzi, T. Kimura and J. Lorenzana, Phys. Rev. B 90, 014437 (2014).
194. A. van der Lee and R. Astier, J. of Solid State Chemistry 180, 1243 (2007).
195. J. Wang, J. A. C. Santana, N. Wu, C. Karunakaran, J. Wang, P. A. Dowben and C. Binek,
J. Phys.: Condens. Matt. 26, 055012 (2014).
196. S. A. Ivanov, P. Nordblad, R. Mathieu, R. Tellgren, C. Ritter, N. Golubko, E. D. Politova,
and M. Weil Mater. Res. Bull. 46, 1870 (2011).
197. P. Schiffer, A. P. Ramirez, W. Bao and S. W. Cheong, Phys. Rev. Lett. 75, 3336 (1995).

163
198. M. Sikora, K. Knizek, C. Kapusta and P. Glatzel, J. Appl. Phys. 103, 07C907 (2008).
199. R. Mathieu, S. A. Ivanov, R. Tellgren and P. Nordblad, Phys. Rev. B 83, 174420 (2011).
200. S. A. Ivanov, R. Mathieu P. Nordblad, E. Politova, R. Tellgren, C. Ritter and V.
Proidakova, J. of Magnetism and Magnetic Materials 324, 1637 (2012).
201. S. Ivanov, P. Nordblad, R. Mathieu, R. Tellgren, E. Politova and G. André, European
Journal of Inorganic Chemistry 2011, 30 (2011).
202. S. Z. Karazhanov, P. Ravindran, P. Vajeeston, A. G. Ulyashin, H. Fjellvag and B. G.
Svensson, J. Phys.: Condens. Matter 21, 485801 (2009).
203. R. D. Shannon, Acta Crystallogr. A 32, 751 (1976).
204. A. Z. Simoes, A. H. M. Gonzalez, A. A. Cavalheiro, M. A. Zaghete, B. D. Stojanovic and
J. A. Varela, Ceramics International. 28, 265 (2002).
205. J. Park, S. Lee, M. Kang, K. Jang, C. Lee, S. V. Streltsov, V. V. Mazurenko, M. V.
Valentyuk, T. Kamiyama and J. G. Park, Phys. Rev. B. 82, 054428 (2010).
206. N. Jiang and C. H. John Spence, Phys. Rev. B 70, 184113 (2004).
207. N. Hollmann, M. W. Haverkort, M. Benomar, M. Cwik, M. Braden and T. Lorenz, Phys.
Rev. B. 83, 174435 (2011).
208. R. Zhao, K. Jin, Z. Xu, H. Guo, Le Wang, Chen Ge, H. Lu and G. Yang, Appl. Phys. Lett.
102, 122402 (2013).
209. S. Sonoda, I. Tanaka, H. Ikeno, T. Yamamoto, F. Oba, T. Araki, Y. Yamamoto, K. Suga,
Y. Nanishi, Y. Akasaka, K. Kindo and H. Hori, J. Phys.: Condens. Matter 18, 4615 (2006).
210. T. Harada, I. Ohkubo, M. Lippmaa, Y. Matsumoto, M. Sumiya, H. Koinuma and M.
Oshima, Rap. Res. Lett. 5, 34 (2011).
211. L. D. Yao, W. Zhang, F. Y. Li, C. Q. Jin and R. C. Yu, J. Appl. Phys. 103, 063909 (2008).
212. R. C. Flores, N. S. Bingham, M. H. Phan, M. A. Torija, C. Leighton, V. Franco, A. Conde,
T. L. Phan, S. C. Yu and H. Srikanth, J. Phys.: Condens. Matter 26, 286001 (2014).
213. D. Bhoi, N. Khan, A. Midya, M. Nandi, A. Hassen, P. Choudhury and P. Mandal, J. Phys.
Chem. C 117, 16658 (2013).
214. C. Magen, P. A. Algarabel, L. Morellon, J. P. Araujo, C. Ritter, M. R. Ibarra, A. M.
Pereira and J. B. Sousa, Phys. Rev. Lett. 96, 167201 (2006).
215. A. Karmakar, S. Majumdar, S. Kundu, T. K. Nath and S. Giri, J. Phys.: Condens. Matter
25, 066006 (2013).

164


![[XLS]pratapgarh.nic.inpratapgarh.nic.in/DIOS/)UP BOARD.xlsx · Web viewBALBHADRA INTER COLLEGE DIHA PRATAPGARH SURESH KUMAR YADAV JAGDEV PRASAD PREM KUMAR YADAV HARI SHANKAR HARISHCHANDRA](https://static.fdocuments.us/doc/165x107/5aecd5b07f8b9a36699010a5/xls-up-boardxlsxweb-viewbalbhadra-inter-college-diha-pratapgarh-suresh-kumar.jpg)


![[XLS]jkrevenue.nic.injkrevenue.nic.in/pdf/Flood_2014/Reasi-Paid.xls · Web viewPrem Singh So Naseeb Singh Chassote 0611040860005212 PREM SINGH SO SH NASIB SINGH 55 Pritam Singh So](https://static.fdocuments.us/doc/165x107/5aee45f57f8b9a903190eeec/xls-viewprem-singh-so-naseeb-singh-chassote-0611040860005212-prem-singh-so-sh.jpg)