
Hardware-software system for simulating and analyzing earthquakes
13
Nat. Hazards Earth Syst. Sci., 12, 61–73, 2012 www.nat-hazards-earth-syst-sci.net/12/61/2012/ doi:10.5194/nhess-12-61-2012 © Author(s) 2012. CC Attribution 3.0 License. Natural Hazards and Earth System Sciences Hardware-software system for simulating and analyzing earthquakes applied to civil structures J. P. Amezquita-Sanchez, R. A. Osornio-Rios, R. J. Romero-Troncoso, and A. Dominguez-Gonzalez HSPdigital Research Group, C. A. Mecatr ´ onica, Facultad de Ingenier´ ıa, Campus San Juan del R´ ıo, Universidad Aut´ onoma de Quer´ etaro, Moctezuma 249, Col. San Cayetano, 76807 San Juan del R´ ıo, Quer´ etaro, M´ exico Correspondence to: R. A. Osornio-Rios ([email protected]) Received: 11 October 2011 – Revised: 17 November 2011 – Accepted: 27 November 2011 – Published: 6 January 2012 Abstract. The occurrence of recent strong earthquakes, the incessant worldwide movements of tectonic plates and the continuous ambient vibrations caused by traffic and wind have increased the interest of researchers in improving the capacity of energy dissipation to avoid damages to civil struc- tures. Experimental testing of structural systems is essential for the understanding of physical behaviors and the building of appropriate analytic models in order to expose difficul- ties that may not have been considered in analytical studies. This paper presents a hardware-software system for exciting, monitoring and analyzing simultaneously a structure under earthquake signals and other types of signals in real-time. Effectiveness of the proposed system has been validated by experimental case studies and has been found to be a useful tool in the analysis of earthquake effects on structures. 1 Introduction Recent strong earthquakes (e.g. Japan, Chile, and M´ exico), the incessant worldwide movements of tectonic plates and the continuous ambient vibrations caused by traffic and wind have increased the interest of researchers in improving the capacity of energy dissipation to avoid damages to civil struc- tures (Dyke, 1998). In order to achieve this task, it is neces- sary to perform the simulation of structures under vibration loads. This is usually performed either experimentally or an- alytically. Experimental testing of structural systems is es- sential to understand physical behaviors and build appropri- ate analytic models in order to expose difficulties that may not have been considered in analytical studies (Jeyasehara et al., 2009). Recently, structural simulators have gained impor- tance, particularly in countries vulnerable to destructive earthquakes. A structural simulator is defined as a system capable of providing the most direct experimental pattern for the performance assessment of structures subject to earth- quakes or to any ground motion (Nakata, 2010). The general block diagram of a structural simulator is shown in Fig. 1. The exciter, typically a shaker, actuates on the structure, pro- ducing vibrations which are measured by sensors – generally accelerometers. Then, the monitored signal is analyzed by means of processing techniques such as FFT, wavelet, and others, in order to get the response of the structure in detail. In order to excite a structure, several kinds of signals have been used as inputs for the shaker such as: recorded earth- quakes, synthetic signals, and ambient vibrations. Different works have proposed the use of earthquake signals to excite civil structures, due to the fact that it permits analysis of the structure behavior under real conditions (San Bartolome et al., 2004; Dolce and Cardone, 2006; Johnson et al., 2008; Van de Lindt and Potts, 2008; Kamanli and Balik, 2010). Synthetic signals are mainly used to obtain the modal param- eters of a structure and to determine its fatigue life; sinusoidal sweep or pure sinusoidal are the most widely used (Zivanovi´ c et al., 2006; Dominguez et al., 2007; Ibrahim and Reynolds, 2008; Ersubasi and Korkmaz, 2010). Another kind of sig- nal frequently used to excite a structure is ambient vibration such as traffic and wind. As well as synthetic signals, am- bient vibration is used to obtain the modal parameters of a structure (Brownjohn et al., 2003; Ren et al., 2004). From the above stated, it is necessary to have a simulator capable of synthesizing or generating the three types of signals, so as to excite any kind of structure under different conditions. Regarding structure sensing, current literature points out that accelerometers (Ren et al., 2004; Dolce and Cardone, 2006; Zivanovi´ c et al., 2006; Ibrahim and Reynolds, 2008) and string potentiometers (Van de Lindt et al., 2008) are two Published by Copernicus Publications on behalf of the European Geosciences Union.
Transcript of Hardware-software system for simulating and analyzing earthquakes

Nat. Hazards Earth Syst. Sci., 12, 61–73, 2012www.nat-hazards-earth-syst-sci.net/12/61/2012/doi:10.5194/nhess-12-61-2012© Author(s) 2012. CC Attribution 3.0 License.
Natural Hazardsand Earth
System Sciences
Hardware-software system for simulating and analyzingearthquakes applied to civil structures
J. P. Amezquita-Sanchez, R. A. Osornio-Rios, R. J. Romero-Troncoso, and A. Dominguez-Gonzalez
HSPdigital Research Group, C. A. Mecatronica, Facultad de Ingenierıa, Campus San Juan del Rıo,Universidad Autonoma de Queretaro, Moctezuma 249, Col. San Cayetano, 76807 San Juan del Rıo, Queretaro, Mexico
Correspondence to:R. A. Osornio-Rios ([email protected])
Received: 11 October 2011 – Revised: 17 November 2011 – Accepted: 27 November 2011 – Published: 6 January 2012
Abstract. The occurrence of recent strong earthquakes, theincessant worldwide movements of tectonic plates and thecontinuous ambient vibrations caused by traffic and windhave increased the interest of researchers in improving thecapacity of energy dissipation to avoid damages to civil struc-tures. Experimental testing of structural systems is essentialfor the understanding of physical behaviors and the buildingof appropriate analytic models in order to expose difficul-ties that may not have been considered in analytical studies.This paper presents a hardware-software system for exciting,monitoring and analyzing simultaneously a structure underearthquake signals and other types of signals in real-time.Effectiveness of the proposed system has been validated byexperimental case studies and has been found to be a usefultool in the analysis of earthquake effects on structures.
1 Introduction
Recent strong earthquakes (e.g. Japan, Chile, and Mexico),the incessant worldwide movements of tectonic plates andthe continuous ambient vibrations caused by traffic and windhave increased the interest of researchers in improving thecapacity of energy dissipation to avoid damages to civil struc-tures (Dyke, 1998). In order to achieve this task, it is neces-sary to perform the simulation of structures under vibrationloads. This is usually performed either experimentally or an-alytically. Experimental testing of structural systems is es-sential to understand physical behaviors and build appropri-ate analytic models in order to expose difficulties that maynot have been considered in analytical studies (Jeyasehara etal., 2009).
Recently, structural simulators have gained impor-tance, particularly in countries vulnerable to destructive
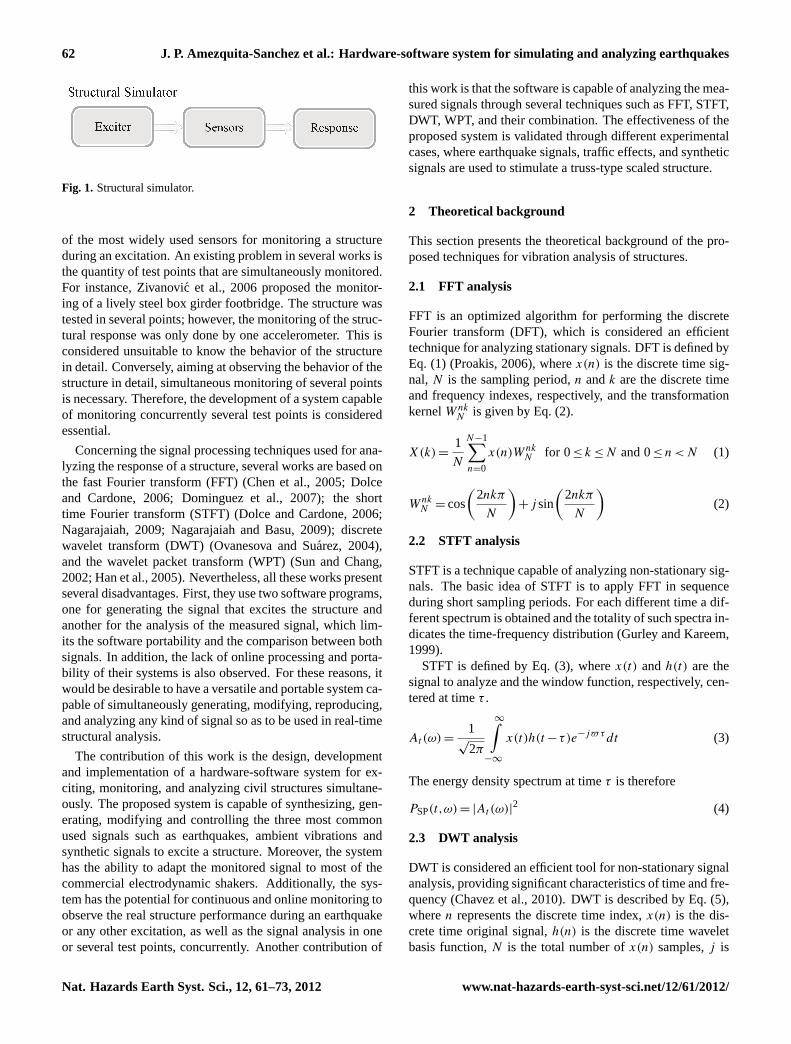
earthquakes. A structural simulator is defined as a systemcapable of providing the most direct experimental pattern forthe performance assessment of structures subject to earth-quakes or to any ground motion (Nakata, 2010). The generalblock diagram of a structural simulator is shown in Fig. 1.The exciter, typically a shaker, actuates on the structure, pro-ducing vibrations which are measured by sensors – generallyaccelerometers. Then, the monitored signal is analyzed bymeans of processing techniques such as FFT, wavelet, andothers, in order to get the response of the structure in detail.
In order to excite a structure, several kinds of signals havebeen used as inputs for the shaker such as: recorded earth-quakes, synthetic signals, and ambient vibrations. Differentworks have proposed the use of earthquake signals to excitecivil structures, due to the fact that it permits analysis of thestructure behavior under real conditions (San Bartolome etal., 2004; Dolce and Cardone, 2006; Johnson et al., 2008;Van de Lindt and Potts, 2008; Kamanli and Balik, 2010).Synthetic signals are mainly used to obtain the modal param-eters of a structure and to determine its fatigue life; sinusoidalsweep or pure sinusoidal are the most widely used (Zivanovicet al., 2006; Dominguez et al., 2007; Ibrahim and Reynolds,2008; Ersubasi and Korkmaz, 2010). Another kind of sig-nal frequently used to excite a structure is ambient vibrationsuch as traffic and wind. As well as synthetic signals, am-bient vibration is used to obtain the modal parameters of astructure (Brownjohn et al., 2003; Ren et al., 2004). Fromthe above stated, it is necessary to have a simulator capableof synthesizing or generating the three types of signals, so asto excite any kind of structure under different conditions.
Regarding structure sensing, current literature points outthat accelerometers (Ren et al., 2004; Dolce and Cardone,2006; Zivanovic et al., 2006; Ibrahim and Reynolds, 2008)and string potentiometers (Van de Lindt et al., 2008) are two
Published by Copernicus Publications on behalf of the European Geosciences Union.
62 J. P. Amezquita-Sanchez et al.: Hardware-software system for simulating and analyzing earthquakes
19
1
2
Figure 1. Structural simulator. 3
4
Fig. 1. Structural simulator.
of the most widely used sensors for monitoring a structureduring an excitation. An existing problem in several works isthe quantity of test points that are simultaneously monitored.For instance, Zivanovic et al., 2006 proposed the monitor-ing of a lively steel box girder footbridge. The structure wastested in several points; however, the monitoring of the struc-tural response was only done by one accelerometer. This isconsidered unsuitable to know the behavior of the structurein detail. Conversely, aiming at observing the behavior of thestructure in detail, simultaneous monitoring of several pointsis necessary. Therefore, the development of a system capableof monitoring concurrently several test points is consideredessential.
Concerning the signal processing techniques used for ana-lyzing the response of a structure, several works are based onthe fast Fourier transform (FFT) (Chen et al., 2005; Dolceand Cardone, 2006; Dominguez et al., 2007); the shorttime Fourier transform (STFT) (Dolce and Cardone, 2006;Nagarajaiah, 2009; Nagarajaiah and Basu, 2009); discretewavelet transform (DWT) (Ovanesova and Suarez, 2004),and the wavelet packet transform (WPT) (Sun and Chang,2002; Han et al., 2005). Nevertheless, all these works presentseveral disadvantages. First, they use two software programs,one for generating the signal that excites the structure andanother for the analysis of the measured signal, which lim-its the software portability and the comparison between bothsignals. In addition, the lack of online processing and porta-bility of their systems is also observed. For these reasons, itwould be desirable to have a versatile and portable system ca-pable of simultaneously generating, modifying, reproducing,and analyzing any kind of signal so as to be used in real-timestructural analysis.
The contribution of this work is the design, developmentand implementation of a hardware-software system for ex-citing, monitoring, and analyzing civil structures simultane-ously. The proposed system is capable of synthesizing, gen-erating, modifying and controlling the three most commonused signals such as earthquakes, ambient vibrations andsynthetic signals to excite a structure. Moreover, the systemhas the ability to adapt the monitored signal to most of thecommercial electrodynamic shakers. Additionally, the sys-tem has the potential for continuous and online monitoring toobserve the real structure performance during an earthquakeor any other excitation, as well as the signal analysis in oneor several test points, concurrently. Another contribution of
this work is that the software is capable of analyzing the mea-sured signals through several techniques such as FFT, STFT,DWT, WPT, and their combination. The effectiveness of theproposed system is validated through different experimentalcases, where earthquake signals, traffic effects, and syntheticsignals are used to stimulate a truss-type scaled structure.
2 Theoretical background
This section presents the theoretical background of the pro-posed techniques for vibration analysis of structures.
2.1 FFT analysis
FFT is an optimized algorithm for performing the discreteFourier transform (DFT), which is considered an efficienttechnique for analyzing stationary signals. DFT is defined byEq. (1) (Proakis, 2006), wherex(n) is the discrete time sig-nal,N is the sampling period,n andk are the discrete timeand frequency indexes, respectively, and the transformationkernelW nk
N is given by Eq. (2).
X(k)=1
N
N−1∑n=0
x(n)W nkN for 0≤ k≤N and 0≤ n<N (1)
W nkN = cos
(2nkπ
N
)+j sin
(2nkπ
N
)(2)
2.2 STFT analysis
STFT is a technique capable of analyzing non-stationary sig-nals. The basic idea of STFT is to apply FFT in sequenceduring short sampling periods. For each different time a dif-ferent spectrum is obtained and the totality of such spectra in-dicates the time-frequency distribution (Gurley and Kareem,1999).
STFT is defined by Eq. (3), wherex(t) andh(t) are thesignal to analyze and the window function, respectively, cen-tered at timeτ .
At (ω)=1
√2π
∞∫−∞
x(t)h(t−τ)e−j$τdt (3)
The energy density spectrum at timeτ is therefore
PSP(t,ω)= |At (ω)|2 (4)
2.3 DWT analysis
DWT is considered an efficient tool for non-stationary signalanalysis, providing significant characteristics of time and fre-quency (Chavez et al., 2010). DWT is described by Eq. (5),wheren represents the discrete time index,x(n) is the dis-crete time original signal,h(n) is the discrete time waveletbasis function,N is the total number ofx(n) samples,j is
Nat. Hazards Earth Syst. Sci., 12, 61–73, 2012 www.nat-hazards-earth-syst-sci.net/12/61/2012/
J. P. Amezquita-Sanchez et al.: Hardware-software system for simulating and analyzing earthquakes 63
the time scaling, andk is the shifting of the discrete waveletfunctionh(n) through the input signalx(n).
DWTj,k =
∑N
x(n)hj,k(n) (5)
DWT is based on the Mallat algorithm (Mallat, 1999), whichconsists of high pass filter (HPF) and low pass filter (LPF)banks. According to the Mallat algorithm, the convolutionof signal x(n) with the LPF is known as the approxima-tion level L(ACL ), and with the HPF is known as the de-tail level L(DCL); the first decomposition ofx(n) is knownas level 1, and it is made of DC1 and AC1 that correspondsto the high-frequency and low-frequency components of thesignal. The decomposition process continues on AC1, ob-taining the level 2 made of DC2 and AC2 that corresponds tothe high-frequency and low-frequency components of AC1,respectively. Once the discrete input signalx(n) has been de-composed into theL desired levels, the signal reconstructionis done by applying the decomposition process in an inverseway that is known as the inverse discrete wavelet transform(IDWT).
According to the DWT filter bank properties, the fre-quency band for an approximation ACL and a detail DCL isgiven by Eqs. (6) and (7), respectively, wherefs is the sam-pling frequency.
ACL ⇒
[0,
fs
2L+1
](6)
DCL ⇒
[fs
2L+1,fs
2L
](7)
2.4 WPT analysis
WPT, like DWT, is a technique to decompose a signal re-peatedly into successive low-frequency and high-frequencycomponents. Yet, in WPT both the detail and the approxima-tion coefficients are decomposed to create the full binary treeof band decomposition. The main advantage of using WPTover DWT is that it can provide uniform frequency bands;therefore, identifying more frequency components especiallyat high frequency is possible.
WPT is defined by Eq. (8), wherei, j andk are the mod-ulation, scale and translation parameters, respectively (Redaet al., 2006).
ψ ij,k(t)= 2j/2ψ i(2j t−k), i= 1,2,3,..... (8)
WPT is obtained through the next recursive equations, whereh(k), g(k) andψ i are low-pass filter coefficients and high-pass filter coefficients associated with the scaling functionand the mother wavelet, respectively.
ψ2i(t)=√
2∞∑
k=−∞
h(k)ψ i(2t−k) (9)
ψ2i+1(t)=√
2∞∑
k=−∞
g(k)ψ i(2t−k) (10)
2.5 DWT/WPT combined with FFT analysis
Two promising techniques that have not been employed toanalyze civil structures are the combination of DWT withFFT, and WPT with FFT. These techniques have providedgood results on analyzing motors (Amezquita-Sanchez et al.,2010) and CNC machine tools (Rangel-Magdaleno et al.,2010); nonetheless, these techniques can be useful tools toanalyze civil structures, earthquakes, etc.
The combination of these analysis techniques allows ob-serving the behavior of the signal throughout time and iden-tifying a characteristic frequency related to the reconstruc-tion of either DWT or WPT, without increasing the FFT fre-quency resolution (Rangel-Magdaleno et al., 2010). A spe-cific frequency band of interest is isolated by means of DWTor WPT, and the FFT is applied on the reconstruction level toidentify the characteristic frequencies within this band.
3 Methodology
This section shows the methodology followed for the de-velopment of the hardware-software system, as well as itscharacteristics and capabilities. The general system, soft-ware methodology, and control system methodology are de-scribed.
3.1 Hardware-software system
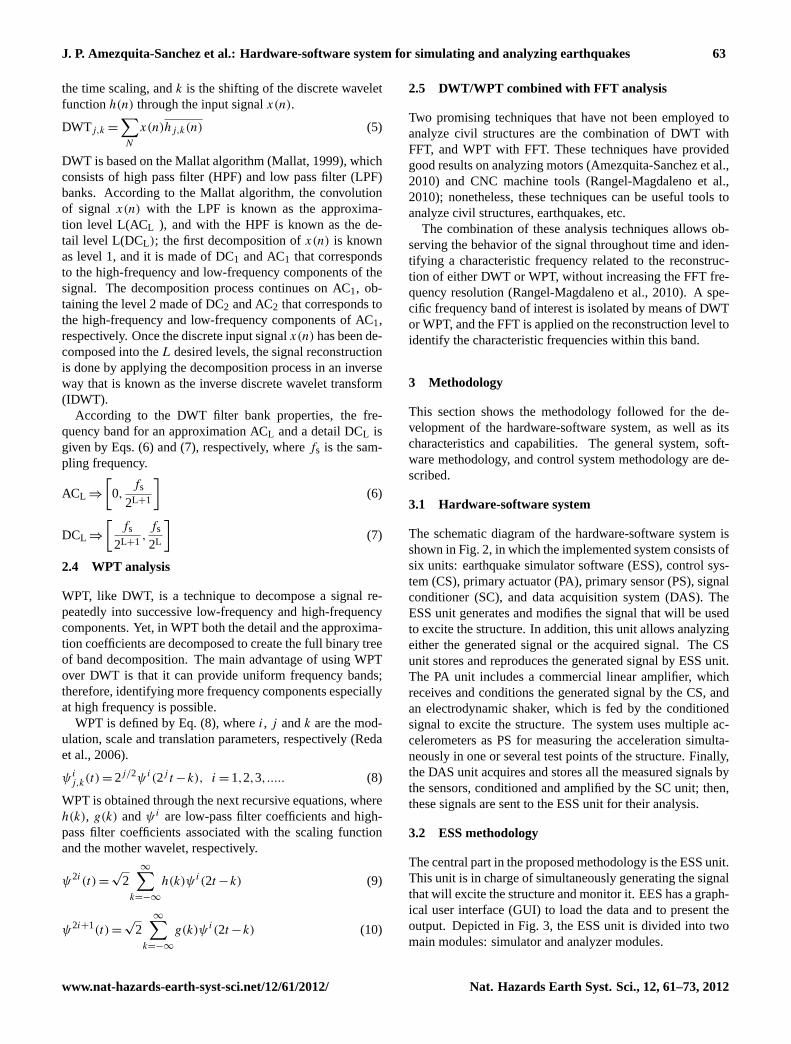
The schematic diagram of the hardware-software system isshown in Fig. 2, in which the implemented system consists ofsix units: earthquake simulator software (ESS), control sys-tem (CS), primary actuator (PA), primary sensor (PS), signalconditioner (SC), and data acquisition system (DAS). TheESS unit generates and modifies the signal that will be usedto excite the structure. In addition, this unit allows analyzingeither the generated signal or the acquired signal. The CSunit stores and reproduces the generated signal by ESS unit.The PA unit includes a commercial linear amplifier, whichreceives and conditions the generated signal by the CS, andan electrodynamic shaker, which is fed by the conditionedsignal to excite the structure. The system uses multiple ac-celerometers as PS for measuring the acceleration simulta-neously in one or several test points of the structure. Finally,the DAS unit acquires and stores all the measured signals bythe sensors, conditioned and amplified by the SC unit; then,these signals are sent to the ESS unit for their analysis.
3.2 ESS methodology
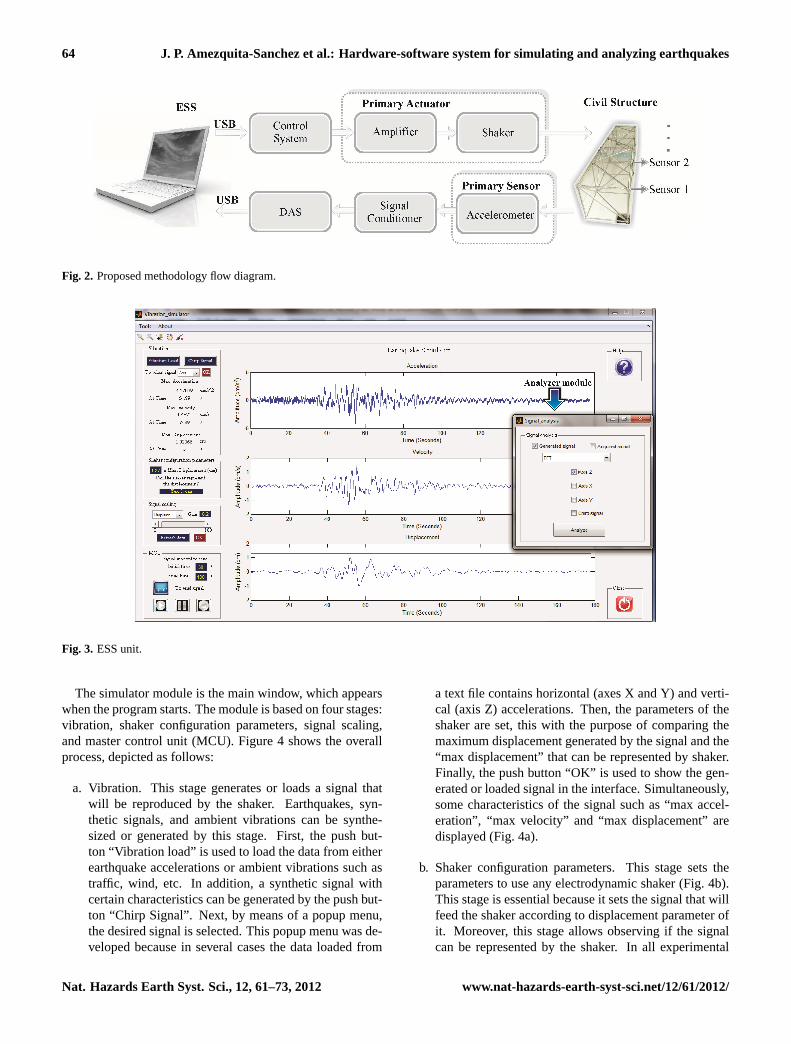
The central part in the proposed methodology is the ESS unit.This unit is in charge of simultaneously generating the signalthat will excite the structure and monitor it. EES has a graph-ical user interface (GUI) to load the data and to present theoutput. Depicted in Fig. 3, the ESS unit is divided into twomain modules: simulator and analyzer modules.
www.nat-hazards-earth-syst-sci.net/12/61/2012/ Nat. Hazards Earth Syst. Sci., 12, 61–73, 2012
64 J. P. Amezquita-Sanchez et al.: Hardware-software system for simulating and analyzing earthquakes
20
1
2
Figure 2. Proposed methodology flow diagram. 3
4
Fig. 2. Proposed methodology flow diagram.
21
1
2
Figure 3. ESS unit. 3
4
Fig. 3. ESS unit.
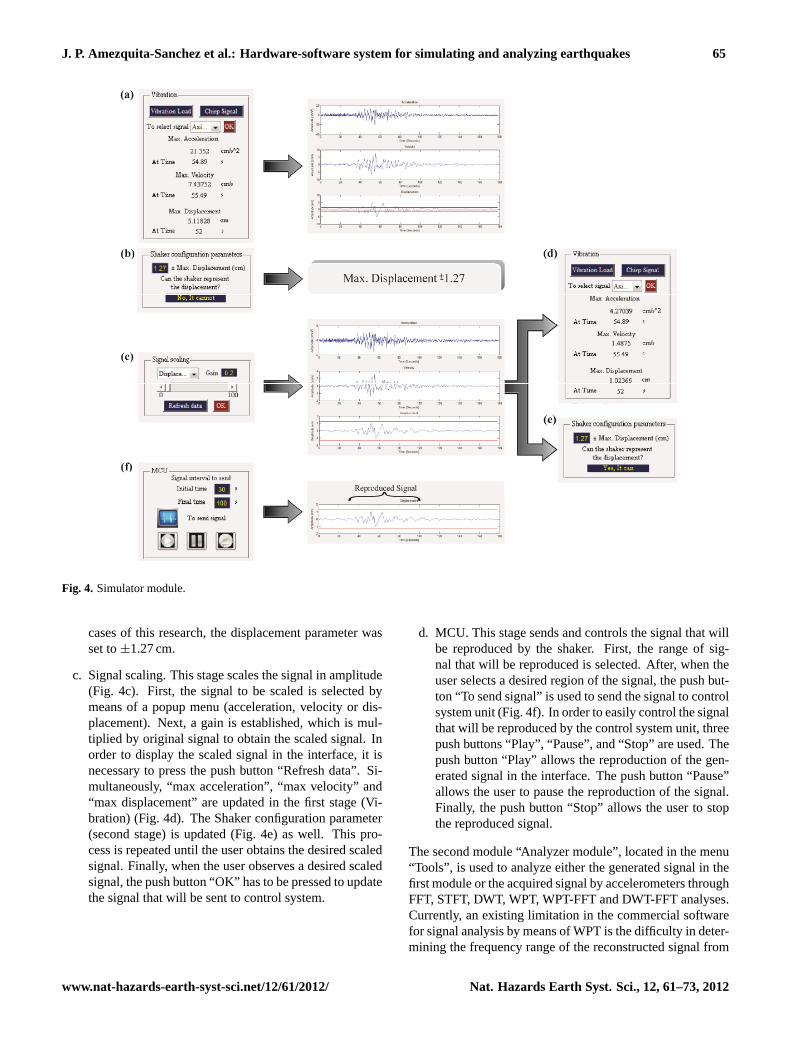
The simulator module is the main window, which appearswhen the program starts. The module is based on four stages:vibration, shaker configuration parameters, signal scaling,and master control unit (MCU). Figure 4 shows the overallprocess, depicted as follows:
a. Vibration. This stage generates or loads a signal thatwill be reproduced by the shaker. Earthquakes, syn-thetic signals, and ambient vibrations can be synthe-sized or generated by this stage. First, the push but-ton “Vibration load” is used to load the data from eitherearthquake accelerations or ambient vibrations such astraffic, wind, etc. In addition, a synthetic signal withcertain characteristics can be generated by the push but-ton “Chirp Signal”. Next, by means of a popup menu,the desired signal is selected. This popup menu was de-veloped because in several cases the data loaded from
a text file contains horizontal (axes X and Y) and verti-cal (axis Z) accelerations. Then, the parameters of theshaker are set, this with the purpose of comparing themaximum displacement generated by the signal and the“max displacement” that can be represented by shaker.Finally, the push button “OK” is used to show the gen-erated or loaded signal in the interface. Simultaneously,some characteristics of the signal such as “max accel-eration”, “max velocity” and “max displacement” aredisplayed (Fig. 4a).
b. Shaker configuration parameters. This stage sets theparameters to use any electrodynamic shaker (Fig. 4b).This stage is essential because it sets the signal that willfeed the shaker according to displacement parameter ofit. Moreover, this stage allows observing if the signalcan be represented by the shaker. In all experimental
Nat. Hazards Earth Syst. Sci., 12, 61–73, 2012 www.nat-hazards-earth-syst-sci.net/12/61/2012/
J. P. Amezquita-Sanchez et al.: Hardware-software system for simulating and analyzing earthquakes 65
22
1
2
Figure 4. Simulator module. 3
4
Fig. 4. Simulator module.
cases of this research, the displacement parameter wasset to±1.27 cm.
c. Signal scaling. This stage scales the signal in amplitude(Fig. 4c). First, the signal to be scaled is selected bymeans of a popup menu (acceleration, velocity or dis-placement). Next, a gain is established, which is mul-tiplied by original signal to obtain the scaled signal. Inorder to display the scaled signal in the interface, it isnecessary to press the push button “Refresh data”. Si-multaneously, “max acceleration”, “max velocity” and“max displacement” are updated in the first stage (Vi-bration) (Fig. 4d). The Shaker configuration parameter(second stage) is updated (Fig. 4e) as well. This pro-cess is repeated until the user obtains the desired scaledsignal. Finally, when the user observes a desired scaledsignal, the push button “OK” has to be pressed to updatethe signal that will be sent to control system.
d. MCU. This stage sends and controls the signal that willbe reproduced by the shaker. First, the range of sig-nal that will be reproduced is selected. After, when theuser selects a desired region of the signal, the push but-ton “To send signal” is used to send the signal to controlsystem unit (Fig. 4f). In order to easily control the signalthat will be reproduced by the control system unit, threepush buttons “Play”, “Pause”, and “Stop” are used. Thepush button “Play” allows the reproduction of the gen-erated signal in the interface. The push button “Pause”allows the user to pause the reproduction of the signal.Finally, the push button “Stop” allows the user to stopthe reproduced signal.
The second module “Analyzer module”, located in the menu“Tools”, is used to analyze either the generated signal in thefirst module or the acquired signal by accelerometers throughFFT, STFT, DWT, WPT, WPT-FFT and DWT-FFT analyses.Currently, an existing limitation in the commercial softwarefor signal analysis by means of WPT is the difficulty in deter-mining the frequency range of the reconstructed signal from
www.nat-hazards-earth-syst-sci.net/12/61/2012/ Nat. Hazards Earth Syst. Sci., 12, 61–73, 2012
66 J. P. Amezquita-Sanchez et al.: Hardware-software system for simulating and analyzing earthquakes
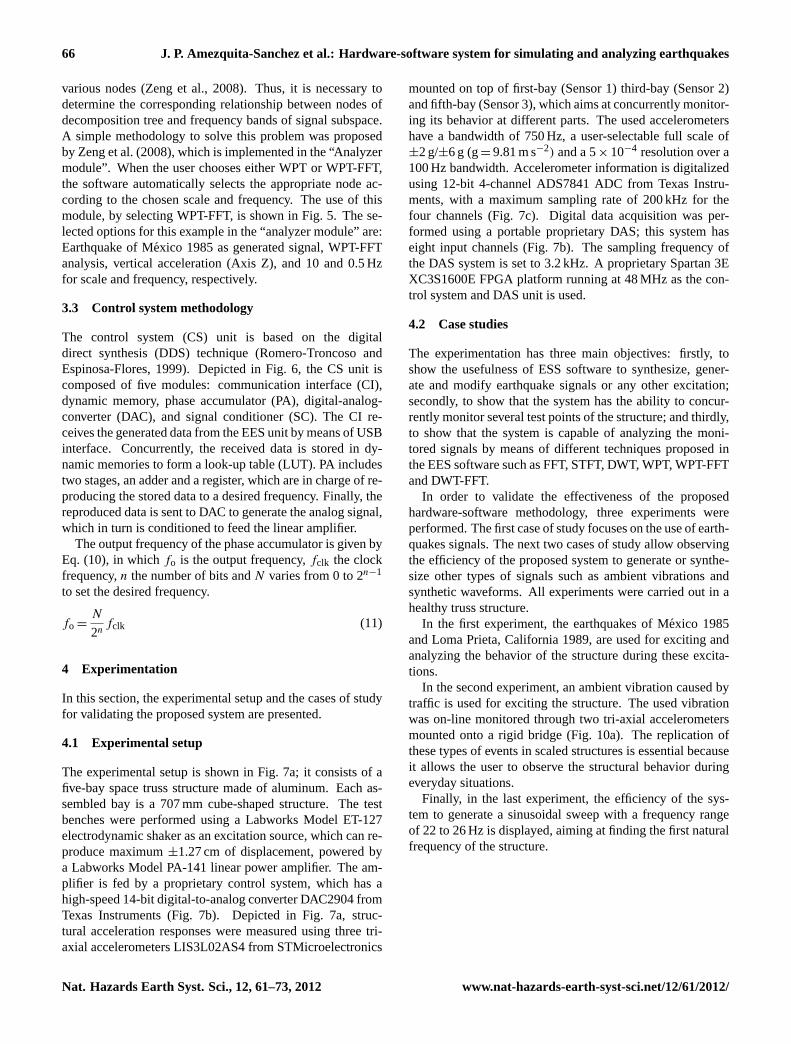
various nodes (Zeng et al., 2008). Thus, it is necessary todetermine the corresponding relationship between nodes ofdecomposition tree and frequency bands of signal subspace.A simple methodology to solve this problem was proposedby Zeng et al. (2008), which is implemented in the “Analyzermodule”. When the user chooses either WPT or WPT-FFT,the software automatically selects the appropriate node ac-cording to the chosen scale and frequency. The use of thismodule, by selecting WPT-FFT, is shown in Fig. 5. The se-lected options for this example in the “analyzer module” are:Earthquake of Mexico 1985 as generated signal, WPT-FFTanalysis, vertical acceleration (Axis Z), and 10 and 0.5 Hzfor scale and frequency, respectively.
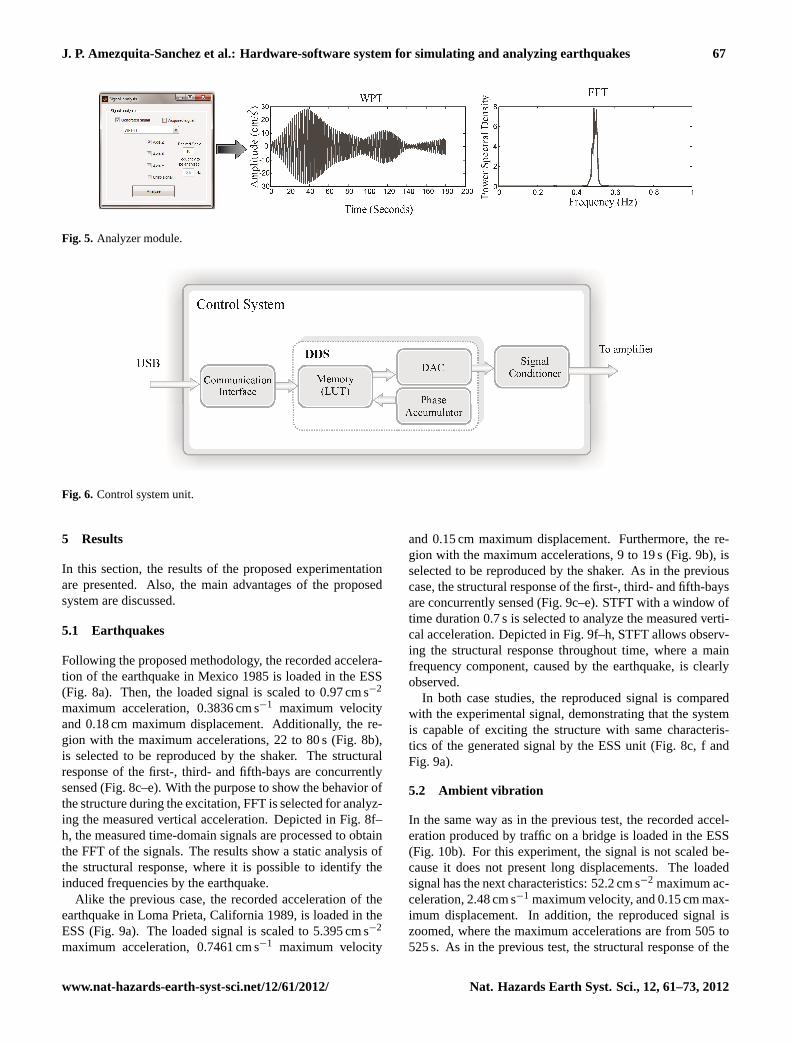
3.3 Control system methodology
The control system (CS) unit is based on the digitaldirect synthesis (DDS) technique (Romero-Troncoso andEspinosa-Flores, 1999). Depicted in Fig. 6, the CS unit iscomposed of five modules: communication interface (CI),dynamic memory, phase accumulator (PA), digital-analog-converter (DAC), and signal conditioner (SC). The CI re-ceives the generated data from the EES unit by means of USBinterface. Concurrently, the received data is stored in dy-namic memories to form a look-up table (LUT). PA includestwo stages, an adder and a register, which are in charge of re-producing the stored data to a desired frequency. Finally, thereproduced data is sent to DAC to generate the analog signal,which in turn is conditioned to feed the linear amplifier.
The output frequency of the phase accumulator is given byEq. (10), in whichfo is the output frequency,fclk the clockfrequency,n the number of bits andN varies from 0 to 2n−1
to set the desired frequency.
fo =N
2nfclk (11)
4 Experimentation
In this section, the experimental setup and the cases of studyfor validating the proposed system are presented.
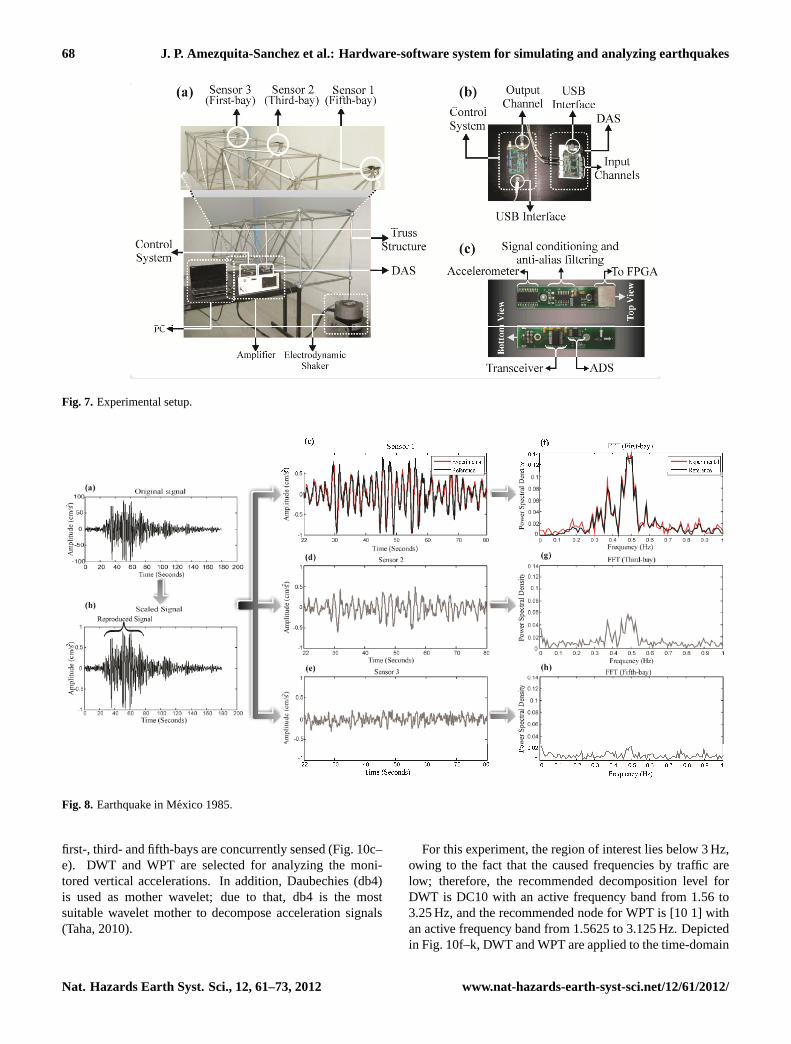
4.1 Experimental setup
The experimental setup is shown in Fig. 7a; it consists of afive-bay space truss structure made of aluminum. Each as-sembled bay is a 707 mm cube-shaped structure. The testbenches were performed using a Labworks Model ET-127electrodynamic shaker as an excitation source, which can re-produce maximum±1.27 cm of displacement, powered bya Labworks Model PA-141 linear power amplifier. The am-plifier is fed by a proprietary control system, which has ahigh-speed 14-bit digital-to-analog converter DAC2904 fromTexas Instruments (Fig. 7b). Depicted in Fig. 7a, struc-tural acceleration responses were measured using three tri-axial accelerometers LIS3L02AS4 from STMicroelectronics
mounted on top of first-bay (Sensor 1) third-bay (Sensor 2)and fifth-bay (Sensor 3), which aims at concurrently monitor-ing its behavior at different parts. The used accelerometershave a bandwidth of 750 Hz, a user-selectable full scale of±2 g/±6 g (g= 9.81 m s−2) and a 5× 10⁻⁴ resolution over a100 Hz bandwidth. Accelerometer information is digitalizedusing 12-bit 4-channel ADS7841 ADC from Texas Instru-ments, with a maximum sampling rate of 200 kHz for thefour channels (Fig. 7c). Digital data acquisition was per-formed using a portable proprietary DAS; this system haseight input channels (Fig. 7b). The sampling frequency ofthe DAS system is set to 3.2 kHz. A proprietary Spartan 3EXC3S1600E FPGA platform running at 48 MHz as the con-trol system and DAS unit is used.
4.2 Case studies
The experimentation has three main objectives: firstly, toshow the usefulness of ESS software to synthesize, gener-ate and modify earthquake signals or any other excitation;secondly, to show that the system has the ability to concur-rently monitor several test points of the structure; and thirdly,to show that the system is capable of analyzing the moni-tored signals by means of different techniques proposed inthe EES software such as FFT, STFT, DWT, WPT, WPT-FFTand DWT-FFT.
In order to validate the effectiveness of the proposedhardware-software methodology, three experiments wereperformed. The first case of study focuses on the use of earth-quakes signals. The next two cases of study allow observingthe efficiency of the proposed system to generate or synthe-size other types of signals such as ambient vibrations andsynthetic waveforms. All experiments were carried out in ahealthy truss structure.
In the first experiment, the earthquakes of Mexico 1985and Loma Prieta, California 1989, are used for exciting andanalyzing the behavior of the structure during these excita-tions.
In the second experiment, an ambient vibration caused bytraffic is used for exciting the structure. The used vibrationwas on-line monitored through two tri-axial accelerometersmounted onto a rigid bridge (Fig. 10a). The replication ofthese types of events in scaled structures is essential becauseit allows the user to observe the structural behavior duringeveryday situations.
Finally, in the last experiment, the efficiency of the sys-tem to generate a sinusoidal sweep with a frequency rangeof 22 to 26 Hz is displayed, aiming at finding the first naturalfrequency of the structure.
Nat. Hazards Earth Syst. Sci., 12, 61–73, 2012 www.nat-hazards-earth-syst-sci.net/12/61/2012/
J. P. Amezquita-Sanchez et al.: Hardware-software system for simulating and analyzing earthquakes 67
23
1
2
Figure 5. Analyzer module. 3
4
Fig. 5. Analyzer module.
24
1
2
Figure 6. Control system unit. 3
4
Fig. 6. Control system unit.
5 Results
In this section, the results of the proposed experimentationare presented. Also, the main advantages of the proposedsystem are discussed.
5.1 Earthquakes
Following the proposed methodology, the recorded accelera-tion of the earthquake in Mexico 1985 is loaded in the ESS(Fig. 8a). Then, the loaded signal is scaled to 0.97 cm s−2
maximum acceleration, 0.3836 cm s−1 maximum velocityand 0.18 cm maximum displacement. Additionally, the re-gion with the maximum accelerations, 22 to 80 s (Fig. 8b),is selected to be reproduced by the shaker. The structuralresponse of the first-, third- and fifth-bays are concurrentlysensed (Fig. 8c–e). With the purpose to show the behavior ofthe structure during the excitation, FFT is selected for analyz-ing the measured vertical acceleration. Depicted in Fig. 8f–h, the measured time-domain signals are processed to obtainthe FFT of the signals. The results show a static analysis ofthe structural response, where it is possible to identify theinduced frequencies by the earthquake.
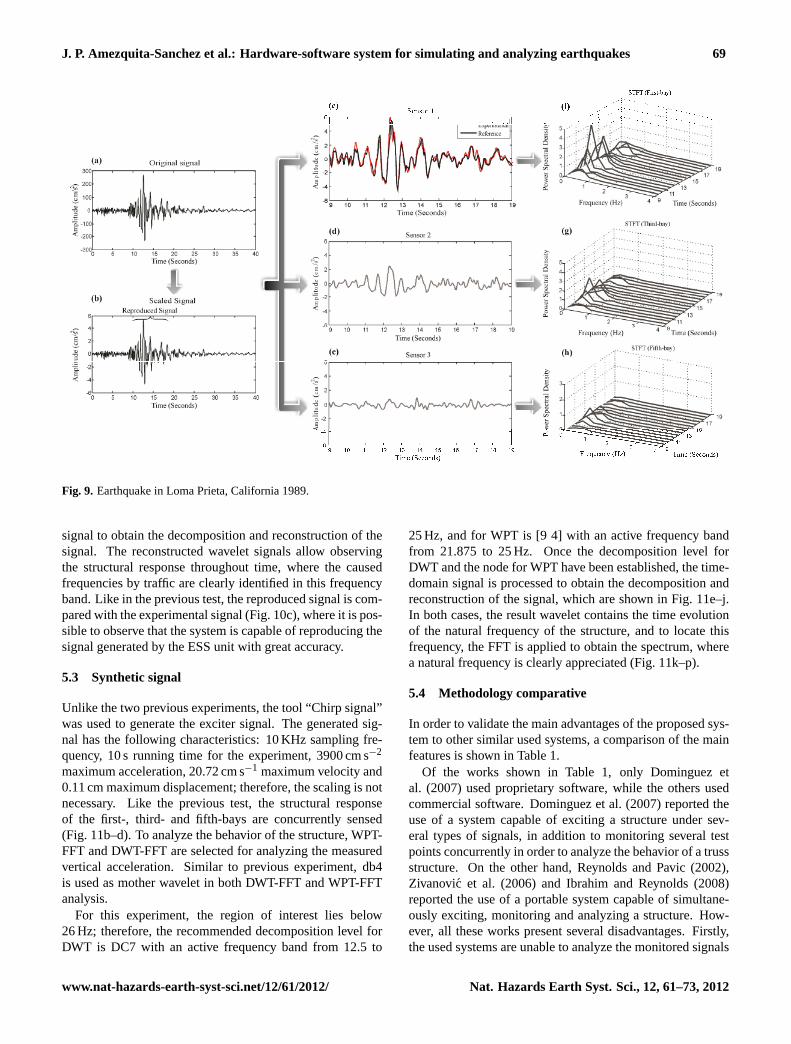
Alike the previous case, the recorded acceleration of theearthquake in Loma Prieta, California 1989, is loaded in theESS (Fig. 9a). The loaded signal is scaled to 5.395 cm s−2
maximum acceleration, 0.7461 cm s−1 maximum velocity
and 0.15 cm maximum displacement. Furthermore, the re-gion with the maximum accelerations, 9 to 19 s (Fig. 9b), isselected to be reproduced by the shaker. As in the previouscase, the structural response of the first-, third- and fifth-baysare concurrently sensed (Fig. 9c–e). STFT with a window oftime duration 0.7 s is selected to analyze the measured verti-cal acceleration. Depicted in Fig. 9f–h, STFT allows observ-ing the structural response throughout time, where a mainfrequency component, caused by the earthquake, is clearlyobserved.
In both case studies, the reproduced signal is comparedwith the experimental signal, demonstrating that the systemis capable of exciting the structure with same characteris-tics of the generated signal by the ESS unit (Fig. 8c, f andFig. 9a).
5.2 Ambient vibration
In the same way as in the previous test, the recorded accel-eration produced by traffic on a bridge is loaded in the ESS(Fig. 10b). For this experiment, the signal is not scaled be-cause it does not present long displacements. The loadedsignal has the next characteristics: 52.2 cm s−2 maximum ac-celeration, 2.48 cm s−1 maximum velocity, and 0.15 cm max-imum displacement. In addition, the reproduced signal iszoomed, where the maximum accelerations are from 505 to525 s. As in the previous test, the structural response of the
www.nat-hazards-earth-syst-sci.net/12/61/2012/ Nat. Hazards Earth Syst. Sci., 12, 61–73, 2012
68 J. P. Amezquita-Sanchez et al.: Hardware-software system for simulating and analyzing earthquakes
25
1
Figure 7. Experimental setup. 2
3
Fig. 7. Experimental setup.
26
1
Figure 8. Earthquake in México 1985. 2
3
Fig. 8. Earthquake in Mexico 1985.
first-, third- and fifth-bays are concurrently sensed (Fig. 10c–e). DWT and WPT are selected for analyzing the moni-tored vertical accelerations. In addition, Daubechies (db4)is used as mother wavelet; due to that, db4 is the mostsuitable wavelet mother to decompose acceleration signals(Taha, 2010).
For this experiment, the region of interest lies below 3 Hz,owing to the fact that the caused frequencies by traffic arelow; therefore, the recommended decomposition level forDWT is DC10 with an active frequency band from 1.56 to3.25 Hz, and the recommended node for WPT is [10 1] withan active frequency band from 1.5625 to 3.125 Hz. Depictedin Fig. 10f–k, DWT and WPT are applied to the time-domain
Nat. Hazards Earth Syst. Sci., 12, 61–73, 2012 www.nat-hazards-earth-syst-sci.net/12/61/2012/
J. P. Amezquita-Sanchez et al.: Hardware-software system for simulating and analyzing earthquakes 69
27
1
Figure 9. Earthquake in Loma Prieta, California 1989. 2
3
Fig. 9. Earthquake in Loma Prieta, California 1989.
signal to obtain the decomposition and reconstruction of thesignal. The reconstructed wavelet signals allow observingthe structural response throughout time, where the causedfrequencies by traffic are clearly identified in this frequencyband. Like in the previous test, the reproduced signal is com-pared with the experimental signal (Fig. 10c), where it is pos-sible to observe that the system is capable of reproducing thesignal generated by the ESS unit with great accuracy.
5.3 Synthetic signal
Unlike the two previous experiments, the tool “Chirp signal”was used to generate the exciter signal. The generated sig-nal has the following characteristics: 10 KHz sampling fre-quency, 10 s running time for the experiment, 3900 cm s−2
maximum acceleration, 20.72 cm s−1 maximum velocity and0.11 cm maximum displacement; therefore, the scaling is notnecessary. Like the previous test, the structural responseof the first-, third- and fifth-bays are concurrently sensed(Fig. 11b–d). To analyze the behavior of the structure, WPT-FFT and DWT-FFT are selected for analyzing the measuredvertical acceleration. Similar to previous experiment, db4is used as mother wavelet in both DWT-FFT and WPT-FFTanalysis.
For this experiment, the region of interest lies below26 Hz; therefore, the recommended decomposition level forDWT is DC7 with an active frequency band from 12.5 to
25 Hz, and for WPT is [9 4] with an active frequency bandfrom 21.875 to 25 Hz. Once the decomposition level forDWT and the node for WPT have been established, the time-domain signal is processed to obtain the decomposition andreconstruction of the signal, which are shown in Fig. 11e–j.In both cases, the result wavelet contains the time evolutionof the natural frequency of the structure, and to locate thisfrequency, the FFT is applied to obtain the spectrum, wherea natural frequency is clearly appreciated (Fig. 11k–p).
5.4 Methodology comparative
In order to validate the main advantages of the proposed sys-tem to other similar used systems, a comparison of the mainfeatures is shown in Table 1.
Of the works shown in Table 1, only Dominguez etal. (2007) used proprietary software, while the others usedcommercial software. Dominguez et al. (2007) reported theuse of a system capable of exciting a structure under sev-eral types of signals, in addition to monitoring several testpoints concurrently in order to analyze the behavior of a trussstructure. On the other hand, Reynolds and Pavic (2002),Zivanovic et al. (2006) and Ibrahim and Reynolds (2008)reported the use of a portable system capable of simultane-ously exciting, monitoring and analyzing a structure. How-ever, all these works present several disadvantages. Firstly,the used systems are unable to analyze the monitored signals
www.nat-hazards-earth-syst-sci.net/12/61/2012/ Nat. Hazards Earth Syst. Sci., 12, 61–73, 2012

70 J. P. Amezquita-Sanchez et al.: Hardware-software system for simulating and analyzing earthquakes
28
1
Figure 10. Ambient vibration. 2
3
Fig. 10. Ambient vibration.
by means of different analysis techniques. In addition, theydo not allow introducing or synthesizing a signal; thus,earthquake signals and ambient vibrations cannot be repro-duced (Reynolds and Pavic, 2002; Zivanovic et al., 2006 andIbrahim and Reynolds, 2008). Secondly, the monitoring ofseveral test points concurrently is not performed (Zivanovicet al., 2006). Third, the use of two software programs, onefor generating the signal that excites the structure and anotherfor the analysis of the measured signal, means portability ofthe system is not possible (Dominguez et al., 2007).
In this work, three experiments demonstrate that the pro-posed single system is capable of either generating or syn-thesizing, and both modifying and analyzing, several typesof signals as well as monitoring several test points concur-rently to evaluate the behavior of the structure by means ofseveral analysis techniques, being also a portable system.
Nat. Hazards Earth Syst. Sci., 12, 61–73, 2012 www.nat-hazards-earth-syst-sci.net/12/61/2012/

J. P. Amezquita-Sanchez et al.: Hardware-software system for simulating and analyzing earthquakes 71
29
1
Figure 11. Synthetic signal. 2 Fig. 11. Synthetic signal.
Table 1. Features comparison between the proposal and reported works.
Work Generate Modify Monitor Multiple One system for Portabilitymultiple signals multiple test techniques of generating, monitoringsignals points analyzing and analyzing
Reynolds and Pavic (2002) YES NO YES NO YES YESZivanovic et al. (2006) YES NO NO NO YES YESDominguez et al. (2007) YES NO YES NO NO NOIbrahim and Reynolds (2008) YES NO YES NO YES YESThis work YES YES YES YES YES YES
www.nat-hazards-earth-syst-sci.net/12/61/2012/ Nat. Hazards Earth Syst. Sci., 12, 61–73, 2012

72 J. P. Amezquita-Sanchez et al.: Hardware-software system for simulating and analyzing earthquakes
6 Conclusions
Earthquakes are seismic waves that cause the greatest catas-trophes: human, economic and structural. Therefore, it isnecessary to have a system capable of analyzing, monitoringand reproducing them. Seismic hazard analysis is one of themost important processes for earthquake safety assessmentof structures and the designing of earthquake resistant struc-tures.
This paper proposes a hardware-software system for ex-citing, monitoring and analyzing simultaneously a structureunder earthquakes, ambient vibrations and synthetic signalsin real-time. The proposed system has different tools to gen-erate and to modify the different signals either generated oracquired, as well as their analysis by means of several analy-sis techniques such as FFT, STFT, DWT, WPT, DWT-FFTand WPT-FFT. Three experiments have been presented inthis work. In the first experiment, the system proves to bea useful tool to synthesize, modify and reproduce real earth-quake signals with great accuracy, which is fundamental inthe analysis and design of structures. The second and thethird experiment are carried out to show the efficiency ofthe system to generate or to synthesize other types of sig-nals such as ambient vibration and synthetic signals, aimingat knowing other characteristics like natural frequencies.
The proposed system is a useful tool in the analysis ofearthquake effects on structures in order to help the improve-ment of its performance, resistance, design, and life service.In addition, it has tools to generate other types of signals forcalculating other structure characteristics, showcased in thedeveloped experiments. Furthermore, the feature compari-son between the proposed system and other reported workshighlights the advantages of using the proposed system.
Acknowledgements.This project was partially supported byCONACyT scholarship 213849 and SEP-CONACyT 84723project.
Edited by: M. E. ContadakisReviewed by: A. Garcia-Perez and another anonymous referee
References
Amezquita-Sanchez, J. P., Cabal-Yepez, E., Romero-Troncoso, R.J., Osornio-Rios, R. A., and Garcia-Perez, A.: Determinationof system frequencies in mechanical systems during shutdowntransient, J. Sci. Ind. Res., 69, 415–421, 2010.
Brownjohn, J. M. W., Moyo, P., Omenzetter, P., and Lu, Y.: As-sessment of highway bridge upgrading by dynamic testing andfinite-element model updating, J. Bridge Eng., 8, 162–172, 2003.
Chavez, O., Millan-Almaraz, J. R., Perez-Enrıquez, R., Arzate-Flores, J. A., Kotsarenko, A., Cruz-Abeyro, J. A., and Rojas, E.:Detection of ULF geomagnetic signals associated with seismicevents in Central Mexico using Discrete Wavelet Transform, Nat.Hazards Earth Syst. Sci., 10, 2557–2564,doi:10.5194/nhess-10-2557-2010, 2010.
Chen, B., Xu, Y. L., and Qu, W. L.: Evaluation of atmosphericcorrosion damage to steel space structures in coastal areas, Int. J.Solids Struct., 42, 4673–4694, 2005.
Dolce, M. and Cardone, D.: Theoretical and experimental studiesfor the application of shape memory alloys in civil engineering,J. Eng. Mater. Technol., 128, 302–311, 2006.
Dominguez, A., Sedaghati, R., and Stiharu, I.: Modeling and ap-plication of MR dampers in semi-adaptive structures, Comput.Struct., 86, 407–415, 2007.
Dyke, S. J.: Design and development of the Washington Universityseismic simulator facility, in: Proc. 12th Eng. Mech, ASCE, SanDiego, 762–765, 1998.
Ersubasi, F. and Korkmaz, H. H.: Shaking table tests on strength-ening of masonry structures against earthquake hazard, Nat.Hazards Earth Syst. Sci., 10, 1209–1220,doi:10.5194/nhess-10-1209-2010, 2010.
Gurley, K. and Kareem, A.: Applications of wavelet transforms inearthquake, wind and ocean engineering, Eng. Struct., 21, 149–167, 1999.
Han, J. G., Wei-Xin Ren, W. X., and Sun, Z. S.: Wavelet packetbased damage identification of beam structures, Int. J. SolidsStruct., 42, 6610–6627, 2005.
Ibrahim, Z. and Reynolds, P.: Modal testing of a cantilever grand-stand, in: International conference on construction and build-ing technology (ICCBT2008), 16–20, Kuala Lumpur, Malaysia,2008.
Jeyasehara, C. A., Kumarb, K. S., Muthumanib, K., and Laksh-mananb, N.: Seismic performance evaluation methodologies forcivil engineering structures, Indian J. Eng. Mater. Sci., 16, 220–228, 2009.
Johnson, R., Padgett, J. E., Maragakis, M. E., DesRoches, R., andSaiidi, M. S.: Large scale testing of nitinol shape memory alloydevices for retrofitting of bridges, Smart Mater. Struct., 17, 1–10,2008.
Kamanli, M. and Balik, F. S.: The behaviour of roof gable wallsunder the effect of earthquake load, Nat. Hazards Earth Syst. Sci.,10, 251–263,doi:10.5194/nhess-10-251-2010, 2010.
Mallat, S.: A Wavelet tour of signal processing, 2nd Edn., Aca-demic Press, 1999.
Nagarajaiah, S.: Adaptive passive, semiactive, smart tuned massdampers: identification and control using empirical mode de-composition, hilbert transform, and short-term fourier transform,Struct Contr Health Monit., 16, 800–841, 2009.
Nagarajaiah, S. and Basu, B.: Output only modal identification andstructural damage detection using time frequency and wavelettechniques, Earthq. Eng. Eng. Vib., 8, 583–605, 2009.
Nakata, N.: Acceleration trajectory tracking control for earthquakesimulators, Eng. Struct., 32, 2229–2236, 2010.
Ovanesova, A. V. and Suarez, L. E.: Applications of wavelet trans-forms to damage detection in frame structures, Eng. Struct., 26,39–49, 2004.
Proakis, J. G. and Manolakis, D. K.: Digital Signal Processing,Principles and Applications, Fourth Edition, Prentice-Hall, NewJersey, USA, 2006.
Rangel-Magdaleno, J. J., Romero-Troncoso, R. J., Osornio-Rios,R.A., Cabal-Yepez, E., and Dominguez-Gonzalez, A.: FPGA-based vibration analyzer for continuous CNC machinery moni-toring with fused FFT-DWT signal processing, IEEE Trans. In-strum. Meas., 59, 3184–3194, 2010
Nat. Hazards Earth Syst. Sci., 12, 61–73, 2012 www.nat-hazards-earth-syst-sci.net/12/61/2012/

J. P. Amezquita-Sanchez et al.: Hardware-software system for simulating and analyzing earthquakes 73
Reda, M. M., Noureldin, A., Lucero, J. L., and Baca, T. J.: Wavelettransform for structural health monitoring: A compendium ofuses and features, Struct. Health. Monit., 5, 267–295, 2006.
Ren, W. X., Tong Zhao, T., and Harik, I. E.: Experimental andanalytical modal analysis of steel arch bridge, J. Struct. Eng.,130, 1022–1031, 2004.
Ren, W. X., Peng, X. L., and Lin, Y. Q.: Experimental and analyticalstudies on dynamic characteristics of a large span cable-stayedbridge, Eng. Struct., 27, 535–548, 2005.
Reynolds, P. and Pavic, A.: Modal testing of a sport stadium,in: Proc. of the 20th. International Modal Analysis Conference(IMAC XX), Los Angeles, California, USA, 1037–1043, 2002.
Romero-Troncoso, R. J. and Espinosa-Flores, G.: Phase accumula-tor synthesis algorithm for DDS applications, Electron. Lett., 35,770–772, 1999.
San Bartolome, A., Quiun, D., and Zegarra, L.: Effective sys-tem for seismic reinforcement of adobe houses, in: 13th Worldconference on Earthquake Engineering, 3321, Vancouver, B.C.,Canada, 2004.
Sun, Z. and Chang, C. C.: Structural damage assessment based onwavelet packet transform, J. Struct. Eng., 128, 1354–1361, 2002.
Taha, M. M. R.: A neural-wavelet technique for damage identifica-tion in the ASCE benchmark structure using phase II experimen-tal data, Adv. Civ. Eng.,doi:10.1155/2010/675927, 2010.
Van de Lindt, J. W. and Potts, A.: Shake table testing of a Superelas-tic Shape Memory Alloy response modification device in a woodshearwall, J. Struct. Eng., 134, 1343–1352, 2008.
Zeng, X., Zhao, W., and Sheng, J.: Corresponding relationshipsbetween nodes of decomposition tree of wavelet packet and fre-quency bands of signal subspace, Acta Seismol. Sin., 21, 91–97,2008.
Zivanovic, S., Pavic, A., and Reynolds, P.: Modal testing and FEmodel tuning of a lively footbridge structure, Eng. Struct., 28,857–868, 2006.
www.nat-hazards-earth-syst-sci.net/12/61/2012/ Nat. Hazards Earth Syst. Sci., 12, 61–73, 2012