Hardbottom Impacts: Bridging the Gap Between Science and ...€¦ · more than 1.08 ac estimated on...
36
FSBPA FSBPA The National Conference on Beach Preservation Technology The National Conference on Beach Preservation Technology February 14, 2013 February 14, 2013 Hardbottom Impacts: Bridging the Gap Between Hardbottom Impacts: Bridging the Gap Between Science and Regulatory, A Case Study Science and Regulatory, A Case Study South St. Lucie County Beach Restoration Project South St. Lucie County Beach Restoration Project Kimberly K. Colstad Kimberly K. Colstad Lois A. Edwards Lois A. Edwards
-
Upload
nguyenkhuong -
Category
Documents
-
view
213 -
download
0
Transcript of Hardbottom Impacts: Bridging the Gap Between Science and ...€¦ · more than 1.08 ac estimated on...

FSBPAFSBPAThe National Conference on Beach Preservation TechnologyThe National Conference on Beach Preservation Technology
February 14, 2013February 14, 2013
Hardbottom Impacts: Bridging the Gap Between Hardbottom Impacts: Bridging the Gap Between Science and Regulatory, A Case StudyScience and Regulatory, A Case StudySouth St. Lucie County Beach Restoration ProjectSouth St. Lucie County Beach Restoration Project
Kimberly K. ColstadKimberly K. ColstadLois A. EdwardsLois A. Edwards

(gratuitous cute manatee snout photo)(gratuitous cute manatee snout photo)
OHAI!

PrePre--Permitting HistoryPermitting History
•• 2006 Nearshore hardbottom (HB) Mapping/ 2006 Nearshore hardbottom (HB) Mapping/ Characterization by others:Characterization by others:–– SidescanSidescan sonar, aerial photography GIS interpretation;sonar, aerial photography GIS interpretation;–– HighHigh--density hardbottom resources ~300 to 600 feet density hardbottom resources ~300 to 600 feet
offshore and sporadic scattered hardbottom;offshore and sporadic scattered hardbottom;–– In situIn situ investigation of 32 sites, 24 intended transects, only investigation of 32 sites, 24 intended transects, only
able to conduct biological characterization of 13;able to conduct biological characterization of 13;–– State and federal agencies acknowledged conditions State and federal agencies acknowledged conditions
precluded adequate community mapping and impact precluded adequate community mapping and impact estimate in 2006 and made recommendations for future estimate in 2006 and made recommendations for future efforts.efforts.
•• 2006 letter from NOAA2006 letter from NOAA--Fisheries Habitat Fisheries Habitat Conservation Division (HCD) identified primary Conservation Division (HCD) identified primary concern was shoal mining, no mention of HB.concern was shoal mining, no mention of HB.

•• Early 2007 Coastal Tech began planning stages:Early 2007 Coastal Tech began planning stages:–– Collaboratively developed investigative plan with state and Collaboratively developed investigative plan with state and
federal staff for hardbottom resources to resolve concerns federal staff for hardbottom resources to resolve concerns from previous HB mapping efforts:from previous HB mapping efforts:
•• Aerial photo interpretation with fieldAerial photo interpretation with field--verificationverification•• Landward edge of hardbottom (LEHB) mappingLandward edge of hardbottom (LEHB) mapping•• ShoreShore--parallel transects with parallel transects with in situin situ quadrats and videoquadrats and video
–– Plan approved by both agencies and funded by the state.Plan approved by both agencies and funded by the state.
•• Engaged fisheries expert to summarize potential Engaged fisheries expert to summarize potential effects from project to offshore shoal Essential Fish effects from project to offshore shoal Essential Fish Habitat (EFH) to address NOAAHabitat (EFH) to address NOAA--Fisheries HCD Fisheries HCD concerns.concerns.
•• 5 design alternatives considered before template 5 design alternatives considered before template selected.selected.
PrePre--Permitting HistoryPermitting History
Photo courtesy of CSA Ocean Sciences, Inc.
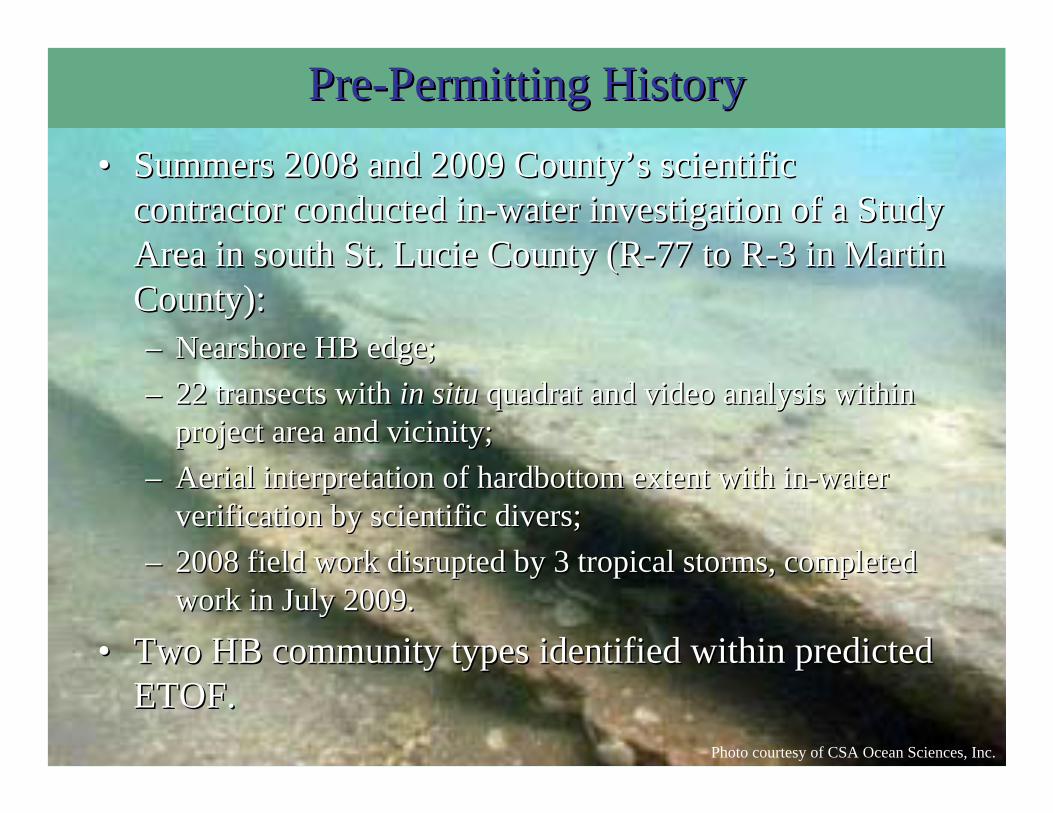
•• Summers 2008 and 2009 CountySummers 2008 and 2009 County’’s scientific s scientific contractor conducted incontractor conducted in--water investigation of a Study water investigation of a Study Area in south St. Lucie County (RArea in south St. Lucie County (R--77 to R77 to R--3 in Martin 3 in Martin County):County):–– Nearshore HB edge;Nearshore HB edge;–– 22 transects with 22 transects with in situin situ quadrat and video analysis within quadrat and video analysis within
project area and vicinity;project area and vicinity;–– Aerial interpretation of hardbottom extent with inAerial interpretation of hardbottom extent with in--water water
verification by scientific divers;verification by scientific divers;–– 2008 field work disrupted by 3 tropical storms, completed 2008 field work disrupted by 3 tropical storms, completed
work in July 2009. work in July 2009.
•• Two HB community types identified within predicted Two HB community types identified within predicted ETOF.ETOF.
PrePre--Permitting HistoryPermitting History
Photo courtesy of CSA Ocean Sciences, Inc.

•• Original project Original project consisted of 2 segments: consisted of 2 segments: RR-- 87.7 to R87.7 to R--90.3, and 90.3, and RR--98 to SLC/MC line98 to SLC/MC line
•• Hardbottom impacts Hardbottom impacts within predicted ETOF within predicted ETOF 1.08 acres based on 1.08 acres based on 2008 and 2009 in2008 and 2009 in--water water investigations and investigations and mapping.mapping.
•• Application submitted Application submitted September 2009 with September 2009 with preliminary HB results preliminary HB results (field work completed (field work completed July 2009).July 2009).
JCP ApplicationJCP Application

JCP ApplicationJCP ApplicationTimelineTimeline
20072007
Review of prior HB Review of prior HB investigations by investigations by othersothers
Development of Development of detailed HB detailed HB monitoring protocol monitoring protocol with state/federal with state/federal agenciesagencies
August August 20082008
Project funded by Project funded by the statethe state
HB HB investigations investigations begin in fieldbegin in field
TS FayTS Fay
TS HannaTS Hanna
TS KyleTS Kyle
September September 20082008
October 2008 October 2008 –– August 2009August 2009
Project design continuesProject design continues
HB investigations conclude July HB investigations conclude July 20092009
JCP Application JCP Application submitted to agenciessubmitted to agencies
September 2009September 2009
Photos courtesy of CSA Ocean Sciences, Inc.

•• ““More HB is visually apparent [in 2008 aerial] than More HB is visually apparent [in 2008 aerial] than was mappedwas mapped”” in 2009.in 2009.
•• Requested applicant provide methodology of HB Requested applicant provide methodology of HB delineation (previously approved/funded).delineation (previously approved/funded).
•• Now requested quantification of ephemeral HBNow requested quantification of ephemeral HB–– ““use a series of aerials and surveys to map and quantify use a series of aerials and surveys to map and quantify
both persistent and ephemeral HB for the last few yearsboth persistent and ephemeral HB for the last few years””
•• Monitoring transects are Monitoring transects are ““not sufficient to delineate not sufficient to delineate HB without also establishing shoreward HB limits HB without also establishing shoreward HB limits and and in situin situ verification of HB distribution.verification of HB distribution.””
JCP ProcessingJCP ProcessingState RAI #1 October 2009State RAI #1 October 2009

•• Requested:Requested:–– Avoidance discussion (reduced template widths, Avoidance discussion (reduced template widths,
elimination of fill areas on hardbottom, reducing elimination of fill areas on hardbottom, reducing fill to minimum necessary to achieve project fill to minimum necessary to achieve project purpose.purpose.
–– Avoidance and Minimization discussion (types of Avoidance and Minimization discussion (types of best management practices used).best management practices used).
–– Statement of proposed mitigation plan.Statement of proposed mitigation plan.
JCP ProcessingJCP ProcessingFederal RAI #1 December 2009Federal RAI #1 December 2009
Photo courtesy of CSA Ocean Sciences, Inc.
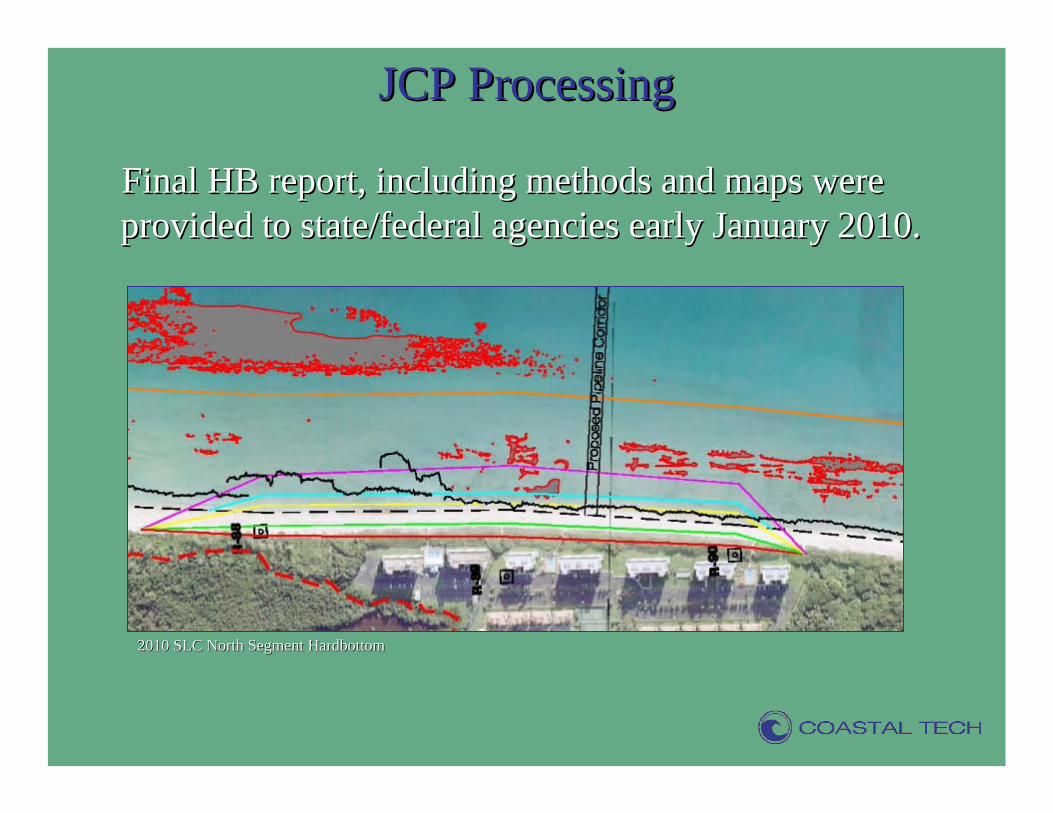
Final HB report, including methods and maps were Final HB report, including methods and maps were provided to state/federal agencies early January 2010.provided to state/federal agencies early January 2010.
JCP ProcessingJCP Processing
2010 SLC North Segment Hardbottom2010 SLC North Segment Hardbottom

•• Item 28: Item 28: ““ we will be in touch in the future with any we will be in touch in the future with any recommendations regarding optimizing your aerial photo recommendations regarding optimizing your aerial photo interpretation efforts for future projects.interpretation efforts for future projects.””
•• Item 33(d): Item 33(d): ““impact area would appear to be considerably impact area would appear to be considerably more than 1.08 ac estimated on aerial photo of 2008.more than 1.08 ac estimated on aerial photo of 2008.””
•• Item 33(d): Item 33(d): ““Dean Equilibrium Profile Methodology does Dean Equilibrium Profile Methodology does not perform the same over HB as it works in sand.not perform the same over HB as it works in sand.””
•• Item 37: Item 37: ““once the equilibrium of sand is revised and once the equilibrium of sand is revised and extent of HB is determined, please consider ways to extent of HB is determined, please consider ways to minimize HB impacts and discuss how minimization minimize HB impacts and discuss how minimization would affect project goals.would affect project goals.””
•• Item 37: requires Item 37: requires ““in kindin kind”” mitigation, worm rock to be mitigation, worm rock to be ““substantially impactedsubstantially impacted””..
JCP ProcessingJCP ProcessingState RAI #2 February 2010State RAI #2 February 2010
Photo courtesy of CSA Ocean Sciences, Inc.

•• Coastal Tech proposed an additional 2010 HB Coastal Tech proposed an additional 2010 HB mapping/ characterization effort using aerials mapping/ characterization effort using aerials and diverand diver--verification, similar to 2008 HB map verification, similar to 2008 HB map with more broad spatial field work.with more broad spatial field work.
•• HB impacts will then be determined via timeHB impacts will then be determined via time--average to account for temporal/spatial average to account for temporal/spatial variation of exposed HB.variation of exposed HB.
•• State noted that CT State noted that CT ““on the right pathon the right path””regarding the proposed methodology.regarding the proposed methodology.
•• Response to RAI #2 July 2010.Response to RAI #2 July 2010.
JCP ProcessingJCP ProcessingTeleconference with State July 2010Teleconference with State July 2010

•• Item 33(d): Item 33(d): –– ““does not agree with the conclusions madedoes not agree with the conclusions made”” in HB in HB
impact assessment.impact assessment.–– The method of aerial photo analysis shall be The method of aerial photo analysis shall be
calibrated with diver observation.calibrated with diver observation.–– Does not agree with Dean Equilibrium Profile Does not agree with Dean Equilibrium Profile
Methodology; reMethodology; re--evaluate ETOF using a more evaluate ETOF using a more appropriate analysis. (biological comment)appropriate analysis. (biological comment)
•• Item 37: Biological Monitoring Plan currently Item 37: Biological Monitoring Plan currently under separate review and will be discussed under separate review and will be discussed separately from this RAI.separately from this RAI.
JCP ProcessingJCP ProcessingState RAI #3 August 2010State RAI #3 August 2010
Photo courtesy of CSA Ocean Sciences, Inc.

•• Aerial photos do not adequately capture ephemeral HB.Aerial photos do not adequately capture ephemeral HB.•• Existing aerials show much more HB than what delineated.Existing aerials show much more HB than what delineated.•• State now identified series of low ledges from aerials. State now identified series of low ledges from aerials. •• 2010 aerial with ground2010 aerial with ground--truthingtruthing proposed work is proposed work is
acceptable.acceptable.•• <<10cm sand coverage = edge of ephemeral HB.10cm sand coverage = edge of ephemeral HB.•• Agreed few impacts at south end of project area (= 0.69 ac).Agreed few impacts at south end of project area (= 0.69 ac).•• State to review provided aerials and produce own LEHB State to review provided aerials and produce own LEHB
interpretation via desktop analysis.interpretation via desktop analysis.•• Dean Equilibrium Profile Method now accepted. Dean Equilibrium Profile Method now accepted. •• PostPost--construction monitoring will identify actual ETOF.construction monitoring will identify actual ETOF.•• Recommended County install 0.5 acres more mitigation reef Recommended County install 0.5 acres more mitigation reef
than required by JCP to circumvent mitigation for next than required by JCP to circumvent mitigation for next nourishment event.nourishment event.
JCP ProcessingJCP ProcessingTeleconference with State August 2010Teleconference with State August 2010

•• Manually interpreted gaps from 2008Manually interpreted gaps from 2008--2009 field 2009 field LEHB.LEHB.
•• Calculated 1/3 of the area between that LEHB and Calculated 1/3 of the area between that LEHB and predicted ETOF to estimate HB impacts.predicted ETOF to estimate HB impacts.
•• 0.97 acres North Segment, 6.97 acres South Segment. 0.97 acres North Segment, 6.97 acres South Segment. Total of 7.94 acres.Total of 7.94 acres.
•• Applicant submitted stateApplicant submitted state’’s methodology and HB s methodology and HB impact estimates impact estimates –– ““Maximum Potential ImpactsMaximum Potential Impacts”” ––to federal agency, scientific validity rejected.to federal agency, scientific validity rejected.
•• Recommends lineRecommends line--intercept with accompanying sand intercept with accompanying sand depth measurements for field work associated with depth measurements for field work associated with HB mapping. HB mapping. <<20cm sand = HB buried/re20cm sand = HB buried/re--exposedexposed
JCP ProcessingJCP ProcessingStateState’’s Aeriallys Aerially--Interpreted HB Map August 2010Interpreted HB Map August 2010

JCP ProcessingJCP ProcessingStateState’’s Aeriallys Aerially--Interpreted HB Map August 2010Interpreted HB Map August 2010
StateState
ApplicantApplicant

•• Aerials flown October 2010, no weather window for Aerials flown October 2010, no weather window for field work; state acknowledges adverse conditions.field work; state acknowledges adverse conditions.
•• State has nothing in writing how HB impacts are to State has nothing in writing how HB impacts are to be determined/calculated, or associated mitigation, be determined/calculated, or associated mitigation, because each site is unique with regard to HB because each site is unique with regard to HB features.features.
•• October aerials should be fieldOctober aerials should be field--verified by December verified by December 31, 2010.31, 2010.
•• If no fieldIf no field--verification possible, state will accept verification possible, state will accept maps generated by remote sensing software because maps generated by remote sensing software because itit’’s the s the ““best available informationbest available information””..
•• PostPost--construction monitoring dictates actual impacts.construction monitoring dictates actual impacts.
JCP ProcessingJCP ProcessingTeleconference with State December 2010Teleconference with State December 2010

JCP ProcessingJCP Processing2010 Applicant HB Map2010 Applicant HB Map
October 2010 aerial, December 2010 fieldOctober 2010 aerial, December 2010 field--verificationverification
Project North
Segment
Project South
Segment
FPL Power Plant
Martin County

•• ““staff conceptually agrees with suggestions staff conceptually agrees with suggestions made in the Mitigation Plan as well as the made in the Mitigation Plan as well as the estimate of HB impact.estimate of HB impact.””–– 2.08 acre North Segment (R2.08 acre North Segment (R--87.7 to R87.7 to R--90.3)90.3)–– 0.08 acre North Pipeline0.08 acre North Pipeline–– 0.55 acre South Segment (R0.55 acre South Segment (R--98 to MCL)98 to MCL)–– 0.02 acre South Pipelines (4)0.02 acre South Pipelines (4)
•• Additional communications with state via Additional communications with state via email and telephone to prompt feedback/ email and telephone to prompt feedback/ concurrence in response to August 2010 RAI concurrence in response to August 2010 RAI #3, regarding Biological Monitoring and #3, regarding Biological Monitoring and Mitigation Plans.Mitigation Plans.
JCP ProcessingJCP ProcessingState RAI #4 March 2011State RAI #4 March 2011
Photo courtesy of CSA Ocean Sciences, Inc.

•• Identified 1.08 acres HB impactsIdentified 1.08 acres HB impacts•• NOAANOAA--Fisheries HCD RAI in response to PN:Fisheries HCD RAI in response to PN:
–– 1.08 acres direct effect1.08 acres direct effect–– Requested quantification of indirect impacts due to Requested quantification of indirect impacts due to
spreading.spreading.–– Requested available benthic habitat maps.Requested available benthic habitat maps.–– Is nearshore HB a limited resource in St. Lucie?Is nearshore HB a limited resource in St. Lucie?–– Requested quantification of temporary impacts due Requested quantification of temporary impacts due
to pipeline placement to pipeline placement –– recommended recommended floating/elevated pipe to avoid nearshore HB floating/elevated pipe to avoid nearshore HB impacts [already proposed].impacts [already proposed].
JCP ProcessingJCP ProcessingFederal Public Notice June 2011Federal Public Notice June 2011

•• Interpreted LEHB from 2009 FDOT aerial, using Interpreted LEHB from 2009 FDOT aerial, using fieldfield--verified 2009 LEHB and manually interpreting verified 2009 LEHB and manually interpreting gaps.gaps.
•• Superimposed biological monitoring transects to Superimposed biological monitoring transects to identify ratio of HB/sand. Transects biased to HB.identify ratio of HB/sand. Transects biased to HB.
•• Calculated HB impacts:Calculated HB impacts:–– 5.19 acres North Segment (1.83 HB, 3.36 ephemeral)5.19 acres North Segment (1.83 HB, 3.36 ephemeral)–– 7.34 acres South Segment (4.28 HB, 3.06 ephemeral)7.34 acres South Segment (4.28 HB, 3.06 ephemeral)–– Total of 12.53 acres of HB impactTotal of 12.53 acres of HB impact
•• Increased estimated impacts from 2.73 acres (agreed Increased estimated impacts from 2.73 acres (agreed to in RAI #4) to 12.53 acres. Cost of required to in RAI #4) to 12.53 acres. Cost of required mitigation would preclude project construction.mitigation would preclude project construction.
JCP ProcessingJCP ProcessingState AeriallyState Aerially--Interpreted HB Map October 2011Interpreted HB Map October 2011

•• State does not accept 2010 HB map work products or State does not accept 2010 HB map work products or associated HB impact estimates, because associated HB impact estimates, because ““only relied on only relied on computer analysiscomputer analysis”” and and ““did not take into account previous did not take into account previous diverdiver--verified data.verified data.”” More HB apparent on aerials.More HB apparent on aerials.
•• Aerial interpretation only verifies HB borders, not distributionAerial interpretation only verifies HB borders, not distributionof HB.of HB.
•• No resolution of HB issue, attended meeting in Tallahassee No resolution of HB issue, attended meeting in Tallahassee with state agency upper management.with state agency upper management.
•• Found total of 11.9 acres of exposed/persistent and ephemeral Found total of 11.9 acres of exposed/persistent and ephemeral HB impacts. Mitigation would be 13.47 acres.HB impacts. Mitigation would be 13.47 acres.
JCP ProcessingJCP ProcessingMeetings with State NovemberMeetings with State November--December 2011December 2011

From CSA 2011 Memo to Coastal TechFrom CSA 2011 Memo to Coastal Tech
JCP ProcessingJCP ProcessingComparison Applicant HB vs. State HB InterpretationComparison Applicant HB vs. State HB Interpretation
State manualState manual--only interpretation is 3.6 times the HB amount only interpretation is 3.6 times the HB amount of combination manual/computer interpretation.of combination manual/computer interpretation.

JCP ProcessingJCP ProcessingComparison of HB Mapping AcreagesComparison of HB Mapping Acreages
Total Area
ApplicantState Methodology
17.642.731.0811.912.537.94TOTAL12.140.570.695.777.346.97South 5.502.160.396.105.190.97North
Winter 2010
Summer 2008
December 2011
October 2011
August 2010

•• North Segment North Segment deleted from project deleted from project in December 2011.in December 2011.–– Significant HB Significant HB
impactsimpacts–– Condominium opted Condominium opted
out of projectout of project•• Effectively reduced Effectively reduced
proposed impacts by proposed impacts by approximately 79 approximately 79 percent percent –– now 0.57 now 0.57 acres.acres.
•• Mitigation 0.97 acres Mitigation 0.97 acres of artificial reef.of artificial reef.

•• Federal commenting agency letter December 2011:Federal commenting agency letter December 2011:–– ““it appears that there is much more HB in the project area it appears that there is much more HB in the project area
than reported by the applicant.than reported by the applicant.””–– Agency estimates 6.1 acres in North Segment, 5.8 acres in Agency estimates 6.1 acres in North Segment, 5.8 acres in
the South Segment.the South Segment.–– Concerned with applicant methods of HB mapping:Concerned with applicant methods of HB mapping:
•• Bounce divesBounce dives•• Large areas between dive sites were not verifiedLarge areas between dive sites were not verified•• UnderUnder--sampled the project areasampled the project area
•• EIS published February 2012, impacts identified as EIS published February 2012, impacts identified as 0.57 acres, consistent with state assessment.0.57 acres, consistent with state assessment.
JCP ProcessingJCP ProcessingFederal Permitting December 2011Federal Permitting December 2011--February 2012February 2012

•• NOAANOAA--Fisheries HCD letter June 1, 2012 Fisheries HCD letter June 1, 2012 •• Federal Agency set up meeting with NOAAFederal Agency set up meeting with NOAA--
Fisheries on June 6, 2012 to resolve issues and Fisheries on June 6, 2012 to resolve issues and clarify misconceptions.clarify misconceptions.–– ApplicantApplicant–– ApplicantApplicant’’s Agents Agent–– Senior Scientific Staff (field work experts)Senior Scientific Staff (field work experts)–– USACEUSACE
•• At start of meeting, NOAA indicated At start of meeting, NOAA indicated preference of meeting only with Corps.preference of meeting only with Corps.
JCP ProcessingJCP ProcessingFederal Commenting Agency Additional CommentsFederal Commenting Agency Additional Comments

•• HB impacts identified = 0.57 acres.HB impacts identified = 0.57 acres.•• Mitigation identified = 0.97 acres artificial Mitigation identified = 0.97 acres artificial
reef.reef.•• Biological monitoring required:Biological monitoring required:
–– PrePre--constructionconstruction–– Immediate postImmediate post--constructionconstruction–– Years 1 and 2 postYears 1 and 2 post--constructionconstruction
JCP ProcessingJCP ProcessingState Issues JCP Final Order June 2012State Issues JCP Final Order June 2012
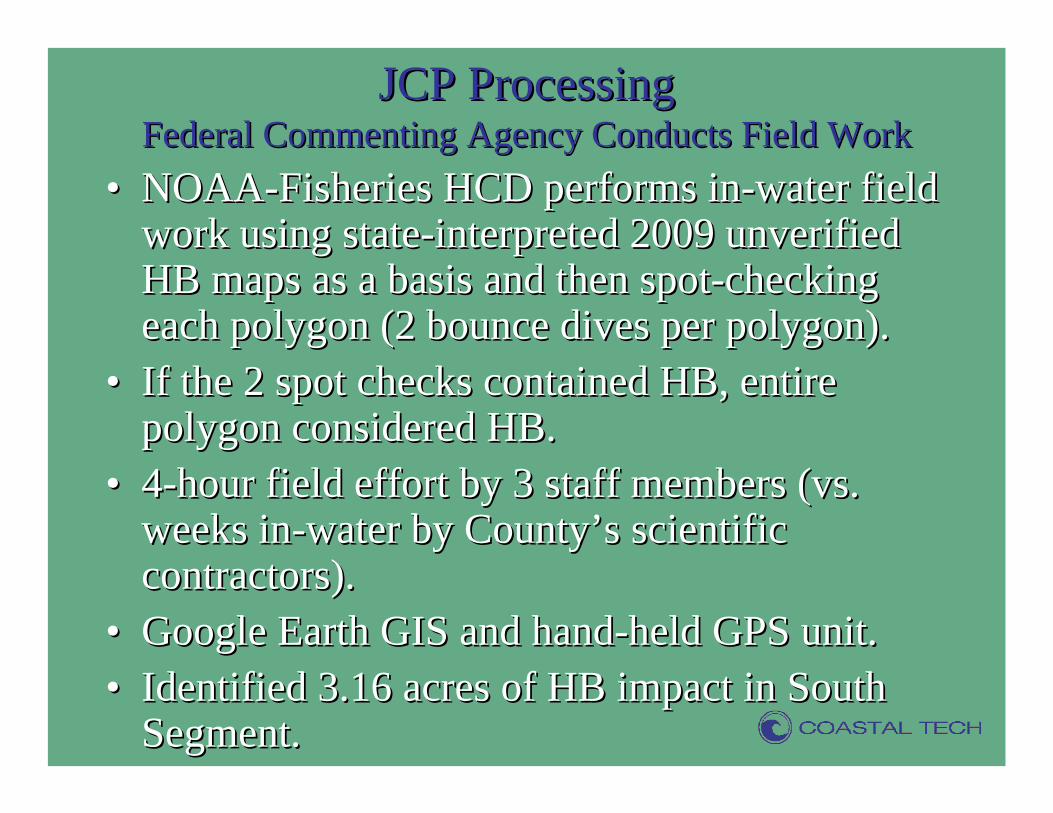
•• NOAANOAA--Fisheries HCD performs inFisheries HCD performs in--water field water field work using statework using state--interpreted 2009 unverified interpreted 2009 unverified HB maps as a basis and then spotHB maps as a basis and then spot--checking checking each polygon (2 bounce dives per polygon).each polygon (2 bounce dives per polygon).
•• If the 2 spot checks contained HB, entire If the 2 spot checks contained HB, entire polygon considered HB.polygon considered HB.
•• 44--hour field effort by 3 staff members (vs. hour field effort by 3 staff members (vs. weeks inweeks in--water by Countywater by County’’s scientific s scientific contractors).contractors).
•• Google Earth GIS and handGoogle Earth GIS and hand--held GPS unit.held GPS unit.•• Identified 3.16 acres of HB impact in South Identified 3.16 acres of HB impact in South
Segment.Segment.
JCP ProcessingJCP ProcessingFederal Commenting Agency Conducts Field WorkFederal Commenting Agency Conducts Field Work

JCP ProcessingJCP ProcessingFederal Commenting Agency Conducts Field WorkFederal Commenting Agency Conducts Field Work
From NOAA-Fisheries HCD June 20, 2012 Letter
Polygon = Polygon = 0.77 acres0.77 acres
North Spot North Spot CheckCheck
South Spot South Spot CheckCheck

•• State issues letter to federal commenting agency State issues letter to federal commenting agency regarding use of stateregarding use of state’’s unverified 2009 HB aerial s unverified 2009 HB aerial interpretation that state ultimately rejected.interpretation that state ultimately rejected.
•• NOAA will not consider other methods or estimates NOAA will not consider other methods or estimates besides their own.besides their own.
JCP ProcessingJCP ProcessingStateState--Federal CommunicationFederal Communication

Winter 2010
Summer 2008
December 2011
October 2011
August 2010
Total Area
ApplicantState Methodology
12.140.570.692.083.165.8Total Acreage
12.140.570.695.777.346.97Total Acreage
Winter 2010
Summer 2008
July 2012
June 2012
December 2011
Total Area
ApplicantNOAA Methodology
JCP ProcessingJCP ProcessingComparison of HB Mapping Acreages Comparison of HB Mapping Acreages –– South SegmentSouth Segment

•• Federal Agency suggests compromise by timeFederal Agency suggests compromise by time--averaging applicantaveraging applicant’’s 2008 and 2010 data, s 2008 and 2010 data, along with NOAAalong with NOAA--Fisheries estimate of 3.16 Fisheries estimate of 3.16 acres, regarding HB impacts.acres, regarding HB impacts.
•• Average HB impacts = 1.34 acresAverage HB impacts = 1.34 acres•• Associated mitigation = 1.89 acresAssociated mitigation = 1.89 acres•• PostPost--issuance of permit, commenting agency issuance of permit, commenting agency
issues letter recommending an additional 0.91 issues letter recommending an additional 0.91 acres mitigation.acres mitigation.
JCP ProcessingJCP ProcessingFederal Resolution July 2012Federal Resolution July 2012

2010
2010
JCP ProcessingJCP ProcessingApplication to Issuance TimelineApplication to Issuance Timeline
Application Submittal
RAI #1
SeptemberSeptember
RAI #1
OctoberOctober DecemberDecember2009
2009
2011
2011
2012
2012
RAI Response
#1RAI #2
TeleconferenceRAI #3
Teleconference State HB Map
JanuaryJanuary FebruaryFebruary JulyJuly AugustAugust
Aerials
OctoberOctober
Field Work
Teleconference
DecemberDecember2010 HB Map
JanuaryJanuary MarchMarch
RAI #4
JuneJune
Public Notice Teleconference
AugustAugust NovemberNovemberOctoberOctober
HB Map
DecemberDecember
Meetings HB Map
Letter Decision
FebruaryFebruary
NEPA EIS
JuneJune
NOAA HB Map, Field Work Meetings/Teleconferences
PermitPermit
JulyJuly
RAI Response #2
RAI Response
#3
FebruaryFebruary
RAI Response
#4
MayMay
Blue = applicantYellow = stateRed = federal

Where Do We Go From Here?Where Do We Go From Here?(slide from Coastal Tech(slide from Coastal Tech’’s 2012 FSBPA presentation regarding HB Issues)s 2012 FSBPA presentation regarding HB Issues)
•• Better define nearshore hardbottom ecological functions Better define nearshore hardbottom ecological functions and compensatory mitigation and compensatory mitigation –– currently in progresscurrently in progress
•• Need to bridge the gaps between regulatory, science, Need to bridge the gaps between regulatory, science, engineering, and common sense engineering, and common sense –– Communication is key!Communication is key!–– Form a committee of regulatory, scientists, engineers to Form a committee of regulatory, scientists, engineers to
develop clear and concise standards that can be replicated develop clear and concise standards that can be replicated for determining beach nourishment project impactsfor determining beach nourishment project impacts
•• Develop standards for UMAM analysis of hardbottom Develop standards for UMAM analysis of hardbottom impacts.impacts.

Thank you!Thank you!