HARBASINS Report: Long-term Spatial Development of ...
26
HARBASINS Report: Long-term Spatial Development of Habitats in the Ems-Dollard Estuary Prepared by: Gerald Herrling and Hanz D. Niemeyer Lower Saxony Water Management, Coastal Defence and Nature Conservation Agency - Coastal Research Station - HARBASINS is a project funded under the European Regional Development Fund INTERREG IIIB North Sea Region Program – A European Community Initiative concerning Trans National Co-operation on Spatial Development 2000-2006.
Transcript of HARBASINS Report: Long-term Spatial Development of ...
HARBASINS Report:
Long-term Spatial Development of Habitats in the Ems-Dollard Estuary
Prepared by: Gerald Herrling and Hanz D. Niemeyer
Lower Saxony Water Management, Coastal Defence and Nature Conservation Agency
- Coastal Research Station -
HARBASINS is a project funded under the European Regional Development Fund INTERREG IIIB North Sea Region Program – A European Community Initiative concerning Trans National Co-operation on Spatial Development 2000-2006.
Long-term Spatial Development of Habitats in the Ems-Dollard Estuary
Page 2
Document history Revisions Version Status Date Name Changes 0.1 1st draft 18.12.2006 Herrling 0.2 1st revision 15.01.2007 Niemeyer 0.3 2nd draft 07.02.2007 Herrling 0.4 2nd revision 19.02.2007 Niemeyer 1.1 1st draft 25.11.2007 Herrling Chapter on ‘coastal waters’
has been added 1.2 1st revision 10.12.2007 Niemeyer Distribution This document has been sent to: Version Date sent Name Position 0.4 20.02.2007 Zijp Project Leader 0.4 20.02.2007 Elliott WP2 Leader 0.4 20.02.2007 Jager WP2 1.2 12.12.2007 Elliott, Breine, Zijp WP Leaders Authors: Gerald Herrling Hanz Dieter Niemeyer
Long-term Spatial Development of Habitats in the Ems-Dollard Estuary
Page 3
Table of Content DOCUMENT HISTORY.................................................................................... 2
TABLE OF CONTENT ...................................................................................... 3
TABLE OF FIGURES ........................................................................................ 4
1. INTRODUCTION........................................................................................... 5
2. INVESTIGATION AREA.............................................................................. 6
3. AVAILABLE HISTORICAL DATA ............................................................ 8 3.1 COASTAL AND TRANSITIONAL WATERS OF THE EMS-DOLLARD ESTUARY .............................................. 8 3.2 LOWER EMS BETWEEN PAPENBURG AND POGUM ................................................................................... 9
4. METHODOLOGY........................................................................................ 10 4.1 PROCESSING OF HISTORICAL INPUT DATA ............................................................................................. 10 4.2 PROCESSING OF ACTUAL INPUT DATA................................................................................................... 11
5. DEVELOPMENT OF THE EMS-DOLLARD ESTUARY AND LOWER EMS .................................................................................................................... 13
5.1 COASTAL WATERS OF THE EMS DOLLARD ESTUARY............................................................................. 13 5.1.1 DEVELOPMENT OF THE COASTAL WATERS OF THE EMS-DOLLARD ESTUARY ............................... 13 5.1.2 SPATIAL BALANCE IN THE COASTAL WATERS OF THE EMS-DOLLARD ESTUARY SINCE 1860....... 15 5.2 TRANSITIONAL WATERS OF THE EMS-DOLLARD ESTUARY................................................................... 16 5.2.1 DEVELOPMENT OF THE TRANSITIONAL WATERS OF THE EMS-DOLLARD ESTUARY....................... 16 5.2.2 SPATIAL BALANCE IN THE TRANSITIONAL WATERS OF THE EMS-DOLLARD ESTUARY SINCE 165019 5.3 LOWER EMS BETWEEN POGUM AND PAPENBURG................................................................................ 20 5.3.1 DEVELOPMENT OF THE LOWER EMS BETWEEN POGUM AND PAPENBURG .................................... 20 5.3.2 SPATIAL BALANCE IN THE LOWER EMS BETWEEN POGUM AND PAPENBURG ............................... 22
6. SUMMARY.................................................................................................... 23
LITERATURE................................................................................................... 24
APPENDIX ........................................................................................................ 24

Long-term Spatial Development of Habitats in the Ems-Dollard Estuary
Page 4
Table of Figures FIG. 1: INVESTIGATION AREA ................................................................................................................................... 6 FIG. 2: MHW AND MLW OBSERVED AT GAUGES ALONG THE EMS-DOLLARD ESTUARY FOR THE PERIOD FROM 2000
TO 2005........................................................................................................................................................... 7 FIG. 3: LONGITUDINAL GRADIENT IN SUSPENDED MATTER (MG/L) AND SALINITY (PPT) (JONGE 2000) .................. 7 FIG. 4: EXAMPLE OF HOMEIER MAPS (IN COLOR) WITH RECONSTRUCTED HISTORICAL TOPOGRAPHY
(COMBINATION OF MAPS NO. 1, 2, 3 AND 4 OF THE HISTORICAL CARTOGRAPHY OF THE LOWER SAXON COAST; EMS-DOLLARD ESTUARY, STATE AT 1860, HOMEIER 1962) AND THE INCORPORATED MAP (NON-COLORED) OF GERRITSEN (1952) WITH THE RECONSTRUCTED HISTORICAL TOPOGRAPHY OF 1859. ............ 8
FIG. 5: HISTORICAL TOPOGRAPHY OF THE LOWER EMS BETWEEN POGUM AND PAPENBURG (RIGHT: ENLARGED
SECTION HIGHLIGHTING THE DETAILED STRUCTURE) ...................................................................................... 9 FIG. 6: DEFINITION FOR THE DISTINCTION OF ESTUARINE HABITAT AREAS............................................................. 10 FIG. 7: VARIATION OF MHW [CM] AND MLW [CM] IN THE SOUTH-EASTERN NORTH SEA (DATA FROM LASSEN &
SIEFERT, 1991, IN NIEMEYER & KAISER, 1996).......................................................................................... 11 FIG. 8: CLASSIFICATION OF THE LITTORAL ENVIRONMENT CONSIDERING 5 HABITAT ZONES.................................. 12 FIG. 9: RECONSTRUCTION OF THE TOPOGRAPHICAL STATES AT A) 1860, B) 1960 AND C) 2005 OF THE COASTAL
WATERS OF THE EMS-DOLLARD ESTUARY (HOMEIER 1962, GERRITSEN 1952)...................................... 14 FIG. 10: DEVELOPMENT OF THE SURFACE AREA IN THE COASTAL WATERS OF THE EMS-DOLLARD ESTUARY
CLASSIFIED FOR SUB-, INTER- AND SUPRATIDAL HABITATS ........................................................................... 15 FIG. 11: RECONSTRUCTION OF THE TOPOGRAPHICAL STATES OF A) 1650 AND B) 1750 OF THE EMS-DOLLARD
ESTUARY BETWEEN POGUM AND DUKEGAT (HOMEIER 1962).................................................................... 16 FIG. 12: RECONSTRUCTION OF THE TOPOGRAPHICAL STATES OF A) 1860 AND B) 1960 OF THE EMS-DOLLARD
ESTUARY BETWEEN POGUM AND DUKEGAT (HOMEIER 1962).................................................................... 17 FIG. 13: PRESENT STATE OF THE EMS-DOLLARD ESTUARY BETWEEN DUKEGAT AND POGUM (2005).................... 18 FIG. 14: DEVELOPMENT OF THE SURFACE AREA IN THE TRANSITIONAL WATERS OF THE EMS-DOLLARD ESTUARY
BETWEEN POGUM AND DUKEGAT CLASSIFIED FOR SUB-, INTER- AND SUPRATIDAL HABITATS ...................... 19 FIG. 15: HABITATS ALONG THE LOWER EMS BETWEEN POGUM AND PAPENBURG AT A) 1898 AND B) 2005 .......... 20 FIG. 16: TOPOGRAPHY OF THE LOWER EMS BETWEEN MARK AND LEERORT IN A) 1898 AND B) 2005 ................... 21 FIG. 17: DEVELOPMENT OF THE SURFACE AREA IN THE LOWER EMS BETWEEN PAPENBURG AND POGUM
CLASSIFIED FOR SUB-, INTER- AND SUPRATIDAL HABITATS ........................................................................... 22
Long-term Spatial Development of Habitats in the Ems-Dollard Estuary
Page 5
1. Introduction Aim of the investigation is to identify and quantify changes of topography in recent decades and centuries with respect to available data and in particular due to anthropogenic impacts. In the course of the last centuries, the Ems-Dollard estuary and the Lower Ems experienced significant changes in their littoral environment both due to natural processes and to human interference. The main anthropogenic pressures on the estuary and its habitats have been: land reclamation, construction of dykes on supratidal marshes and tidal flats, harbour extensions, groynes, training walls, streamlining and deepening of the waterway by dredging and closing of tributary channels. The estuary consists of a variety of habitats which all provide a suitable environment for specific plants and animals being optimally adapted to the local environmental conditions. The borders of the distinct habitats are mainly coast parallel with respect to hydrodynamical and topographical gradients with which mostly the grain size distribution corresponds. A simple rule of thumb for their spatial extension is the gentler the slope, the broader the range of the habitats. The shape and state of the estuary has been altered significantly in the course of recent centuries by human interference. The Water Framework Directive of the European Communities (EC WFD) differentiates between natural and heavily modified water bodies. Therefore it is of high interest to define a natural reference status and thus the distribution of the former habitat zonation in order to evaluate the classification of the present state of the water body as natural or heavily modified. In coastal areas and particularly in estuaries or areas such as the Wadden Sea, there is a lack of straightforward procedures for the objective identification of ‘Heavily Modified Water Bodies’ (HMWB) according to the EC WFD. In a first step for evaluating estuarine water bodies with respect to the EC WFD classification, the changes in spatial extension of the distinct estuarine habitats will be carried out. Historical and the present states of the estuarine topography were evaluated with respect to the spatial extension of the distinct estuarine habitats differentiated in deep channels, adjacent shallow water areas, tidal flats and supratidal marshes. Available were data for the state at 1860, 1960 and 2005 of the coastal waters and for the state at 1650, 1750, 1860, 1960 and 2005 in the transitional waters of the Ems-Dollard estuary. For the Lower Ems tidal river between Pogum and Papenburg data were available for the states at 1898 and 2005 (Fig. 1). The comparison will be used as a basis for the quantification of habitat changes and furthermore for highlighting the pressure due to human impacts on the estuarine environment. This report is a first approach to the problem with respect to the need of project partners, particularly those of WP2. The intention is to deliver a report with an analysis on habitat changes covering the coastal and transitional waters of the Ems-Dollard estuary.

Long-term Spatial Development of Habitats in the Ems-Dollard Estuary
Page 6
2. Investigation area The investigation area covers the coastal and transitional waters of the Ems-Dollard estuary due to the EC Water Framework Directive; their seaward limit is close to Borkum in the outer estuary and they range upstream towards Leer in the Lower Ems. Available reconstructions of historical topographies cover the estuary between Borkum and Pogum. Further upstream between Pogum and Papenburg beside recent data a map of 1898 is available. In order to analyze as much as possible of the entity of the estuary also the area between Leer and Papenburg has been included into the analysis (Fig. 1).
Fig. 1: Investigation area
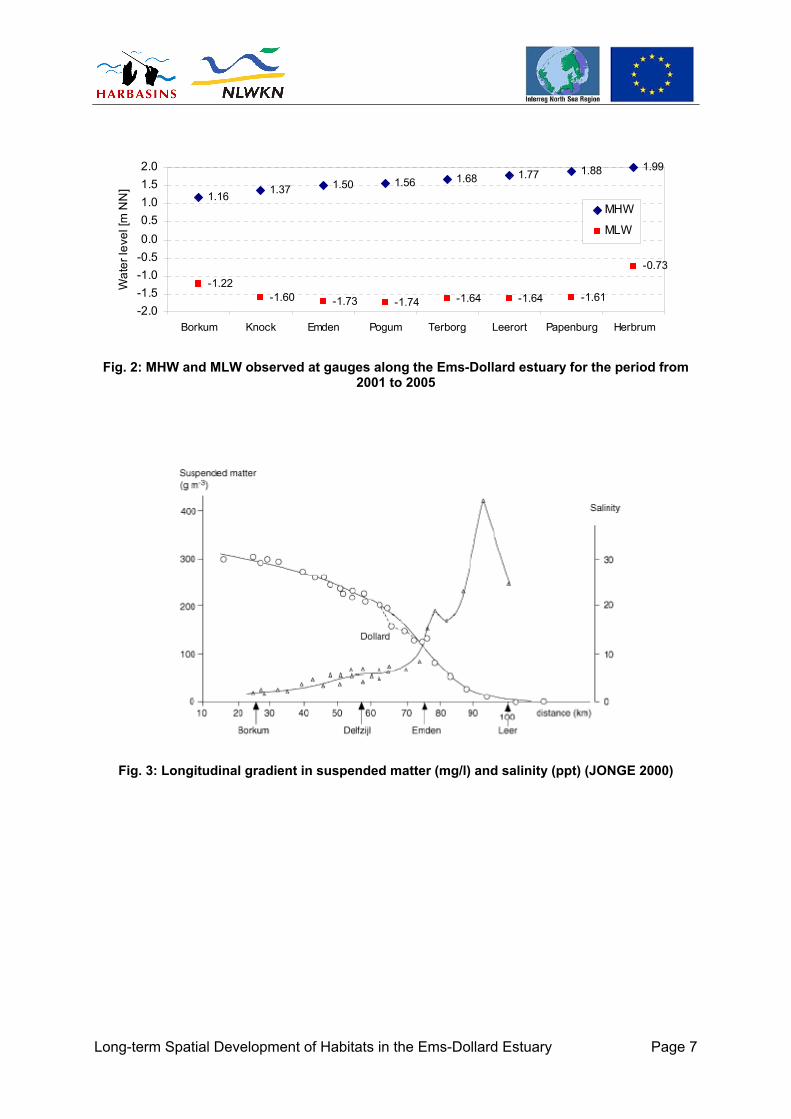
The actual mean tidal range in the Ems estuary has a bandwidth between 2.4 m at the island of Borkum increasing to its maximum of 3.5 m at Papenburg and decreases upstream to 2.7 m at the tidal border at Herbrum (Fig. 2). The salinity remains nearly constant at Borkum for mean tidal and freshwater conditions. Further upstream it reduces gradually up to Leer. Contrariwise, the concentration of suspended matter increases upstream of Borkum reaching its maximum of about 400 g/m³ between Jemgum and Leer (Fig. 3; JONGE 2000).
Background: a) DTK 1000 © Federal Office for Carthography and Geodesy 2002 b) Nautical charts © Federal Office for Navigation and Hydrography 2007
Long-term Spatial Development of Habitats in the Ems-Dollard Estuary
Page 7
1.16 1.37 1.50 1.56 1.68 1.77 1.88 1.99
-1.22-1.60 -1.73 -1.74 -1.64 -1.64 -1.61
-0.73
-2.0-1.5-1.0-0.50.00.51.01.52.0
Borkum Knock Emden Pogum Terborg Leerort Papenburg Herbrum
Wat
er le
vel [
m N
N]
MHW
MLW
Fig. 2: MHW and MLW observed at gauges along the Ems-Dollard estuary for the period from 2001 to 2005
Fig. 3: Longitudinal gradient in suspended matter (mg/l) and salinity (ppt) (JONGE 2000)

Long-term Spatial Development of Habitats in the Ems-Dollard Estuary
Page 8
3. Available historical data
3.1 Coastal and transitional waters of the Ems-Dollard estuary The reconstruction of historical topographies of the coastal and transitional waters of the Ems-Dollard estuary have been established as historical coastal maps by HOMEIER (1962) on the basis of historical records, navigation and land charts in order to document long-term morphological changes. They consist of the states of 1650, 1750, 1860 and 1960 for the whole Lower Saxon coast in a scale of 1:50000. They incorporate the mean low and mean high water line and the positions of the dune foot or toe of dyke, the border of supratidal salt marshes and foreland (colored maps in Fig. 4). Supplements to the maps document all used sources and deliver information on their reliability and accuracy. Some parts of the investigated areas in the southern coastal waters and in the north-western transitional waters are not covered by the coastal maps elaborated by HOMEIER (Fig. 4). By incorporating topographical charts by GERRITSEN (1952), respectively from 1859 (non-colored map in Fig. 4) and 1949, the topographical reconstructions of the states at 1860 and 1960 could be completed for the whole water body. For the states at 1650 and 1750 no reliable information was available to cover the areas outside of the maps elaborated by HOMEIER.
Fig. 4: Reconstruction of historical topography by HOMEIER (in color, maps No. 1, 2, 3 and 4 of the Historical Cartography of the Lower Saxon Coast; Ems-Dollard estuary, state at 1860, HOMEIER 1962) and the incorporated (non-colored) map of GERRITSEN (1952) with the
reconstructed historical topography of 1859.
Long-term Spatial Development of Habitats in the Ems-Dollard Estuary
Page 9
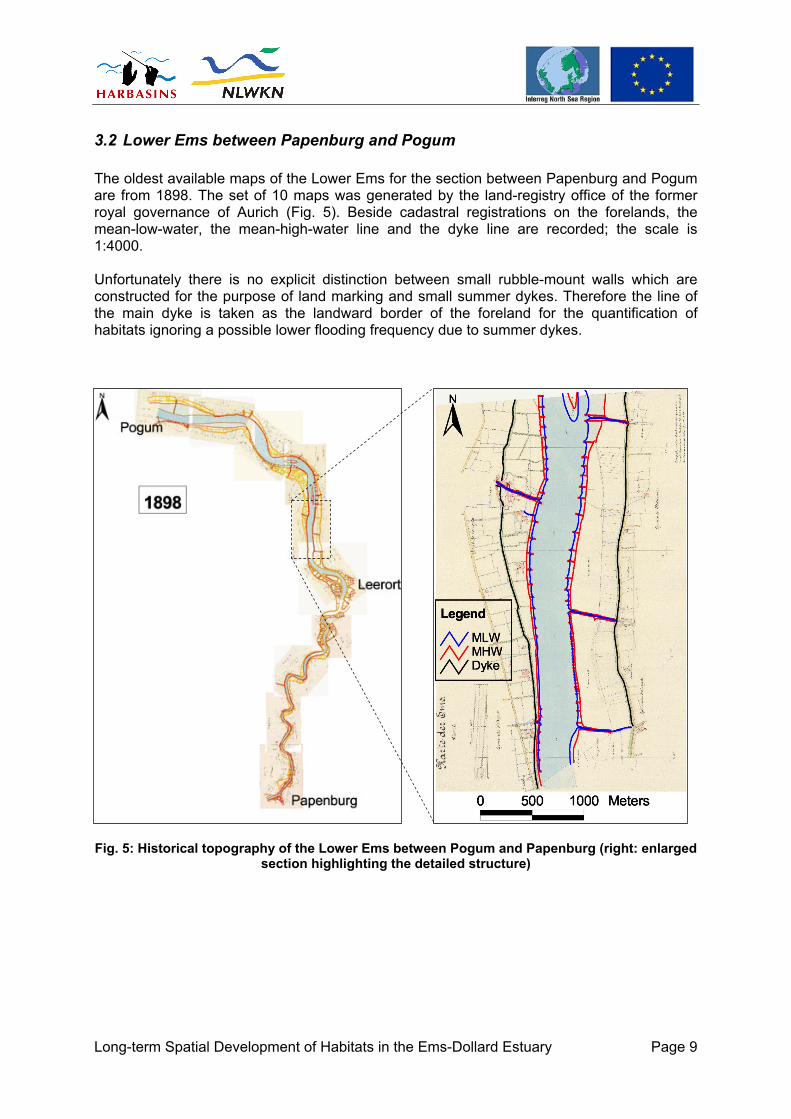
3.2 Lower Ems between Papenburg and Pogum The oldest available maps of the Lower Ems for the section between Papenburg and Pogum are from 1898. The set of 10 maps was generated by the land-registry office of the former royal governance of Aurich (Fig. 5). Beside cadastral registrations on the forelands, the mean-low-water, the mean-high-water line and the dyke line are recorded; the scale is 1:4000. Unfortunately there is no explicit distinction between small rubble-mount walls which are constructed for the purpose of land marking and small summer dykes. Therefore the line of the main dyke is taken as the landward border of the foreland for the quantification of habitats ignoring a possible lower flooding frequency due to summer dykes.
Fig. 5: Historical topography of the Lower Ems between Pogum and Papenburg (right: enlarged
section highlighting the detailed structure)

Long-term Spatial Development of Habitats in the Ems-Dollard Estuary
Page 10
4. Methodology Aim of the investigation is the comparison of habitat areas in the Ems-Dollard estuary at distinct states. The information on the physical terrain surface has to be transferred into a digital data structure allowing an analysis by application of a geographic information system (GIS). The historical charts provide data enabling to differentiate the surface areas between the MLW-line, the MHW-line and the dyke on one hand. On the other, actual input data contain additionally the surface heights allowing therefore a three dimensional visualization in a digital elevation model (DEM).
4.1 Processing of historical input data The information being contained in the historical maps of the area were available in a geographical information system (GIS) providing polygons for the position of the toe of the dyke, of the MLW- and of the MHW-line. They allow the separation of the following habitat areas (Fig. 6):
• Subtidal areas: levels below MLW, • Intertidal areas: levels between MLW and MHW,
• Supratidal areas: levels between MHW and toe of the dyke.
Fig. 6: Definition for the distinction of estuarine habitat areas
Long-term Spatial Development of Habitats in the Ems-Dollard Estuary
Page 11
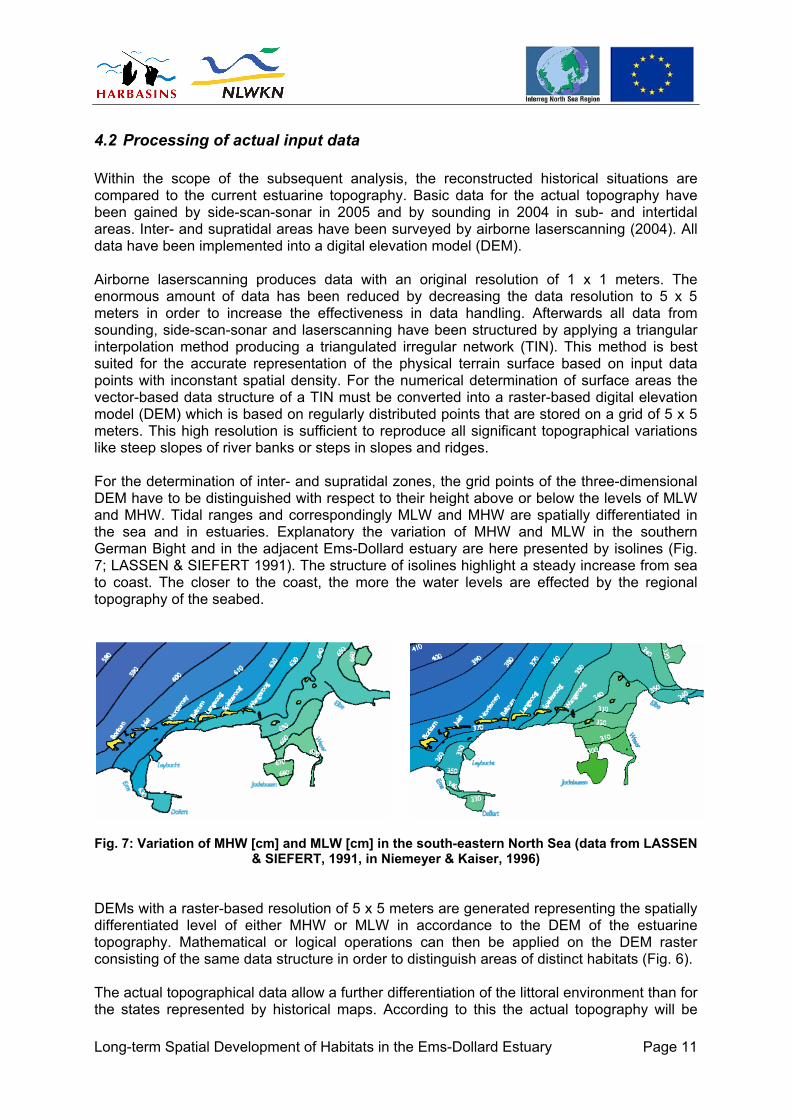
4.2 Processing of actual input data Within the scope of the subsequent analysis, the reconstructed historical situations are compared to the current estuarine topography. Basic data for the actual topography have been gained by side-scan-sonar in 2005 and by sounding in 2004 in sub- and intertidal areas. Inter- and supratidal areas have been surveyed by airborne laserscanning (2004). All data have been implemented into a digital elevation model (DEM). Airborne laserscanning produces data with an original resolution of 1 x 1 meters. The enormous amount of data has been reduced by decreasing the data resolution to 5 x 5 meters in order to increase the effectiveness in data handling. Afterwards all data from sounding, side-scan-sonar and laserscanning have been structured by applying a triangular interpolation method producing a triangulated irregular network (TIN). This method is best suited for the accurate representation of the physical terrain surface based on input data points with inconstant spatial density. For the numerical determination of surface areas the vector-based data structure of a TIN must be converted into a raster-based digital elevation model (DEM) which is based on regularly distributed points that are stored on a grid of 5 x 5 meters. This high resolution is sufficient to reproduce all significant topographical variations like steep slopes of river banks or steps in slopes and ridges. For the determination of inter- and supratidal zones, the grid points of the three-dimensional DEM have to be distinguished with respect to their height above or below the levels of MLW and MHW. Tidal ranges and correspondingly MLW and MHW are spatially differentiated in the sea and in estuaries. Explanatory the variation of MHW and MLW in the southern German Bight and in the adjacent Ems-Dollard estuary are here presented by isolines (Fig. 7; LASSEN & SIEFERT 1991). The structure of isolines highlight a steady increase from sea to coast. The closer to the coast, the more the water levels are effected by the regional topography of the seabed.
Fig. 7: Variation of MHW [cm] and MLW [cm] in the south-eastern North Sea (data from LASSEN
& SIEFERT, 1991, in Niemeyer & Kaiser, 1996) DEMs with a raster-based resolution of 5 x 5 meters are generated representing the spatially differentiated level of either MHW or MLW in accordance to the DEM of the estuarine topography. Mathematical or logical operations can then be applied on the DEM raster consisting of the same data structure in order to distinguish areas of distinct habitats (Fig. 6). The actual topographical data allow a further differentiation of the littoral environment than for the states represented by historical maps. According to this the actual topography will be
Long-term Spatial Development of Habitats in the Ems-Dollard Estuary
Page 12
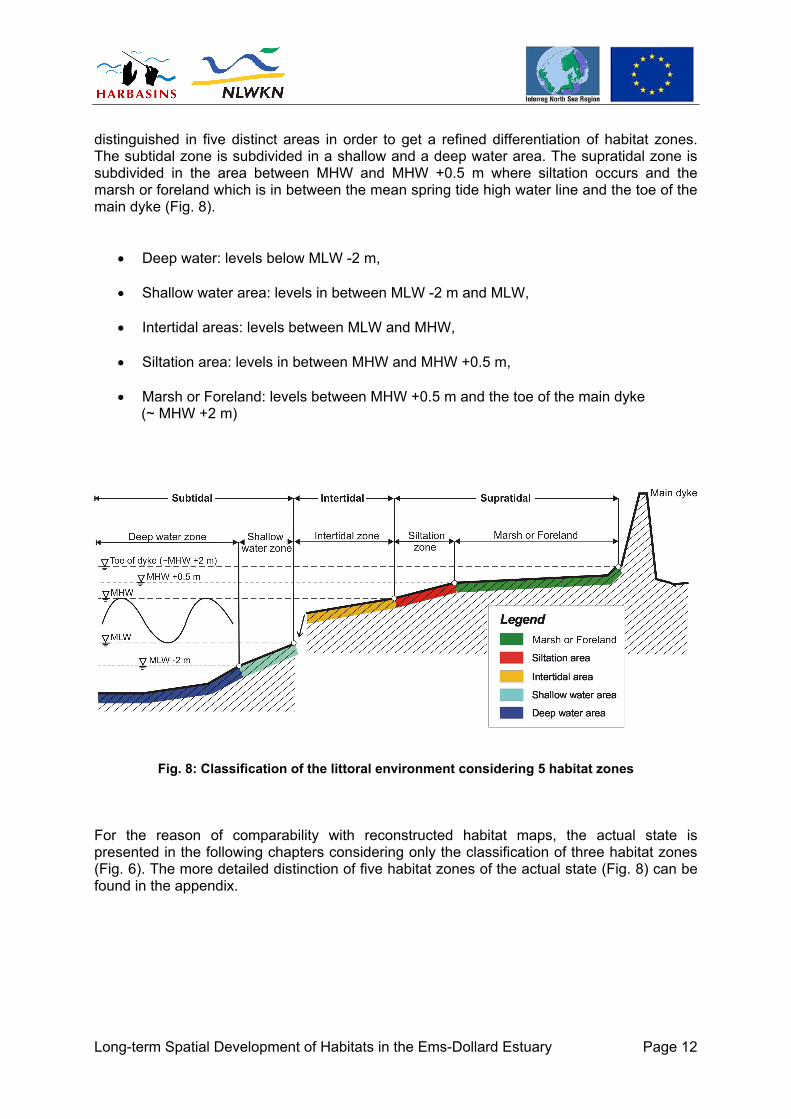
distinguished in five distinct areas in order to get a refined differentiation of habitat zones. The subtidal zone is subdivided in a shallow and a deep water area. The supratidal zone is subdivided in the area between MHW and MHW +0.5 m where siltation occurs and the marsh or foreland which is in between the mean spring tide high water line and the toe of the main dyke (Fig. 8).
• Deep water: levels below MLW -2 m, • Shallow water area: levels in between MLW -2 m and MLW,
• Intertidal areas: levels between MLW and MHW, • Siltation area: levels in between MHW and MHW +0.5 m,
• Marsh or Foreland: levels between MHW +0.5 m and the toe of the main dyke
(~ MHW +2 m)
Fig. 8: Classification of the littoral environment considering 5 habitat zones
For the reason of comparability with reconstructed habitat maps, the actual state is presented in the following chapters considering only the classification of three habitat zones (Fig. 6). The more detailed distinction of five habitat zones of the actual state (Fig. 8) can be found in the appendix.
Long-term Spatial Development of Habitats in the Ems-Dollard Estuary
Page 13
5. Development of the Ems-Dollard estuary and Lower Ems
5.1 Coastal waters of the Ems Dollard estuary
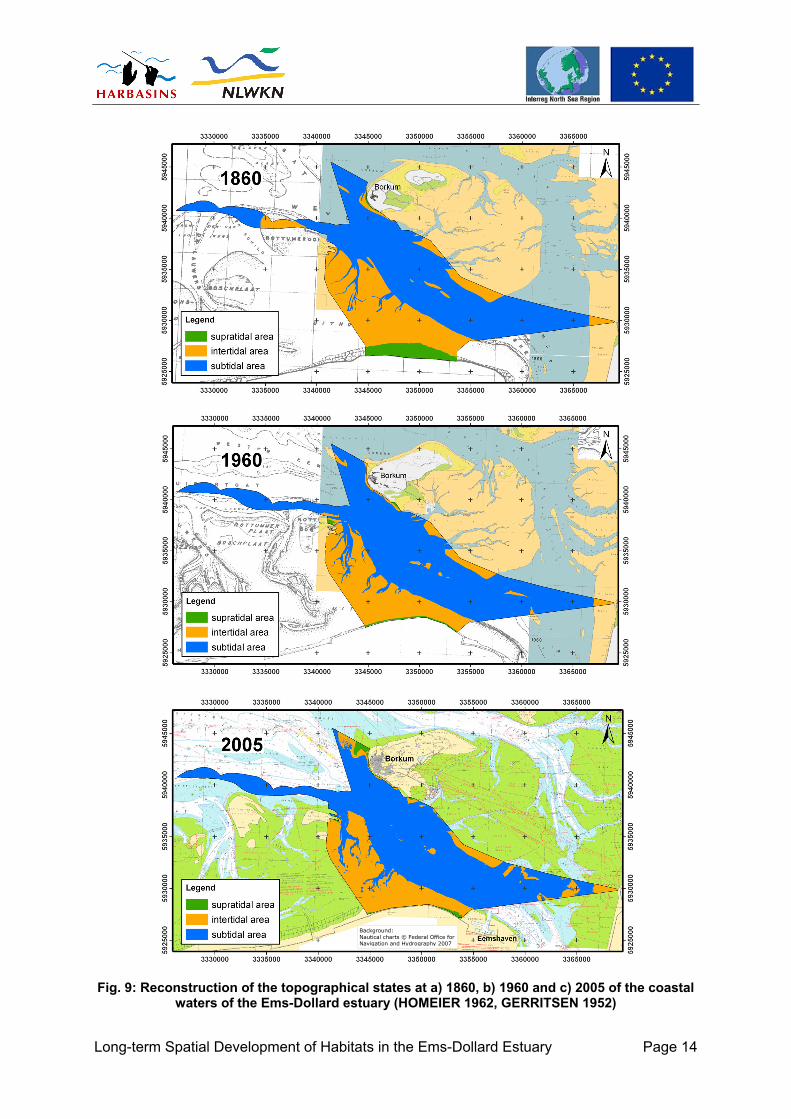
5.1.1 Development of the coastal waters of the Ems-Dollard estuary The location and boundaries of the coastal waters of the Ems-Dollard estuary are determined based on classification of water bodies due to the EC-WFD. The investigated water body covers the main part of the Wester Ems, a tidal inlet between the island Borkum and the Dutch coast, that can be considered nowadays as the mouth of the estuary (Fig. 1). The reconstructions of the topographical states at 1860, 1960 (HOMEIER 1962, GERRITSEN 1952) and 2005 allow the evaluation of long-term morphological changes in the coastal waters (Fig. 9a to 9c). The only anthropogenic impact on this coastal stretch was land reclamation. The coastal dyke was realigned seawards in the first decade of the 20th century (GERRITSEN, 1952). As a consequence, the supratidal foreland has been almost vanished. At Eemshaven, the outer estuary splits in the Wester and the Easter Ems, but nowadays the Easter Ems is no longer part of the estuarine mouth. The estuarine tidal volume exchanges through the Wester Ems whereas the inlet at eastward of Borkum only provides the water exchange of the eastern tidal flats (SCHUBERT 1970). The morphological situation of 1860 shows that the Easter Ems was much wider and deeper than today and accordingly had contributed to the tidal exchange with the Ems-Dollard estuary. From 1860 to 1960, the cross-sections of the Easter Ems had reduced significantly due to silting up, while the subtidal channel of the Wester Ems gained in width. The increase of subtidal areas was there compensated by a reduction of intertidal flats. Apart from the continuous relocation of smaller sand bars and shoals in the tidal inlet and the estuarine mouth, by 1960, a morphological equilibrium had been adopted and no significant developments of the main tidal channels have occurred since then. The only remarkable development between 1960 and today could be noticed westward of the island of Borkum. A significant sand bank had been formed at the northern, seaward bend of the tidal inlet. Nothwesterly of the island’s coastline a far stretched supratidal beach called Hohes Riff has been performed and remained.
Long-term Spatial Development of Habitats in the Ems-Dollard Estuary
Page 14
Fig. 9: Reconstruction of the topographical states at a) 1860, b) 1960 and c) 2005 of the coastal
waters of the Ems-Dollard estuary (HOMEIER 1962, GERRITSEN 1952)
Background: Nautical charts © Federal Office for Navigation and Hydrography 2007

Long-term Spatial Development of Habitats in the Ems-Dollard Estuary
Page 15
5.1.2 Spatial balance in the Coastal Waters of the Ems-Dollard estuary since 1860 The spatial balance of the surface areas is classified for sub-, inter- and supratidal habitats (Fig. 10). From 1860 to 1960, the subtidal areas increased by 9.1 km² (7%), while the intertidal flats decreased by 15.6 km² (21%). In the same period, the supratidal areas lost 8.5 km² (84%), which is almost equal to the surface area that was taken by land reclamations at the coastal stretch. Between 1960 and 2005, the overall sub- and intertidal surface areas did not change in size. Supratidal areas gained by some 0.3 km² (19%) within that period, as a consequence of the formation of the elevated sand in West of the island of Borkum. It has to be considered that the gain in supratidal areas is mostly due to sandy areas but not due to salt marshes.
132.4
73.4
10.1
141.5
57.8
1.6
141.3
57.7
1.90
40
80
120
160
Subtidal Intertidal Supratidal
Surf
ace
area
[km
²]
situation 1860
situation 1960
situation 2005
Fig. 10: Development of the surface area in the coastal waters of the Ems-Dollard estuary classified for sub-, inter- and supratidal habitats
Long-term Spatial Development of Habitats in the Ems-Dollard Estuary
Page 16
5.2 Transitional waters of the Ems-Dollard estuary
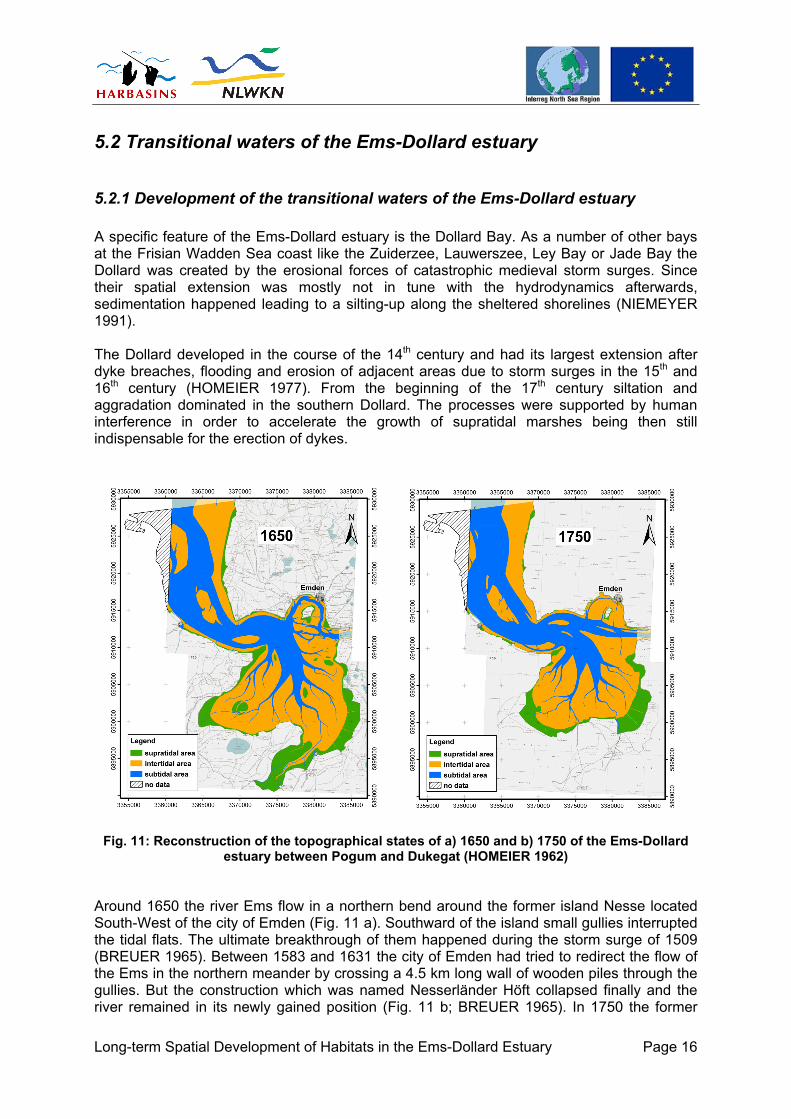
5.2.1 Development of the transitional waters of the Ems-Dollard estuary A specific feature of the Ems-Dollard estuary is the Dollard Bay. As a number of other bays at the Frisian Wadden Sea coast like the Zuiderzee, Lauwerszee, Ley Bay or Jade Bay the Dollard was created by the erosional forces of catastrophic medieval storm surges. Since their spatial extension was mostly not in tune with the hydrodynamics afterwards, sedimentation happened leading to a silting-up along the sheltered shorelines (NIEMEYER 1991). The Dollard developed in the course of the 14th century and had its largest extension after dyke breaches, flooding and erosion of adjacent areas due to storm surges in the 15th and 16th century (HOMEIER 1977). From the beginning of the 17th century siltation and aggradation dominated in the southern Dollard. The processes were supported by human interference in order to accelerate the growth of supratidal marshes being then still indispensable for the erection of dykes.
Fig. 11: Reconstruction of the topographical states of a) 1650 and b) 1750 of the Ems-Dollard estuary between Pogum and Dukegat (HOMEIER 1962)
Around 1650 the river Ems flow in a northern bend around the former island Nesse located South-West of the city of Emden (Fig. 11 a). Southward of the island small gullies interrupted the tidal flats. The ultimate breakthrough of them happened during the storm surge of 1509 (BREUER 1965). Between 1583 and 1631 the city of Emden had tried to redirect the flow of the Ems in the northern meander by crossing a 4.5 km long wall of wooden piles through the gullies. But the construction which was named Nesserländer Höft collapsed finally and the river remained in its newly gained position (Fig. 11 b; BREUER 1965). In 1750 the former

Long-term Spatial Development of Habitats in the Ems-Dollard Estuary
Page 17
river bed of the Ems performing the access to the harbour of Emden has degenerated to a small tidal gully (Fig. 11 b). Major difference of the situation in 1750 compared to 1650 is the decrease of the area being flooded at MHW in the Dollard of almost one third from about 155 km² to about 108 km² (HOMEIER 1979) due to silting-up and growth of supratidal marshes which enabled the coastal communities to reclaim the land by erecting dykes. The silting-up and growth of supratidal salt marshes led also to a reduction of the tidal prism which again was followed-up by a reduction of the channel cross-sections and a further seaward extension of the tidal flats in the Dollard. Most of the former parts of the Dollard Bay were reclaimed in its southwestern and –eastern part. The situation in 1860 highlights the ongoing siltation in the bight of Emden since 1750 which performed a barrier between the Ems river and the harbour. In 1848 a straight channel was built eastward of the island of Nesse connected to the deep river bed of the Ems. The new harbour entrance was closed off from tidal action and sedimentation by a lock.
Fig. 12: Reconstruction of the topographical states of a) 1860 and b) 1960 of the Ems-Dollard estuary between Pogum and Dukegat (HOMEIER 1962)
The silting-up and the growth of supratidal marshes continued also in the Dollard Bay accelerated by human interference by building land reclamation groynes and leading ultimately to further land reclamation. Again this process was accompanied by further reduction of the tidal prism and an extension of the tidal flats spread towards the center of the Dollard Bay (Fig. 12 a). Between 1860 and 1960 these processes decelerated since they had balanced towards a new morphodynamical equilibrium (Fig. 12 b). The last land reclamation at the Dollard Bay took place in 1924 (HOMEIER 1962). In 1860 the Ems estuary seaward of the Dollard Bay consisted of two channels: Ostfriesisches Gatje and Bucht von Watum being nearly equivalent with respect to their hydrodynamical capacity. In 1960 the channel Ostfriesisches Gatje took two third of the total

Long-term Spatial Development of Habitats in the Ems-Dollard Estuary
Page 18
tidal prism passing during ebb and flood (SCHUBERT 1970). This change has been driven by human interference, particularly by deepening and streamlining the navigational waterway (SCHUBERT 1970). In order to improve the waterway in the Ems river between 1870 and 1890 several groynes and a training wall were constructed on the tidal shallow Geise which separates the Dollard Bay from the Ems river in order to strengthen the flow dynamics and hence stabilize the morphodynamics in the navigational channel. The training wall was lengthened in the beginning of the 1930s. In the shelter of the headland Knock in the upstream located Bay of Wybelsum ongoing sedimentation created supratidal salt marshes which were impoldered between 1912 and 1922 by the construction of a straight dyke built in between Knock and Borsum alongside the Emden waterway. Within the period between 1930 and 1935 the reach of the Emden waterway at the Knock was dredged and stabilized by a bended training wall. Afterward maintenance dredging has been performed in the waterway to maintain the depth of 7.0 meters below mean low spring tide (SKN) and capital dredging after 1953 in order to deepen the Emden waterway to a depth of 8.5 meters below SKN. The present state of the Ems-Dollard estuary (Fig. 13) does not differ significantly from that in 1960. The major difference is the reduction of the channel Bocht van Watum due to rapid sedimentation. There has been no land reclamation and the supratidal marshes are preserved with respect to nature conservation and as a natural toe protection of the dykes.
Fig. 13: Present state of the Ems-Dollard estuary between Dukegat and Pogum (2005)
Background: DTK 1000 © Federal Office for Carthography and Geodesy 2002
Long-term Spatial Development of Habitats in the Ems-Dollard Estuary
Page 19
5.2.2 Spatial balance in the transitional Waters of the Ems-Dollard estuary since 1650
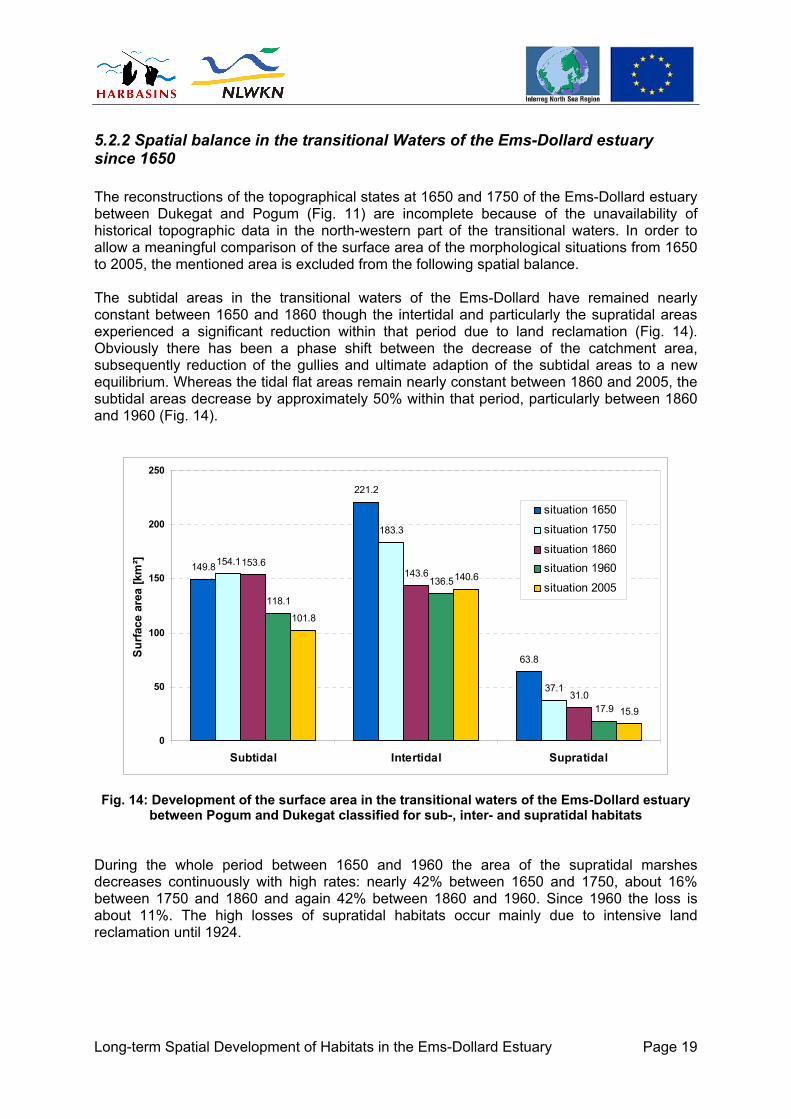
The reconstructions of the topographical states at 1650 and 1750 of the Ems-Dollard estuary between Dukegat and Pogum (Fig. 11) are incomplete because of the unavailability of historical topographic data in the north-western part of the transitional waters. In order to allow a meaningful comparison of the surface area of the morphological situations from 1650 to 2005, the mentioned area is excluded from the following spatial balance. The subtidal areas in the transitional waters of the Ems-Dollard have remained nearly constant between 1650 and 1860 though the intertidal and particularly the supratidal areas experienced a significant reduction within that period due to land reclamation (Fig. 14). Obviously there has been a phase shift between the decrease of the catchment area, subsequently reduction of the gullies and ultimate adaption of the subtidal areas to a new equilibrium. Whereas the tidal flat areas remain nearly constant between 1860 and 2005, the subtidal areas decrease by approximately 50% within that period, particularly between 1860 and 1960 (Fig. 14).
149.8
221.2
63.8
154.1
183.3
37.1
153.6143.6
31.0
118.1
136.5
17.9
101.8
140.6
15.9
0
50
100
150
200
250
Subtidal Intertidal Supratidal
Surfa
ce a
rea
[km
²]
situation 1650
situation 1750
situation 1860situation 1960
situation 2005
Fig. 14: Development of the surface area in the transitional waters of the Ems-Dollard estuary between Pogum and Dukegat classified for sub-, inter- and supratidal habitats
During the whole period between 1650 and 1960 the area of the supratidal marshes decreases continuously with high rates: nearly 42% between 1650 and 1750, about 16% between 1750 and 1860 and again 42% between 1860 and 1960. Since 1960 the loss is about 11%. The high losses of supratidal habitats occur mainly due to intensive land reclamation until 1924.

Long-term Spatial Development of Habitats in the Ems-Dollard Estuary
Page 20
5.3 Lower Ems between Pogum and Papenburg
5.3.1 Development of the Lower Ems between Pogum and Papenburg Since the beginning of the 20th century the Lower Ems experienced considerable impacts changing its natural regime. Aims of that human interference were improvement of navigability, providence of protection against storm surges and enhancing agricultural conditions.
Fig. 15: Habitats along the Lower Ems between Pogum and Papenburg at a) 1898 and b) 2005
Weener Weener
Coldam Coldam
Pottdeich
Mark Mark
Pottdeich
Gandersum
Storm surge barrier
Long-term Spatial Development of Habitats in the Ems-Dollard Estuary
Page 21
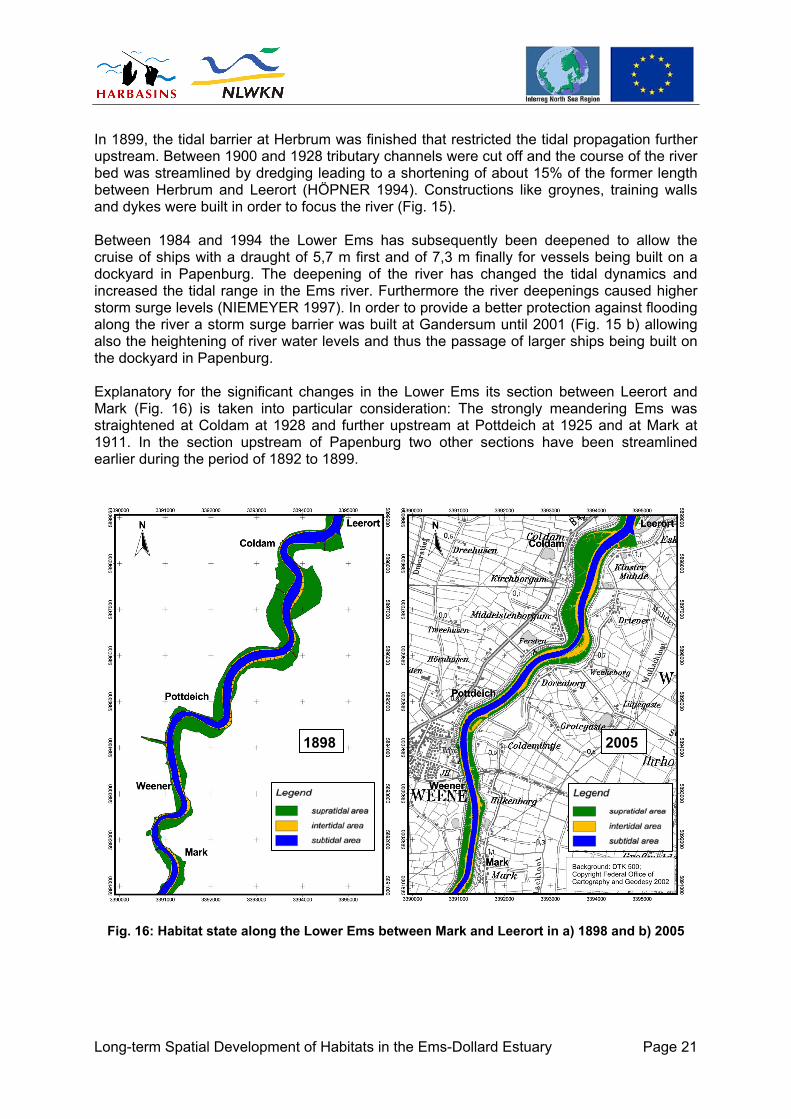
In 1899, the tidal barrier at Herbrum was finished that restricted the tidal propagation further upstream. Between 1900 and 1928 tributary channels were cut off and the course of the river bed was streamlined by dredging leading to a shortening of about 15% of the former length between Herbrum and Leerort (HÖPNER 1994). Constructions like groynes, training walls and dykes were built in order to focus the river (Fig. 15). Between 1984 and 1994 the Lower Ems has subsequently been deepened to allow the cruise of ships with a draught of 5,7 m first and of 7,3 m finally for vessels being built on a dockyard in Papenburg. The deepening of the river has changed the tidal dynamics and increased the tidal range in the Ems river. Furthermore the river deepenings caused higher storm surge levels (NIEMEYER 1997). In order to provide a better protection against flooding along the river a storm surge barrier was built at Gandersum until 2001 (Fig. 15 b) allowing also the heightening of river water levels and thus the passage of larger ships being built on the dockyard in Papenburg. Explanatory for the significant changes in the Lower Ems its section between Leerort and Mark (Fig. 16) is taken into particular consideration: The strongly meandering Ems was straightened at Coldam at 1928 and further upstream at Pottdeich at 1925 and at Mark at 1911. In the section upstream of Papenburg two other sections have been streamlined earlier during the period of 1892 to 1899.
Fig. 16: Habitat state along the Lower Ems between Mark and Leerort in a) 1898 and b) 2005
1898 2005

Long-term Spatial Development of Habitats in the Ems-Dollard Estuary
Page 22
5.3.2 Spatial balance in the Lower Ems between Pogum and Papenburg Though the river has been shortened by approximately 15% the reduction of the subtidal area is only about 10%, whereas the tidal flats have been reduced by more than 15% and the supratidal marshes by nearly 15% (Fig. 17). These figures make evident that a major aim of human interferences has been achieved: the tidal volume is nowadays more focused on the waterway than on the other river habitats. It has to be considered that the reduction of supratidal marshes is partly also caused by land reclamation.
11.72
5.10
12.75
10.76
4.28
11.07
0
2
4
6
8
10
12
14
Subtidal Intertidal Supratidal
Surfa
ce a
rea
[km
²]
situation 1898
situation 2005
Fig. 17: Development of the surface area in the Lower Ems between Papenburg and Pogum classified for sub-, inter- and supratidal habitats
Long-term Spatial Development of Habitats in the Ems-Dollard Estuary
Page 23
6. Summary The Ems-Dollard estuary has experienced a dramatic change of its shape by both natural processes and human interference. Medieval storm surges caused enormous coastal retreat which was reclaimed by coastal inhabitants in the course of the last centuries. The subsequent deepening and streamlining of the Lower Ems created long-term morphodynamical processes being still of importance. The coastal waters of the Ems-Dollard estuary experienced no significant impacts in the period between 1860 and today. The natural adaption of the morphodynamics in the mouth of the estuary to a new equilibrium led to an increase of the subtidal area of 9 km² and a decrease of the intertidal flats of 16 km². In the same period, the supratidal foreland lost about 8 km² as a result of land reclamation. Considering the transitional waters of the Ems-Dollard estuary from their seaward limit close to Eemshaven in the outer estuary up to Pogum where the Lower Ems discharges into the Dollard Bay, the total littoral surface area has decreased from 435 km² to 268 km² in the period from 1650 until today. Both, sub- and intertidal habitats diminished by 32%, while supratidal marsh and forelands lost 75% of their original extension. The main reduction of the tidal inlets and channels took place between 1860 and 2005 whereas the tidal flats lost most of their area between 1650 and 1860. Supratidal habitats such as salt marshes and forelands retreated almost gradually from 1650 up to the present. The habitat development of the Lower Ems from Pogum as far upstream as Papenburg is assessed on the basis of topographical changes from 1898 to 2005. The total area in the Lower Ems reduced from 30 km² to 26 km² mainly due to the shortening of the river of about 15% by cutting meandering arms. The reduction of 15% is found also for the sub- and intertidal habitats while supratidal areas lost additional 5% due to the dyking of marshes and forelands. Human impacts in the Lower Ems enforced a concentration of the tidal prism on the narrowed and deepened waterway leading to a significant amplification of the tidal range. This first approach quantified the long-term spatial changes in distinct estuarine habitats and highlighted the areas of human interference by comparing historical with actual topographies. In a second step, hydro-morphodynamical modeling will be applied in order to evaluate criteria for the appropriate identification of heavily modified water bodies (HMWB). A similar report on the Weser estuary (D) is available. Additional investigations on morphodynamical pressures will be carried out for the estuaries of the Humber (UK) and the Scheldt (B/NL) depending on the availability of data.

Long-term Spatial Development of Habitats in the Ems-Dollard Estuary
Page 24
Literature Breuer, H. (1965): Dollart und Ems. Die Folgen der Dollartbildung für das Gebiet der unteren
Ems, Jahrbuch zu Emden, 45. Band, Ostfriesische Landschaft Aurich De Jong, F., Bakker, J.F., van Berkel, C.J.M., Dankers, N.M.J.A., Dahl, K., Gätje, C., Marencic, H. & Potel, P. (1999): Wadden Sea Quality Status Report. Common Wadden
Sea Secretariat Wilhelmshaven, Wadden Sea Ecosystem No. 9: 175-186 Gerritsen, F. (1952): Historisch hydrografisch onderzoek Eems. Report. Hoorn,
Rijkswaterstaat. pp. 28 Homeier, H. (1962): Historisches Kartenwerk 1:50 000 der niedersächsischen Küste,
Jahresbericht der Forschungsstelle Küste, Band XIII Homeier, H. (1977): Einbruch und weitere Entwicklung des Dollart bis um 1600, Jahrbuch
1976, Forschungsstelle Küste, Bd. 28, Norderney, 1977 Homeier, H. (1979): Beiheft zu Karte Nr. 2, Historisches Kartenwerk 1:50 000 der
niedersächsischen Küste, Forschungsstelle Küste Höpner, T. (1994): Auswirkungen der Ästuarvertiefung in der Emsmündung. In: LOZAN, J.,
RACHOR, E., REISE, K., VON WESTERNHAGEN, H., LENZ, W., Hrsg., Warnsignale aus dem Wattenmeer. Blackwell-Wiss. Verlag Berlin, 171-175.
Jonge, V.N. de, (2000): Importance of spatial and temporal scales in applying biological and physical process knowledge in coastal management, an example for the Ems estuary. Continental Shelf Research, 20, pp. 1655-1686.
Lassen, H. & Siefert, W. (1991): Mittlere Tidewasserstände in der südöstlichen Nordsee – säkularer Trend und Verhältnisse um 1980, Die Küste, Heft 52
Niemeyer, H.D. (1991): Case study Ley Bay: an alternative to traditional enclosure. Proc. 3rd Conf. Coast. & Port. Eng. i. Devel. Countr. Mombasa/ Kenya
Niemeyer, H.D. & Kaiser, R. (1996): Mittlere Tidewasserstände, Umweltaltas Wattenmeer-Band 2 - Wattenmeer zwischen Elb- und Emsmündung
Niemeyer, H.D. (1997): Überprüfung der Bestickhöhen von Deichstrecken an der Unterems, Arbeiten aus der Forschungsstelle Küste Nr. 13
Schubert, K. (1970): Ems und Jade, Die Küste, Heft 19.
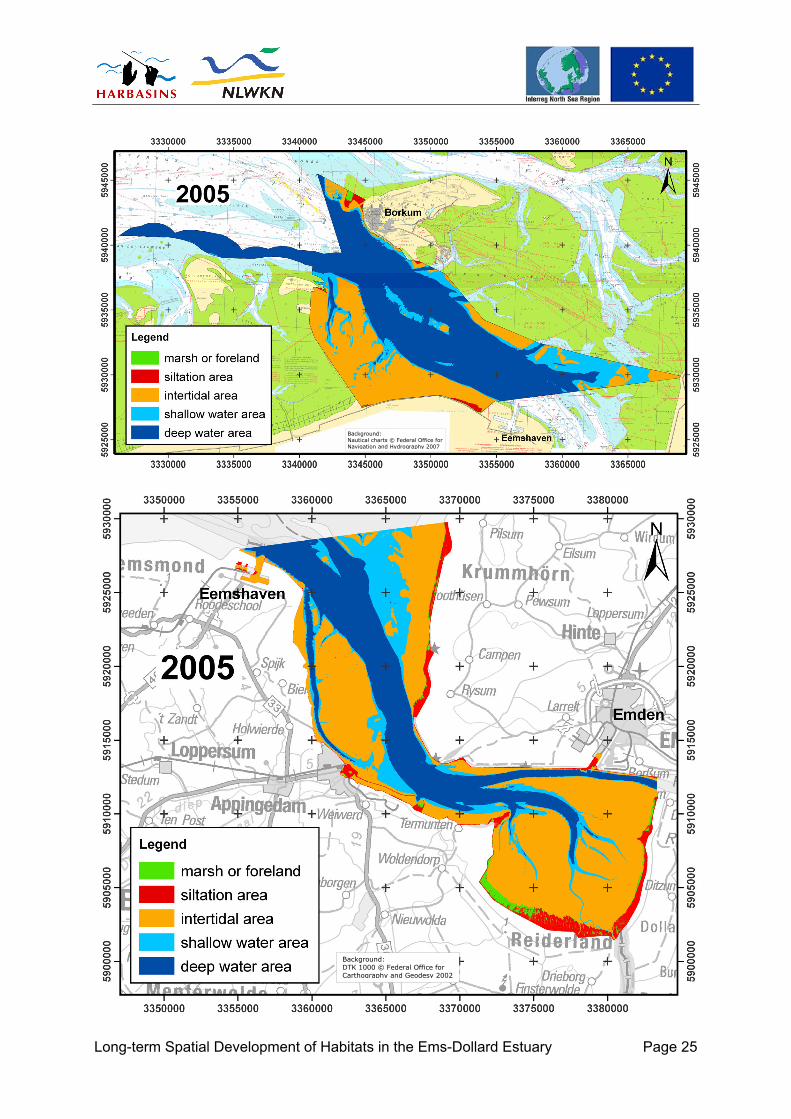
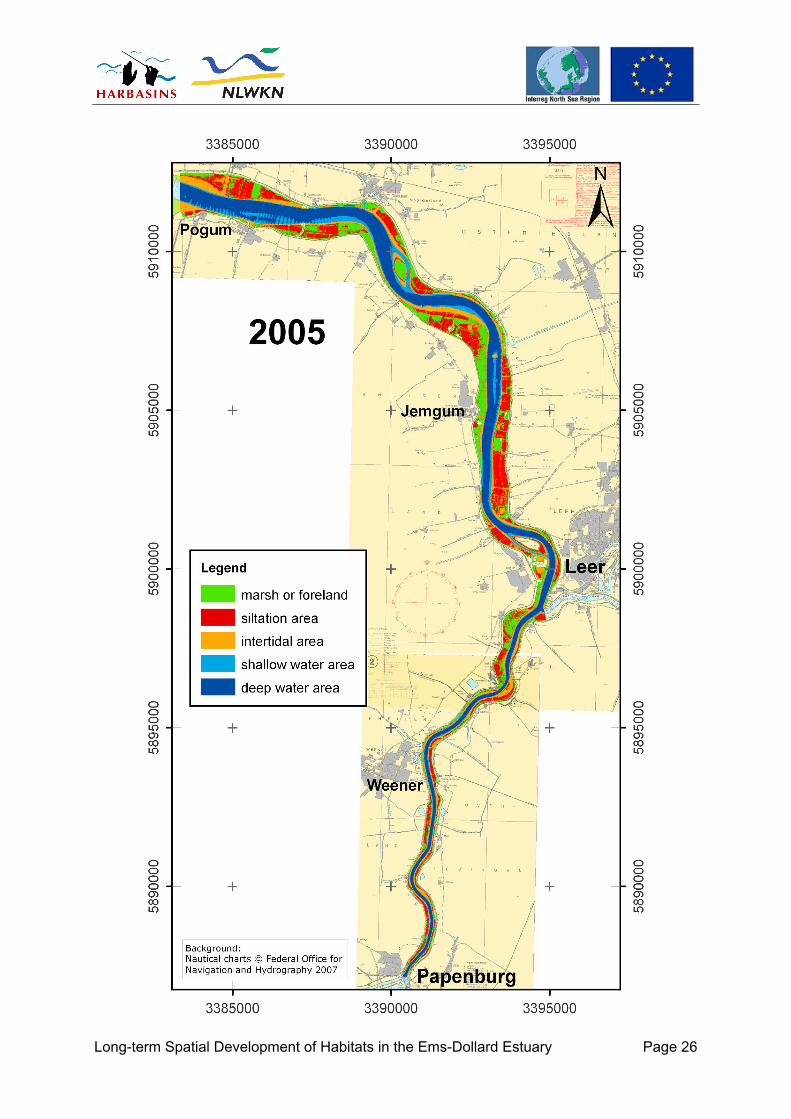
Appendix Appendix 1: Overview of the coastal waters in 2005 with the classification of 5 habitat zones......................................................................................................................................25 Appendix 2: Overview of the transitional waters in 2005 with the classification of 5 habitat zones...................................................................................................................................…25 Appendix 3: Overview of the Lower Ems between Pogum and Papenburg in 2005 with the classification of 5 habitat zones...........................................................................................…26
Long-term Spatial Development of Habitats in the Ems-Dollard Estuary
Page 25
Background: DTK 1000 © Federal Office for Carthography and Geodesy 2002
Background: Nautical charts © Federal Office for Navigation and Hydrography 2007
Long-term Spatial Development of Habitats in the Ems-Dollard Estuary
Page 26


![Transcription factor Egr-1 is required for long-term fear ... · long term spatial memory [42]. A role for Egr-1 in the amygdala has been reported in the acquisition [43] or recall](https://static.fdocuments.us/doc/165x107/5f05dd8e7e708231d4151a1d/transcription-factor-egr-1-is-required-for-long-term-fear-long-term-spatial.jpg)