Hant and Soil 87,375-391 (1985). Ms. 6100 9 1985 Martinus ...Hant and Soil 87,375-391 (1985). Ms....
17
Hant and Soil 87,375-391 (1985). Ms. 6100 1985 Martinus NifhoffPublishers, Dordrecht. Printed in the Netherlands. Nitrogen status of cotton subjected to two short term periods of waterlogging of varying severity using a sloping plot water-table facility P. J. HOCKING*, D. C. REICOSKY** and W. S. MEYER CS1RO, Centre for Irrigation Research, Private Mail Bag, Griffith, N,S. W. 2680, Australia Received 19 September 1984. Revised February 1985 Key words Cotton Nitrate Nitrate reductase Nitrogen Waterlogging Xylem exudate Summary Cotton is reported to be susceptible to waterlogging, and there is evidence that some of the symptoms shown by waterlogged plants are due to impaired uptake of nitrogen. To investigate this for cotton, the nitrogen nutrition of a field-grown crop was monitored when the plants were subjected to two short term periods of waterlogg~ng of varying severity using a sloping plot water-table facility. Growth of severely waterlogged cotton decreased after 4 days in the first and second floodings, and these plants were wilted by the end of the first flooding but not the second. Waterlogging resulted in decreased concentrations of total-N and especially NO~-N in the petiole and lamina of the youngest fully-expanded leaf. Uptake of N by water- logged plants occurred, but was not as great as for well-aerated plants. The nitrate reductase activity of leaves was much lower in waterlogged plants. Stumps of detopped waterlogged plants did not exude xylem sap at the end of the first flooding, suggesting impaired solute uptake due to damaged roots. However, xylem exudate was obtained from stumps of water- logged plants at the end of the second flooding, indicating adaptive changes to the root systems of these plants. Although cotton is reported to reduce little NO~-N in its roots, analysis of xylem exudate showed that about half of the N exported by roots was as amino compounds. The concentration of amino compounds in xylem exudate from severely waterlogged plants was higher than in well-aerated plants. It was concluded that the growth reduction in water- logged cotton was due partly to induced N-deficiency. Introduction Most cotton crops in Australia are grown under flood irrigation on fine-textured heavy soils with low saturated hydraulic conduc- tivity 14. This may result in periods when the crop is waterlogged, especially if rainfall occurs soon after irrigation. Brief waterlogging can damage roots 24, and greatly reduce yields 9'39. Characteristic symptoms of waterlogging are growth cessation, leaf epinasty and senescence, and the formation of adventitious roots 17,~~ . However, the physiological mechanisms which bring about these symptoms are poorly understood. Physiological events which may occur during waterlogging include the accumulation of proline in shoots 1 , the * Present address: CSIRO, Division of Plant Industry, GPO Box 1600, Canberra, ACT 2601, Australia ** Visiting Scientist: Present address: USDA-ARS, North Central Soil Conservation Research Center, Morris, MN 56267, USA 375
Transcript of Hant and Soil 87,375-391 (1985). Ms. 6100 9 1985 Martinus ...Hant and Soil 87,375-391 (1985). Ms....
Hant and Soil 87 ,375 -391 (1985). Ms. 6100 �9 1985 Martinus NifhoffPublishers, Dordrecht. Printed in the Netherlands.
Nitrogen status o f c o t t o n subjected to t w o short term periods o f waterlogging o f varying severity using a s loping plot water-table facil ity
P. J. HOCKING*, D. C. REICOSKY** and W. S. MEYER CS1RO, Centre for Irrigation Research, Private Mail Bag, Griffith, N,S. W. 2680, Australia
Received 19 September 1984. Revised February 1985
Key words Cotton Nitrate Nitrate reductase Nitrogen Waterlogging Xylem exudate
Summary Cotton is reported to be susceptible to waterlogging, and there is evidence that some of the symptoms shown by waterlogged plants are due to impaired uptake of nitrogen. To investigate this for cotton, the nitrogen nutrition of a field-grown crop was monitored when the plants were subjected to two short term periods of waterlogg~ng of varying severity using a sloping plot water-table facility. Growth of severely waterlogged cotton decreased after 4 days in the first and second floodings, and these plants were wilted by the end of the first flooding but not the second. Waterlogging resulted in decreased concentrations of total-N and especially NO~-N in the petiole and lamina of the youngest fully-expanded leaf. Uptake of N by water- logged plants occurred, but was not as great as for well-aerated plants. The nitrate reductase activity of leaves was much lower in waterlogged plants. Stumps of detopped waterlogged plants did not exude xylem sap at the end of the first flooding, suggesting impaired solute uptake due to damaged roots. However, xylem exudate was obtained from stumps of water- logged plants at the end of the second flooding, indicating adaptive changes to the root systems of these plants. Although cotton is reported to reduce little NO~-N in its roots, analysis of xylem exudate showed that about half of the N exported by roots was as amino compounds. The concentration of amino compounds in xylem exudate from severely waterlogged plants was higher than in well-aerated plants. It was concluded that the growth reduction in water- logged cotton was due partly to induced N-deficiency.
Introduction
Most cotton crops in Australia are grown under flood irrigation on fine-textured heavy soils with low saturated hydraulic conduc- tivity 14. This may result in periods when the crop is waterlogged, especially if rainfall occurs soon after irrigation. Brief waterlogging can damage roots 24, and greatly reduce yields 9'39. Characteristic symptoms of waterlogging are growth cessation, leaf epinasty and senescence, and the formation of adventitious roots 17,~~ . However, the physiological mechanisms which bring about these symptoms are poorly understood. Physiological events which may occur during waterlogging include the accumulation of proline in shoots 1 , the
* Present address: CSIRO, Division of Plant Industry, GPO Box 1600, Canberra, ACT 2601, Australia ** Visiting Scientist: Present address: USDA-ARS, North Central Soil Conservation Research Center, Morris, MN 56267, USA
375
376 HOCKING, REICOSKY AND MEYER
production of abscissic acid and ethylene 34, decreased cytokinin synthesis in roots, and impaired uptake and metabolism of key nu- trients such as nitrogen and phosphorus 6, 7,22,23,37,38
Cotton is susceptible to waterlogging or excessive irrigation s' 13,14,16, and its growth and tissue levels of N are reduced by a high static water- table 26. This paper reports on the nitrogen nutrition of cotton sub- jected to two short term periods of waterlogging of varying severity using a sloping plot water-table facility.
Materials and me thods
Water-table facility The sloping plot facility used to obtain a variable water-table depth, and the establ ishment
of the co t ton crop have been described previously 3~ Briefly, the facility was a sloping plot 45 m long by 5 m wide const ructed on Hanwood Clay Loam SoiP s at the CSIRO Centre for Irrigation Research, Griffith, central western N.S.W., in which a gradient o f water-table depth was established by excavating a t rench to a slope of 1.78%. The t rench was lined with im- pervious fabric and the original soil was repacked giving 0.2 m of top soil and 0.4 m of subsoil with a uniform rooting depth of 0.6 m. The repacked soil overlay a giavel layer 0.15 m thick which facilitated movemen t of water during flooding or draining. Water entered the sloping plot th rough a slotted PVC pipe embedded in the gravel layer during flooding, and a float valve mainta ined the water level. At the end o f the flooding, water was drained from the sloping plot by pumping from the gravel layer.
Six posit ions were selected for plant sampling at 3, 9, 15, 21, 27 and 43 m along the t rench to provide water-table depths of + 0.04, - 0.05, - 0.17, - 0.27, - 0.38 and - 0.60 m with respect to the soil surface. Plants growing where the water-table was 0.60 m below the surface were regarded as unstressed, and those growing where the water-table was 0.04 m above the soil were regarded as the plants stressed mos t severely. The first flooding lasted 8 days from 17 to 24 January, 1983, when the plants were 0.6 m high with a closed canopy and had just started flowering. The second flooding lasted 16 days from 7 to 23 March, 1983 when the plants were about 1 m high and had developing bolls.
Plant material Cot ton (Gossypium hirsutum L. cv. Deltapine 61) was sown on 26 October, 1982 in rows
0.25 m apart. Prior to sowing, fertilizer was incorporated at 130 and 100 kg ha -t for N (urea) and P (P2Os), respectively. Seedlings were th inned to 19 plants m -2 two weeks after emer- gence. Weeds were controlled by herbicides or hand hoeing, and insect pests and mites were controlled chemically. Plants in the sloping plot were kept well watered by irrigation with an overhead sprinkler sys tem.
A control area 45 m long and 5 m wide was established adjacent to the water-table facility. The soil and plants in this area were treated in the same manner as in the sloping, plot, except that half o f the control area received no nitrogen to assess crop response to the applied N. The control area which received N is designated high-N control and that which received no N is designated low-N control. A top dressing of 75 kg N ha -1 as urea was applied to the sloping plot to assist plant recovery after the first flooding, and to the high-N control plants.
Harvest of plant material The day before bo th floodings began and at the end of each period of waterlogging, 6
representative plants were cut at soil level from a zone 1.5 m either side of each water-table depth for tissue analysis. Leaf laminae were separated from stems and petioles, and bolls were also kept separate at the end of the second flooding. To hasten matur i ty at the end of the growing season, plants were defoliated with a dessicant, and yield was determined on
NITROGEN NUTRITION OF WATERLOGGED COTTON 377
25 May 1983 for each water-table depth and the controls from 10 representative areas of 1 m s . Mature bolls were separated into lint plus seeds and rest of boll.
The concentration of nitrate in the petiole of the youngest full-expanded leaf was used as an indicator of the N status of cotton 2s . Beginning the day before each flooding, two representa- tive samples each of 12 youngest fully-expanded leaves were collected from the main axes of plants at each water-table depth along the sloping plot and the controls, and separated into laminae and petioles. These samples were taken daily during the first flooding, and at intervals of 2 oi 3 days in the second. All tissue samples were collected between 11.00 and 12.00h Australian Eastern Time to minimise possible diurnal effects.
Collection of root exudate Root functioning was assessed by measuring the rate of xylem exudation and N content
of xylem sap from stem stumps. At the end of the first flooding, and at the beginning and end of the second, three representative plants of similar size from each water-table depth and the controls were cut off 2cm above soil level and xylem sap collected from l l . 0 0 h to 13.00h into plastic tubing fitted over the stumps. Sap from plants at each locality was transferred into pre-weighed plastic vials.
A naly tieal procedures Plant parts were dried at 80~ and milled to pass a 20 mesh (0.84 mm) screen. Subsamples
(250 rag) of plant material were digested by a Kjeldahl method with 0.5% Se as catalyst and salicylic acid to reduce nitrate-N (NO~-N) 8 . Concentrations of total-N were determined from the diluted digests with an autoanalyser using the indophenol blue method. Nitrate-N was extracted from 100 mg subsamples of plant tissue with 2M KCI, and determined on the auto- analyser ~2 . Nitrate-N in xylem sap was determined by ion chromatography. Total amino-N in xylem sap was determined colorimetrically 4~ .
Assay of nitrate reductase For assay of nitrate reductase, ~wo samples each of 15 leaves were collected and placed
onto ice at midday on the last day of the first flooding from plants at water-table depths of +0.04, --0.17 and - -0 .60m, and transported to the laboratory within 15 minutes. An in vivo procedure was used, in which leaf laminae were finely chopped in a cold room at 3~ and weighed subsamples transferred to flasks containing 12ml of 30mM KNO3, 20ml of 100 mM phosphate buffer (pH 7.5) and 0.4 ml of 0.13 M 1-propanol (1% v/v) which had been bubbled for 5 min with N 2 to remove air. One set of flasks had the KNO 3 replaced with dis- tilled H20 so that enzyme activity relied on nitrate present in the leaf tissue. The flasks were evacuated three times on ice to facilitate infiltration of the incubation mixture into leaf tissue, and the vacuum released under N~. The flasks were stoppered with suba seals and transferred to a water bath at 30~ At intervals of 10 min, 1 ml aliquots were withdrawn with a syringe and assayed for NO~-N 19 . Each value reported is the mean of two assays. The remainder of the leaf blade material and all petioles were assayed for total-N and NO~-N as described above.
Results
Plan t grow th Waterlogged plants did not change in appearance during the initial
four days of the first flooding, but on day 5 leaves of plants from the four wettest treatments had a greyish-green appearance. By day 7 some plants from these treatments had wilted, and by day 8 about 80% of these plants had wilted. Leaf growth was the same for all treatments until 4 days after the flooding began, then decreased in the four wettest treatments 3~ . Watterlogged plants had recovered by the time the second
3 7 8 H O C K I N G , R E I C O S K Y A N D M E Y E R
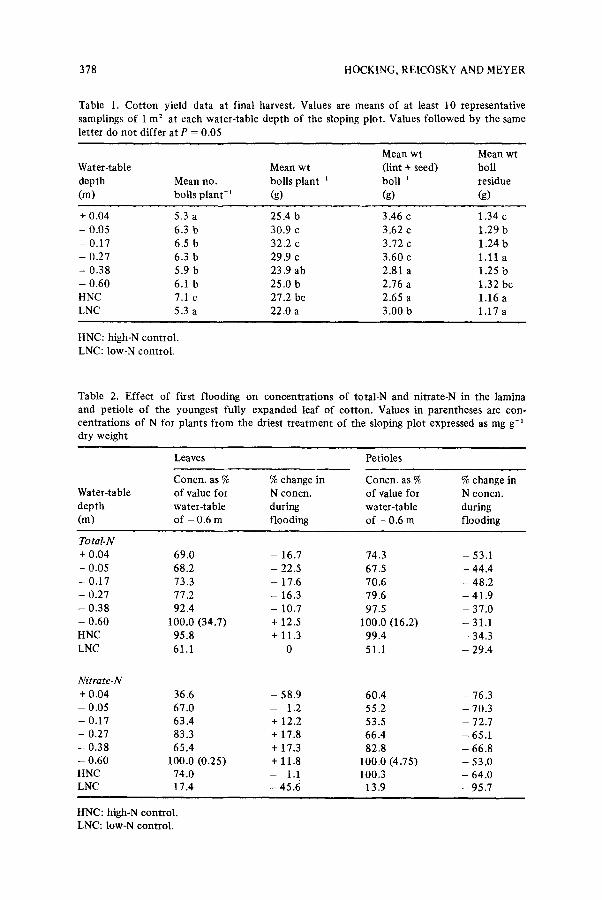
Tab le 1. C o t t o n y i e ld d a t a a t f i na l ha rves t . V a l u e s are m e a n s o f a t l eas t 10 r e p r e s e n t a t i v e
s a m p l i n g s o f 1 m 2 a t e a c h w a t e r - t a b l e d e p t h o f t h e s lop ing p l o t . V a l u e s f o l l o w e d b y t h e s ame
le t t e r d o n o t d i f f e r a t P = 0 . 0 5
M e a n w t M e a n w t
W a t e r - t a b l e M e a n w t ( l int + seed) bo l l
d e p t h M e a n n o , bo l l s p l a n t - t b o l l - 1 r e s i due
( m ) bo l l s p l a n t - t (g) (g) (g)
+ 0 . 0 4 5 ,3 a 2 5 . 4 b 3 .46 c 1 . 3 4 c
- 0 , 0 5 6 .3 b 30 ,9 c 3 . 6 2 c 1 .29 b
- 0 . 1 7 6 .5 b 3 2 . 2 c 3 . 7 2 e 1 ,24 b
- 0 . 2 7 6 .3 b 29 .9 c 3 . 6 0 c 1 .11 a
- 0 . 3 8 5 .9 b 23 .9 a b 2 .81 a 1 .25 b
- 0 . 6 0 6.1 b 2 5 . 0 b 2 .76 a 1 .32 b c
H N C 7.1 c 27 .2 b c 2 .65 a 1 .16 a
L N C 5.3 a 2 2 . 0 a 3 . 0 0 b 1 .17 a
H N C : h igh -N c o n t r o l .
L N C : l o w - N c o n t r o l .
T a b l e 2. E f f e c t o f f i rs t f l o o d i n g o n c o n c e n t r a t i o n s o f t o t a l - N a n d n i t r a t e - N in t h e l a m i n a
a n d p e t i o l e o f t h e y o u n g e s t f u l l y e x p a n d e d l ea f o f c o t t o n . V a l u e s in p a r e n t h e s e s a re c o n -
c e n t r a t i o n s o f N fo r p l a n t s f r o m t h e d r ies t t r e a t m e n t o f t he s lop ing p l o t e x p r e s s e d as m g g-~
d r y w e i g h t
Leaves Pe t io l e s
C o n c n . as % % c h a n g e in C o n c n . as % % c h a n g e in
W a t e r - t a b l e o f va lue fo r N c o n c n , o f value f o r N c o n c n .
d e p t h w a t e r - t a b l e d u r i n g w a t e r - t ab le d u r i n g
(m) o f - 0 .6 m f l o o d i n g o f - 0 .6 m f l o o d i n g
Total.N + 0 , 0 4 6 9 . 0 - 16 .7 74 .3 - 53 .1
- 0 .05 6 8 . 2 - 22 .5 67 .5 - 4 4 . 4
- 0 . 1 7 73 .3 - 17 .6 7 0 . 6 - 4 8 . 2
- 0 . 2 7 77 .2 - 16 .3 7 9 . 6 - 4 1 . 9
- 0 . 3 8 92 .4 - 10 .7 97 .5 - 3 7 . 0
- 0 . 6 0 1 0 0 . 0 ( 3 4 . 7 ) + 12 .5 1 0 0 . 0 ( 1 6 . 2 ) - 31 .1
H N C 9 5 . 8 + 11 .3 9 9 . 4 - 34 .3
L N C 61 .1 0 51 .1 - 2 9 . 4
Nitrate-N
+ 0 . 0 4 36 .6 - 5 8 . 9 6 0 . 4 - 76 .3
- 0 , 05 6 7 . 0 - 1.2 5 5 . 2 - 7 0 . 3
- 0 . 17 6 3 . 4 + 12 .2 53 .5 - 72 .7
- 0 .27 83 .3 + 17 .8 6 6 . 4 - 65 .1
- 0 . 3 8 6 5 . 4 + 17 .3 8 2 . 8 - 6 6 . 8
- 0 . 6 0 1 0 0 . 0 ( 0 . 2 5 ) + 11 .8 1 0 0 . 0 ( 4 . 7 5 ) - 5 3 . 0
H N C 7 4 . 0 - 1.1 1 0 0 . 3 - 6 4 . 0 L N C 17 .4 - 4 5 . 6 13 .9 -, 95 .7
H N C : h i g h - N c o n t r o l . L N C : l o w - N c o n t r o l .

NITROGEN NUTRITION OF WATERLOGGED COTTON 379
flooding began and appeared uniform, but those from the four wettest treatments had slightly smaller upper leaves than the high-N control plants or those where water-table depths were --0.38 to - -0 .60m. There were no signs of plant water stress (wilting) during the second flooding, although leaf growth rates decreased for plants from the four wettest treatments 3~ .
Yield data of mature plants are shown in Table 1. The number of bolls per plant was lowest at the most waterlogged end of the sloping plot and the low-N control, and highest for the high-N control. The mean number of bolls per plant was highest at water-table depths of - 0 . 0 5 , - 0 . 1 7 and - 0 . 2 7 m, as was the mean weight per boil. Plants from these treatments also had the highest yield of lint and seed per boll. However, bolls from the - -0 .38 a n d - - 0 . 6 0 m water-table depths and the high-N control were not quite mature at harvest, and probably would have gained further dry matter.
Concentrations of nitrogen in leaves First flooding. Concentrations of total-N in the youngest fully-
expanded leaf laminae (hereafter called leaves) decreased during the first flooding at all but the driest treatment and the high N control (Table 2). The average concentration of N in leaves of plants from the sloping plot at the beginning of the flooding was 3.1%, and by the end of the flooding this had fallen to 2.5% in leaves of plants from water-table depths of +0.04, --0.05, --0.17 and - -0 .27m, but had risen to 3.3% in leaves of plants from the two driest treatments.
The situation for petiole N was similar to that for leaves, except for decreases in N concentrations in petioles from the two driest treatments
100 '11
60 " " '
8 "3
20
0 I | i I I I i I
0 1 2 3 4 5 6 7 Days of waterlogging
Fig. 1. Time courses of decline in concentrat ions of nitrate-N in petioles o f youngest fully- expanded leaves of cot ton subjected to short term waterlogging at selected positions along the sloping plot during f'trst flooding. Symbols for water-table depths are as follows: �9 . . . . �9 + 0.04 m; = - - = , - -0 .17 m; A - - A , - -0.27 m; o - - r - -0 .60 m.
3 8 0 H O C K I N G , R E I C O S K Y A N D M E Y E R
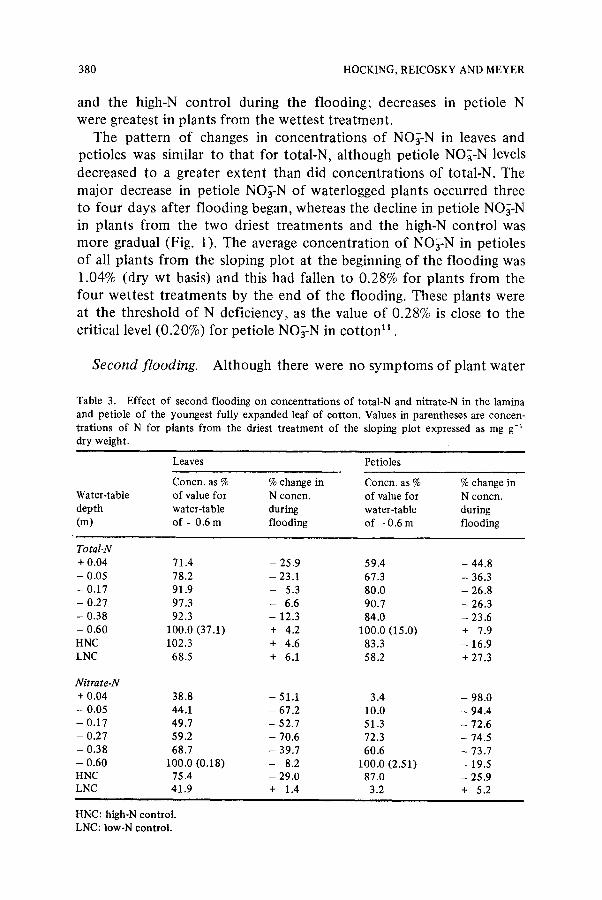
and the high-N control during the flooding; decreases in petiole N were greatest in plants from the wettest treatment.
The pattern of changes in concentrations of NO;-N in leaves and petioles was similar to that for total-N, although petiole NO~-N levels decreased to a greater extent than did concentrations of total-N. The major decrease in petiole NO~-N of waterlogged plants occurred three to four days after flooding began, whereas the decline in petiole NO;-N in plants from the two driest treatments and the high-N control was more gradual (Fig. 1). The average concentration of NO;-N in petioles of all plants from the sloping plot at the beginning of the flooding was 1.04% (dry wt basis) and this had fallen to 0.28% for plants from the four wettest treatments by the end of the flooding. These plants were at the threshold of N deficiency, as the value of 0.289; is close to the critical level (0.20%) for petiole NO~-N in cotton 11 .
Second flooding. Although there were no symptoms of plant water
T a b l e 3. E f f e c t o f s e c o n d f l o o d i n g o n c o n c e n t r a t i o n s o f t o t a l - N a n d n i t r a t e - N in t h e l a m i n a
a n d p e t i o l e o f t h e y o u n g e s t f u l l y e x p a n d e d l ea f o f c o t t o n . V a l u e s in p a r e n t h e s e s a re c o n c e n -
t r a t i o n s o f N fo r p l a n t s f r o m the d r i e s t t r e a t m e n t o f t he s lop ing p l o t e x p r e s s e d as m g g - i
d r y w e i g h t .
Leaves Pe t io l e s
C o n c n . as % % c h a n g e in C o n c n . as % % c h a n g e in
W a t e r - t a b l e o f va lue f o r N c o n c n , o f va lue f o r N c o n c n .
d e p t h w a t e r - t a b l e d u r i n g w a t e r - t a b l e d u r i n g
(m) o f - 0 .6 m f l o o d i n g o f - 0 .6 m f l o o d i n g
Total.N + 0 . 0 4 7 1 . 4 - 2 5 . 9 5 9 . 4 - 4 4 . 8
- 0 . 05 78 .2 - 23 .1 67 .3 - 36 .3
- 0 . 1 7 9 1 . 9 - 5 .3 8 0 . 0 - 2 6 . 8
- 0 . 2 7 9 7 . 3 - 6 .6 9 0 . 7 - 26 .3
- 0 . 3 8 92 .3 - 12 .3 8 4 . 0 - 23 .6
- 0 . 6 0 1 0 0 . 0 ( 3 7 . 1 ) + 4 .2 1 0 0 . 0 ( 1 5 . 0 ) + 7 .9
H N C 1 0 2 . 3 + 4 .6 83 .3 - 16 .9
L N C 68 .5 + 6 .1 5 8 . 2 + 27 .3
Nitrate-N + 0 . 0 4 3 8 . 8 - 51 .1 3 .4 - 9 8 . 0
- 0 . 0 5 44 .1 - 6 7 . 2 10 .0 - 9 4 . 4
- 0 . 1 7 4 9 . 7 - 5 2 . 7 51 .3 - 72 .6
- 0 . 2 7 59 .2 - 70 .6 72 .3 - 74 .5
- 0 . 3 8 6 8 . 7 - 39 .7 6 0 . 6 - 73 .7
- 0 . 6 0 1 0 0 . 0 ( 0 . 1 8 ) - 8 .2 1 0 0 . 0 ( 2 . 5 1 ) - 19 .5 H N C 75 .4 - 2 9 . 0 8 7 . 0 - 2 5 . 9
L N C 4 1 . 9 + 1.4 3 .2 + 5 .2
H N C : h i g h - N c o n t r o l .
L N C : l o w - N c o n t r o l .
NITROGEN NUTRITION OF WATERLOGGED COTTON 381
stress in the second flooding, concentrations of total-N decreased in the youngest fully-expanded leaves and petioles of plants from all but the driest treatment of the sloping plot, and concentrations of NO;-N decreased in leaves and petioles of plants from all treatments, except for the low-N controls (Table 3). As with the first flooding, the de- creases in leaf total-N and NOg-N were greatest in severely waterlogged plants. Nitrate concentrations in petioles of plants from the two wettest treatments and the low-N control were well below sufficiency levels 11 , and indicate that these plants were N-stressed, despite the lack of visual symptoms of N deficiency.
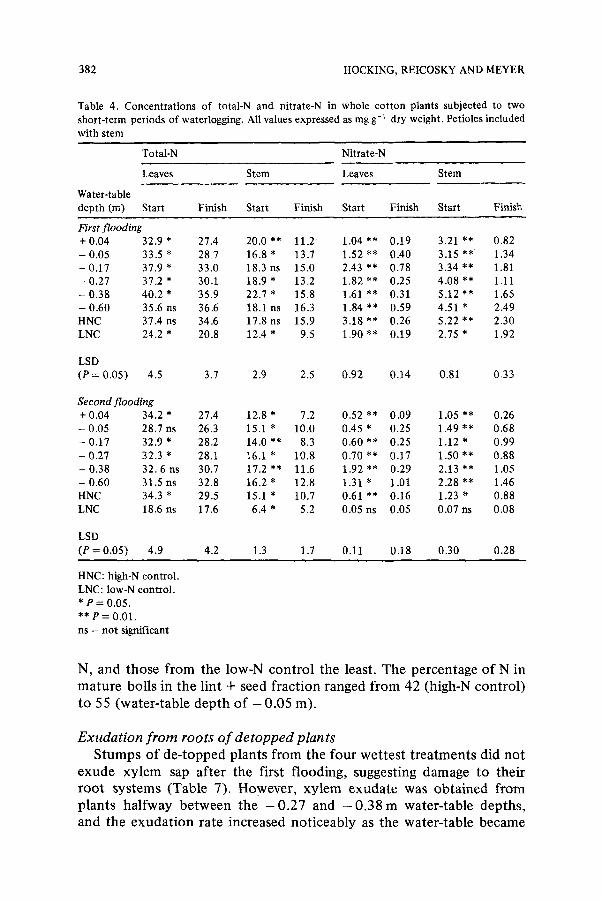
Concentrations of nitrogen in whole plant tops There was a significant decrease in concentrations of total-N in leaves
and stems of plants from all treatments during the first flooding, except for the driest treatment and the high-N control (Table 4). Concen- trations of total-N in leaves and stems of plants from the low-N control were significantly lower than those recorded for plants from the sloping plot or the high-N control. Levels of NO3-N decreased in plant tops from all treatments (including the controls) during the first flooding; however, the magnitude of the decrease in NO~-N was greater in severely waterlogged plants.
In the second flooding the pattern for leaf and stem total-N and NO~-N was similar to that of the first (Table 4), with a few exceptions. There were no changes in concentrations of NO3-N in plants from the low-N control; these were negligible even before the flooding commenced.
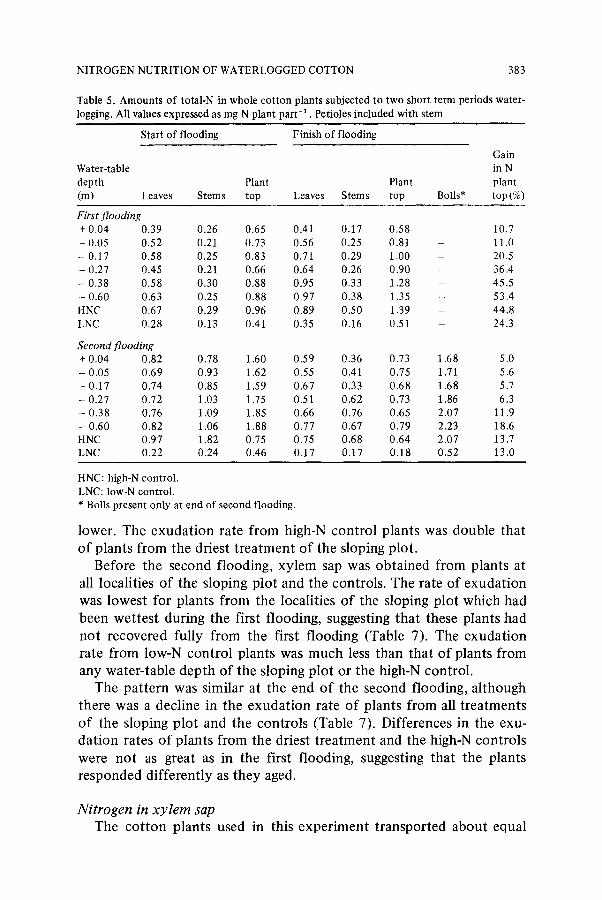
Amounts o f nitrogen in plant tops and in mature bolls Plants that were not waterlogged made the largest gains in N during
the first flooding (Table 5). Plants from the wettest treatment lost N, and this was probably due to leakage of N solutes from damaged roots. All plants gained N during the second flooding, but the gains were proportionally much less than during the first flooding; plants from the wettest treatments acquired the least amount of N. At the end of the second flooding, bolls had accumulated between 31-44% of the total above-ground plant N, and this, plus the relatively small gain in N by plant tops, indicates that internal redistribution of N had occurred.
Concentrations of N in mature boll residues were lowest for plants from the three wettest treatments in the sloping plot (Table 6), but there were few differences in concentrations of N in lint + seed. Bolls from the driest treatment of the sloping plot had the greatest quality of
382 HOCKING, REICOSKY AND MEYER
Table 4. Concentra t ions of total-N and nitrate-N in whole co t ton plants subjected to two
short-term periods of waterlogging. All values expressed as mg g- ~ dry weight. Petioles included
with stem
Total-N Nitrate-N
Leaves Stem Leaves Stem
Water-table
depth (m) Start Finish Start Finish Start Finish Start Finish
First flooding + 0.04 32.9 * 27.4 20.0 ** 11.2 1.04 ** 0.19 3.21 ** 0.82
- 0.05 33.5 * 28.7 16.8 * 13.7 1.52 ** 0.40 3.15 ** 1.34 - 0.17 37.9 * 33.0 18.3 ns 15.0 2.43 ** 0.78 3.34 ** 1.81
- 0 . 2 7 3 7 . 2 " 30.1 1 8 . 9 " 13.2 1 . 8 2 " * 0.25 4 . 0 8 ' * 1.11
- 0.38 4 0 . 2 " 35.9 22.7 * 15.8 1.61 ** 0.31 5 . 1 2 " * 1.65
- 0.60 35.6 ns 36.6 18.1 ns 16.3 1.84 ** 0.59 4.51 * 2.49 HNC 37.4 ns 34.6 17.8 ns 15.9 3.18 ** 0.26 5.22 ** 2.30
LNC 24.2 * 20.8 12.4 * 9.5 1.90 ** 0.19 2.75 * 1.92
LSD (P = 0.05) 4.5 3.7 2.9 2.5 0.92 0.14 0.81 0.33
Second flooding + 0.04 3 4 . 2 * 27.4 12.8 * 7.2 0.52 ** 0.09 1.05 ** 0.26
- 0.05 28.7 ns 26.3 15.1 * 10.0 0.45 * 0.25 1.49 ** 0.68
- 0.17 32.9 * 28.2 14.0 ** 8.3 0.60 ** 0.25 1.12 * 0.99
- 0.27 32.3 * 28.1 16.1 * 10.8 0.70 ** 0.17 1.50 ** 0.88
- 0.38 3 2 . 6 ns 30.7 17.2 ** 11.6 1.92 *~ 0.29 2.13 ** 1.05
- 0.60 31.5 ns 32.8 16.2 * 12.8 1.31 * 1.01 2.28 ** 1.46
HNC 34.3 * 29.5 15.1 * 10.7 0.61 ** 0.16 1.23 * 0.88
LNC 18.6 ns 17.6 6.4 * 5.2 0.05 ns 0.05 0.07 ns 0.08
LSD
(P = 0.05) 4.9 4.2 1.3 1.7 0.11 0.18 0.30 0.28
HNC: high-N control .
LNC: low-N control .
* P = 0.05.
** P = 0.01.
ns - not significant
N, and those from the low-N control the least. The percentage of N in mature bolls in the lint + seed fraction ranged from 42 (high-N control) to 55 (water-table depth of - 0.05 m).
Exudation from roots of detopped plants Stumps of de-topped plants from the four wettest treatments did not
exude xylem sap after the first flooding, suggesting damage to their root systems (Table 7). However, xylem exudate was obtained from plants halfway between the - 0 . 2 7 and - 0 . 3 8 m water-table depths, and the exudation rate increased noticeably as the water-table became
NITROGEN NUTRITION OF WATERLOGGED COTTON 383
Table 5. Amounts o f total-N in whole cotton plants subjected to two short term periods water- logging. All values expressed as mg N plant part -1 . Petioles included with stem
Start of flooding Finish of flooding
Gain
Water-table in N depth Plant Plant plant (m) Leaves Stems top Leaves Stems top Bolls* top (%)
First flooding + 0.04 0.39 0.26 0.65 0.41 0.17 0.58 - 0.05 0.52 0.21 0.73 0.56 0.25 0.81 - 0.17 0.58 0.25 0.83 0.71 0.29 1.00 - - 0.27 0.45 0.21 0.66 0.64 0.26 0.90 - 0.38 0.58 0.30 0.88 0.95 0.33 1.28 - - 0.60 0.63 0.25 0.88 0.97 0.38 1.35 HNC 0,67 0.29 0.96 0.89 0.50 1.39 - LNC 0,28 0.13 0.41 0.35 0.16 0.51
Second flooding + 0.04 0.82 0.78 1.60 0.59 0.36 0,73 1.68 - 0.05 0.69 0.93 1.62 0.55 0.41 0.75 1.71 - 0.17 0.74 0.85 1.59 0.67 0.33 0.68 1,68 - 0.27 0.72 1.03 1.75 0.51 0.62 0.73 1.86 - 0.38 0.76 1.09 1.85 0.66 0.76 0.65 2.07 - 0.60 0.82 1.06 1.88 0.77 0.67 0.79 2.23 HNC 0.97 1.82 0.75 0.75 0.68 0.64 2.07 LNC 0.22 0.24 0.46 0.17 0.17 0.18 0.52
10.7 11.0 20.5 36.4 45.5 53.4 44.8 24.3
5.0 5.6 5.7 6.3
11.9 18.6 13.7 13.0
HNC: high-N control. LNC: low-N control. * Bolls present only at end of second flooding.
lower. The exudation rate from high-N control plants was double that of plants from the driest treatment of the sloping plot.
Before the second flooding, xylem sap was obtained from plants at all localities of the sloping plot and the controls. The rate of exudation was lowest for plants from the localities of the sloping plot which had been wettest during the first flooding, suggesting that these plants had not recovered fully from the first flooding (Table 7). The exudation rate from low-N control plants was much less than that of plants from any water-table depth of the sloping plot or the high-N control.
The pattern was similar at the end of the second flooding, although there was a decline in the exudation rate of plants from all treatments of the sloping plot and the controls (Table 7). Differences in the exu- dation rates of plants from the driest treatment and the high-N controls were not as great as in the first flooding, suggesting that the plants responded differently as they aged.
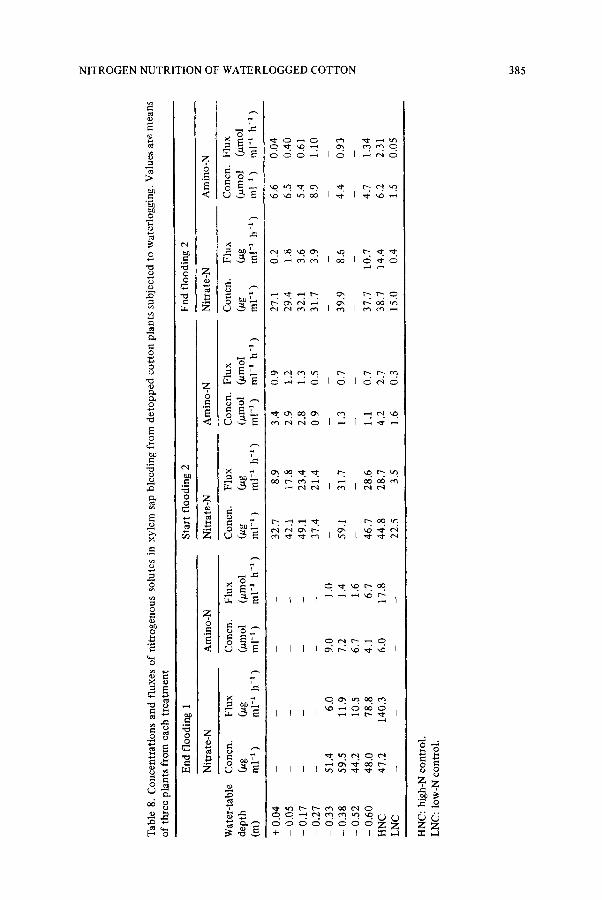
Nitrogen in xylem sap The cotton plants used in this experiment transported about equal
384 HOCKING, REICOSKY AND MEYER
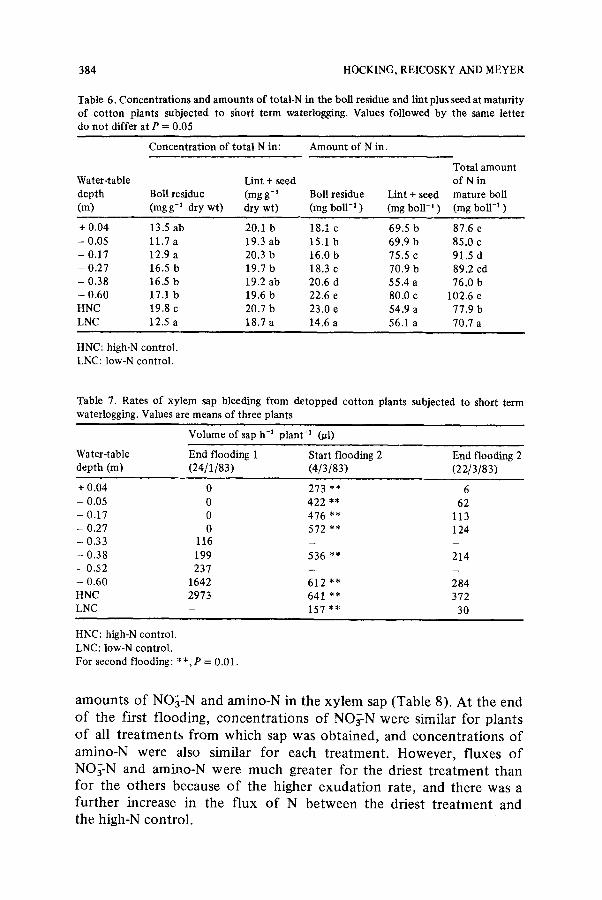
Table 6. Concentrations and amounts of total-N in the boll residue and lint plus seed at maturity of cotton plants subjected to short term waterlogging. Values followed by the same letter do not differ at P = 0.05
Concentration of total N in: Amount of N in:
Total amount Water-table Lint + seed of N in depth Boll residue (mg g-~ Boll residue Lint + seed mature boll (m) (mg g-1 dry wt) dry wt) (mg boll -1 ) (mg boll-~ ) (mg boll "l )
+ 0.04 13.5 ab 20.1 b 18.1 c 69.5 b 87.6 e - 0.05 11.7 a 19.3 ab 15.1 b 69.9 b 85.0 c - 0.17 12.9 a 20.3 b 16.0 b 75.5 c 91.5 d - 0.27 16.5 b 19.7 b 18.3 c 70.9 b 89.2 cd - 0.38 16.5 b 19.2 ab 20.6 d 55.4 a 76.0 b - 0.60 17.1 b 19.6 b 22.6 e 80.0 c 102.6 e HNC 19.8 c 20.7 b 23.0 e 54.9 a 77.9 b LNC 12.5 a 18.7 a 14.6 a 56.1 a 70.7 a
HNC: high-N control. LNC: low-N control.
Table 7. Rates of xylem sap bleeding from detopped cot ton plants subjected to short term waterlogging. Values are means of three plants
Volume of sap h -1 plant -a (#1)
Water-table End flooding 1 Start flooding 2 End flooding 2 depth (m) (24/1/83) (4/3/83) (22/3/83)
+ 0.04 0 273 ** 6 - 0.05 0 422 ** 62 - 0.17 0 476 ** 113 - 0.27 0 572 ** 124 - 0.33 116 - _
- 0.38 199 536 ** 214 - 0.52 237 - - - 0.60 1642 612 ** 284 HNC 2973 641 ** 372 LNC - 157 ** 30
HNC: high-N control.
LNC: low-N control. For second flooding: * * , P = 0.01.
amounts of NO~-N and amino-N in the xylem sap (Table 8). At the end of the first flooding, concentrations of NO~-N were similar for plants o f all treatments from which sap was obtained, and concentrations of amino-N were also similar for each treatment. However, fluxes of NO~-N and amino-N were much greater for the driest t reatment than for the others because of the higher exudation rate, and there was a further increase in the flux of N between the driest t reatment and the high-N control.
NITROGEN NUTRITION OF WATERLOGGED COTTON 385
O
O
o
+.,
O
6
o ~
t",;
t"q
Y
O .= -
z i ~ ~-
J t-,
z
i
+ q I I I I F I ~ ~
0 ""
z z
386 HOCKING, REICOSKY AND MEYER
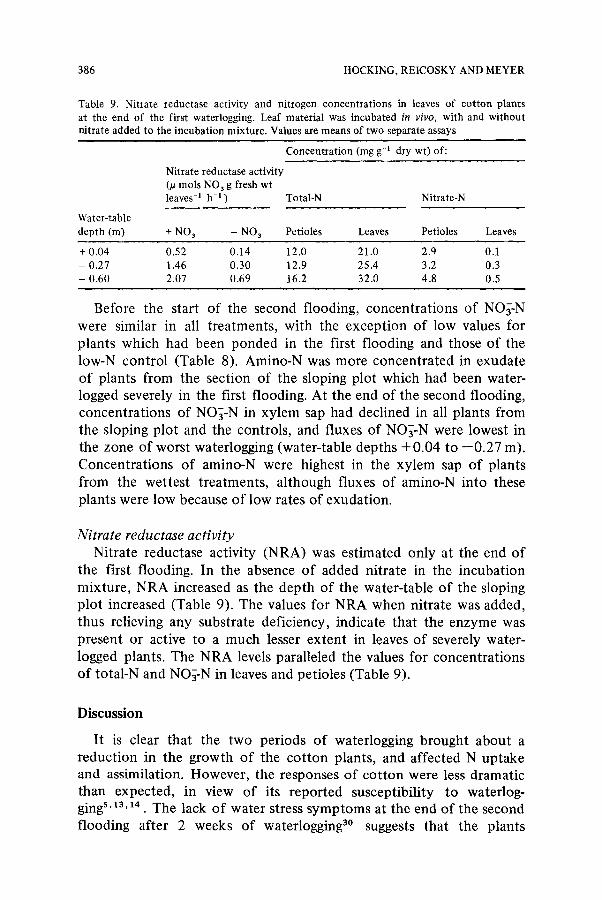
Table 9. Nitrate reductase activity and nitrogen concentrat ions in leaves of cot ton plants at the end of the first waterlogging. Leaf material was incubated in vivo, with and wi thout nitrate added to the incubat ion mixture . Values are means o f two separate assays
Nitrate reductase activity (~t mols NO 3 g fresh wt leaves-I h-I )
Concentra t ion (mg g-a dry wt) of:
Total-N Nitrate-N
Water-table depth (m) + NO 3 - NO 3 Petioles Leaves Petioles Leaves
+ 0.04 0.52 0.14 12.0 21.0 2.q 0.1 - 0.27 1.46 0.30 12.9 25.4 3.2 0.3 - 0.60 2.07 0.69 16.2 32.0 4.8 0.5
Before the start of the second flooding, concentrations of NO~-N were similar in all treatments, with the exception of low values for plants which had been ponded in the first flooding and those of the low-N control (Table 8). Amino-N was more concentrated in exudate of plants from the section of the sloping plot which had been water- logged severely in the first flooding. At the end of the second flooding, concentrations of NO~-N in xylem sap had declined in all plants from the sloping plot and the controls, and fluxes of NO~-N were lowest in the zone of worst wateflogging (water-table depths + 0.04 to --0.27 m). Concentrations of amino-N were highest in the xylem sap of plants from the wettest treatments, although fluxes of amino-N into these plants were low because of low rates of exudation.
Nitrate reductase activity Nitrate reductase activity (NRA) was estimated only at the end of
the first flooding. In the absence of added nitrate in the incubation mixture, NRA increased as the depth of the water-table of the sloping plot increased (Table 9). The values for NRA when nitrate was added, thus relieving any substrate deficiency, indicate that the enzyme was present or active to a much lesser extent in leaves of severely water- logged plants. The NRA levels paralleled the values for concentrations of total-N and NO~-N in leaves and petioles (Table 9).
Discussion
It is clear that the two periods of waterlogging brought about a reduction in the growth of the cot ton plants, and affected N uptake and assimilation. However, the responses of cotton were less dramatic than expected, in view of its reported susceptibility to waterlog- gingS, ~3,14 . The lack of water stress symptoms at the end of the second flooding after 2 weeks of waterlogging 3~ suggests that the plants
NITROGEN NUTRITION OF WATERLOGGED COTTON 387
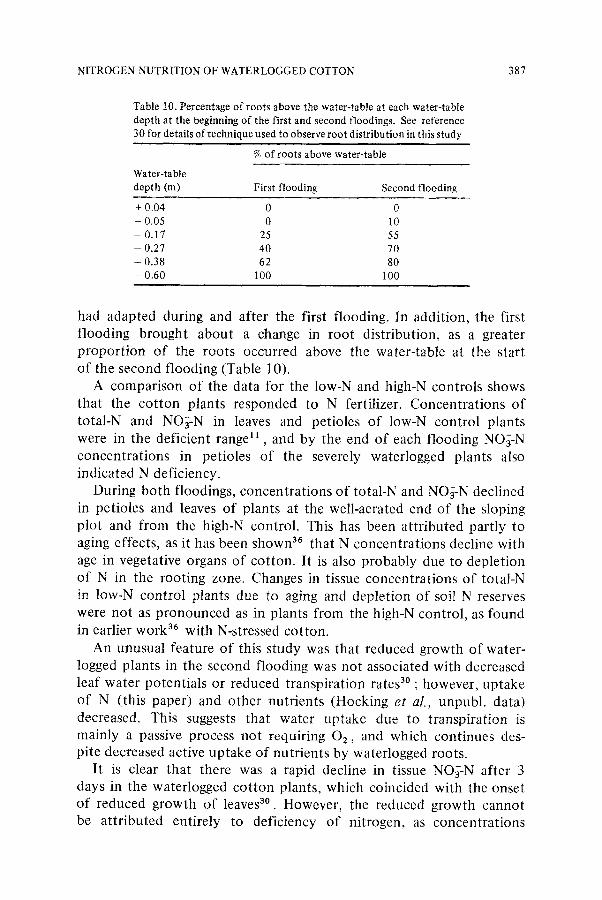
Table 10. Percentage o f roots above the water-table at each water-table depth at the beginning of the first and second floodings. See reference 30 for details of technique used to observe root distr ibution in this s tudy
% of roots above water-table
Water-table depth (m) First flooding Second flooding
+ 0.04 0 0 - 0.05 0 10 - 0 . 1 7 2 5 5 5
- 0.27 40 70 - 0.38 62 80 - 0.60 100 100
had adapted during and after the first flooding. In addition, the first flooding brought about a change in root distribution, as a greater proportion of the roots occurred above the water-table at the start of the second flooding (Table 10).
A comparison of the data for the low-N and high-N controls shows that the cotton plants responded to N fertilizer. Concentrations of total-N and NO;-N in leaves and petioles of low-N control plants were in the deficient range ~1 , and by the end of each flooding NO]-N concentrations in petioles of the severely waterlogged plants also indicated N deficiency.
During both floodings, concentrations of total-N and NO~-N declined in petioles and leaves of plants at the well-aerated end of the sloping plot and from the high-N control. This has been attributed partly to aging effects, as it has been shown a6 that N concentrations decline with age in vegetative organs of cotton. It is also probably due to depletion of N in the rooting zone. Changes in tissue concentrations of total-N in low-N control plants due to aging and depletion of soil N reserves were not as pronounced as in plants from the high-N control, as found in earlier work 36 with N-stressed cotton.
An unusual feature of this study was that reduced growth of water- logged plants in the second flooding was not associated with decreased leaf water potentials or reduced transpiration rates 3~ ; however, uptake of N (this paper) and other nutrients (Hocking et al., unpubl, data) decreased. This suggests that water uptake due to transpiration is mainly a passive process not requiring 02, and which continues des- pite decreased active uptake of nutrients by waterlogged roots.
It is clear that there was a rapid decline in tissue NO;-N after 3 days in the waterlogged cotton plants, which coincided with the onset of reduced growth of leaves 3~ . However, the reduced growth cannot be attributed entirely to deficiency of nitrogen, as concentrations
388 HOCKING, REICOSKY AND MEYER
of P and K also declined (Hocking et al. unpubl, data). Decreased con- centrations of N, P, K and Ca have been reported in other studies of waterlogged crop plants 2'~' 18,32,3a,3~, including cotton 26 . We conclude that root uptake of N and other elements is impaired before growth is reduced in waterlogged cotton, and this may result in the crop becoming deficient in several nutrients.
Reductions in exudation rates have been reported for herbaceous species when their root systems were subjected to anaerobic con- ditions 2~ and the impaired capacity of waterlogged cotton plants to exude-sap is likely to result from reduced uptake, transport and xylem loading of ions by roots. Uptake of NO~-N has been reported to cease when roots are waterlogged 3v:~ but the effect of flooding on NO~-N uptake was not so clear cut in this experiment. For example, NO~-N was present in xylem sap at the end of the second flooding despite mean partial pressures of soil oxygen of 3 to 6 kPa in the soil solution. Plants in the wettest treatment lost N from their shoots during the first flooding (Table 5), and this was probably due to leakage of nitrogenous solutes from damaged roots.
Cytokinin synthesis in roots is impaired by waterlogging 3'4, and N deficiency appears to bring about a slowing of growth partly because of reduced export of cytokinins from roots as . In particular, NO~-N is linked with the synthesis of cytokinins 14 , and thus decreased growth of waterlogged cotton in this experiment may have been due partly to reduced levels of cytokinins synthesized and exported from roots because of their poor NO~-N status.
Roots of cotton reduce only sufficient NO]-N for their require- ments, and export the rest to the shoot 1~ . However, in this ex- periment cotton roots exported about equal quantities of N as reduced- N (amino compounds) and NO~-N in xylem sap to the shoot, and there was a trend for a greater proportion of reduced-N with increased degree of waterlogging. The presence of large quantities of reduced-N in xylem sap could be due to ammonium uptake from the soil, although soil NH,] values were low and variable 31 . It is likely that the higher concentrations of amino-N in waterlogged plants were due to the hydrolysis of proteins in necrotic root tissue, and the subsequent release of amino acids into the xylem. They may also be due to in- creased resident time of NO~-N in waterlogged roots, as suggested by the low flux of xylem exudate from stumps of waterlogged plants, thus giving more time in which reduction of NO~-N could occur.
It has been suggested z7 that NRA of the youngest fully-expanded leaf of cotton is a more sensitive indicator of plant N status than NO~-N concentrations in petioles. NRA also appears to be a good indicator
NITROGEN NUTRITION OF WATERLOGGED COTTON 389
of plant stress due to waterlogging. Although nitrate added to the incubation mixture increased NRA, it did not increase the activity of the enzyme more in waterlogged plants than in well-aerated plants suggesting that the enzyme was not present in an inactive form to a greater extent in waterlogged plants than in the well-aerated ones.
In conclusion, it is likely that the decreased N uptake of waterlogged cotton is only partly responsible for the observed reduction in vege- tative growth, as decreased uptake of other nutrients such as P and K may also contribute to the growth reduction. In practical terms, a short period of waterlogging may result in N deficiency in cotton, especially if the crop was growing vigorously and the availability of soil N was only just adequate before the waterlogging.
Acknowledgements We thank Mr R Sides for field assistance and for preparation of plant material, and Mr L Higgins for chemical analyses and Susan Kelo for preparing the typescript.
References
1 Aloni B and Rosenshtein G 1982 Effect of flooding on tomato cultivars: The relation- ship between proline accumulation and other morphological and physiological changes. Physiol. Plant 56 ,513-517 .
2 Belford R K 1981 Response of winter wheat to prolonged waterlogging under outdoor conditions. J. Agric. Sci. Camb. 97 ,557-568 .
3 Bradford K J and Yang S F 1981 Physiological responses of plants to waterlogging. Hort. Sci. 16, 25-30 .
4 Carmi A and Van Staden J 1983 Role of roots in regulating the growth rate and cytokinin content in leaves. Plant Physiol. 73, 76-78 .
5 de Bruyn L P 1982 The effect of over-irrigation on the growth and production of Gossy- pium hirsutum. Irrig. Sci. 3 ,177-184 .
6 Drew M C and Sisworo E J 1979 The development of waterlogging damage in young barley plants in relation to plant nutrient status and changes in soil properties. New Phytol. 82 ,301-314 .
7 Drew M C, Sisworo E J and Saker L R 1979 Alleviation of waterlogging damage to young barley by application of nitrate and a synthetic cytokinin, and comparison between the effects of waterlogging, nitrogen deficiency and root excision. New Phytol. 82 ,315-329 .
8 Eastin E F 1978 Total nitrogen determination for plant material containing nitrate. Analyt. Biochem. 85 ,591-594 .
9 Erickson A E and Van Doren D M 1960 The 7th International Congress of Soil Science, No. 3. Committee 4, pp. 428.
10 Halevy J 1976 Growth rate and nutrient uptake of two cotton cultivars grown under irrigation. Agron. J. 68 ,701 - 705 .
11 Hearn A B 1981 Cotton nutrition. Field Crop Abstracts 34, 11-34. 12 Hertriksen A and Selmer-Olsen A R 1970 Automatic methods for determining nitrate and
nitrite in water and soil extracts. Analyst 95, 514-518. 13 Hodgson A S 1982 The effects of duration, timing and chemical amelioration of short-
term waterlogging during furrow-irrigation of cotton in a cracking grey clay. Aust. J. Agric. Res. 33, 1019-1028.
14 Hodgson A S and Chan K Y 1982 The effect of short term waterlogging during furrow irrigation of cotton on a grey-cracking clay. Aust. J. Agric. Res. 33 ,109-116 .
390 HOCKING, REICOSKY AND MEYER
15 Horan J M and Wareing P F 1980 Cytokinins and the growth responses of seedlings of Betula pendula Roth. and Aeer pseudoplatanus L. to nitrogen and phosphorus deficiency. J. Exp. Bot. 31,525-532.
16 Huck M G 1970 Variation in tap root elongation as influenced by composition of the soil air. Agron. J. 62,815-818.
17 Jackson M B 1983 Approaches to relieving aeration stress in waterlogged plants. Pestic. Sci. 14, 25-32.
18 Jackson M B, Drew M C and Giffard S C 1981 Effects of applying ethylene to the root system of Zea mays on growth and nutrient concentration in relation to flooding tole- rance. Physiol. Plant. 52, 23-28.
19 Kende H, Hahn H and Kays S E 1971 Enhancement of nitrate reductase activity by benzyladenine in Agrostemma githago. Plant Physiol. 4 8 ,7 0 2 706.
20 Kramer P J 1940 Causes of decreased absorption of water by plants in poorly aerated media. Am. J. Bot. 27,216-220.
21 Kramer P J 1951 Causes of injury to plants resulting from flooding of the soil. Plant Physiol. 26,722-736.
22 Labanauskas C K, Stolzy L H and Luxmoore R J 1975 Soil temperature and soil aeration effects on concentrations and total amounts of nutrients in 'Yecora' wheat grain. Soil Sci. 120,450-454.
23 Lee R B 1978 Inorganic nitrogen metabolism in barley roots under poorly aerated con- ditions. J. Exp. Bot. 29,693-708.
24 Letey J, Stolzy L H and Blank G B 1962 Effect of duration and timing of low soil oxygen content on shoot and root growth. Agron. J. 54, 34-37.
25 Mackenzie A J, Spencer W F, Stockinger K R and Krantz B A 1962 Seasonal nitrate-N content of cotton petioles as affected by nitrogen application and its relationship to yield. Agron. J. 52, 55-59.
26 Meek B D, Owen-Bartlett E C, Stolzy L H and Labanauskas C K 1980 Cotton yield and nutrient uptake in relation to water table depth. Soil Sci. Soc. Am. J. 44,301-305.
27 Oosterhuis D M and Bate G C 1983 Nitrogen uptake of field-grown cotton. II. Nitrate reductase activity and petiole nitrate concentration as indicators of plant nitrogen status. Expl. Agric. 19,103-109.
28 Radin J W 1977 Contribution of the root system to nitrate assimilation in whole plants. Aust. J. Plant Physiol. 4, 811-819.
29 Radin J W 1978 A physiological basis for the division of nitrate assimilation between roots and leaves. Plant Sci. Letters 13, 21-25.
30 Reicosky D C, Meyer W S, Schaefer N L and Sides R D 1985 Cotton response to short term waterlogging imposed with a water-table gradient facility. Agric. Water Manage. (In press).
31 Schaefer N L, Melhuish F M, Reicosky D C and Meyer W S 1985 The effect of a water- table gradient on soil nitrogen and plant uptake. Plant and Soil submitted.
32 Singh R and Ghildyal B P 1980 Soil submergence effects on nutrient uptake, growth, and yield of five corn cultivars. Agron. J. 72,737-741.
33 Slowik K, Labanauskas C K, Stolzy L H and Zentmyer G A 1979 Influence of rootstocks, soil oxygen and soil moisture on the uptake and translocation of nutrients in young avocado plants. J. Am. Soc. Hort. Sci. 104,172-175.
34 Tang Z C and Kozlowski T T 1982 Some physiological and growth responses of Betula papyrifera seedlings to flooding. Physiol. Plant 55,415-420.
35 Taylor J K and Hooper P D 1938 A soil survey of the horticultural soils of the Murrum- bidgee Irrigation Areas, New South Wales. Bull. Counc. Scient. Ind. Res., Melb. No. 118.
36 Thompson A C, Lane H C, Jones J W and Hesketh J D 1976 Nitrogen concentrations of cotton leaves, buds, and bolls in relation to age and nitrogen fertilization. Agron. J. 68,617-621.
37 Trought M C T and Drew M C 1980 The development of waterlogging damage in wheat seedlings (Triticum aestivum L.) 1. Shoot and root growth in relation to changes in the concentrations of dissolved gases and solutes in the soil solution. Plant and Soil 54, 7 7 - 94.

NITROGEN NUTRITION OF WATERLOGGED COTTON 391
38 Trought M C T and Drew M C 1982 Effects of waterlogging on young wheat plants (Triti- cum aestivum L.) and on soil solutes at different soil temperatures. Plant and Soil 69, 311-326.
39 Van't Woudt B D and HageIi R M 1957 In Drainage of Agricultural Lands. Ed. J N Luthin, pp 514-611. Am. Soc. Agron. Madison, Wisconsin.
40 Wiley C R 1970 Effects of short periods of anaerobic and near anaerobic conditions on water uptake by tobacco roots. Agron. J. 62 ,224 -229 .
41 Yemm E W and Cocking E C 1955 The determination of amino acids with ninhydrin. Analyst 80 ,209-213 .


![Broek, David - Elementary Engineering Fracture Mechanics [Martinus Nijhoff 1984].pdf](https://static.fdocuments.us/doc/165x107/563db8de550346aa9a97b2cb/broek-david-elementary-engineering-fracture-mechanics-martinus-nijhoff.jpg)


![Broek, David - Elementary Engineering Fracture Mechanics [Martinus Nijhoff 1984]](https://static.fdocuments.us/doc/165x107/55182ba44a795992098b461e/broek-david-elementary-engineering-fracture-mechanics-martinus-nijhoff-1984.jpg)