Hands-on Lab: Building Advanced Dashboards with Xtraction for CA Service Management
41
Hands-on Lab: Building Advanced Dashboards with Xtraction for CA Service Management Amy Chenard – Sr. Principal Engineering Services Architect – CA Technologies John Weston – Sr. Principal Consultant, Presales – CA Technologies AMX31E AGILE MANAGEMENT
-
Upload
ca-technologies -
Category
Technology
-
view
106 -
download
1
Transcript of Hands-on Lab: Building Advanced Dashboards with Xtraction for CA Service Management

Hands-on Lab: Building Advanced Dashboards with Xtraction for CA Service ManagementAmy Chenard – Sr. Principal Engineering Services Architect – CA TechnologiesJohn Weston – Sr. Principal Consultant, Presales – CA Technologies
AMX31E
AGILE MANAGEMENT

3 © 2016 CA. ALL RIGHTS RESERVED.@CAWORLD #CAWORLD
For Informational Purposes Only
© 2016 CA. All rights reserved. All trademarks referenced herein belong to their respective companies.
The content provided in this CA World 2016 presentation is intended for informational purposes only and does not form any type of warranty. The information provided by a CA partner and/or CA customer has not been reviewed for accuracy by CA.
Terms of this Presentation

5 © 2016 CA. ALL RIGHTS RESERVED.@CAWORLD #CAWORLD
Agenda
INTRODUCTION TO DASHBOARDS
XTRACTION FOR CA SERVICE MANAGEMENT
BUILDING A DASHBOARD
EXPORT, SCHEDULING, PUBLISHING
USER EXPERIENCE
1
2
3
4
5

6 © 2016 CA. ALL RIGHTS RESERVED.@CAWORLD #CAWORLD
Introduction to Dashboards

7 © 2016 CA. ALL RIGHTS RESERVED.@CAWORLD #CAWORLD
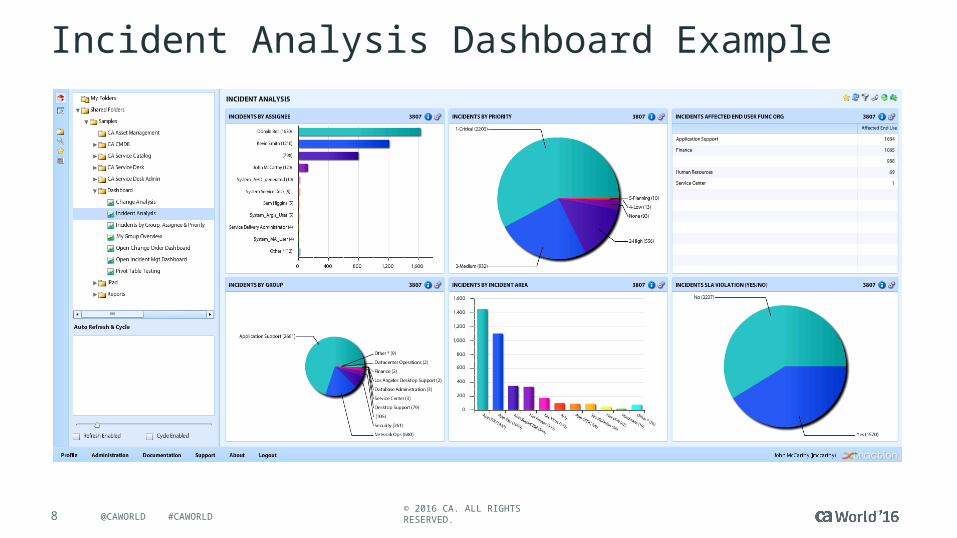
What is a Dashboard?
Dashboards often provide at-a-glance views of KPIs relevant to a particular objective or business process.
In real-world terms, "dashboard" is another name for "progress report" or "report."
Definition by Wikipedia
8 © 2016 CA. ALL RIGHTS RESERVED.@CAWORLD #CAWORLD
Incident Analysis Dashboard Example
9 © 2016 CA. ALL RIGHTS RESERVED.@CAWORLD #CAWORLD
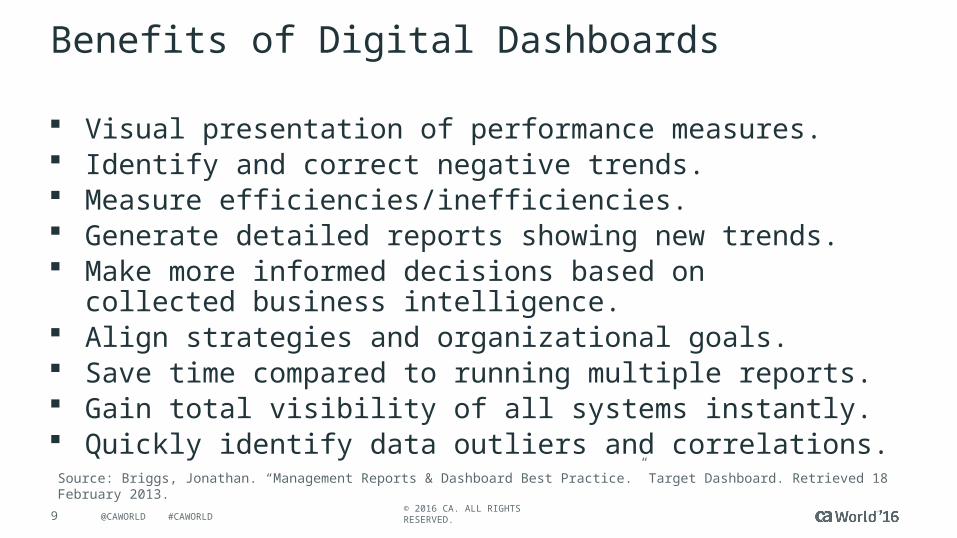
Benefits of Digital Dashboards
Visual presentation of performance measures. Identify and correct negative trends. Measure efficiencies/inefficiencies. Generate detailed reports showing new trends. Make more informed decisions based on collected business
intelligence. Align strategies and organizational goals. Save time compared to running multiple reports. Gain total visibility of all systems instantly. Quickly identify data outliers and correlations.
Source: Briggs, Jonathan. “Management Reports & Dashboard Best Practice.” Target Dashboard. Retrieved 18 February 2013.
10 © 2016 CA. ALL RIGHTS RESERVED.@CAWORLD #CAWORLD
Xtraction Dashboards for CA Service Management

11 © 2016 CA. ALL RIGHTS RESERVED.@CAWORLD #CAWORLD
Building a Service Management Dashboard
CA Service Management DB as the Data Source
Access to a meaningful Data Model
Dynamic filtering capability
Display choices: calendar, grid, area, bar, columns, pie-chart, scorecard, line, bubble…
Export capability
What do we need?
12 © 2016 CA. ALL RIGHTS RESERVED.@CAWORLD #CAWORLD
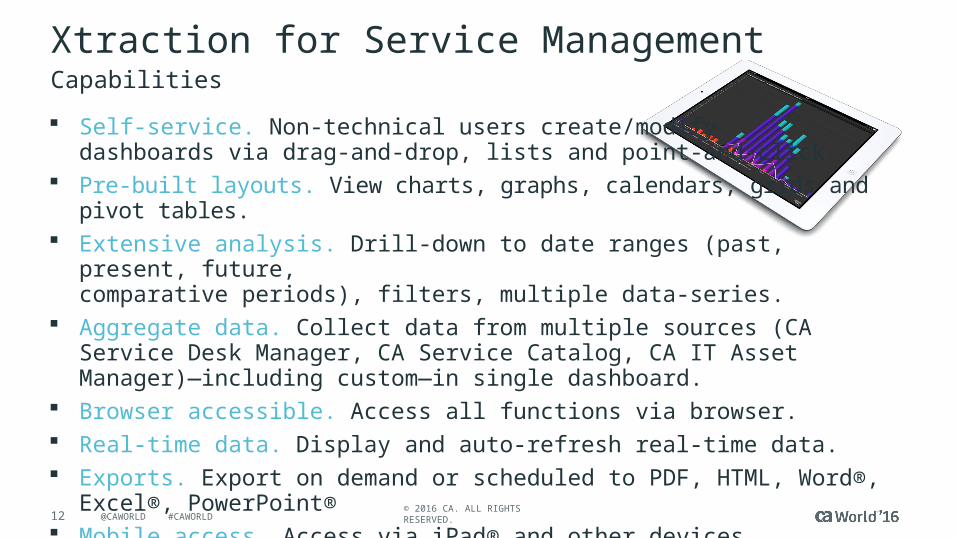
Xtraction for Service Management
Self-service. Non-technical users create/modify dashboards via drag-and-drop, lists and point-and-click.
Pre-built layouts. View charts, graphs, calendars, grids and pivot tables. Extensive analysis. Drill-down to date ranges (past, present, future,
comparative periods), filters, multiple data-series. Aggregate data. Collect data from multiple sources (CA Service Desk Manager, CA
Service Catalog, CA IT Asset Manager)—including custom—in single dashboard. Browser accessible. Access all functions via browser. Real-time data. Display and auto-refresh real-time data. Exports. Export on demand or scheduled to PDF, HTML, Word®, Excel®, PowerPoint® Mobile access. Access via iPad® and other devices No database table structure. Create dashboards without specialized knowledge.
Capabilities

13 © 2016 CA. ALL RIGHTS RESERVED.@CAWORLD #CAWORLD
Xtraction for CA Service Management
A real-time, ad hoc dashboard and reporting solution
Empowers users with self-service capabilities
Non-technical users create interactive dashboards and reports in minutes
Immediately share with the broader user community Results in unified view of your CA Service Management environment Delivers deep, real-time management insight and transparency into
service demand, cost, use, assets and issues
At a Glance

14 © 2016 CA. ALL RIGHTS RESERVED.@CAWORLD #CAWORLD
Xtraction for CA Service Management
Improve user experience. Self-service empowers users with the right information, at the right time - in minutes, not hours.
Make better business decisions. Improve access to and ad hoc analysis of relevant service management data.
Reduce costs. Remove dependency on technical teams, coding and cumbersome tools.
Increase productivity. Get answers quicker; free up technical team.
Delivering Business Value

15 © 2016 CA. ALL RIGHTS RESERVED.@CAWORLD #CAWORLD
Lab 1: Explore Xtraction for CA Service Management
16 © 2016 CA. ALL RIGHTS RESERVED.@CAWORLD #CAWORLD
Xtraction for CA Service Management
Use of dynamic filtering
Export-as-a-screen
Save dashboard as a link
Toggle component view
Display record list
Display ticket details in CA Service Desk Manager
Lab Review: Capabilities Explored

17 © 2016 CA. ALL RIGHTS RESERVED.@CAWORLD #CAWORLD
Building a Dashboard
18 © 2016 CA. ALL RIGHTS RESERVED.@CAWORLD #CAWORLD
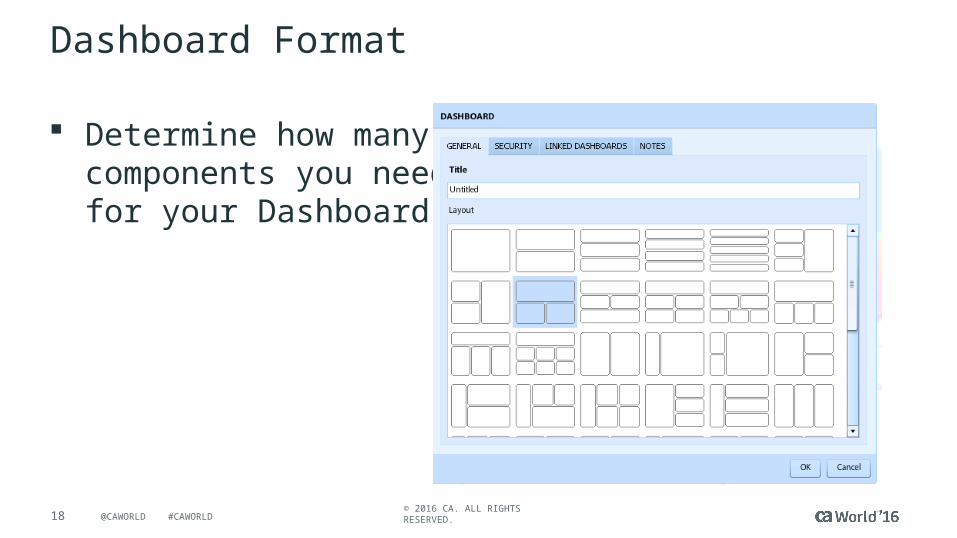
Dashboard Format
Determine how many components you need for your Dashboard

19 © 2016 CA. ALL RIGHTS RESERVED.@CAWORLD #CAWORLD
Component Types
Type Description
Time Component Visually represents data using time slices segregated by hours, days, weeks, months, etc.; these can be presented in many formats including area, bar and line charts; or in stacked and 100% stacked formats, which enables the data to be portrayed in comparative context
Group Component Summarizes data by one or more fields from the Data Source Group Components may have multiple independent series, each coming from different Data Sources
Pivot Component Supports a multi-dimensional pivot by employing a row and column pivot Pivot Components support either group or time pivots
Scorecard Component Summarizes an entire data set providing a single result instead of slicing by time or group as in the above components
(Record) List Component Displays raw data from Data Sources without performing any summarization Sources without performing any summarization
Image Component Displays an image from the server or from a URL
20 © 2016 CA. ALL RIGHTS RESERVED.@CAWORLD #CAWORLD
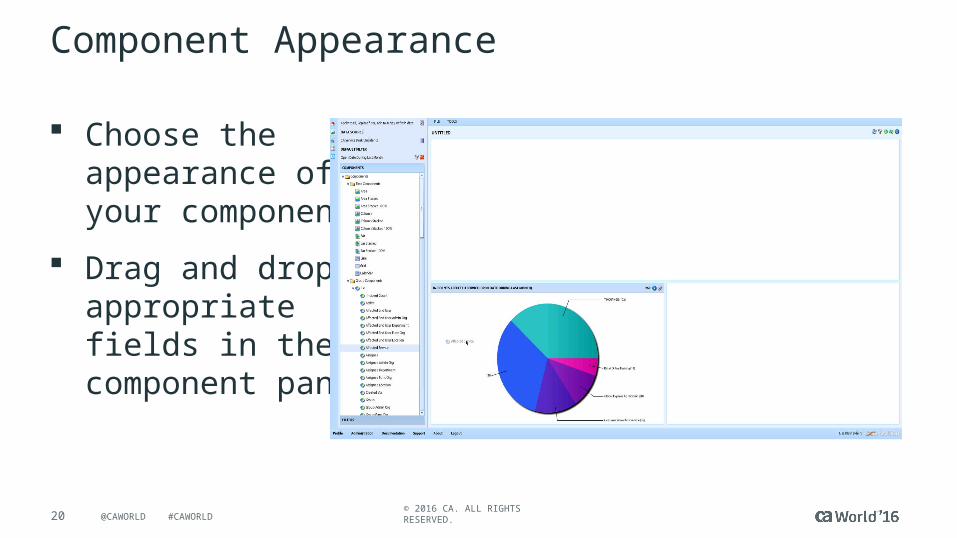
Component Appearance
Choose the appearance of your component
Drag and drop appropriate fields in the component pane

21 © 2016 CA. ALL RIGHTS RESERVED.@CAWORLD #CAWORLD
Components & Series Properties

22 © 2016 CA. ALL RIGHTS RESERVED.@CAWORLD #CAWORLD
Edit a Dashboard
23 © 2016 CA. ALL RIGHTS RESERVED.@CAWORLD #CAWORLD
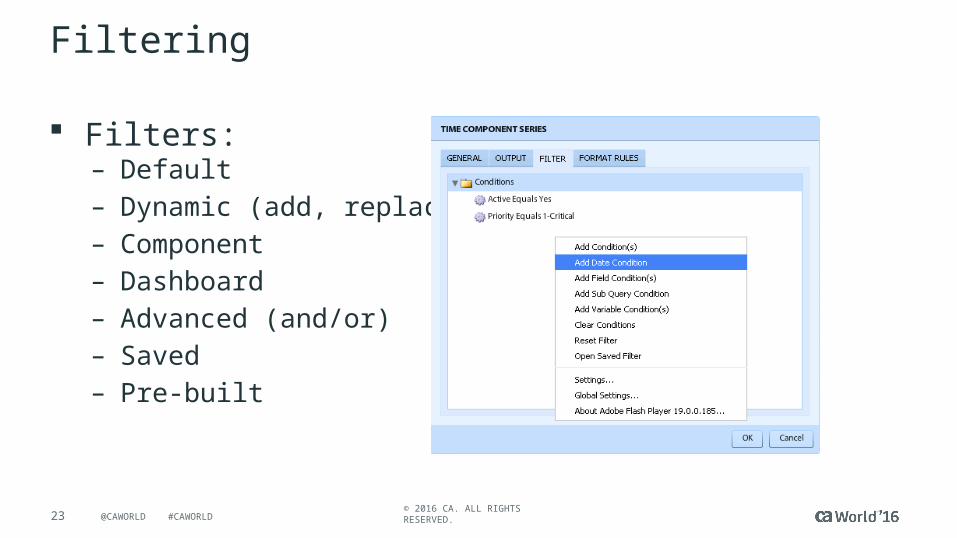
Filtering
Filters:– Default– Dynamic (add, replace)– Component– Dashboard– Advanced (and/or) – Saved– Pre-built
24 © 2016 CA. ALL RIGHTS RESERVED.@CAWORLD #CAWORLD
Lab 2: Build an ITSM Analysis Dashboards

25 © 2016 CA. ALL RIGHTS RESERVED.@CAWORLD #CAWORLD
Lab 3: Build a Scoreboard

26 © 2016 CA. ALL RIGHTS RESERVED.@CAWORLD #CAWORLD
Export, Scheduling, Publishing

27 © 2016 CA. ALL RIGHTS RESERVED.@CAWORLD #CAWORLD
Export
Click on Export Icon
Several formats:– HTML– MS Word– MS Excel– MS Powerpoint– PDF– Screen shot (PNG)

28 © 2016 CA. ALL RIGHTS RESERVED.@CAWORLD #CAWORLD
Lab 4: Export Your Dashboard

29 © 2016 CA. ALL RIGHTS RESERVED.@CAWORLD #CAWORLD
Schedule and Publish
Save your Dashboard as a document or import it into a document
Click Schedule Icon
Specify export format, scheduling and delivery location
30 © 2016 CA. ALL RIGHTS RESERVED.@CAWORLD #CAWORLD
Lab 5: Create a Document and Schedule it

31 © 2016 CA. ALL RIGHTS RESERVED.@CAWORLD #CAWORLD
Auto Refresh

32 © 2016 CA. ALL RIGHTS RESERVED.@CAWORLD #CAWORLD
User Experience

33 © 2016 CA. ALL RIGHTS RESERVED.@CAWORLD #CAWORLD
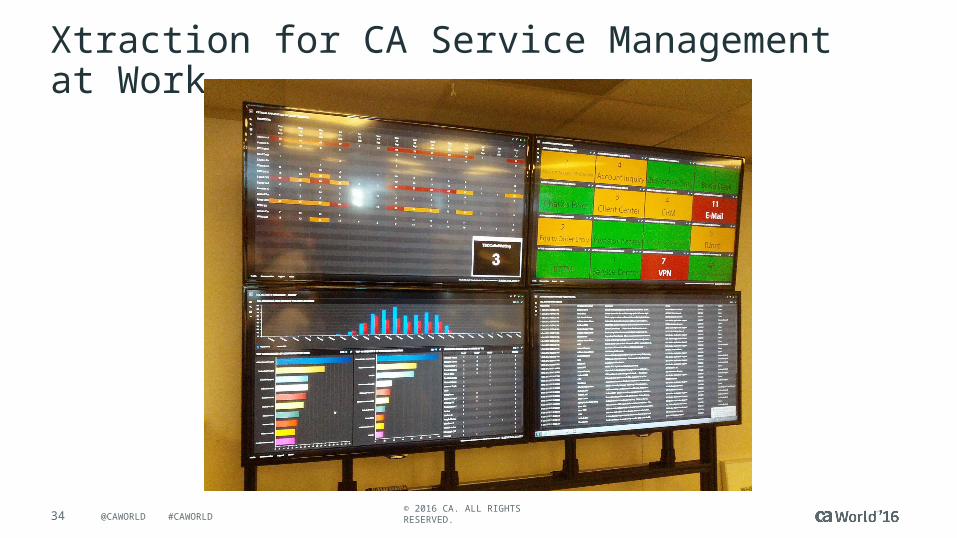
User Experience
Self-service User Interface
Mobile Interface
Internal Broadcast on TV monitors (Auto refresh, Large Display Mode)
34 © 2016 CA. ALL RIGHTS RESERVED.@CAWORLD #CAWORLD
Xtraction for CA Service Management at Work

35 © 2016 CA. ALL RIGHTS RESERVED.@CAWORLD #CAWORLD
Xtraction for CA Service Management at Work

36 © 2016 CA. ALL RIGHTS RESERVED.@CAWORLD #CAWORLD
Lab 6: Display Your Dashboards

37 © 2016 CA. ALL RIGHTS RESERVED.@CAWORLD #CAWORLD
Mixing Data Sources
38 © 2016 CA. ALL RIGHTS RESERVED.@CAWORLD #CAWORLD
Lab 7: Build a Multi-Sourced Dashboard

39 © 2016 CA. ALL RIGHTS RESERVED.@CAWORLD #CAWORLD
ResultsIn this session you learned about Xtraction for CA Service Management. We built an IT service management (ITSM) dashboard using Xtraction for CA Service Management in only few clicks. We demonstrated the power and value that advanced reporting and dashboards with Xtraction bring to ITSM
Summary
40 © 2016 CA. ALL RIGHTS RESERVED.@CAWORLD #CAWORLD
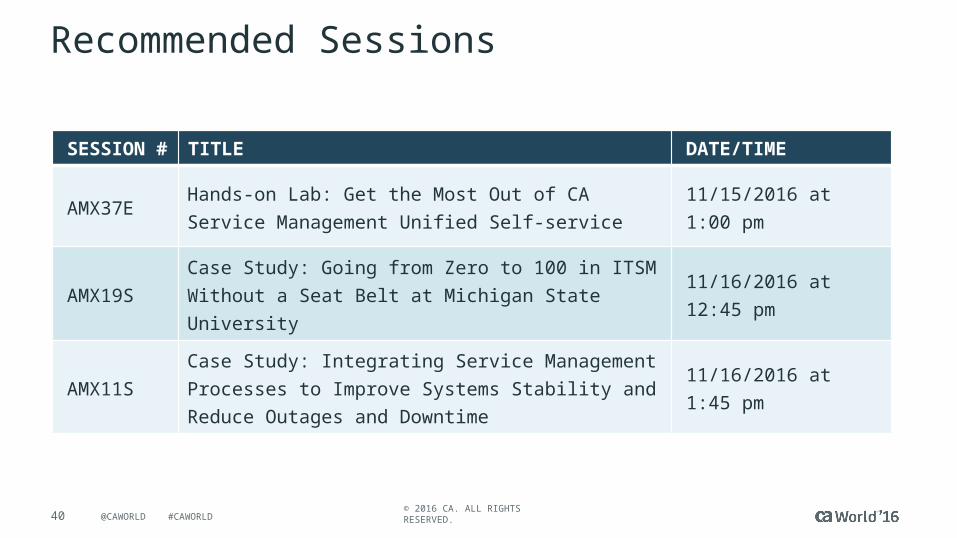
Recommended Sessions
SESSION # TITLE DATE/TIME
AMX37E Hands-on Lab: Get the Most Out of CA Service Management Unified Self-service 11/15/2016 at 1:00 pm
AMX19S Case Study: Going from Zero to 100 in ITSM Without a Seat Belt at Michigan State University 11/16/2016 at 12:45 pm
AMX11S Case Study: Integrating Service Management Processes to Improve Systems Stability and Reduce Outages and Downtime 11/16/2016 at 1:45 pm

41 © 2016 CA. ALL RIGHTS RESERVED.@CAWORLD #CAWORLD
Must See Demos
Service Desk and Support Analyst xFlow Experience
Software and Hardware Asset Management
Request Management and Self-service
Management Insights –Reporting and Dashboards

42 © 2016 CA. ALL RIGHTS RESERVED.@CAWORLD #CAWORLD
Questions?

43 © 2016 CA. ALL RIGHTS RESERVED.@CAWORLD #CAWORLD
Thank you.
Stay connected at communities.ca.com